1. Introduction
Aluminum-matrix composites are widely used in different applications intended for working under conditions of wear and corrosion. These materials relate to a class of metal matrix composites (MMC) and in reality, represent its most important and well-studied part. Therefore, numerous reviews devoted to MMC or, in particular to the aluminum matrix composites (AMC) can be easily found, which contain all kinds of information known about manufacturing processes, types of reinforcement materials, mechanical characteristics, wear and corrosion behavior, etc.
Transition metal aluminides are promising from the viewpoint of applying them as reinforcement for the aluminum alloy matrix because possessing a number of characteristics such as low density, high melting temperatures, high hardness and strength [
1]. Iron aluminides Fe
3Al and FeAl have long been known as possessing high resistance to oxidation and sulfidation but their insufficient room-temperature ductility and low high-temperature strength limited their application in commercial alloys, therefore attempts were undertaken to enhance their stability by alloying [
2,
3].
These iron aluminides were used for preparation of intermetallic matrix composites using both solid-state and melting methods [
4] as well as coatings [
5,
6].
Traditional and cost effective process used for manufacturing iron aluminide-reinforced aluminum alloy is stir casting that permits uniform distribution of the IMCs and improving strength characteristics [
7].
Chatterjee et al. [
8] studied reinforcement of an stir-casted aluminum alloy by Al
13Fe
4 and Al
5Fe
2 IMCs. The normalized and hot deformed samples demonstrated improved UTS but reduced STF compared to commercially pure aluminum.
Selective laser melting (SLM) has been used by Kang et al. [
9] to sinter aluminum powder with Al
65Cu
20Fe
10Cr
5 quasicrystals at different irradiating beam energies. The as-grown samples consisted of α-Al and Al
91Fe
4Cr
5 phases and contained microcracks. Nevertheles high wear resistance was achieved.
Laser powder bed fusion has been carried out by Ai et al. on a high-Fe Al
12Si alloy that allowed refining α-Al(Fe,Mn)Si particles make them coherent with the α-Al matrix [
10].
It is known that the presence of iron in aluminum alloys has detrimental effect on the strength because of formation of iron-containing IMCs. Therefore, all the AMCs manufactured using fusion methods will contain them and various treatment as well as alloying are undertaken to refine or modify them. In this connection, solid state manufacturing methods are preferable.
Tribological and corrosion behavior of AA2024/316LSS metal/metal composites prepared using hot pressing was studied by A. Canakci et al. [
11] wherein it was shown that intermetallic compounds (IMC) such as Al
2Cu, Fe
4Al
13, and Fe
2Al
5 have been formed that allowed increasing hardness, as well as improving wear and corrosion resistances as compared to the base AA2024.
Analogous process was used by Roy et al. [
12] to obtain Al-Fe AMCs by sintering an Al+Fe
2O
3 mixture at 700, 800 and 900°C. The iron aluminides were formed Fe
3Al and FeAl
3 that allowed increasing the microhardness by a factor of 3-4. Tribological testing of these composites demonstrated reduction in friction and improvement of wear resistance [
13].
Spark plasma sintering on the Al+Fe
2O
3 mixture was carried out by Mallik et al. [
14] that allowed obtaining IMCs Fe
3Al and FeAl
2 in the aluminum matrix. Wear volume reduced considerably as depended on the temperature of sintering.
All these methods also require heating the powder mixtures to temperatures close or above the melting point of aluminum and therefore controlling many parameters including temperature, shrinkage and porosity. A relatively new friction stir processing (FSP) allows avoiding melting the aluminum alloy matrix except, maybe a local contact melting due to exothermic reaction-diffusion between the components [
15]. The FSP is a solid-state process that involves intensive plastic deformation, grain refinement, as well as competing processes of strain-induced dissolution and precipitation of all types of particles, dynamic recrystallization of the solid solution grains, aging, etc [
15,
16,
17].
Formation of intermetallic compounds in FSP is usually by solid state reactions which are controlled by diffusion of components through the interfaces between contacting particles or between particles and matrix. The reacting is intensified when two particles are in sliding contact, i.e., mutually experience shear deformation. This what really happens when many compounds are synthetized during mechanical alloying [
18]. For example, iron aluminides were formed on the steel FSW tool in welding on aluminum alloys sheets, wherein the temperature was about 400-450°C [
19]. Another example of intensive interaction between the FSP too and friction stir processed metal was reported [
20] wherein Ni-Ti IMC particles were formed and admixed with the stir zone during FSP intermixing a Cu+Al powder mixture with a Ti6Al4V alloy using a FSP tool made of nickel superalloy.
There a number of factors that influence the efficiency of FSP including the FSP tool shape, rotation rate, plunge force and processing speed. However, as far as formation of a surface composite is concerned, the one of the main ones is the number of FSP passes necessary to provide homogeneous distribution of the reacting component in the aluminum matrix [
21] because powder is usually applied on the surface of the matrix alloy using either a milled groove or a row of drilled holes. However, alternative solutions exist that utilize coatings.
Lee et al. [
22] applied a multi-pass FSP for intermixing the pre-compacted Al-10 at.%Fe into an aluminum alloy, which allowed them to obtain nanosized Al
13Fe
4 IMCs in the aluminum matrix, whose volume fraction increased linearly with the amount of iron reacted with aluminum. This AMC demonstrated its UTS in the range 207-217 MPa with strain-to-fracture (STF) 6.7-3.7%.
The multipass friction stir processing (FSP) was used to in-situ prepare an AMC by mechanical intermixing iron powder loaded into a groove milled with commercially pure aluminum [
23,
24]. The Al-Fe IMCs were formed such as Al
3Fe and Al
5Fe
2 that allowed increasing the ultimate tensile strength (UTS) with about three-fold loss in strain-to-fracture. Wear tests have been carried out that showed generation of mechanicall mixed layers (MML) on the worn surfaces of samples FSPPed using not less than 6 passes [
25].
Hybride nanocomposite Al/(Al
13Fe
4+Al
2O
3) was obtained using a reactive friction stir processing when the reinfoircement intermetallic and oxide particles were formed by exothermic displacement reaction between Al matrix and Fe
2O
3 that allowed improving hardness and ultimate tensile stress of the alloy [
26,
27].
Combined reaction powder mixture containing both iron and Fe
3O
4-magnetite powders was used for FSP on an 1050-H24 alloy plate [
28] at tool rotation rate 100-1500 RPM. It was reported that no reaction products have been detected.
The majority of AMCs are intended for tribological applications, i.e., machine components that would combine light weight characteristics with high wear resistance and low friction. Improving the anti-wear and anti-friction charcateristics is related to increasing hardness and thus limiting the plastic deformation to stable real contact areas. The tribological behavior of the AMCs obtained by FSP is still the field of interest for the researchers because many publications were dedicated either to studying the FSP or meaqsuring wear and coefficient of friction, without attempting to gain understanding of wear mechanisms and structural evolution in sliding.
The objective of this work was to study iron aluminide reinforced AMCs obtained by FSP and characterize them in detail with special attention given to wear mechanisms.
2. Materials and Methods
Friction stir processing was carried out on an Al-Mg alloy (
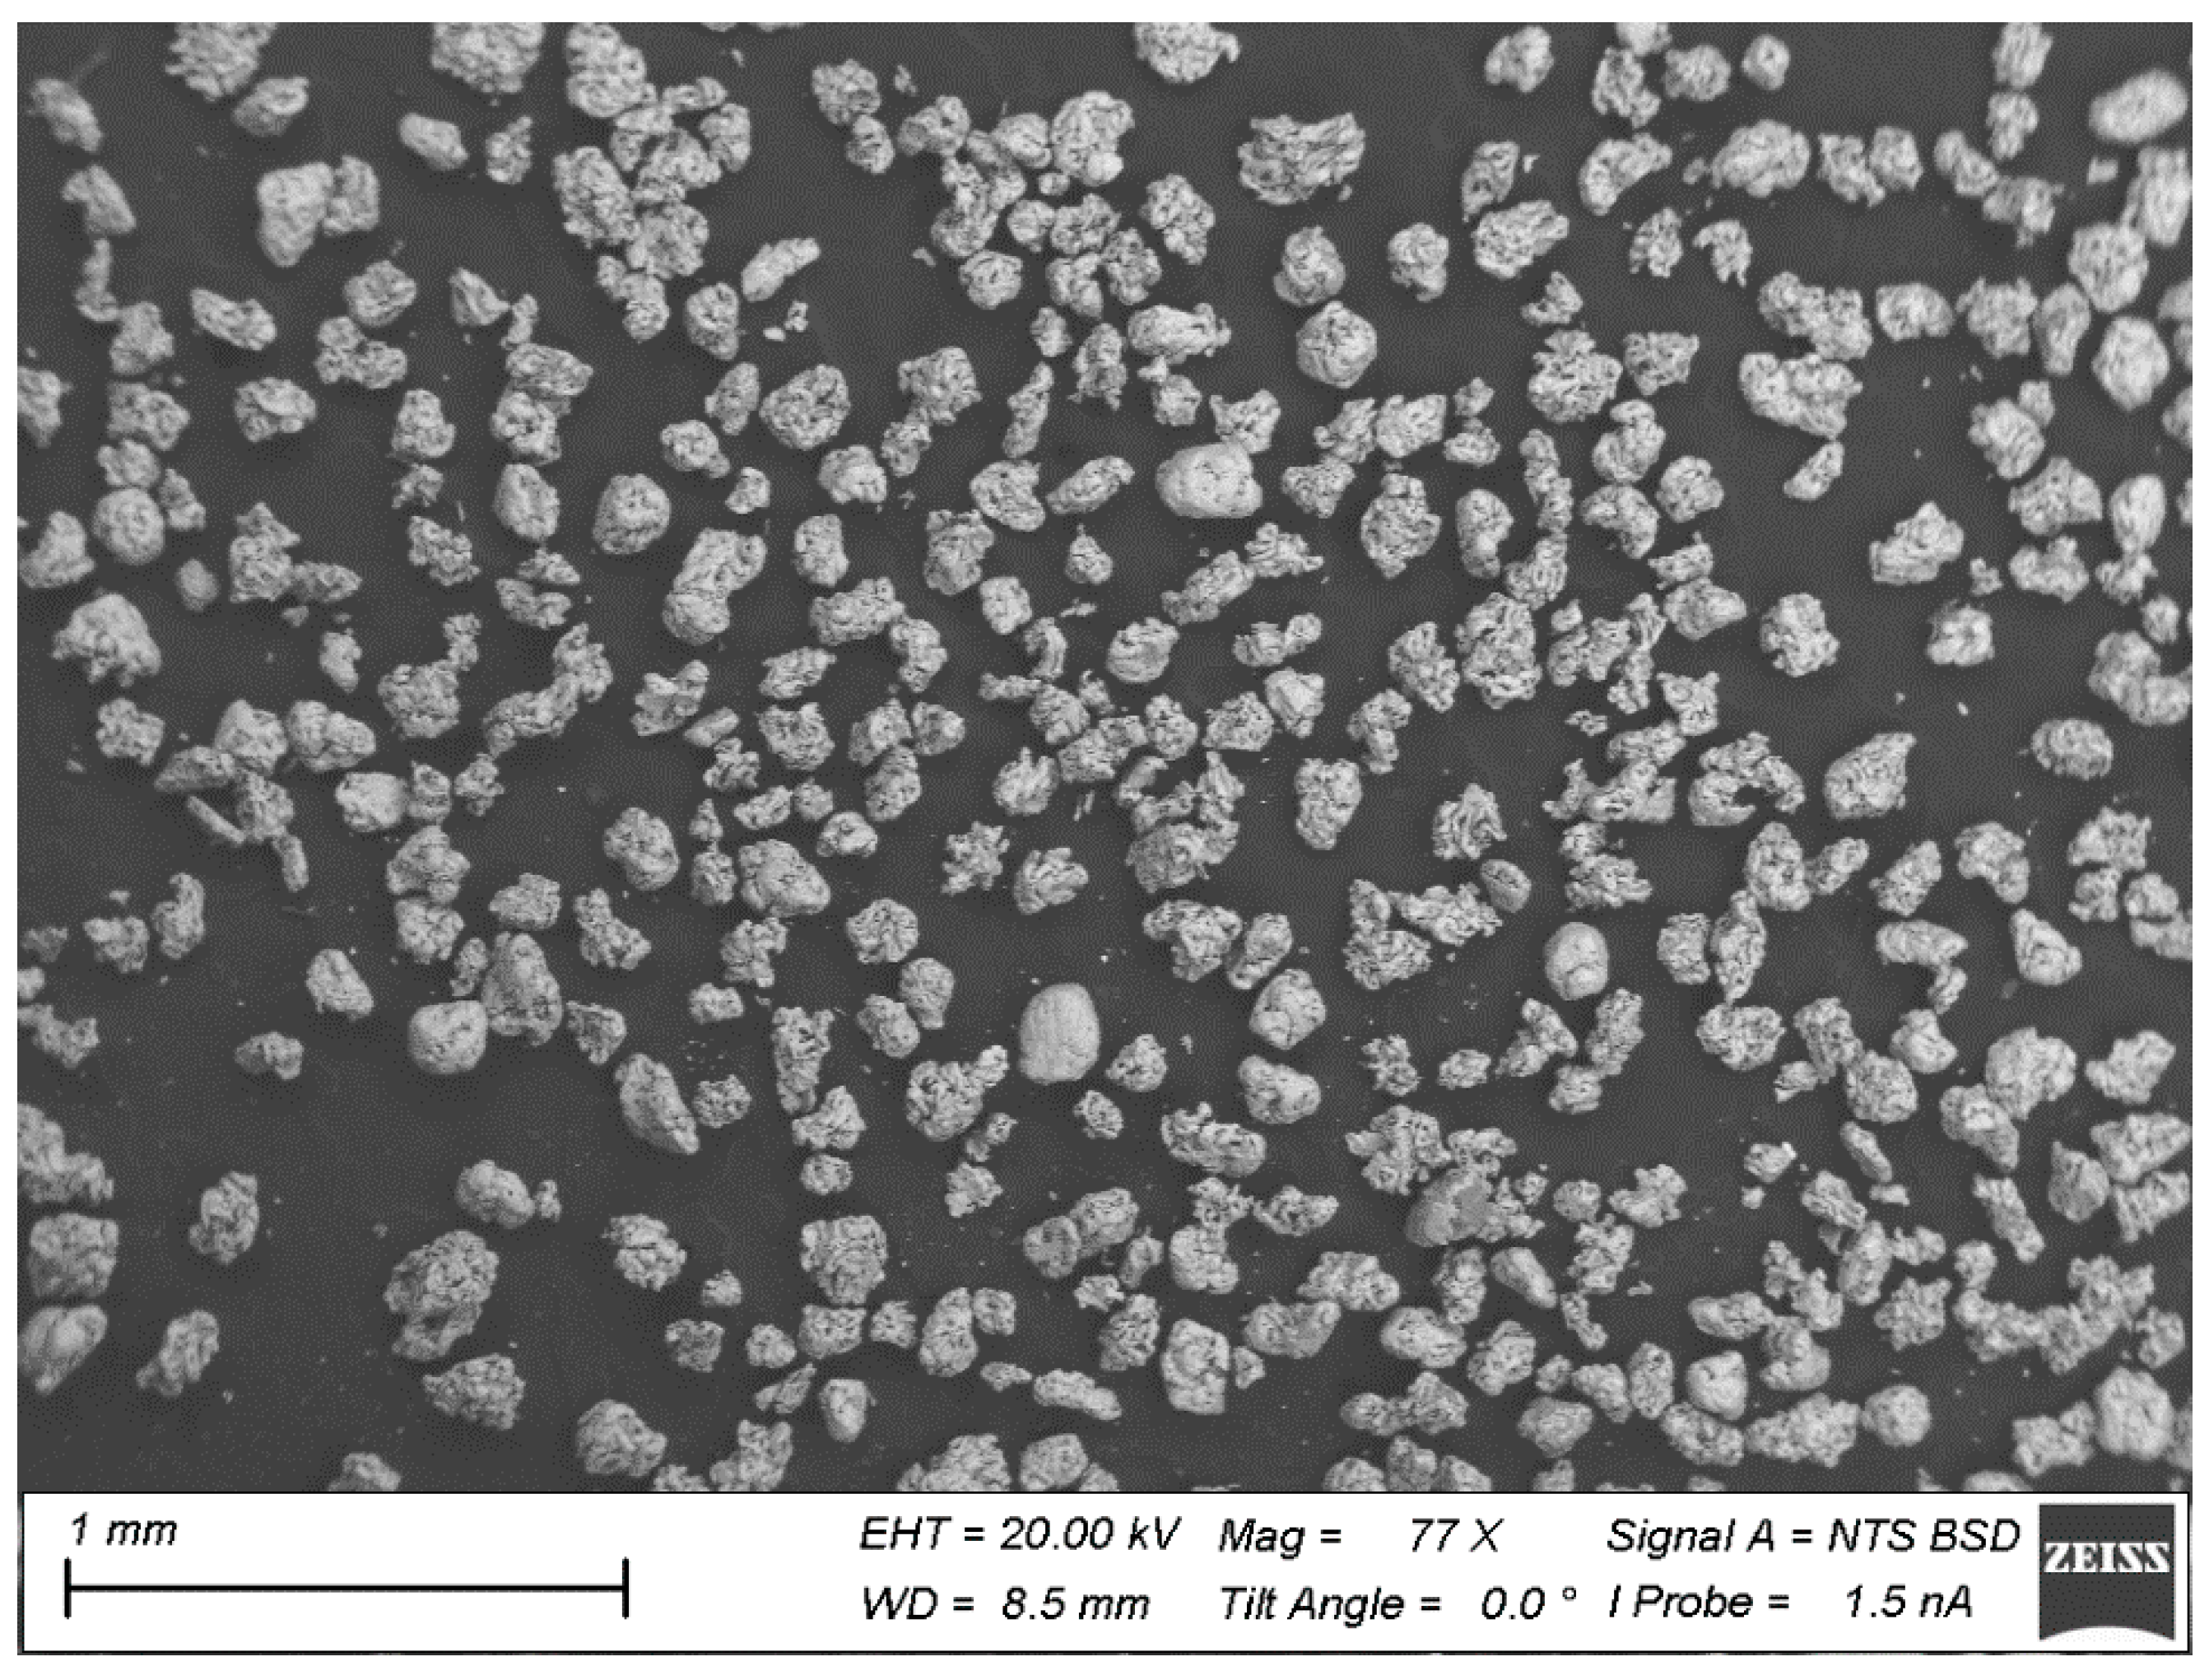
Table 1) 5 mm of thickness sheets with ∅1mm and 3 mm–deep holes drilled in them to provide loading iron powder in concentrations 5, 10 and 15 vol.%. Chemical compositions of all the materials were obtained using a Thermo Scientific Niton XL3t XRF Analyzer. Iron powder particles are shown in
Figure 1.
Friction stir processing was carried out using an experimental friction stir welding machine (ISPMS SB RAS) according to parameters displayed in
Table 2.
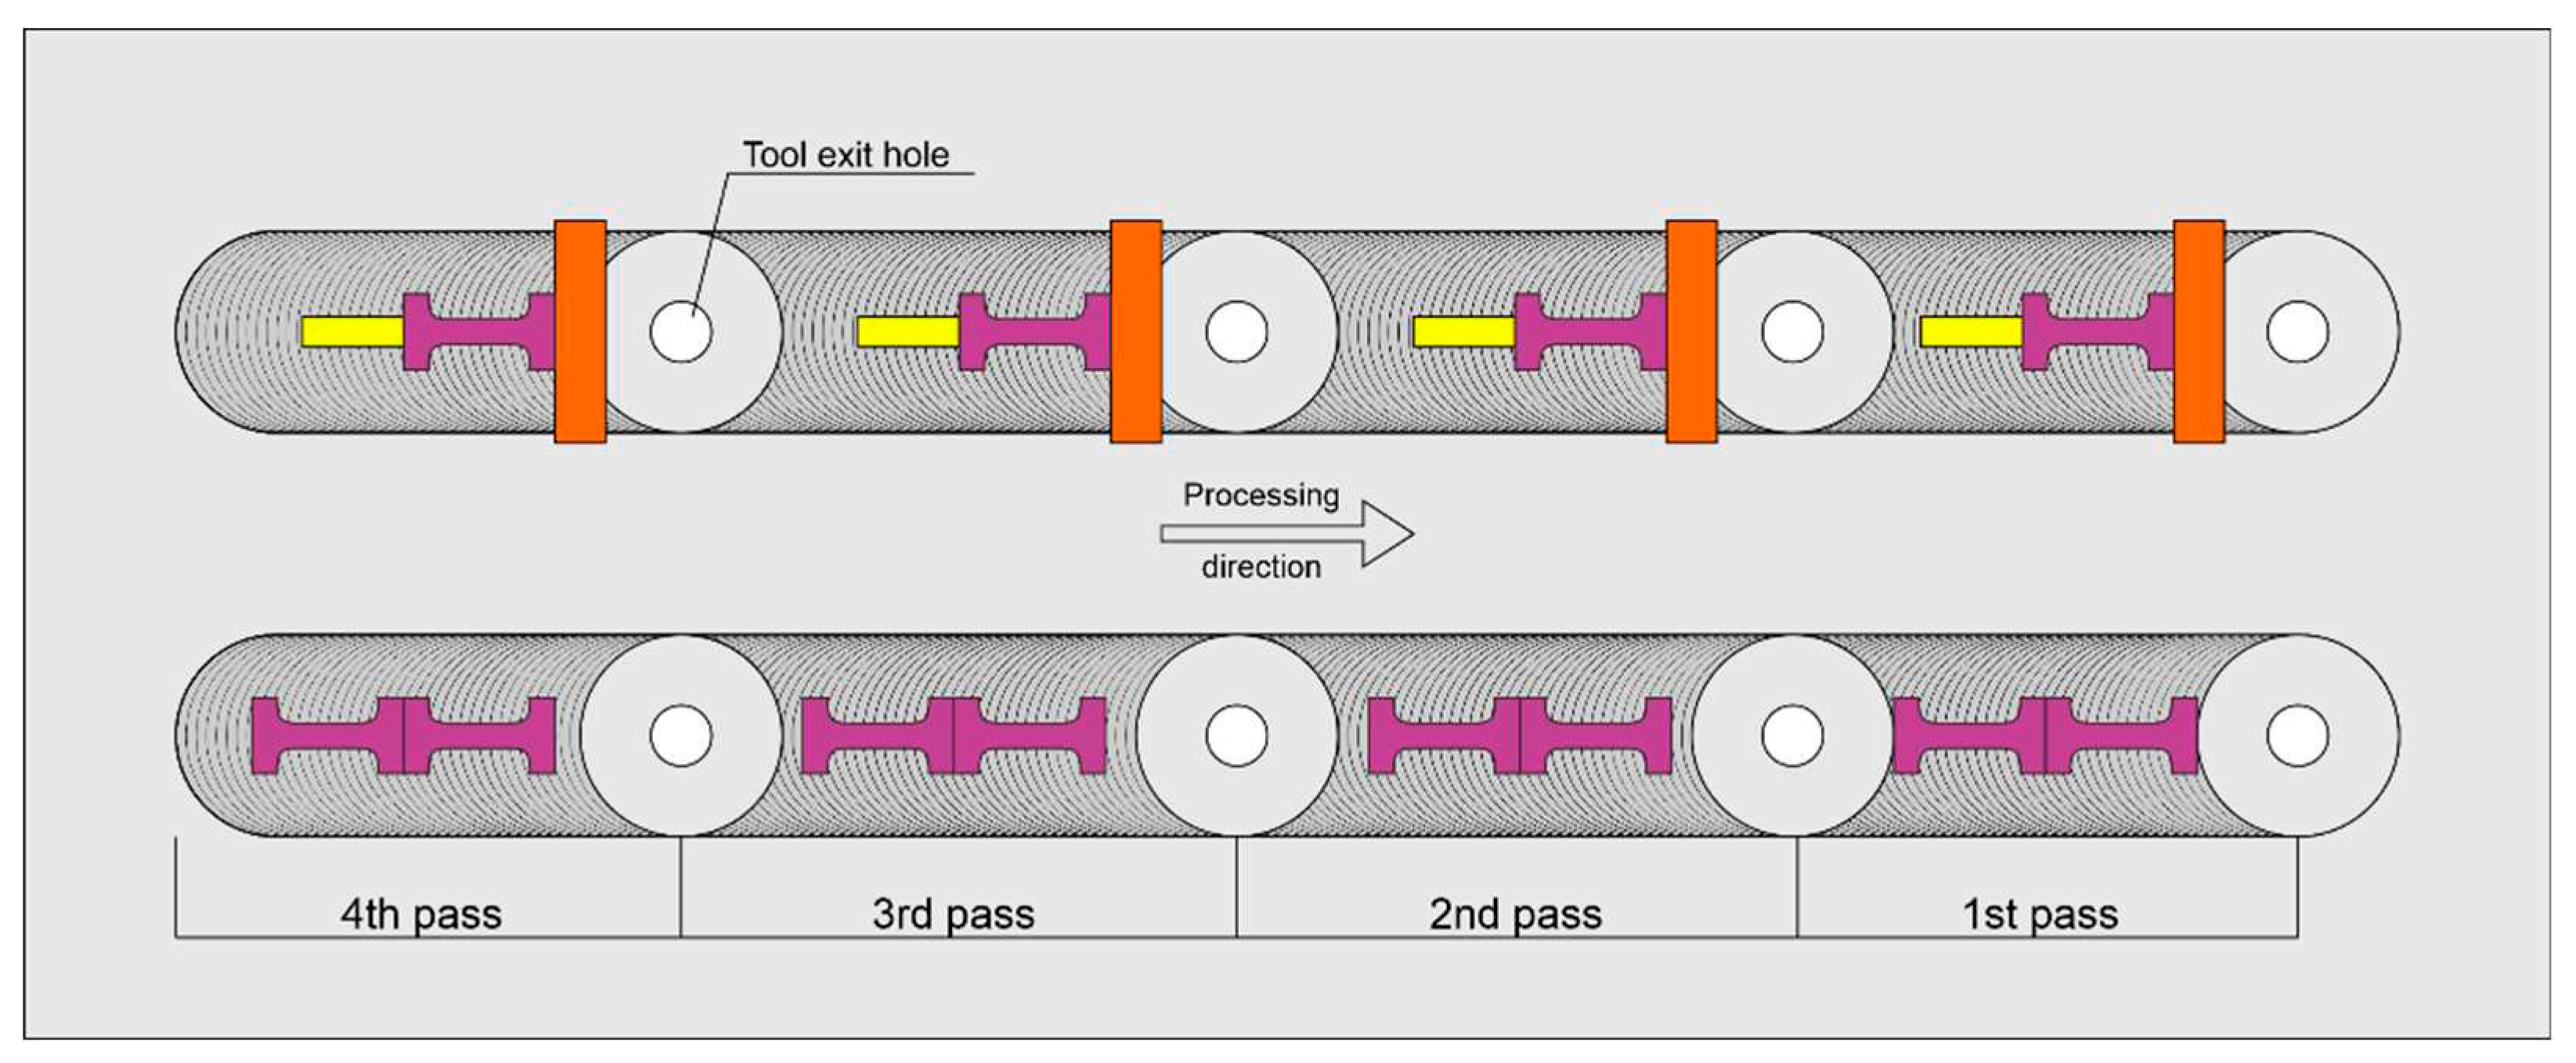
After processing the plate, two-dimensional computed tomography was carried out on an YXLON Cheetah EVO installation (YXLON International GmbH, Hamburg, Germany) to determine the homogeneity of the iron powder distribution as well as to detect large structural defects. Samples were cut off the workpiece using a DK7750 LWS EDM machine to characterize the resulting composite for strength, hardness and wear resistance, as well as for optical and transmission microscopy examinations (
Figure 2).
Optical examination of the stir zone (SZ) in a section perpendicular to the FSP direction zone was carried out using Altami MET1-C and Axiovert 200MAT microscopes. Microstructural studies, determination of elemental and phase composition was carried out using a JEM-2100 transmission electron microscope (JEOL Ltd., Akishima, Japan) and scanning electron microscopes (SEM) Carl Zeiss LEO EVO 50 (Carl Zeiss AG, Oberhochen, Germany) with Oxford Instruments X-ray energy dispersive microanalysis attachment. The phase composition of FSP-ed samples was studied using a DRON-8N diffractometer (Bourevestnik, Saint-Petersburg, Russia) with CuKα radiation.
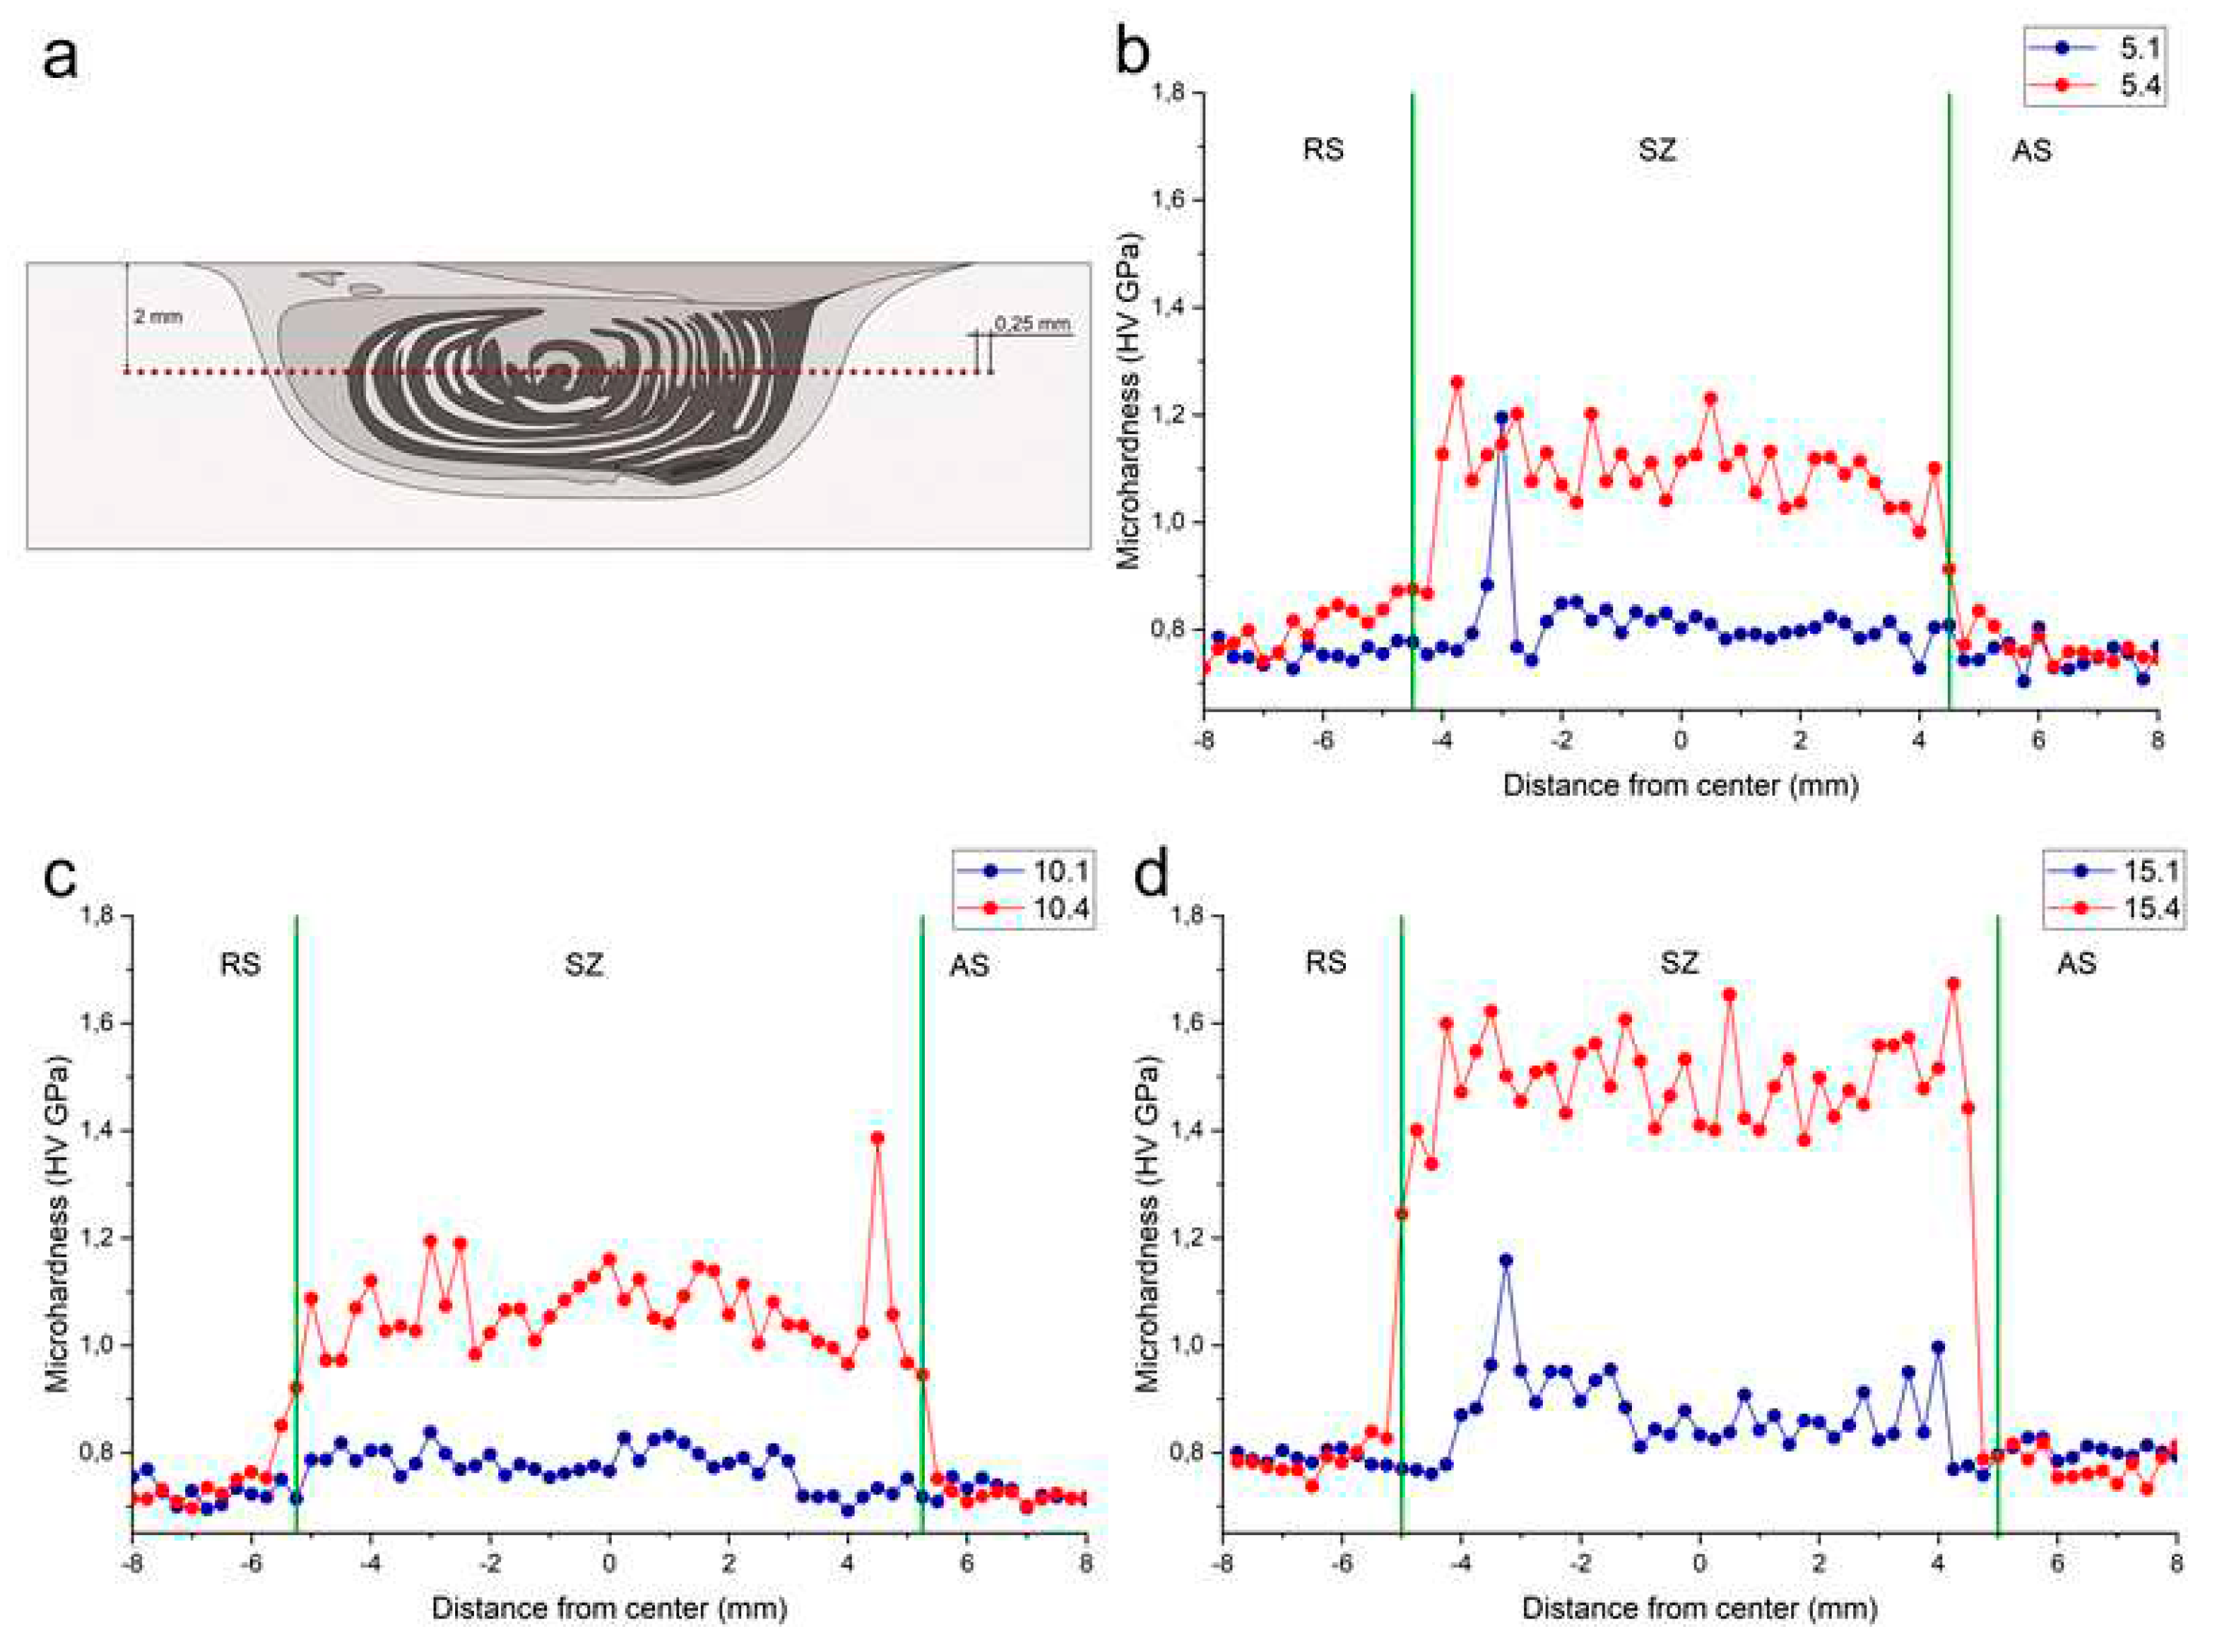
Microhardness was measured using the Vickers method and AFFRI DM8 instrument along the horizontal direction on a perpendicular section at a depth of 2.5 mm below the FSPed surface with an indentation step of 0.25 mm, load of 200 g and an indenter dwelling time 10 s.
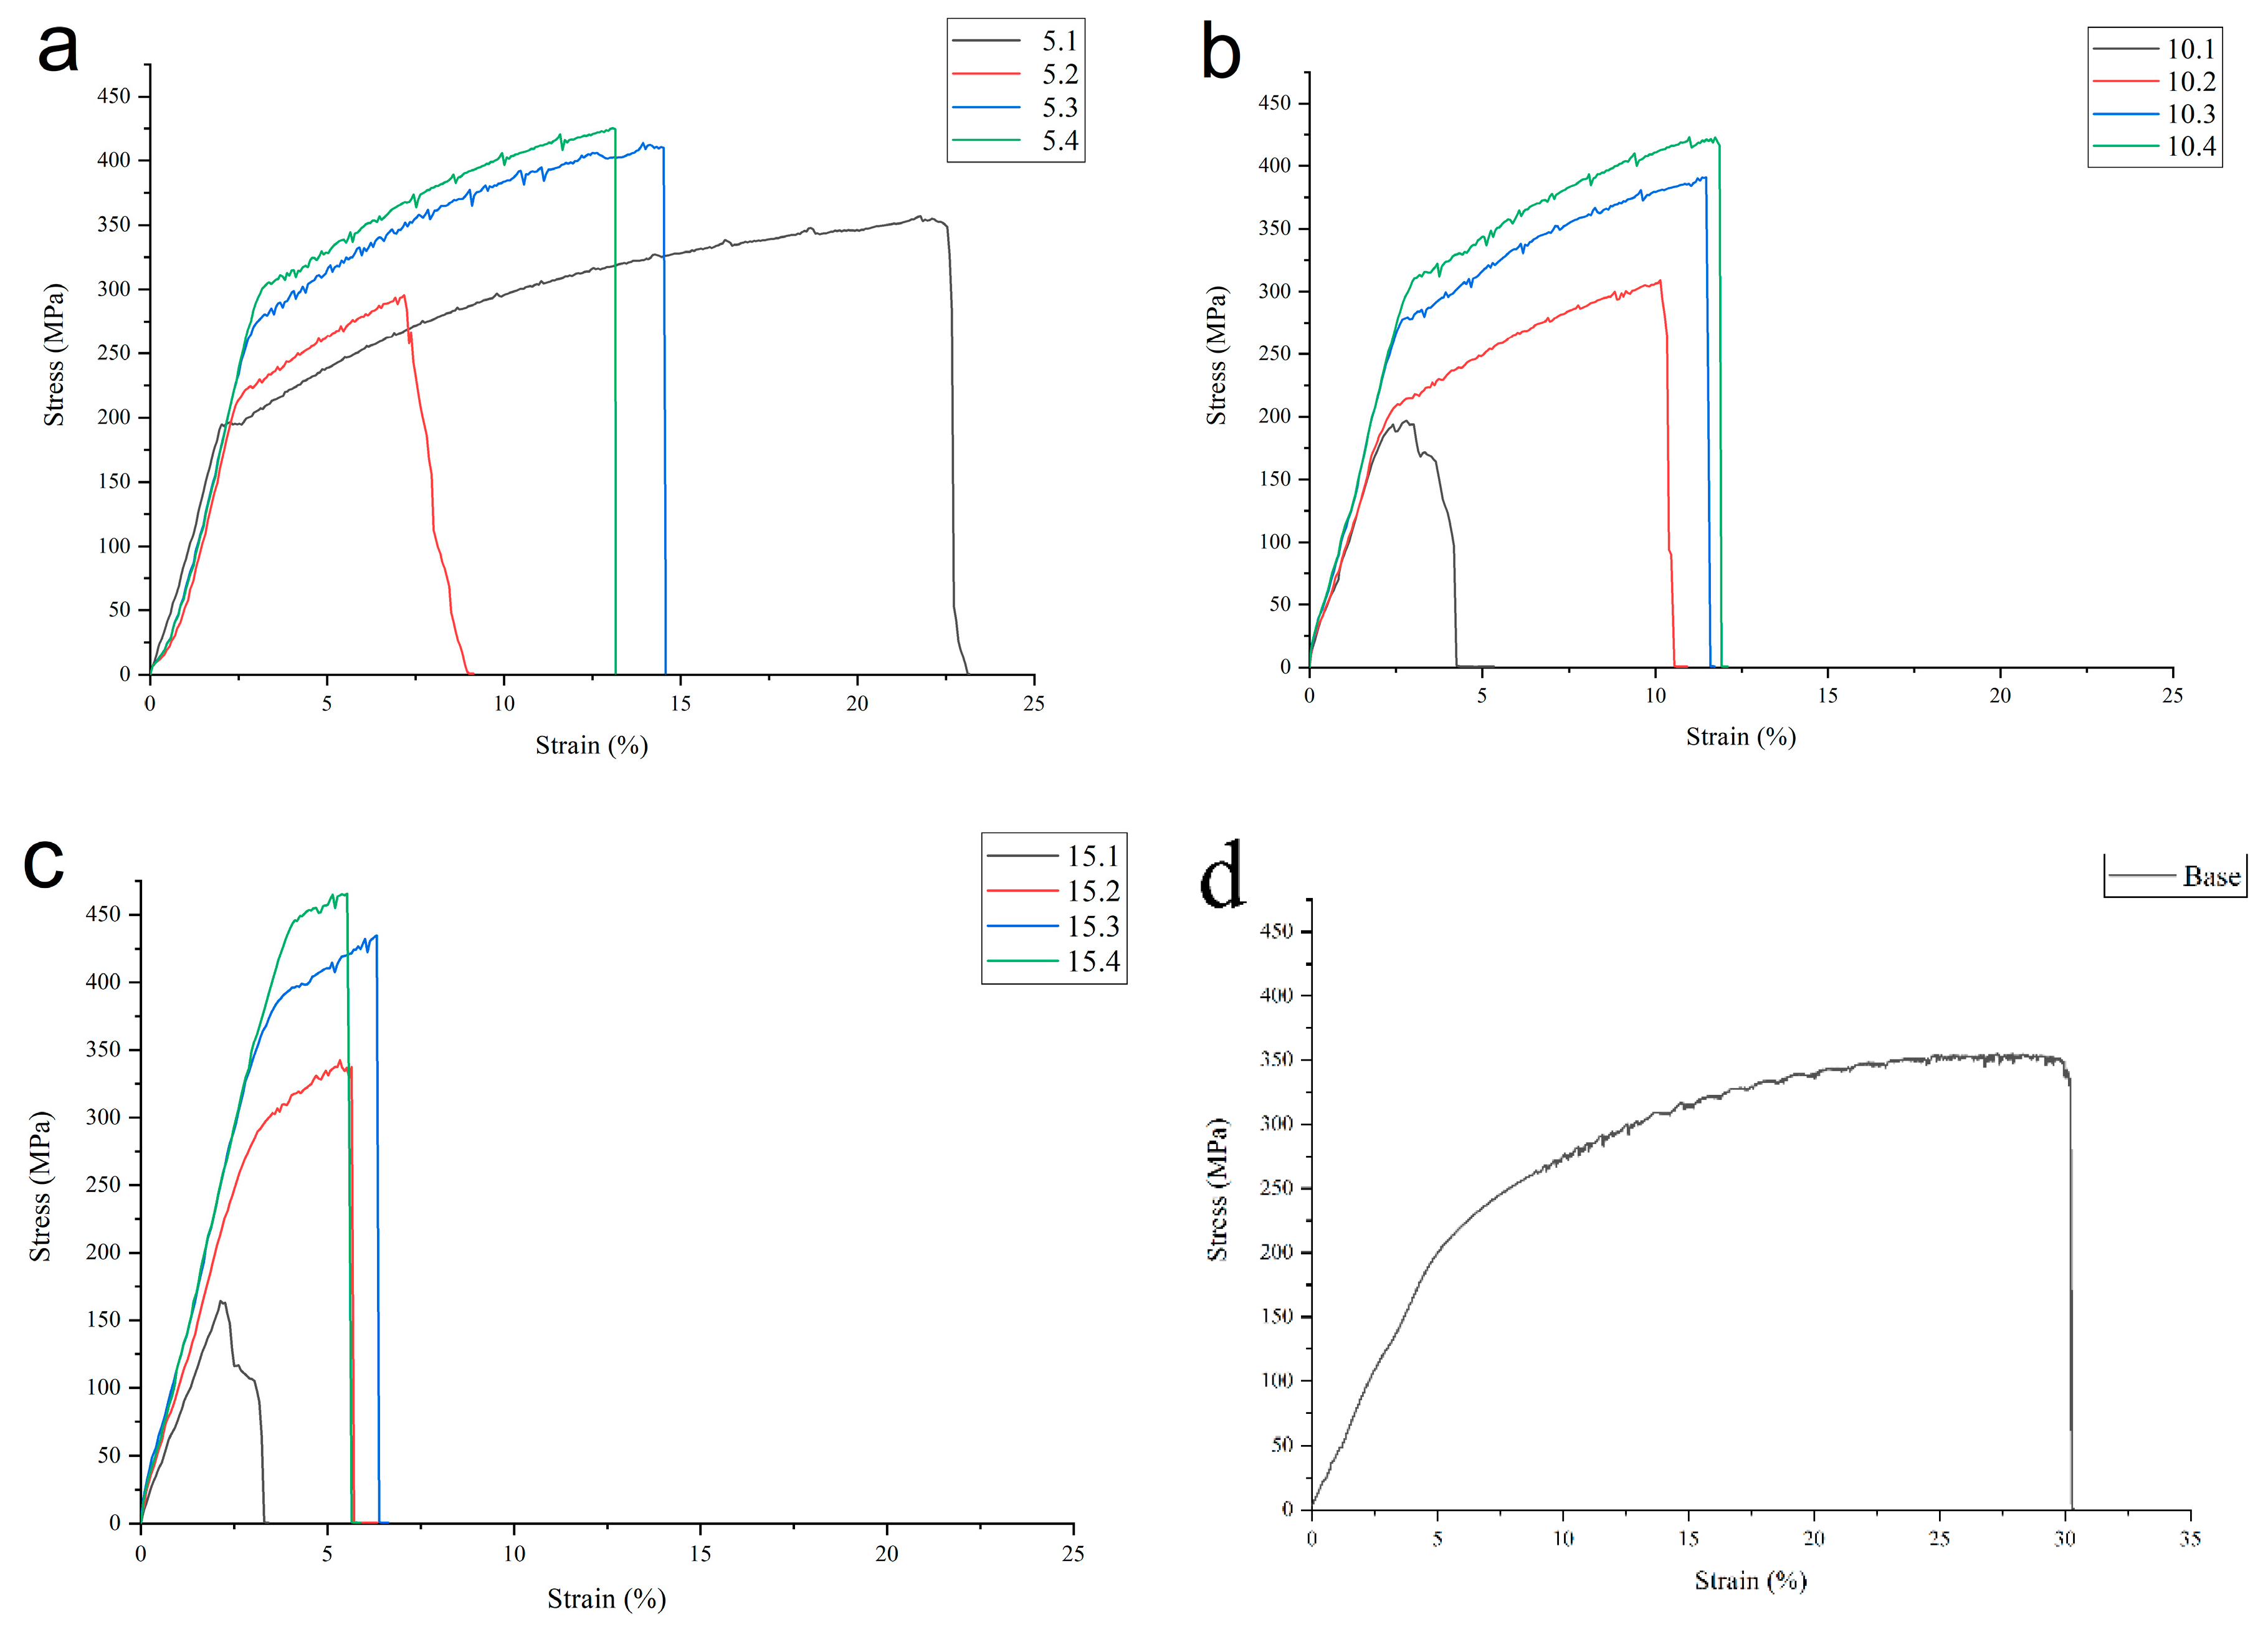
Tensile strength was determined using a “UTS 110M-100” testing machine (TestSystems, Ivanovo, Russia).
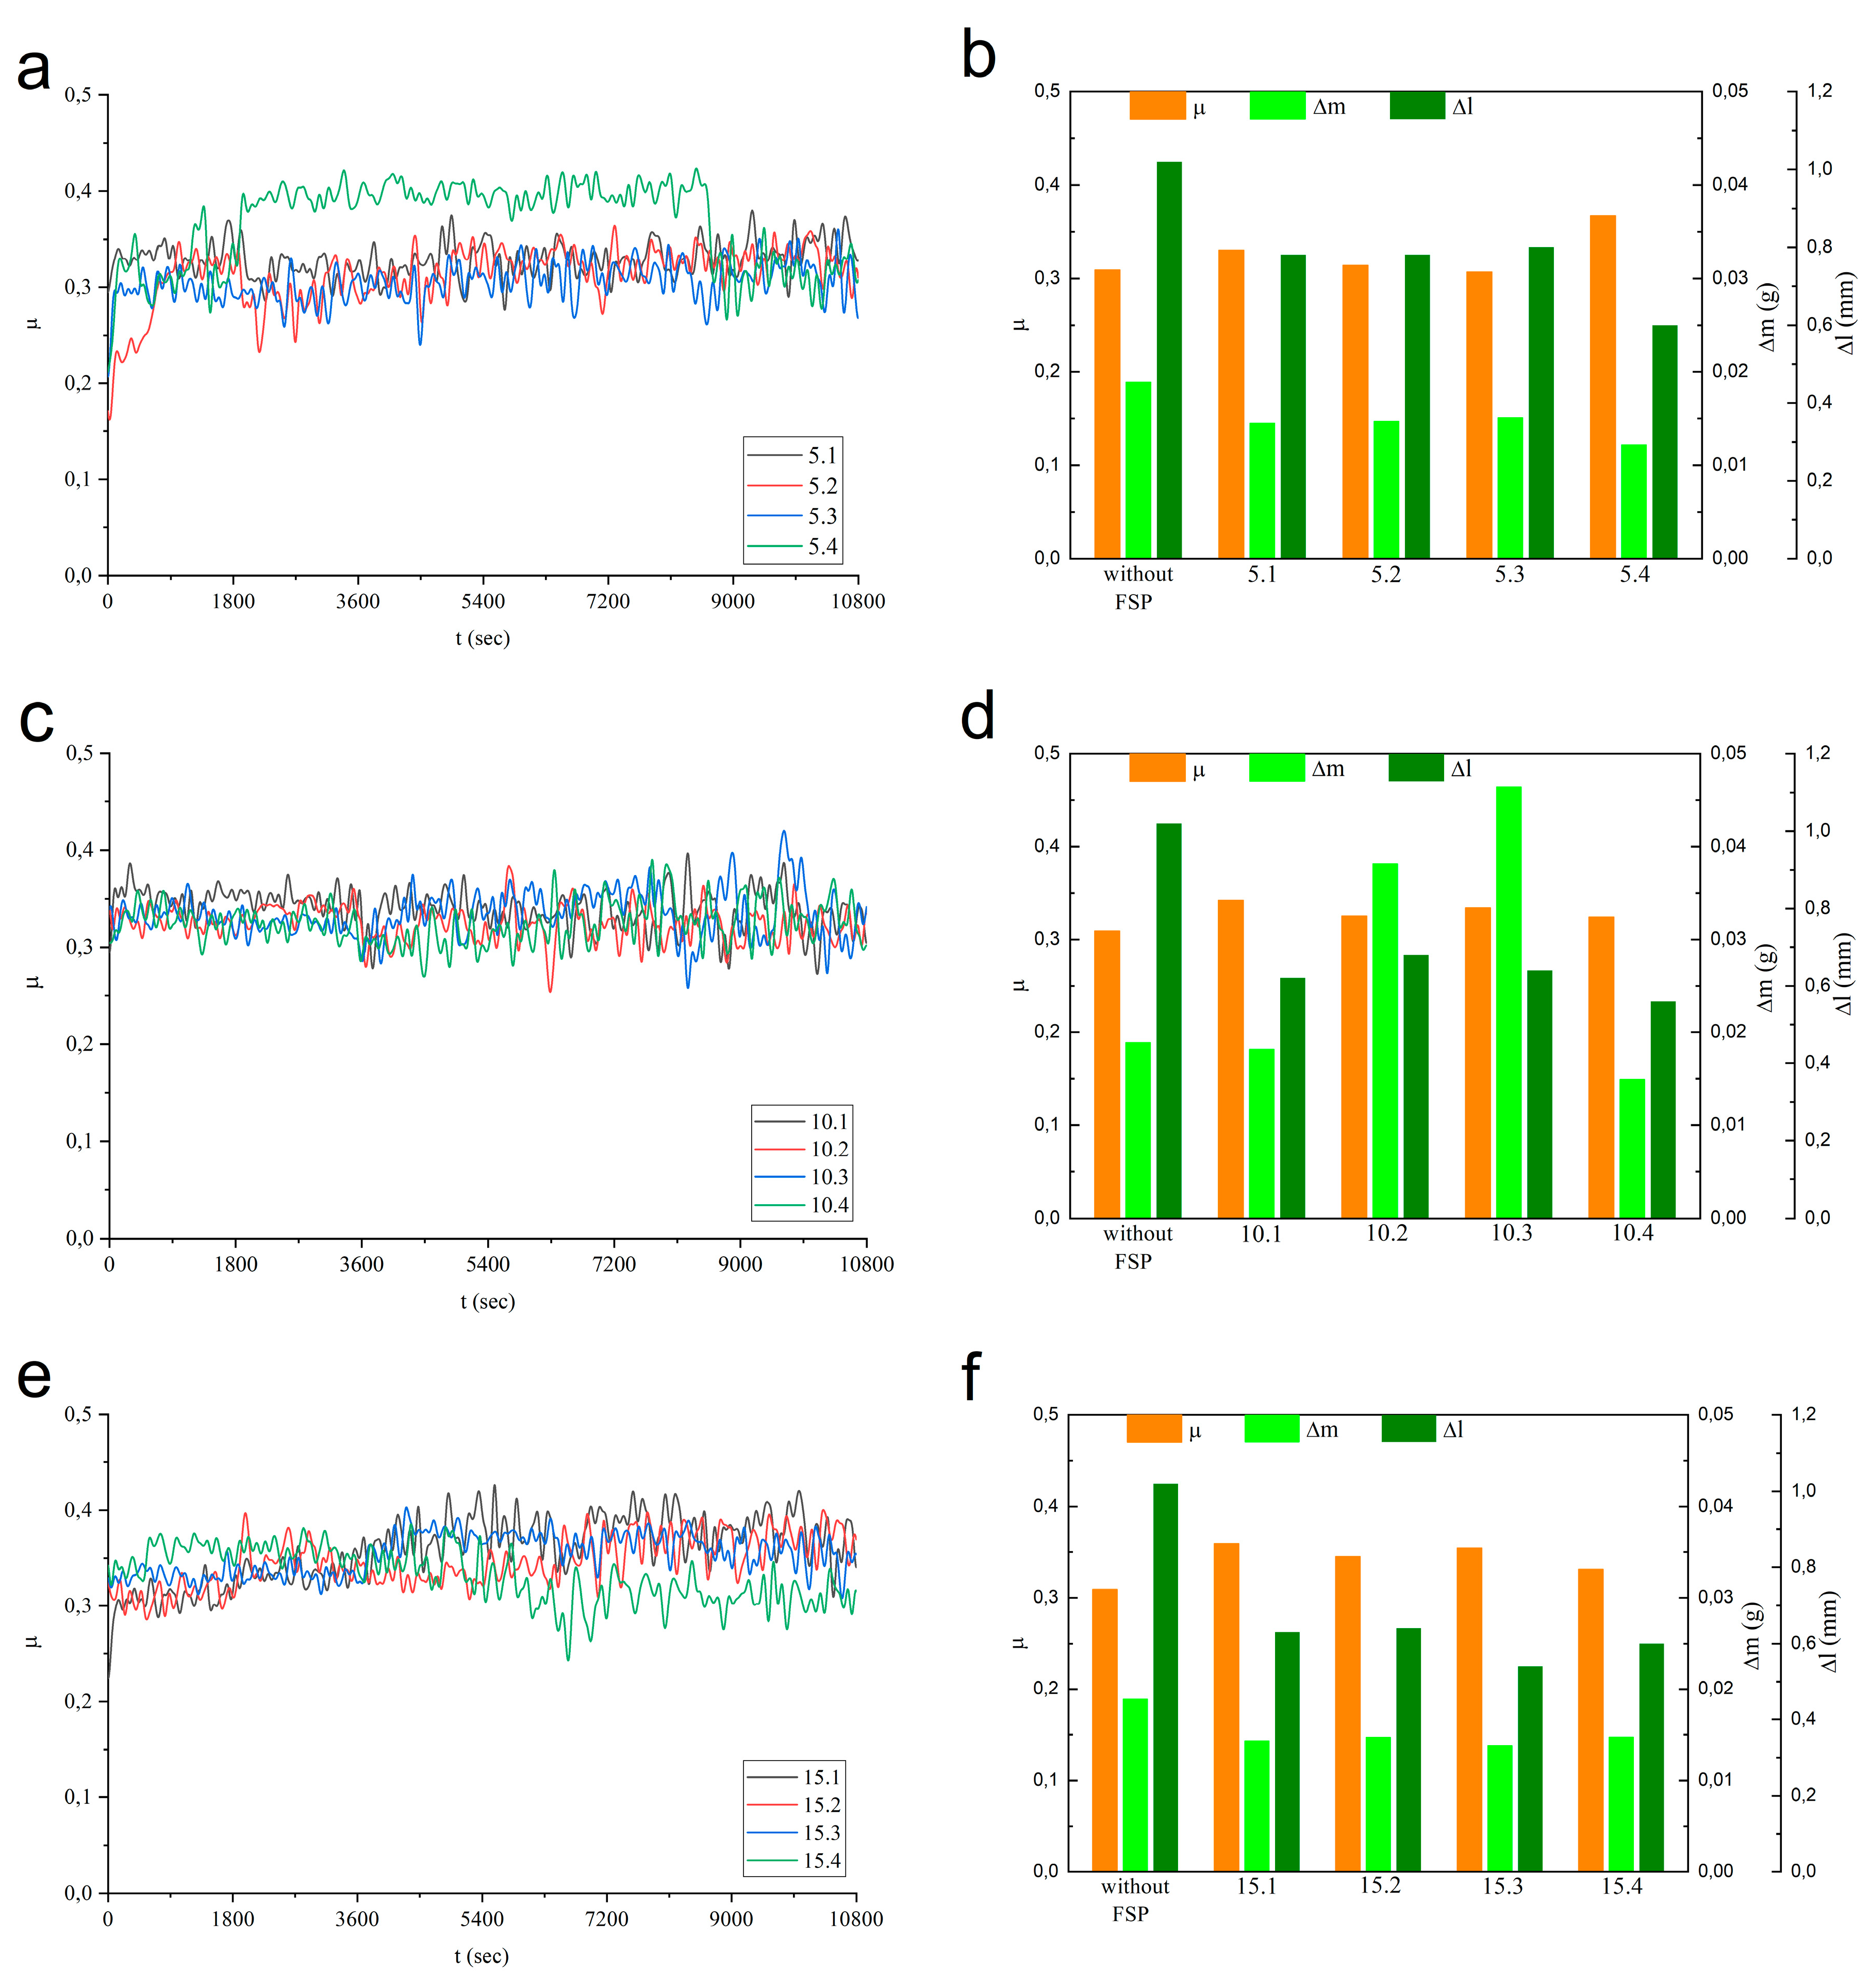
Wear resistance tests were carried out using a pin-on-disc scheme and a TRIBOtechnic tribometer (Tribotechnic, Clichy, France). The pins were 3 mm × 3 mm × 10 mm in size that have been cut out of the SZ middle part. The load and rotation speed were 12 N and 250 rpm, respectively. Thus, in 3 hours of testing, the sample covered a distance of 2827 m. The counterbody was a disk made of 40Cr13 steel. Wear was evaluated by measuring the pin’s mass and height before and after the testing. Coefficient of friction (COF) was measured in-situ as a function of time.
3. Results
3.1. FSP Process Parameters
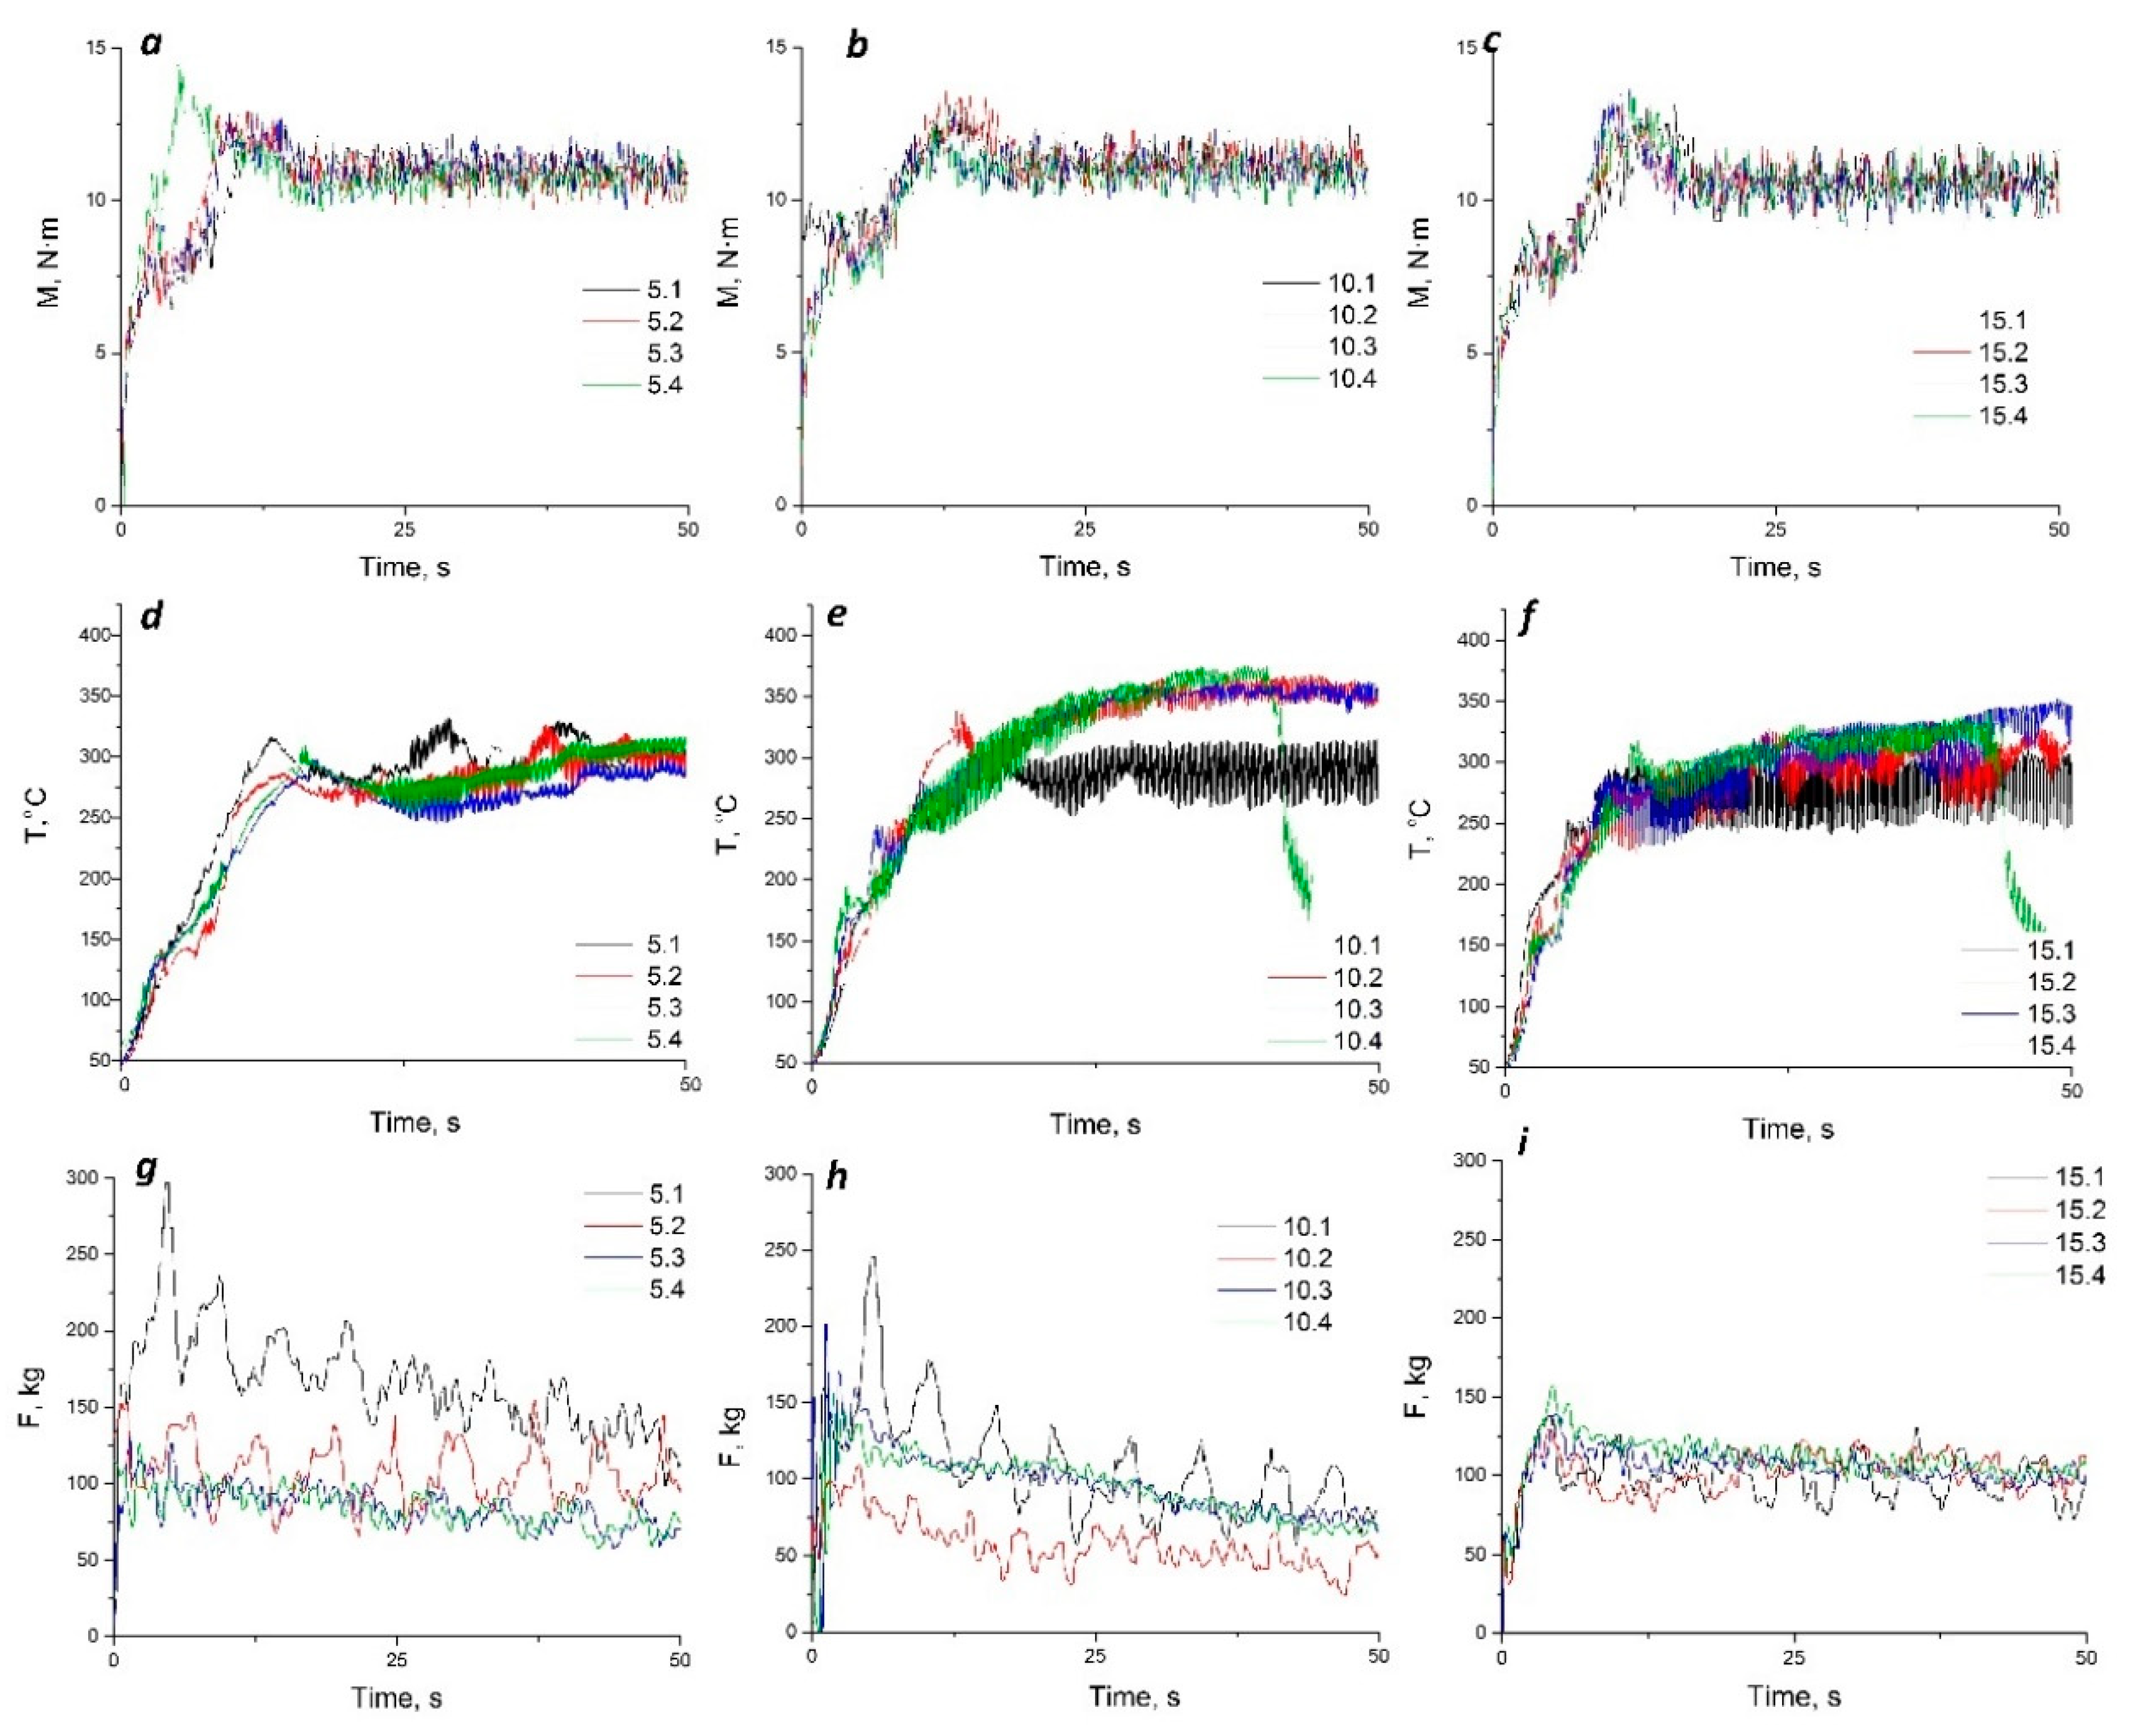
The FSP experiments have been carried out with in-situ recording of torque and force caused by resistance of the metal to the tool movement. Simultaneously, the temperature on the FSPed surface just behind the tool has been determined using an IR camera FLIR SC655. The exothermic effect of the reactions occurring in the stir zone would cause its extra heating with additional plasticizing and reduction of its effective viscosity. In such a case, the force of reaction to the FSP tool motion would reduce. The magnitude of torque would determine the effect of frictional heating since it proportional to the mechanical work power, if the angular velocity is kept constant. It is known also [
29] that the very first FSP pass is accompanied by maximum of that force while further passes are carried out with that force reduced owing to previously formed fine-grained structure. Assuming all the above said it becomes possible to analyze the heat input and its effect on the metal plasticity.
It can be observed from
Figure 3a–c that the steady part of the torque dependencies on time are at the same level thus meaning that the heat input at this stage was equal for all the samples. When comparing these plots to those of temperatures measured on the FSPed surfaces (
Figure 3d–f) it should be noted that more or less equal temperatures are observed for the samples 5.1-5.4 of Al-Mg admixed with 5 vol.% Fe. On the Al-Mg admixed with 10 vol.% Fe the highest temperatures were observed on samples 10.2-10.4, while the lowest temperature was obtained for the 1-pass FSPed sample 10.1. Less temperature differences were obtained on the surfaces of samples of Al-Mg admixed with 15 vol.% Fe. Nevertheless, the surface temperatures were higher for samples 15.2-15.4. Since heat input was almost the same for all the samples, these temperature difference could be caused by exothermic reactions between aluminum matrix and iron particles. The most intensive heat release probably occurred during the second and further FSP passes, i.e that the main parts of the iron-aluminum IMCs were formed in samples containing 10 and 15 vol.% Fe.
The resistance force dependencies on time (
Figure 3g–i) show the differences in the stir zone metal degree of plasticization. The highest force magnitude and oscillation amplitudes were observed during the first and second FSP passes on samples 5.1 and 5.2, respectively. Such a finding may be related with FSP on the coarse-grained as-received alloy and low conversion of iron into IMC, respectively. The third and fourth passes are characterized by low oscillations as well as lower resistance, i.e low effective viscosity of the stirred metal. Even higher effect of metal plasticization by extra reaction heating can be observed on the Al-Mg admixed with 10 vol.% Fe samples (
Figure 3h). In this case, the notable effect of plasticization occurred during the second FSP pass (sample 10.2) so that the most part of the IMCs had already been formed before performing further passes on the samples 10.4 and 10.4. The enhanced resistance force in FSPing these sample was caused by IMC hardening of the stir zone metal. The Al-Mg admixed with 15 vol.% Fe samples showed almost no differences in the effect of plasticization among the samples. Such a situation may be provided by the fact that the IMC reaction started from the very first pass.
3.1. Macro-and Microstructures in SZ of Al-Mg Admixed with 5 vol.% Fe
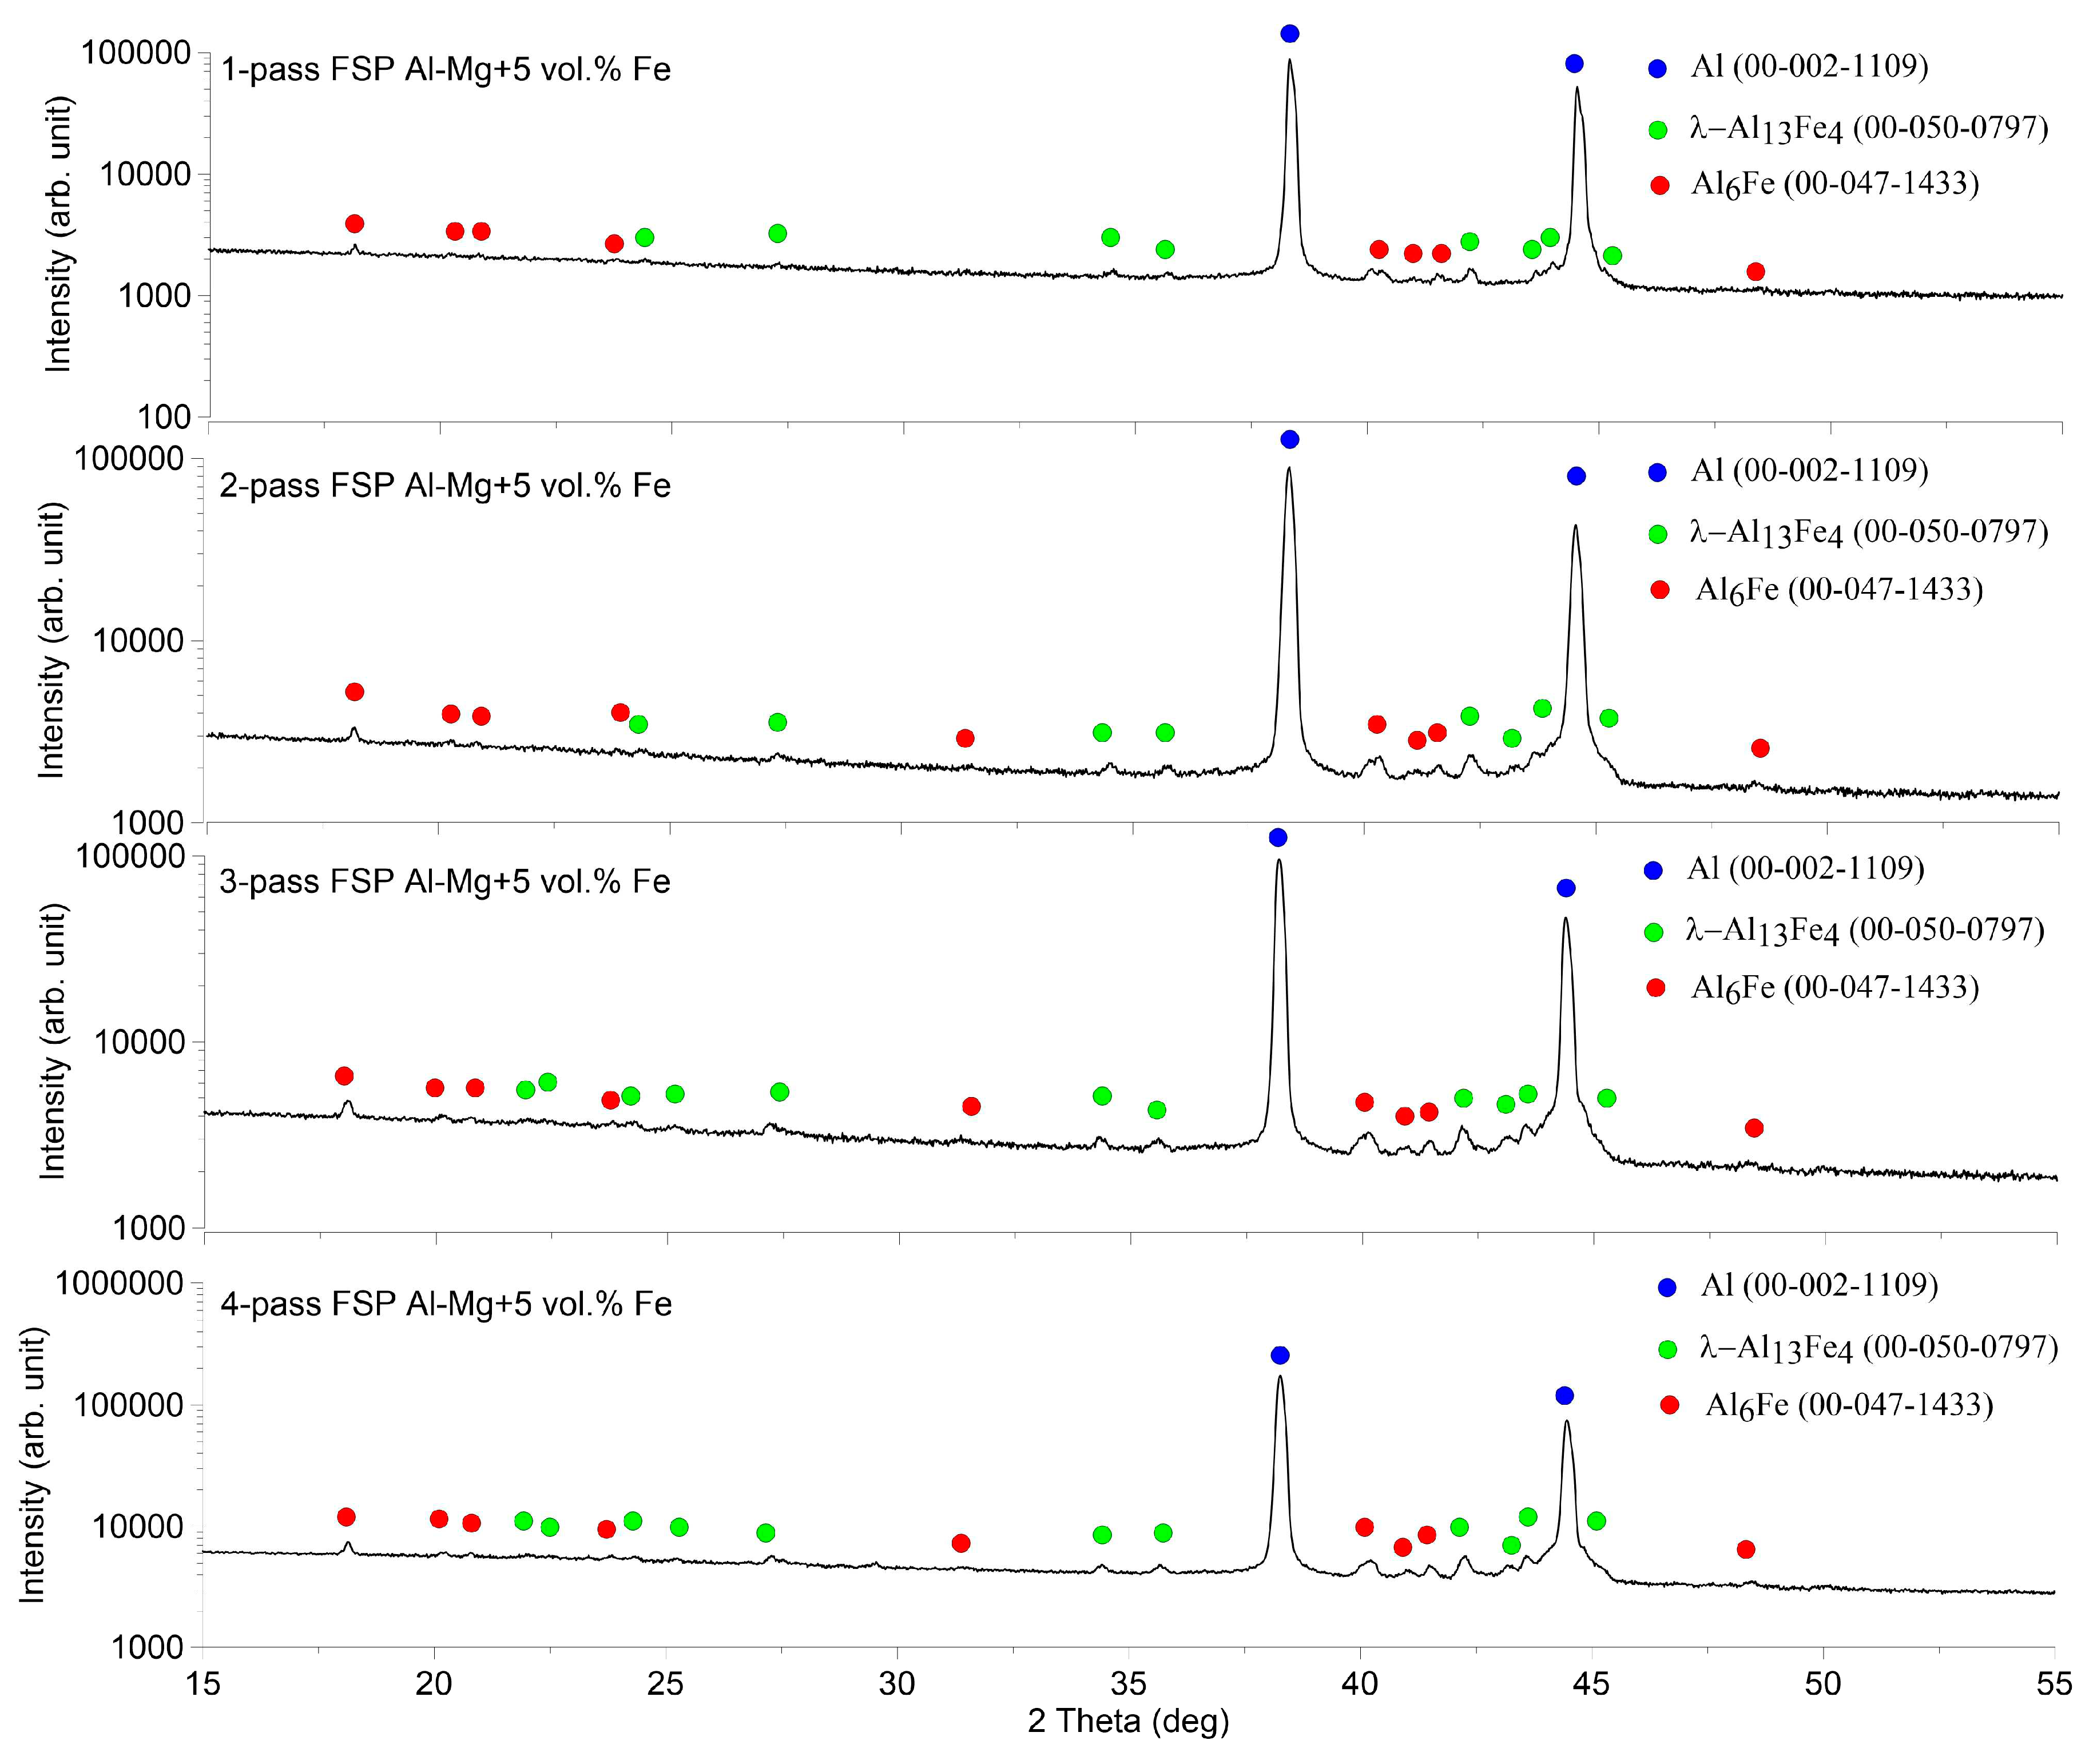
XRD of the stir zone metal obtained after 1 to 4 FSP passes demonstrated the presence of three phases such as α-Al (00-002-1109), Al
13Fe
4 (00-050-07) and Al
6Fe (00-047-1433) irrespective of the FSP pass number (
Figure 4).
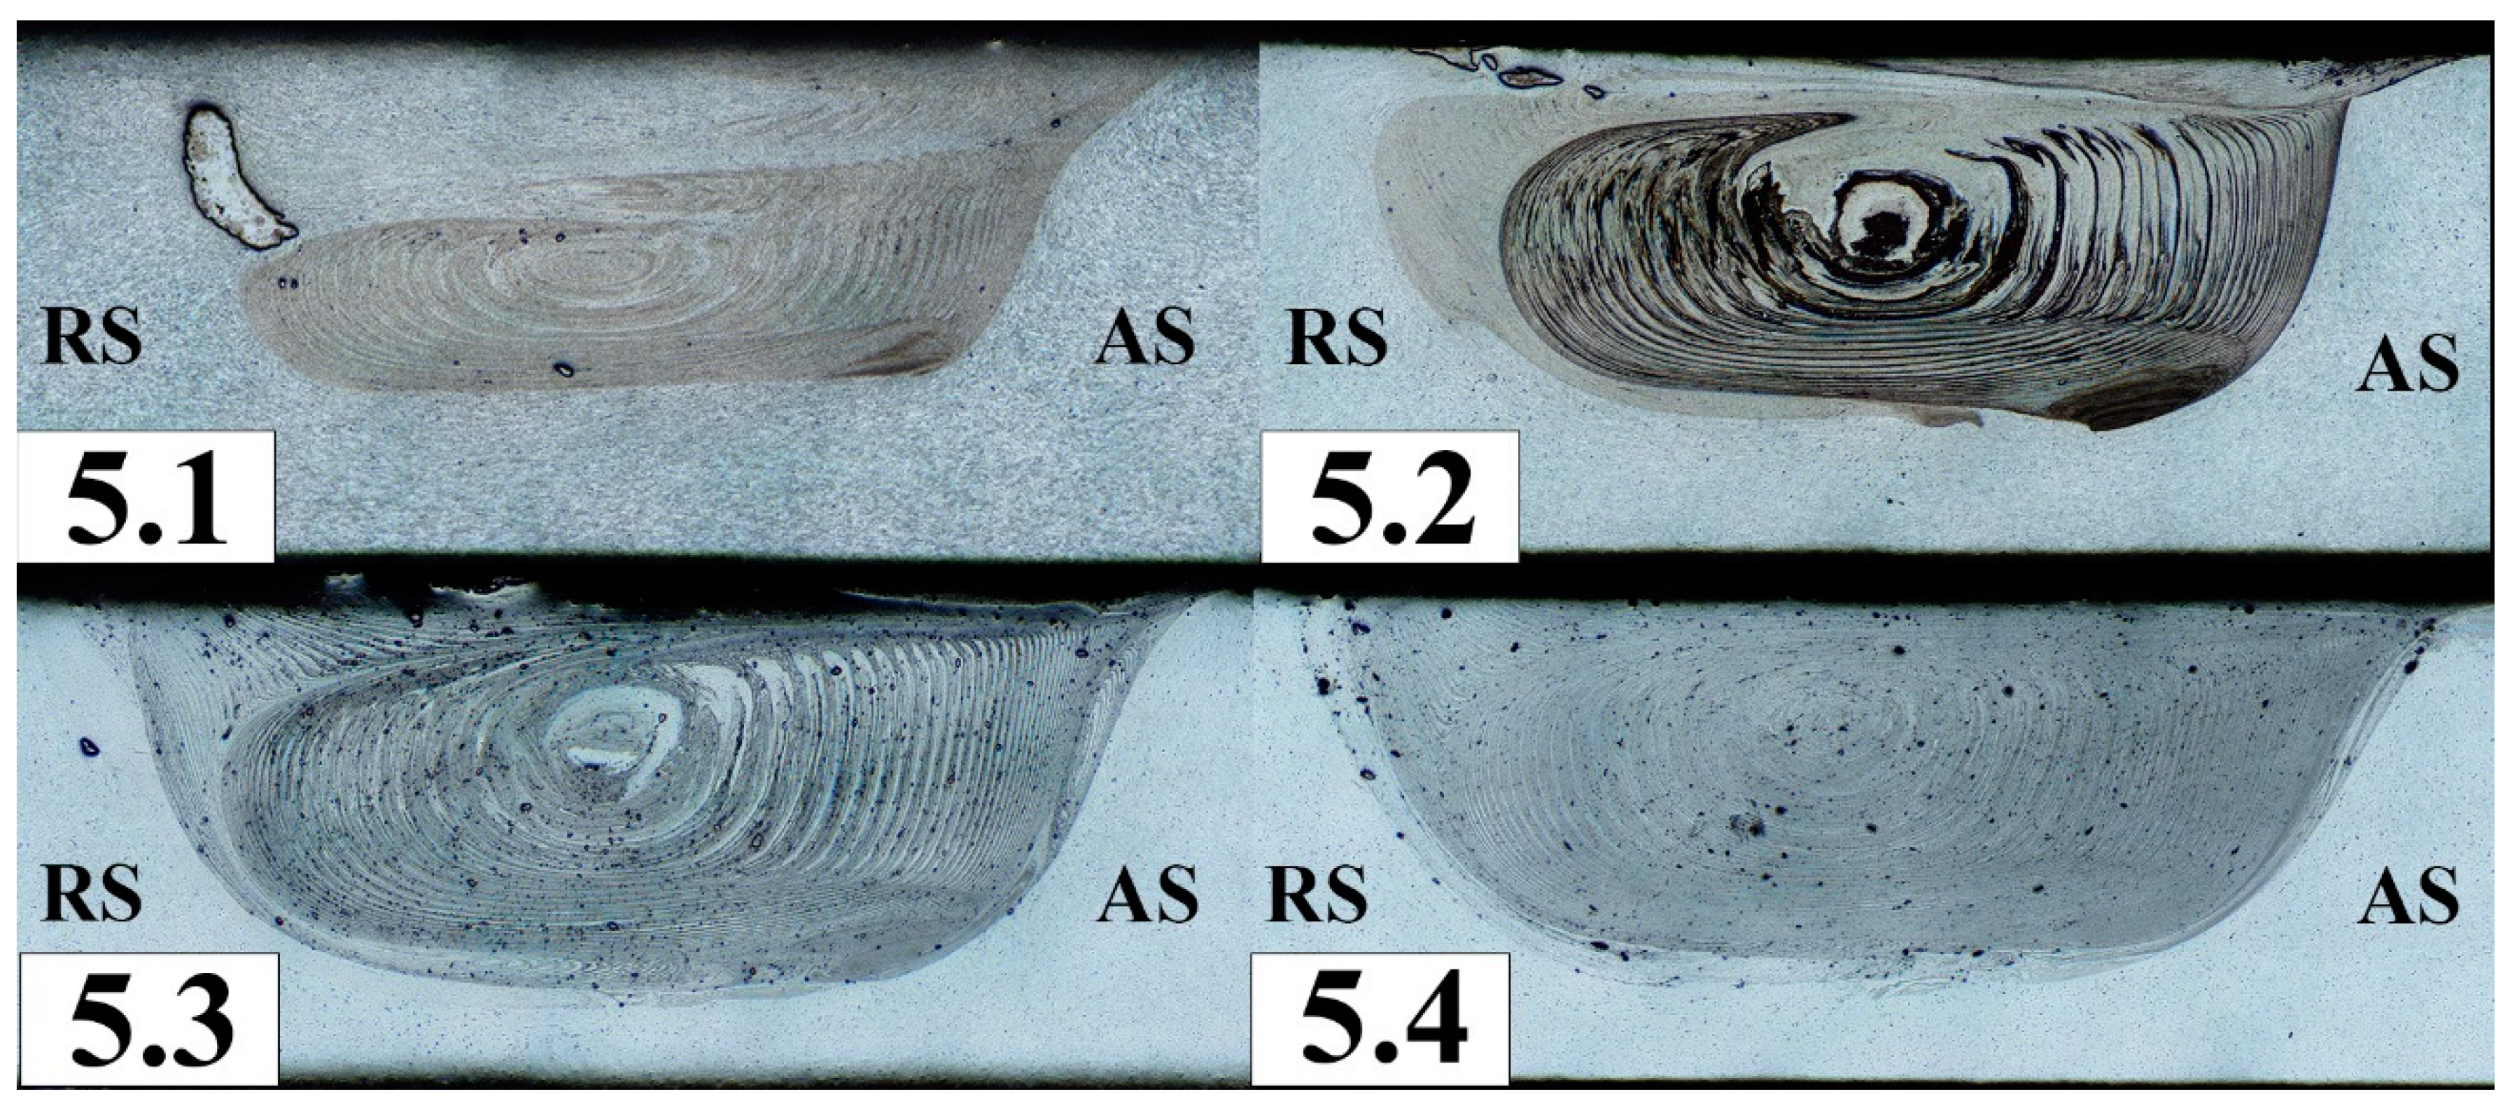
Figure 5 shows macrographs of an aluminum-magnesium alloy (analogue of AA5056) added with 5 vol. % Fe of Fe powder in a section perpendicular to the processing direction. After the first processing pass, the bulk of the powder material was extruded into the upper part of the retreating side (RS) of the stir zone. Under the influence of temperature and severe plastic deformation, the powder agglomerated into large formations of about 1.5 mm in size. During further processing, the iron powder agglomerates were crushed and their fragments were distributed throughout the stir zone. Large agglomerates of powder, about 0.2-0.6 mm in size, can be seen only in the subsurface areas. By the fourth processing cycle, the iron powder was evenly distributed throughout the entire volume. At the same time, the agglomerates were crushed into 0.07-0.12 mm sized ones.
Computer tomography studies of the resulting composites (
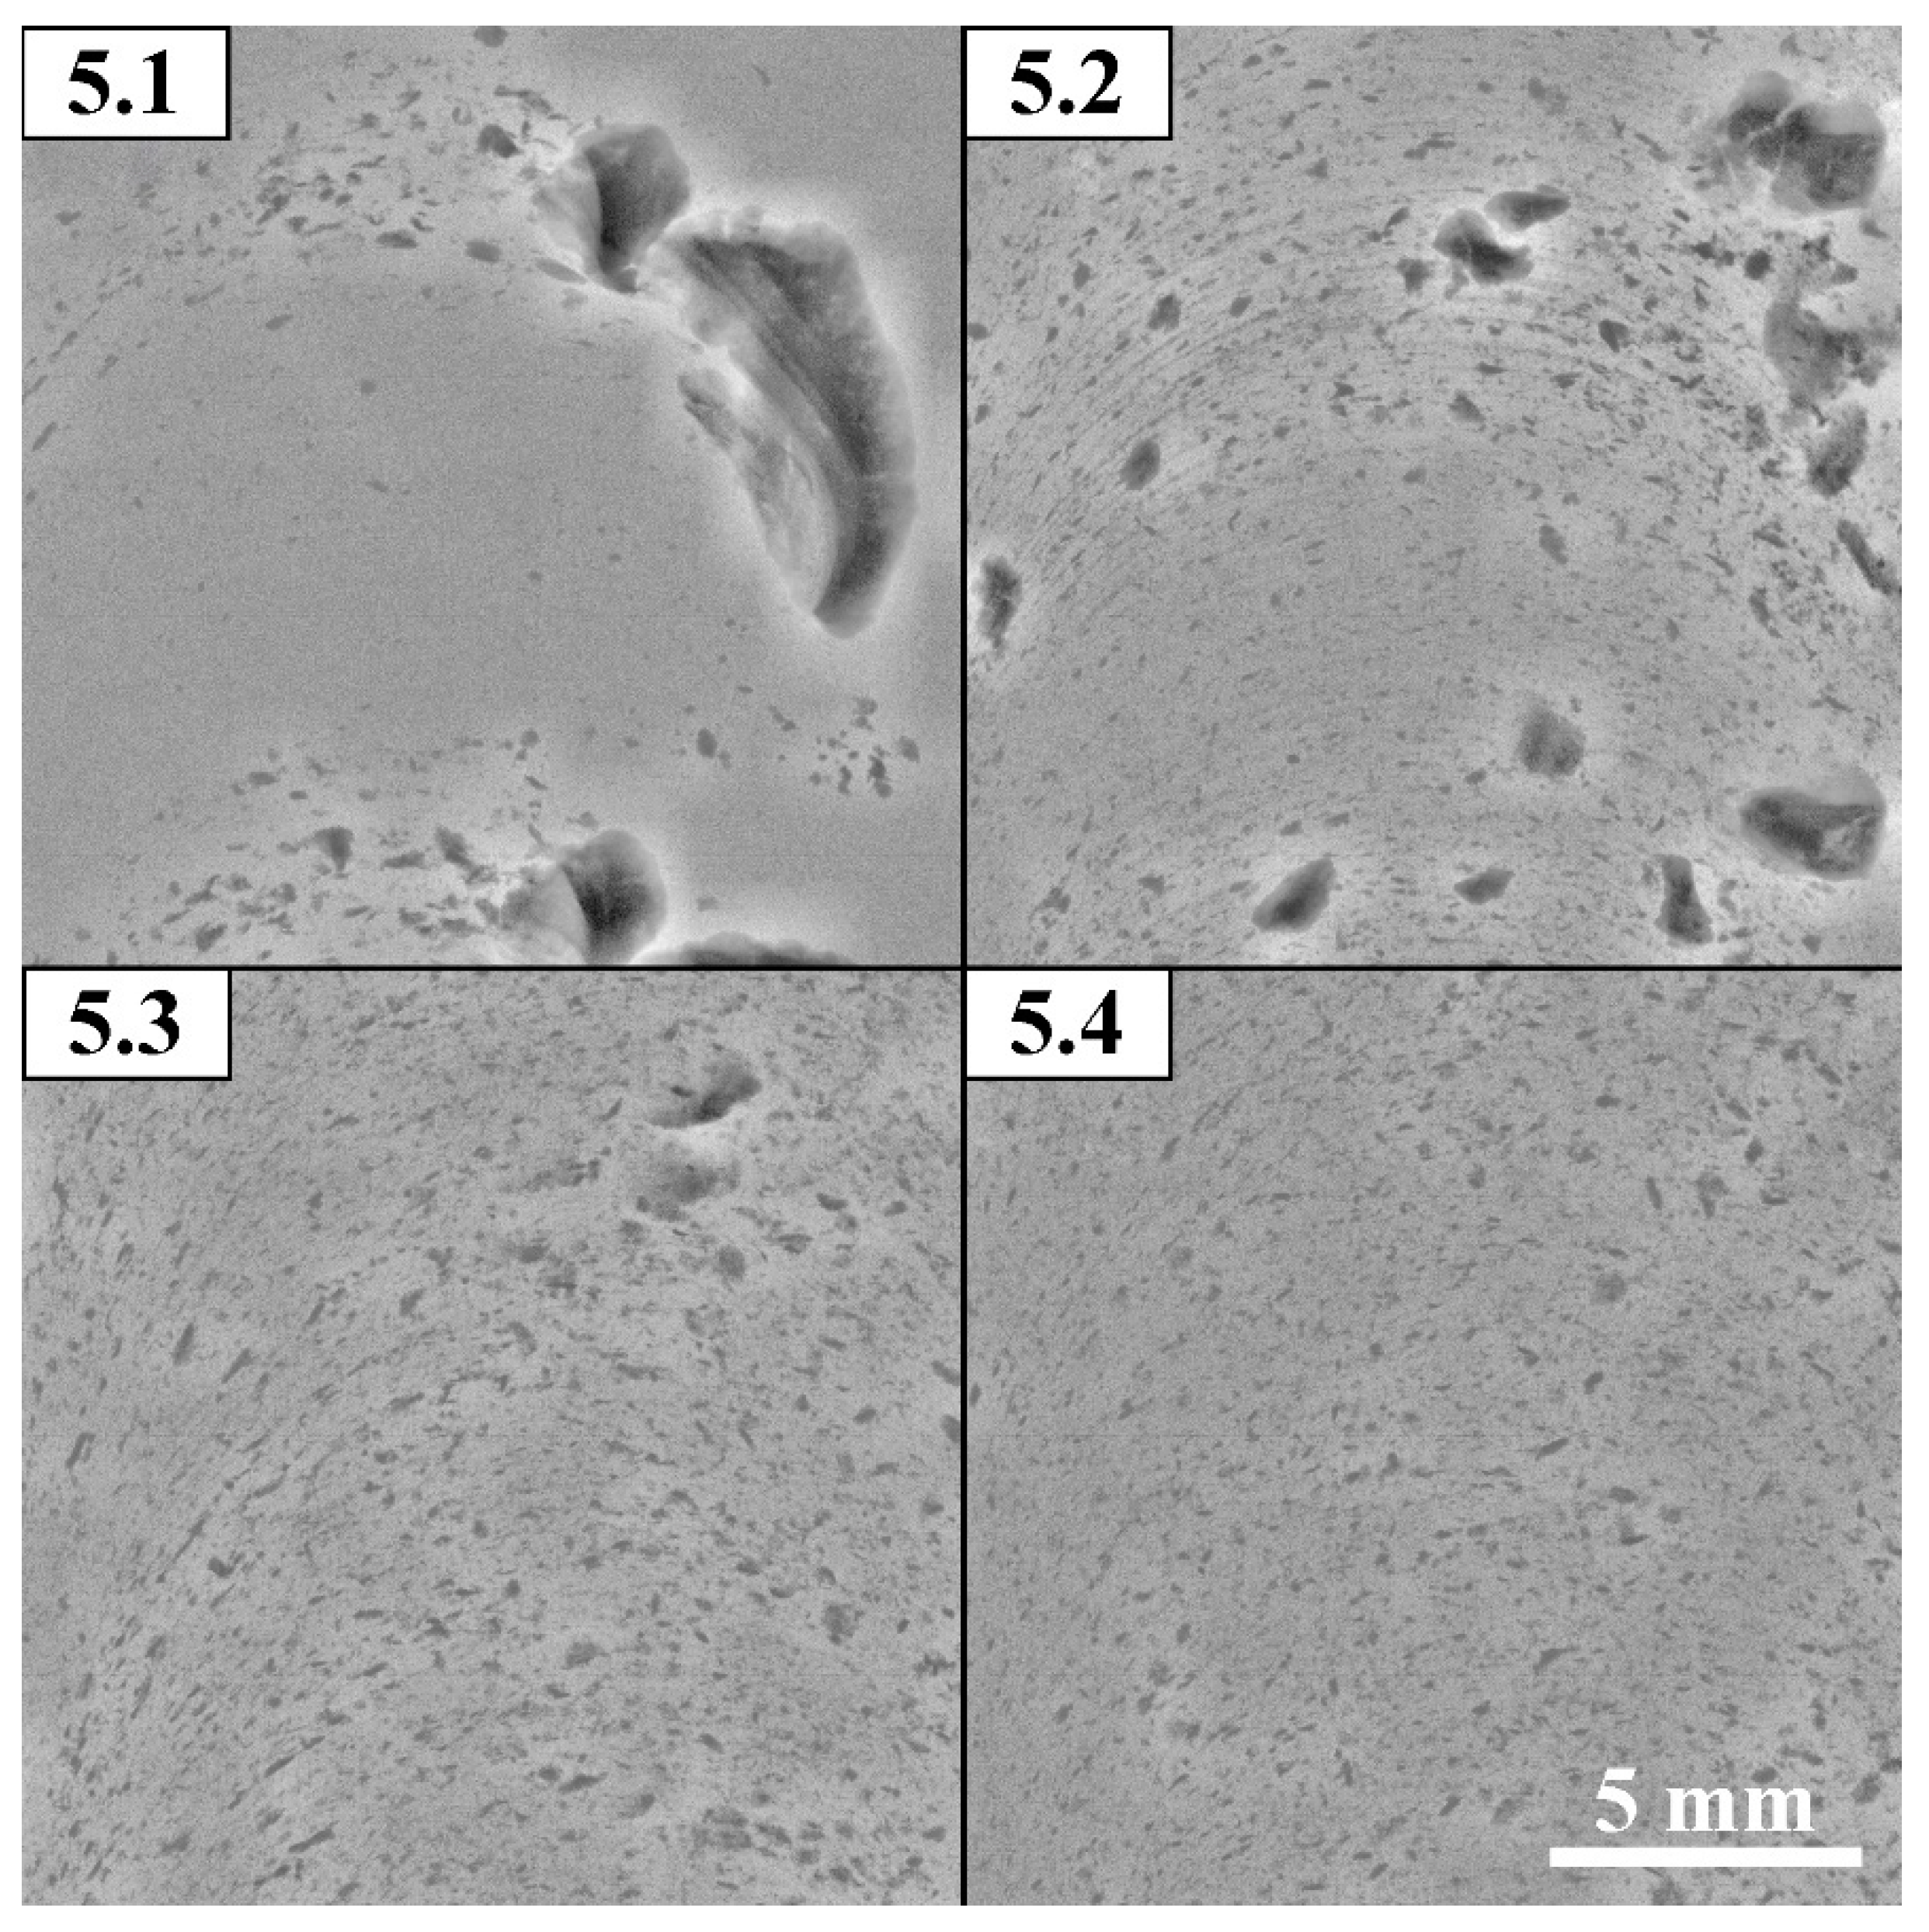
Figure 6) also showed that the powder was pushed toward the retreating side of the tool. At the same time, being squeezed towards the tool’s shoulders, it is transferred and distributed further along the workpiece. This forms a mark in the form of large dark spots about 6 mm in size on X-ray images after the first pass. Already the second pass of processing reduces the size of inclusions to 1.5-2 mm, and the third pass – to 1 mm, the fourth – 0.5 mm.
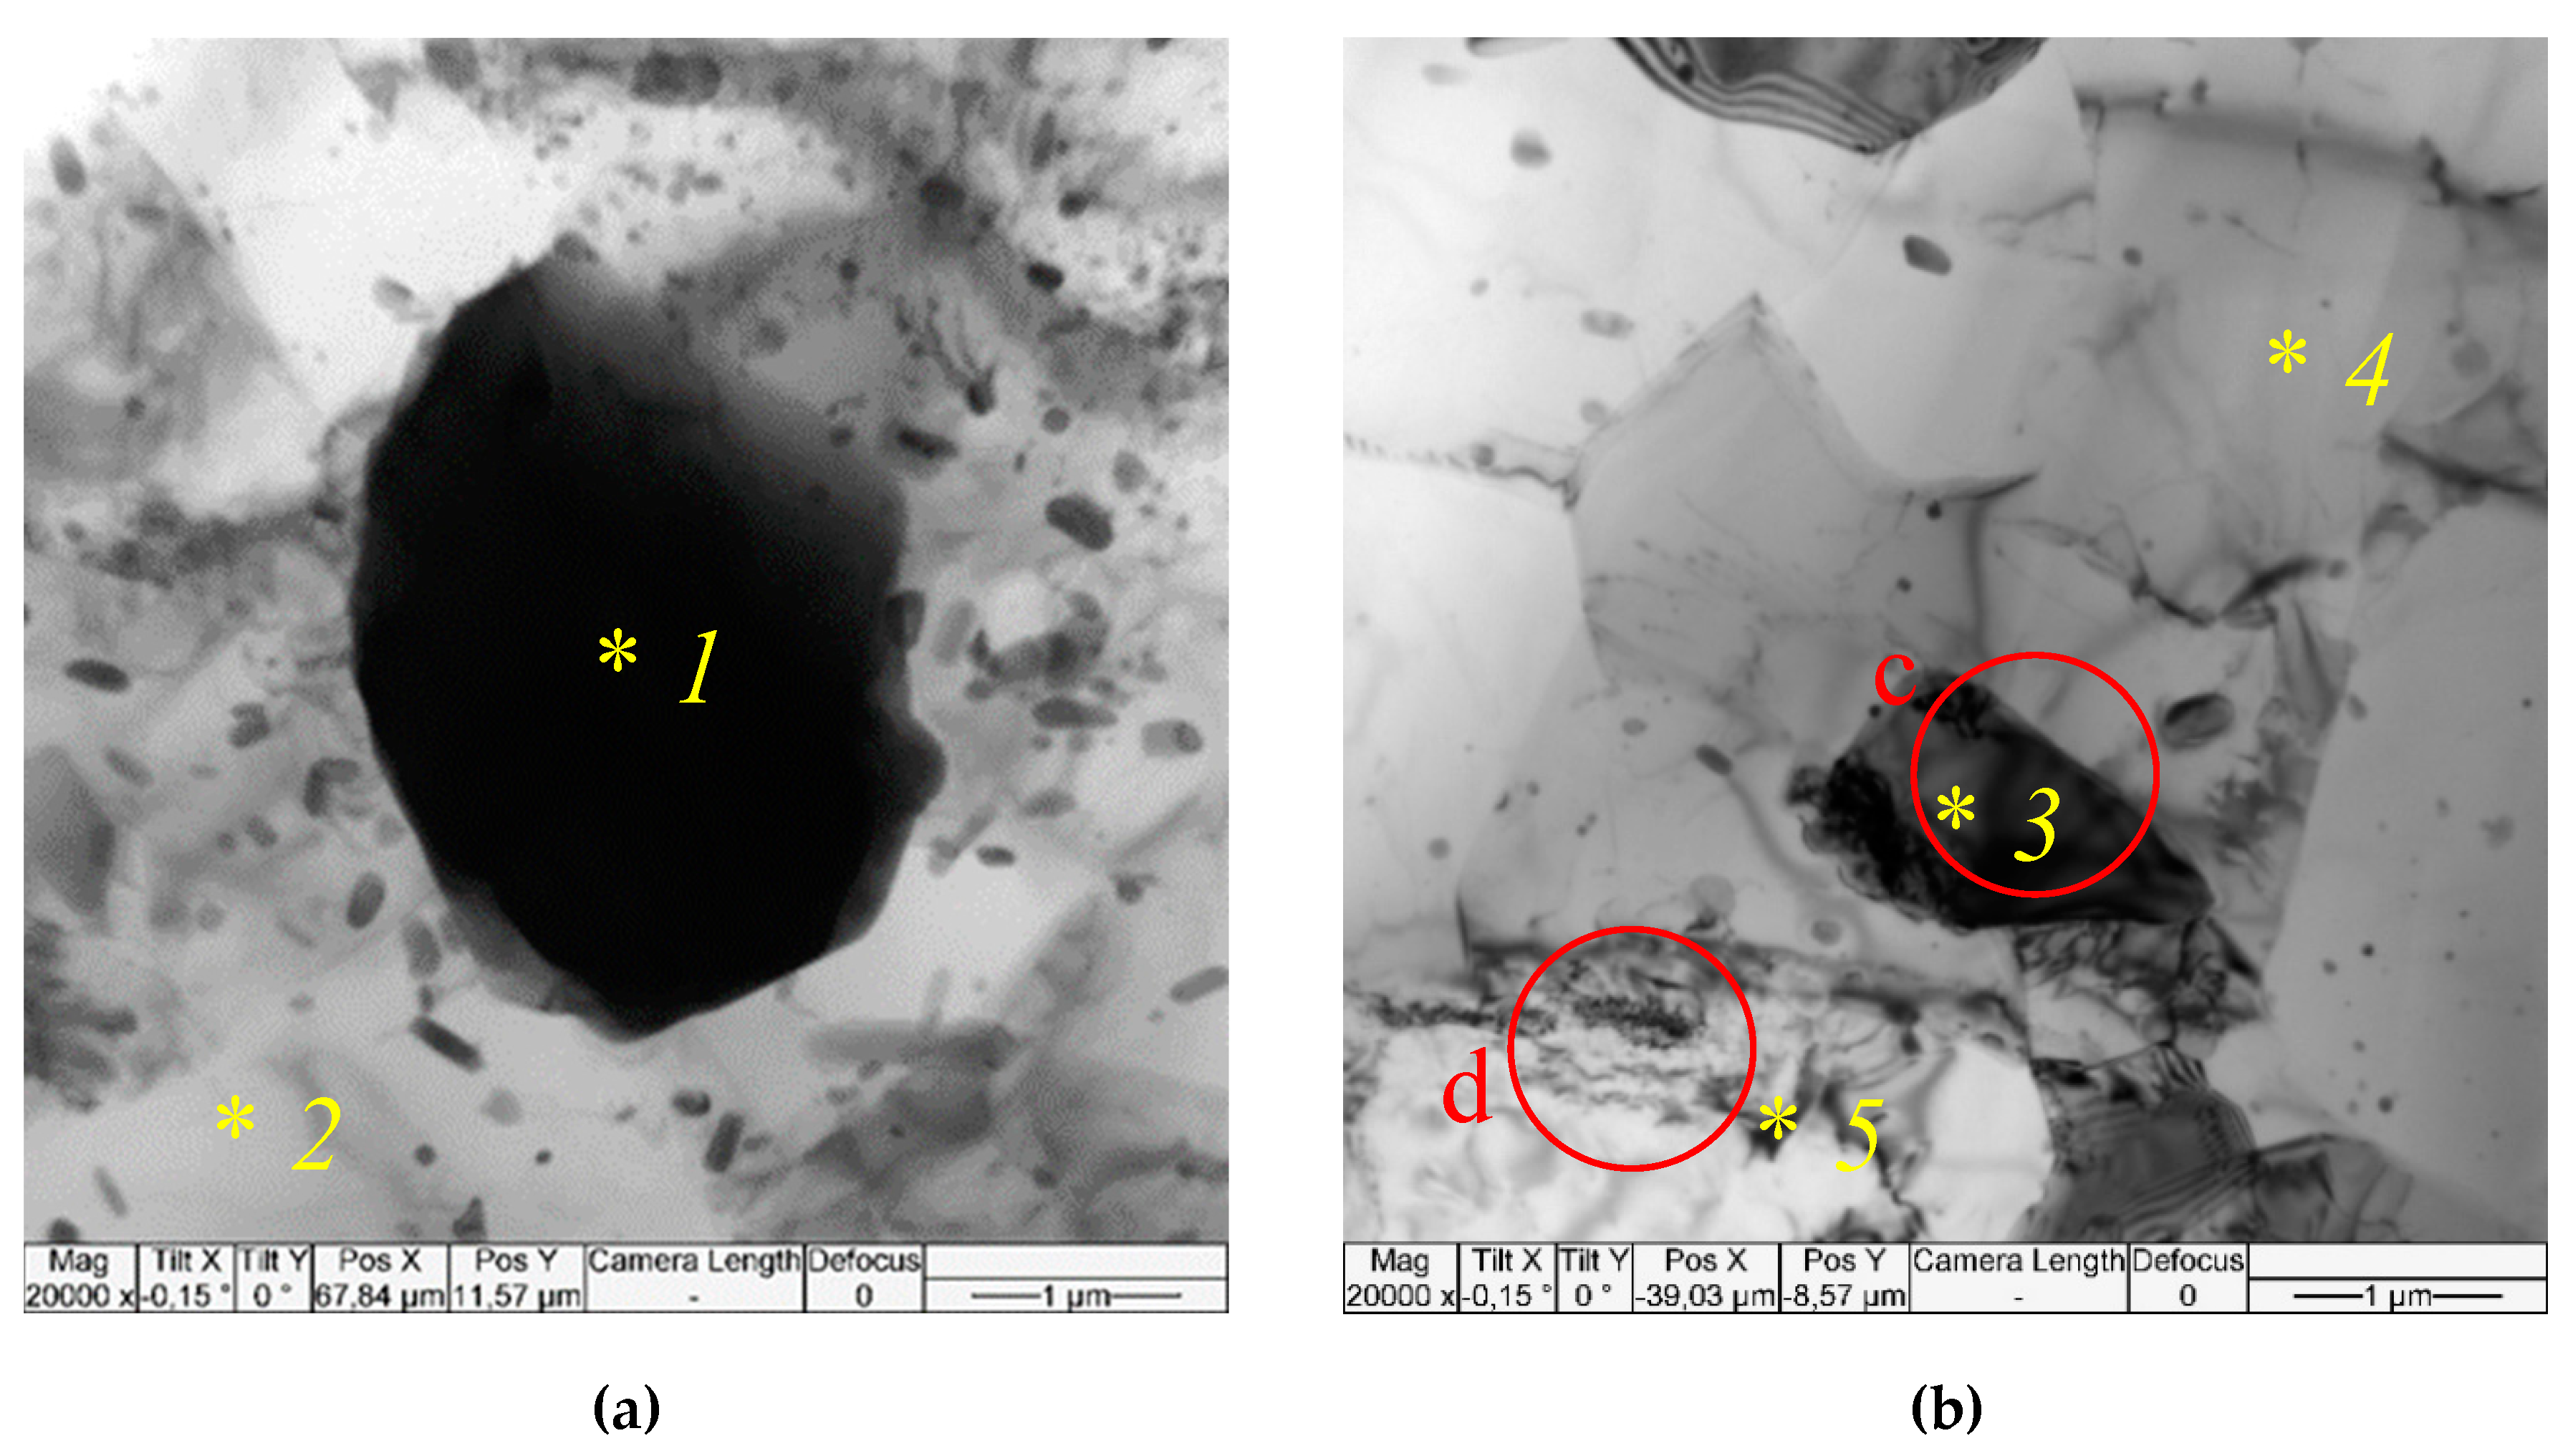
More microstructural details have been obtained with the use of TEM, in particular, the single pass FSP resulted in forming recrystallized α-Al solid solution grains of the mean size 2.58±0.68 μm. According to EDS these grains contain ~7 at. % of Mg (
Figure 7a,b,
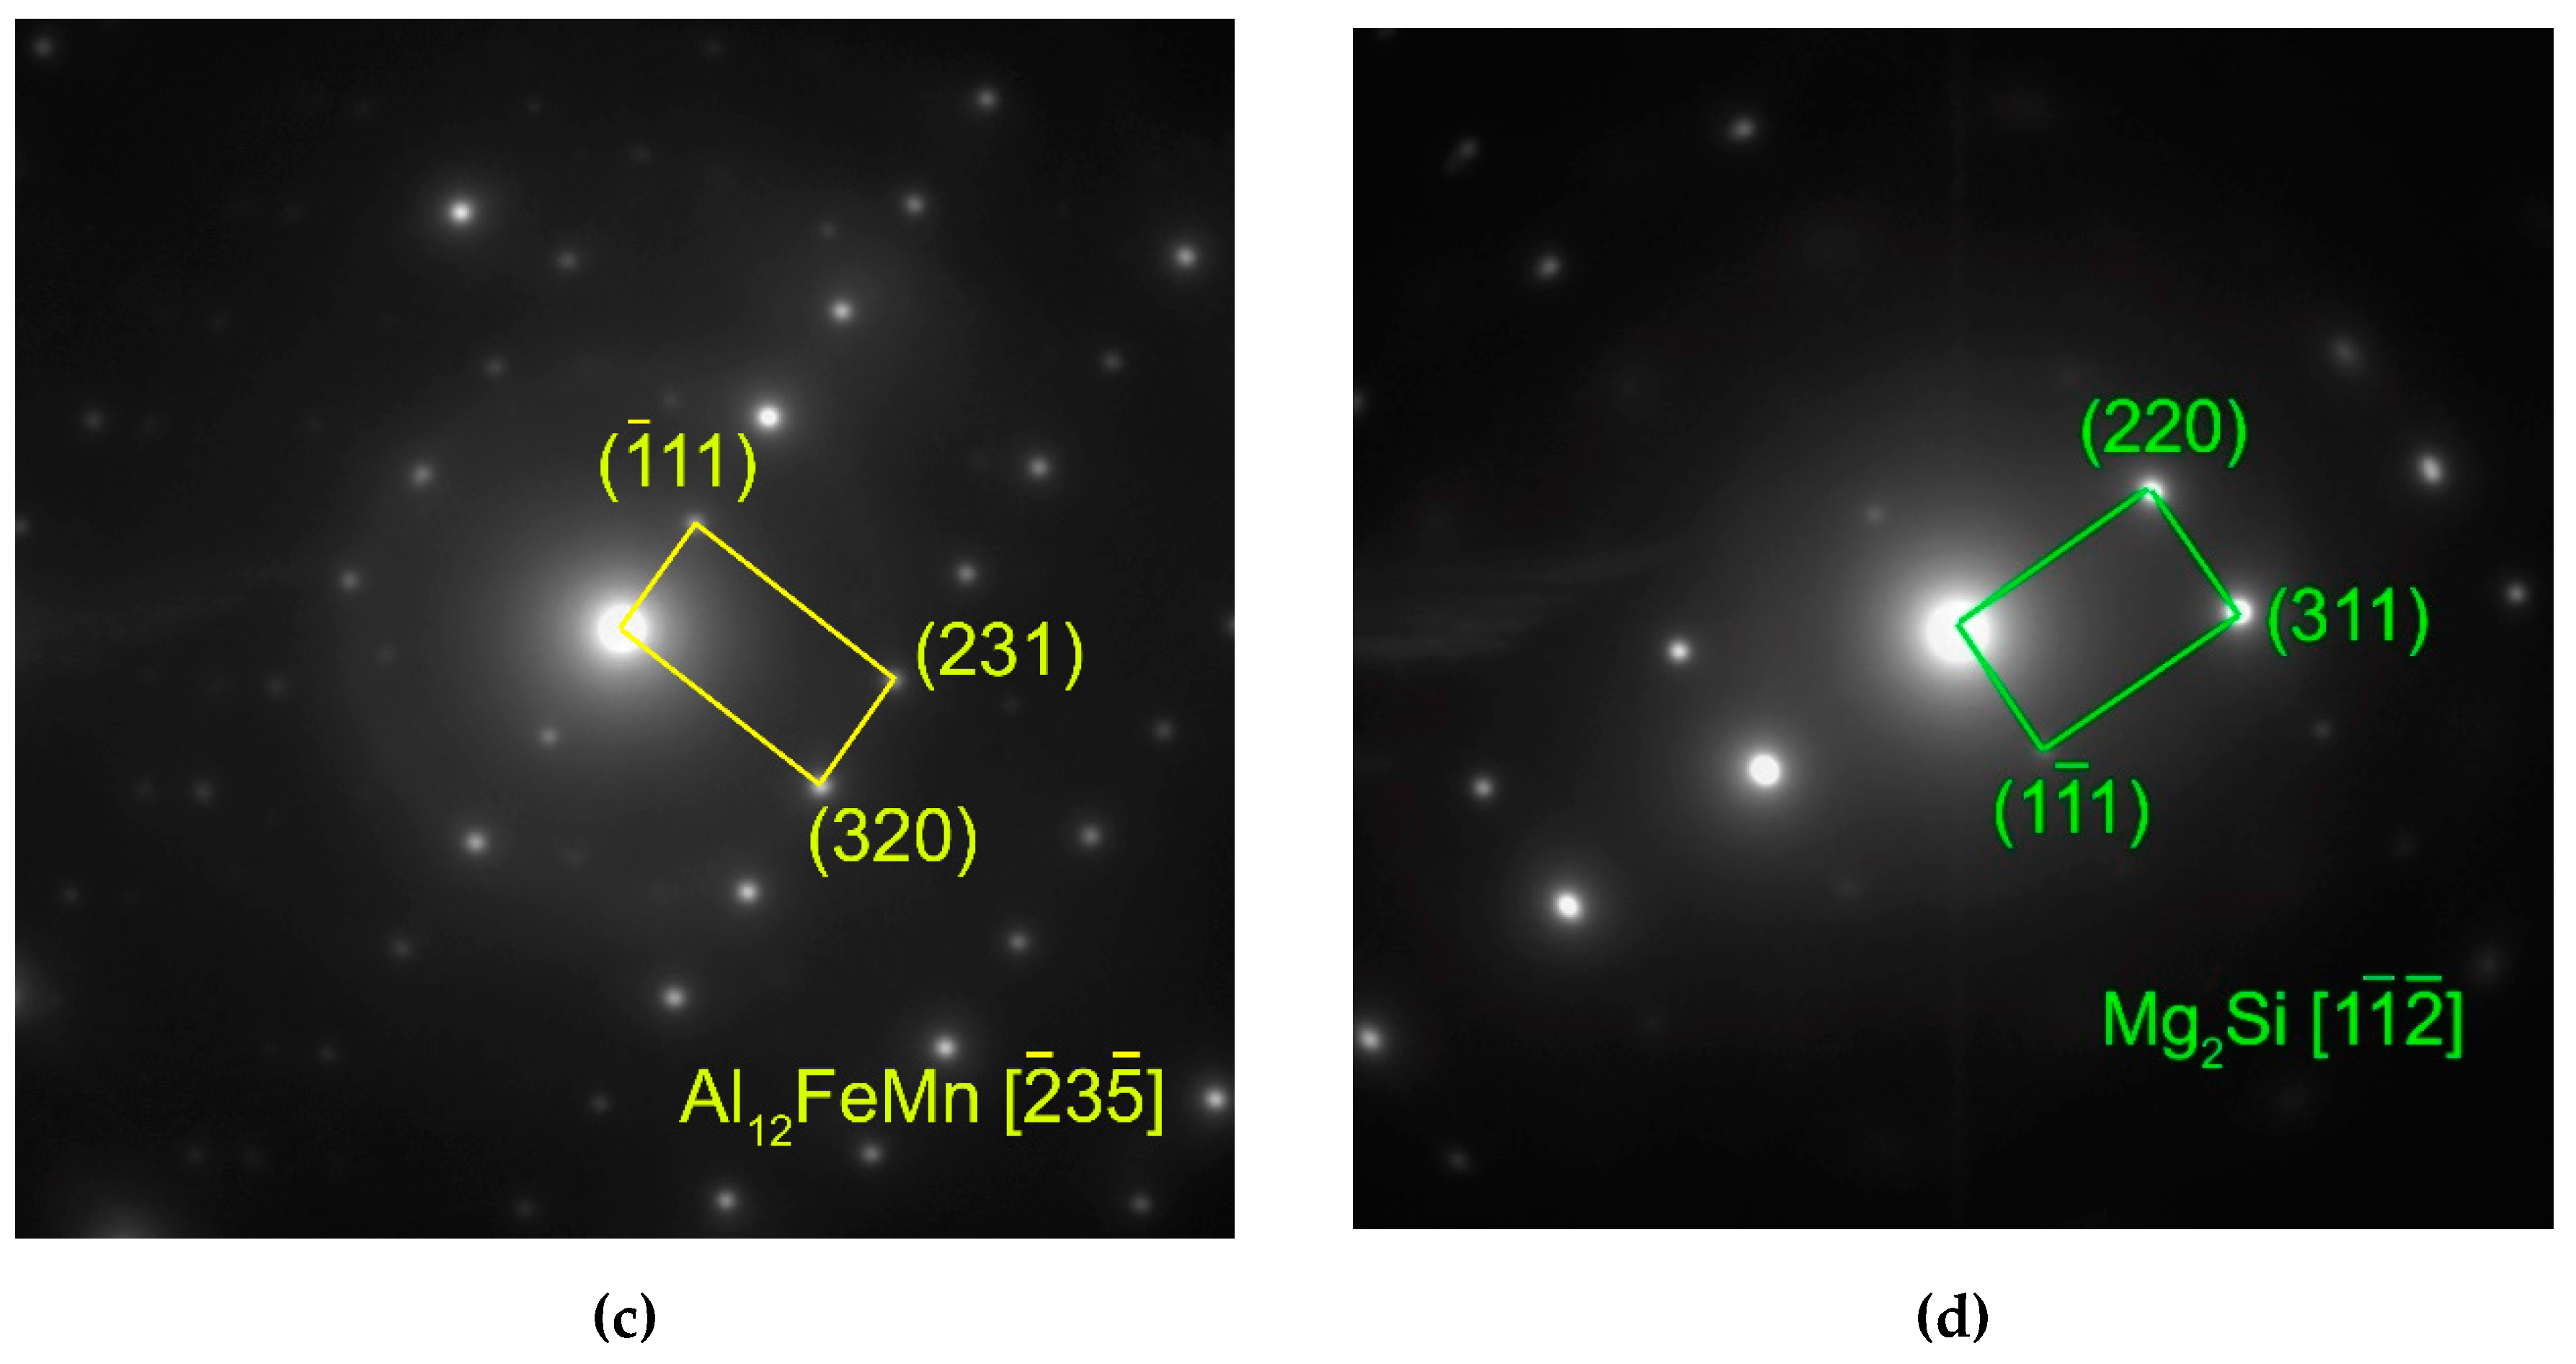
Table 3, spectra 2,4). Isolated IMC grains can be observed in the SZ whose EDS spectra allow identifying them as orthorhombic Al
12FeMn with lattice parameters a = 0.639 nm, b = 0.742 nm, c = 0.871 nm (Amm2) (
Figure 7a,b,
Table 3, spectra 1,3). Such a suggestion is supported by identification of the corresponding SAED pattern reflections (
Figure 7c). These particles also contain impurities such as Cr and Si (
Table 3, spectra 1,3).
Fine particles can be found both inside the α-Al grains and on their boundaries (
Figure 7a,b) whose mean size is 351±90 nm. These particles are inhomogeneously distributed in the SZ as demonstrated in
Figure 6, image 5.1. There is another sort of particles of the size comparable to that of the solid solution grains (
Figure 7b). Corresponding EDS spectrum and SAED pattern allow identifying them as Mg
2Si (
Figure 7b,
Table 3, spectrum 5).
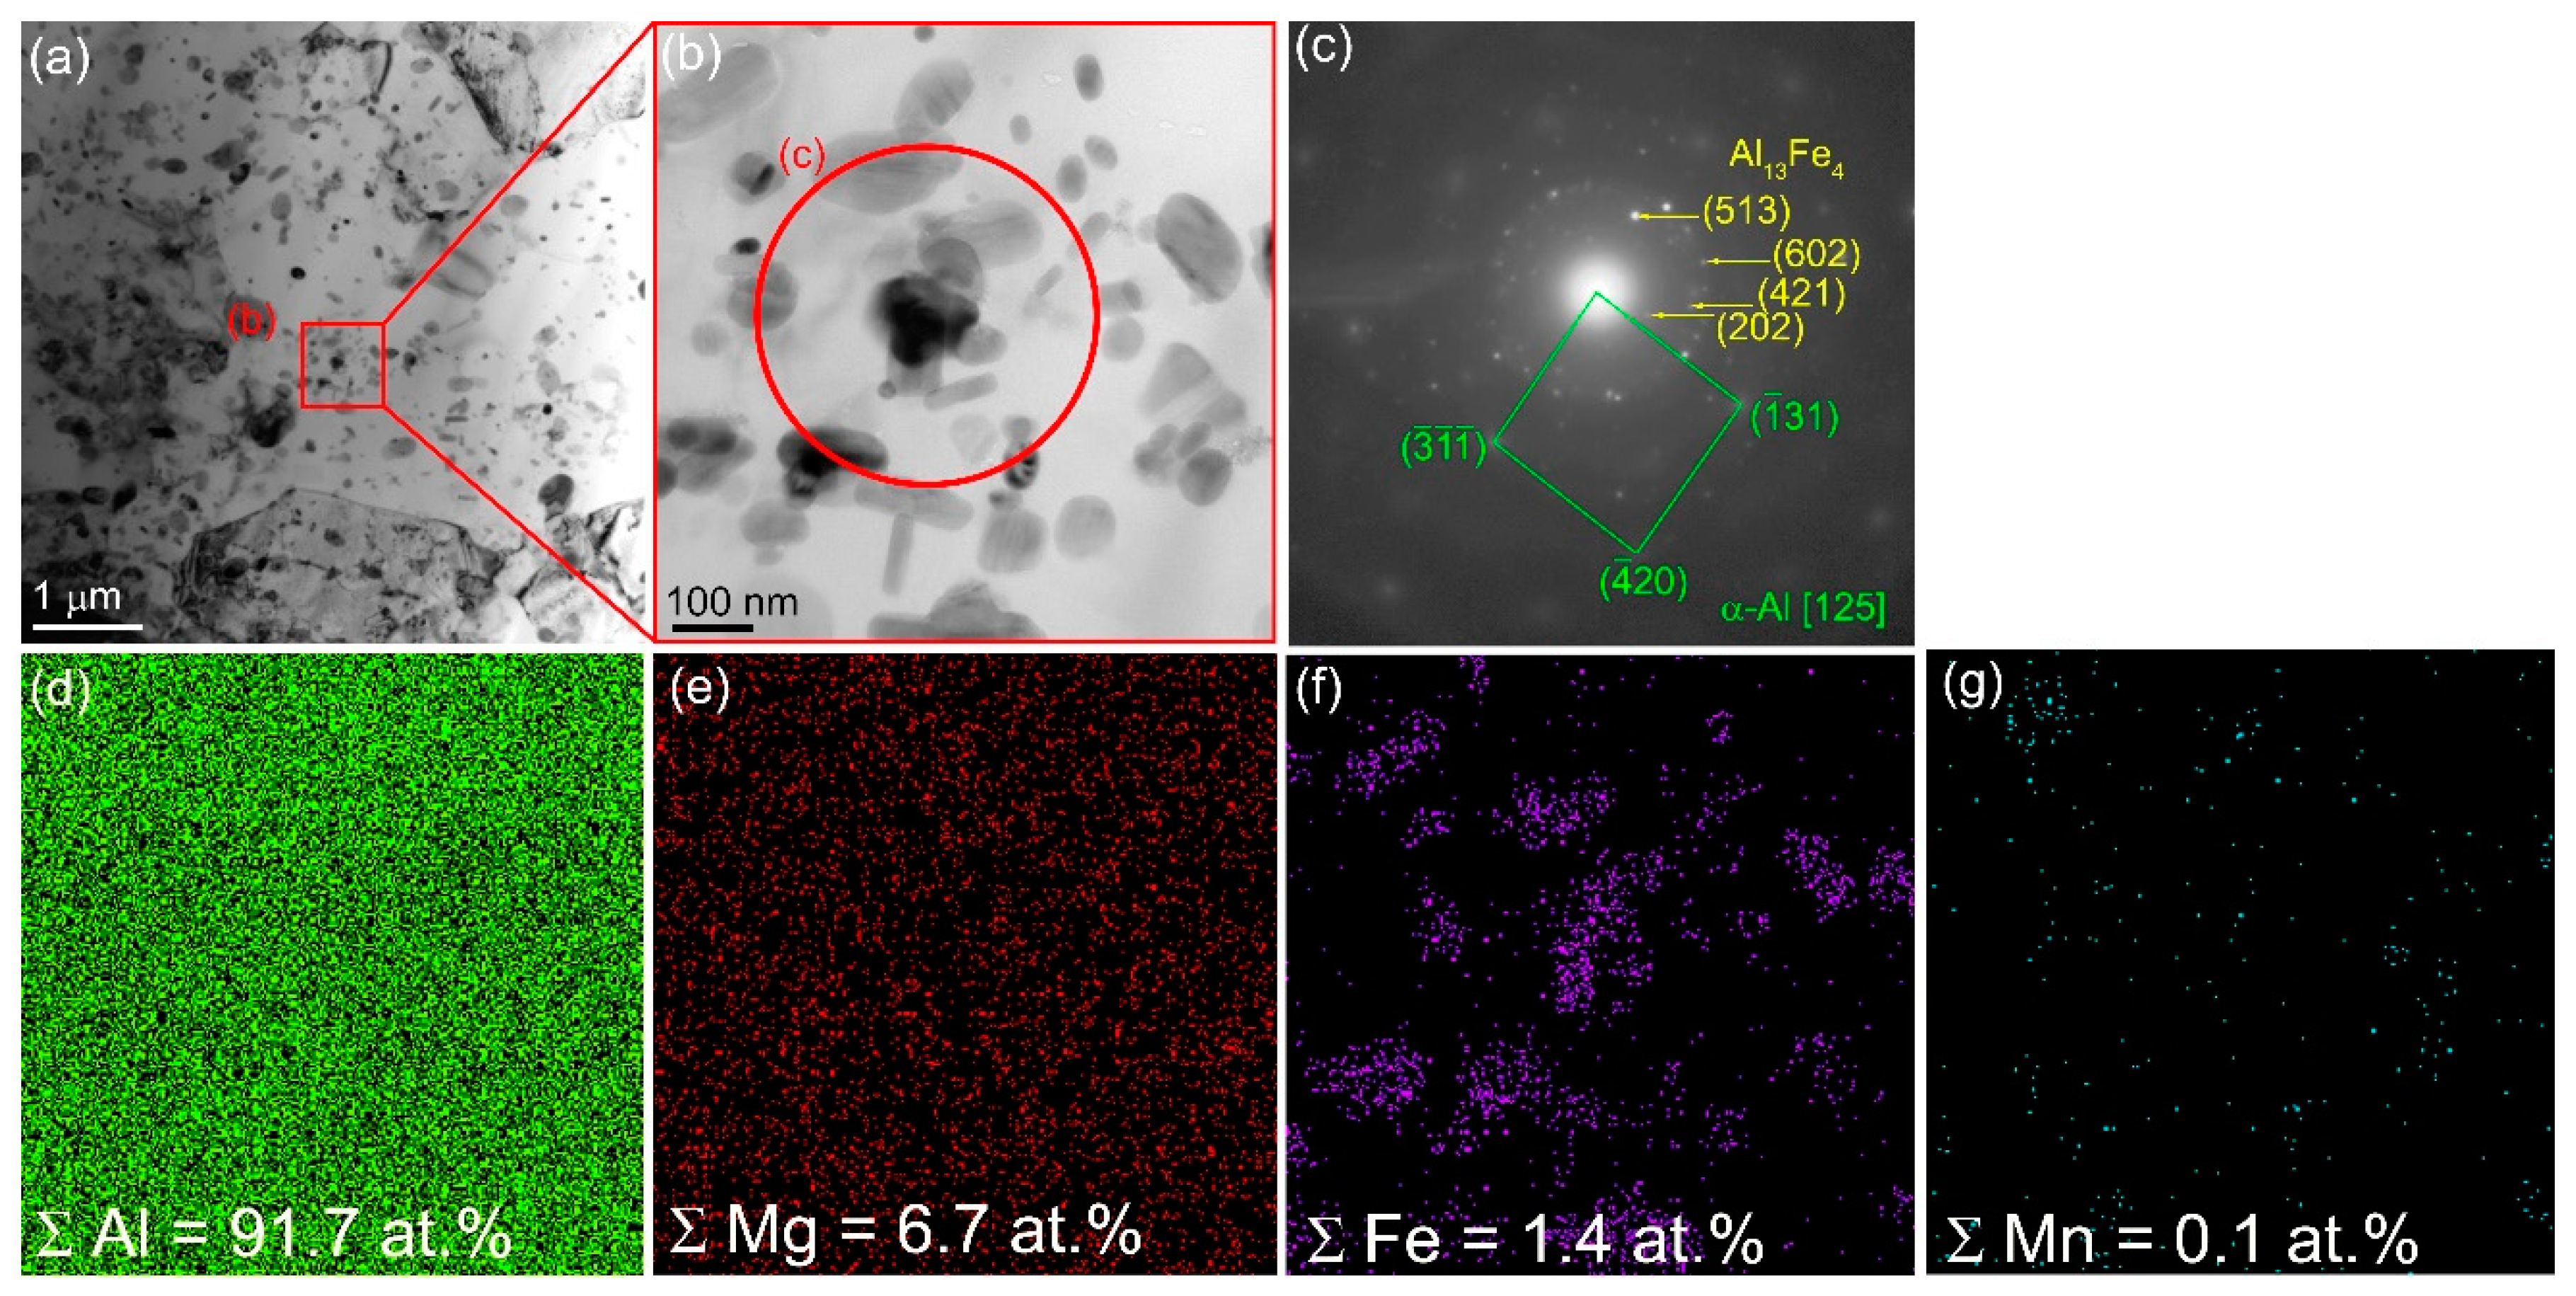
More homogeneous distribution of IMCs is observed after 4-pass FSP (
Figure 8a). Their mean size reduced to 152±34 nm. Some of them have been identified as IMCs according to the SAED pattern in
Figure 8b,c and EDS elemental maps in
Figure 8d–g.
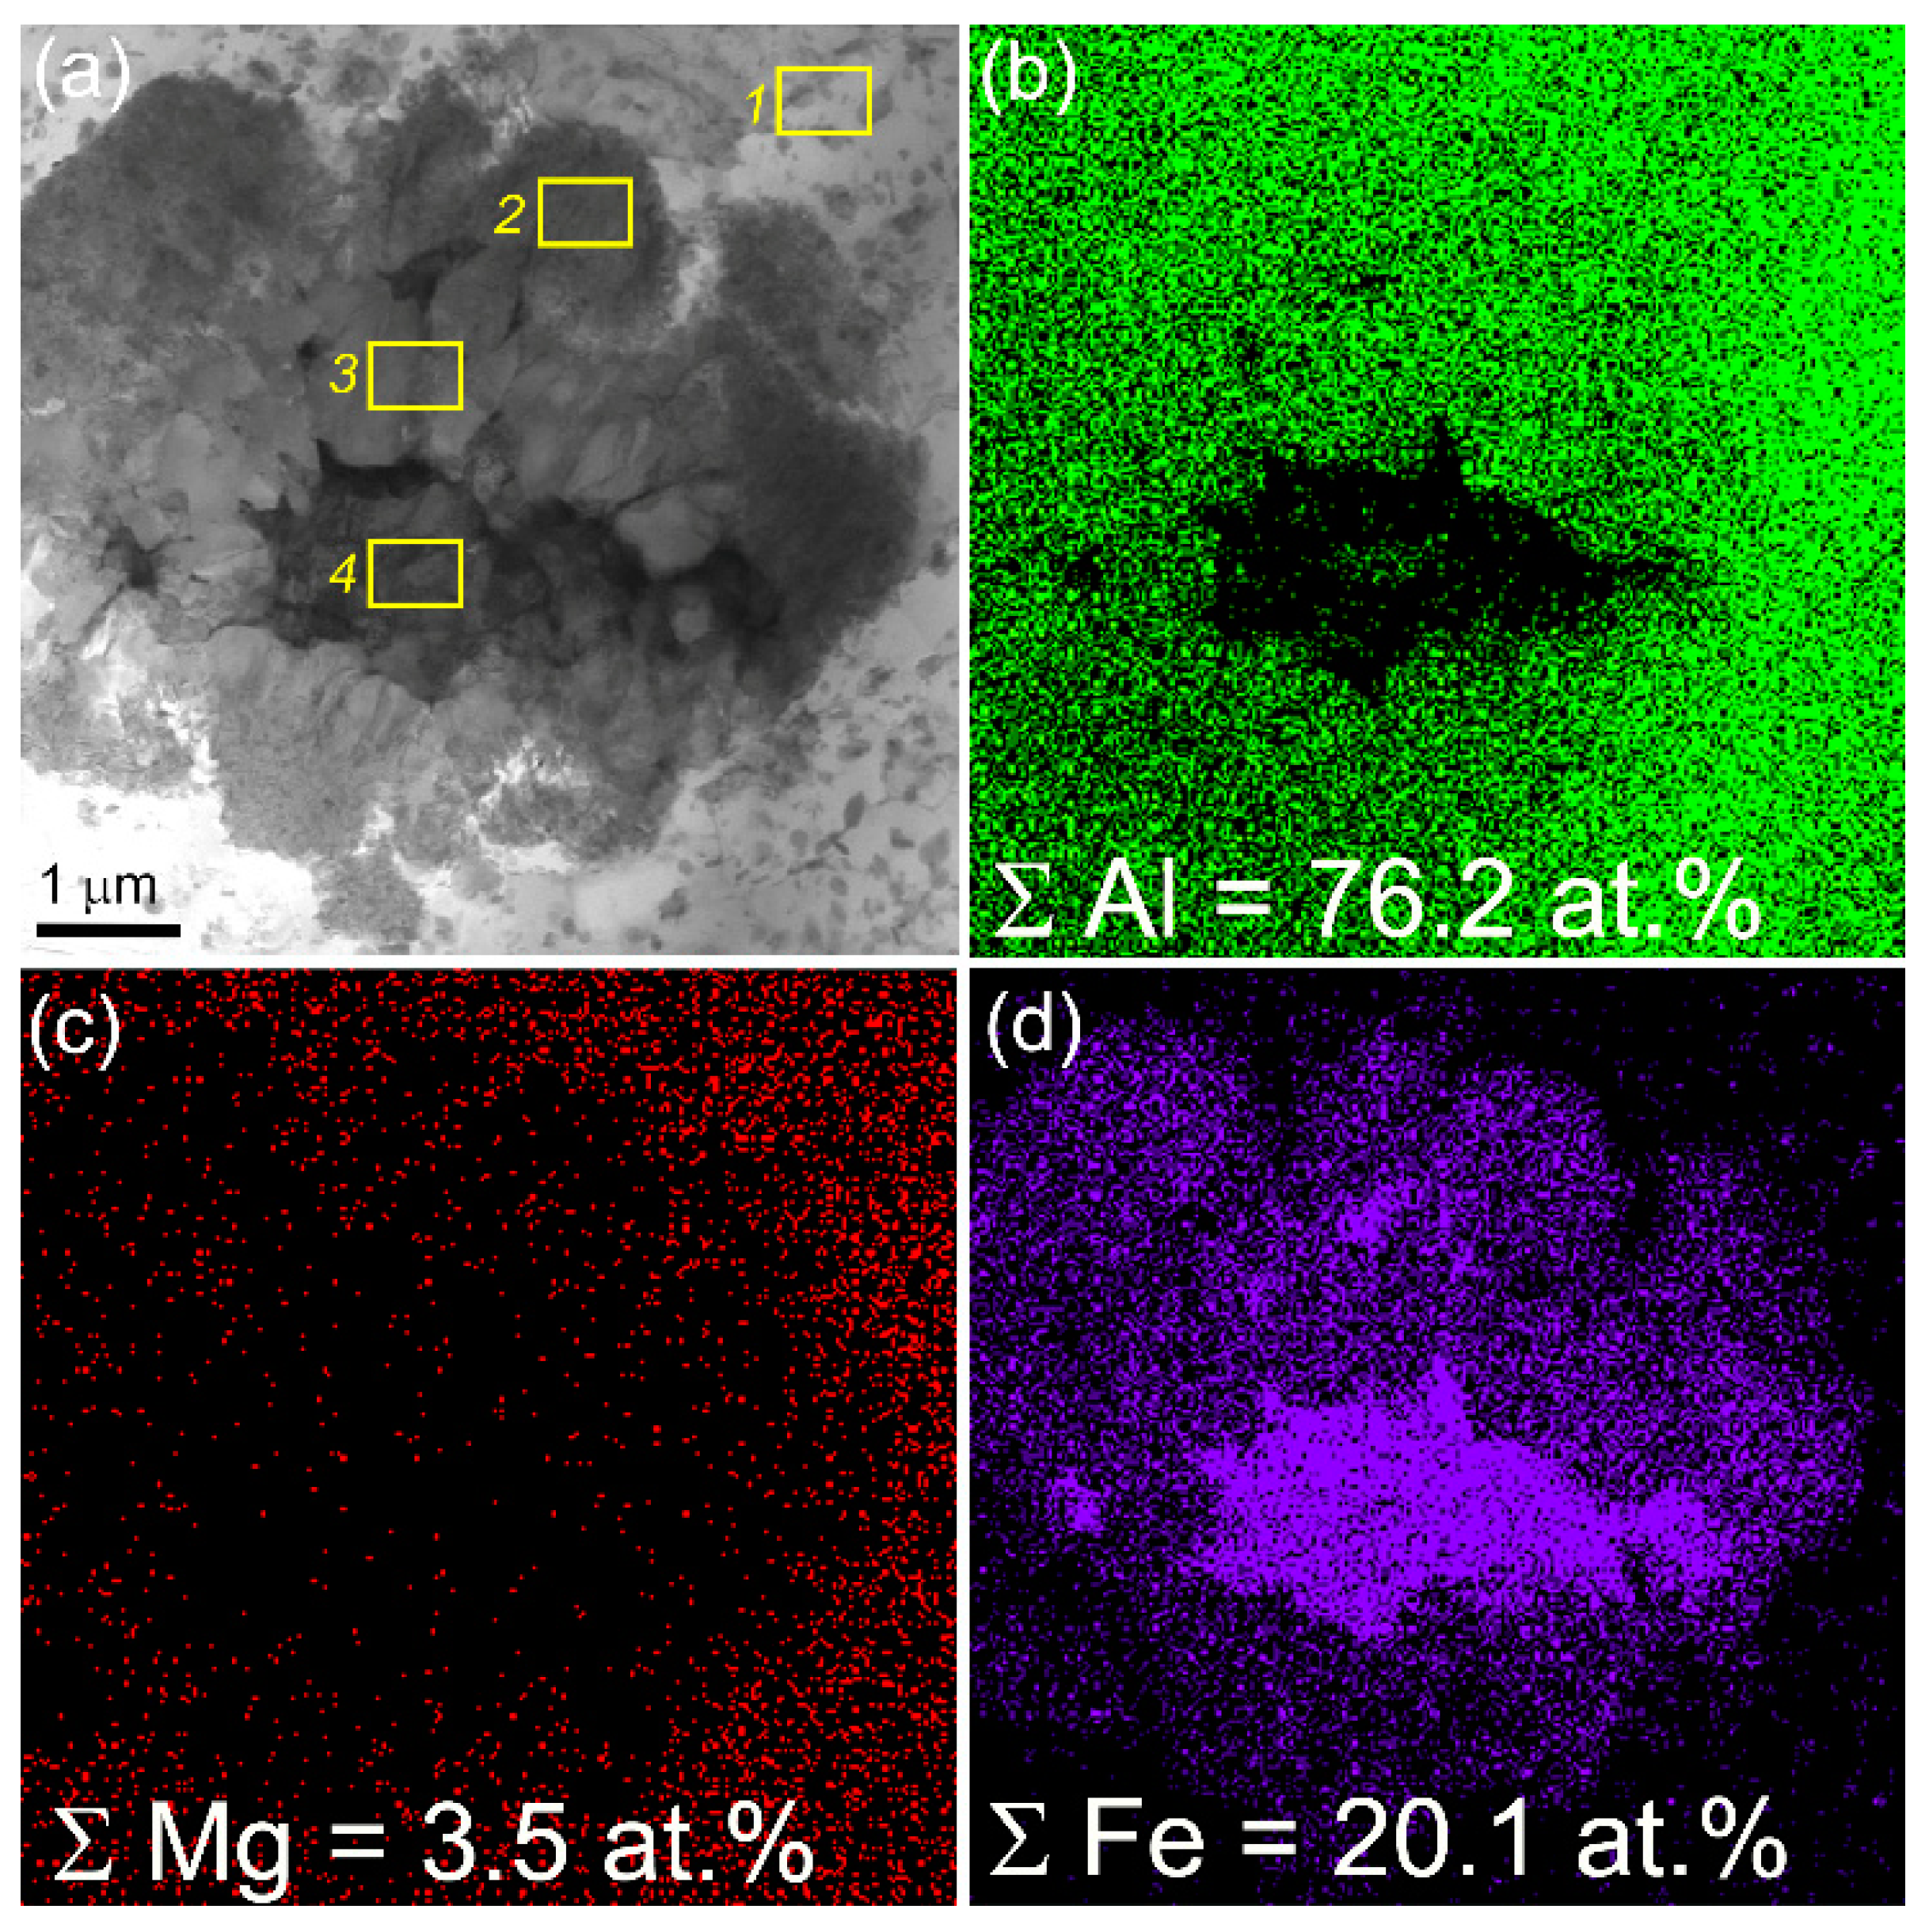
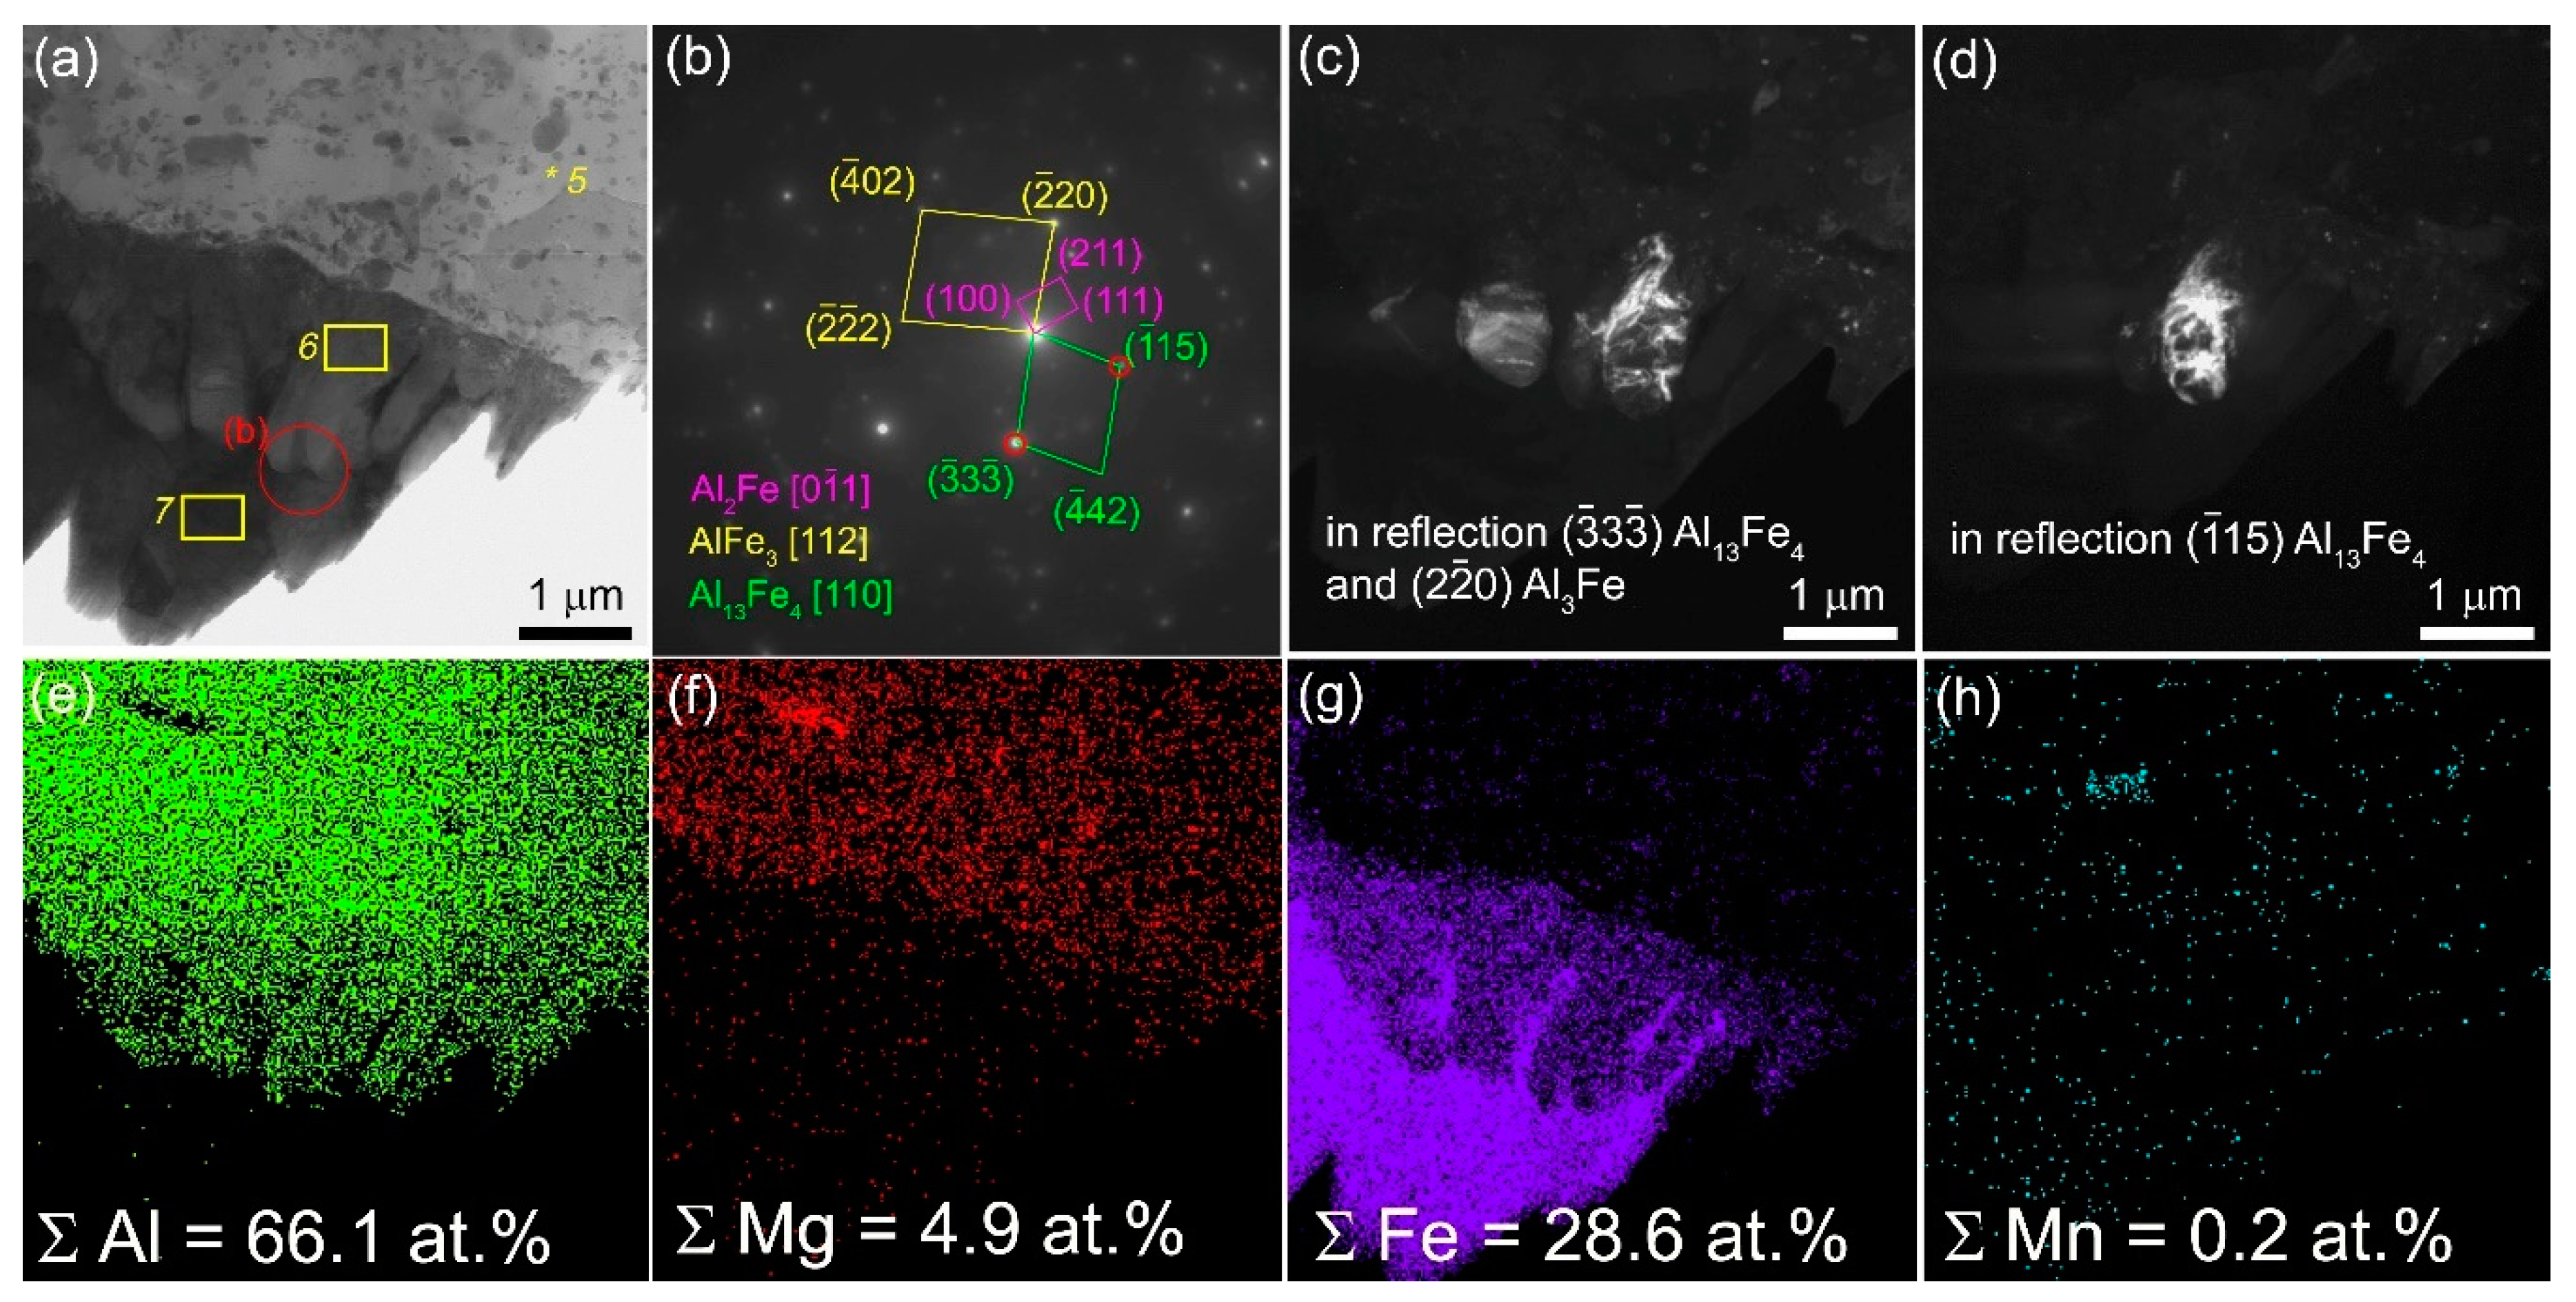
Another finding is that there are some zones in the SZ that contain core γ-Fe grains with the AlxFey IMC shells (
Figure 9,
Figure 10a,e,g) that also can be clearly seen from observing EDS maps in
Figure 9 and
Figure 10, EDS spectra in
Table 4 (spectra 2,3,6) and SAED pattern in
Figure 9a,b. The distribution of both Fe and Al in these core-shell particles varies (
Figure 9 and
Figure 10) so that shell regions may contain some AlxFey IMCs. The SAED pattern reflections in
Figure 10a allows identifying the presence of IMCs such as Al
2Fe, Al
13Fe
4 and AlFe
3 (
Figure 10a,b).
3.2. Macro-and Microstructures in SZ of Al-Mg Admixed with 10 vol.% Fe
According to XRD, these samples contained the phases same as those detected in Al-Mg-5 vol. % Fe, i.e., increasing the amount of Fe powder intermixed with the aluminum alloy did not changed the phase composition irrespective of the FSP pass number (
Figure 11).
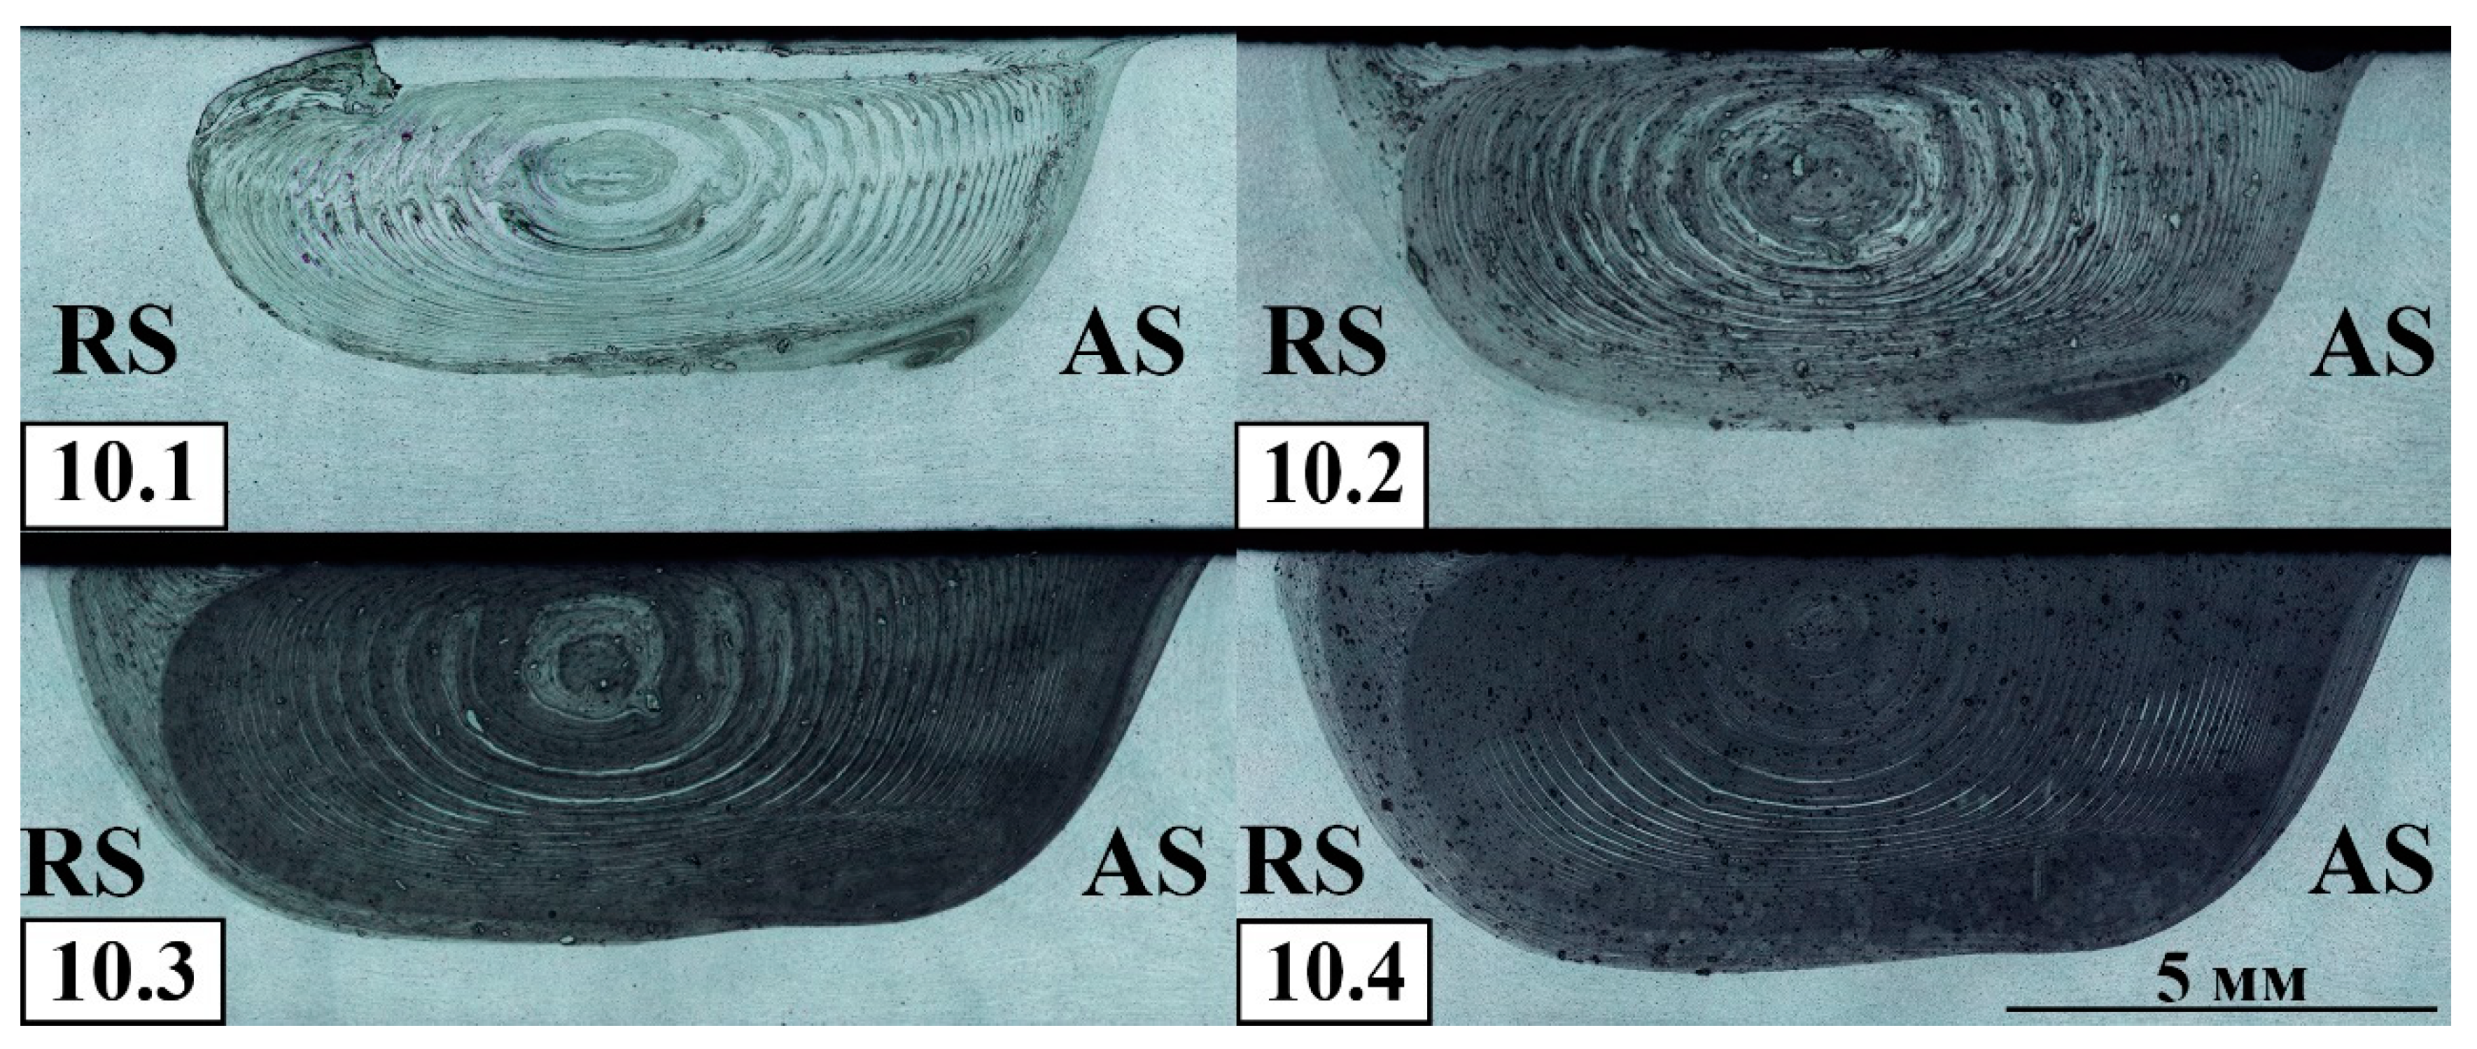
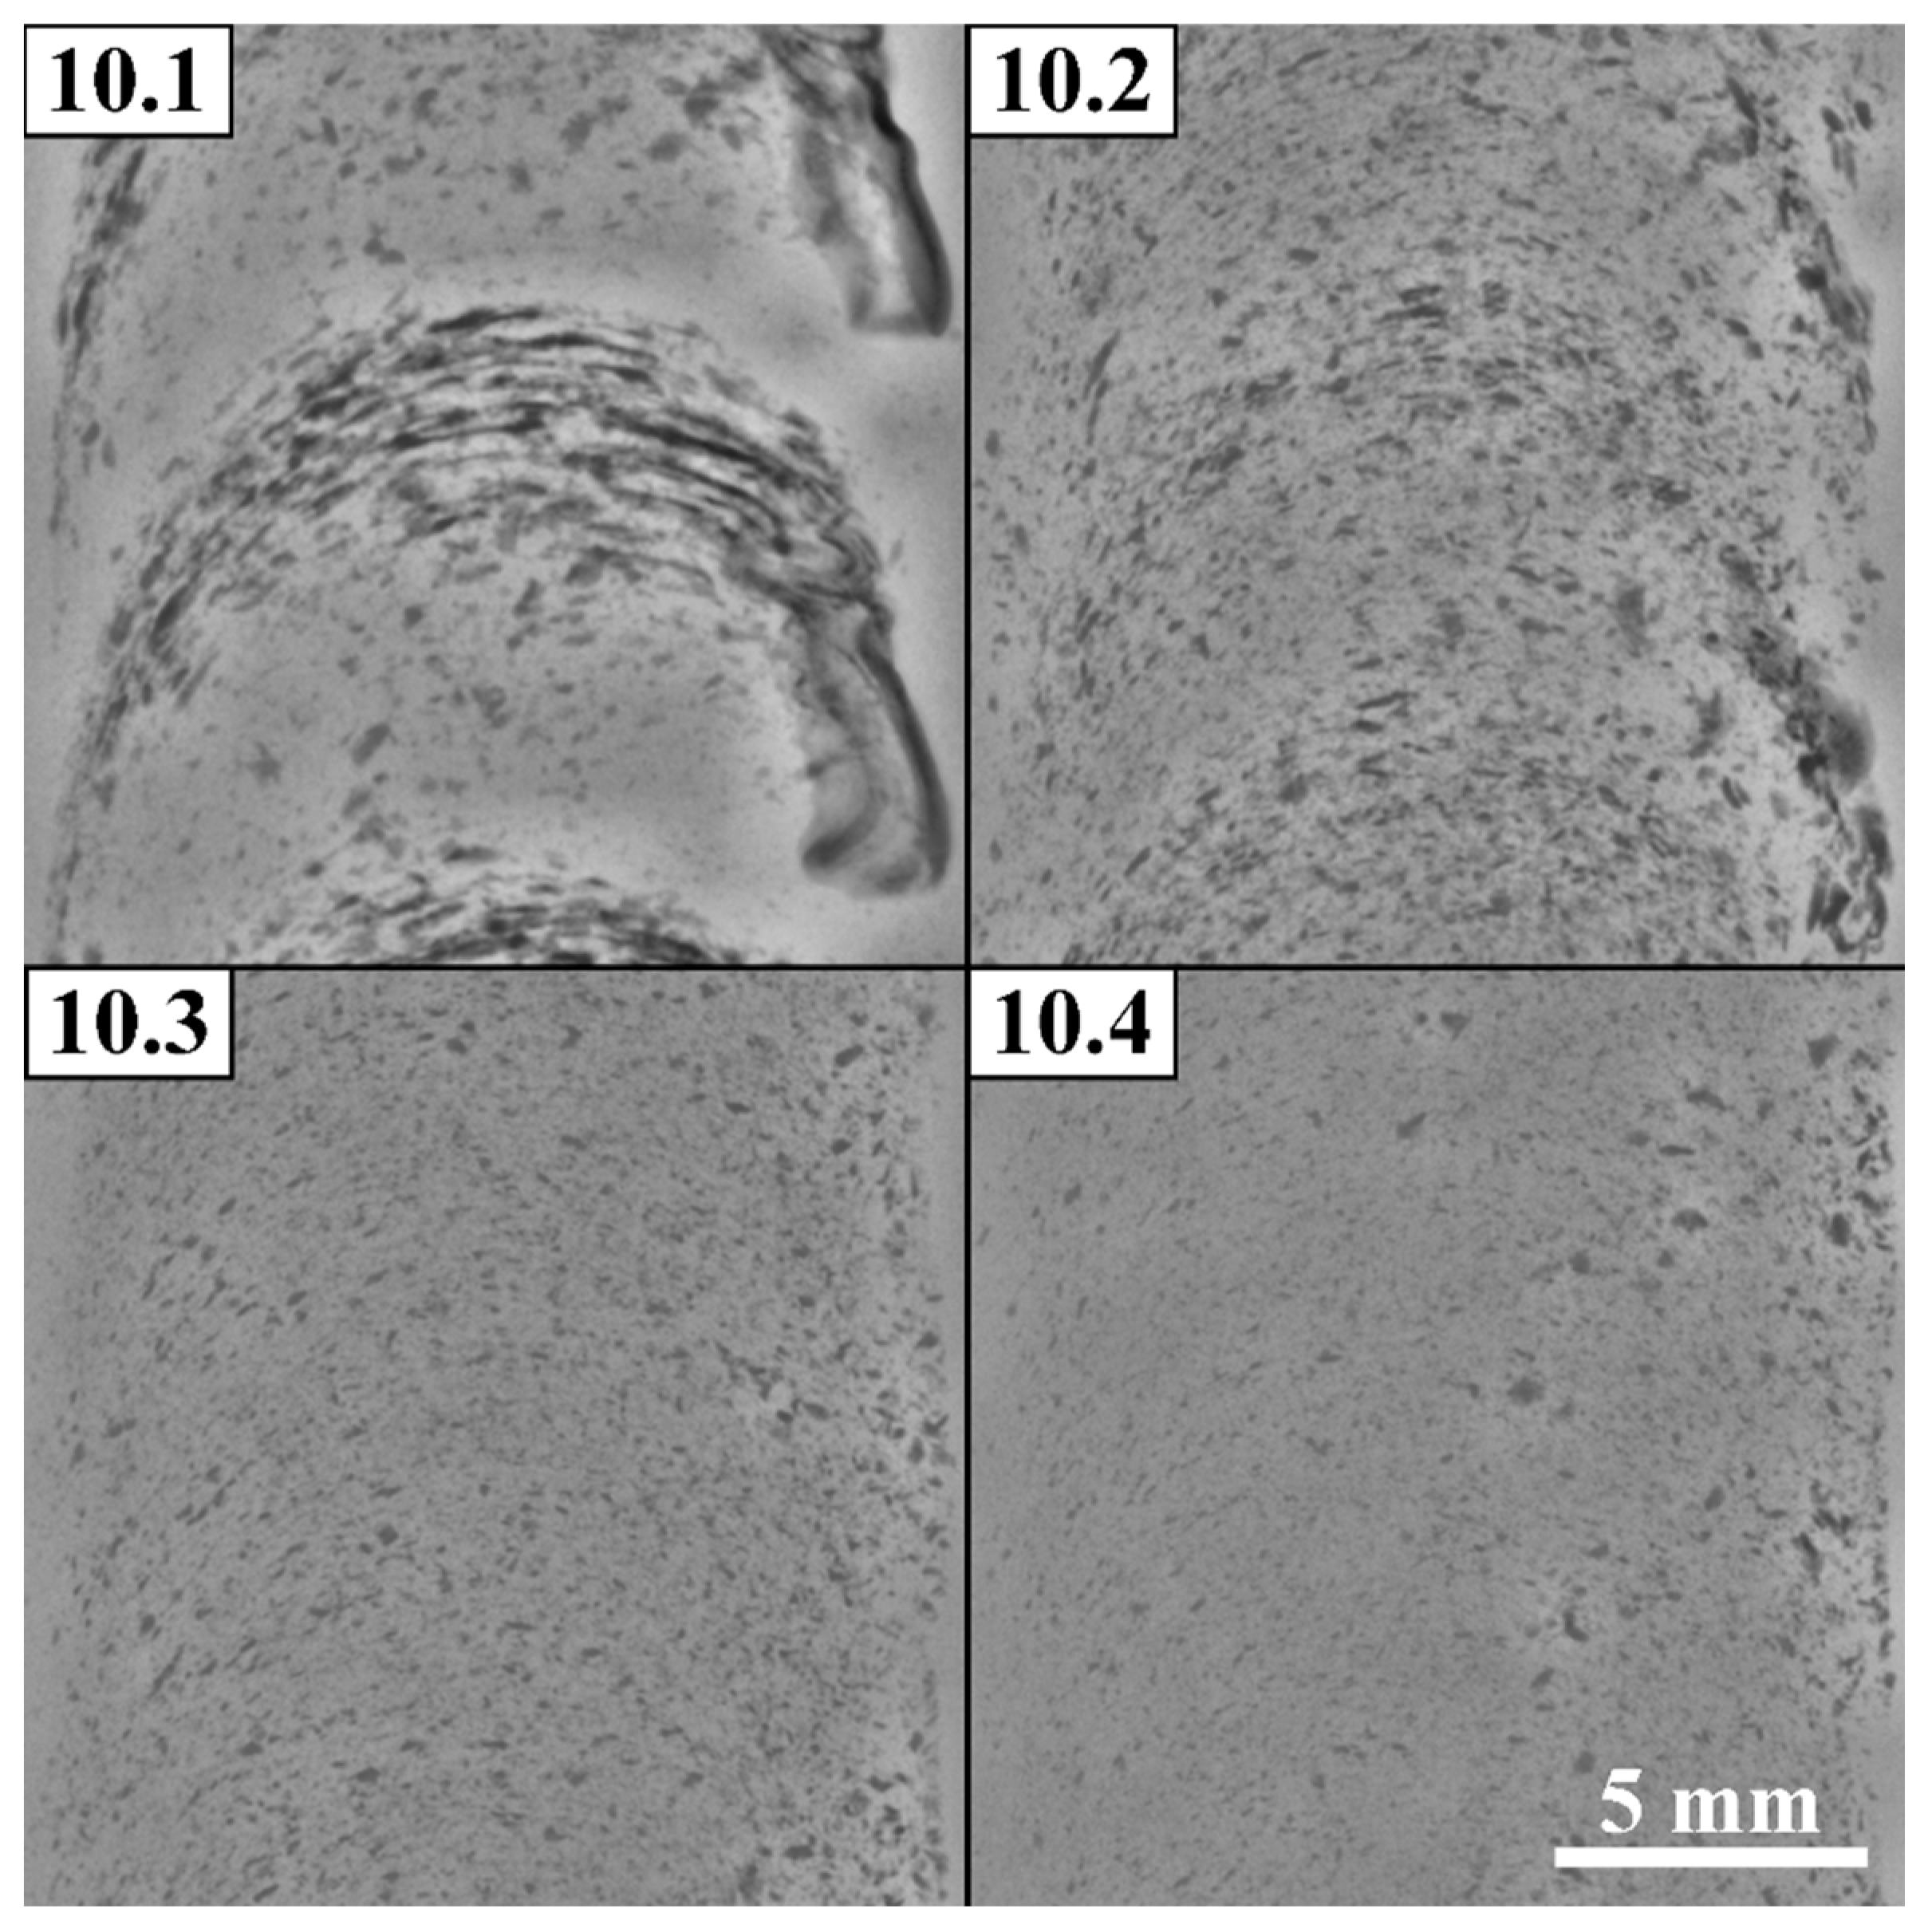
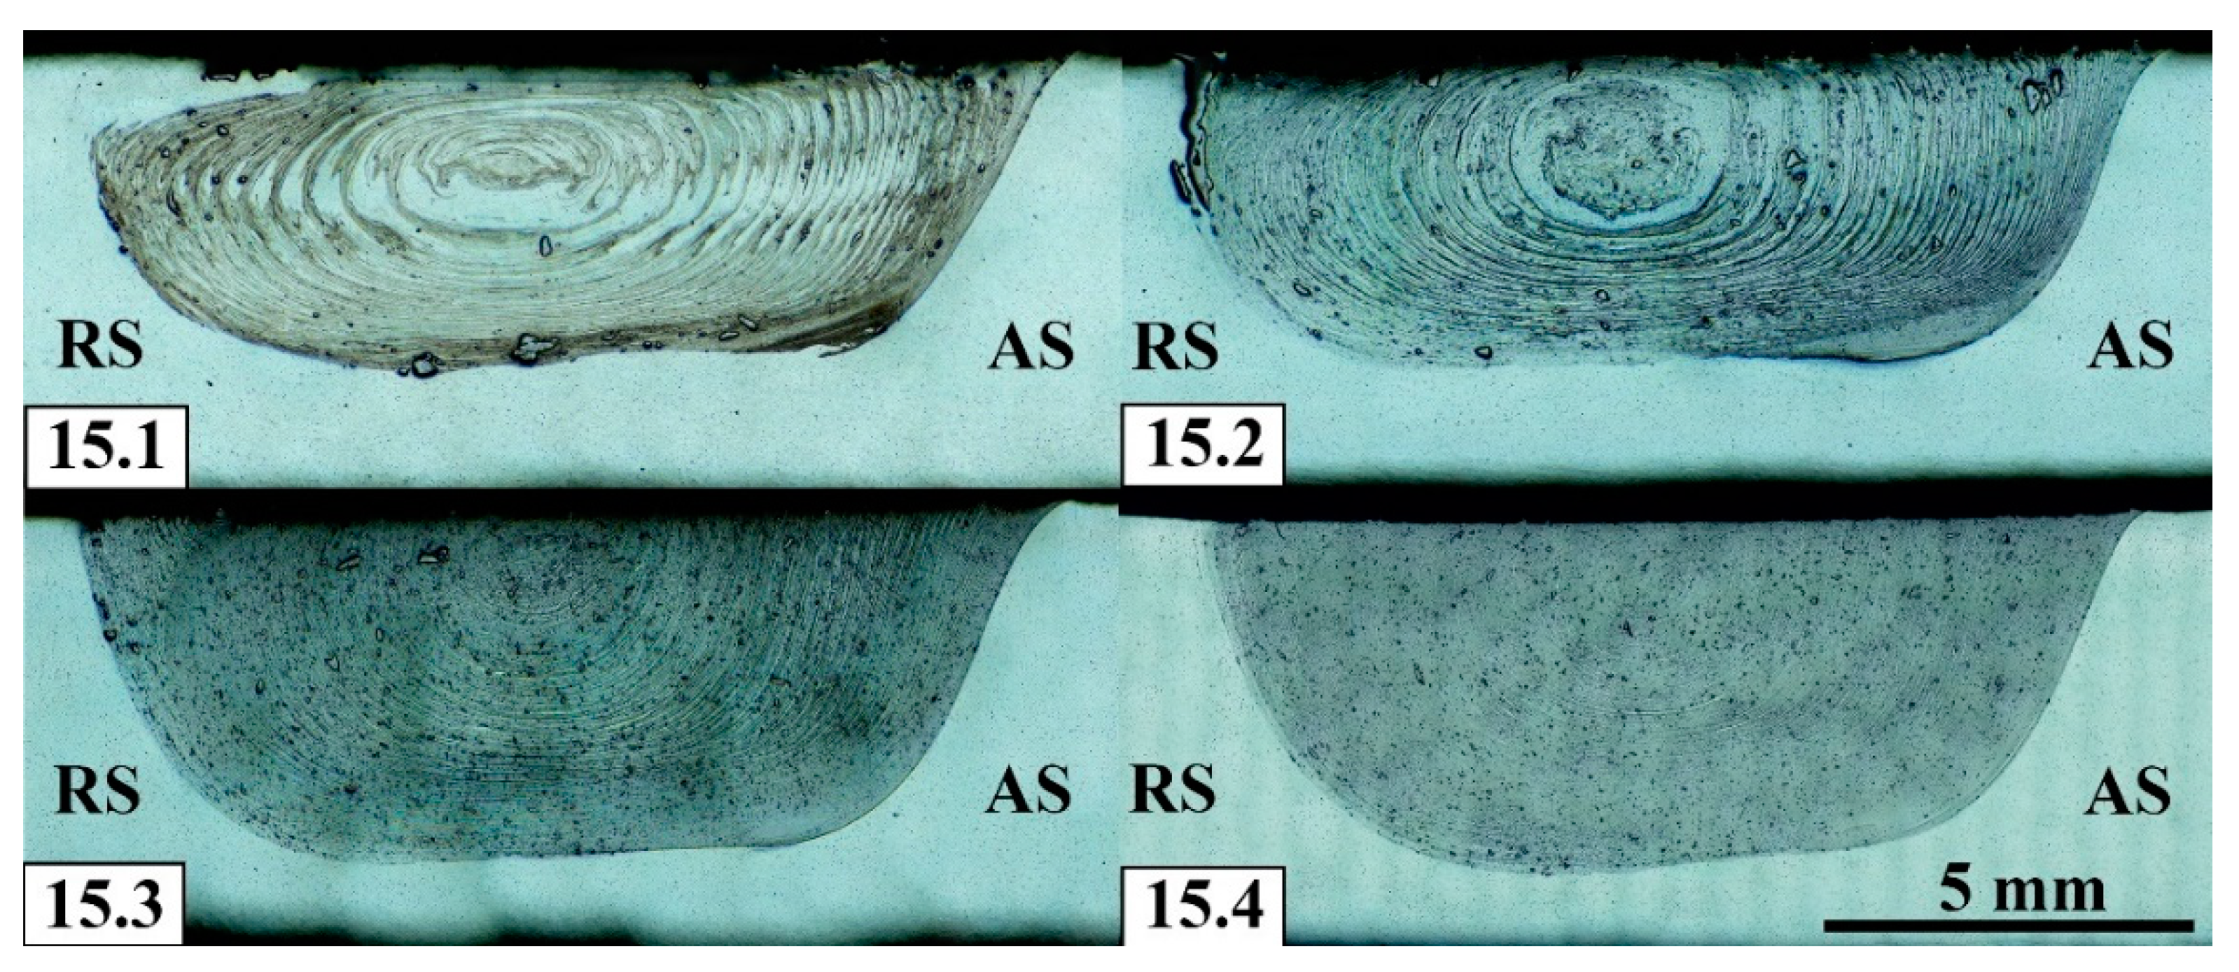
In this case, better homogeneity has been achieved already after a single-pass FSP (
Figure 12) despite iron powder localized along the “onion rings” (
Figure 13) at the distances approximately equal to those existing between two successively drilled holes. Some part of the powder has been driven to the retreating side of the SZ as well as large agglomerates can be noticed closer to the SZ bottom. The particles size in the 4-pass FSPed zone is in the range 75-100 μm as observed from the optical images.
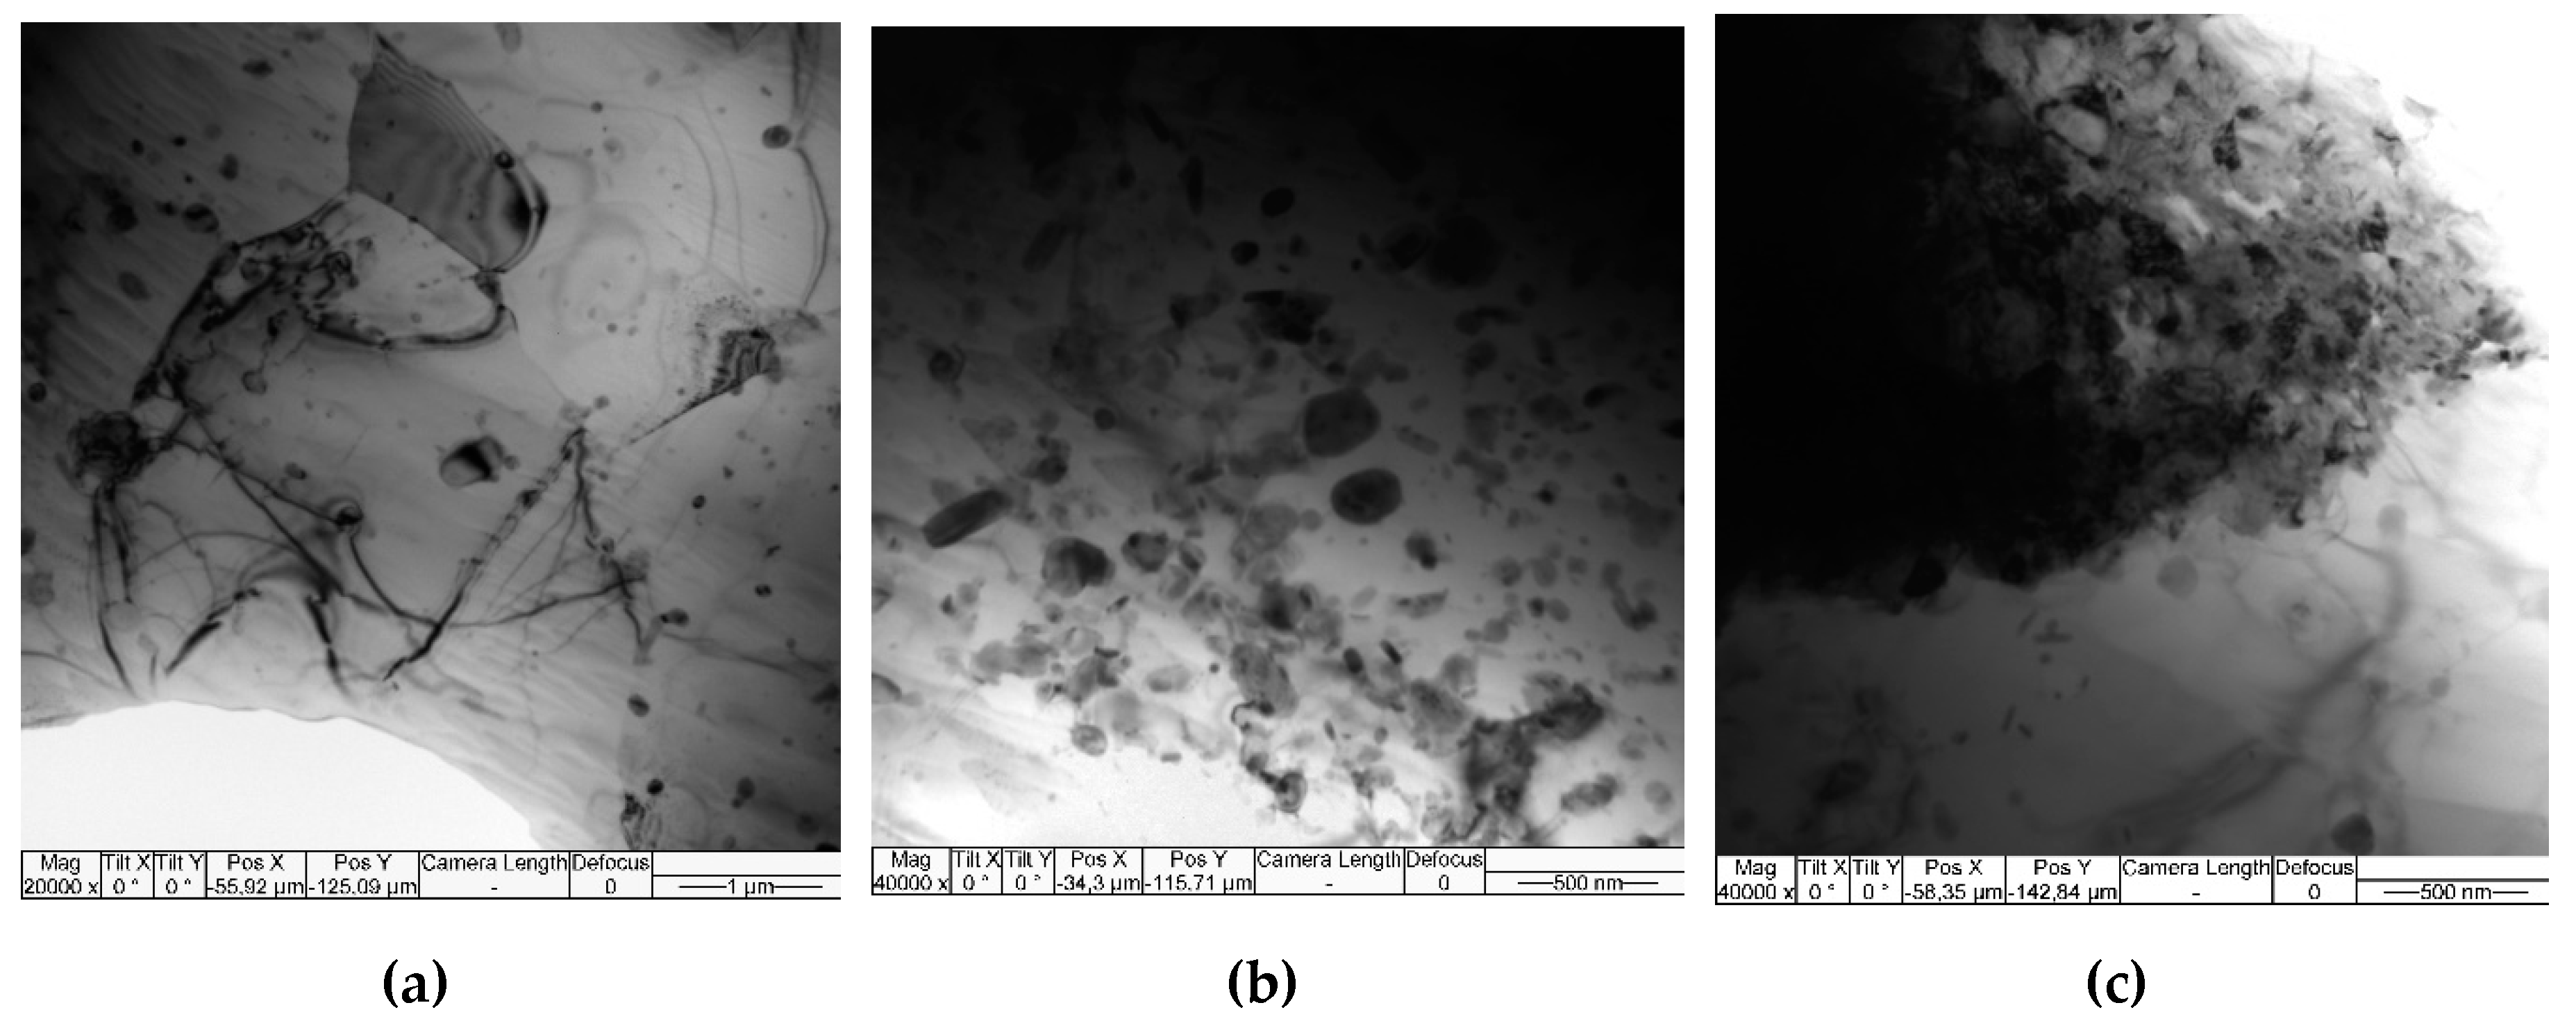
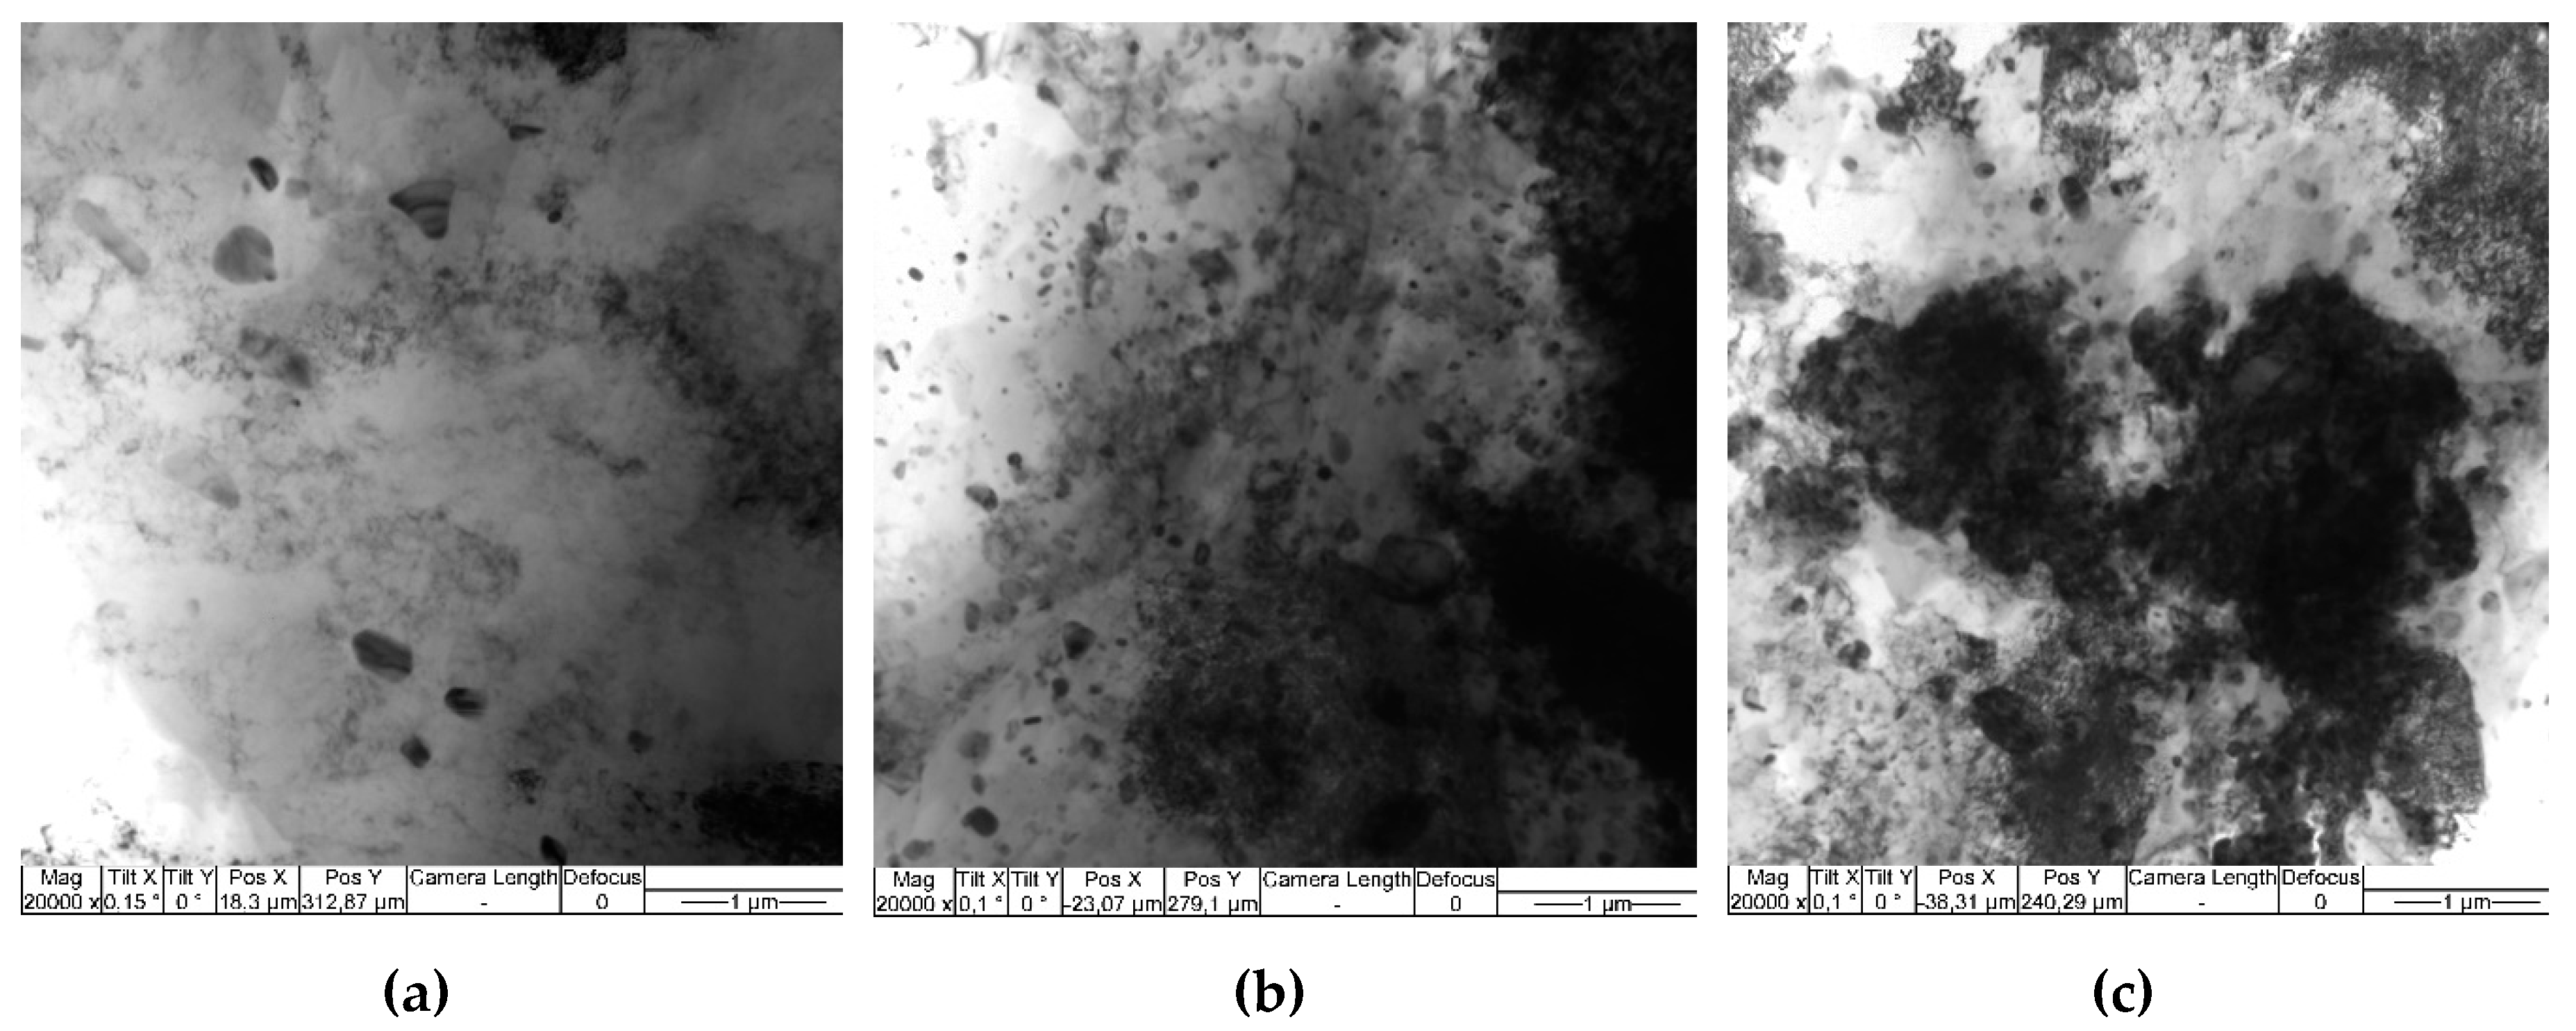
The microstructure of Al-Mg-10 vol.% Fe composite after single-pass FSP is represented by recrystallized α-Al grains of the mean size 1.99±0.42 μm as well inhomogeneous distribution of Fe-rich particles with the mean size of 257±89 μm (
Figure 14).
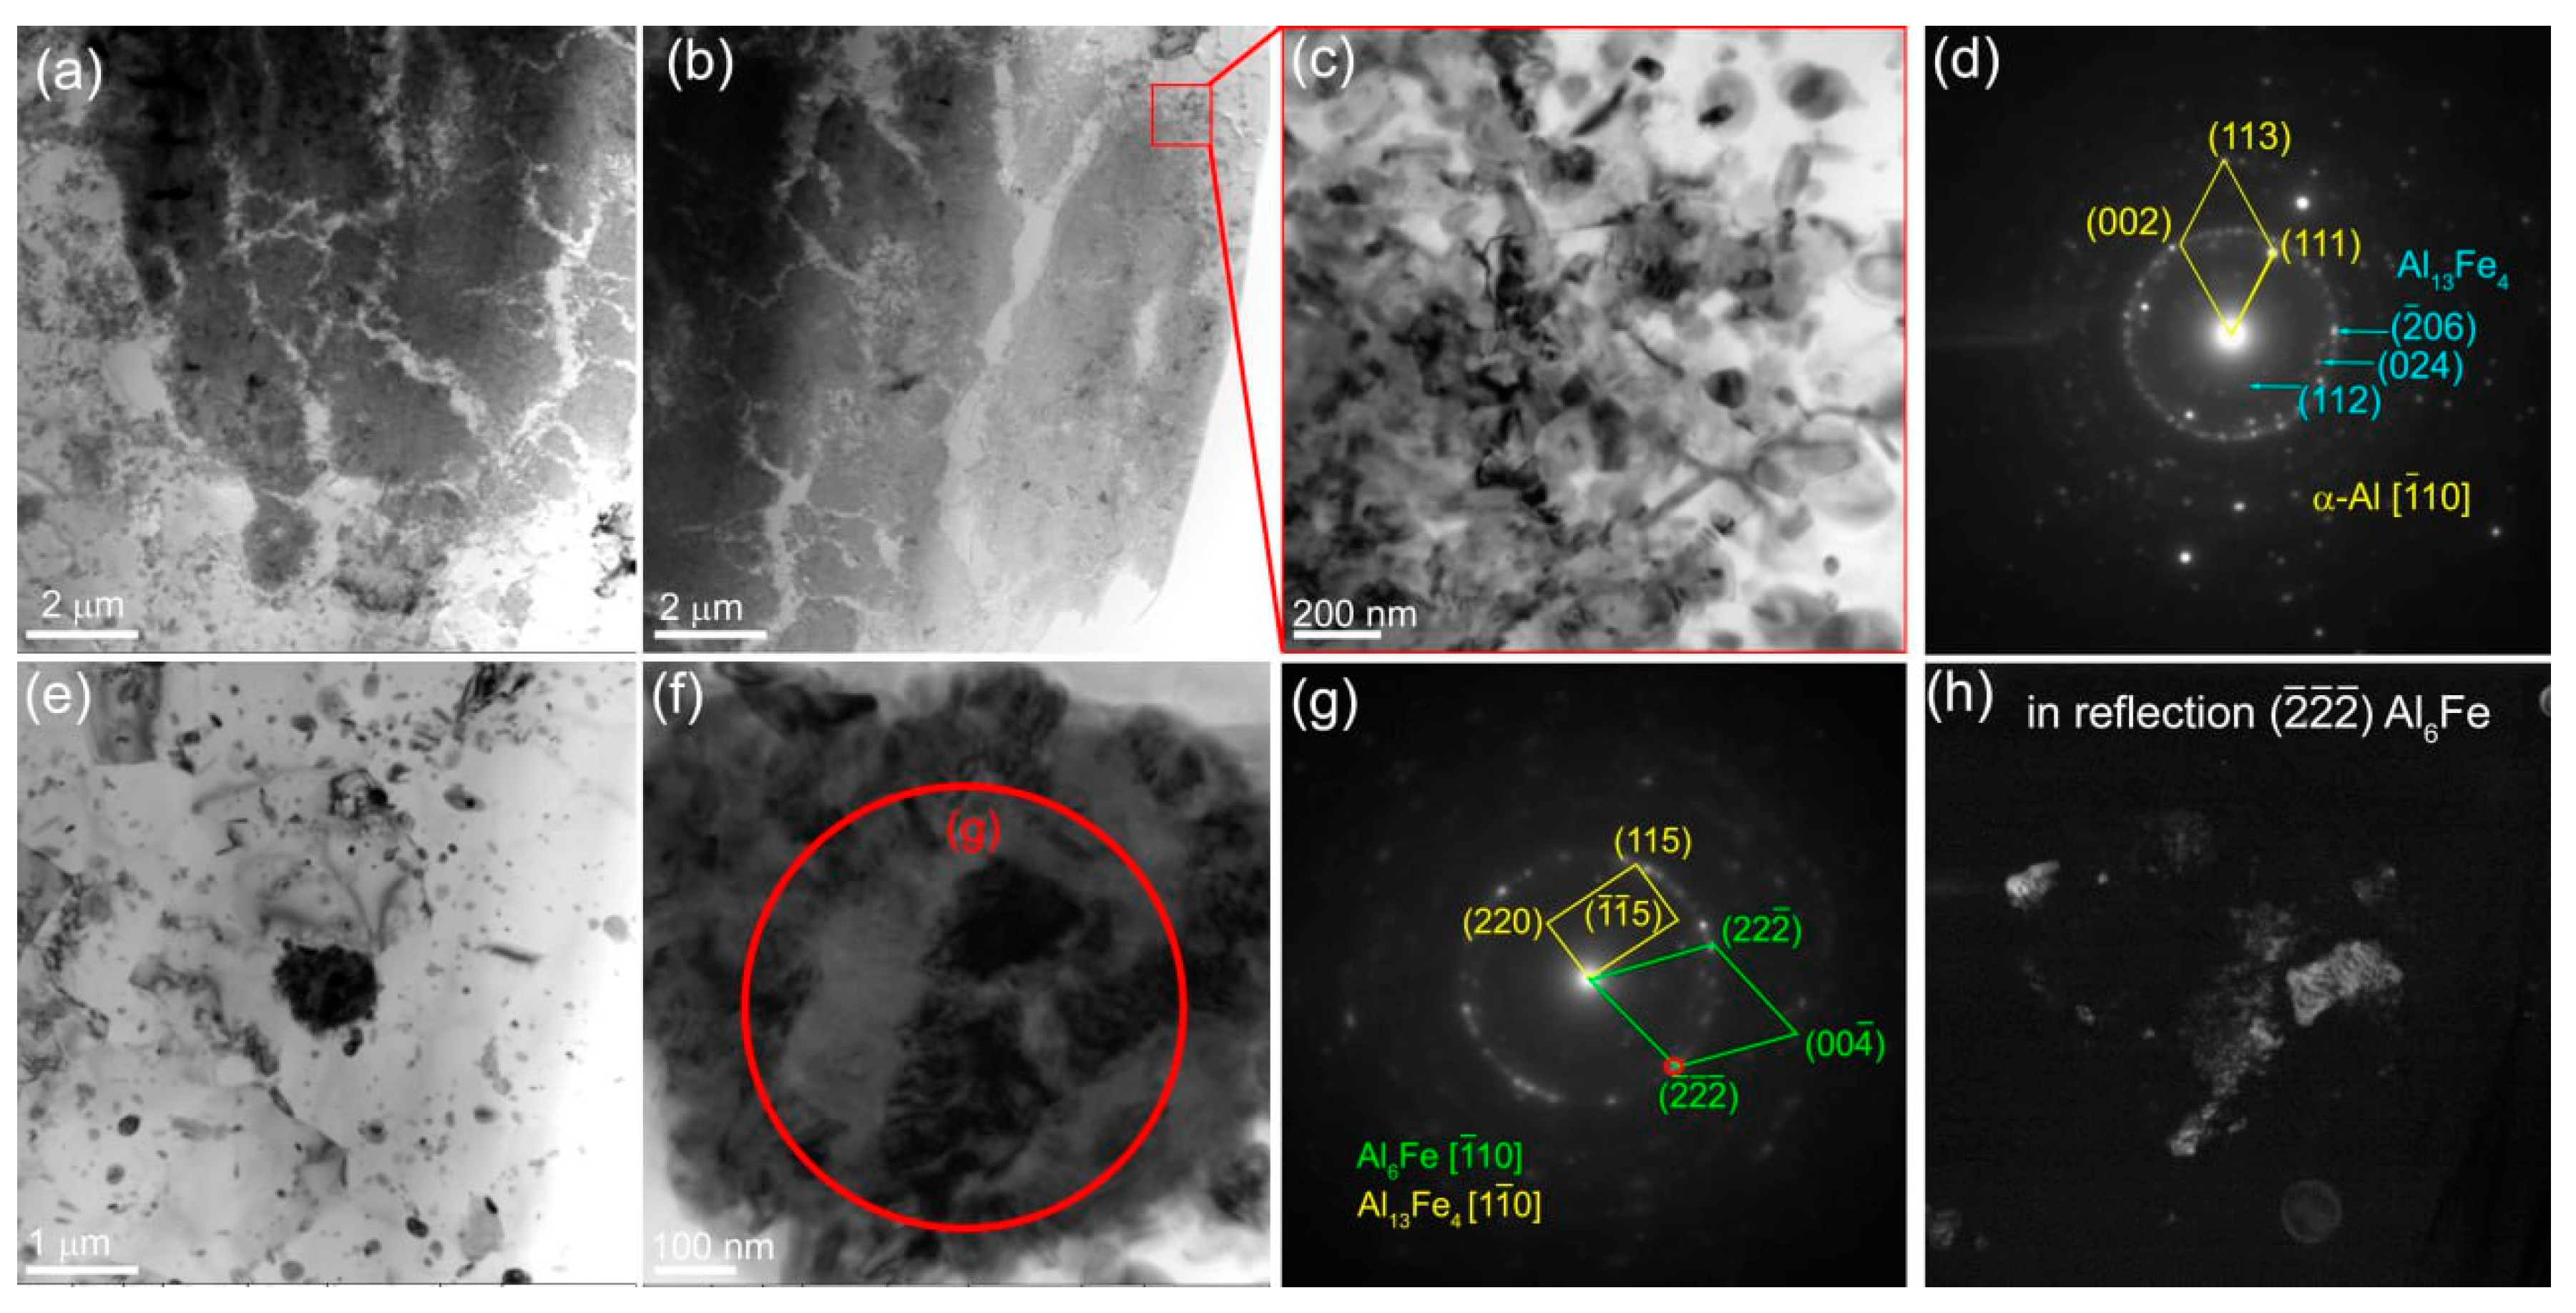
The 4-pass FSP resulted in refining the α-Al grains to 2.29±0.54 μm and increasing the amount of fine Fe-rich particles with the mean size of 351±27 nm (
Figure 15а–с). The SAED pattern identification in
Figure 15d clearly shows the Al
13Fe
4 reflections. In addition, there are microdiffraction rings with the most bright one corresponding to (
06)
Al13Fe4 reflections (
Figure 15d).
Coarse IMCs could be observed directly inside the α-Al grains (
Figure 15e) whose SAED patterns testify on their variable phase composition (
Figure 15f–h). Nevetheless, the presence such phases as Al
6Fe, Al
13Fe
4 have been identified (
Figure 15g).
3.3. Macro-and Microstructures in SZ of Al-Mg Admixed with 15 vol.% Fe
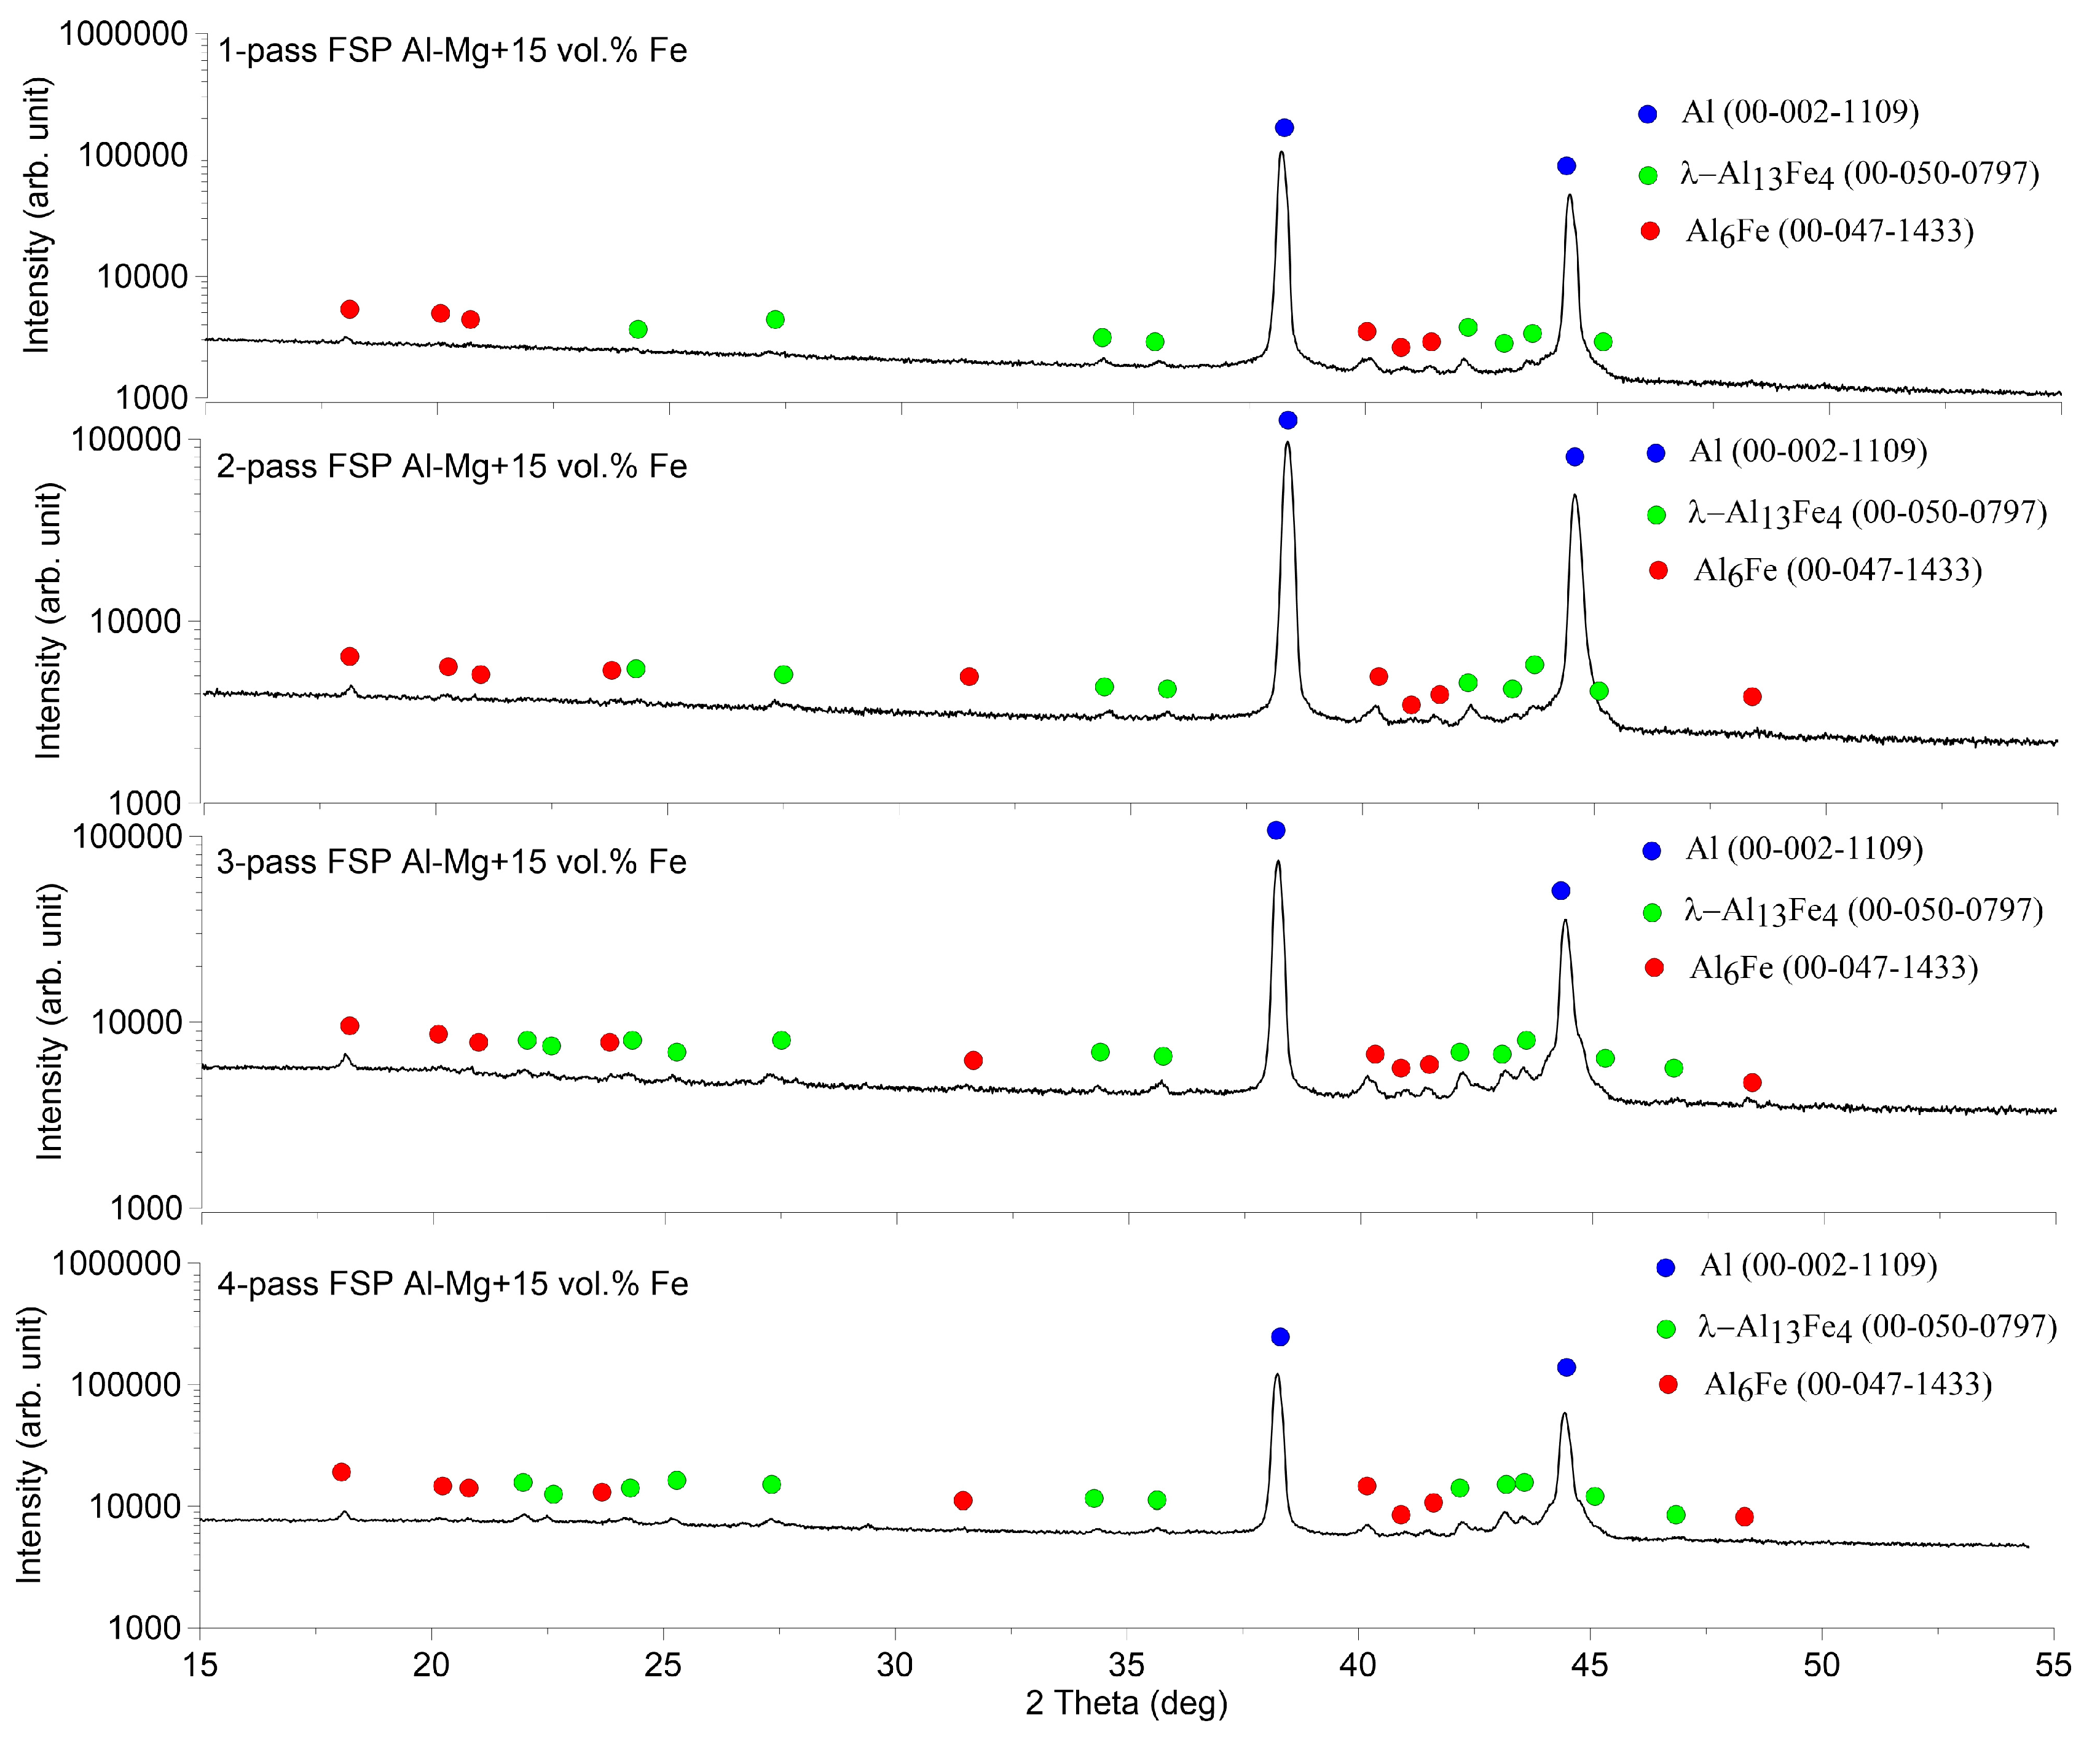
The XRD patterns of the stir zone metal intermixed with 15 vol. Fe are represented in
Figure 16 that allows observing that the main phases found are the same as those detected in Al-Mg-5 vol.% Fe and Al-Mg-15 vol. %Fe. Such a fact may be the evidence in favor of suggestion that all basic intermetallic compounds were formed during the first FSP pass.
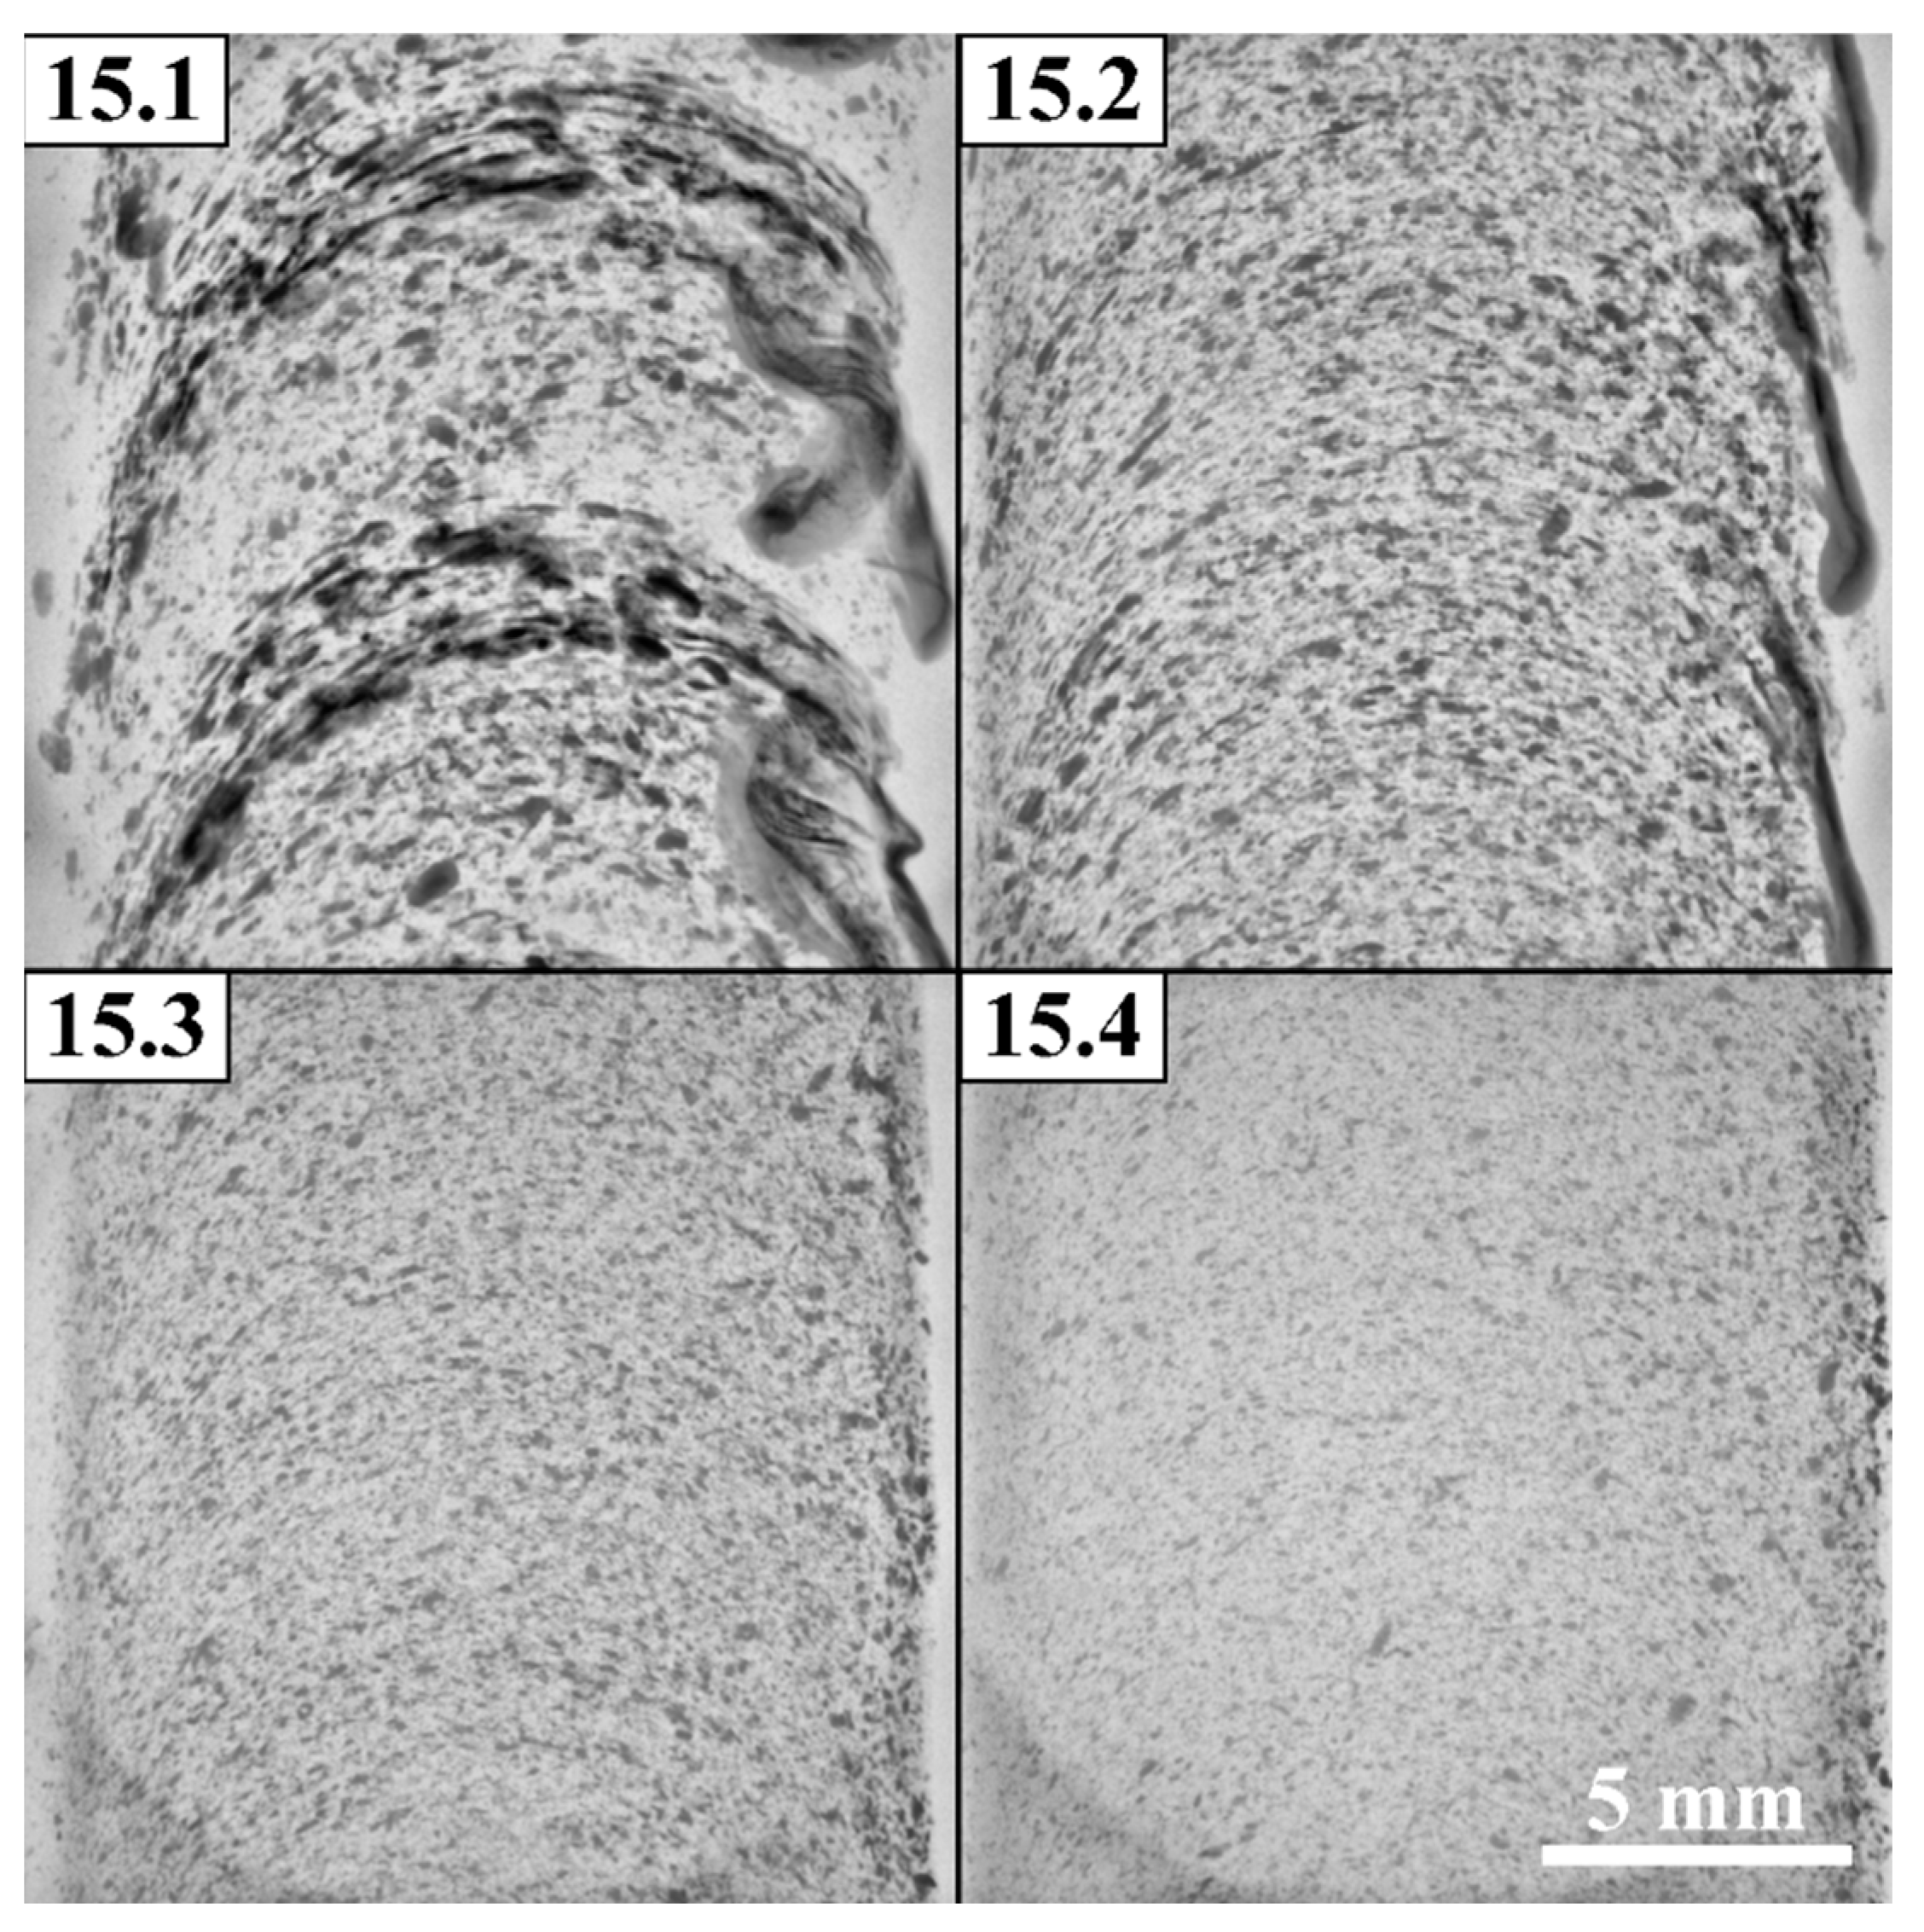
Acceptable homogeneity of powder distribution in the SZ has been achieved already after 2-pass FSP (
Figure 17) with some higher concentrations on the boundary between the SZ and thermo-mechanically affected zone (TMAZ) on the retreating side. Third and fourth FSP passes provide even better homogeneity with the only difference that the Fe-particle size reduced from 33 to 25 μm, respectively.
The CT images in
Figure 18 show that the first pass FSP distributed the powder along the rings with some enriching of the RS region while further passes provided homoigeneous structure of the SZ.
The mean size of α-Al grains is 1.94±0.58 μm inside of which there are 159±80 nm in size Fe-particles (
Figure 19).
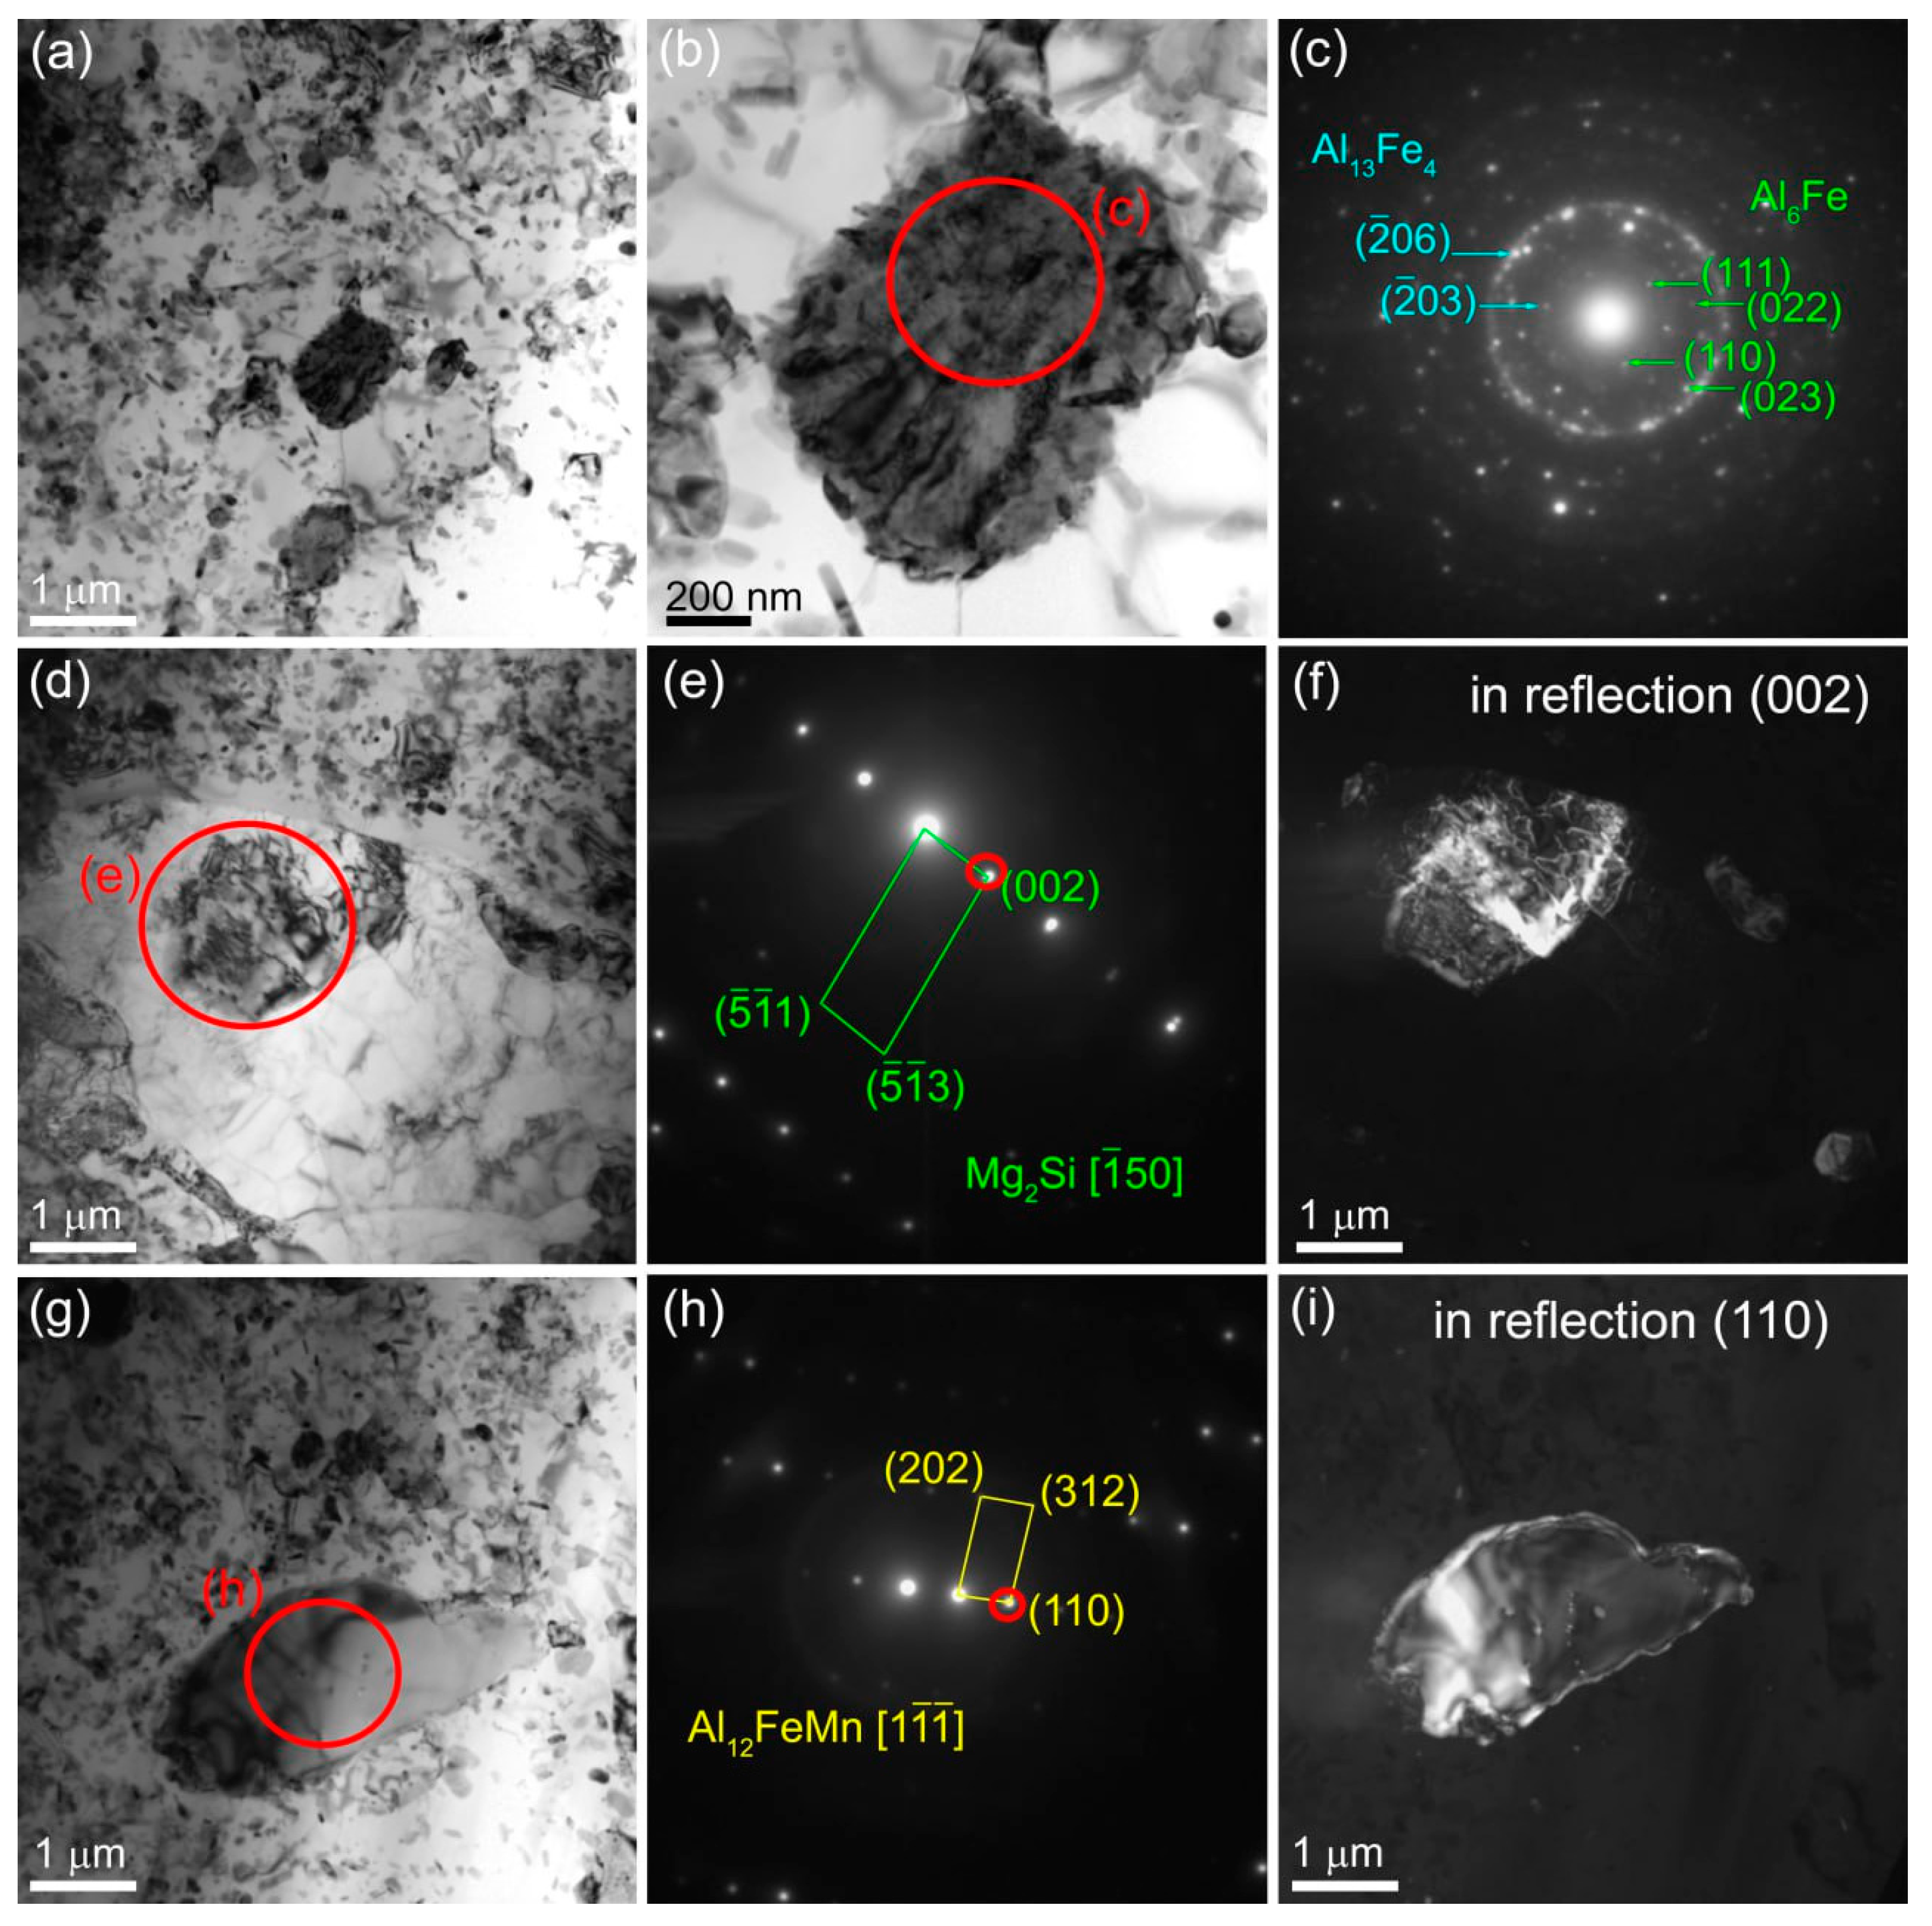
The 4-pass FSP allowed reducing the α-Al grain size to 1.55±0.3 μm while that of the Fe-rich particles increased to 239±71 nm (
Figure 20а). Coarse Al
xFe
y IMCs were found whose crystalline lattice could not be identified accurately (
Figure 20b,c). The SAED pattern are crowded with reflections that from diffraction rings with the most bright of them corresponding to (222)
Al6Fe (
Figure 20b,c). The presence of other Al
xFe
y IMCs is also plausible.
Judging by the SAED pattern identification there are coarse Mg
2Si and Al
12FeMn particles inside the α-Al grains (
Figure 20d–i).
3.4. Microhardness
Microhardness profiles were obtained only for samples FSPed using either 1 or 4 passes. The 1-pass FSPed samples with 5 and 10 vol.% Fe showed almost no difference in microhardness (
Figure 21b,c) except for the high peak in Figure16b on the RS related with indenting a coarse agglomerate. In general, these samples demonstrated slight increase in the microhardness as compared to that of as-received alloy, i.e., from 0.77 HV GPa to 0.82 HV GPa.
On average the microhardness of samples is determined by the content of iron powder admixed with the aluminum alloy. The 4-pass FSP provided almost equal microhardness for samples with 5 and 10 vol.% of Fe at the level of 1.07 HV GPa (
Figure 19b,c) and somewhat higher microhardness 1.5 HV GPa for the Al-Mg + 15 vol.% sample (
Figure 21d).
3.5. Tensile Properties
Tensile strength characteristics of the FSPed alloys varied with both the percentage of iron added and number of FSP passes. The presence of defects in the form of powder agglomeration areas also contributed to inconsistency of the results obtained. For instance, large powder concentration regions in 2-ass FSPed sample 5.2 resulted in its premature failure at UTS 256 MPa during the tensile test (
Figure 22a). It seems that the same failure occurred to the 1-pass FSPed samples 10.1 and 15.1. The UTS of as-received Al-Mg alloy was 355 MPa with strain-to-fracture (STF) 30% (
Figure 22d). It is worthwhile to note that the 1-pass FSPed sample 5.1 demonstrated STF almost as high as that of the as-received alloy because tensile specimen was cut of the SZ central part while most of the powder was driven to the RS.
Nevertheless, the defect-free samples showed acceptable tensile characteristics, for example, the UTS of 5.3 and 5.4 samples (
Figure 22a) were 414 and 425 MPa, respectively. Such a strengthening has not, however, lead to the loss of ductility, i.e., their STF values were 14.5 and 13, respectively. Samples 10.3 and 10.4 (
Figure 22b) have their UTS values 391 and 423 MPa as well as STF 11.5 and 12%, respectively, i.e., their strength characteristics are close to each other.
Al-Mg-15 vol.% 15.3 and 15.4 samples achieved UTS 435 and 466 MPa with STF 6 and 5.5%, respectively.
Increasing the amount of Fe powder added to the aluminum alloys resulted in embrittlement of all samples with simultaneous improving the tensile strength. For samples containing 5 and 10 vol.% Fe the best results in terms of both tensile strength and ductility have been achieved after 3-pass and 4-pass FSP. This may be true also for UTS of samples added with 15 vol.% Fe while the STF value of 15.4 samples was somewhat lower that of sample 15.3.
3.6. Fractography
Fractographic SEM BSE images have been obtained from the fracture surfaces of the tested tensile samples (
Figure 23a–c). Coarse and fine bright particles are observed on the fracture surfaces that represent IMCs with intercrystallite type of fracture (
Figure 23b,c) in contrast to viscous type of fracture demonstrated by the as-received alloy (
Figure 23a). The coarse IMC particles in sample 15.4 have been pulled out thus leaving large pits.
3.7. Sliding Wear Tests Al-Mg/Fe after 4-Pass FSP
The time dependencies of COF have been obtained on samples obtained using FSP passes 1 to 4 for each of Fe concentrations (
Figure 24a,c,e). Al-Mg-10 vol.% Fe (c) and Al-Mg-15 vol.% Fe samples demonstrated rather steady COF with oscillations within the range 0.3-0.4 irrespective of the FSP pass number (
Figure 24c,e). Sample 15.4 showed some tendency for reducing the COF in the end of the testing. On the contrary, the Al-Mg-5 vol.% Fe 5.4 sample showed higher COF as compared to those of samples 5.1-5.3 (
Figure 24a). In general, the time dependencies of COF demonstrated their rather steady behavior. Mean COF values represented in
Figure 24b,d,f allow observing that all FSPed alloys demonstrate their COFs somewhat higher than that of as-received aluminum alloy. Such a finding may be provided by the fact that FSPed aluminum alloy is characterized by fine-grained microstructure with much higher number of grain boundaries that contribute to higher adhesion interaction in sliding while sliding tests have been conducted on the as-received coarse-grained ones.
There is a consistency between wear characteristics measured by mass losses (
Δm) and height reduction (
Δl) on Al-Mg-5 vol.%Fe samples (5.1-5.4) so that both characteristics only slightly change with the FSP pass number (
Figure 24b). For Al-Mg-10 vol.%Fe samples (10.1-10.4) the behavior of these wear characteristics is more complex, i.e., samples 10.2 and 10.3 showed their Δm wear values not only higher than those of 10.1 and 10.4 (
Figure 24d) but also higher than that of the as-received alloy. At the same time, the
Δl wear characteristics of all Al-Mg-10 vol.%Fe samples were below corresponding characteristic of the as-received sample. There is no such a discrepancy between
Δl and
Δm characteristics for the Al-Mg-15 vol.% Fe samples, both of them show the same tendency with the FSP pass number while absolute wear values stay below that of the as-received sample (
Figure 24f). Let us note here that the
Δl wear characteristic is more reliable since it characterizes purely the volume losses while measuring the
Δm requires tedious cleaning and careful handling of the samples.
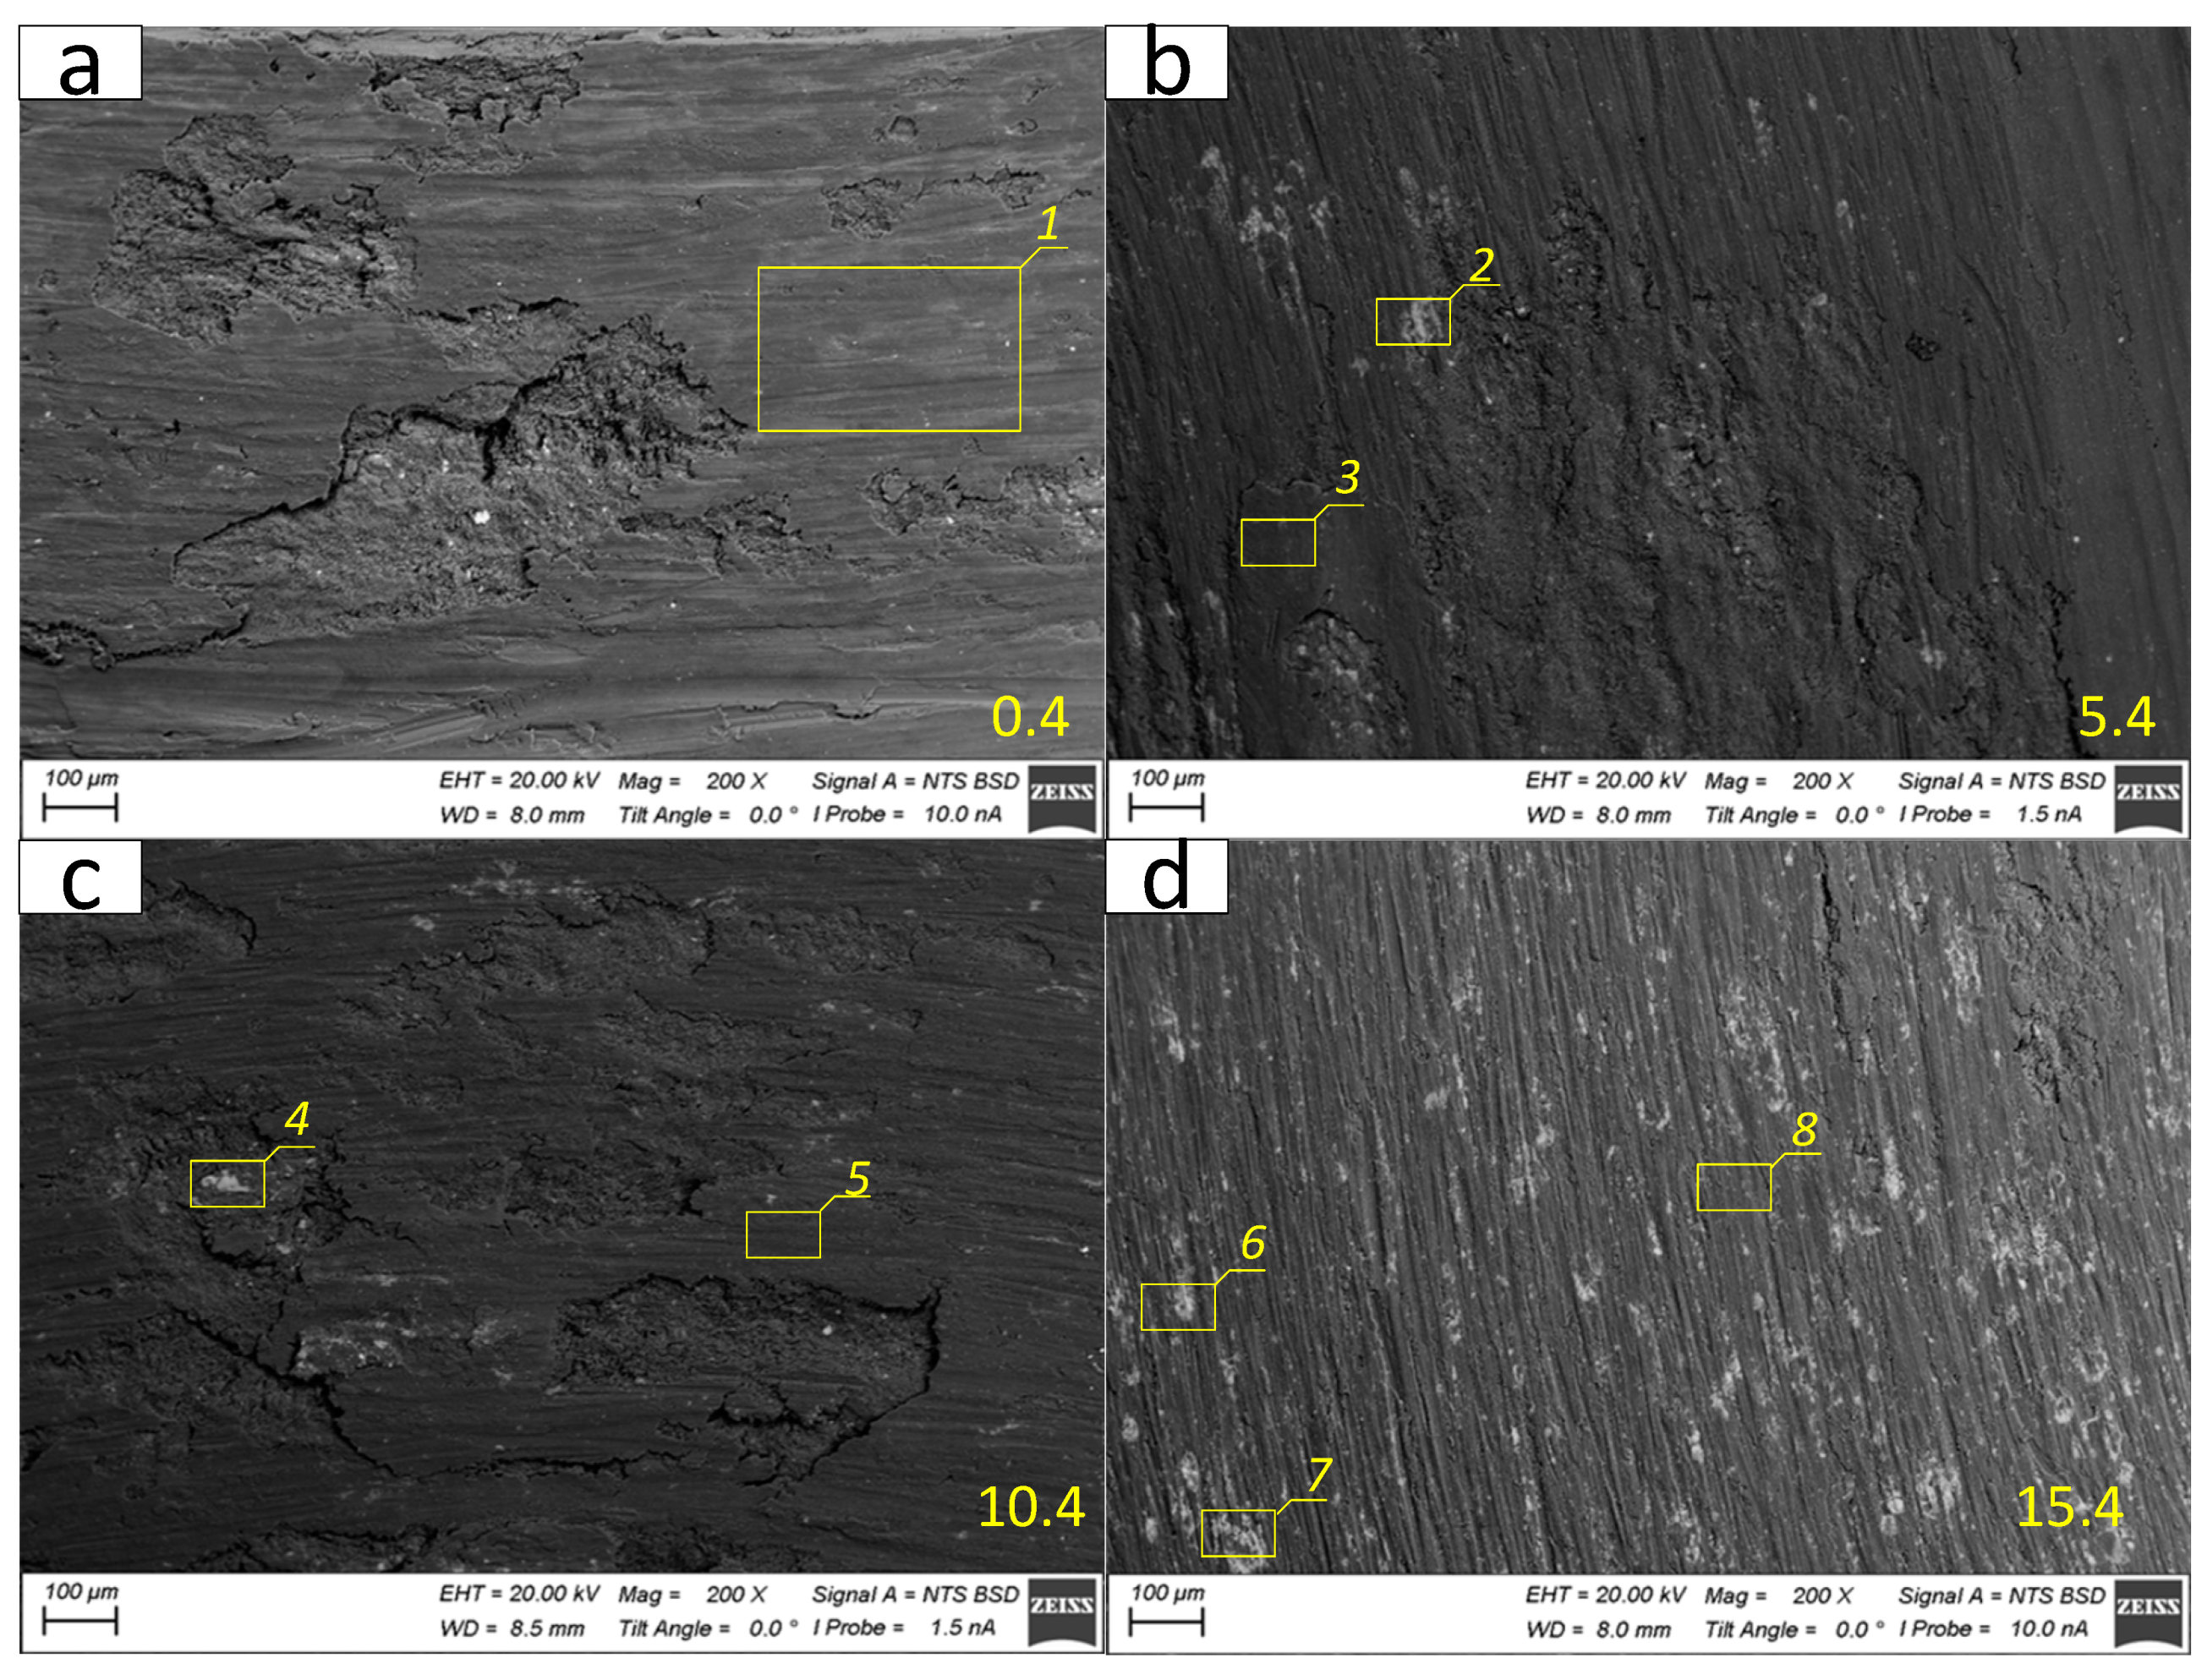
The worn surface of the as-received alloy sample 0.4 as well as those of the 4-pass FSPed Al-Mg-5 vol.%Fe and Al-Mg-10 vol.%Fe samples (5.4 and 10.4) are represented by both smooth and large layer delamination areas (
Figure 25a,b,c). Bright SEM BSE contrast particulates on the worn surfaces can either be Al-Fe IMCs or Fe-particles. The worn surface of Al-Mg-15 vol.%Fe sample 15.4 allows observing narrow wear grooves that may be formed by plowing the surface by hard particles pulled out of the sample (
Figure 25d).
The SEM BSE image of as-received Al-Mg alloy worn surface is of one and the same grey color because this surface is covered by a MML layer composed of oxidized alloy components (
Figure 21a,
Table 5, Area 1) with small concentration of iron. The main component there must be aluminum oxide.
The worn surfaces of FSP-ed Al-Mg- Fe composites differ from that of as-received alloy by the presence of dark and bright areas (
Figure 25b–d), which can be identified as iron-rich ones that also contain oxygen. Bright areas (
Figure 25b–d,
Table 5, Areas 2,4,6,7) contain more iron as compared to dark ones (
Figure 26b,d,
Table 5, Areas 3,5,8).
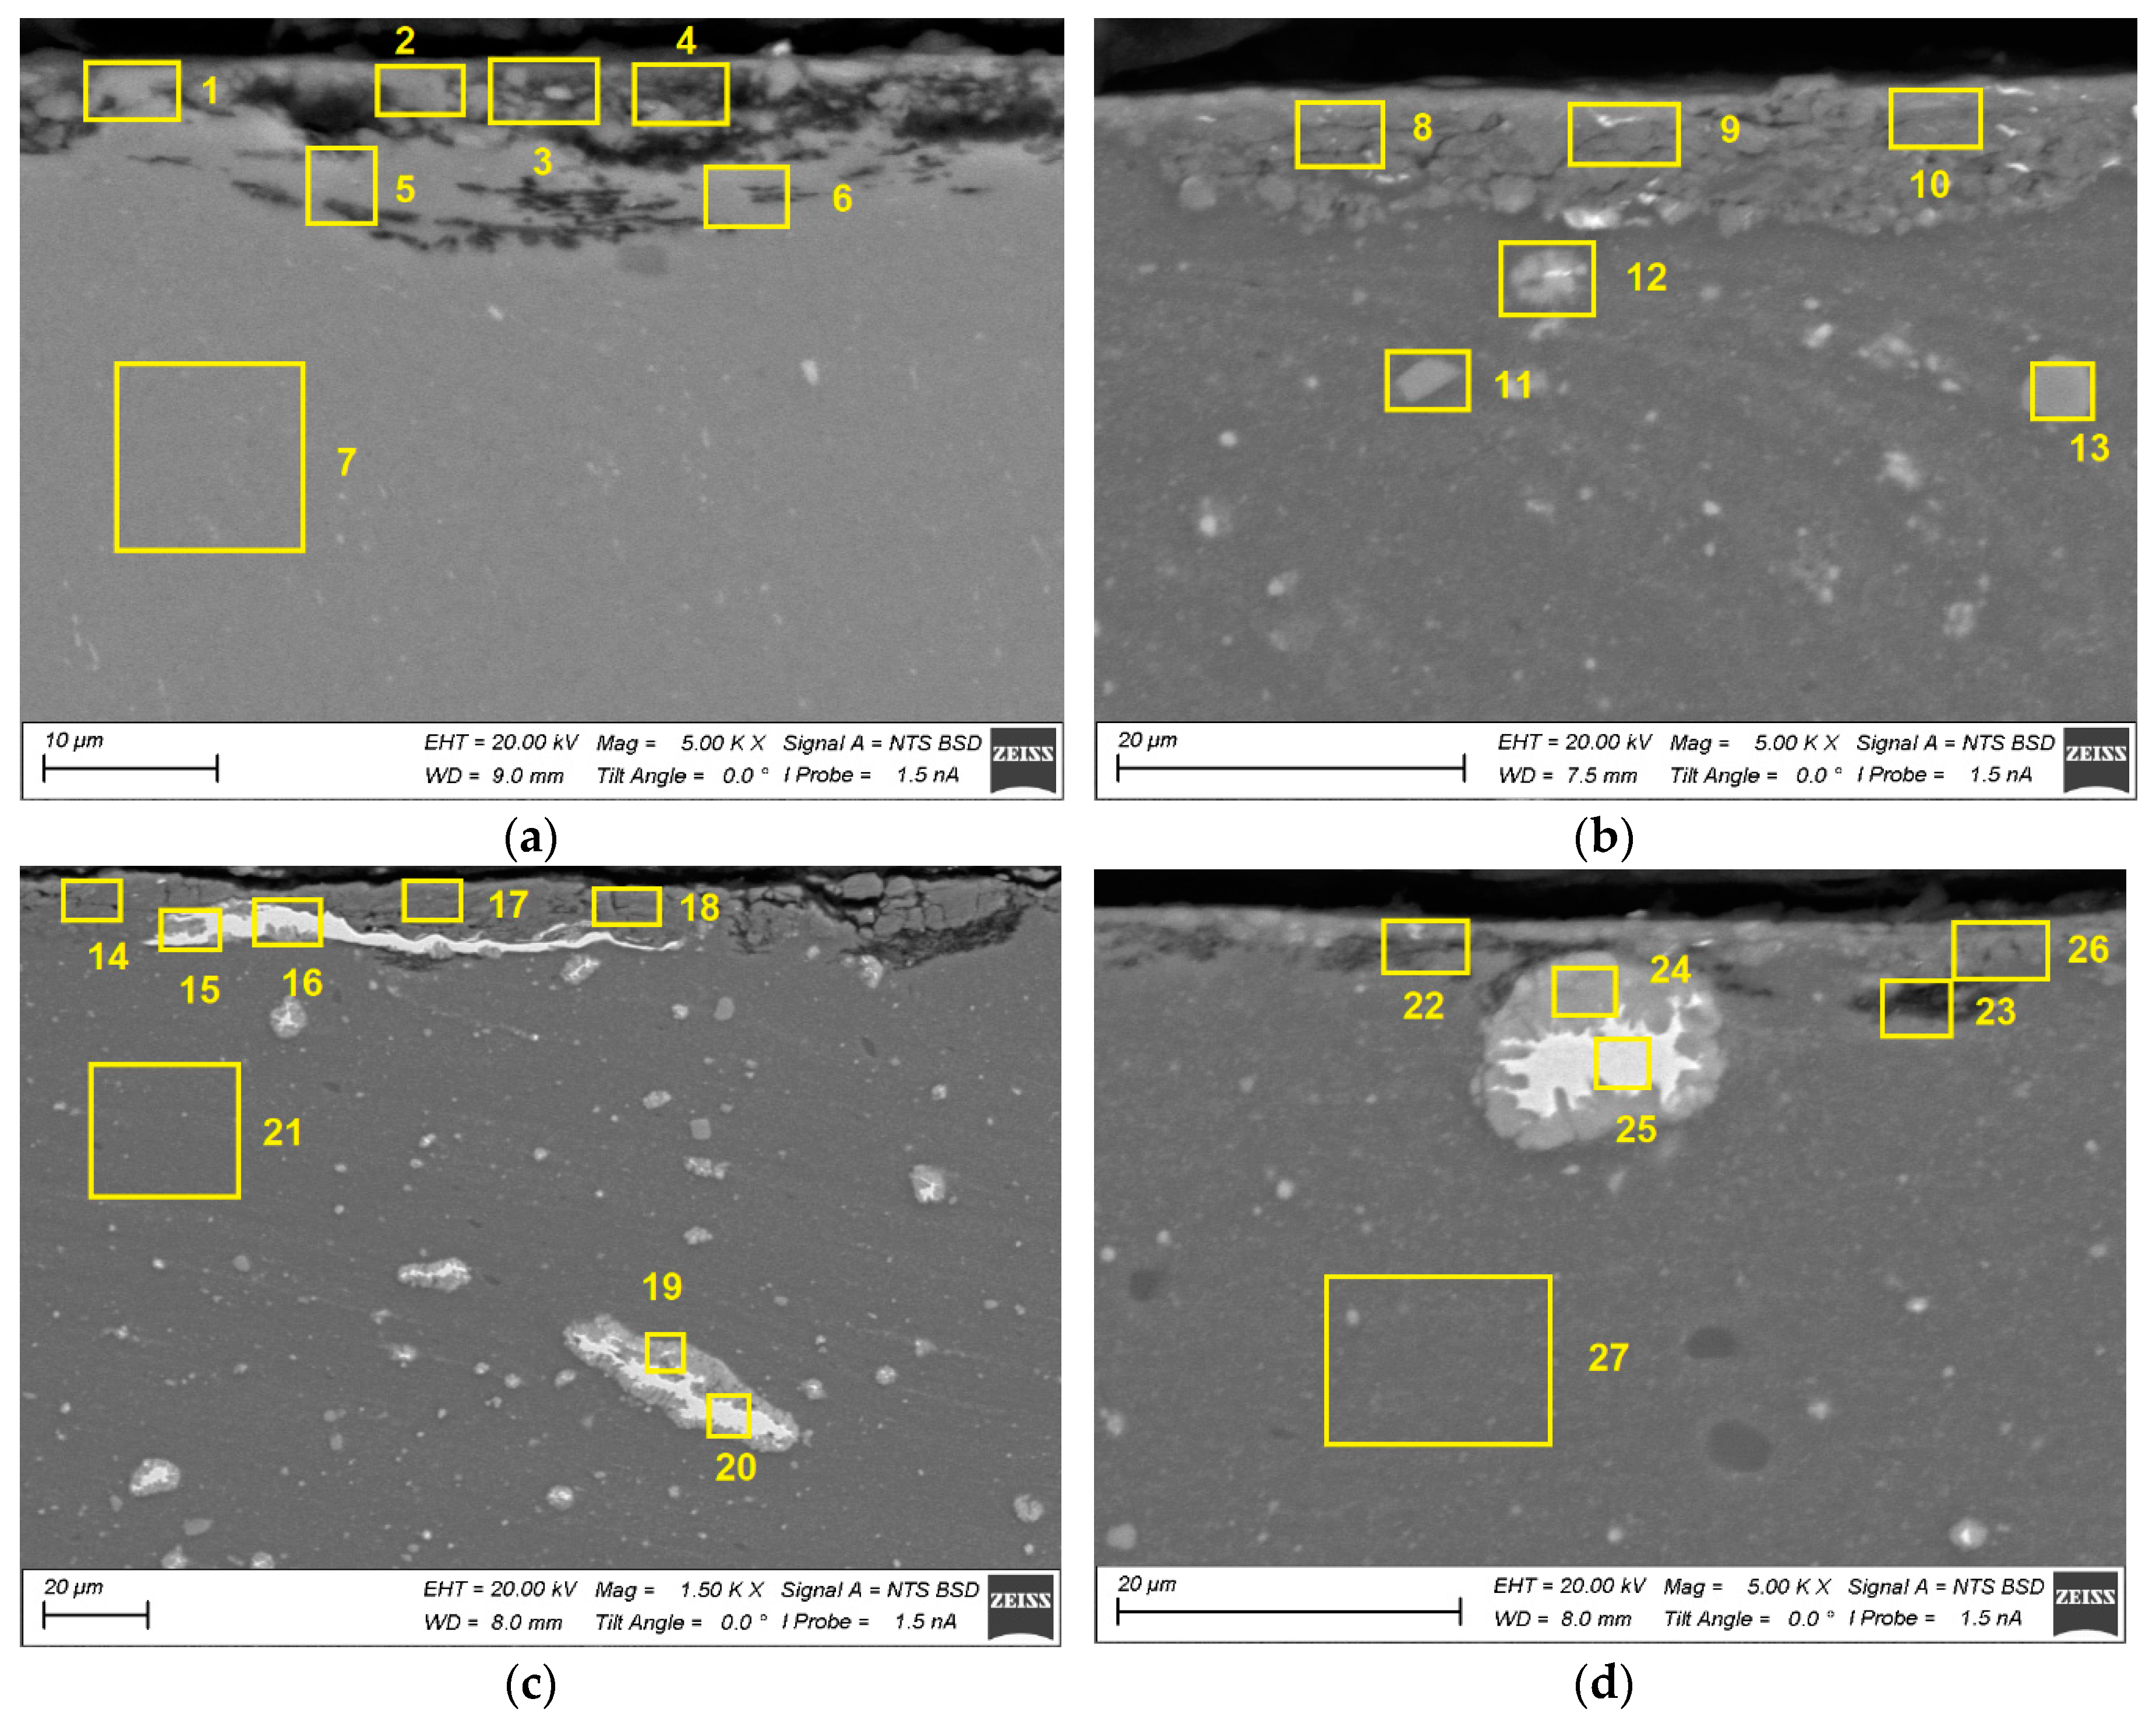
Unlubricated sliding is usually accompanied by severe subsurface deformation and fracture as well as adhesion transfer of the wear particles along the worn surface with generation of a tribological or mechanically mixed layer. Therefore, investigation into subsurface evolution of the base material is very important part of the tribological research. The subsurface SEM images obtained from tested as-received sample allow observing discontinuities and dark BSE contrast areas that might appear due to oxidation (
Figure 26a,b). The subsurface layer containing bright Fe-rich particles and intermetallic particles was generated in the Al-Mg-5 vol.% Fe sample 5.4 (
Figure 26b).
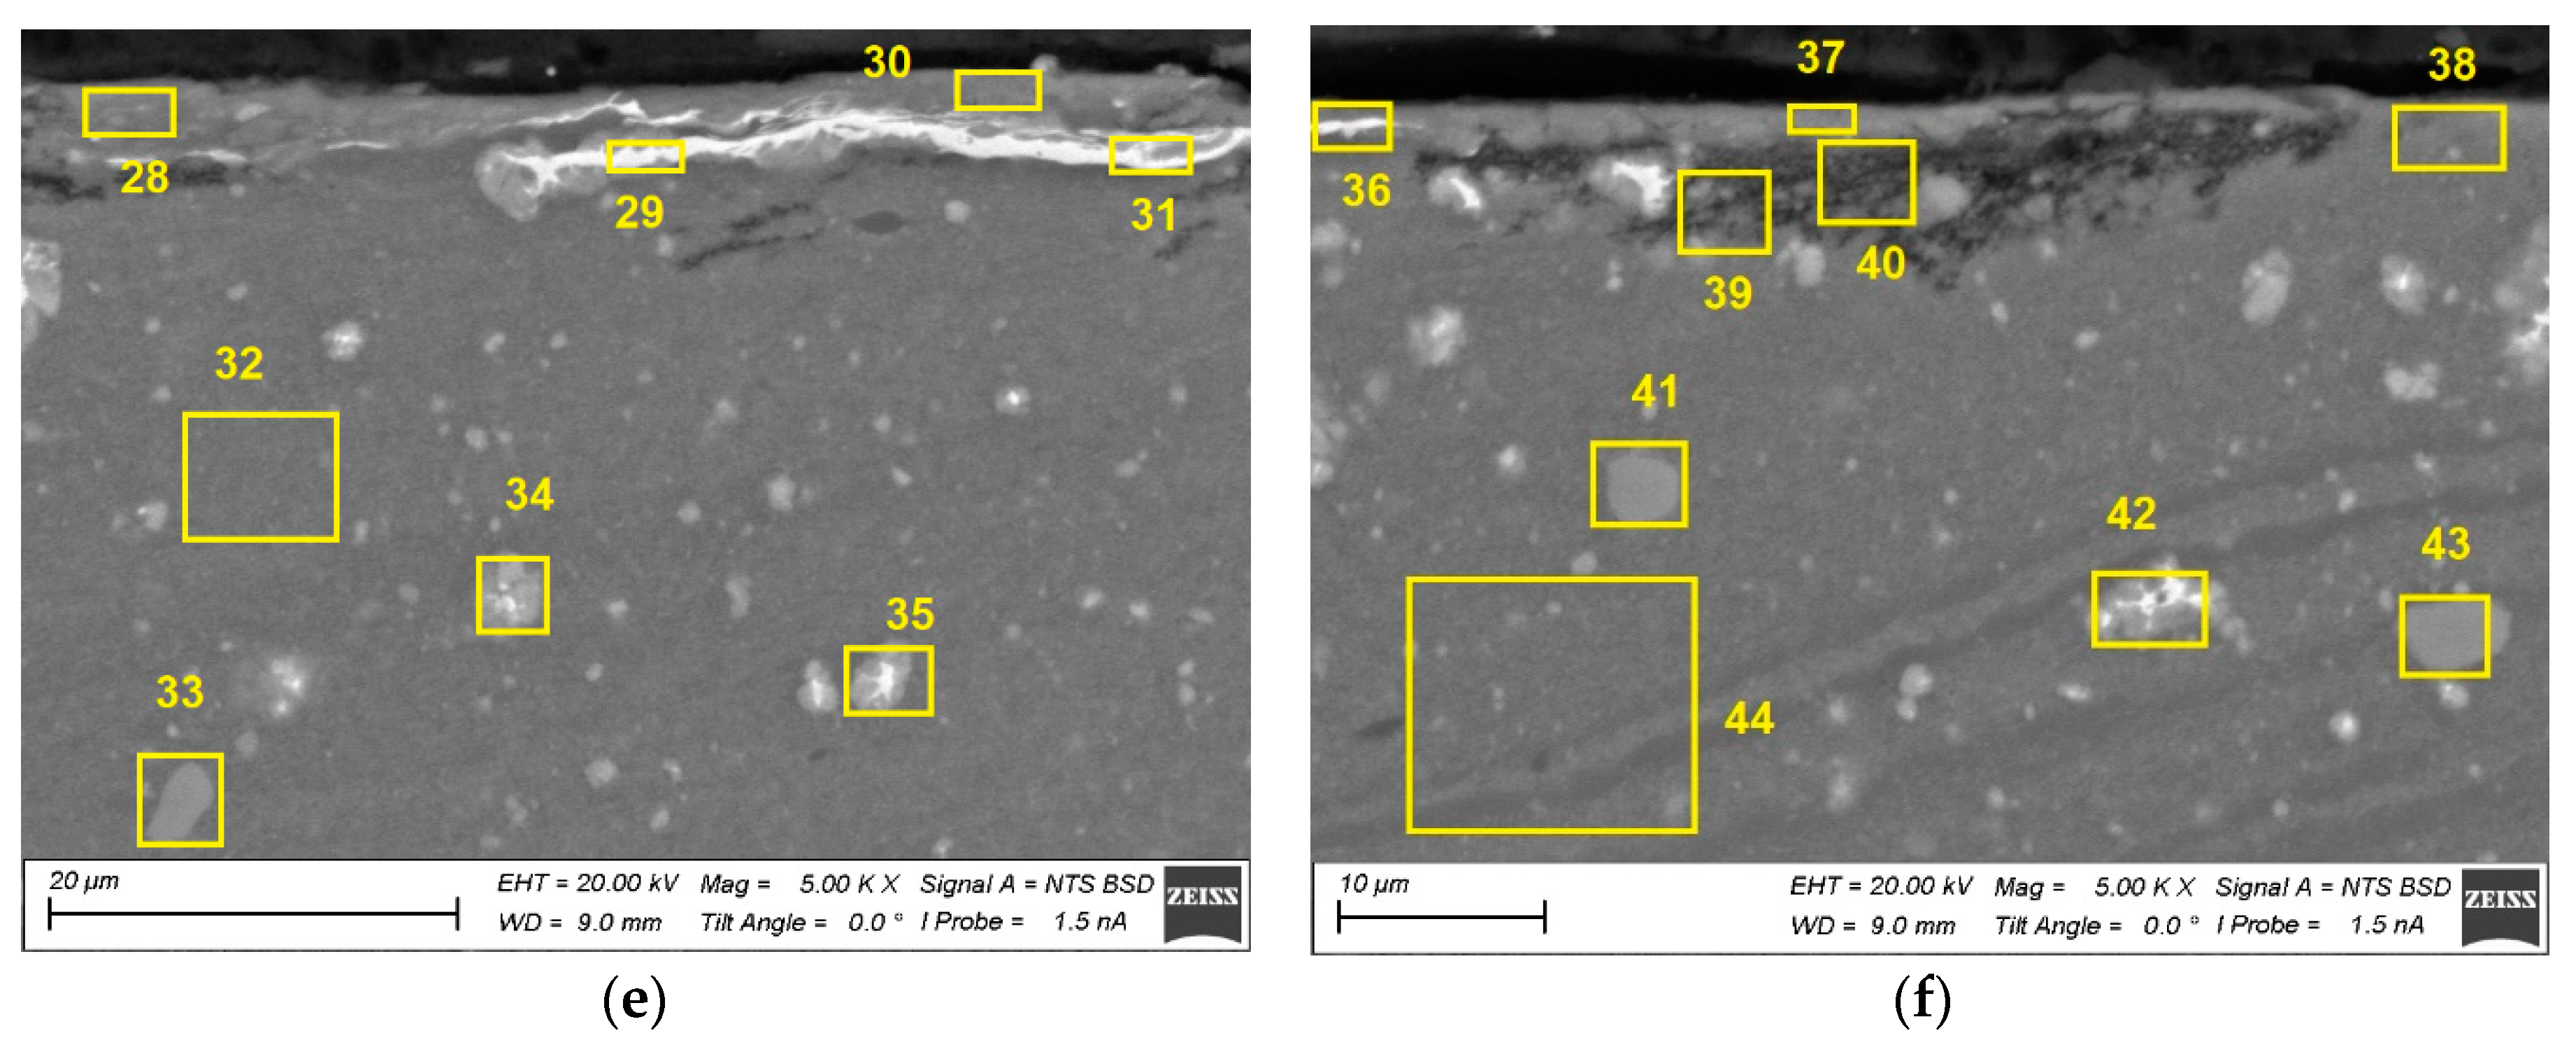
The elongated and deformed Fe-core particles as well as undeformed ones are observed in the subsurface on the Al-Mg-10 vol.% Fe sample 10.4 (
Figure 26e,f). The same type of deformed structures can be observed on the worn surface of the Al-Mg-15 vol.% Fe (
Figure 26e,f) as well as with high oxygen-rich dark areas look like those in the subsurface of Al-Mg alloy (
Figure 26f). The EDS spectra of areas denoted by figures 1-44 are shown in
Table 6.
4. Discussion
Admixing iron powders into aluminum alloy using FSP results in inhomogeneous distribution of powders in the stir zone, especially after 1-2 FSP passes. Therefore these large Fe powder agglomerates that can be then densified and sintered under conditions of FSP as well as react with the aluminum matrix to form IMC shell around the Fe core. Despite IMC particles possess high hardness, their soft core allows plastic deformation of the core-shell Fe/IMC particles. Small Fe–agglomerates maybe fully converted into IMCs by FSP.
In general, the IMCs in FSP with the Al-Mg alloy are formed by reacting between non-oxidized iron powders and aluminum alloy matrix according to the following exothermic reaction:
and without forming any aluminum oxides as it occurs in case of a reaction between Al and iron oxide:
Therefore, no aluminum oxide was detected in all the samples studied. However, the source metallic particles may be covered with very thin oxide layer and starting reaction in this case maybe as shown above. The formed aluminum oxides would be too fine and scarce in this case to be detected by XRD or TEM.
On the other hand, the iron-rich particles are inherent with this type of the aluminum alloy. According to [
30] all intermetallic particles are dissolved during the FSP or FSW on aluminum alloys and then precipitate again forming new dispersoids and particles. In this case it would too hard to tell which ones were inherited from the alloy and which ones were formed by reactions 1-2. Moreover, the multi-pass FSP is characterized by several these dissolution-precipitation cycles.
Diffusion-reaction between iron agglomerates and aluminum matrix is exothermic and therefore frictional heating of the samples may be enhanced by this exothermic effect. Big Fe-powder agglomerates are crushed in the course of FSP and start reacting with aluminum so that core-shell particulates are formed. Increasing the number of passes provides more homogeneous distribution of powder in the stir zone better conversion of iron particles into IMCs.
It is not unexpected that increasing the IMC content in the composites resulted in increasing hardness and tensile strength with simultaneous reduction if ductility. These metal matric composites have not however been intended for tensile loading and therefore main attention was given to studying their behavior in sliding friction. In the absence of lubrication, the composites interacted with the steel counterbody directly. Subsurface plastic deformation of the matrix was more prominent in the Al-Mg-5 vol.% composite with generation of MML composed of oxidized matrix and fragmented IMCs. These MML are subjected to adhesive wear with removal and transfer of large areas. The same type of wear was inherent with the composites containing 10 vol.% Fe.
Composites with 15 vol.% Fe contain more IMCs and therefore are less susceptible to plastic deformation. The worn surface of the Al-Mg -15 vol.% Fe is characterized by wear grooves that may have appeared due to plowing by the hard IMC wear particles.
5. Conclusions
Multi-pass friction stir processing has been used to admix 5, 10 and 15 vol.% of iron powders into Al-Mg alloy and, thus, form composite structure reinforced by in-situ synthetized Fe-Al intermetallic particles. Homogeneous distribution of IMCs such as Al6Fe, Al13Fe4 and Al12FeMn in the stir zones was achieved after 4-pass FSP that allowed increasing the microhardness by a factor of two as compared to that of the base alloy. Tensile strength of the composites was improved with the simultaneous drop in ductility. Such a reinforcement had its positive effect on wear resistance of the composites. Mechanically mixed layer composed of deformed, fragmented and oxidized IMCs, was generated on the worn surfaces of all samples.
Author Contributions
conceptualization, A.Z., A. Chum. and S.T.; methodology, A.Z. and A. Chum. and S.T.; software, N.S.; validation, E.K.; formal analysis, A.Z., A.Chum.; investigation, E.K., A.N., A.Chum., A. Cher., A.Z., D.G., V.U., E.M. and N.S.; resources, A.Chum.; data curation, E.K., A.Z. and A. Chum.; writing—original draft preparation, N.S., A.Z. and S.T.; writing—review and editing, N.S and S.T.; visualization, E.K, A.N., A.Chum., A.Cher., A.Z., D.G., V.U., E.M. and N.S; supervision, A.Z. and S.T.; project administration, A.Z. A.Chum.; funding acquisition, A. Chum. All authors have read and agreed to the published version of the manuscript.
Funding
This research was funded by Government research assignment for ISPMS SB RAS, project FWRW-2021-0012.
Data Availability Statement
Data sharing is not applicable to this article.
Acknowledgments
The investigations have been carried out using the equipment of Share Use Centre “Nanotech” of the ISPMS SB RAS” and Tomsk Regional Core Shared Research Facilities Center of National Research Tomsk State University.
Conflicts of Interest
The authors declare no conflict of interest.
References
- Aliofkhazraei, M. Intermetallic Compounds - Formation and Applications, InTech, 2018. [CrossRef]
- Deevi, S.C.; Sikka, V.K. Nickel and iron aluminides: an overview on properties, processing, and applications. Intermetallics 1996, 4, 357–375. [Google Scholar] [CrossRef]
- Stoloff, N.S. Iron aluminides: present status and future prospects. Mater. Sci. Eng. A 1998, 258, 1–14. [Google Scholar] [CrossRef]
- Prakash, U. Intermetallic matrix composites based on iron aluminides. Intermetallic Matrix Composites. Properties and Applications 2018, 21–35. [Google Scholar] [CrossRef]
- Deevi, S.C. Advanced intermetallic iron aluminide coatings for high temperature applications. Progress in Materials Science 2021, 118, 100769. [Google Scholar] [CrossRef]
- Itoi, T.; Mineta, S.; Kimura, H.; Yoshimi, K.; Hirohashi, M. Fabrication and wear properties of Fe3Al-based composites. Intermetallics 2010, 18, 2169–2177. [Google Scholar] [CrossRef]
- Pradhan, S.K.; Chatterjee, S.; Mallick, A.B.; Das, D. A simple stir casting technique for the preparation of in situ Fe-aluminides reinforced. Perspectives in Science 2016, 8, 529—532. [Google Scholar] [CrossRef]
- Chatterjee, S.; Sinha, A.; Das, D.; Ghosh, S.; Basumallick, A. Microstructure and mechanical properties of Al/Fe-aluminide in-situ composite prepared by reactive stir casting route. Materials Science & Engineering A 2013, 578, 6–13. [Google Scholar] [CrossRef]
- Kang, N.; Fu, Y.; Coddet, P.; Guelorget, B.; Liao, H.; Coddet, C. On the microstructure, hardness and wear behavior of Al-Fe-Cr quasicrystal reinforced Al matrix composite prepared by selective laser melting. Materials and Design 2017, 132, 105–111. [Google Scholar] [CrossRef]
- Ai, X.; Wang, J.; Wen, T.; Yang, F.; Dong, X.; Yan, H.; Ji, Sh. A high Fe-containing AlSi12 alloy fabricated by laser powder bed fusion. Journal of materials research and technology 2022, 18, 4513–4521. [Google Scholar] [CrossRef]
- Canakci, A.; Ozkaya, S.; Erdemir, F.; Hasan Karabacak, A.; Celebi, M. Effects of Fe-Al intermetallic compounds on the wear and corrosion performances of AA2024/316L SS metal/metal composites. Journal of Alloys and Compounds 2020, 845, 156236. [Google Scholar] [CrossRef]
- Roy, D.; Ghosh, S.; Basumallick, A.; Basu, B. Preparation of Fe-aluminide reinforced in situ metal matrix composites by reactive hot pressing. Materials Science and Engineering A 2006, 415, 202–206 https://. [Google Scholar] [CrossRef]
- Roy, D.; Basu, B.; Mallick, A.B.; Kumar, B.V. M.; Ghosh, S. Understanding the unlubricated friction and wear behavior of Fe-aluminide reinforced Al-based in-situ metal–matrix composite. Composites: Part A 2006, 37, 1464–1472. [Google Scholar] [CrossRef]
- Mallik, B.; Sikdar, K.; Roy, D. Tribological Performance of In Situ Reinforced Al-Based Metal Matrix Composite Processed by Spark Plasma Sintering. Materials Performance and Characterization 2019, 8. [Google Scholar] [CrossRef]
- Zykova, A.; Chumaevskii, A.; Gusarova, A.; Kalashnikova, T.; Fortuna, S.; Savchenko, N.; Kolubaev, E.; Tarasov, S. Microstructure of In-Situ Friction Stir Processed Al-Cu Transition Zone. Metals 2020, 10, 818. [Google Scholar] [CrossRef]
- Kalashnikov, K.N.; Tarasov, S. Yu.; Chumaevskii, A.V.; Fortuna, S.V.; Eliseev, A.A.; Ivanov, A.N. Towards aging in a multipass friction stir–processed АА2024. The International Journal of Advanced Manufacturing Technology 2019, 103, 2121–2132. [Google Scholar] [CrossRef]
- Zykova, A.; Chumaevskii, A.; Gusarova, A.; Gurianov, D.; Kalashnikova, T.; Savchenko, N.; Kolubaev, E.; Tarasov, S. Evolution of Microstructure in Friction Stir Processed Dissimilar CuZn37/AA5056 Stir Zone. Materials 2021, 14, 5208. [Google Scholar] [CrossRef]
- Koch, C.C. Intermetallic matrix composites prepared by mechanical alloying—a review. Materials Science and Engineering A 1998, 244, 39–48. [Google Scholar] [CrossRef]
- Tarasov, S.Yu.; Rubtsov, V.E.; Kolubaev, E.A. A proposed diffusion-controlled wear mechanism of alloy steel friction stir welding (FSW) tools used on an aluminum alloy. Wear 2014, 318, 130–134. [Google Scholar] [CrossRef]
- Zykova, A.; Vorontsov, A.; Chumaevskii, A.; Gurianov, D.; Gusarova, A.; Kolubaev, E.; Tarasov, S. Structural evolution of contact parts of the friction stir processing heat-resistant nickel alloy tool used for multi-pass processing of Ti6Al4V/(Cu+Al) system. Wear 2022, 488–489, 204138. [Google Scholar] [CrossRef]
- Rubtsov, V.; Chumaevskii, A.; Gusarova, A.; Knyazhev, E.; Gurianov, D.; Zykova, A.; Kalashnikova, T.; Cheremnov, A.; Savchenko, N.; Vorontsov, A.; et al. Macro- and Microstructure of In Situ Composites Prepared by Friction Stir Processing of AA5056 Admixed with Copper Powders. Materials 2023, 16, 1070. [Google Scholar] [CrossRef]
- Lee, I.S.; Kao, P.W.; Ho, N.J. Microstructure and mechanical properties of Al–Fe in situ nanocomposite produced by friction stir processing. Intermetallics 2008, 16, 1104–1108. [Google Scholar] [CrossRef]
- Sarkari Khorrami, M.; Samadi, S.; Janghorban, Z.; Movahedi, M. In-situ aluminum matrix composite produced by friction stir processing using FE particles. Materials Science&Engineering A 2015, 641, 380–390. [Google Scholar] [CrossRef]
- Najafi, A.; Movahedi, M.; Sadoughi Yarandi, A. Properties–microstructure relationship in Al–Fe in situ composite produced by friction stir processing. Proc IMechE Part L: Journal of Materials: Design and Applications 2018, 233, 1–11. [Google Scholar] [CrossRef]
- Eftekhari, M.; Movahedi, M.; Hossein Kokabi, A. Microstructure, Strength, and Wear Behavior Relationship in Al-Fe3O4 Nanocomposite Produced by Multi-pass Friction Stir Processing. Journal of Materials Engineering and Performance 2017, 26, 3516–3530. [Google Scholar] [CrossRef]
- Azimi-Roeen, G.; Kashani-Bozorg, S.F.; Nosko, M.; Švec, P. Reactive mechanism and mechanical properties of in-situ hybrid nano-composites fabricated from an Al–Fe2O3 system by friction stir processing. Materials Characterization 2017, 127, 279–287. [Google Scholar] [CrossRef]
- AzimiRoeen, G.; Kashani-Bozorg, S.F.; Nosko, M.; Lotfian, S. Mechanical and Microstructural Char-acterization of Hybrid Aluminum Nanocomposites Synthesized from an Al–Fe3O4 System by Friction Stir Processing. Metals and Materials International 2020, 26, 1441–1453. [Google Scholar] [CrossRef]
- Mahmoud, E.R.I.; Tash, M.M. Characterization of Aluminum-Based-Surface Matrix Composites with Iron and Iron Oxide Fabricated by Friction Stir Processing. Materials 2016, 9, 505. [Google Scholar] [CrossRef]
- Kalashnikov, K.N.; Tarasov, S. Yu.; Chumaevskii, A.V.; Fortuna, S.V.; Eliseev, A.A.; Ivanov, A.N. Towards aging in a multipass friction stir–processed АА2024. The International Journal of Advanced Manufacturing Technology 2019, 103, 2121–2132. [Google Scholar] [CrossRef]
- Tarasov, S.Y.; Rubtsov, V.E.; Fortuna, S.V.; Eliseev, A.A.; Chumaevsky, A.V.; Kalashnikova, T.A.; Kolubaev, E.A. Ultrasonic-assisted aging in friction stir welding on Al-Cu-Li-Mg aluminum alloy. Welding in the World 2017, 61, 679–690. [Google Scholar] [CrossRef]
Figure 1.
Iron powder particles used in experimenting.
Figure 1.
Iron powder particles used in experimenting.
Figure 2.
EDM cutting pattern of samples. Samples for optical research and microhardness measure (orange), tensile test (purple) and wear test (yellow).
Figure 2.
EDM cutting pattern of samples. Samples for optical research and microhardness measure (orange), tensile test (purple) and wear test (yellow).
Figure 3.
The FSP torque (a,b,c), temperature on the FSPed surface (d,e,f), resistance force (g,h,i).
Figure 3.
The FSP torque (a,b,c), temperature on the FSPed surface (d,e,f), resistance force (g,h,i).
Figure 4.
XRD patterns of Al-Mg-5% vol. % Fe stir zone metal obtained by 1 to 4 passes of FSP.
Figure 4.
XRD patterns of Al-Mg-5% vol. % Fe stir zone metal obtained by 1 to 4 passes of FSP.
Figure 5.
Al-Mg alloy macrostructure after FSP with 5 vol. % Fe after 1–4 passes. AS—advancing side, RS—retreating side.
Figure 5.
Al-Mg alloy macrostructure after FSP with 5 vol. % Fe after 1–4 passes. AS—advancing side, RS—retreating side.
Figure 6.
CT images of the stir zone of Al-Mg alloy with 5 vol. % Fe.
Figure 6.
CT images of the stir zone of Al-Mg alloy with 5 vol. % Fe.
Figure 7.
Bright-field TEM images (a,b) and SAED patterns (c,d) obtained from areas in circles in Figure (b). Single pass FSP on Al-Mg added with 5 vol. % Fe.
Figure 7.
Bright-field TEM images (a,b) and SAED patterns (c,d) obtained from areas in circles in Figure (b). Single pass FSP on Al-Mg added with 5 vol. % Fe.
Figure 8.
Bright-field TEM images (a,b), SAED pattern (c) and EDS elemental maps (d–g) obtained from 4-pass FSPed Al-Mg-5 vol. % Fe composite.
Figure 8.
Bright-field TEM images (a,b), SAED pattern (c) and EDS elemental maps (d–g) obtained from 4-pass FSPed Al-Mg-5 vol. % Fe composite.
Figure 9.
Bright-field TEM image (a), and EDS elemental maps (b-d) obtained from 4-pass FSPed Al-Mg-5 vol. % Fe composite.
Figure 9.
Bright-field TEM image (a), and EDS elemental maps (b-d) obtained from 4-pass FSPed Al-Mg-5 vol. % Fe composite.
Figure 10.
Bright-field TEM images (a), SAED pattern (b), dark-field TEM images (c–d) and EDS elemental maps (e-h) obtained from 4-pass FSPed Al-Mg-5 vol. % Fe composite.
Figure 10.
Bright-field TEM images (a), SAED pattern (b), dark-field TEM images (c–d) and EDS elemental maps (e-h) obtained from 4-pass FSPed Al-Mg-5 vol. % Fe composite.
Figure 11.
XRD patterns of Al-Mg-10% vol. % Fe stir zone metal obtained by 1 to 4 passes of FSP.
Figure 11.
XRD patterns of Al-Mg-10% vol. % Fe stir zone metal obtained by 1 to 4 passes of FSP.
Figure 12.
Macrostructural optical images of Al-Mg-10 vol.% Fe after 1–4 FSP passes AS—advancing side, RS—retreating side.
Figure 12.
Macrostructural optical images of Al-Mg-10 vol.% Fe after 1–4 FSP passes AS—advancing side, RS—retreating side.
Figure 13.
CT images of the processed area of Al-Mg alloy with 10 vol. % Fe.
Figure 13.
CT images of the processed area of Al-Mg alloy with 10 vol. % Fe.
Figure 14.
Bright-field TEM images obtained from the 1-pass FSPed Al-Mg-10 vol. % Fe composite.
Figure 14.
Bright-field TEM images obtained from the 1-pass FSPed Al-Mg-10 vol. % Fe composite.
Figure 15.
Bright-field TEM images (a,b,c,e), SAED patterns (d,g) and dark-field image (h) obtained using reflection ()Al6Fe from the 4-pass FSPed Al-Mg-10 vol. % Fe composite.
Figure 15.
Bright-field TEM images (a,b,c,e), SAED patterns (d,g) and dark-field image (h) obtained using reflection ()Al6Fe from the 4-pass FSPed Al-Mg-10 vol. % Fe composite.
Figure 16.
XRD patterns of Al-Mg-15% vol. % Fe stir zone metal obtained by 1 to 4 passes of FSP.
Figure 16.
XRD patterns of Al-Mg-15% vol. % Fe stir zone metal obtained by 1 to 4 passes of FSP.
Figure 17.
Al-Mg-15 vol.% Fe alloy macrostructures as formed after FSP successive passes AS—advancing side, RS—retreating side.
Figure 17.
Al-Mg-15 vol.% Fe alloy macrostructures as formed after FSP successive passes AS—advancing side, RS—retreating side.
Figure 18.
CT images of the processed area of Al-Mg alloy with 15 vol.% Fe.
Figure 18.
CT images of the processed area of Al-Mg alloy with 15 vol.% Fe.
Figure 19.
Bright-field TEM images obtained from the 1-pass FSPed Al-Mg-15 vol. % Fe composite.
Figure 19.
Bright-field TEM images obtained from the 1-pass FSPed Al-Mg-15 vol. % Fe composite.
Figure 20.
Bright-field TEM images (a,b,d,g), SAED patterns (c,e,h) and dark-field images (f,i) obtained using reflections (002)Mg2Si and (110)Al12FeMn, respectively from the 4-pass FSPed Al-Mg-15 vol. % Fe composite.
Figure 20.
Bright-field TEM images (a,b,d,g), SAED patterns (c,e,h) and dark-field images (f,i) obtained using reflections (002)Mg2Si and (110)Al12FeMn, respectively from the 4-pass FSPed Al-Mg-15 vol. % Fe composite.
Figure 21.
Microhardness measurements. Scheme of measuring (a) and plots for 5 vol. % Fe (b), 10 vol. % Fe (c) and 15 vol. % Fe (d) for first and forth pass of FSP.
Figure 21.
Microhardness measurements. Scheme of measuring (a) and plots for 5 vol. % Fe (b), 10 vol. % Fe (c) and 15 vol. % Fe (d) for first and forth pass of FSP.
Figure 22.
Tensile properties of FSPed materials as-depended on FSP pass number for alloys with 5% (a), 10% (b) and 15% (c) as compared to as-received Al-Mg alloy (d).
Figure 22.
Tensile properties of FSPed materials as-depended on FSP pass number for alloys with 5% (a), 10% (b) and 15% (c) as compared to as-received Al-Mg alloy (d).
Figure 23.
Fractographic SEM BSE images of the tested tensile samples of as-received Al-Mg alloy (a), Al-Mg-5 vol.% Fe (b), Al-Mg-10 vol.% Fe (c), Al-Mg-15 vol.% Fe (d).
Figure 23.
Fractographic SEM BSE images of the tested tensile samples of as-received Al-Mg alloy (a), Al-Mg-5 vol.% Fe (b), Al-Mg-10 vol.% Fe (c), Al-Mg-15 vol.% Fe (d).
Figure 24.
Wear test results. a, c, e—graphics of friction coefficient to time for 5, 10 and 15% vol. %Fe, respectively; b, d, f—histograms of average friction coefficient and wear by mass and length through the wear test for 5, 10 and 15% vol. %Fe, respectively.
Figure 24.
Wear test results. a, c, e—graphics of friction coefficient to time for 5, 10 and 15% vol. %Fe, respectively; b, d, f—histograms of average friction coefficient and wear by mass and length through the wear test for 5, 10 and 15% vol. %Fe, respectively.
Figure 25.
SEM BSE images of the worn surfaces obtained on as-received Al-Mg alloy (a), Al-Mg-5 vol.% Fe (b), Al-Mg-10 vol.% Fe (c), Al-Mg-15 vol.% Fe (d).
Figure 25.
SEM BSE images of the worn surfaces obtained on as-received Al-Mg alloy (a), Al-Mg-5 vol.% Fe (b), Al-Mg-10 vol.% Fe (c), Al-Mg-15 vol.% Fe (d).
Figure 26.
SEM BSE (
a-f) images of the worn surfaces obtained on as-received Al-Mg alloy (
a), Al-Mg-5 vol.% Fe (
b), Al-Mg-10 vol.% Fe (
c,d), Al-Mg-15 vol.% Fe (
e,f). Numbers on (
a-f) indicate probe zones for which EDS elemental concentrations were determined indicated in
Table 5.
Figure 26.
SEM BSE (
a-f) images of the worn surfaces obtained on as-received Al-Mg alloy (
a), Al-Mg-5 vol.% Fe (
b), Al-Mg-10 vol.% Fe (
c,d), Al-Mg-15 vol.% Fe (
e,f). Numbers on (
a-f) indicate probe zones for which EDS elemental concentrations were determined indicated in
Table 5.
Table 1.
Chemical composition of the base AL-Mg alloy and alloys obtained by FSP intermixing with 5, 10, 15% vol. Fe.
Table 1.
Chemical composition of the base AL-Mg alloy and alloys obtained by FSP intermixing with 5, 10, 15% vol. Fe.
| Sample |
Number of passes |
Element, wt.% |
| Al |
Mg |
Si |
Ti |
V |
Cr |
Mn |
Fe |
| Plate Al-Mg |
Base |
- |
92.63 |
5.33 |
0.39 |
0.10 |
0.03 |
0.21 |
0.54 |
0.30 |
| Al-Mg + 5% Fe |
5.1 |
1 |
91.80 |
4.99 |
0.301 |
0.13 |
0.02 |
0.321 |
0.94 |
1.31 |
| 5.2 |
2 |
87.44 |
5.30 |
0.224 |
0.11 |
0.02 |
0.257 |
0.73 |
5.74 |
| 5.3 |
3 |
87.91 |
5.15 |
0.224 |
0.06 |
0.02 |
0.217 |
0.66 |
5.67 |
| 5.4 |
4 |
89.75 |
5.44 |
0.274 |
0.08 |
0.02 |
0.263 |
0.73 |
3.33 |
| Al-Mg + 10% Fe |
10.1 |
1 |
93.20 |
4.89 |
0.19 |
0.07 |
0.02 |
0.24 |
0.48 |
0.72 |
| 10.2 |
2 |
83.72 |
4.73 |
0.21 |
0.09 |
0.01 |
0.24 |
0.43 |
10.2 |
| 10.3 |
3 |
84.07 |
4.57 |
0.19 |
0.08 |
0.01 |
0.26 |
0.50 |
10.06 |
| 10.4 |
4 |
85.99 |
4.49 |
0.23 |
0.11 |
0.02 |
0.25 |
0.49 |
8.15 |
| Al-Mg + 15% Fe |
15.1 |
1 |
82.98 |
4.44 |
0.34 |
0.16 |
0.02 |
0.28 |
0.49 |
10.70 |
| 15.2 |
2 |
85.18 |
4.57 |
0.21 |
0.14 |
0.03 |
0.32 |
0.53 |
8.45 |
| 15.3 |
3 |
83.80 |
4.30 |
0.27 |
0.18 |
0.02 |
0.28 |
0.45 |
10.02 |
| 15.4 |
4 |
80.16 |
4.33 |
0.20 |
0.14 |
0.02 |
0.22 |
0.40 |
13.98 |
Table 2.
Parameters of friction stir processing (FSP).
Table 2.
Parameters of friction stir processing (FSP).
| № pass |
V, mm/min |
ω, RPM |
P, kg |
| 5 vol.% |
10 vol.% |
15 vol.% |
| 1 |
90 |
500 |
1080 |
950 |
860 |
| 2 |
90 |
500 |
1100 |
980 |
900 |
| 3 |
90 |
500 |
1150 |
1000 |
950 |
| 4 |
90 |
500 |
1150 |
1050 |
1000 |
Table 3.
EDS spectra from areas 1-4 in
Figure 7а,b. Single pass FSPed stir zone of Al-Mg-5 vol. % Fe.
Table 3.
EDS spectra from areas 1-4 in
Figure 7а,b. Single pass FSPed stir zone of Al-Mg-5 vol. % Fe.
| Spectrum |
Elements, at. % |
| Al |
Mg |
Fe |
Mn |
Si |
Cr |
| 1 |
77.3 |
- |
11.7 |
9.1 |
1.6 |
0.3 |
| 2 |
92.9 |
7.1 |
- |
- |
- |
- |
| 3 |
86.2 |
- |
7.2 |
5.9 |
- |
- |
| 4 |
93.4 |
6.6 |
- |
- |
- |
- |
| 5 |
- |
70.6 |
- |
- |
29.4 |
- |
Table 4.
EDS spectra from the 4-pass FSPed Al-Mg-5 vol. % Fe composite areas 1-7 (
Figure 9a,
Figure 10a).
Table 4.
EDS spectra from the 4-pass FSPed Al-Mg-5 vol. % Fe composite areas 1-7 (
Figure 9a,
Figure 10a).
| Spectrum |
Element, at.% |
| Al |
Mg |
Fe |
| 1 |
91.8 |
6.9 |
1.2 |
| 2 |
75.4 |
- |
24.6 |
| 3 |
72.2 |
- |
27.8 |
| 4 |
13.7 |
- |
86.3 |
| 5 |
91.6 |
8.4 |
- |
| 6 |
74.1 |
- |
25.9 |
| 7 |
1.3 |
- |
98.7 |
Table 5.
EDS chemical composition of worn surface of the as-received Al-Mg alloy (
Figure 26a), FSP-ed Al-Mg-5 vol.% Fe (
Figure 26b), FSP-ed Al-Mg-10 vol.% Fe (
Figure 26c), FSP-ed Al-Mg-15 vol.% Fe (
Figure 26d).
Table 5.
EDS chemical composition of worn surface of the as-received Al-Mg alloy (
Figure 26a), FSP-ed Al-Mg-5 vol.% Fe (
Figure 26b), FSP-ed Al-Mg-10 vol.% Fe (
Figure 26c), FSP-ed Al-Mg-15 vol.% Fe (
Figure 26d).
| Area |
Element (at.%) |
| O |
Mg |
Al |
Cr |
Mn |
Fe |
| As-received Al-Mg alloy |
| 1 |
32.66 |
4.46 |
61.33 |
0.21 |
0.16 |
1.18 |
| FSP-ed Al-Mg-5 vol.% Fe |
| 2 |
9.52 |
6.06 |
82.07 |
- |
0.32 |
2.03 |
| 3 |
18.42 |
2.10 |
27.51 |
- |
- |
51.97 |
| FSP-ed Al-Mg-10 vol.% Fe |
| 4 |
37.37 |
3.47 |
47.62 |
0.30 |
- |
11.25 |
| 5 |
43.51 |
3.01 |
43.94 |
0.32 |
- |
9.22 |
| FSP-ed Al-Mg-15 vol.% Fe |
| 6 |
43.67 |
3.05 |
40.90 |
0.78 |
- |
11.59 |
| 7 |
50.51 |
2.81 |
39.32 |
0.79 |
- |
6.57 |
| 8 |
37.75 |
3.64 |
53.04 |
0.48 |
- |
5.08 |
Table 6.
EDS chemical composition of microstructures formed by sliding below the worn surface of the as-received Al-Mg alloy (Figure 27), FSP-ed Al-Mg-5 vol.% Fe (Figure 27b), FSP-ed Al-Mg-10 vol.% Fe (Figure 27c,d), FSP-ed Al-Mg-15 vol.% Fe (Figure 27e,f).
Table 6.
EDS chemical composition of microstructures formed by sliding below the worn surface of the as-received Al-Mg alloy (Figure 27), FSP-ed Al-Mg-5 vol.% Fe (Figure 27b), FSP-ed Al-Mg-10 vol.% Fe (Figure 27c,d), FSP-ed Al-Mg-15 vol.% Fe (Figure 27e,f).
| Area |
Element (at.%) |
| O |
Mg |
Al |
Cr |
Mn |
Fe |
| As-received Al-Mg alloy |
| 1 |
38.18 |
4.02 |
57.80 |
- |
- |
- |
| 2 |
55.02 |
3.12 |
41.11 |
- |
- |
0.75 |
| 3 |
51.73 |
3.54 |
43.86 |
- |
- |
0.87 |
| 4 |
50.66 |
3.28 |
45.13 |
- |
- |
0.94 |
| 5 |
10.70 |
5.87 |
83.43 |
- |
- |
- |
| 6 |
7.28 |
5.71 |
87.01 |
- |
- |
- |
| 7 |
- |
6.08 |
93.92 |
- |
- |
- |
| FSP-ed Al-Mg-5 vol.% Fe |
| 8 |
54.95 |
3.32 |
34.84 |
0.84 |
- |
6.05 |
| 9 |
53.30 |
2.87 |
34.75 |
1.37 |
- |
7.72 |
| 10 |
53.21 |
3.35 |
35.94 |
1.17 |
- |
6.33 |
| 11 |
- |
4.65 |
86.78 |
- |
3.75 |
4.82 |
| 12 |
- |
4.66 |
80.61 |
- |
|
14.73 |
| 13 |
- |
1.93 |
85.48 |
- |
5.87 |
6.73 |
| FSP-ed Al-Mg-10 vol.% Fe |
| 14 |
51.30 |
2.74 |
39.24 |
0.85 |
- |
5.88 |
| 15 |
- |
3.44 |
64.46 |
- |
- |
32.10 |
| 16 |
- |
- |
4.35 |
- |
- |
95.65 |
| 17 |
51.56 |
2.96 |
38.36 |
0.81 |
- |
6.31 |
| 18 |
48.78 |
2.82 |
39.83 |
1.29 |
- |
7.28 |
| 19 |
- |
2.97 |
71.61 |
- |
- |
25.42 |
| 20 |
- |
- |
10.30 |
- |
- |
89.70 |
| 21 |
- |
7.07 |
91.34 |
- |
- |
1.60 |
| 22 |
29.23 |
4.52 |
63.85 |
- |
- |
2.40 |
| 23 |
45.39 |
3.40 |
45.78 |
0.62 |
- |
4.82 |
| 24 |
- |
2.25 |
70.19 |
- |
- |
27.56 |
| 25 |
- |
- |
8.08 |
- |
- |
91.92 |
| 26 |
45.39 |
3.40 |
45.78 |
0.62 |
- |
4.82 |
| 27 |
- |
7.01 |
91.76 |
- |
- |
1.23 |
| FSP-ed Al-Mg-15 vol.% Fe |
| 28 |
37.42 |
3.86 |
52.18 |
- |
- |
6.54 |
| 29 |
- |
2.17 |
34.53 |
- |
- |
63.31 |
| 30 |
40.39 |
4.24 |
47.77 |
- |
- |
7.60 |
| 31 |
- |
3.79 |
58.18 |
- |
- |
38.02 |
| 32 |
- |
6.83 |
88.98 |
- |
- |
4.18 |
| 33 |
- |
3.05 |
85.38 |
- |
3.30 |
8.28 |
| 34 |
- |
3.00 |
70.89 |
- |
- |
26.12 |
| 35 |
- |
2.67 |
70.31 |
- |
- |
27.03 |
| 36 |
17.41 |
4.89 |
53.30 |
3.56 |
- |
20.84 |
| 37 |
38.09 |
3.87 |
53.34 |
0.38 |
- |
4.33 |
| 38 |
12.34 |
4.83 |
77.30 |
- |
- |
5.53 |
| 39 |
18.62 |
4.32 |
70.26 |
- |
- |
6.79 |
| 40 |
21.03 |
3.87 |
68.02 |
- |
- |
7.08 |
| 41 |
- |
1.86 |
85.46 |
- |
4.30 |
8.38 |
| 42 |
- |
- |
39.91 |
- |
- |
60.09 |
| 43 |
- |
1.46 |
85.07 |
- |
4.27 |
9.19 |
| 44 |
4.75 |
6.84 |
85.00 |
- |
0.48 |
2.93 |
|
Disclaimer/Publisher’s Note: The statements, opinions and data contained in all publications are solely those of the individual author(s) and contributor(s) and not of MDPI and/or the editor(s). MDPI and/or the editor(s) disclaim responsibility for any injury to people or property resulting from any ideas, methods, instructions or products referred to in the content. |
© 2023 by the authors. Licensee MDPI, Basel, Switzerland. This article is an open access article distributed under the terms and conditions of the Creative Commons Attribution (CC BY) license (http://creativecommons.org/licenses/by/4.0/).
