1. Introduction
Drag is a significant physical phenomenon in the performance of elite athletes in multiple sports. Each athlete must overcome the resistance exerted by the surrounding fluid, whether water or air. Elite athletes of multiple sports and their management teams have long been looking for ways to improve performance by reducing drag.
The most common technique employed is drafting. For a runner, drafting means running directly behind another runner (or in other formation) to benefit from the wake region generated by the runner in front. The wake region is characterized by lower flow velocities and negative pressure coefficients, reducing drag and benefitting the trailing runner.
The effects of drafting have been studied the most for cycling, where it was shown through computational fluid dynamics (CFD) that large drag reductions can be achieved by drafting, especially in tight formations [
1,
2,
3]. In further studies with two cyclists, drag reductions of 27.1% were reported for the trailing cyclist [
4]. Wind tunnel experiments have also been performed in the past to investigate formations of two riders [
5]. The effects of drafting have also been studied for motorsports [
6,
7], skating [
8], kayaking [
9], skiing [
10] and swimming [
11,
12]. In all the cases except for motor sports, special emphasis is placed on the metabolic cost of exercise for the athletes, i.e., the study of the energy savings associated with reduced drag.
Studies on the effect of drafting and its relation to metabolic savings in running performance have been conducted. The first major study on the subject, [
13], established the rate of oxygen uptake necessary for a runner to sustain movement over a range of velocities. The rate of oxygen uptake is also known as running economy and is the most common metabolic indicator, taking into account numerous cardiorespiratory, biomechanical and neuromuscular effects during suboptimal running [
14,
15].
Over the past few years, different running formations have been adopted by elite marathon runners, both in official events and in special attempts to break the two hour barrier. Most notably, Kenyan runner Eliud Kipchoge utilized different formations to break the official world record in both the 2018 and 2022 editions of the Berlin marathon. In two separate events, the Nike Breaking2 (2017) and INEOS challenge (2019), rather creative formations were seen, which ultimately led to the breaking of the two hour mark in the latter event, though the record is not recognized by the IAAF [
16].
A 2018 study [
17] claimed that a cooperative drafting strategy performed by a team of four elite runners could result in an official marathon time of 2:00:48. A similar study [
18] investigated the strategies employed by Ethiopian runner Kenesisa Bekele, estimating metabolic power reductions of up to 2.84% based on the drafting formation used.
A research study published in 2021 [
19] employed CFD on a realistic 3-D model of a runner at different speeds to evaluate aerodynamic and total power expenditure. Four formations were evaluated, and it was found that drag reductions of more than 70% are attainable. A 2023 study [
20] utilized the same technique to investigate many other running formations by also integrating different pacing strategies. It was shown that Eliud Kipchoge could have run his record breaking 2022 Berlin marathon in 1:59:57, one minute and twelve seconds than his actual time.
Recently, in the 2023 Chicago marathon, Kenyan runner Kelvin Kiptum shocked the world by running in 2:00:35 and setting a world record in the race. That feat is even more amazing considering that Kiptum did not take advantage of drafting effects at all during the race. Sparked by curiosity, the authors decided to expand the previous study [
20] and determine how much faster Kiptum could have run by taking advantage of drafting effects.
In this study, a realistic model of Kelvin Kiptum was used in CFD simulations to evaluate drag for him and his pacers during the race. By computing the energy expenditure for each runner and simulating an alternative drafting strategy, we calculate the potential time savings during the race.
2. Methods
2.1. Numerical Methods
The solution of the flow field around the runners and calculation of corresponding values was performed via computational fluid dynamics (CFD) using ANSYS Fluent. The Navier-Stokes equations were solved in the Reynolds-Averaged (RANS) format.
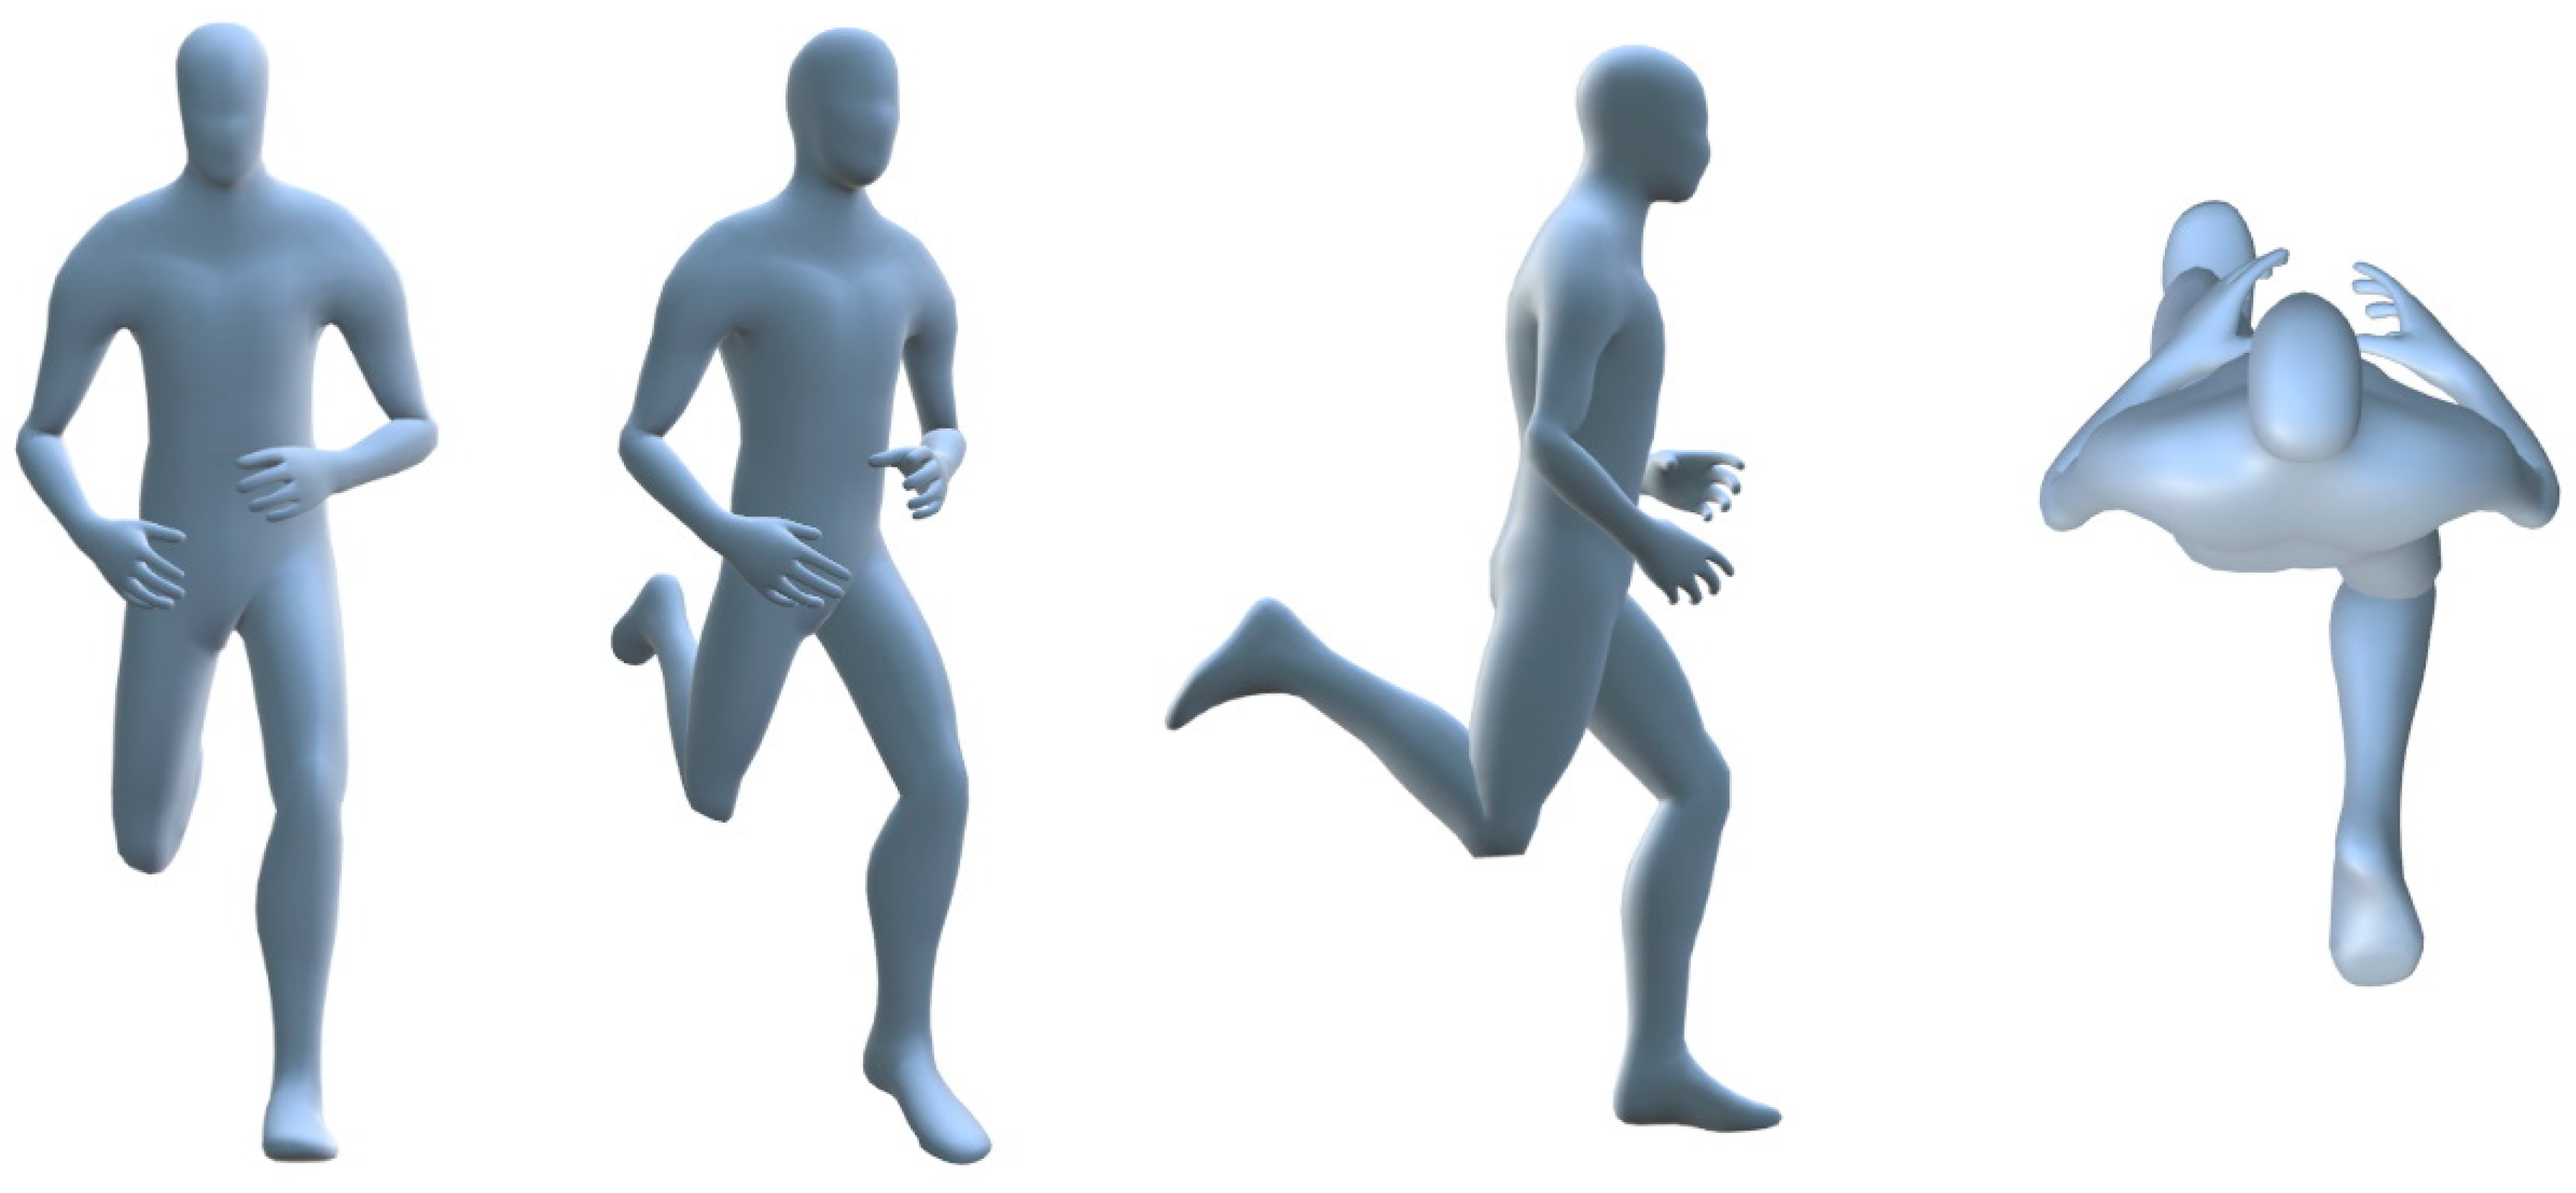
The geometry for each runner was extracted from a high-fidelity anthropometric model, which was scaled to properly match Kelvin Kiptum’s height of 1.80m [
21]. The limbs were displaced in order to approximately match his running position when the left foot is on the ground.
Our simulation was performed using a static model, i.e., not considering movement of the limbs. This is consistent with research performed both on cyclists [
22] and runners [
20]. Although it is possible to consider the movement of the arms and legs relative to the trunk, a more advanced study of the runner would be necessary, with extensive use of 3-D scanning techniques. Also, a dynamic meshing process would be necessary, which greatly increases the computational cost, making the alternative unviable.
The turbulence model has an important effect on the flow solution in the boundary layer region, and greatly impacts the calculation of the drag force. In this study, the shear-stress-transport (SST) formulation is chosen [
23].
The meshing process was performed according to best practices for CFD simulations [
20,
24]. In particular, the SST formulation requires finer meshing in the near wall region. We chose to use 30 inflation layers, with a growth factor of 1.2, where the first height (
) is calculated according to the equations shown in [
25]. The SST model imposes a condition in the dimensionless wall distance value over the geometry of
.
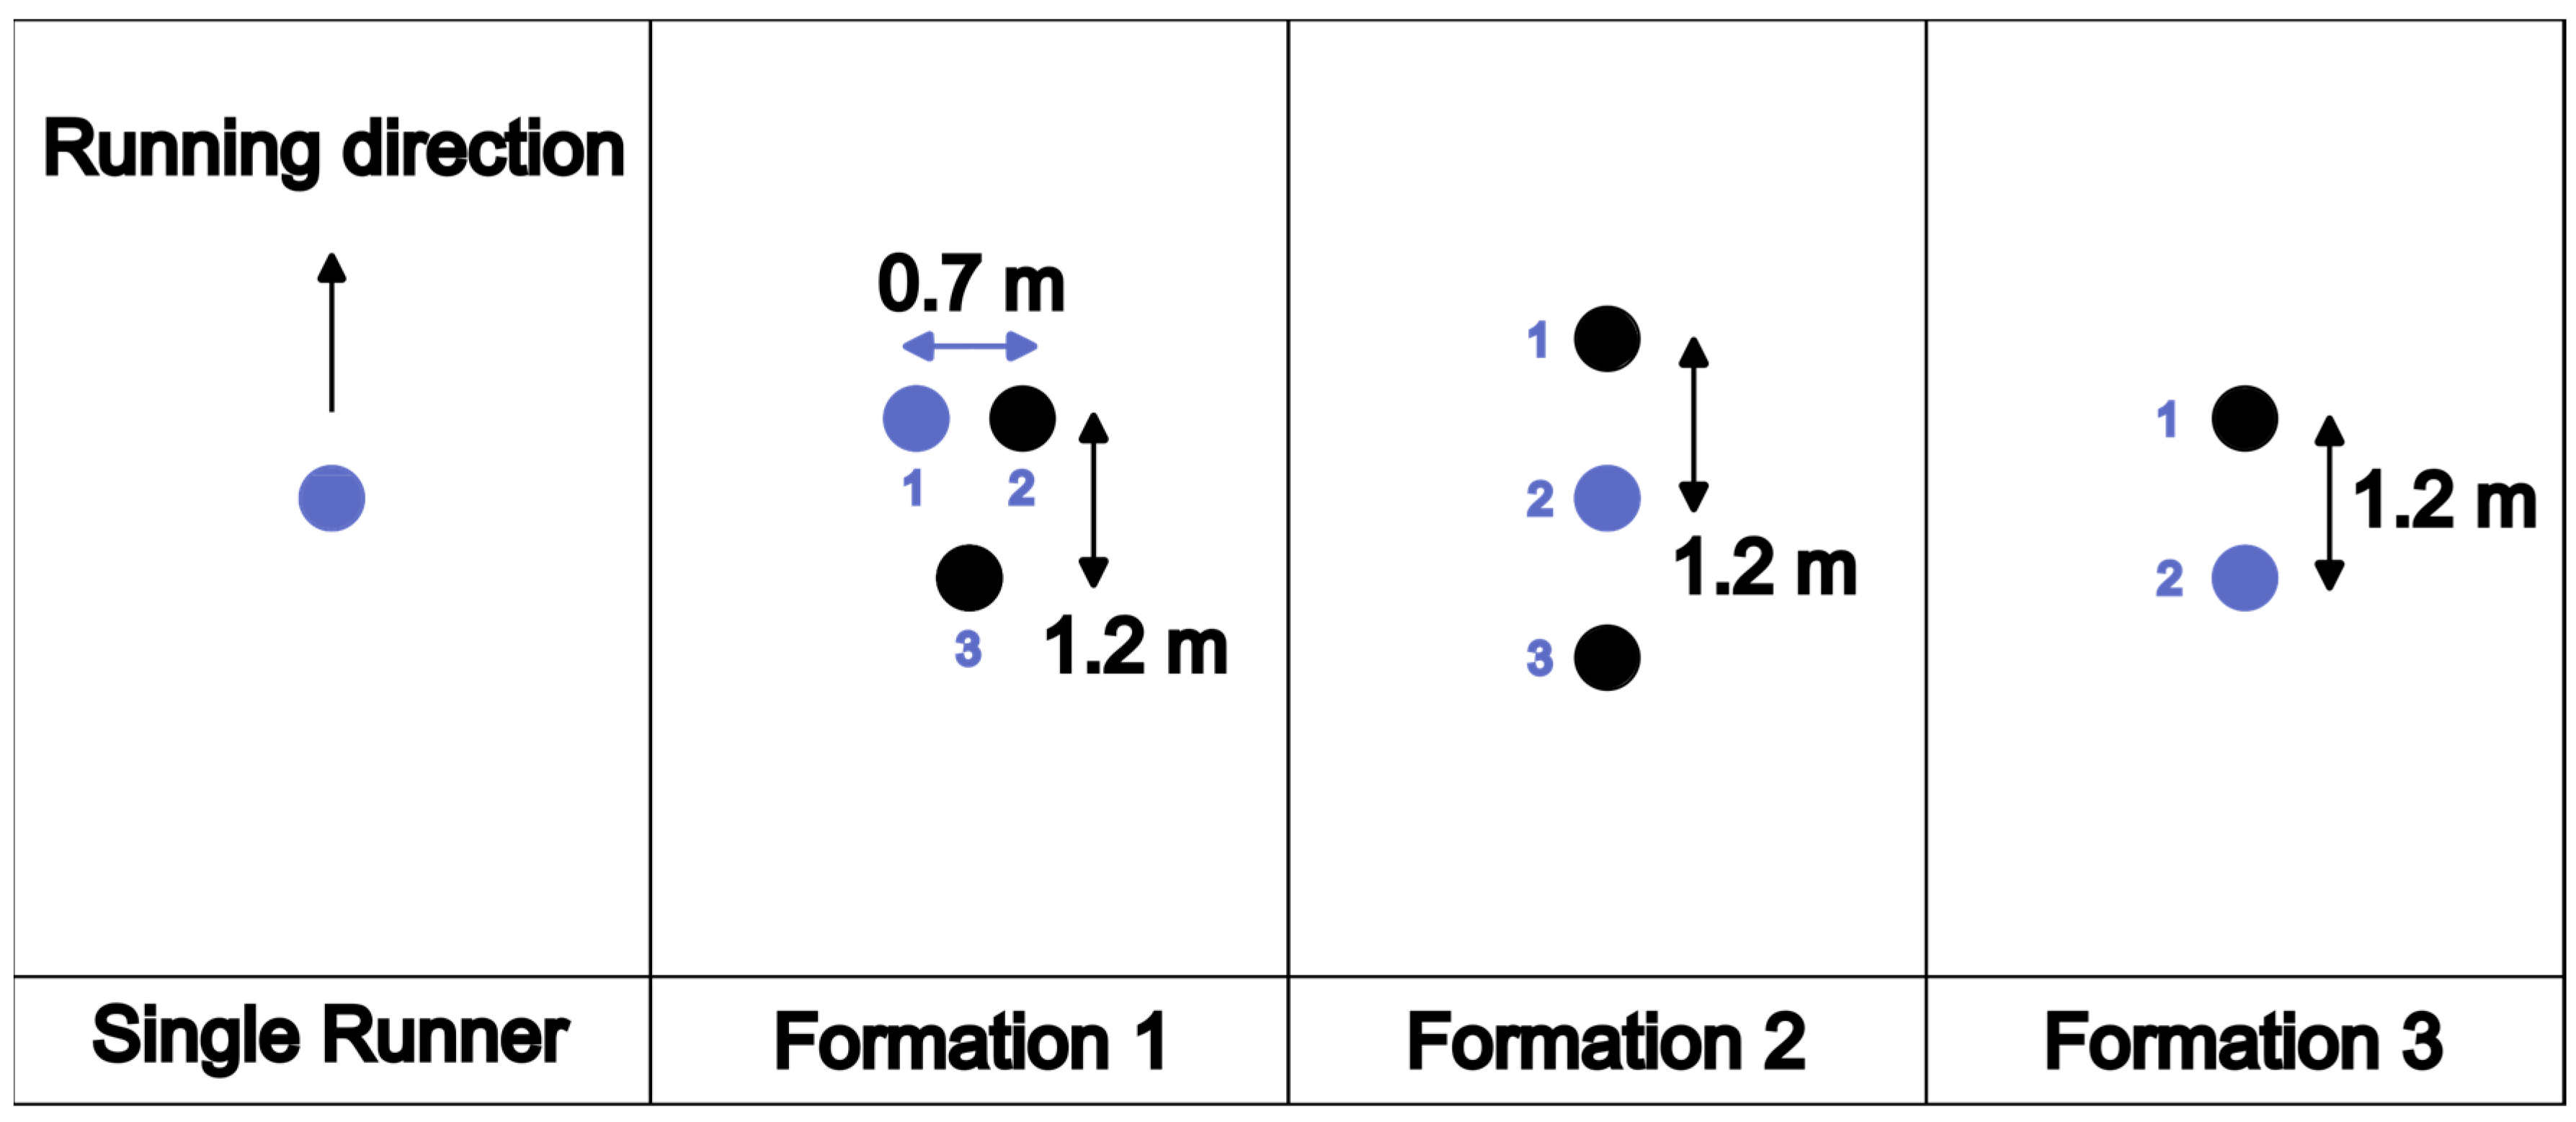
Four total formations, shown in
Figure 1 were simulated. During the first
of the race, the leading pack featured other runners, and it was difficult to pinpoint the actual formation. Soon after, Kiptum and his pacers took the lead, running in Formation 1 Interestingly, Kiptum ran in position 1, which offers no drag benefit. When the first pacer left, he ran side-by-side with the remaining pacer, with a lateral offset big enough that the drag is the same as running alone. Formations 2 and 3 are also simulated for offering superior drag performance for both the main runner and the pacers [
20]. All drag results are shown in section 4.
The dimensions of the formations were estimated from the race broadcast [
26]. The distance between two runners in the running direction is of
, consistent with previous research [
18,
19]. This distance reduces the risk of tripping. The lateral distance for Formation 1, of
, is also consistent with past research.
Quick changes in formation, such as for hydration stations, are not considered since they are only used for negligible periods of time.
The anthropometric model in running position is shown in
Figure 2. Surrounding it is the box-shaped fluid domain. Dimensions for the fluid domain were defined based on best practices for CFD simulations [
24]. The lateral and vertical distances between the center of the formation and the walls are twenty-five times the width for each running formation; the axial length is defined as fifty times the length of each formation. Ensuring the boundaries are distant from the object of interest minimizes the effect of boundary condition choices on drag results.
A vertical offset of was applied to all the runners, ensuring there is no contact between the lower foot of each runner and the lower boundary. Enforcing all the bodies to be completely surrounded by fluid facilitates the choice of boundary conditions and is indeed a realistic running pose if we consider the instant before the front foot touches the ground.
The inlet boundary condition consists of a uniform velocity of the appropriate value for each case. More information about each case is presented in section Error! Reference source not found.. The lateral and upper walls were modeled as symmetric walls, and a static pressure boundary was chosen for the outlet, with an ambient pressure of . The fluid is defined as air with ambient pressure and a temperature of .
The ground is defined as a moving wall, with the same speed as the inlet boundary. This ensures there are no unrealistic boundary layers at the bottom that could invalidate the results. This approach is consistent with previous research [
19].
2.1. Calculation of power values
In order to compute the power output of a runner, one of the available empirical models must be used. The earliest model was proposed by Fukunaga et al [
27]. In this study, the more complete model, proposed by Cavagna and Kaneko [
28], is used. The equation for specific running power per unit mass is
In this model, the velocity
is in
and
is calculated in calories per minute per kg. To facilitate the analysis, changes were made so that the velocity is in
and
is found in Joules per second per kg. The next step is to substitute the mass for Kelvin Kiptum,
[
21] to find the total running power, in W:
This model contemplates the internal running power, i.e., the power necessary to accelerate the limbs relative to the trunk, as well as other biomechanical aspects. The total mechanical work is split into two components:
Where
and
are the external and internal components, respectively. The external component accounts for the energy spent to overcome the aerodynamic drag, weight of the runner and ground friction forces (in case one of the feet is in contact with the ground).
The internal component accounts for the internal movement of the arms and legs, such spring-like motion of muscles during running [
29]. The internal work component, as well as the portions of
related to weight and ground friction, have been accounted for in the model for
.
The experiments performed in the obtention of the model for
[
27,
29] were performed on treadmills, where the air was stagnant and no form drag was present; in order to account for the flow component of energy expenditure, the total running power,
, must also include the aerodynamic power:
Where the Aerodynamic power,
, is defined as
Where
is the drag force, in
, and
is the running velocity, in
; the aerodynamic power is obtained in
. The drag force,
is obtained from the CFD simulations.
3. Analytical procedure
The evaluation of Kelvin Kiptum’s performance in the light of drag benefits associated with more aerodynamically efficient formations must be performed according to a procedure that allows systematic and consistent comparison between different formations and velocities.
The equations presented in section 2.2 clearly show the dependence of power expenditure on drag force and running velocity. Therefore, it is necessary to split the race into different sections, according to pace and formation. The results are shown in
Table 1. The official results [
30] presented the average pace for each
portion of the race. Since our analysis will not include the portion of the race prior to Kiptum taking the lead, the first
are not relevant.
Usually, CFD simulations allow the calculation of drag for one given running speed. With that in mind, the drag values were obtained for four different (although close) running speeds for every formation. That improves the accuracy of our analysis and allows the interpolation of values, which is necessary for our predictions. The lower limit, , was chosen as and an upper limit, , was set as . The interval was divided into three equal parts, generating intermediate speeds of and .
After the obtention of drag values for all positions and formations at four different speeds, high quality second order polynomial fits are obtained, which allow the calculation of the drag force for speed values inside and slightly outside of the interval with great accuracy.
The drag values obtained from the second order fits are then fed into the mechanical power model, and finally the power output for each racer in each portion of the race is known. Comparison between different phases of the race to project time savings is a complex process, due to varying speeds and formations. However, we use the average running power exerted by the main runner during a certain phase of the run to evaluate possible improvements in case a more aerodynamically efficient formation is adopted.
After the power output for each runner and portion of the race is determined, the total energy spent by each runner is known. It is unrealistic that either Kiptum or his pacers would have been able to elevate their total energy expenditure during the race, due to a number of factors: hydration, fatigue, sunlight, temperature, among others. Therefore, when speculating that a more efficient formation could save time, the energy output of the speculated case must be equal or lower than that of the real race.
In this paper, we follow the results of past research [
20] to generate a superior pacing/drafting strategy. In particular, it has been shown that:
When two pacers are available, Formation 2 is more efficient than Formation 1 (
Figure 1) because it requires a lower total combined power output for the three runners. In particular, the main runner should be in position 2, benefiting from the greatest drag reduction. Position 3 must be occupied by the strongest of the two pacers (i.e., the one who will stay in the race for longer).
When only one pacer is available, the most efficient formation is Formation 4 (
Figure 1), and the main runner should run behind the lone pacer.
The pacing strategy is chosen to closely match the velocity fluctuations that occurred in the actual race. The velocity of all portions of the race is multiplied by the velocity increase factor, . Therefore, the energy savings associated with drafting are offset by increased running power for higher speeds. The simulated race is run according to the drafting strategy explained above.
The procedure of analysis may be summarized as follows:
Evaluation of race results and broadcast to determine distance covered, time elapsed and formation for each portion of each race;
Obtention of drag values from CFD simulations for all the formations at the applicable speeds;
Calculation of aerodynamic, mechanical and total power values for all runners;
Obtention of total energy output for each runner during the race;
Choice of velocity increase factor, ;
Application of the principle of conservation of energy to both pacers, determining when each of them exits the race and when formations are changed;
Obtention of total race time and energy expenditure for Kiptum.
The last three steps were performed in MATLAB. The procedure will be illustrated in greater detail in section 4.
4. Results and discussion
The evaluation of the race results and broadcast is presented in
Table 1. Drag results were obtained from the CFD simulations, and the results are shown in
Table 2. Information about the formations and running positions within each formation is available in
Figure 1.
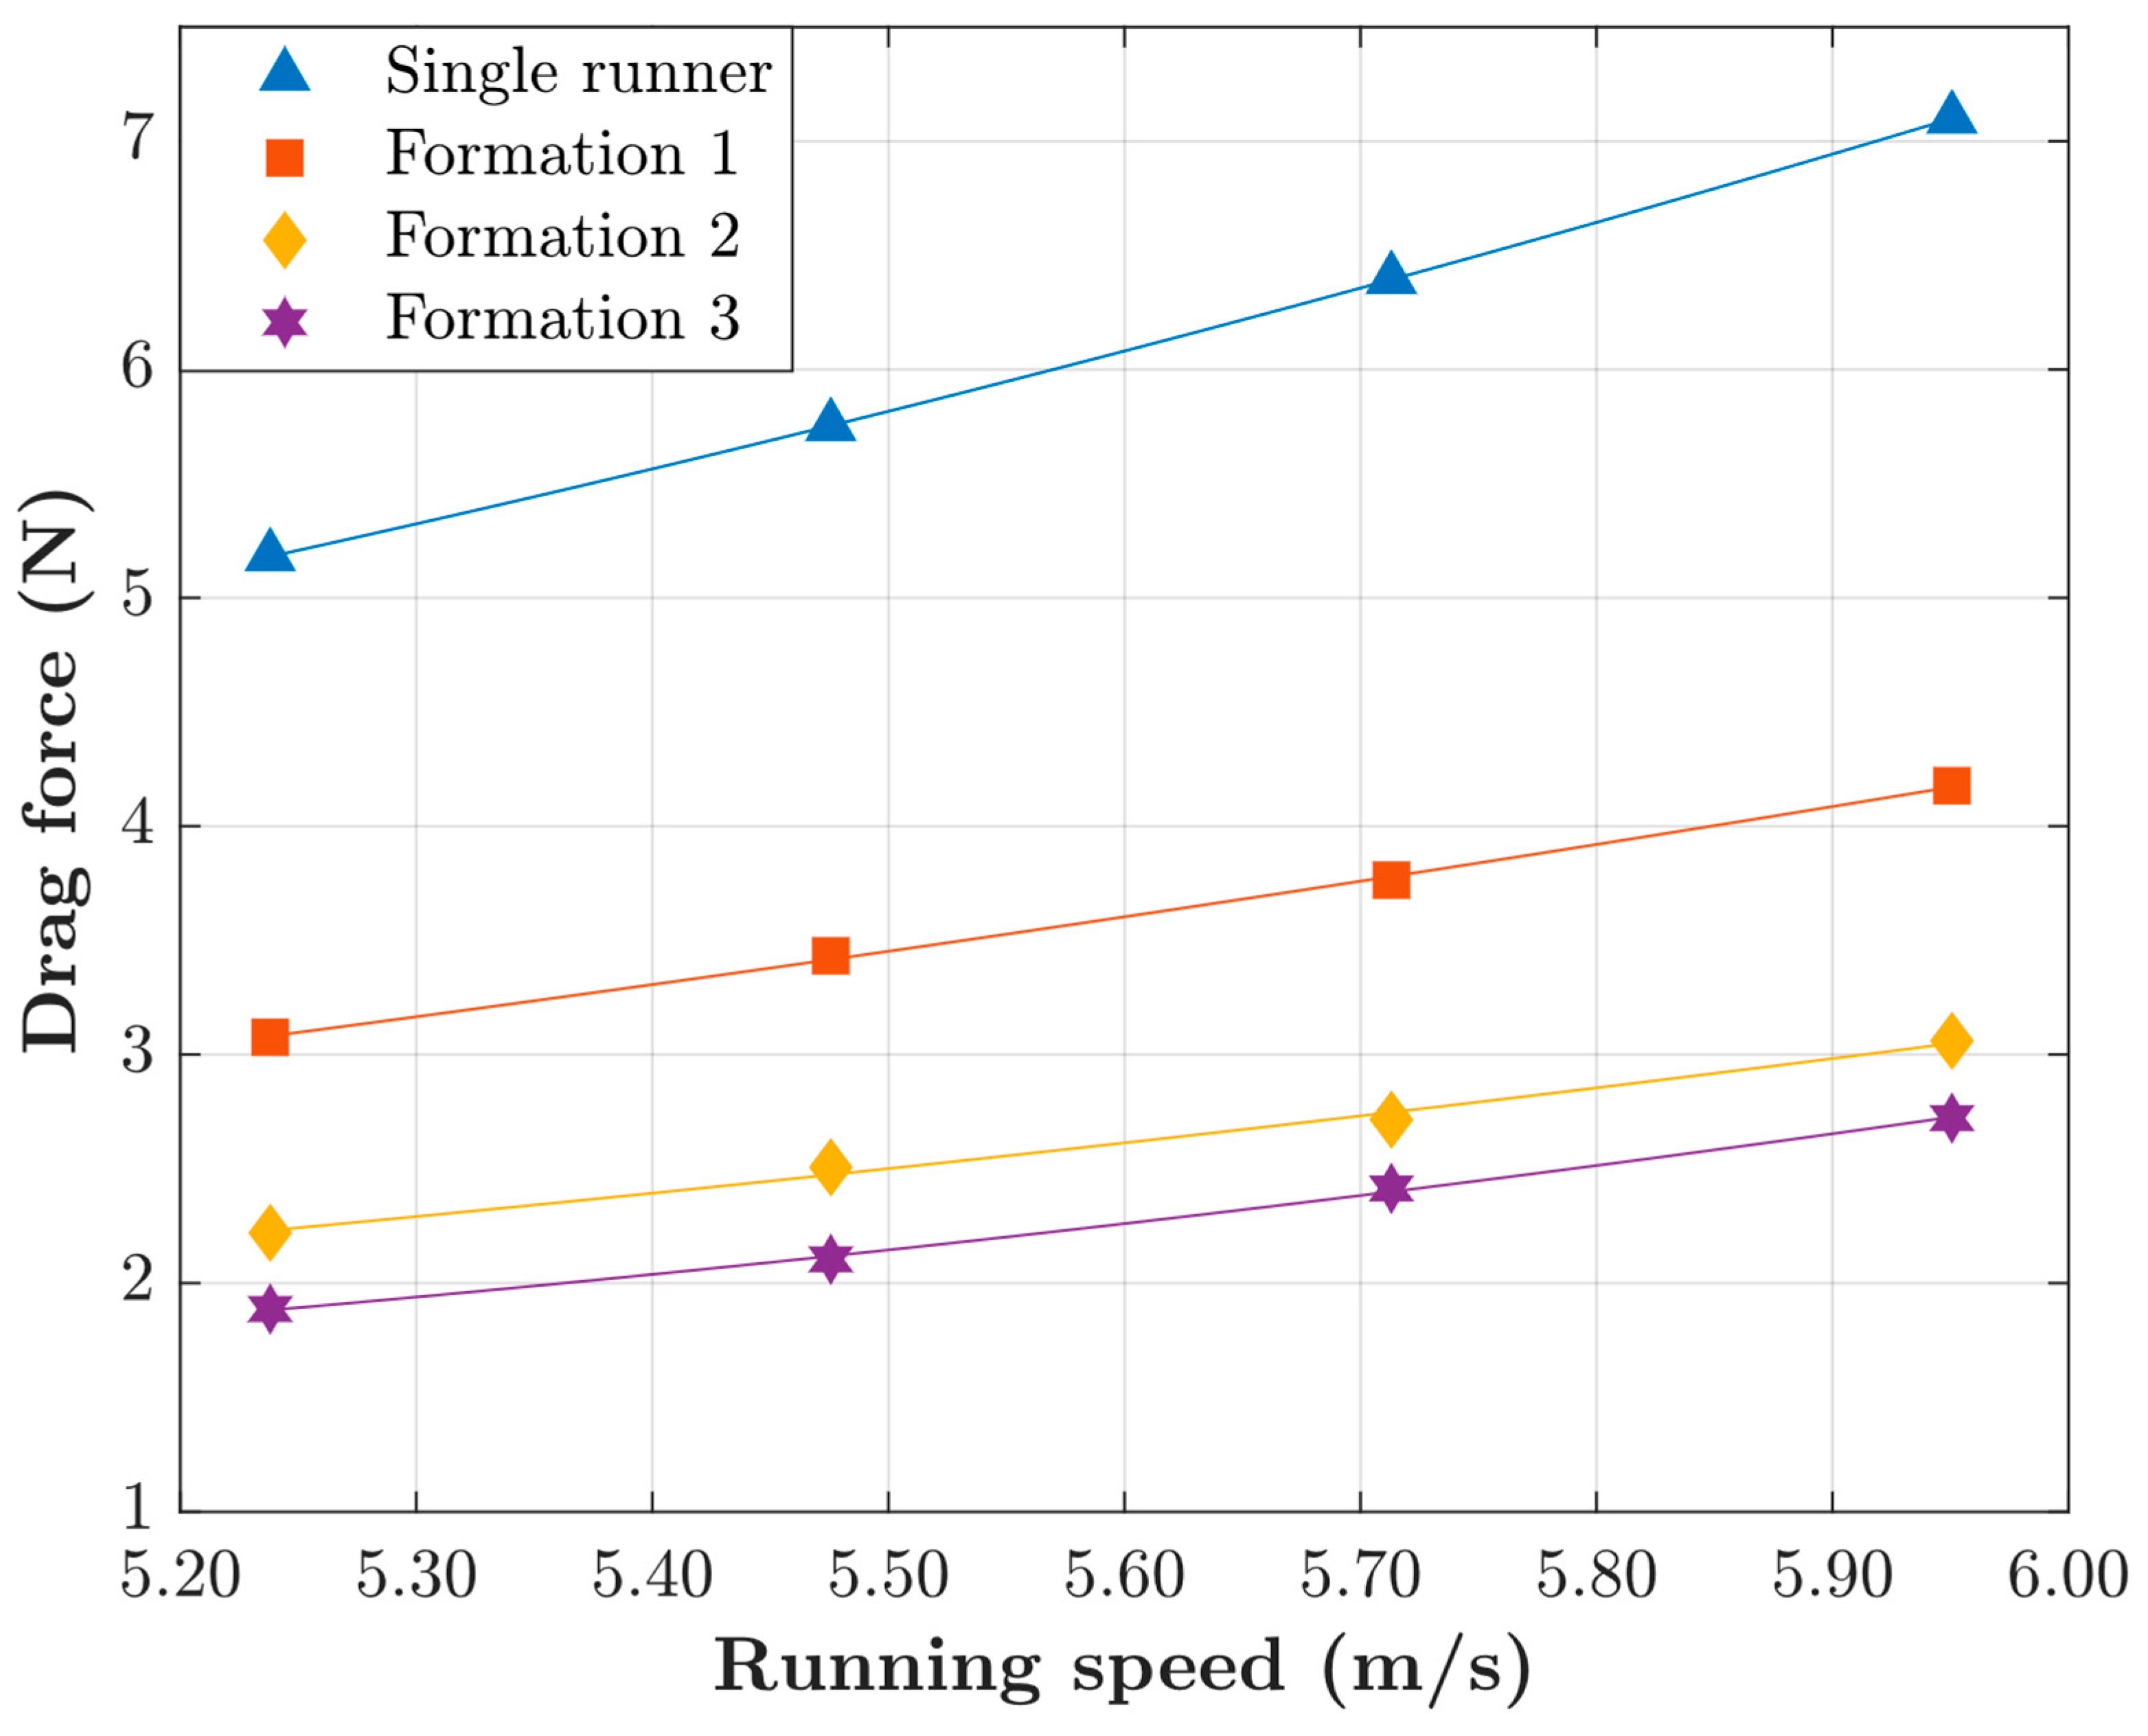
The benefits of drafting are clearly visible. For instance, when Kiptum ran with two pacers in Formation 1, he was in position 1. Simply switching to position 3 instead would result in about 46% less drag. However, if Formation 2 is chosen, the drag reduction is even bigger. For instance, when running in the best position of Formation 2 (position 2), Kiptum would experience a third of the drag experienced during the actual race (Formation 1, position 1).
A similar trend occurs in the portion of the race where one pacer was available: Kiptum ran at his side, at a distance long enough that we may consider him to be in the Single runner formation; had he run in position 2 of formation 3 instead, he would have experienced about 57% less drag.
Plots for the drag force experienced by Kiptum in the mentioned Formations and positions are shown in
Figure 3, along with the second order polynomial fits. Running in the optimal positions of Formations 2 and 3 is, indeed, much more aerodynamically efficient than Formation 1 and the single runner formation.
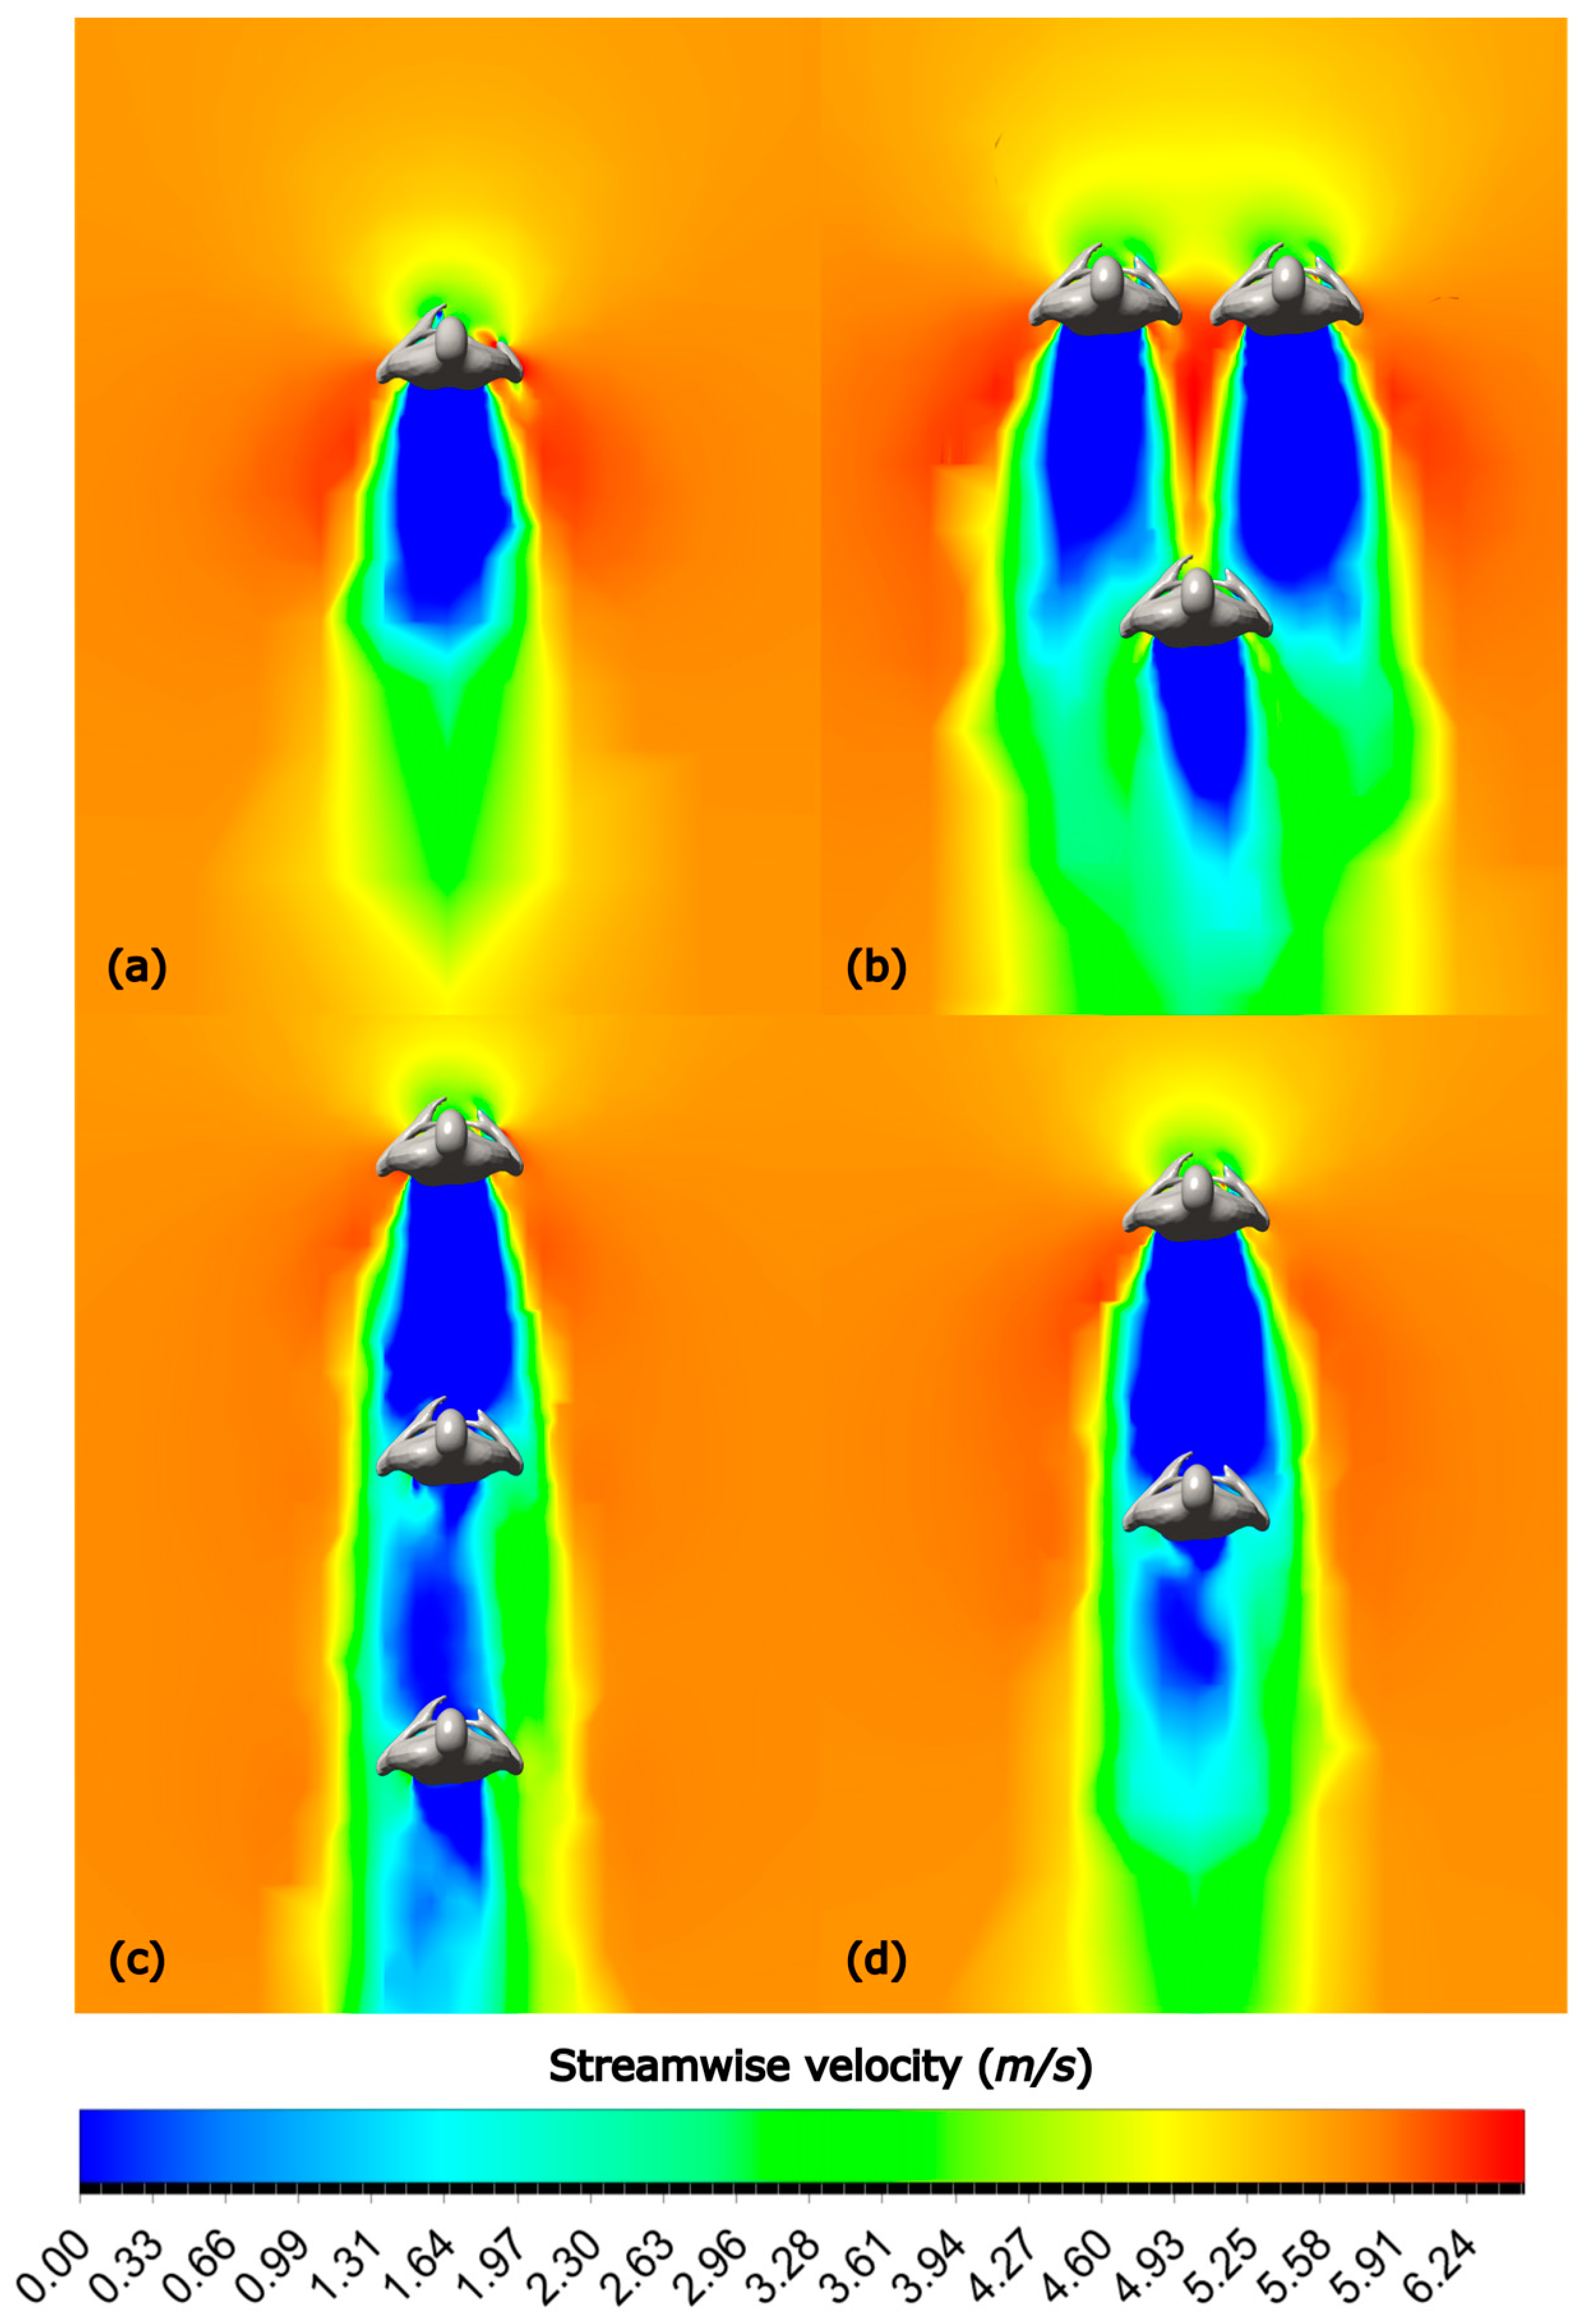
To help further illustrate the superior drag performance of Formations 2 and 3, streamwise velocity contour plots are shown in
Figure 4. For instance, we can compare the baseline case (a), with running in position 2 of Formation 3 (d). The blue patch in front of Kiptum in (d) (i.e., the
wake region of the runner ahead of him) indicates an area of lower streamwise velocity compared to the warmer colors of (a). In fact, the solid blue color indicates an area of almost stagnant air around the torso region, meaning that Kiptum is facing “less wind” when compared to the single runner formation.
A similar effect is seen when comparing Formation 1, position 3 (b) to Formation 2, position 2 (c). In (b), a portion of the runner’s torso is subject to higher velocity flow, as shown by the reddish area between the wake of each pacer in front.
After the determination of the drag values, the power expenditure for each runner during the original race must be determined. This is obtained through a combination of the information present in
Table 1 and
Table 2 and the application of the equations for running power (
), aerodynamic power (
) and total power (
) detailed in section 2.2. The results are shown in
Table 3.
The strongest pacer, Daniel Mateiko, stayed in the race until around
35; it was not possible to identify the other pacer, here referred to as “P4”, the identification visible on his race bib [
26]. As a reminder, the power expenditure of the first
of the race is not considered. We chose not to alter that portion of the race due to other runners and pacers being in close proximity to Kiptum and his pacers.
Now, we shall repeat the same analysis, but using the more aerodynamically efficient formations. Initially, the velocity increase factor, , is chosen as . That means that every portion of the race will be run at exactly the same speed; however, since more efficient running formations are being used, we expect Kiptum to spend less energy than he did in the actual race.
The results are shown in
Table 4. Prior to jumping ahead to results, however, we must provide further detail into the process for obtaining these results. The limiting pacer, i.e., the one who left the race first (P4) will be used to determine when the formation will change. A portion of the table (not shown below) has the instantaneous total running power for each runner at velocity
. That value is multiplied by
to determine the total energy expenditure for each phase of the race.
The process is repeated for the next line until the total energy expenditure exceeds the limit for P4, shown in
Table 3. In our case, we determined that he could not make it to
. Then, by conservation of energy, we determined the time he could spend in the race by running at the same velocity. In our simulated race, P4 left at
(compared to
in the original race. The additional distance was covered in about 16 seconds.
The same procedure is repeated, but now for Daniel Mateiko. In this scenario, he exits the race in (compared to in the original race). Kiptum then runs the unprotected portion of the race, finishing at the same time as previously. As expected, his total energy during the simulated race is less than that of the original race ( against ). By running at exactly the same pace but using our drafting strategy, Kiptum spent less energy.
Naturally, our next step is to gradually increment the
velocity increase factor,
, to determine how much faster Kiptum can run without exhausting his original race energy. This laborious process was implemented in MATLAB. The only difference is that, now, since each portion of the race is being run slightly faster, the total race time will be lower.
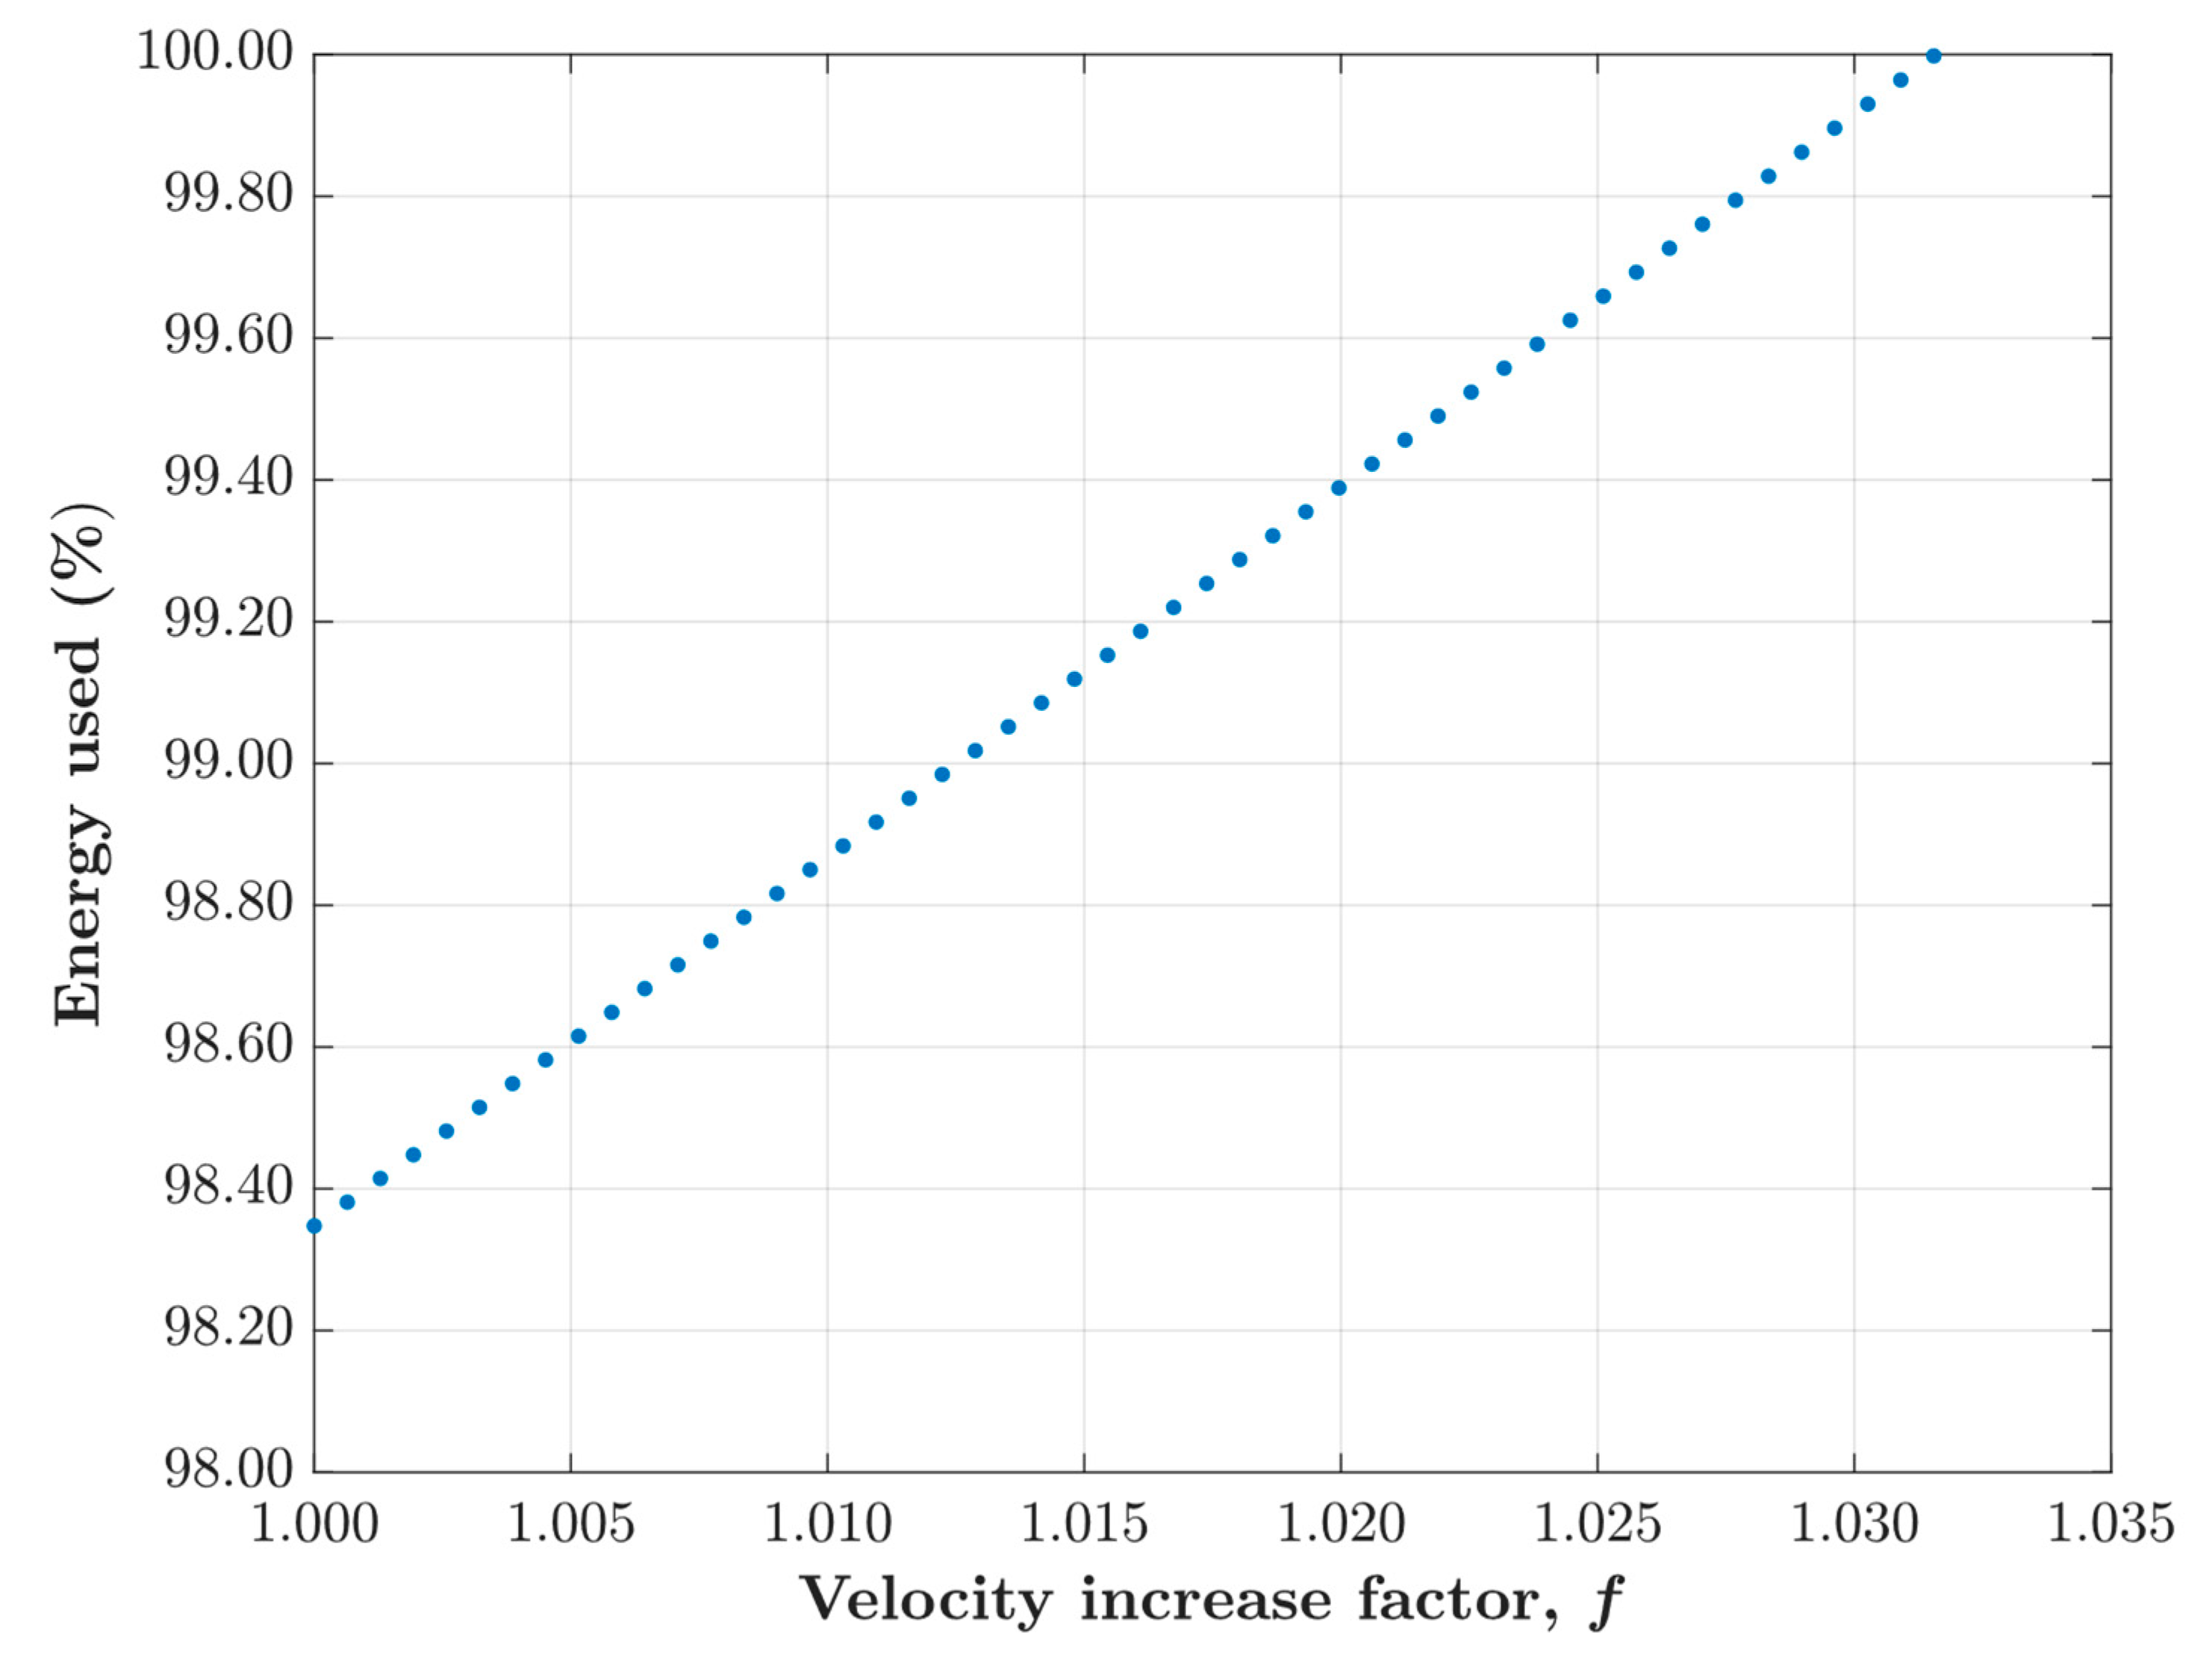
Figure 5 shows that, as
is increased, Kiptum spends more of his available energy, as expected. When
(a velocity increase of
throughout the entire race), his energy is exhausted, meaning that this is the fastest he could realistically run the race using our pacing strategy.
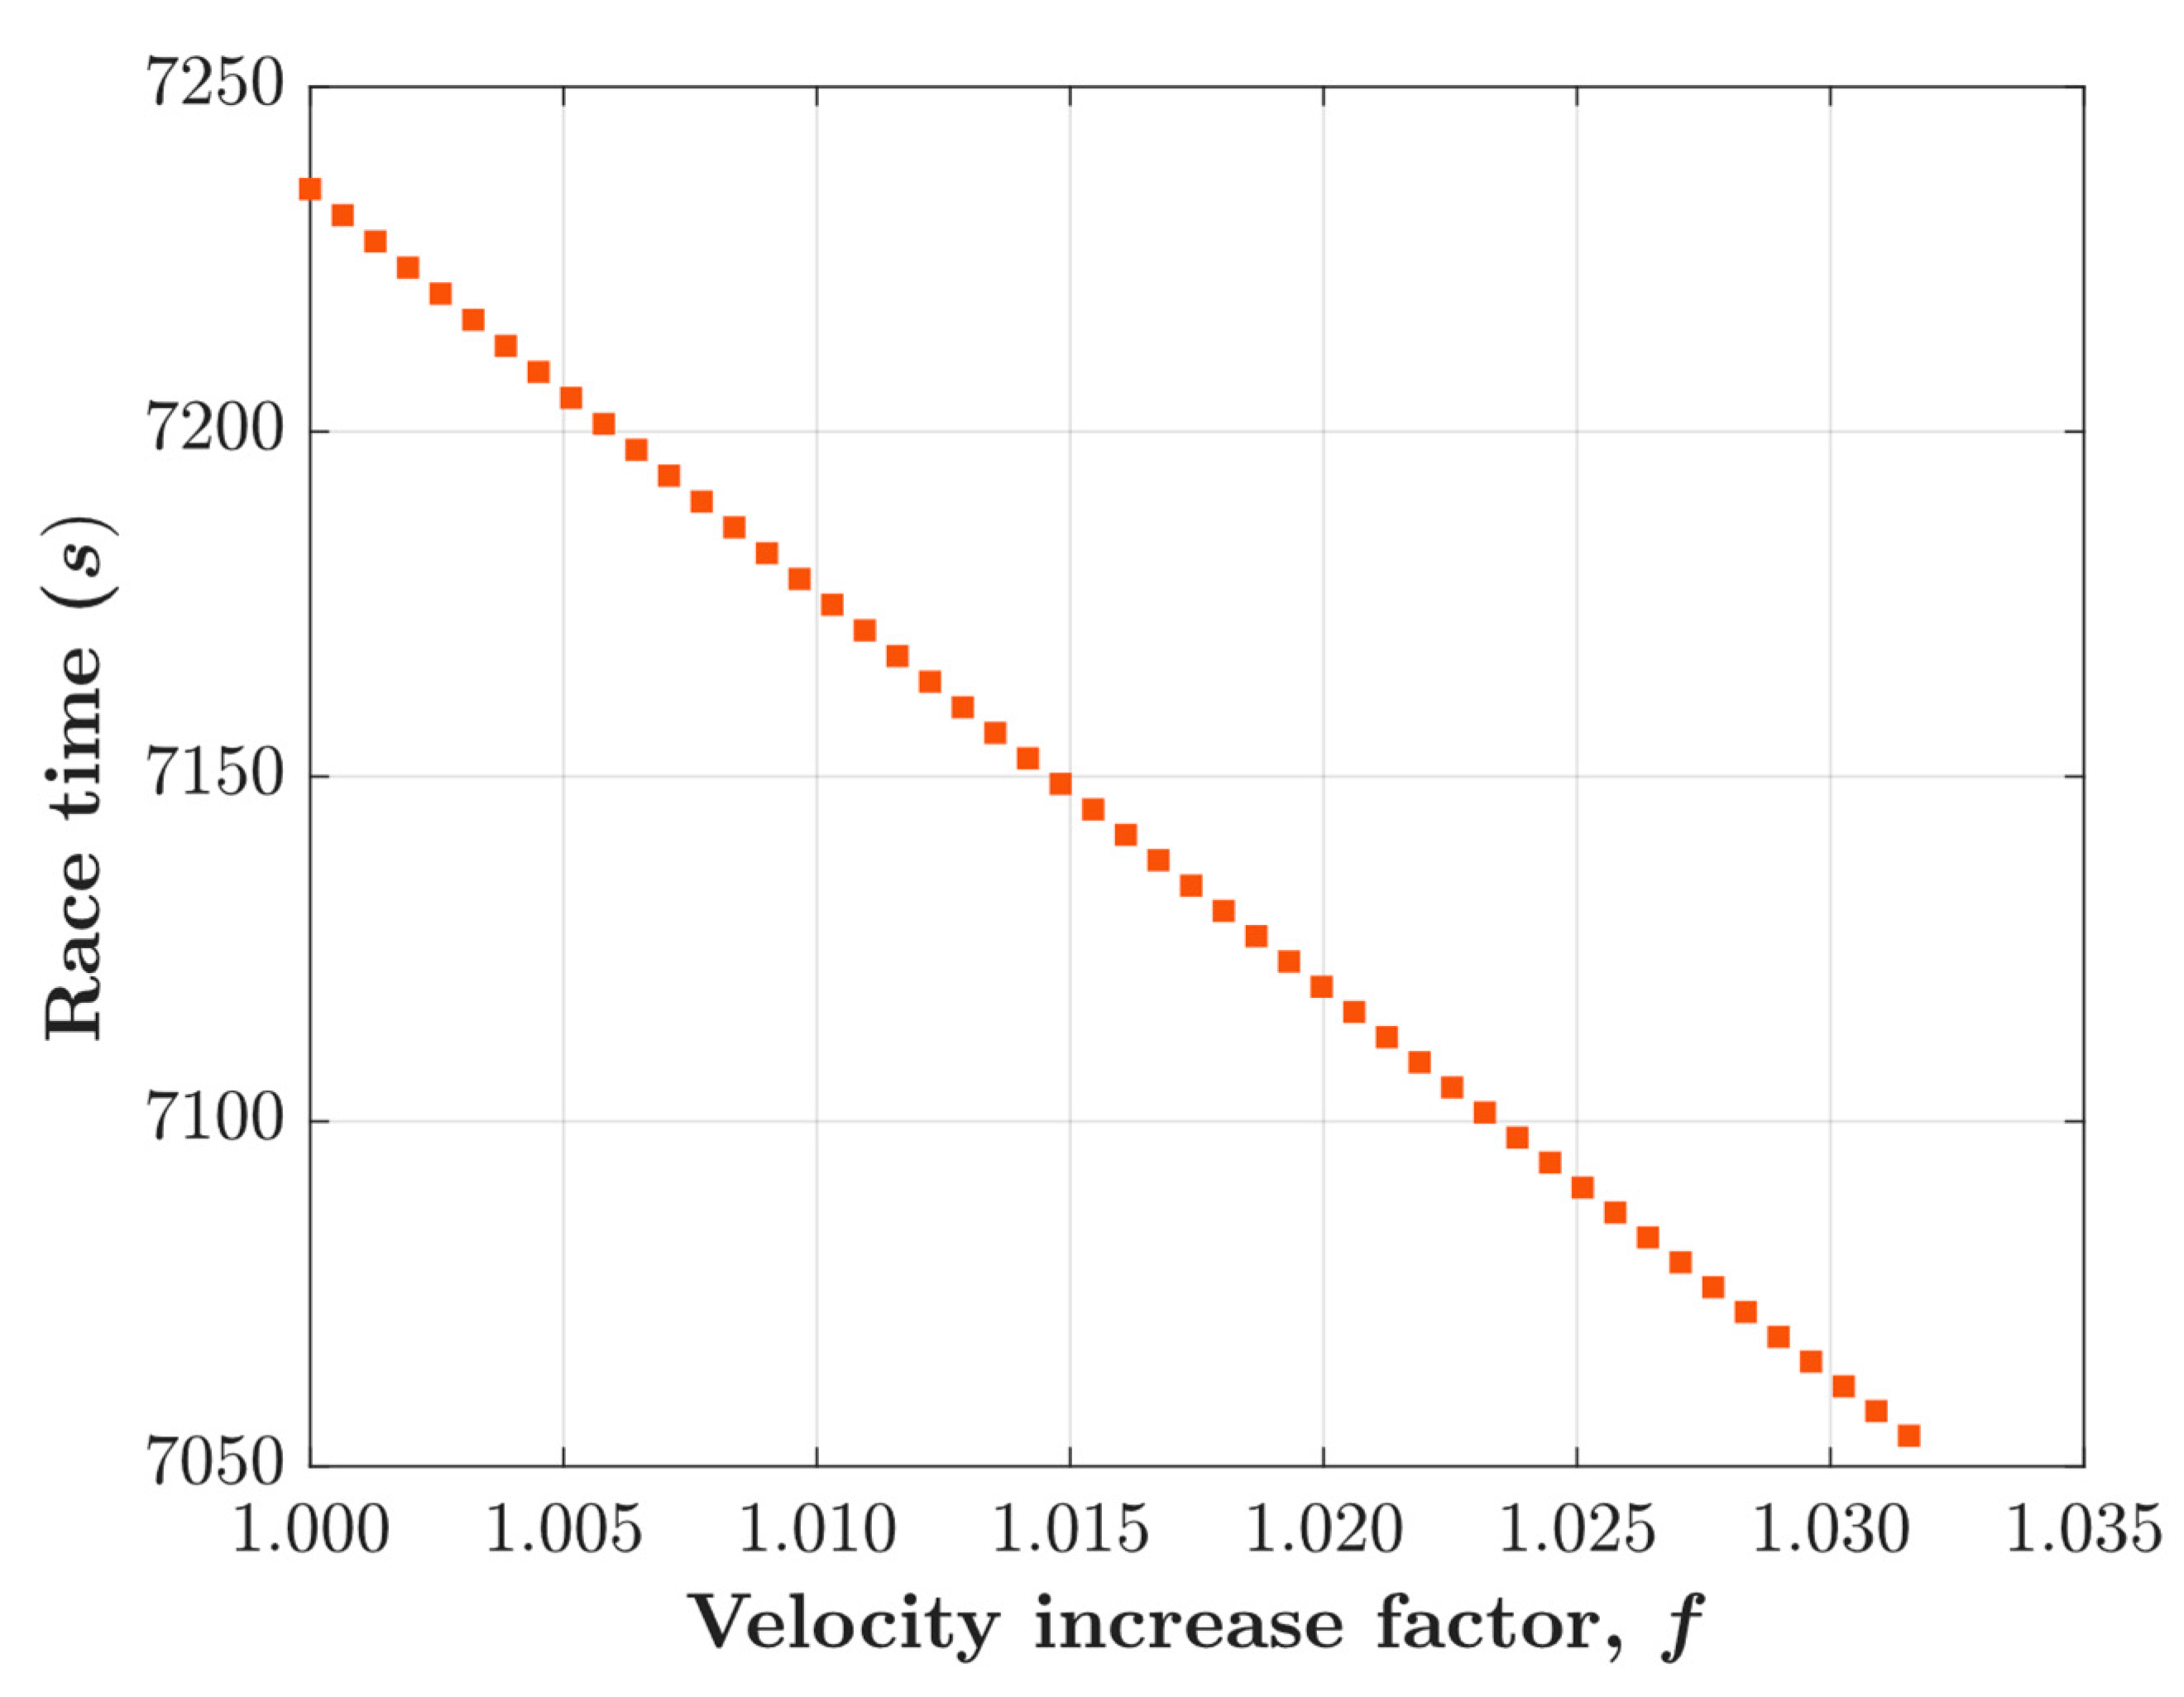
Finally,
Figure 6 shows the highlight of our performance predictions: if Kiptum increases his velocity by
throughout the entire race, his finish time will be of
seconds,
, a full three minutes faster than his already record-breaking race. In fact, the margin of improvement is so impressive that if he runs the race a mere
faster than originally, a finish time of under two hours is possible; in that scenario, Kiptum would use about
of his available energy.
The huge margin for improvement shows that, if Kiptum keeps his current running form and adopts drafting to improve his performance, the breaking of the two hour barrier for the official marathon is a matter of time.
5. Conclusion
In the present work, we evaluate Kelvin Kiptum’s incredible marathon record through a drag perspective. The power expenditures for Kiptum and his pacers were obtained for the race. Alternative drafting formations were studied, and their superior drag performance was illustrated. Through the application of the energy conservation principle, we proved that the adequate use of drafting could allow Kiptum to increase his race velocity by up to , resulting in a finish time of 1:57:34. The huge potential for improvement over his already record-setting time (2:00:35) shows that we may be very close to witnessing the breaking of the two hour barrier for official marathons.
Author contributions
both authors have contributed in all phases of the project, as well as in the preparation of the manuscript.
Funding information
no funding was used in this research project.
Conflict of interest
the authors declare no conflicts of interest.
References
- Edwards, A.G.; Byrnes, W.C. Aerodynamic Characteristics as Determinants of the Drafting Effect in Cycling. Med. Sci. Sports Exerc. 2007, 39, 170–176. [Google Scholar] [CrossRef]
- Blocken, B.; Toparlar, Y.; van Druenen, T.; Andrianne, T. Aerodynamic drag in cycling team time trials. J. Wind. Eng. Ind. Aerodyn. 2018, 182, 128–145. [Google Scholar] [CrossRef]
- Malizia, F.; Blocken, B. Bicycle aerodynamics: History, state-of-the-art and future perspectives. J. Wind. Eng. Ind. Aerodyn. 2020, 200, 104134. [Google Scholar] [CrossRef]
- Blocken, B.; Defraeye, T.; Koninckx, E.; Carmeliet, J.; Hespel, P. CFD simulations of the aerodynamic drag of two drafting cyclists. Comput. Fluids 2013, 71, 435–445. [Google Scholar] [CrossRef]
- Belloli, M.; Giappino, S.; Robustelli, F.; Somaschini, C. Drafting Effect in Cycling: Investigation by Wind Tunnel Tests. Procedia Eng. 2016, 147, 38–43. [Google Scholar] [CrossRef]
- Katz, J. Race Car Aerodynamics: Designing for Speed, 2nd ed.; Bentley Publishers: Cambridge, MA, USA, 1996. [Google Scholar]
- Romberg, G.F.; Chianese, F.; Lajoie, R.G. Aerodynamics of Race Cars in Drafting and Passing Situations. presented at the 1971 Automotive Engineering Congress and Exposition; 1971; p. 710213. [Google Scholar]
- Rundell, K. W. Effects of drafting during short-track speed skating. Med. Sci. Sports Exerc. 1996, 28, 765–771. [Google Scholar] [CrossRef]
- Gray, G.L.; Matheson, G.O.; McKenzie, D.C. The Metabolic Cost of Two Kayaking Techniques. Int. J. Sports Med. 1995, 16, 250–254. [Google Scholar] [CrossRef]
- Bilodeau, B.; Roy, B.; Boulay, M.R. Effect of drafting on heart rate in cross-country skiing. Med. Sci. Sports Exerc. 1994, 26, 637–641. [Google Scholar] [CrossRef]
- Chatard, J.-C.; Chollet, D.; Millet, G. Performance and drag during drafting swimming in highly trained triathletes. Med. Sci. Sports Exerc. 1998, 30, 1276–1280. [Google Scholar] [CrossRef]
- Chollet, D.; Hue, O.; Auclair, F.; Millet, G.; Chatard, J.C. The effects of drafting on stroking variations during swimming in elite male triathletes. Eur. J. Appl. Physiol. 2000, 82, 413–417. [Google Scholar] [CrossRef]
- Pugh, L.G.C.E. Oxygen intake in track and treadmill running with observations on the effect of air resistance. J. Physiol. 1970, 207, 823–835. [Google Scholar] [CrossRef]
- Barnes, K.R.; Kilding, A.E. Running economy: measurement, norms, and determining factors. Sports Med. Open 2015, 1, 8. [Google Scholar] [CrossRef]
- Tartaruga, M.P.; Mota, C.B.; Peyré-Tartaruga, L.A.; Brisswalter, J. Scale Model on Performance Prediction in Recreational and Elite Endurance Runners. Int. J. Sports Physiol. Perform. 2014, 9, 650–655. [Google Scholar] [CrossRef]
- International Association of Athletics Federations, Competition Rules 2016-2017. 2015.
- Hoogkamer, W.; Snyder, K.L.; Arellano, C.J. Modeling the Benefits of Cooperative Drafting: Is There an Optimal Strategy to Facilitate a Sub-2-Hour Marathon Performance? Sports Med. 2018, 48, 2859–2867. [Google Scholar] [CrossRef]
- Polidori, G.; Legrand, F.; Bogard, F.; Madaci, F.; Beaumont, F. Numerical investigation of the impact of Kenenisa Bekele’s cooperative drafting strategy on its running power during the 2019 Berlin marathon. J. Biomech. 2020, 107, 109854. [Google Scholar] [CrossRef]
- Schickhofer, L.; Hanson, H. Aerodynamic effects and performance improvements of running in drafting formations. J. Biomech. 2021, 122, 110457. [Google Scholar] [CrossRef]
- The sub 2-hour official marathon is possible: developing a drafting strategy for a historic breakthrough in sports. Available online: https://www.researchsquare.com (accessed on 19 October 2023).
- “Kelvin Kiptum,” Wikipedia. Oct. 15, 2023. Available online: https://en.wikipedia.org/w/index.php?title=Kelvin_Kiptum&oldid=1180209382 (accessed on 18 October 2023).
- Crouch, T.N.; Burton, D.; Thompson, M.C.; Brown, N.A.; Sheridan, J. Dynamic leg-motion and its effect on the aerodynamic performance of cyclists. J. Fluids Struct. 2016, 65, 121–137. [Google Scholar] [CrossRef]
- Menter, F.R. Two-equation eddy-viscosity turbulence models for engineering applications. AIAA J. 1994, 32, 1598–1605. [Google Scholar] [CrossRef]
- Götten, F.; Finger, D.; Marino, M.; Bil, C.; Havermann, M.; Braun, C. A review of guidelines and best practices for subsonic aerodynamic simulations using RANS CFD. 2019. [Google Scholar]
- White, F. Fluid Mechanics, 7th ed.; McGraw-Hill Science/Engineering/Math: New York, NY, 2010. [Google Scholar]
- “Watch: Full 2023 Bank of America Chicago Marathon Broadcast,” NBC Chicago. Available online: https://www.nbcchicago.com/news/sports/chicago-marathon/watch-full-2023-bankof-america-chicago-marathon-broadcast/3245741/ (accessed on 12 October 2023).
- Fukunaga, T.; Matsuo, A.; Yuasa, K.; Fujimatsu, H.; Asahina, K. Effect of running velocity on external mechanical power output. Ergonomics 1980, 23, 123–136. [Google Scholar] [CrossRef]
- Cavagna, G.A.; Kaneko, M. Mechanical work and efficiency in level walking and running. J. Physiol. 1977, 268, 467–481. [Google Scholar] [CrossRef]
- A Cavagna, G.; Dusman, B.; Margaria, R.; Fletcher, J.R.; MacIntosh, B.R.; Walshe, A.D.; Wilson, G.J.; Ettema, G.J.C.; Takarada, Y.; Hirano, Y.; et al. Positive work done by a previously stretched muscle. J. Appl. Physiol. 1968, 24, 21–32. [Google Scholar] [CrossRef]
- “Bank of America Chicago Marathon: Kelvin Kiptum Details,” Mika timing. Available online: https://results.chicagomarathon.com/2023/?content=detail&event=MAR&idp=9TGG963828AFFB&pid=search&search%5Bname%5D=kiptum (accessed on 12 October 2023).
|
Disclaimer/Publisher’s Note: The statements, opinions and data contained in all publications are solely those of the individual author(s) and contributor(s) and not of MDPI and/or the editor(s). MDPI and/or the editor(s) disclaim responsibility for any injury to people or property resulting from any ideas, methods, instructions or products referred to in the content. |
© 2023 by the authors. Licensee MDPI, Basel, Switzerland. This article is an open access article distributed under the terms and conditions of the Creative Commons Attribution (CC BY) license (http://creativecommons.org/licenses/by/4.0/).
