Submitted:
24 October 2023
Posted:
26 October 2023
You are already at the latest version
Abstract
Keywords:
1. Introduction
2. Materials and Methods
2.1. Sample Collection
2.2. Sample Analysis
3. Results and Discussions
3.1. Physical Parameters
3.2. Chemical Parameters
pH
COD
BOD
Alkalinity
Dissolved Oxygen
Chloride
Iron
Carbon Dioxide
Arsenic
3.3. Quantity of the AC Condensate Water
4. Conclusion
Funding
Conflict of Interest
References
- [1] S. Dos Santos et al., “Urban growth and water access in sub-Saharan Africa: Progress, challenges, and emerging research directions,” Science of the Total Environment, vol. 607, pp. 497–508, 2017. [CrossRef]
- [2] V. A. Tzanakakis, N. V. Paranychianakis, and A. N. Angelakis, Water supply and water scarcity, vol. 12, no. 9. MDPI, 2020, p. 2347. [CrossRef]
- [3] W. A. Jury and H. J. Vaux Jr, “The emerging global water crisis: managing scarcity and conflict between water users,” Advances in agronomy, vol. 95, pp. 1–76, 2007. [CrossRef]
- [4] P. Roy, M. A. Ahmed, M. Islam, M. Azad, M. Islam, and M. Islam, Water Supply, Sanitation System and Water-borne Diseases of Slum Dwellers of Bastuhara Colony, Khulna. 2020.
- [5] K. Azharul Haq, “Water management in Dhaka,” Water Resources Development, vol. 22, no. 2, pp. 291–311, 2006.
- [6] M. S. H. Swapan, A. U. Zaman, T. Ahsan, and F. Ahmed, “Transforming urban dichotomies and challenges of South Asian megacities: Rethinking sustainable growth of Dhaka, Bangladesh,” Urban Science, vol. 1, no. 4, p. 31, 2017. [CrossRef]
- [7] A. M. Dewan, M. H. Kabir, K. Nahar, and M. Z. Rahman, “Urbanisation and environmental degradation in Dhaka Metropolitan Area of Bangladesh,” International Journal of Environment and Sustainable Development, vol. 11, no. 2, pp. 118–147, 2012. [CrossRef]
- [8] D. Singha and D. S. Kendra, “Water initiative for the urban poor,” 2002.
- [9] M. A. Baten, K. S. Lisa, and A. S. Chowdhury, “Water supply of Dhaka city: present context and future scenarios,” in Water security in Asia: Opportunities and challenges in the context of climate change, Springer, 2021, pp. 351–367. [CrossRef]
- [10] M. E. Haque, “Study on surface water availability for future water demand for Dhaka city,” 2018.
- [11] M. Moshfika, “Development of adaptation strategies to groundwater level declination in Dhaka city,” 2021.
- [12] S. Uddin, A. Omar, and M. A. Alam, “Assessment of quantity and quality of condensate water from air conditioners,” in Proceedings of the 2nd International Conference on Water and Environmental Engineering (iCWEE2019), 2019, pp. 84–93.
- [13] M. Shibly Anwar, “Potentials for water conservation in Dhaka city,” 2010.
- [14] T. Chaki, “Efficient hydraulic modelling of water distribution system for a selected district metered area of Dhaka city,” 2017.
- [15] G. M. Islam, “Sustainable management of Dhaka city water supply through district metering area approach: a case study,” 2018.
- [16] K. E. Furst et al., “Effects of Intrusion on Disinfection Byproduct Formation in Intermittent Distribution Systems,” ACS ES&T Water, vol. 2, no. 5, pp. 807–816, 2022. [CrossRef]
- [17] F. S. Khan, “Assessment of water quality at DND conveyance canal and its implications on treated water quality at Saidabad water treatment plant,” 2008.
- [18] A. M. Hossain, J. Fien, and R. Horne, “Megacity Dhaka as example of water security syndrome for the developing world: implications for sustainability science”.
- [19] D. W. Smith et al., “Chlorine taste can increase simulated exposure to both fecal contamination and disinfection byproducts in water supplies,” Water Research, vol. 207, p. 117806, 2021. [CrossRef]
- [20] M. A. Hoque, M. M. Hoque, and K. M. Ahmed, “Declining groundwater level and aquifer dewatering in Dhaka metropolitan area, Bangladesh: causes and quantification,” Hydrogeology Journal, vol. 15, pp. 1523–1534, 2007. [CrossRef]
- [21] S. K. Roy and A. Zahid, “Assessment of declining groundwater levels due to excessive pumping in the Dhaka District of Bangladesh,” Environ Earth Sci, vol. 80, no. 8, p. 333, Apr. 2021. [CrossRef]
- [22] M. Moshfika, S. Biswas, and M. S. Mondal, “Assessing Groundwater Level Declination in Dhaka City and Identifying Adaptation Options for Sustainable Water Supply,” Sustainability, vol. 14, no. 3, Art. no. 3, Jan. 2022. [CrossRef]
- [23] M. Islam, M. Van Camp, D. Hossain, M. M. R. Sarker, S. Khatun, and K. Walraevens, “Impacts of Large-Scale Groundwater Exploitation Based on Long-Term Evolution of Hydraulic Heads in Dhaka City, Bangladesh,” Water, vol. 13, no. 10, Art. no. 10, Jan. 2021. [CrossRef]
- [24] M. K. Hasan, A. Shahriar, and K. U. Jim, “Water pollution in Bangladesh and its impact on public health,” Heliyon, vol. 5, no. 8, p. e02145, Aug. 2019. [CrossRef]
- [25] N. T. Chowdhury, “Water management in Bangladesh: an analytical review,” Water Policy, vol. 12, no. 1, pp. 32–51, Nov. 2009. [CrossRef]
- [26] M. A. H. Bhuiyan, M. A. Rakib, S. B. Dampare, S. Ganyaglo, and S. Suzuki, “Surface water quality assessment in the central part of Bangladesh using multivariate analysis,” KSCE J Civ Eng, vol. 15, no. 6, pp. 995–1003, Jul. 2011. [CrossRef]
- [27] M. A. H. Bhuiyan et al., “Investigation of the possible sources of heavy metal contamination in lagoon and canal water in the tannery industrial area in Dhaka, Bangladesh,” Environ Monit Assess, vol. 175, no. 1, pp. 633–649, Apr. 2011. [CrossRef]
- [28] Md. Bodrud-Doza, S. M. D.-U. Islam, T. Rume, S. B. Quraishi, M. S. Rahman, and M. A. H. Bhuiyan, “Groundwater quality and human health risk assessment for safe and sustainable water supply of Dhaka City dwellers in Bangladesh,” Groundwater for Sustainable Development, vol. 10, p. 100374, Apr. 2020. [CrossRef]
- [29] Md. A. Ahmed, M. Hossain, and M. Islam, Prediction of Solid Waste Generation Rate and Determination of Future Waste Characteristics at South-western Region of Bangladesh Using Artificial Neural Network. KUET, Khulna, Bangladesh: WasteSafe 2017, KUET, Khulna, Bangladesh, 2017.
- [30] H. B. Sharma et al., “Challenges, opportunities, and innovations for effective solid waste management during and post COVID-19 pandemic,” Resources, Conservation and Recycling, vol. 162, p. 105052, Nov. 2020. [CrossRef]
- [31] Md. A. Ahmed and S. M. Moniruzzaman, A Study on Plastic Waste Recycling Process in Khulna City. KUET, Khulna, Bangladesh: 4th International Conference on Civil Engineering for Sustainable Development (ICCESD 2018), KUET, Khulna, Bangladesh, 2018.
- [32] P. Kjeldsen, M. A. Barlaz, A. P. Rooker, A. Baun, A. Ledin, and T. H. Christensen, “Present and Long-Term Composition of MSW Landfill Leachate: A Review,” Critical Reviews in Environmental Science and Technology, vol. 32, no. 4, pp. 297–336, Oct. 2002. [CrossRef]
- [33] Md. M. Rahman, D. B. P. Argha, and M. Haque, PRESENT SCENARIO OF MUNICIPAL SOLID WASTE MANAGEMENT IN SATKHIRA MUNICIPALITY. 2018.
- [34] M. A. Ahmed and S. D. Chakrabarti, “SCENARIO OF EXISTING SOLID WASTE MANAGEMENT PRACTICES AND INTEGRATED SOLID WASTE MANAGEMENT MODEL FOR DEVELOPING COUNTRY WITH REFERENCE TO JHENAIDAH MUNICIPALITY, BANGLADESH,” presented at the 4 th International Conference on Civil Engineering for Sustainable Development (ICCESD 2018), Khulna, Bangladesh: Department of Civil Engg., KUET, Feb. 2018.
- [35] H. Wang et al., “Water and Wastewater Treatment in Africa – Current Practices and Challenges,” CLEAN – Soil, Air, Water, vol. 42, no. 8, pp. 1029–1035, 2014. [CrossRef]
- [36] T. Khan, D. B. P. Argha, and M. S. Anita, An Analysis of Existing Medical Waste Management and Possible Health Hazards in Jhenaidah Municipality. 2021.
- [37] G. Lee and R. Jones, “Municipal solid waste management: Long-term public health and environmental protection,” Jan. 1991.
- [38] E. C. Manfredi et al., “Solid Waste and Water Quality Management Models for Sagarmatha National Park and Buffer Zone, Nepal,” mred, vol. 30, no. 2, pp. 127–142, May 2010. [CrossRef]
- [39] A. K. Ziraba, T. N. Haregu, and B. Mberu, “A review and framework for understanding the potential impact of poor solid waste management on health in developing countries,” Archives of Public Health, vol. 74, no. 1, p. 55, Dec. 2016. [CrossRef]
- [40] P. Roy, Md. A. Ahmed, and Md. H. Shah, “Biogas generation from kitchen and vegetable waste in replacement of traditional method and its future forecasting by using ARIMA model,” Waste Dispos. Sustain. Energy, vol. 3, no. 2, pp. 165–175, Jun. 2021. [CrossRef]
- [41] P. Merlin Christy, L. R. Gopinath, and D. Divya, “A review on anaerobic decomposition and enhancement of biogas production through enzymes and microorganisms,” Renewable and Sustainable Energy Reviews, vol. 34, pp. 167–173, Jun. 2014. [CrossRef]
- [42] Md. A. Ahmed, P. Roy, A. Bari, and M. Azad, Conversion of Cow Dung to Biogas as Renewable Energy Through Mesophilic Anaerobic Digestion by Using Silica Gel as Catalyst, 5th ed. Chittagong: ICMERE 2019, Chittagong University of Engineering & Technology (CUET), 2019.
- [43] M. A. Ahmed, P. Roy, M. H. Shah, D. P. Argha, D. Datta, and R. H. Ri̇yad, “Recycling of cotton dust for organic farming is a pivotal replacement of chemical fertilizers by composting and its quality analysis,” ERT, vol. 4, no. 2, Art. no. 2, Jun. 2021. [CrossRef]
- [44] L. Deng et al., “Application and development of biogas technology for the treatment of waste in China,” Renewable and Sustainable Energy Reviews, vol. 70, pp. 845–851, Apr. 2017. [CrossRef]
- [45] R. F. de P. V. Marques, A. M. da Silva, L. dos S. Rodrigues, and G. Coelho, “Impacts of urban solid waste disposal on the quality of surface water in three cities of Minas Gerais - Brazil,” Ciênc. agrotec., vol. 36, pp. 684–692, Dec. 2012. [CrossRef]
- [46] G. Chen et al., “Environmental, energy, and economic analysis of integrated treatment of municipal solid waste and sewage sludge: A case study in China,” Science of The Total Environment, vol. 647, pp. 1433–1443, Jan. 2019. [CrossRef]
- [47] A. Ahmad et al., “Effect of sewage sludge biochar on the soil nutrient, microbial abundance, and plant biomass: A sustainable approach towards mitigation of solid waste,” Chemosphere, vol. 287, p. 132112, Jan. 2022. [CrossRef]
- [48] M. R. Rashid and M. Ashik, “Evaluation of Physicochemical Treatment Technologies for Landfill Leachate Induced Dissolved Organic Nitrogen (DON).,” AEESP Research and Education Conference, Northeastern University, June 20-23, 2023, Jun. 2023, Accessed: Sep. 10, 2023. [Online]. Available: https://par.nsf.gov/biblio/10431232-evaluation-physicochemical-treatment-technologies-landfill-leachate-induced-dissolved-organic-nitrogen-don.
- [49] H. Tutu, Water Quality. BoD – Books on Demand, 2017.
- [50] M. A. Ahmed* and M. Redowan, “Fate and Transport of the Biologically Treated Landfill Leachate Induced Dissolved Organic Nitrogen (DON),” AEESP Research and Education Conference, Northeastern University, June 20-23, 2023, Jun. 2023, Accessed: Sep. 10, 2023. [Online]. Available: https://par.nsf.gov/biblio/10431230-fate-transport-biologically-treated-landfill-leachate-induced-dissolved-organic-nitrogen-don.
- [51] R. O. Carey and K. W. Migliaccio, “Contribution of Wastewater Treatment Plant Effluents to Nutrient Dynamics in Aquatic Systems: A Review,” Environmental Management, vol. 44, no. 2, pp. 205–217, Aug. 2009. [CrossRef]
- [52] K. Roy, Q. Bari, S. Mostakim, and D. B. P. Argha, Water Supply History of Khulna City. 2019.
- [53] G. Hutton and C. Chase, “Water Supply, Sanitation, and Hygiene,” in Injury Prevention and Environmental Health, 3rd ed., C. N. Mock, R. Nugent, O. Kobusingye, and K. R. Smith, Eds., Washington (DC): The International Bank for Reconstruction and Development / The World Bank, 2017. Accessed: Oct. 23, 2023. [Online]. Available: http://www.ncbi.nlm.nih.gov/books/NBK525207/.
- 54] P. Roy, M. A. Ahmed, and A. Kumer, “AN OVERVIEW OF HYGIENE PRACTICES AND HEALTH RISKS RELATED TO STREET FOODS AND DRINKING WATER FROM ROADSIDE RESTAURANTS OF KHULNA CITY OF BANGLADESH,” EJERE, vol. 3, no. 2, Art. no. 2, Dec. 2019, Accessed: Aug. 08, 2023. [Online]. Available: https://dergipark.org.tr/en/pub/ejere/issue/49620/590483.
- [55] G. Hutton and C. Chase, “The Knowledge Base for Achieving the Sustainable Development Goal Targets on Water Supply, Sanitation and Hygiene,” International Journal of Environmental Research and Public Health, vol. 13, no. 6, Art. no. 6, Jun. 2016. [CrossRef]
- [56] L. Rodić and D. C. Wilson, “Resolving Governance Issues to Achieve Priority Sustainable Development Goals Related to Solid Waste Management in Developing Countries,” Sustainability, vol. 9, no. 3, Art. no. 3, Mar. 2017. [CrossRef]
- [57] R. K. Henry, Z. Yongsheng, and D. Jun, “Municipal solid waste management challenges in developing countries – Kenyan case study,” Waste Management, vol. 26, no. 1, pp. 92–100, Jan. 2006. [CrossRef]
- [58] S. C. Jhansi and S. K. Mishra, “Wastewater Treatment and Reuse: Sustainability Options,” Consilience, no. 10, pp. 1–15, 2013, Accessed: Oct. 23, 2023. [Online]. Available: https://www.jstor.org/stable/26476137.
- [59] M. S. Winkler et al., “Sanitation safety planning as a tool for achieving safely managed sanitation systems and safe use of wastewater,” WHO South-East Asia Journal of Public Health, vol. 6, no. 2, p. 34, Sep. 2017. [CrossRef]
- [60] C. Tortajada, “Contributions of recycled wastewater to clean water and sanitation Sustainable Development Goals,” npj Clean Water, vol. 3, no. 1, Art. no. 1, Apr. 2020. [CrossRef]
- [61] K. Andersson, S. Dickin, and A. Rosemarin, “Towards ‘Sustainable’ Sanitation: Challenges and Opportunities in Urban Areas,” Sustainability, vol. 8, no. 12, Art. no. 12, Dec. 2016. [CrossRef]
- [62] Z. Huang et al., “Integrated Water Resource Management: Rethinking the Contribution of Rainwater Harvesting,” Sustainability, vol. 13, no. 15, Art. no. 15, Jan. 2021. [CrossRef]
- [63] S. Saha, Md. R. Ahme, Md. A. Ahmed, and Md. S. Islam, “Study on Rainwater Harvesting in Dacope Upazila, Khulna, Bangladesh,” presented at the 4th International Conference on Advances in Civil Engineering 2018 (ICACE 2018), Chittagong, Bangladesh: Department of Civil Engg., CUET, Dec. 2018.
- [64] H. T. Ishaku, M. R. Majid, and F. Johar, “Rainwater Harvesting: An Alternative to Safe Water Supply in Nigerian Rural Communities,” Water Resour Manage, vol. 26, no. 2, pp. 295–305, Jan. 2012. [CrossRef]
- [65] A. Hasib and D. B. P. Argha, COVID-19: LACK OF CORONAVIRUS WASTES MANAGEMENT-AN UPCOMING THREAT FOR THE MEGACITY DHAKA. 2021.
- [66] A. S. Narayan et al., “Advancements in and Integration of Water, Sanitation, and Solid Waste for Low- and Middle-Income Countries,” Annual Review of Environment and Resources, vol. 46, no. 1, pp. 193–219, 2021. [CrossRef]
- [67] D. B. P. Argha, A. Hasib, and M. Rahman, “A comparative study on the variation of air quality index of Dhaka city before and after the nationwide lockdown due to COVID-19,” in 6th International Conference on Engineering Research, Innovation and Education (2021). Sylhet, Bangladesh, 2021.
- [68] J. R. S. Selvan Christyraj, J. D. Selvan Christyraj, P. Adhimoorthy, K. Rajagopalan, and J. Nimita Jebaranjitham, “Impact of Biomedical Waste Management System on Infection Control in the Midst of COVID-19 Pandemic,” in The Impact of the COVID-19 Pandemic on Green Societies: Environmental Sustainability, C. Chakraborty, S. Roy, S. Sharma, and T. A. Tran, Eds., Cham: Springer International Publishing, 2021, pp. 235–262. [CrossRef]
- [69] T. El Merheby, “Prospects for Participatory Water Condensate Harvesting from Air-conditioning Home Units for Use in Public Gardens: A Case Study in Tripoli, Lebanon,” Thesis, 2021. Accessed: Oct. 23, 2023. [Online]. Available: https://scholarworks.aub.edu.lb/handle/10938/22431.
- [70] A. Stephan and L. Stephan, “Life cycle water, energy and cost analysis of multiple water harvesting and management measures for apartment buildings in a Mediterranean climate,” Sustainable Cities and Society, vol. 32, pp. 584–603, Jul. 2017. [CrossRef]
- [71] W. Eades, “Energy and water recovery using air-handling unit condensate from laboratory HVAC systems,” Sustainable Cities and Society, vol. 42, pp. 162–175, Jul. 2018. [CrossRef]
- [72] H. Quon and S. Jiang, “Decision making for implementing non-traditional water sources: a review of challenges and potential solutions,” npj Clean Water, vol. 6, no. 1, Art. no. 1, Aug. 2023. [CrossRef]
- [73] M. Elashmawy, “Experimental study on water extraction from atmospheric air using tubular solar still,” Journal of Cleaner Production, vol. 249, p. 119322, Mar. 2020. [CrossRef]
- [74] M. Hastbacka, J. Dieckmann, and J. Brodrick, “‘Smart’ irrigation systems,” ASHRAE Journal, vol. 54, no. 8, pp. 76–80, Aug. 2012, Accessed: Oct. 23, 2023. [Online]. Available: https://go.gale.com/ps/i.do?p=AONE&sw=w&issn=00012491&v=2.1&it=r&id=GALE%7CA339849693&sid=googleScholar&linkaccess=abs.
- [75] S. Algarni, C. A. Saleel, and M. A. Mujeebu, “Air-conditioning condensate recovery and applications—Current developments and challenges ahead,” Sustainable Cities and Society, vol. 37, pp. 263–274, Feb. 2018. [CrossRef]
- [76] B. A. Habeebullah, “Potential use of evaporator coils for water extraction in hot and humid areas,” Desalination, vol. 237, no. 1, pp. 330–345, Feb. 2009. [CrossRef]
- [77] B. Zhao, L.-Y. Wang, and T.-S. Chung, “Enhanced membrane systems to harvest water and provide comfortable air via dehumidification & moisture condensation,” Separation and Purification Technology, vol. 220, pp. 136–144, Aug. 2019. [CrossRef]
- [78] J. A. Bryant and T. Ahmed, “Condensate Water Collection for an Institutional Building in Doha, Qatar: An Opportunity for Water Sustainability,” Dec. 2008, Accessed: Oct. 23, 2023. [Online]. Available: https://oaktrust.library.tamu.edu/handle/1969.1/90780.
- [79] W. A. Rutala and D. J. Weber, “Uses of inorganic hypochlorite (bleach) in health-care facilities,” Clinical Microbiology Reviews, vol. 10, no. 4, pp. 597–610, Oct. 1997. [CrossRef]
- [80] J. Wang et al., “Disinfection technology of hospital wastes and wastewater: Suggestions for disinfection strategy during coronavirus Disease 2019 (COVID-19) pandemic in China,” Environmental Pollution, vol. 262, p. 114665, Jul. 2020. [CrossRef]
- [81] N. J. Ashbolt, “Microbial Contamination of Drinking Water and Human Health from Community Water Systems,” Curr Envir Health Rpt, vol. 2, no. 1, pp. 95–106, Mar. 2015. [CrossRef]
- [82] A. V. B. Reddy, M. Moniruzzaman, and T. M. Aminabhavi, “Polychlorinated biphenyls (PCBs) in the environment: Recent updates on sampling, pretreatment, cleanup technologies and their analysis,” Chemical Engineering Journal, vol. 358, pp. 1186–1207, Feb. 2019. [CrossRef]
- [83] A. Naik, S. N. Raghavendra, and K. S. M. S. Raghavarao, “Production of Coconut Protein Powder from Coconut Wet Processing Waste and its Characterization,” Appl Biochem Biotechnol, vol. 167, no. 5, pp. 1290–1302, Jul. 2012. [CrossRef]
- [84] S. Jouanneau et al., “Methods for assessing biochemical oxygen demand (BOD): A review,” Water Research, vol. 49, pp. 62–82, Feb. 2014. [CrossRef]
- [85] R. Cossu, T. Lai, and A. Sandon, “Standardization of BOD5/COD ratio as a biological stability index for MSW,” Waste Management, vol. 32, no. 8, pp. 1503–1508, Aug. 2012. [CrossRef]
- [86] A. L. Srivastav, N. Patel, and V. K. Chaudhary, “Disinfection by-products in drinking water: Occurrence, toxicity and abatement,” Environmental Pollution, vol. 267, p. 115474, Dec. 2020. [CrossRef]
- [87] S. E. Hrudey, “Chlorination disinfection by-products, public health risk tradeoffs and me,” Water Research, vol. 43, no. 8, pp. 2057–2092, May 2009. [CrossRef]
- [88] A. Anju, P. Ravi S., and S. Bechan, “Water Pollution with Special Reference to Pesticide Contamination in India,” Journal of Water Resource and Protection, vol. 2010, May 2010. [CrossRef]
- [89] M. Li, Z. Liu, Y. Chen, and Y. Hai, “Characteristics of iron corrosion scales and water quality variations in drinking water distribution systems of different pipe materials,” Water Research, vol. 106, pp. 593–603, Dec. 2016. [CrossRef]
- [90] M. Glavan, Water Challenges of an Urbanizing World. BoD – Books on Demand, 2018.
- [91] K. C. Makris, S. S. Andra, and G. Botsaris, “Pipe Scales and Biofilms in Drinking-Water Distribution Systems: Undermining Finished Water Quality,” Critical Reviews in Environmental Science and Technology, vol. 44, no. 13, pp. 1477–1523, Jul. 2014. [CrossRef]
- [92] N. R. Council, D. on E. and L. Studies, W. S. and T. Board, and C. on P. W. S. D. S. A. and R. Risks, Drinking Water Distribution Systems: Assessing and Reducing Risks. National Academies Press, 2007.
- [93] N. Khatri, S. Tyagi, and D. Rawtani, “Recent strategies for the removal of iron from water: A review,” Journal of Water Process Engineering, vol. 19, pp. 291–304, Oct. 2017. [CrossRef]
- [94] D. A. Laird, “The Charcoal Vision: A Win–Win–Win Scenario for Simultaneously Producing Bioenergy, Permanently Sequestering Carbon, while Improving Soil and Water Quality,” Agronomy Journal, vol. 100, no. 1, pp. 178–181, 2008. [CrossRef]
- [95] M. M. Rahman, J. C. Ng, and R. Naidu, “Chronic exposure of arsenic via drinking water and its adverse health impacts on humans,” Environ Geochem Health, vol. 31, no. 1, pp. 189–200, Apr. 2009. [CrossRef]
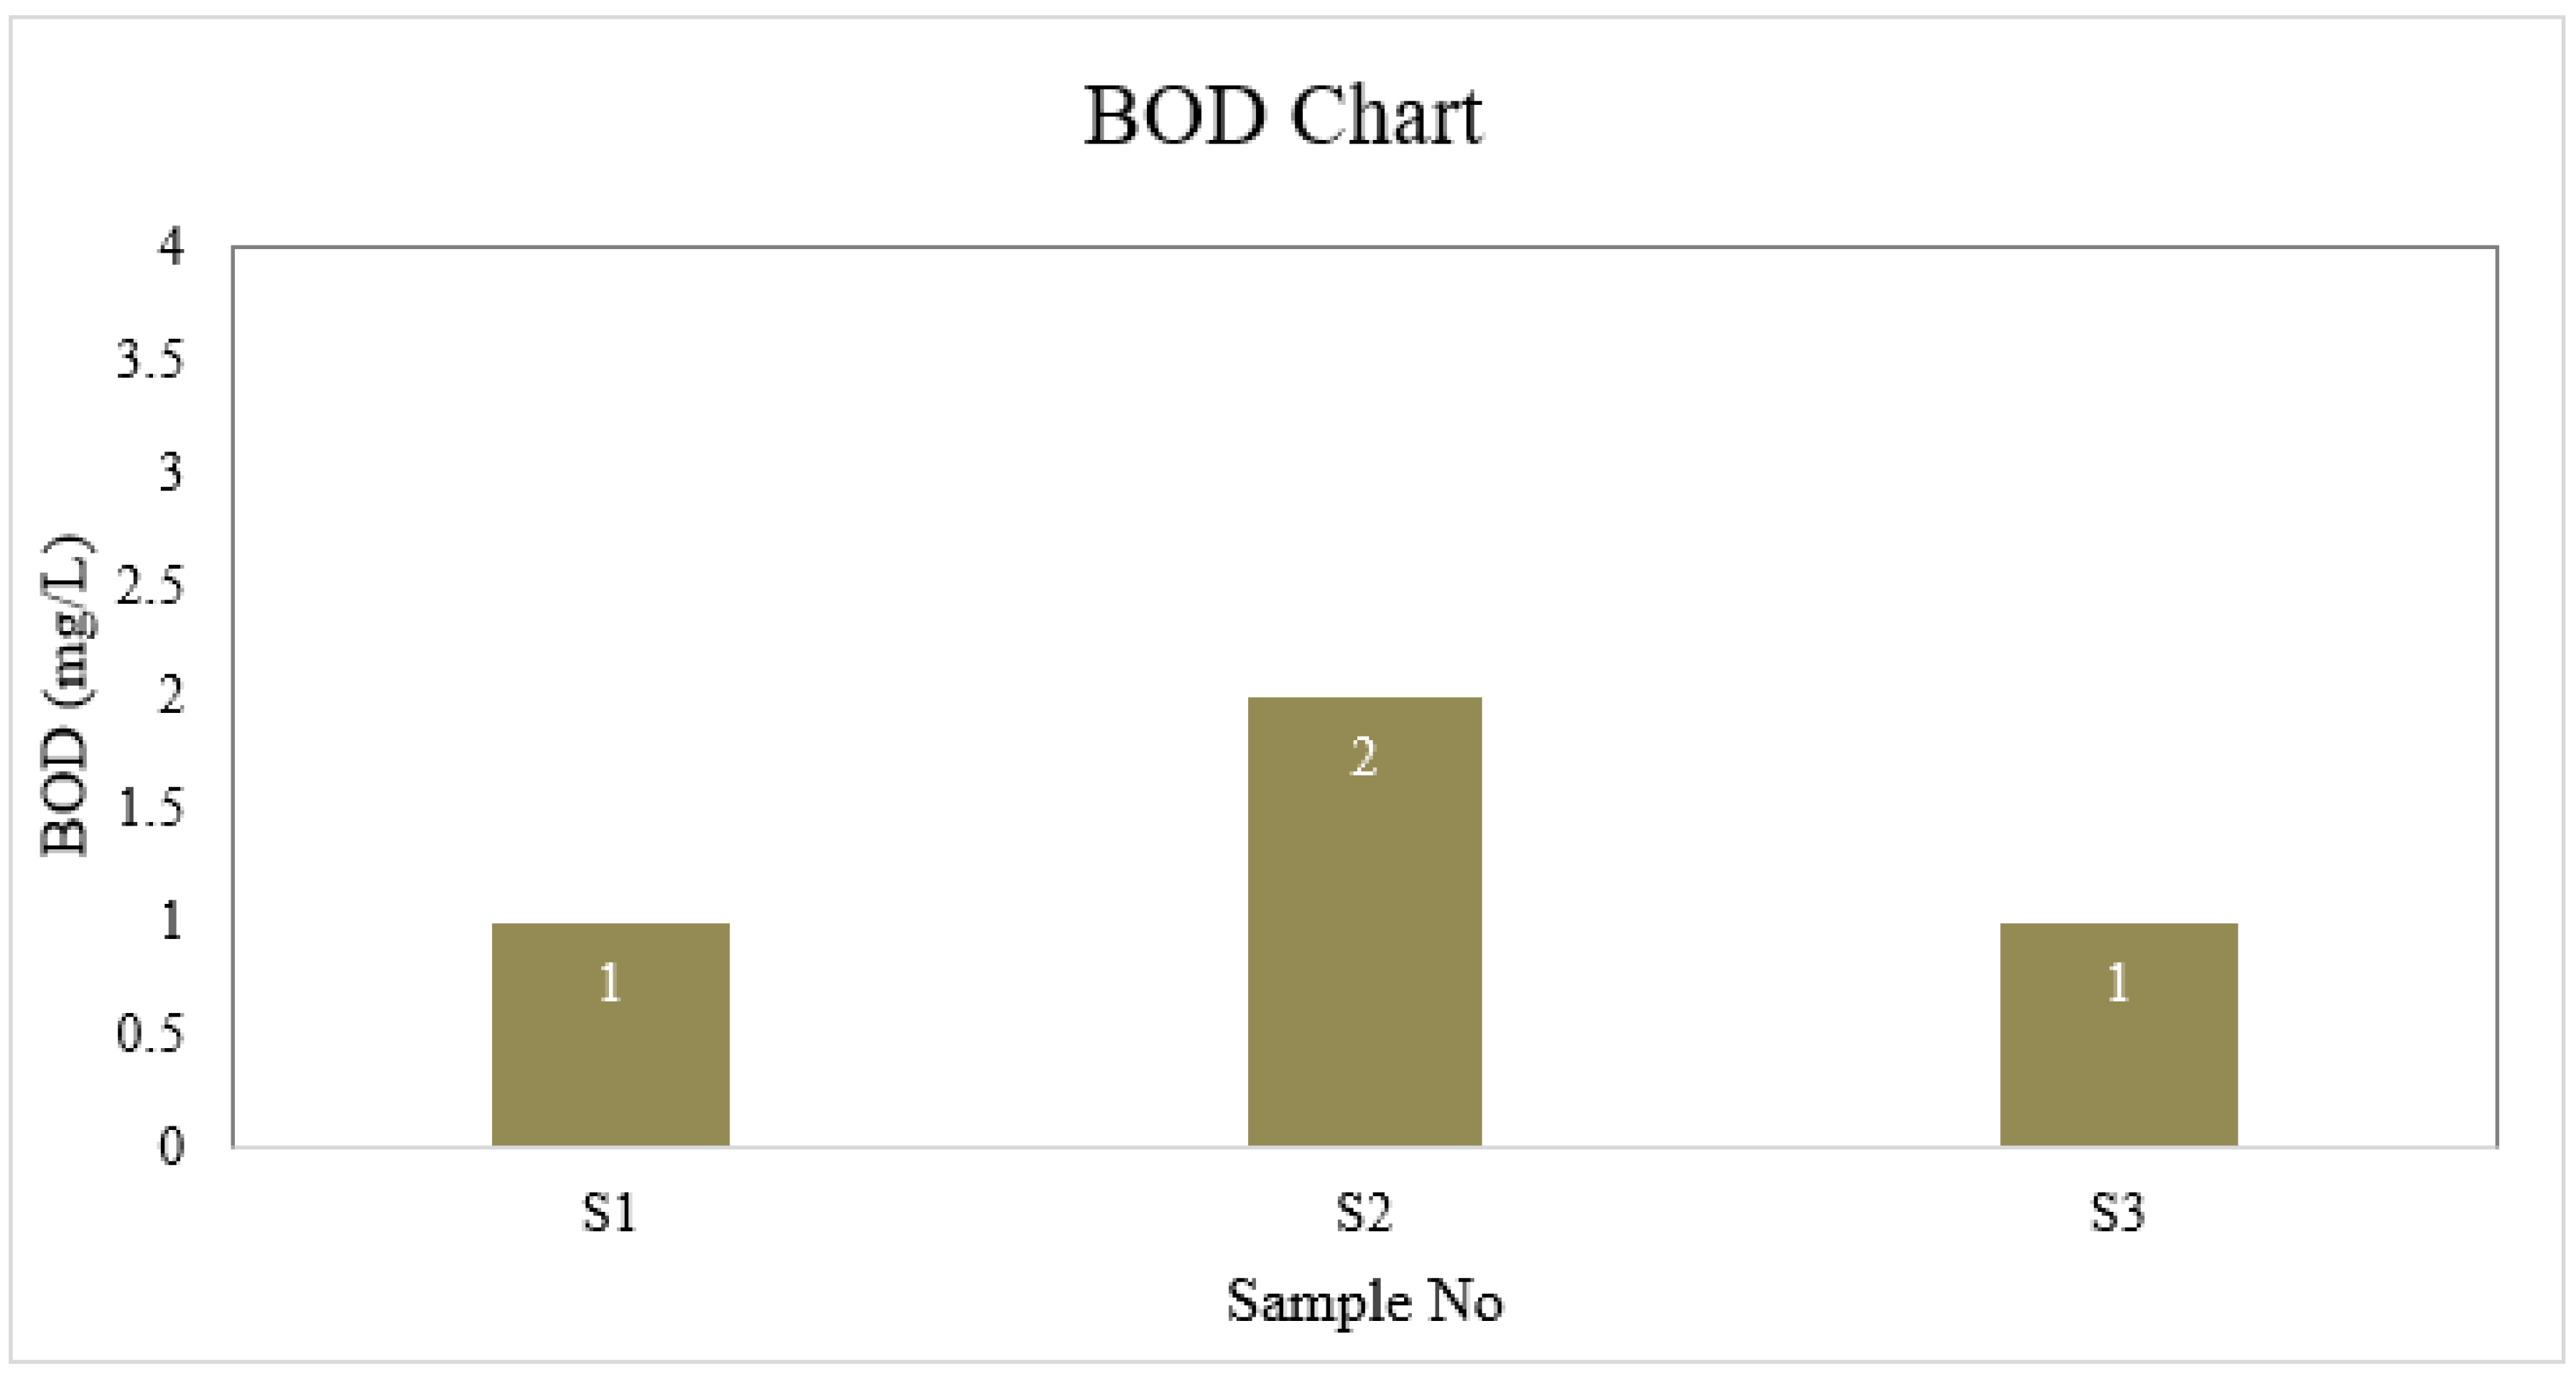
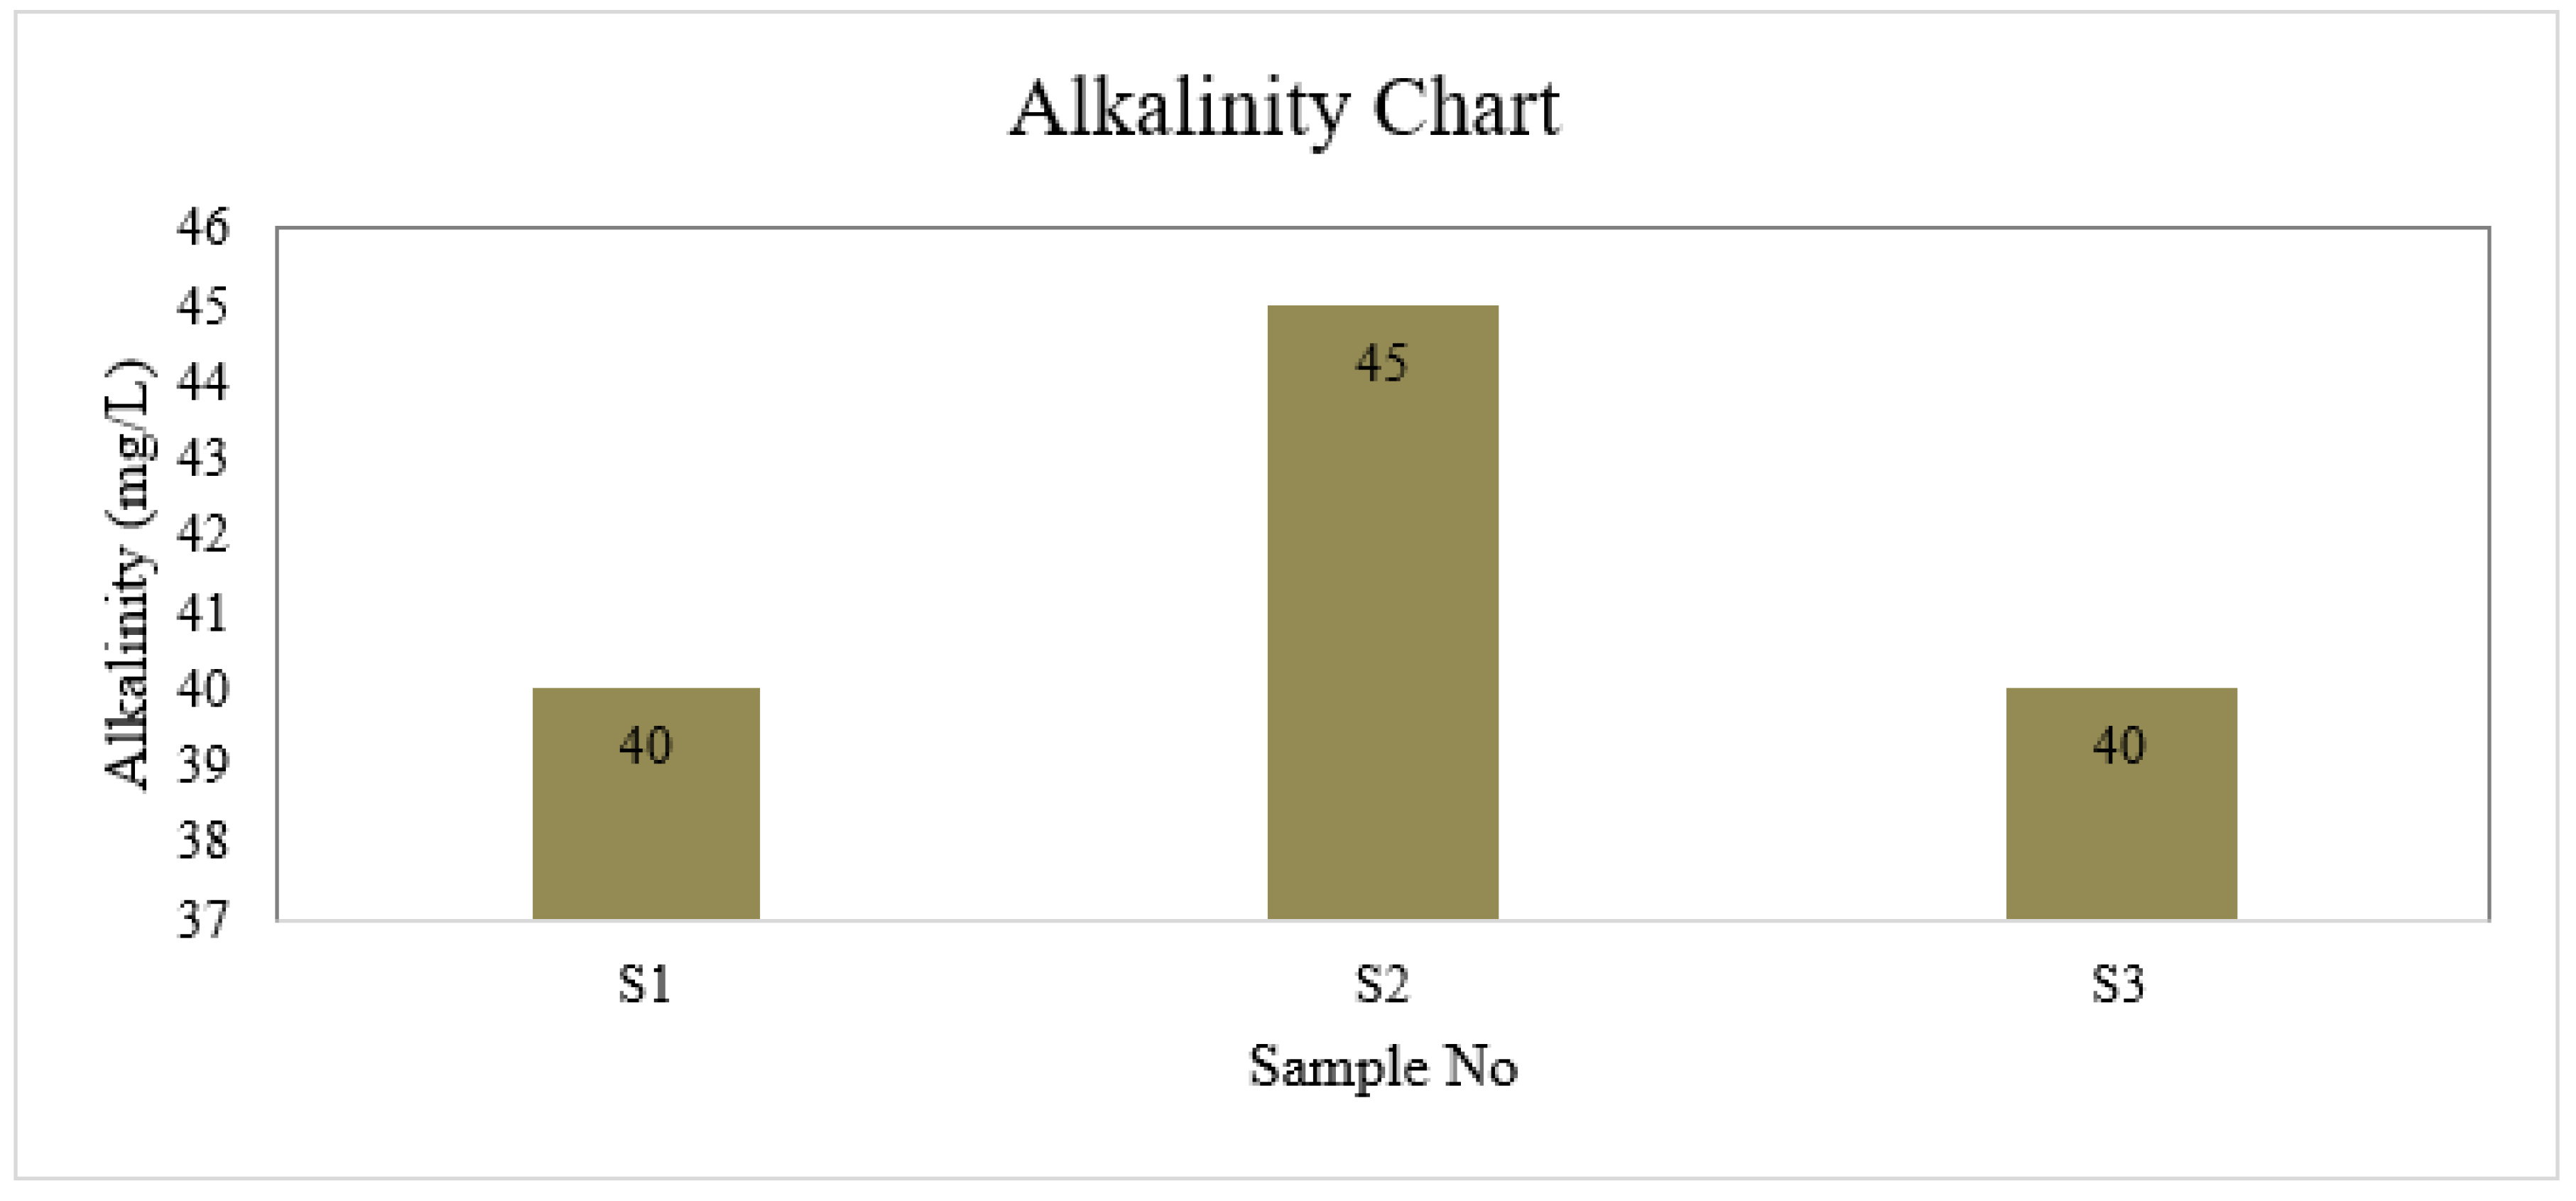
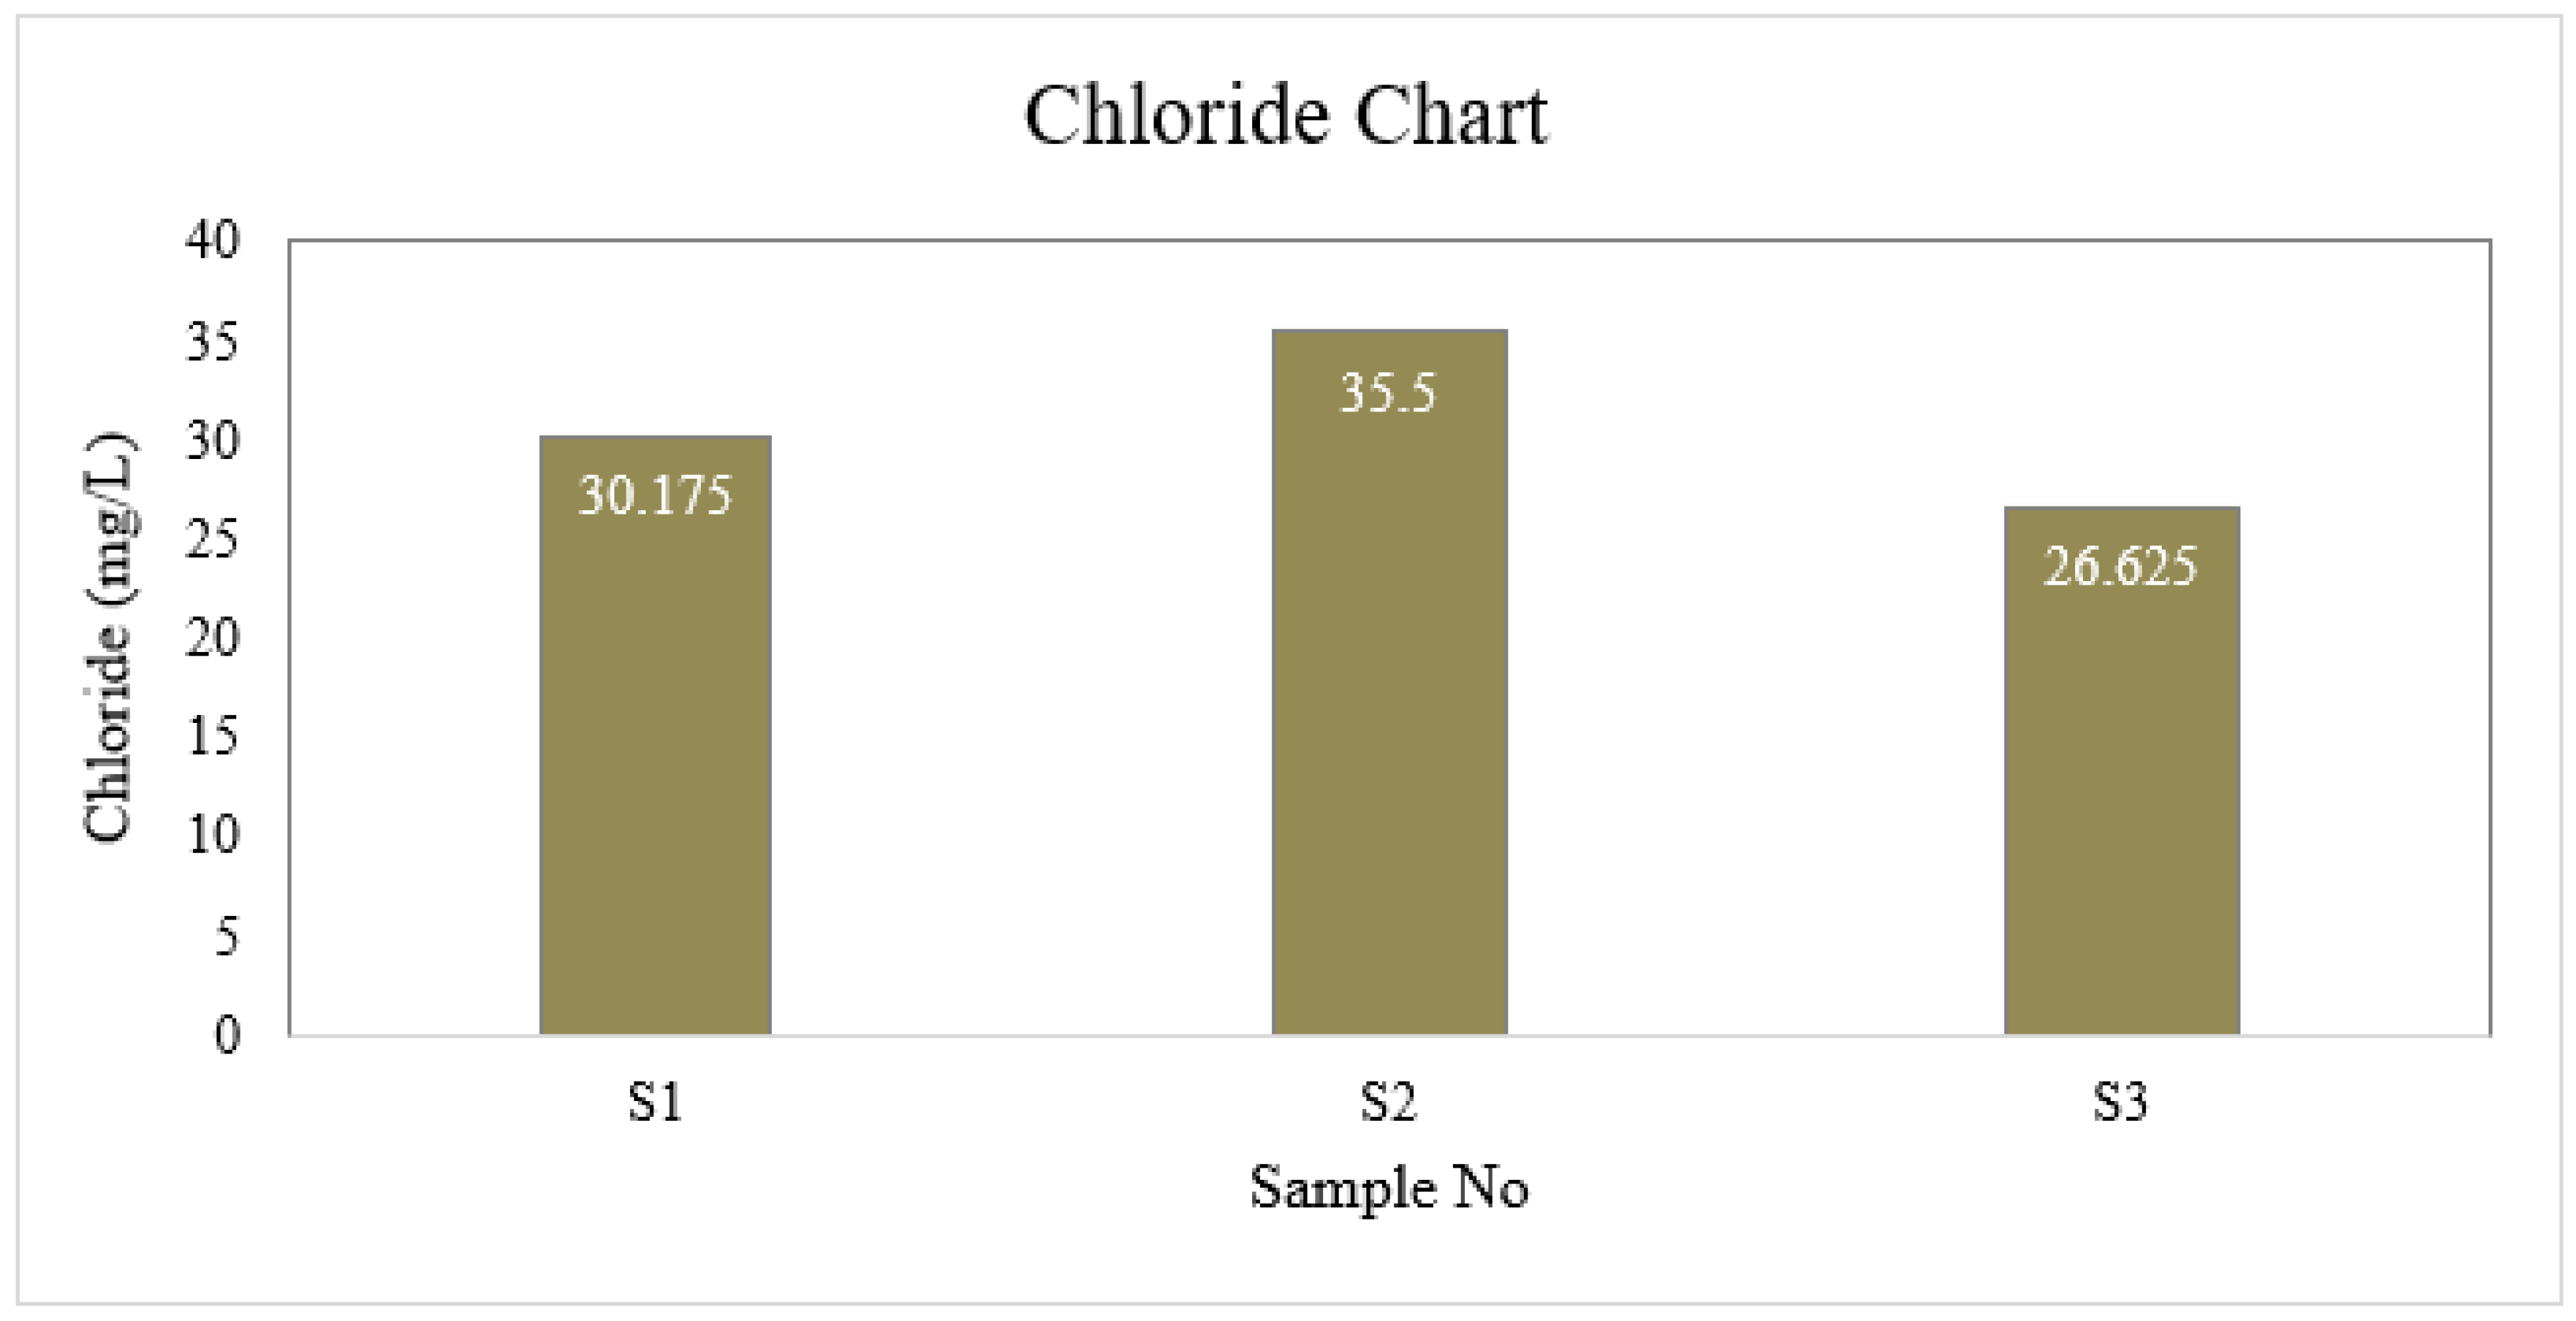
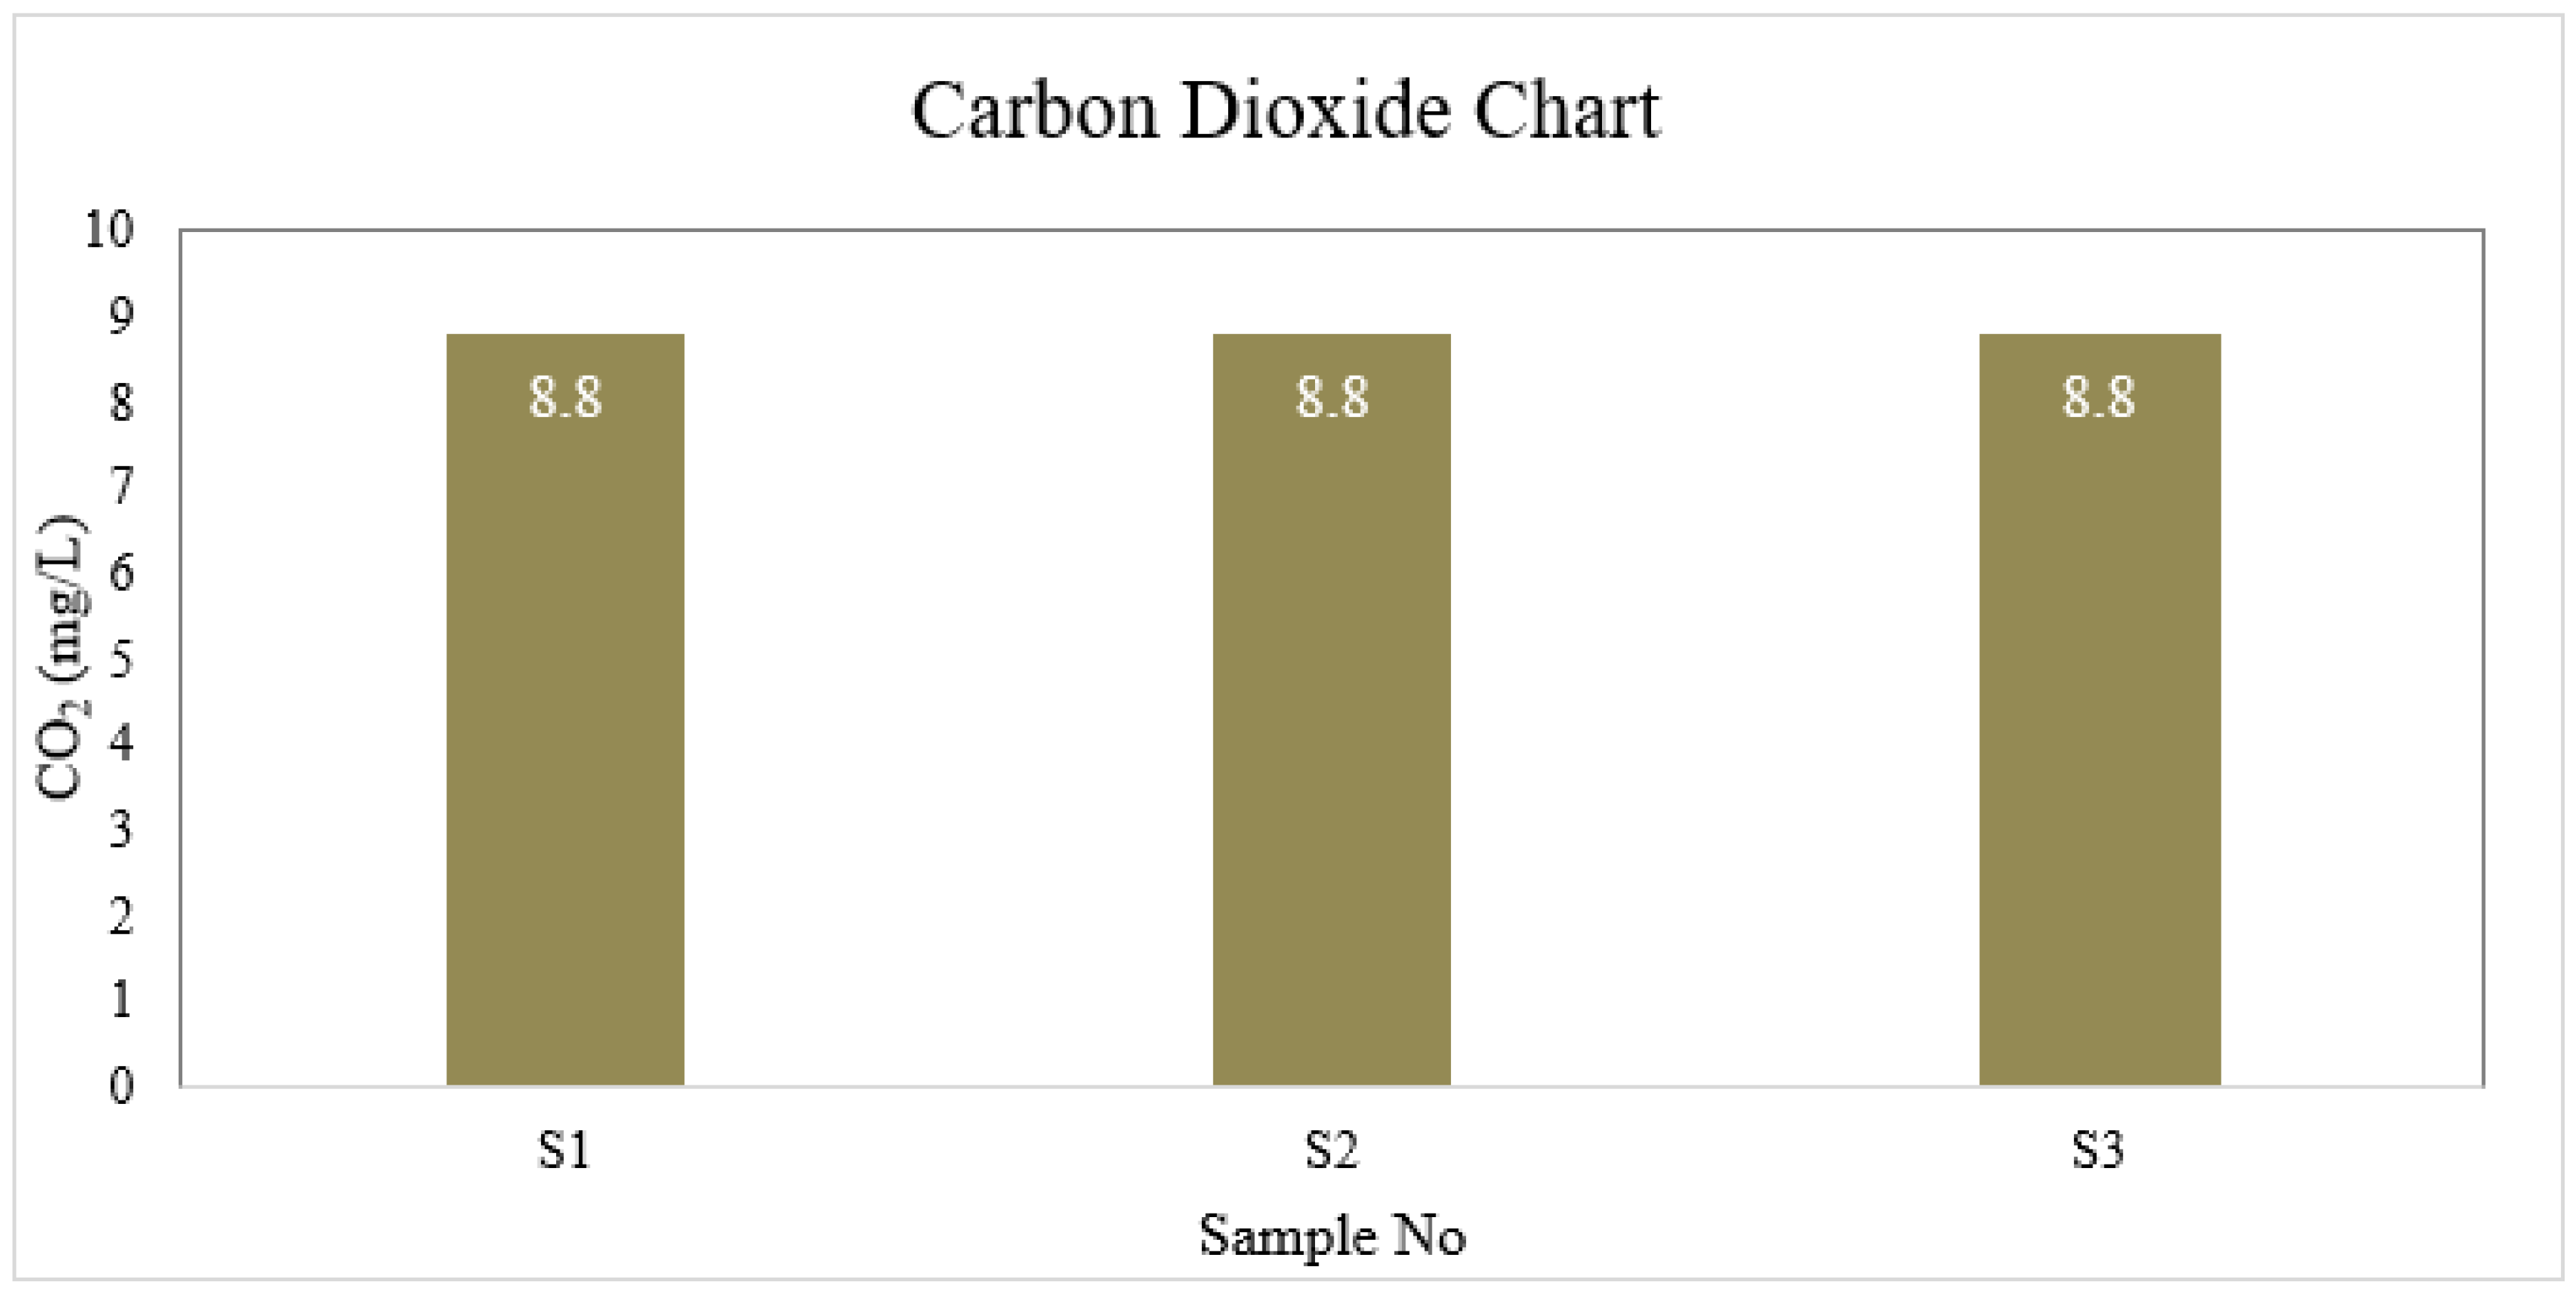
| Sample No | Respective AC Units | Sample Volume (mL) | Sample Temperature (ºC) | Sample Color | Sample Taste | Sample Odor |
|---|---|---|---|---|---|---|
| S1 | 1 ton | 1000 | 26.7 | Colorless | Tasteless | Odorless |
| S2 | 2 tons | 1000 | 28 | Colorless | Tasteless | Odorless |
| S3 | 4 tons | 1000 | 29.4 | Colorless | Tasteless | Odorless |
| Parameters | Methods | Units | BD Standard (ECR’97) | |
|---|---|---|---|---|
| Temperature | Temperature Probe | ºC | --- | |
| Physical | Color | Visualization | --- | --- |
| Taste | Tongue | --- | --- | |
| Odor | Smelling | --- | --- | |
| Total Solids (TS) | mg/L | --- | ||
| Total Dissolve Solids (TDS) | Filtration, Evaporation | mg/L | 1000 | |
| Total Suspended Solids (TSS) | Filtration, Evaporation | mg/L | 10 | |
| Turbidity (NTU) | Turbidimeter | NTU | 10 | |
| Chemical | Acidity/Alkanity(pH) | Electrometric | ---- | 6.5 – 8.5 |
| Arsenic (As) | Atomic Absorption Flame Spectrometer | mg/L | 0.05 | |
| Alkalinity as CaCO3 | Titrimetric | mg/L | 150 – 250 | |
| Chloride (Cl-) | Titrimetric | mg/L | 150 – 600 | |
| Dissolve oxygen(DO) | Electrometric | mg/L | ≤ 6 | |
| Electrical Conductivity (EC) | Electrometric | μS/cm | 700 | |
| Iron (Fe) | Colorimetric | mg/L | 0.3 – 1 | |
| Carbon dioxide (CO2) | CO2 meter | mg/L | --- | |
| Chemical Oxygen Demand (COD) | Colorimetric Method | mg/L | 4 | |
| Biochemical Oxygen Demand (BOD) | Standard Method 5210B | mg/L | 2 | |
| Sample ID | Color | Odor | Taste | Temperature (°C) |
TS (mg/L) |
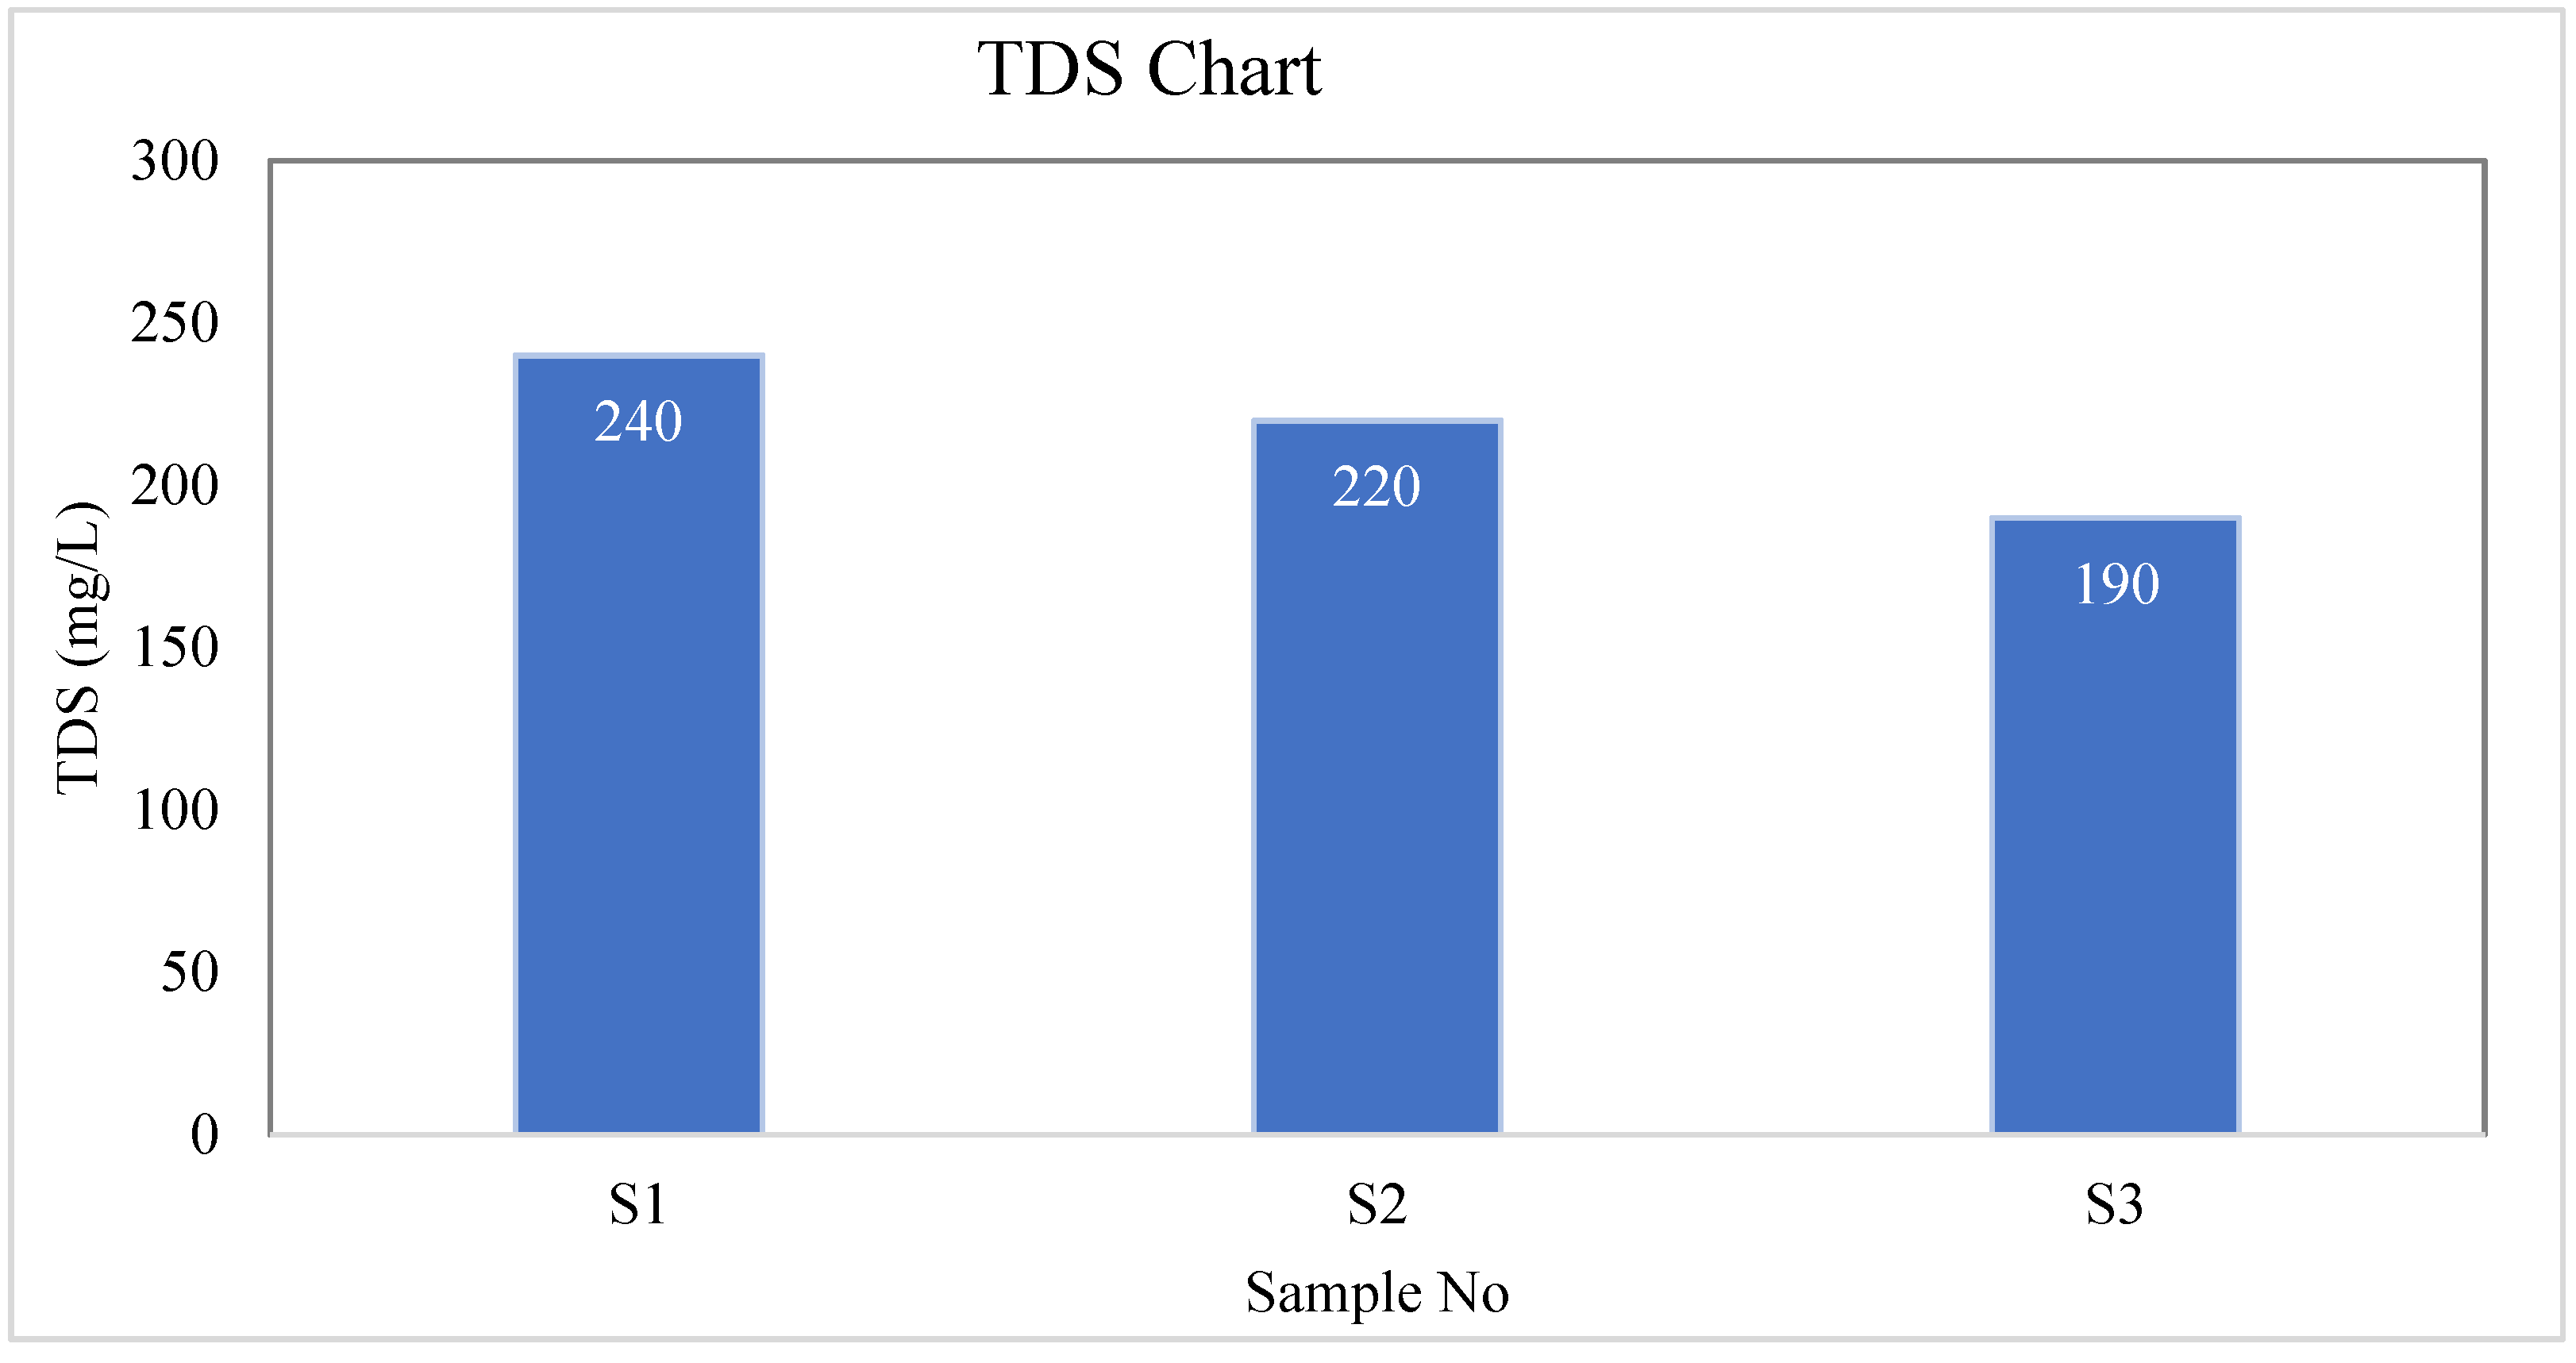
TDS (mg/L) |
TSS (mg/L) |
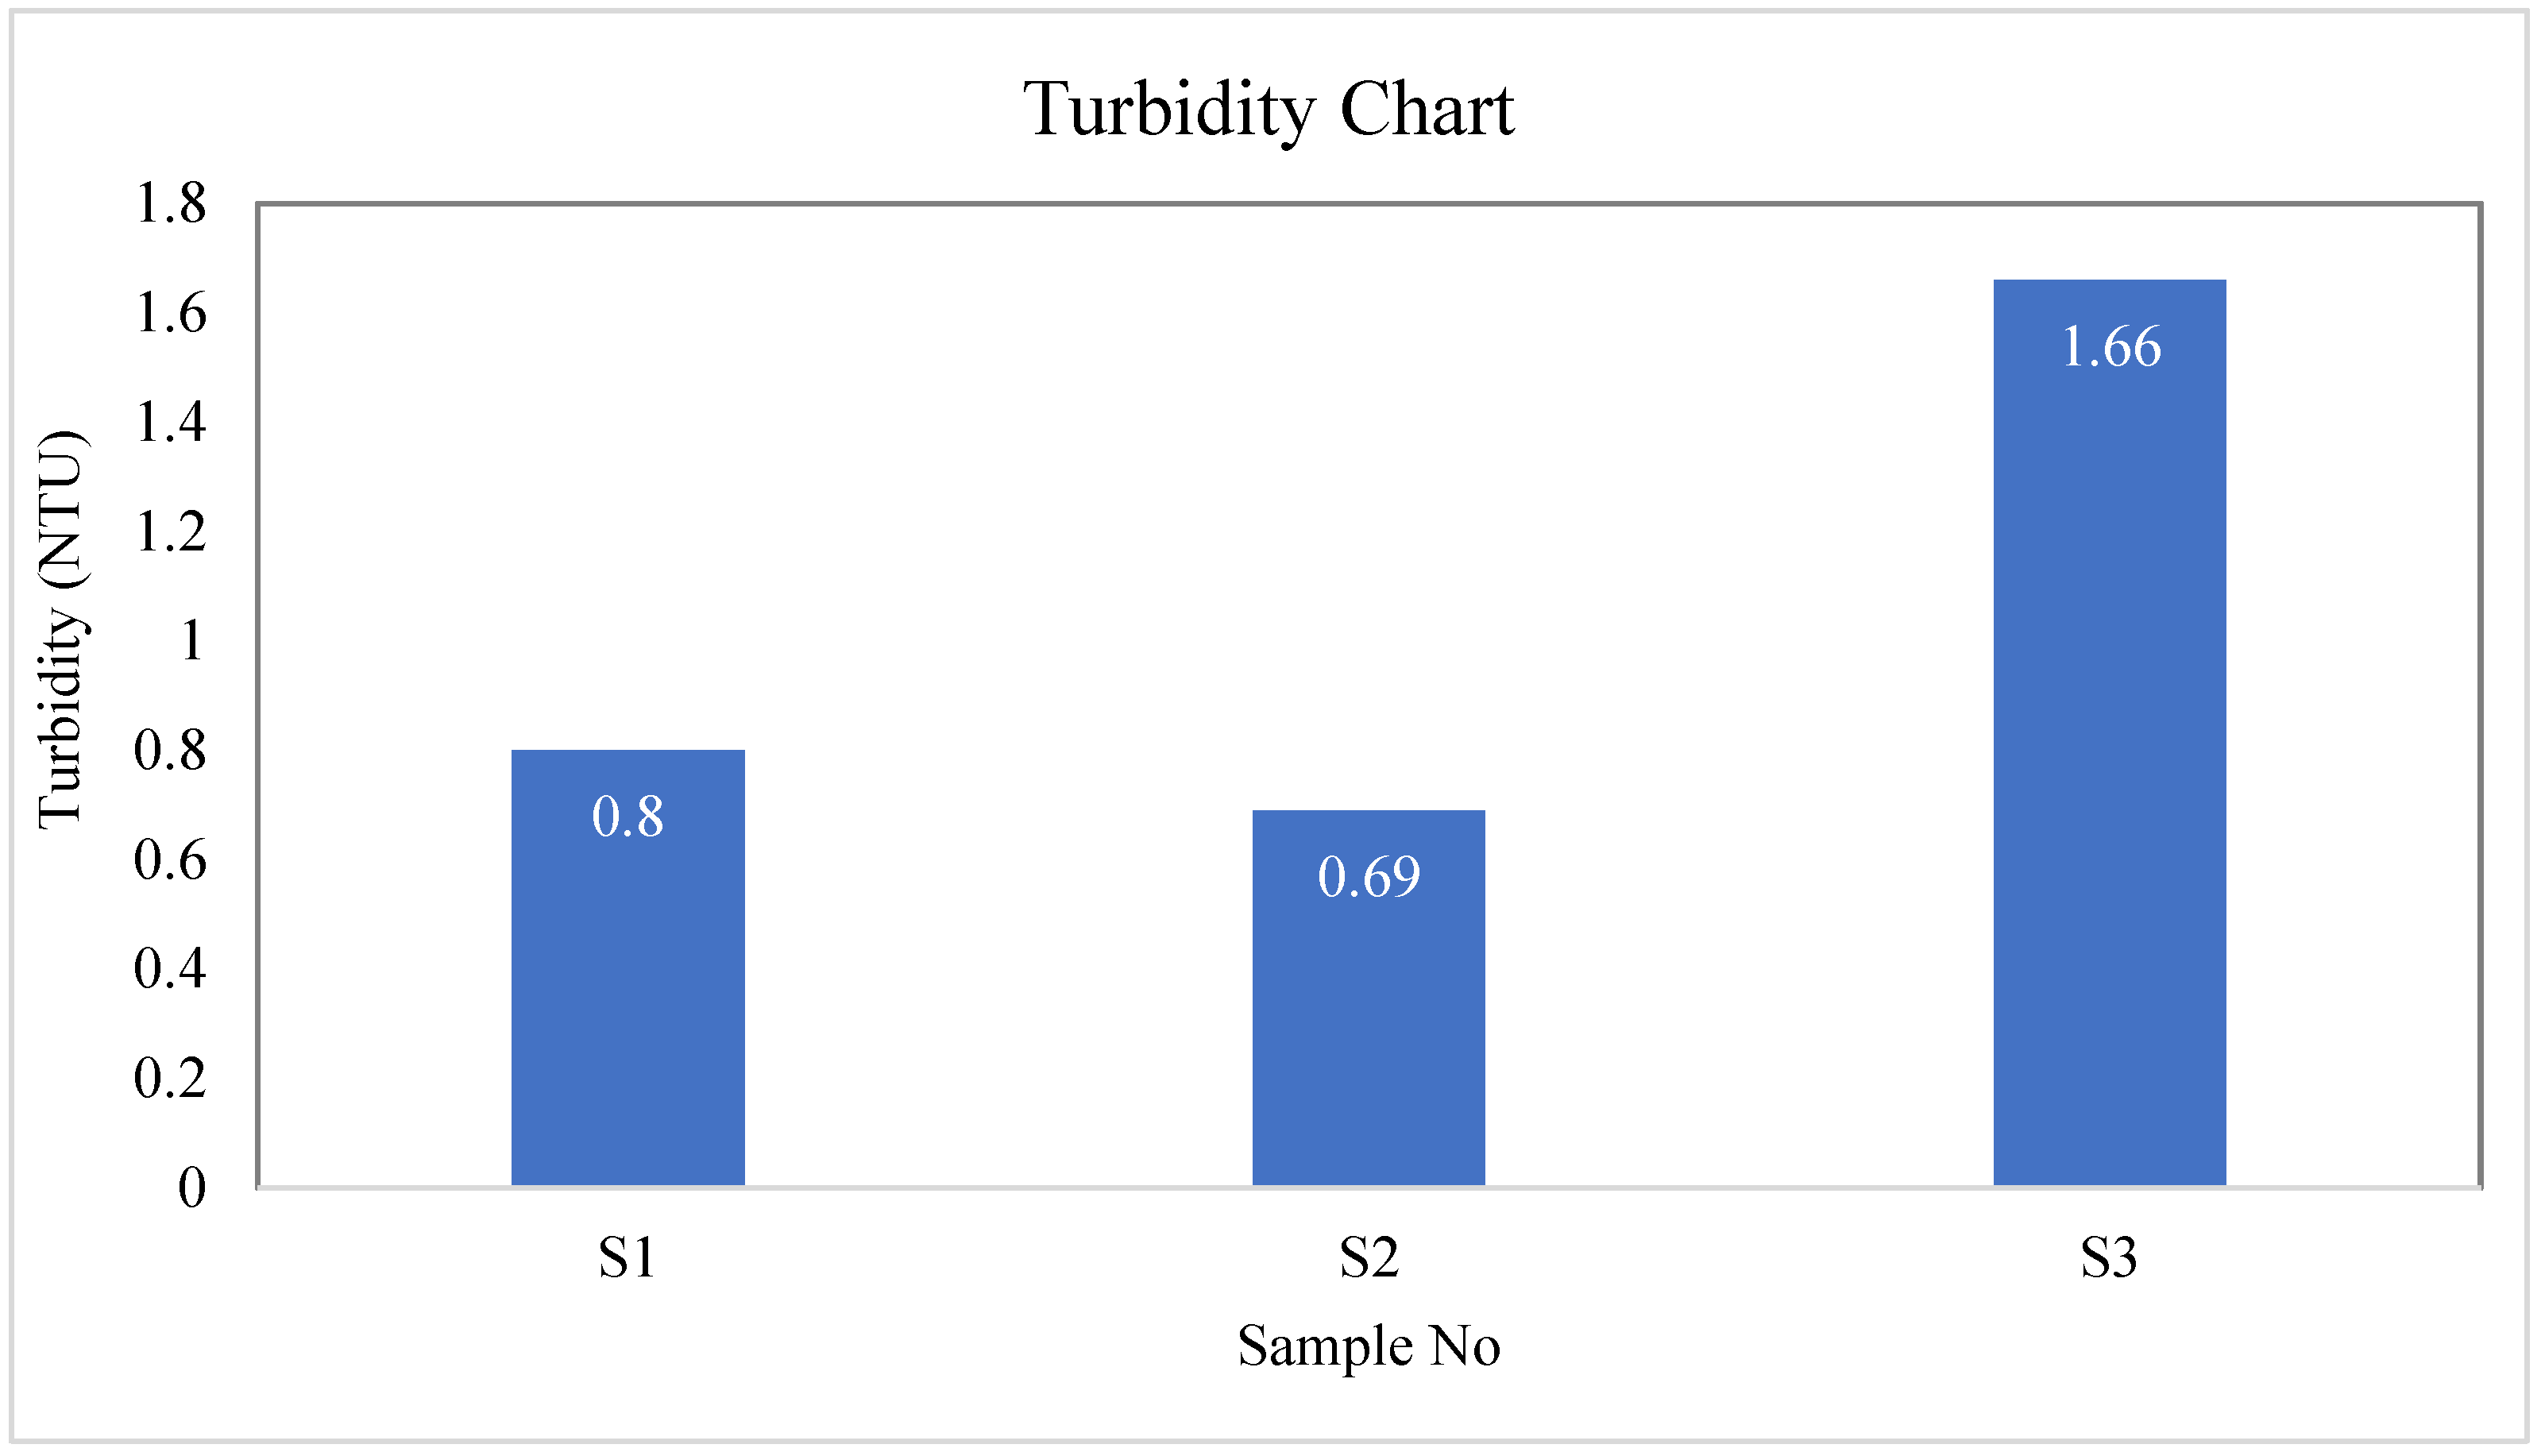
Turbidity (NTU) |
|---|---|---|---|---|---|---|---|---|
| S-01 | Colorless | Odorless | Tasteless | 26.7 | 244 | 240 | 4 | 0.80 |
| S-02 | Colorless | Odorless | Tasteless | 28 | 224 | 220 | 4 | 0.69 |
| S-03 | Colorless | Odorless | Tasteless | 29.4 | 193 | 190 | 3 | 1.66 |
| BD Standard | --- | --- | --- | --- | --- | 1000 | 10 | 10 |
| Sample ID |
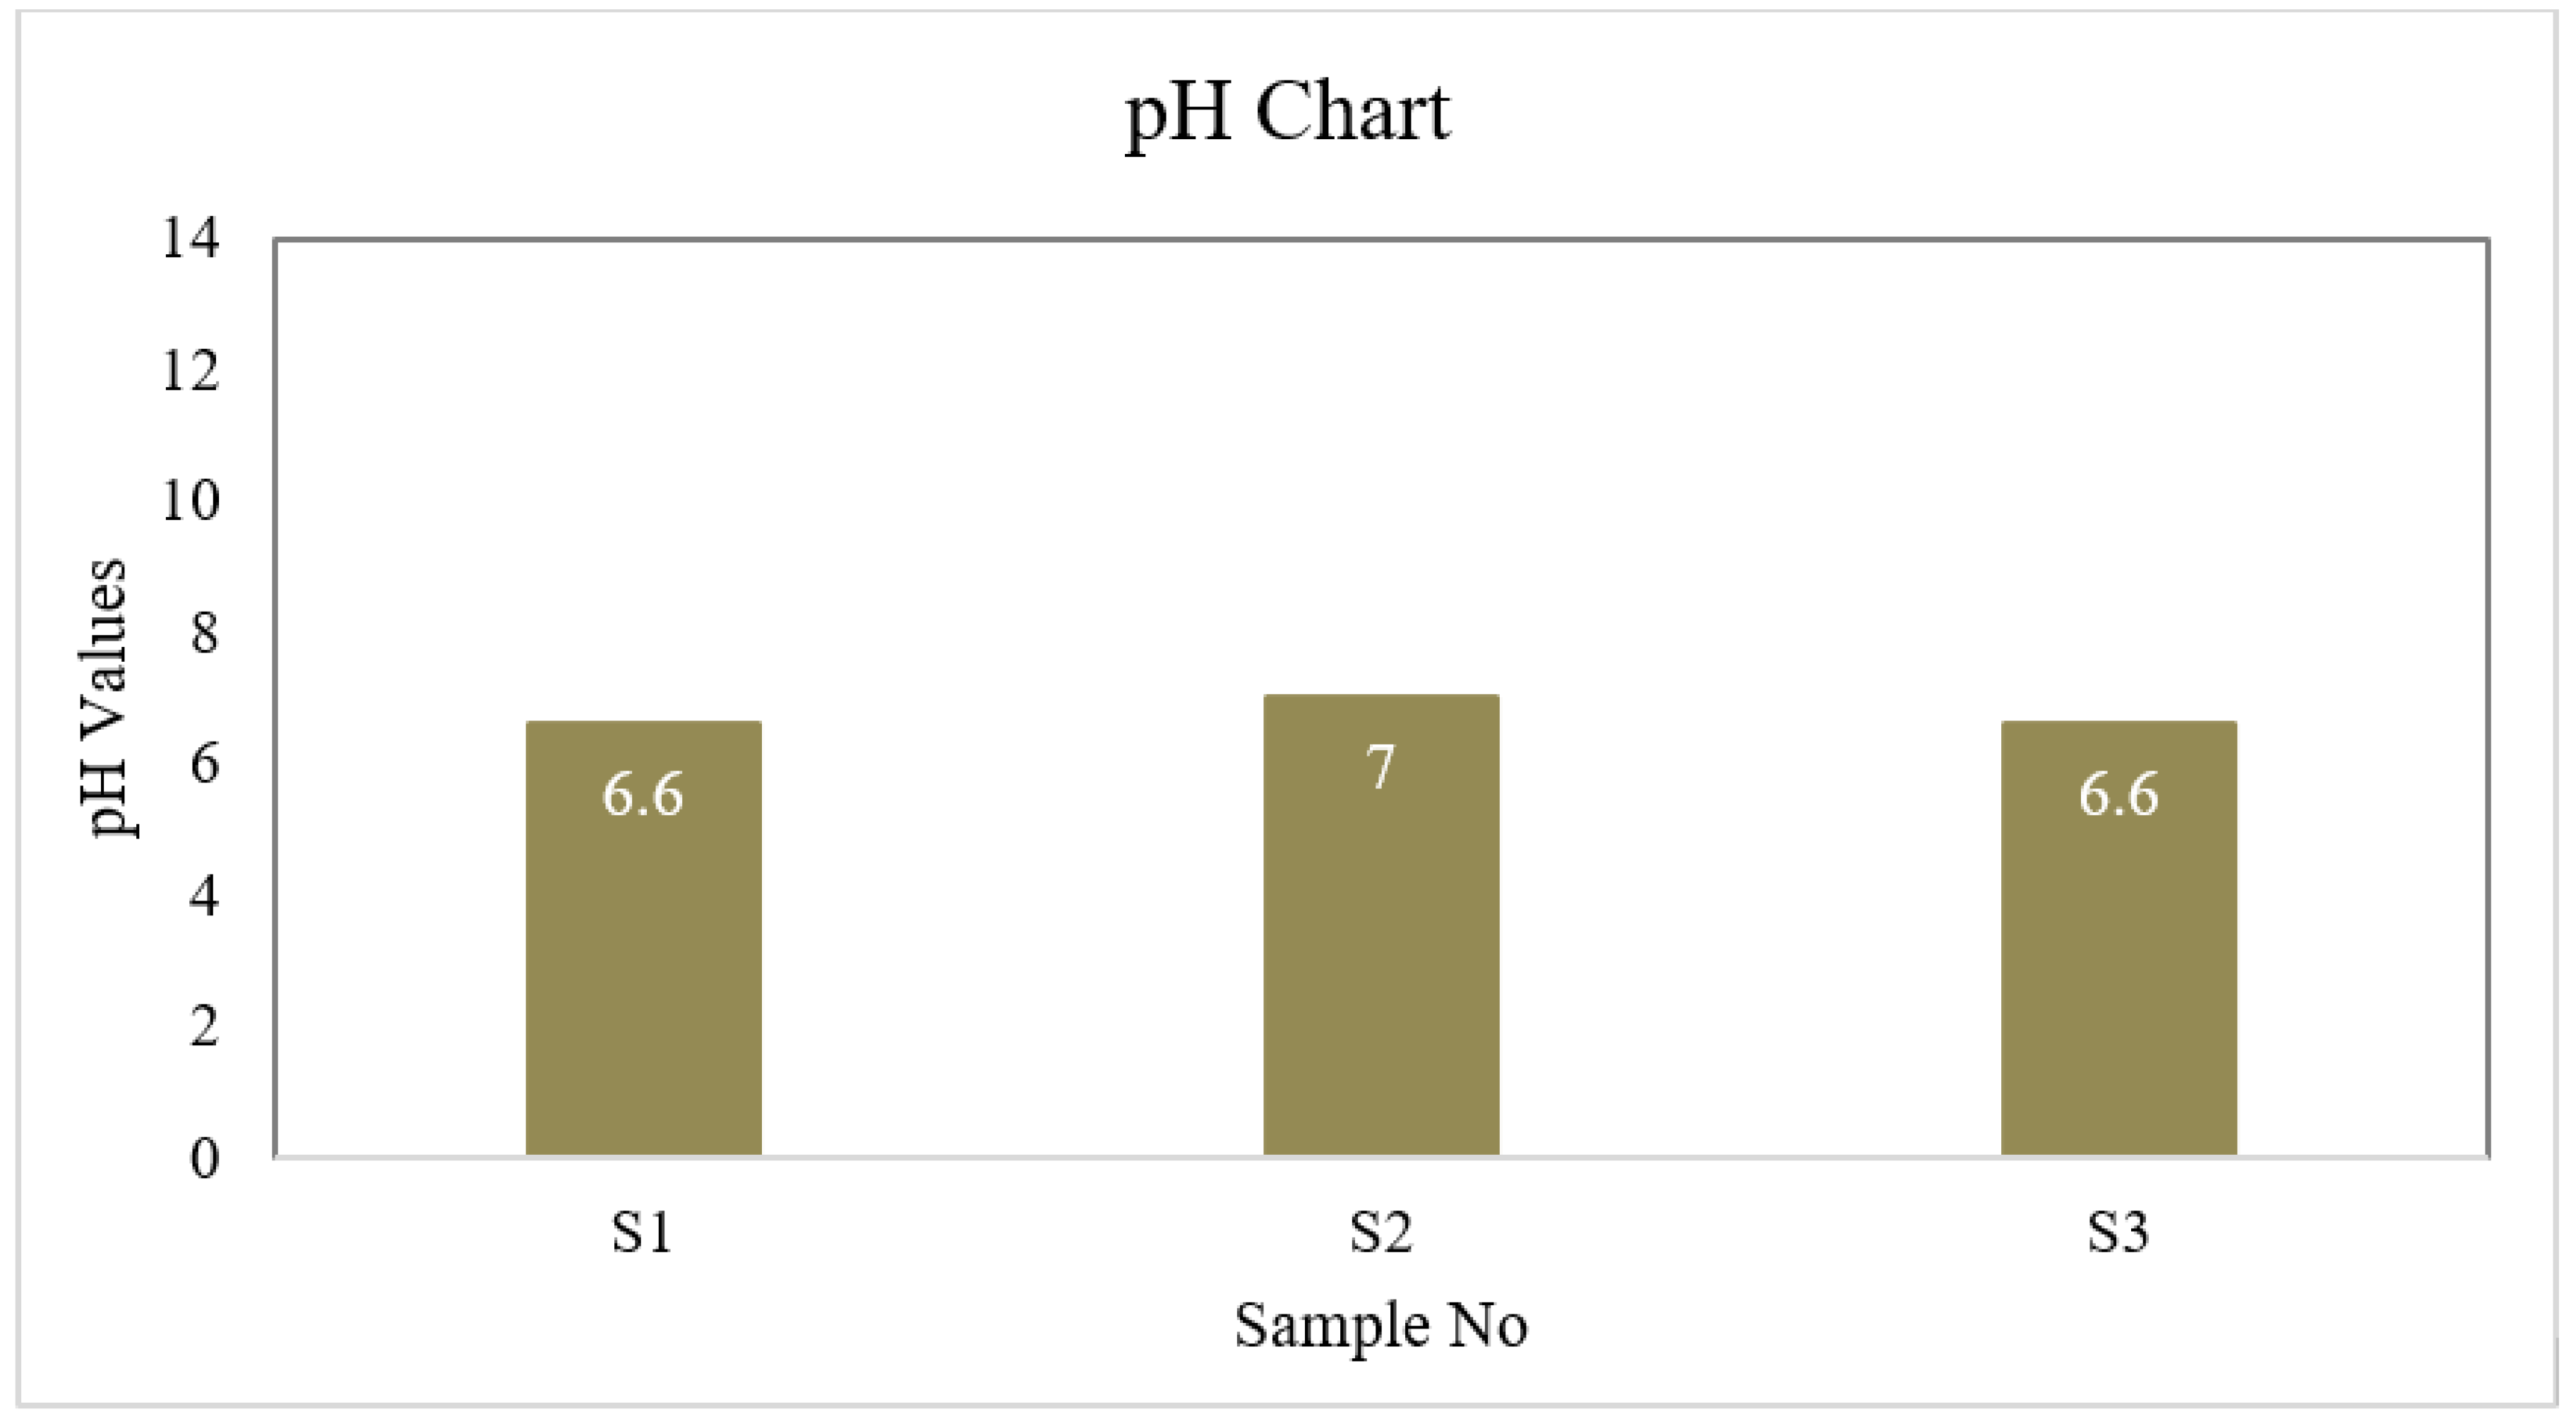
pH |
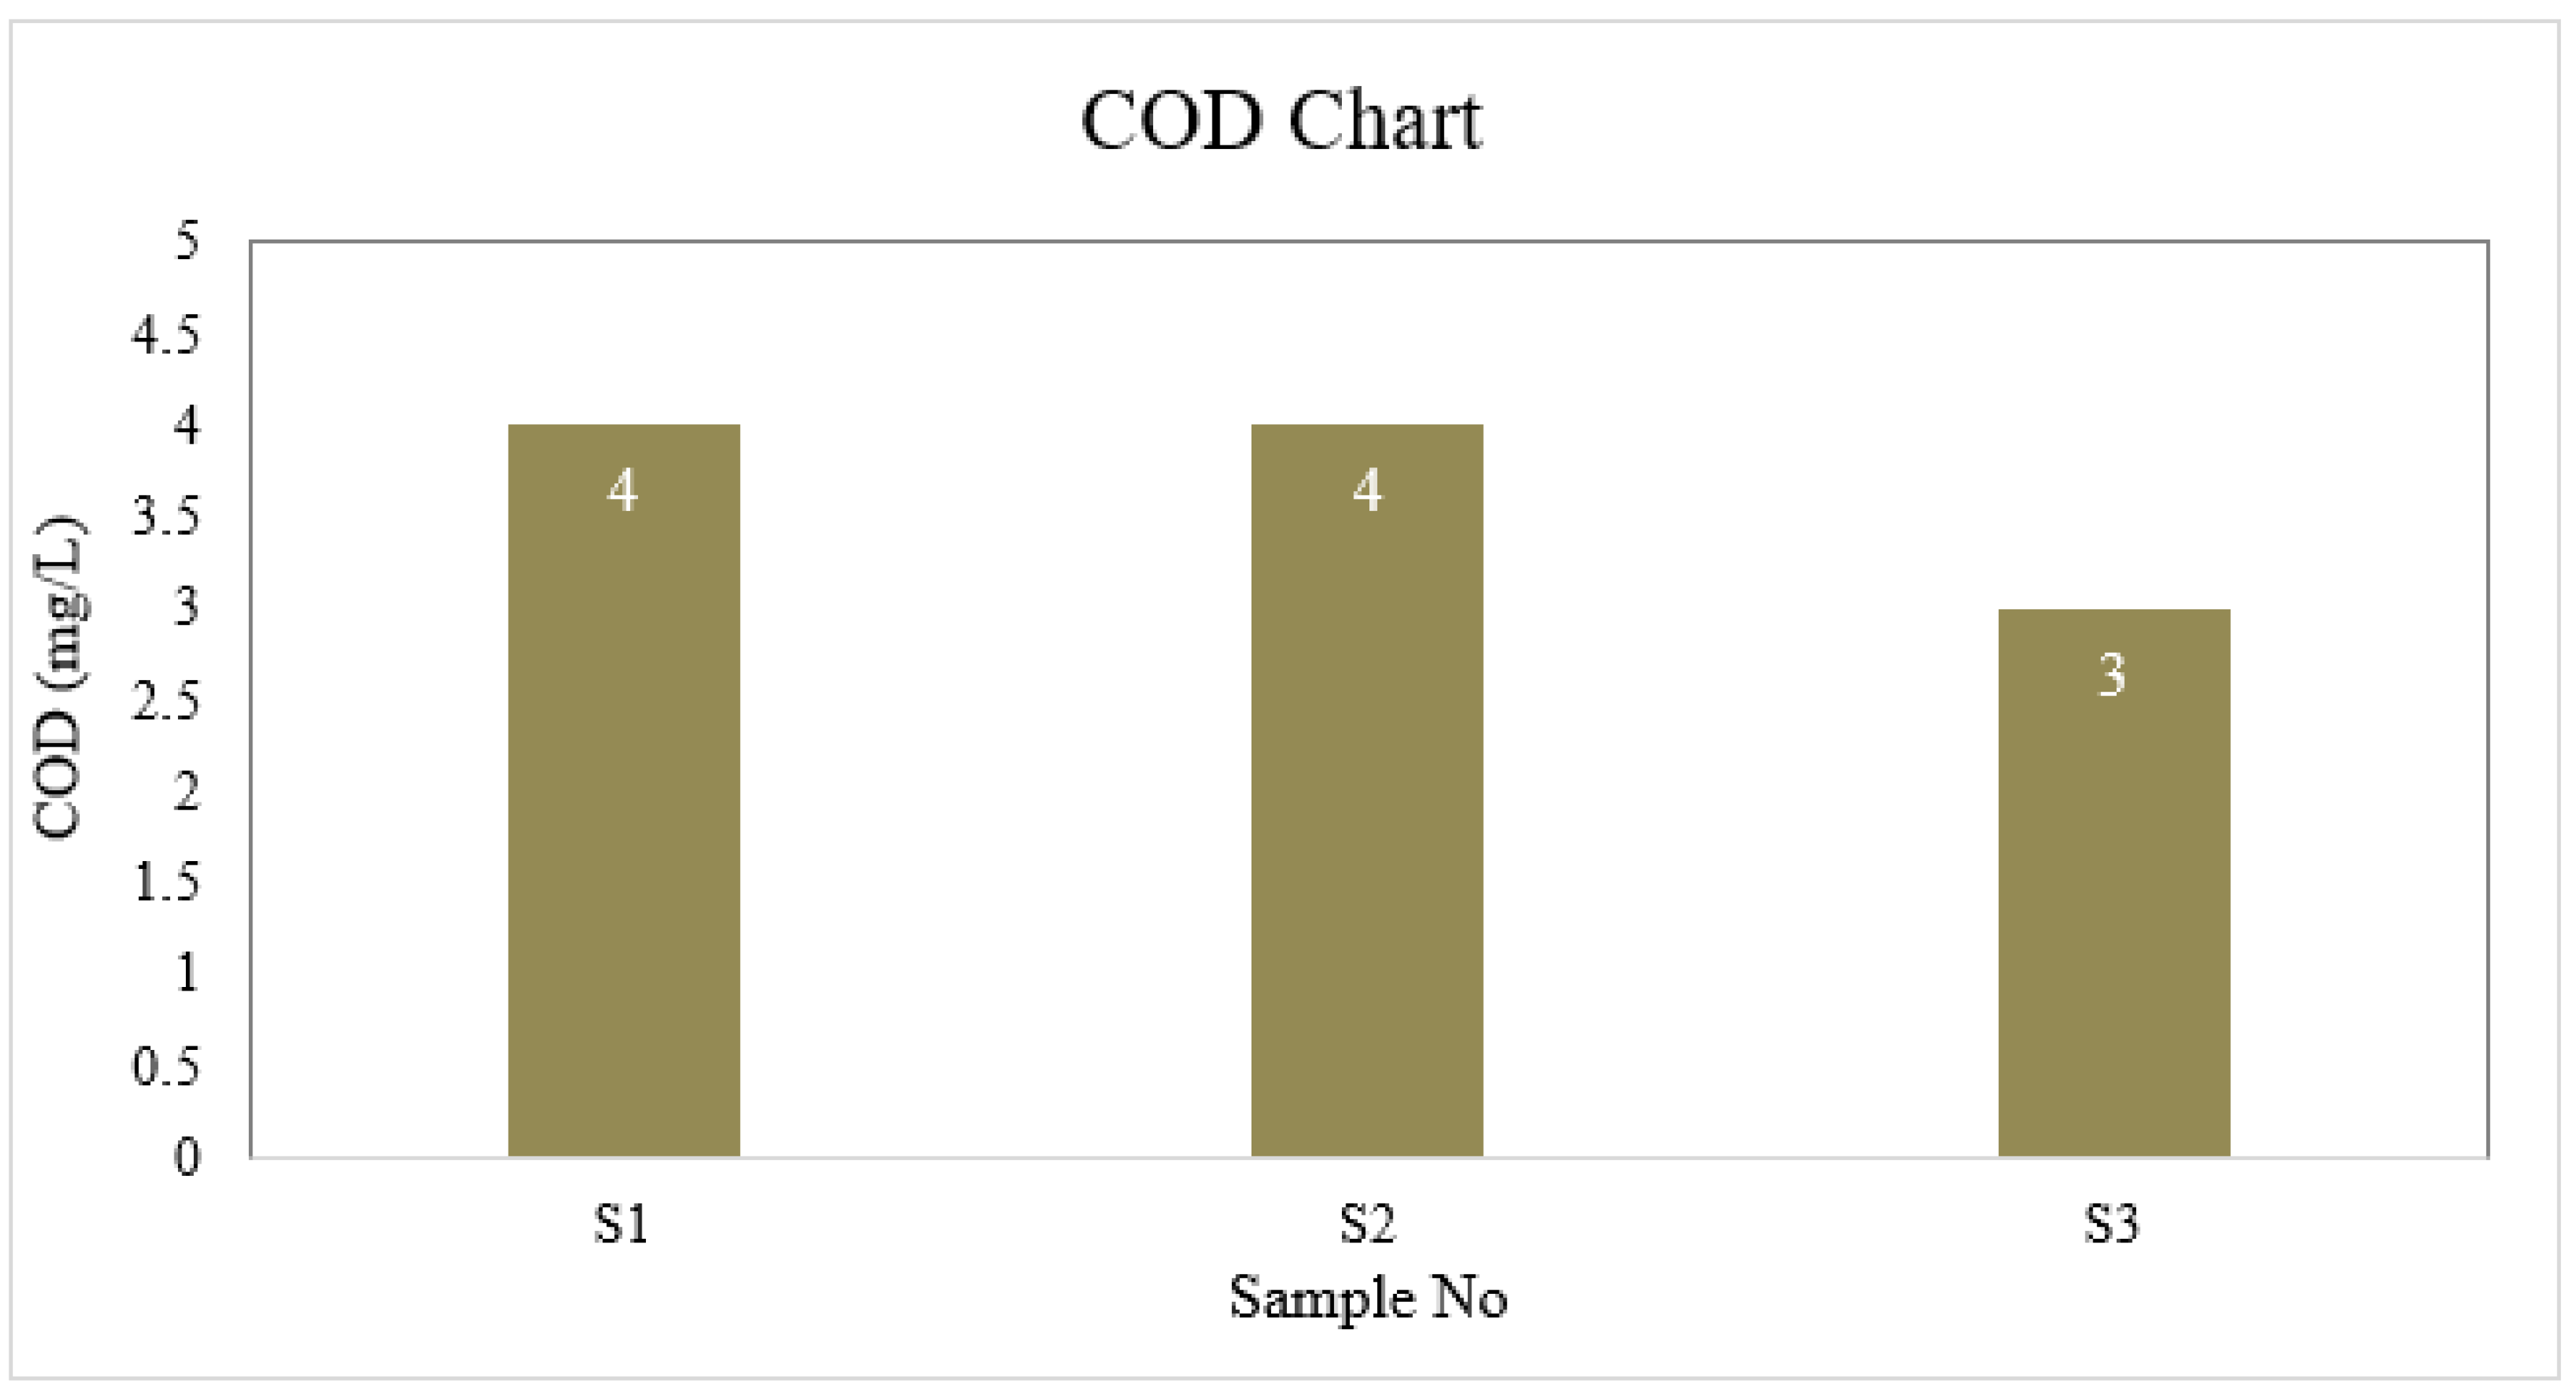
COD (mg/L) |
BOD (mg/L) |
Alkalinity (mg/l) |
Dissolve oxygen (mg/L) |
Chloride (mg/L) |
Iron ppm |
Carbon dioxide (mg/L) |
Arsenic (mg/L) |
|---|---|---|---|---|---|---|---|---|---|
| S1 | 6.6 | 4 | 1 | 40 | 6.5 | 30.175 | 0 | 8.8 | 0 |
| S2 | 7.0 | 4 | 2 | 45 | 6.7 | 35.5 | 0 | 8.8 | 0 |
| S3 | 6.7 | 3 | 1 | 40 | 6.7 | 26.625 | 0 | 8.8 | 0 |
| BD Standard | 6.5-8.5 | 4 | 2 | 150-250 | ≤ 6 | 150-600 | 0.3-1 | --- | 0.05 |
Disclaimer/Publisher’s Note: The statements, opinions and data contained in all publications are solely those of the individual author(s) and contributor(s) and not of MDPI and/or the editor(s). MDPI and/or the editor(s) disclaim responsibility for any injury to people or property resulting from any ideas, methods, instructions or products referred to in the content. |
© 2023 by the authors. Licensee MDPI, Basel, Switzerland. This article is an open access article distributed under the terms and conditions of the Creative Commons Attribution (CC BY) license (http://creativecommons.org/licenses/by/4.0/).


