1. Introduction
Glacier lake outburst flood (GLOFs) is regarded as a hazardous flood and in some cases in a cyclic release of a storage water from a moraine lake or glacier dammed lake [1]. There events could result in catastrophic life loss, making remarkable risks to hydraulic engineering and conservancy facilities, e.g., highway, bridges and to the lives and properties of local peoples along the downstream oases [2–5]. GLOFs can also alter the oasis floodplain by depositing, eroding, transporting large amounts of sediment, and such alterations occur a few hundred kilometers along downstream from the headwater [6–9]. Since GLOF have generated disasters in a lot of countries, GLOFs have been paid a great attention by the scientific community in the world [10–13].
The retreating glaciers in the Himalayas have speeded up the formation of large lakes and rapidly growing lakes in plateau forelands with highly extreme damage [14–17]. The North American glacio-hydrologist have also studied GLOFs for long time, mainly in western Canada and Alaska [18–21], as well as in Central Asia, where a great number of the outburst flood have been undertaken regarding to mitigating impact of GLOFs [22–24]. For example, flood predictions from the Merzbacher Lake, which is dammed by the South Inylchek Glacier, have been fully recognized [25,26].
Located in the Shaksgam Valley on the northern side of the China Karakoram, glacier dammed lake Kyagar is well known for a balanced mass or a slight mass budget in many large glaciers, contrasting major trends of glacier retreat in line with global warming [27–29]. In addition, the Karakoram glaciers have also been widely studied based on data satellite of remote sensing because of previously many surge events, which have emphasized the importance for the formation and outburst of glacier dammed lakes [30].
According to the data of outburst flood in the Aksu River, it has reported that the annual frequency of GLOFs have increased by 75% from 0.4 time/a during 1956 to 1986 to 0.7 time/a during 1997 to 2006 [32]. The survey and assessment of the hazard loss from the Merzbacher lake have been paid a great of attention by the local government. The estimation of glacier lake area or lake volume is the first step in the hazard projection of its risk and in the prevention of flashy and unexpected catastrophes. In comparison both high costs and many difficulties in conducting fieldworks around both the huge glacier and large lake, the combination of multisource optical satellite and accurate flood data observed from the gauged station of the downstream this study can provide advantages in monitoring the hydrological processes of the lakes and glacier drainage system.
GLOF from Lake Merzbacher is dammed by the South Inylchek Glacier, with a 62 km long glacier on the western side of the Central Tien Shan in Kyrgyzstan. Many glaciologists and hydrologists, most of them were the former Russia, have investigated this glacier-dammed lake since it was named by German, G. Merzbacher in 1902.
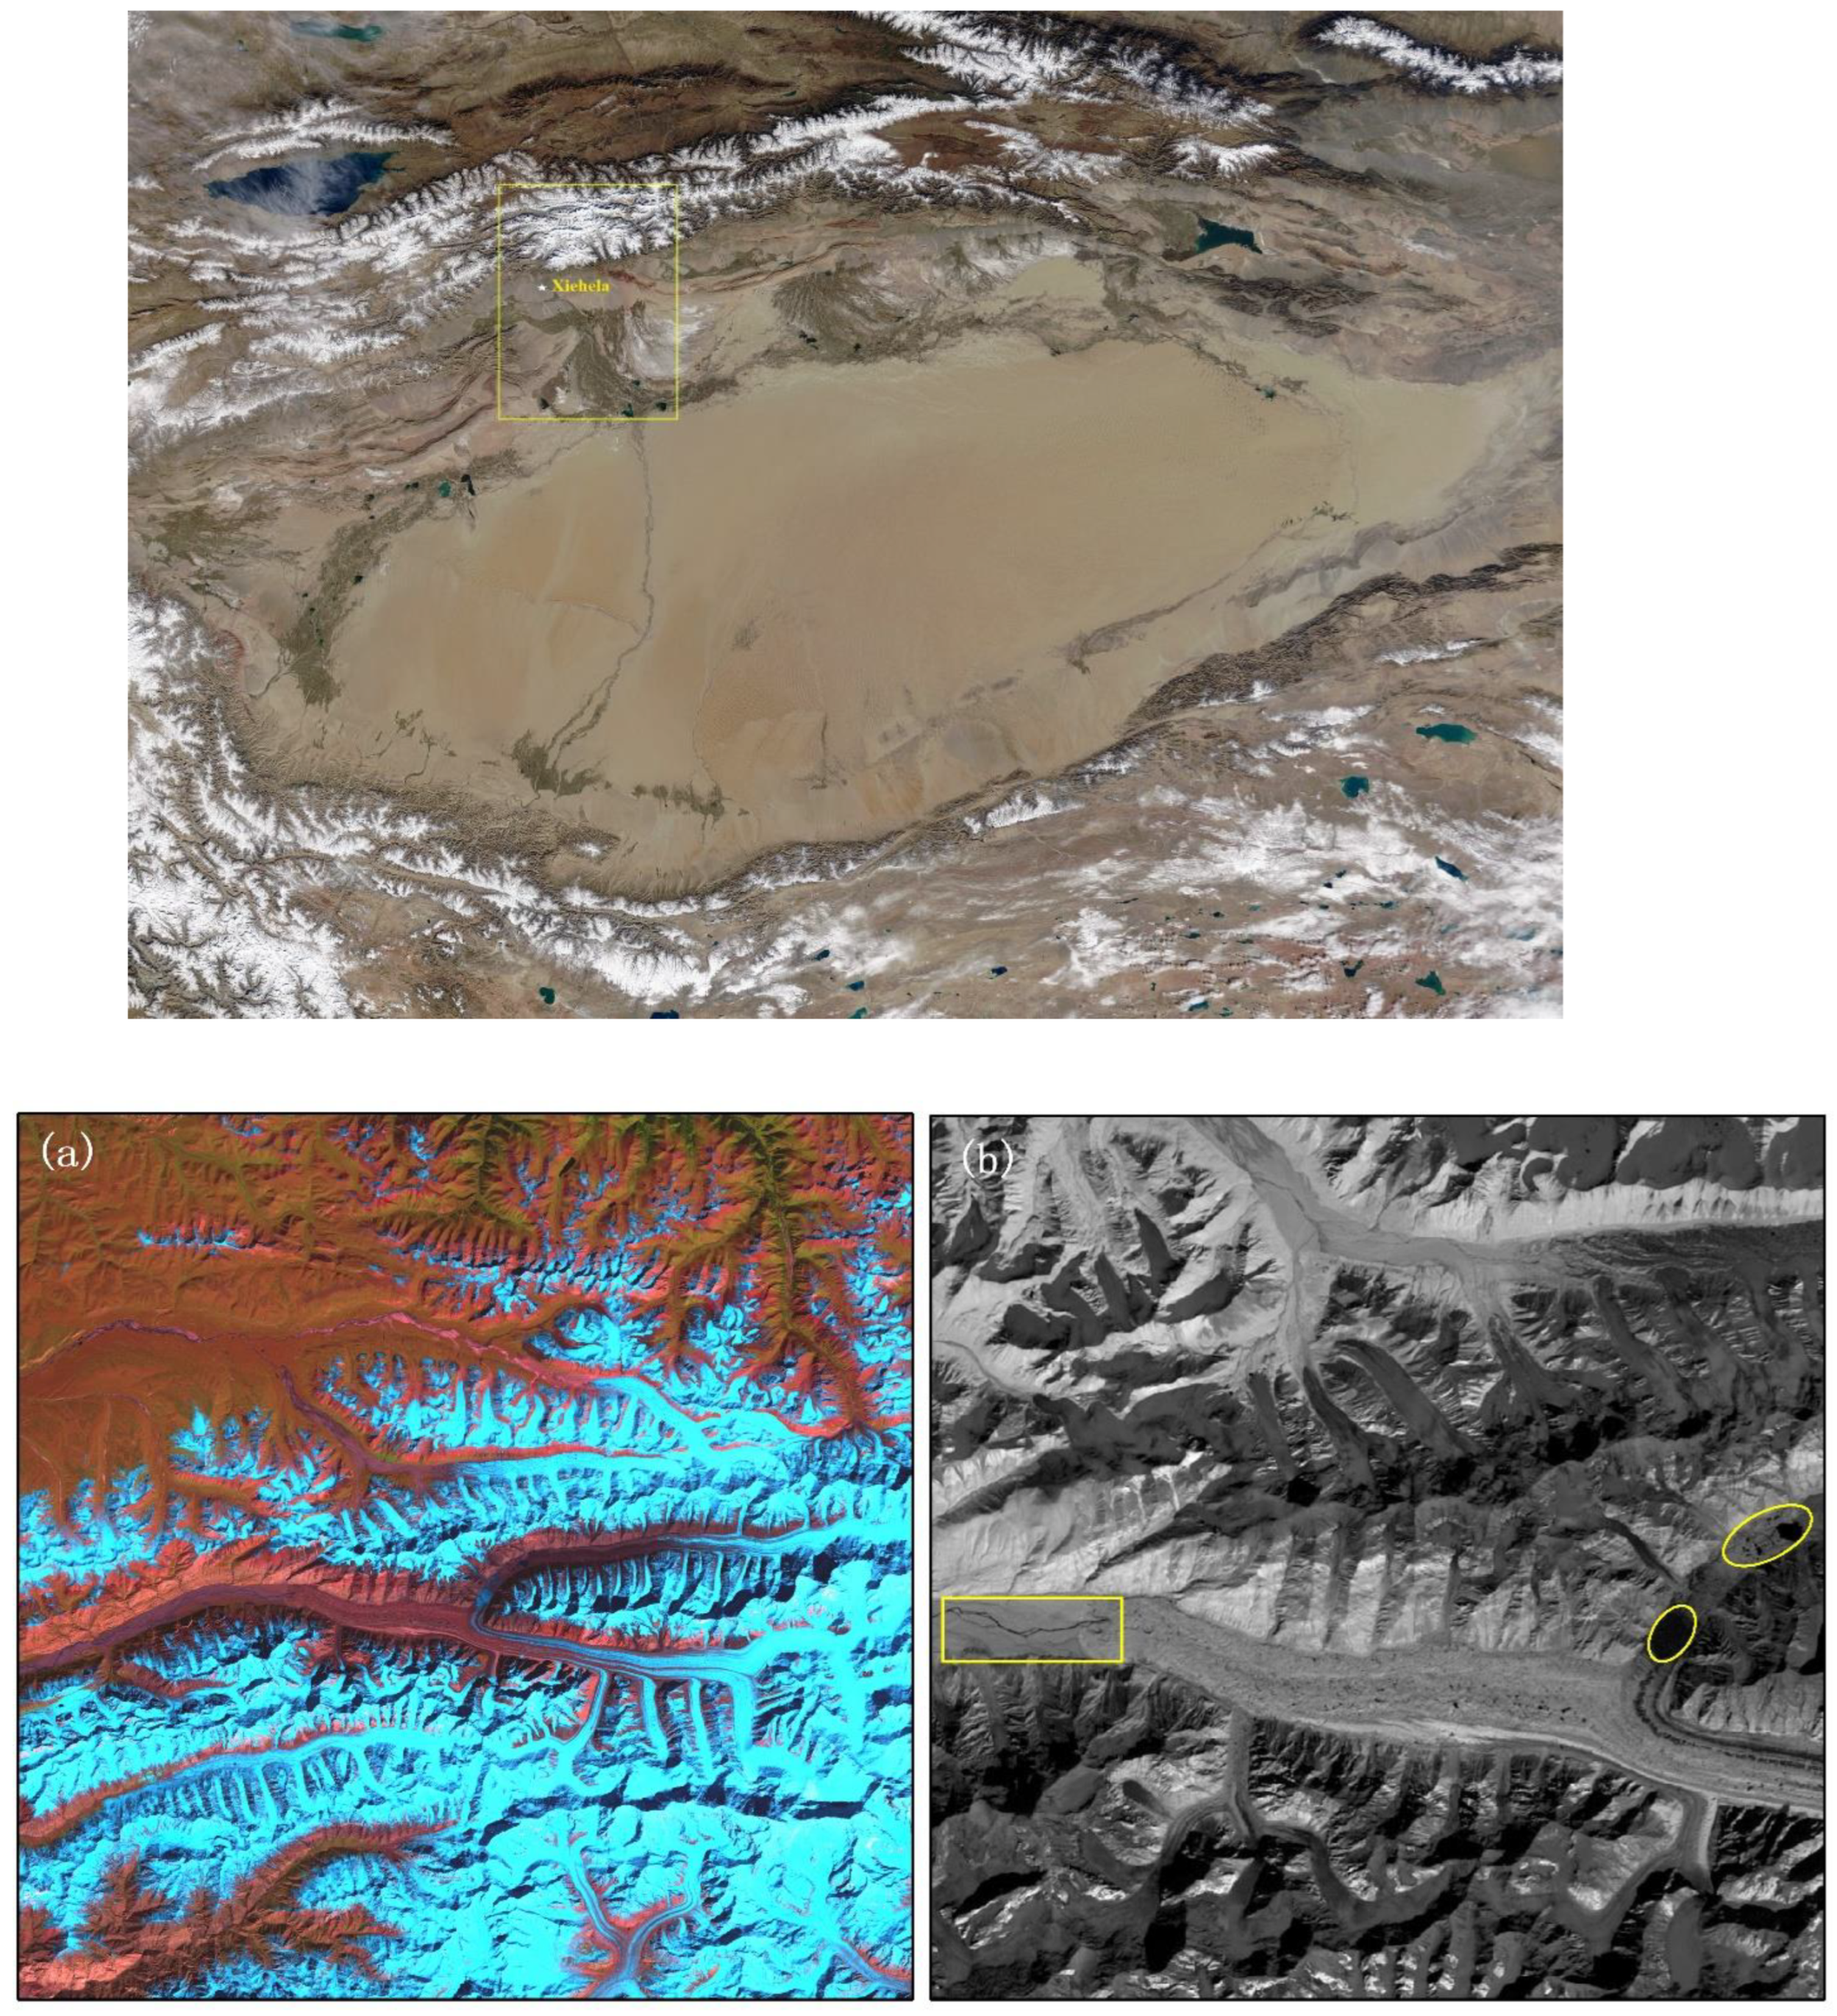
The Kunmalike River is located at the headwater of the Tarim River on the southern side of the China Tien Shan on the border of China and Kyrgyzstan. Its annual runoff volume is 49.4 x 10
8 m
3 measured at the downstream gauge Xiehela in Wensu county, China. The basin area is 12816 km
2.
Figure 1 shows the location of the river basin. Hydrological records indicate that GLOF occur frequently in the river. The source of these outburst floods is the Lake Merzbacher.
The meltwater volume stored in the lake at the beginning of the winter GLOF has ranged from 5.36 x 10⁶ m3 to 327.4 x 10⁶ m3. The lake drains under the glacier for distance of 14 km to the glacier terminus. From this point, the water flows into the Kunmalike River and then to the stream gauge at Xiehela with, a total distance of 203 km, since 1956, the Xingjiang Hydrological Service has recorded the all data of various floods.
The measured flood waves at Xiehela gauge are similar the hydrographs measured at the upstream in the Kyrgyzstan. The present paper describes the characteristics of the GLOF in cold season (October-December) from Lake Merzbacher and discusses the two principal objectives of forecasting method of daily discharges at the downstream gauge station and investigate drain passage at the glacier terminus.
2. Used data and methodology
2.1. Used satellite data
The sensor of Landsat 5 TM and Landsat 7-ETM had a 16-day repeat period, and data files of their image consisted by seven spectral bands with spatial resolution of 30 m and 16m. The Landsat 5 and the 7 were launched in July 1984 and 1997, the Landsat images used this study are obtained from the USGS Earth Resources Observation Science (EROS) website (
http://glovis.usgs.gov/). All image data are processed to terrain accuracy and a standard level of geometric (
https://landsat.usgs.gov/landsat-processing-details). Two path/row configuration (147/031) cover the glacier lake and the Merzbacher lake; therefore, theoretically, Landsat images can provide data with a quasi-eight-day period.
2.2. Flood data
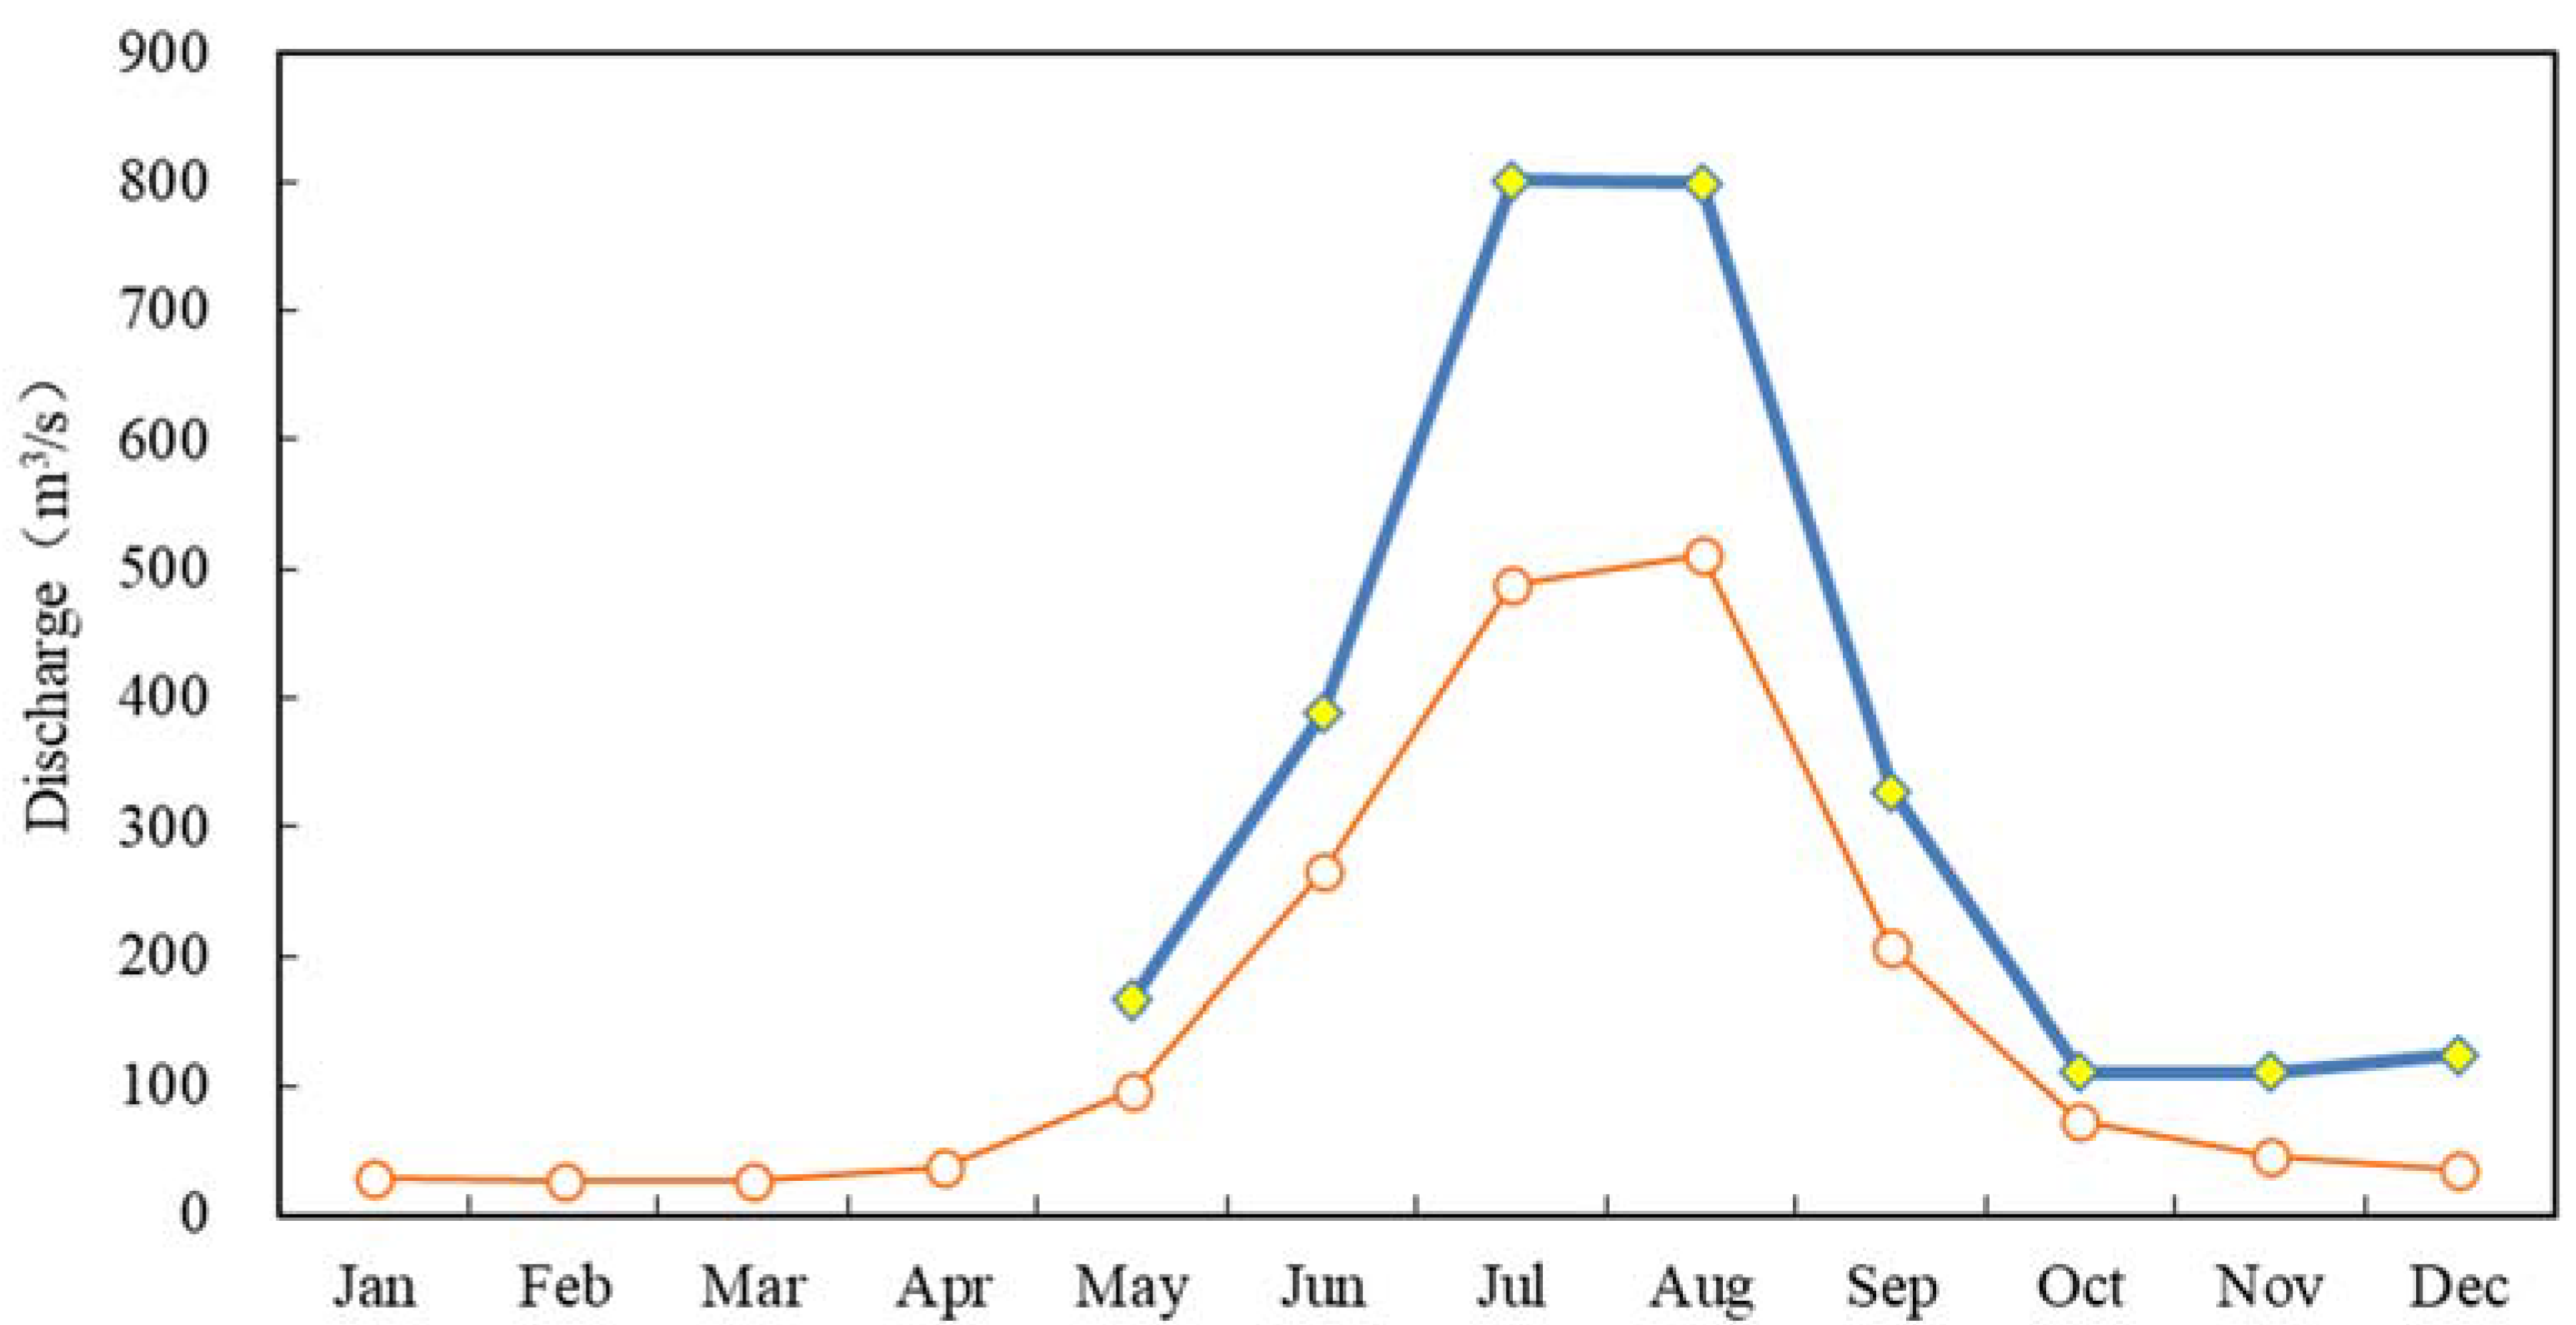
Figure 2 illustrates that the monthly average discharge with impact of GLOF (blue line) are much larger than that without the impact, the bigger the GLOF is the larger the monthly discharge, the former is 200% larger than the latter in May, 49% larger in June, 170% larger in July, 165% in August, finally 267% and 373% larger than without impact of Glof in November and December, respectively. The larger month flow indicates a signal that a Glof maybe occur soon.
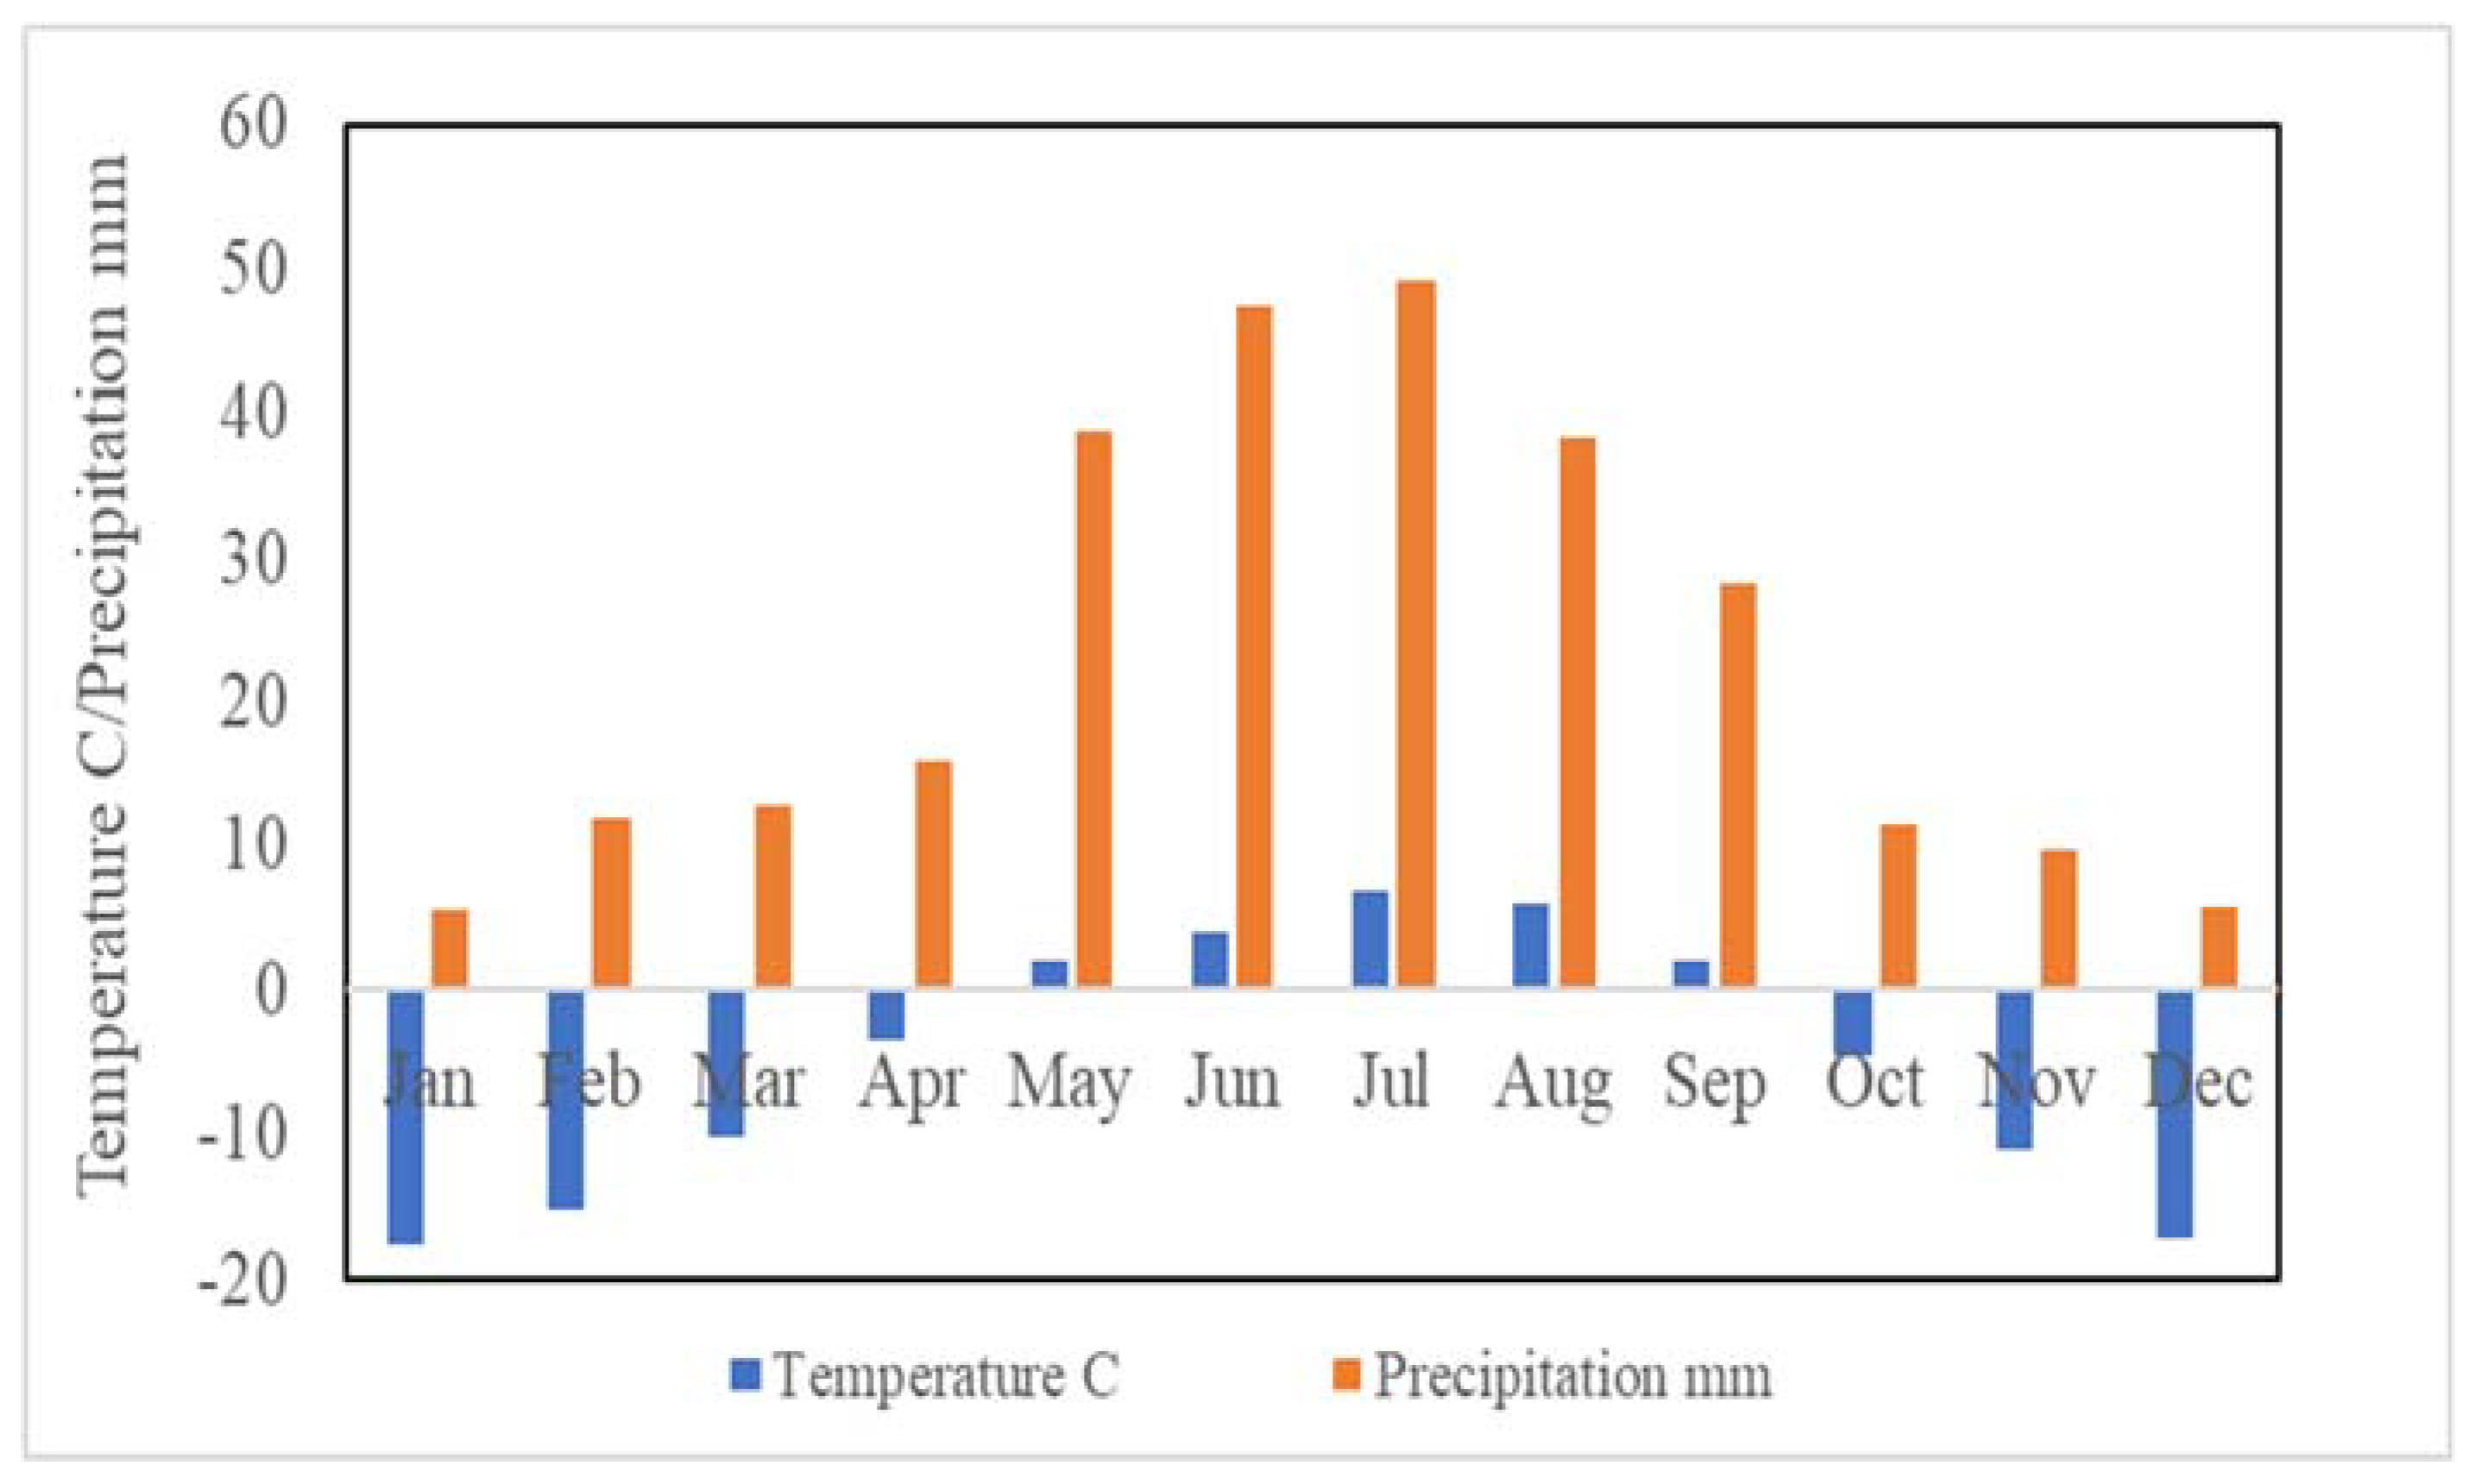
The cold season at the central Tien Shan station (3600 m, asl.) is from October to April next year when air temperature is below 0
oC as shown by
Figure 3, meanwhile, the snow and glacier melting occur during May to September, respectively. When air temperature rise high than 0
oC, the maximum monthly discharge occurs in July, instead of August as shown in
Figure 2, when both monthly air temperature and precipitation are highest and largest because of the meltwater storage in both the huge Inylchek glacier and Merzbacher lake and glaciated surrounding areas, then the Glof occur frequently.
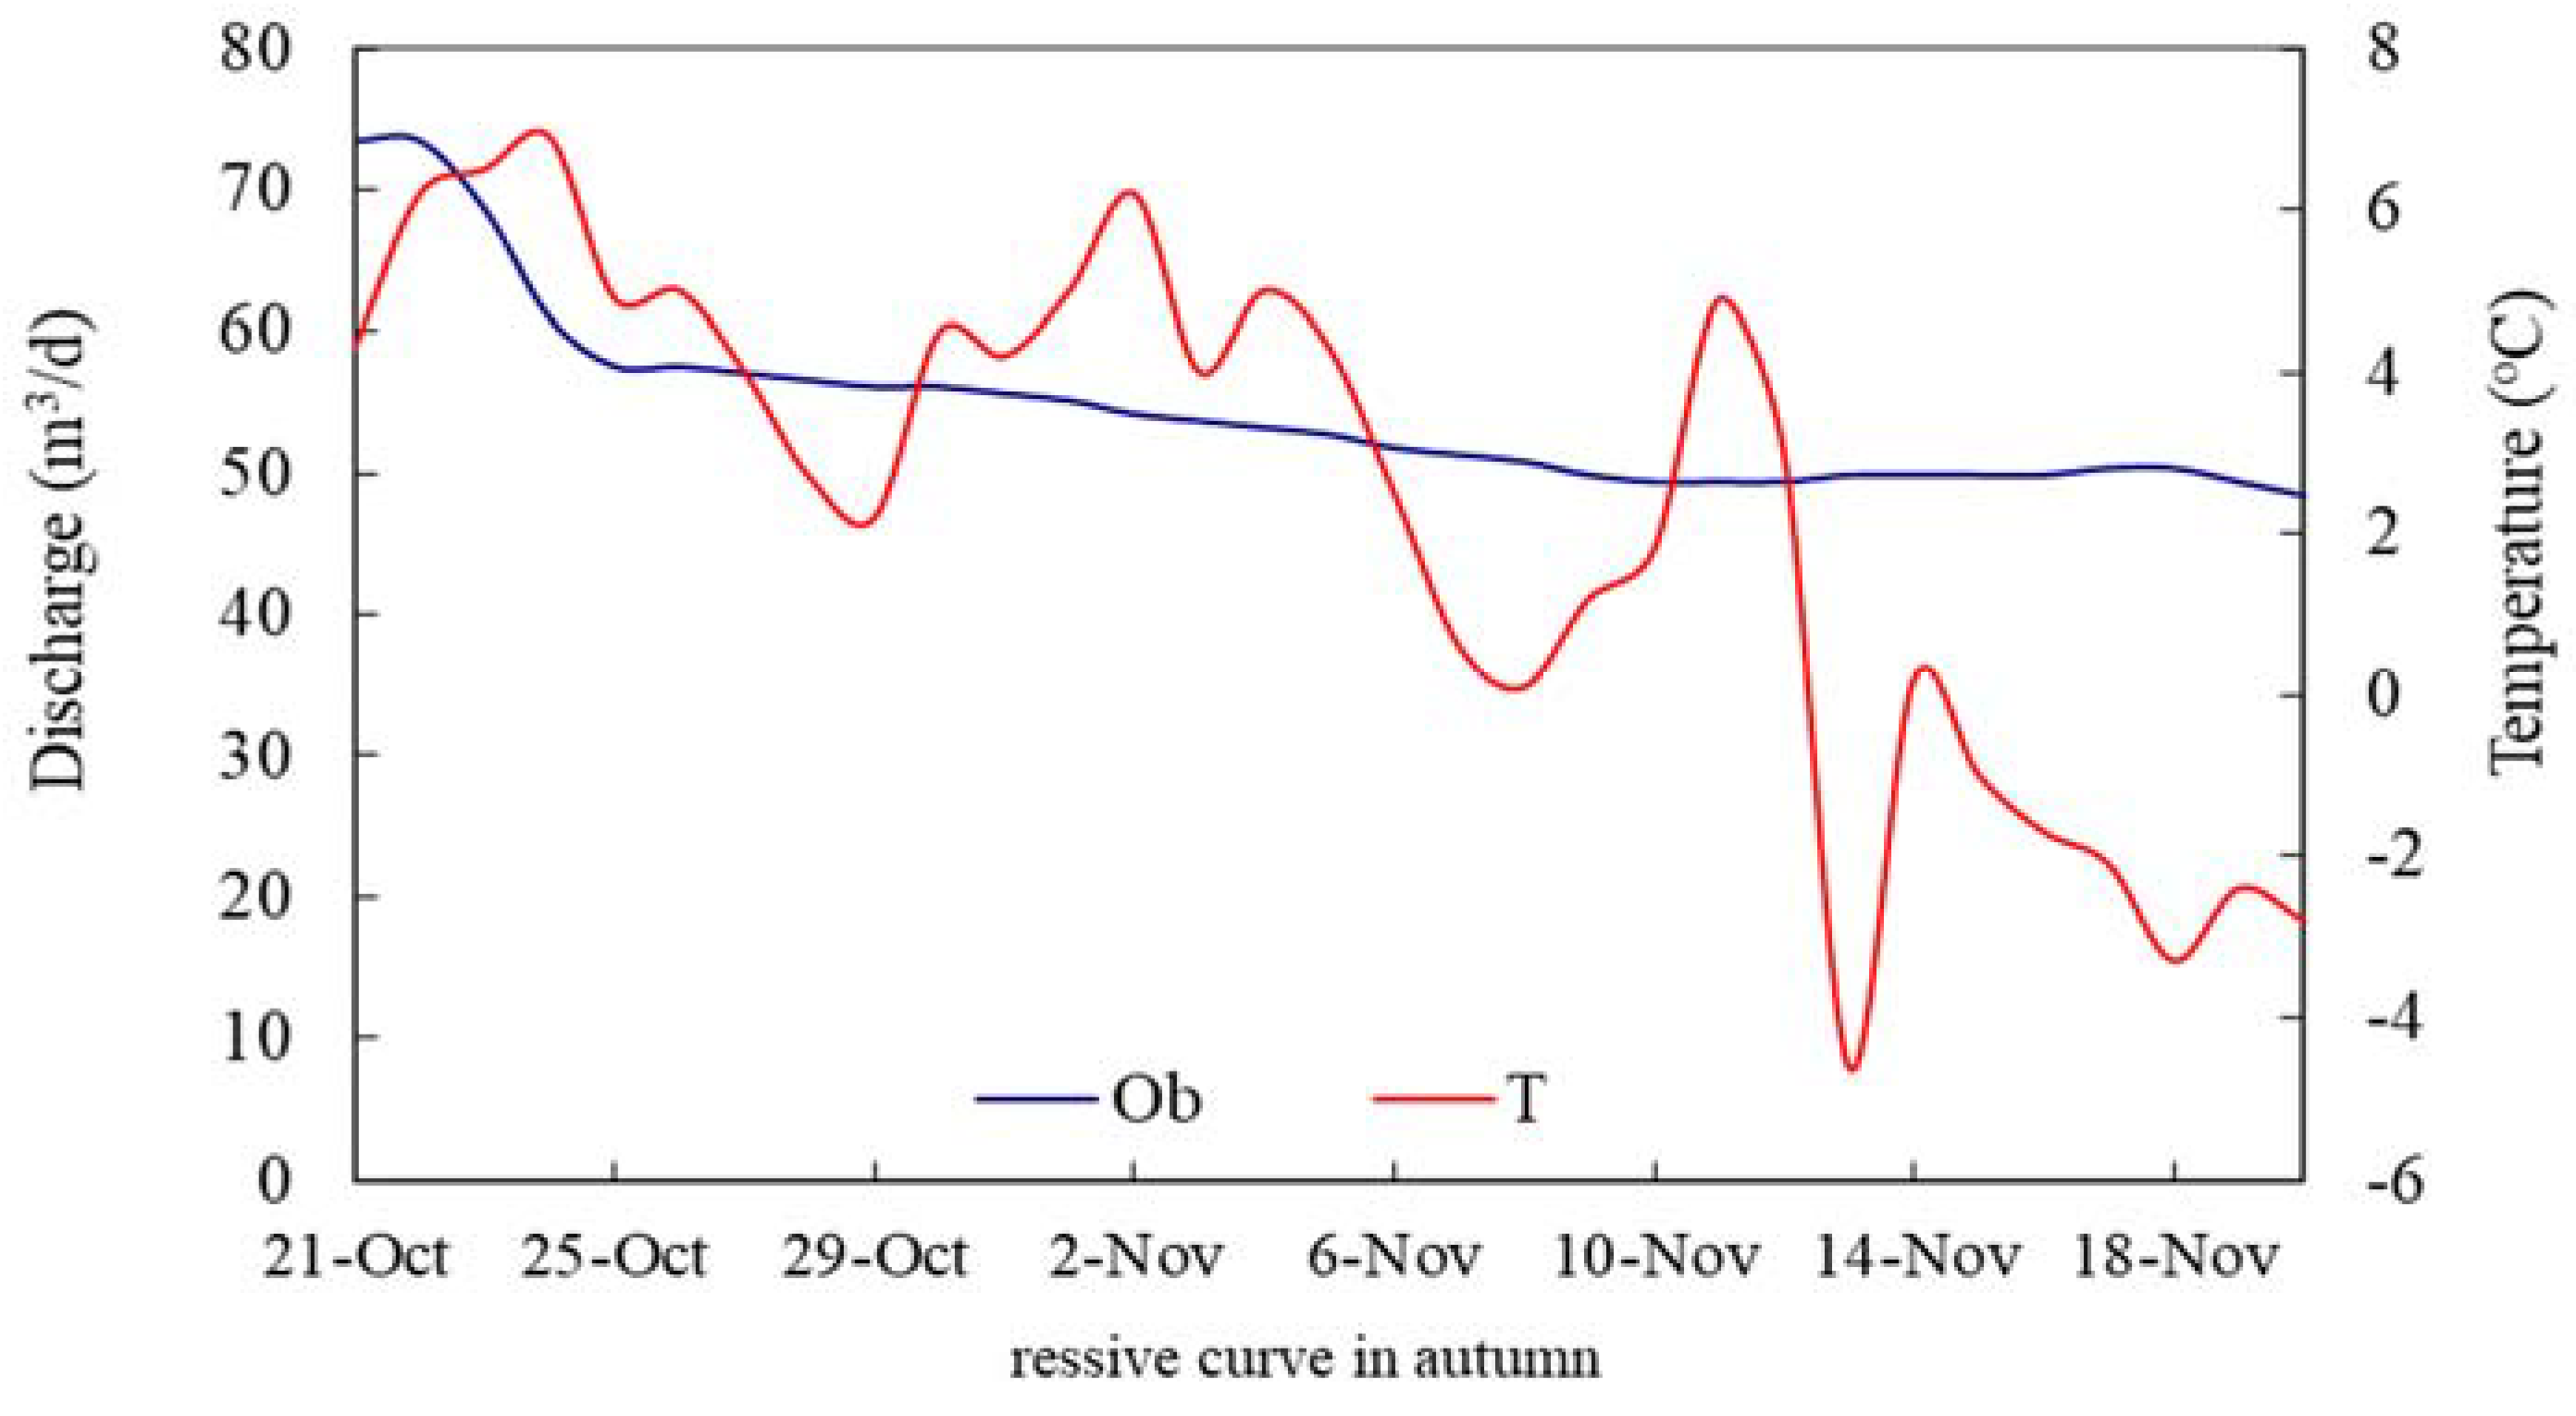
Figure 4 represents a hydrograph of normally recessive curve at the gauged station in the cold month, the discharge gradually declines with the lowing air temperature.
The flood discharges and volumes of historical GLOFs in cold season were recorded at the Xiehela (39°34′N, 77°13′E, 1400 m, asl.), located in the downstream valley of the Kunmalik River, all daily data are available from the dataset of the station. The observation of the river stage in the low water was carried out by manual way twice at 10 am and 20 pm of the Beijing Time every day when the river is in freezing up.
Table 1 lists some characteristics of the winter GLOF observed at Xiehela gauge station.
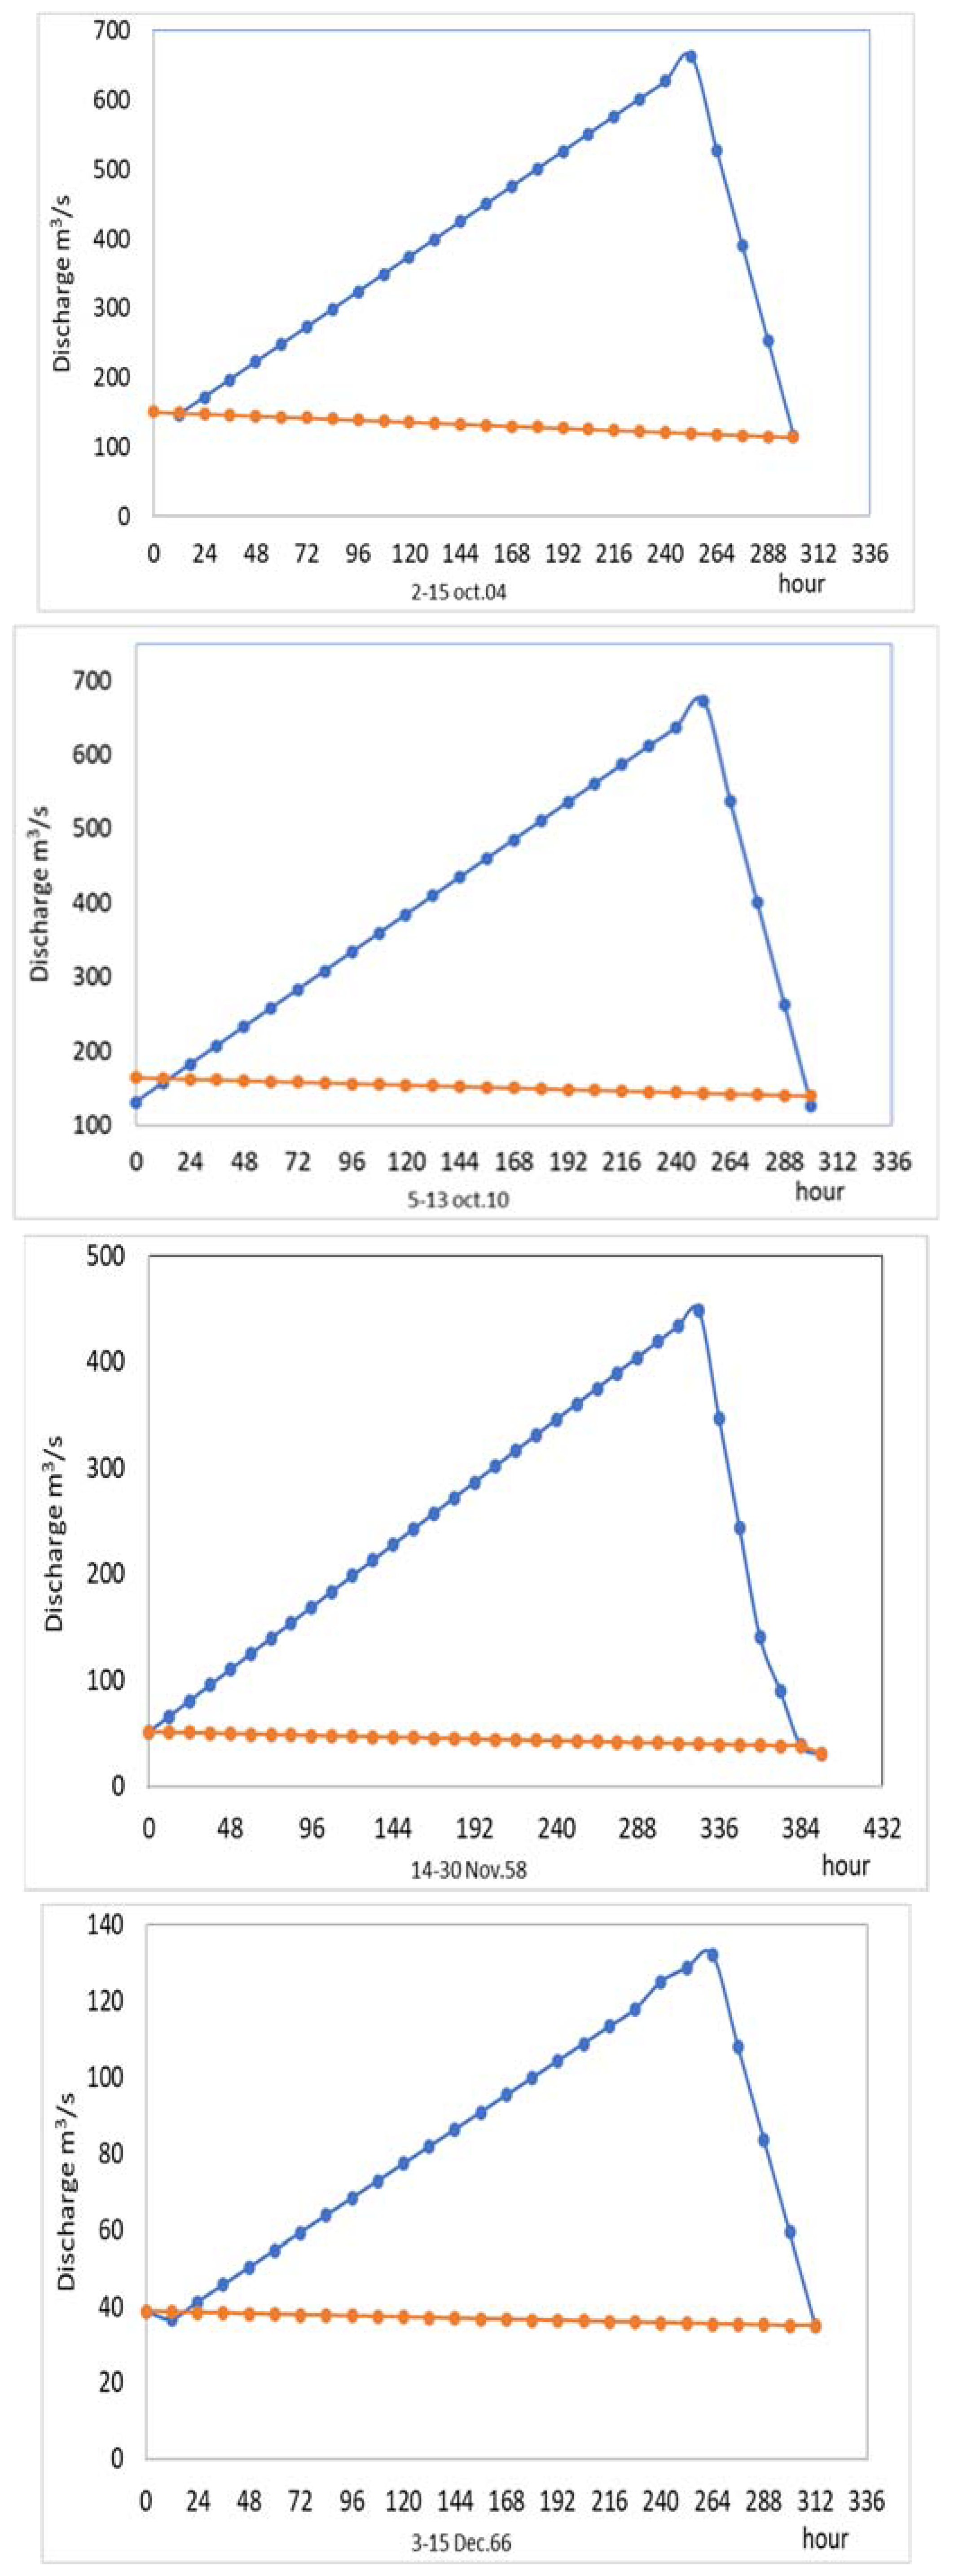
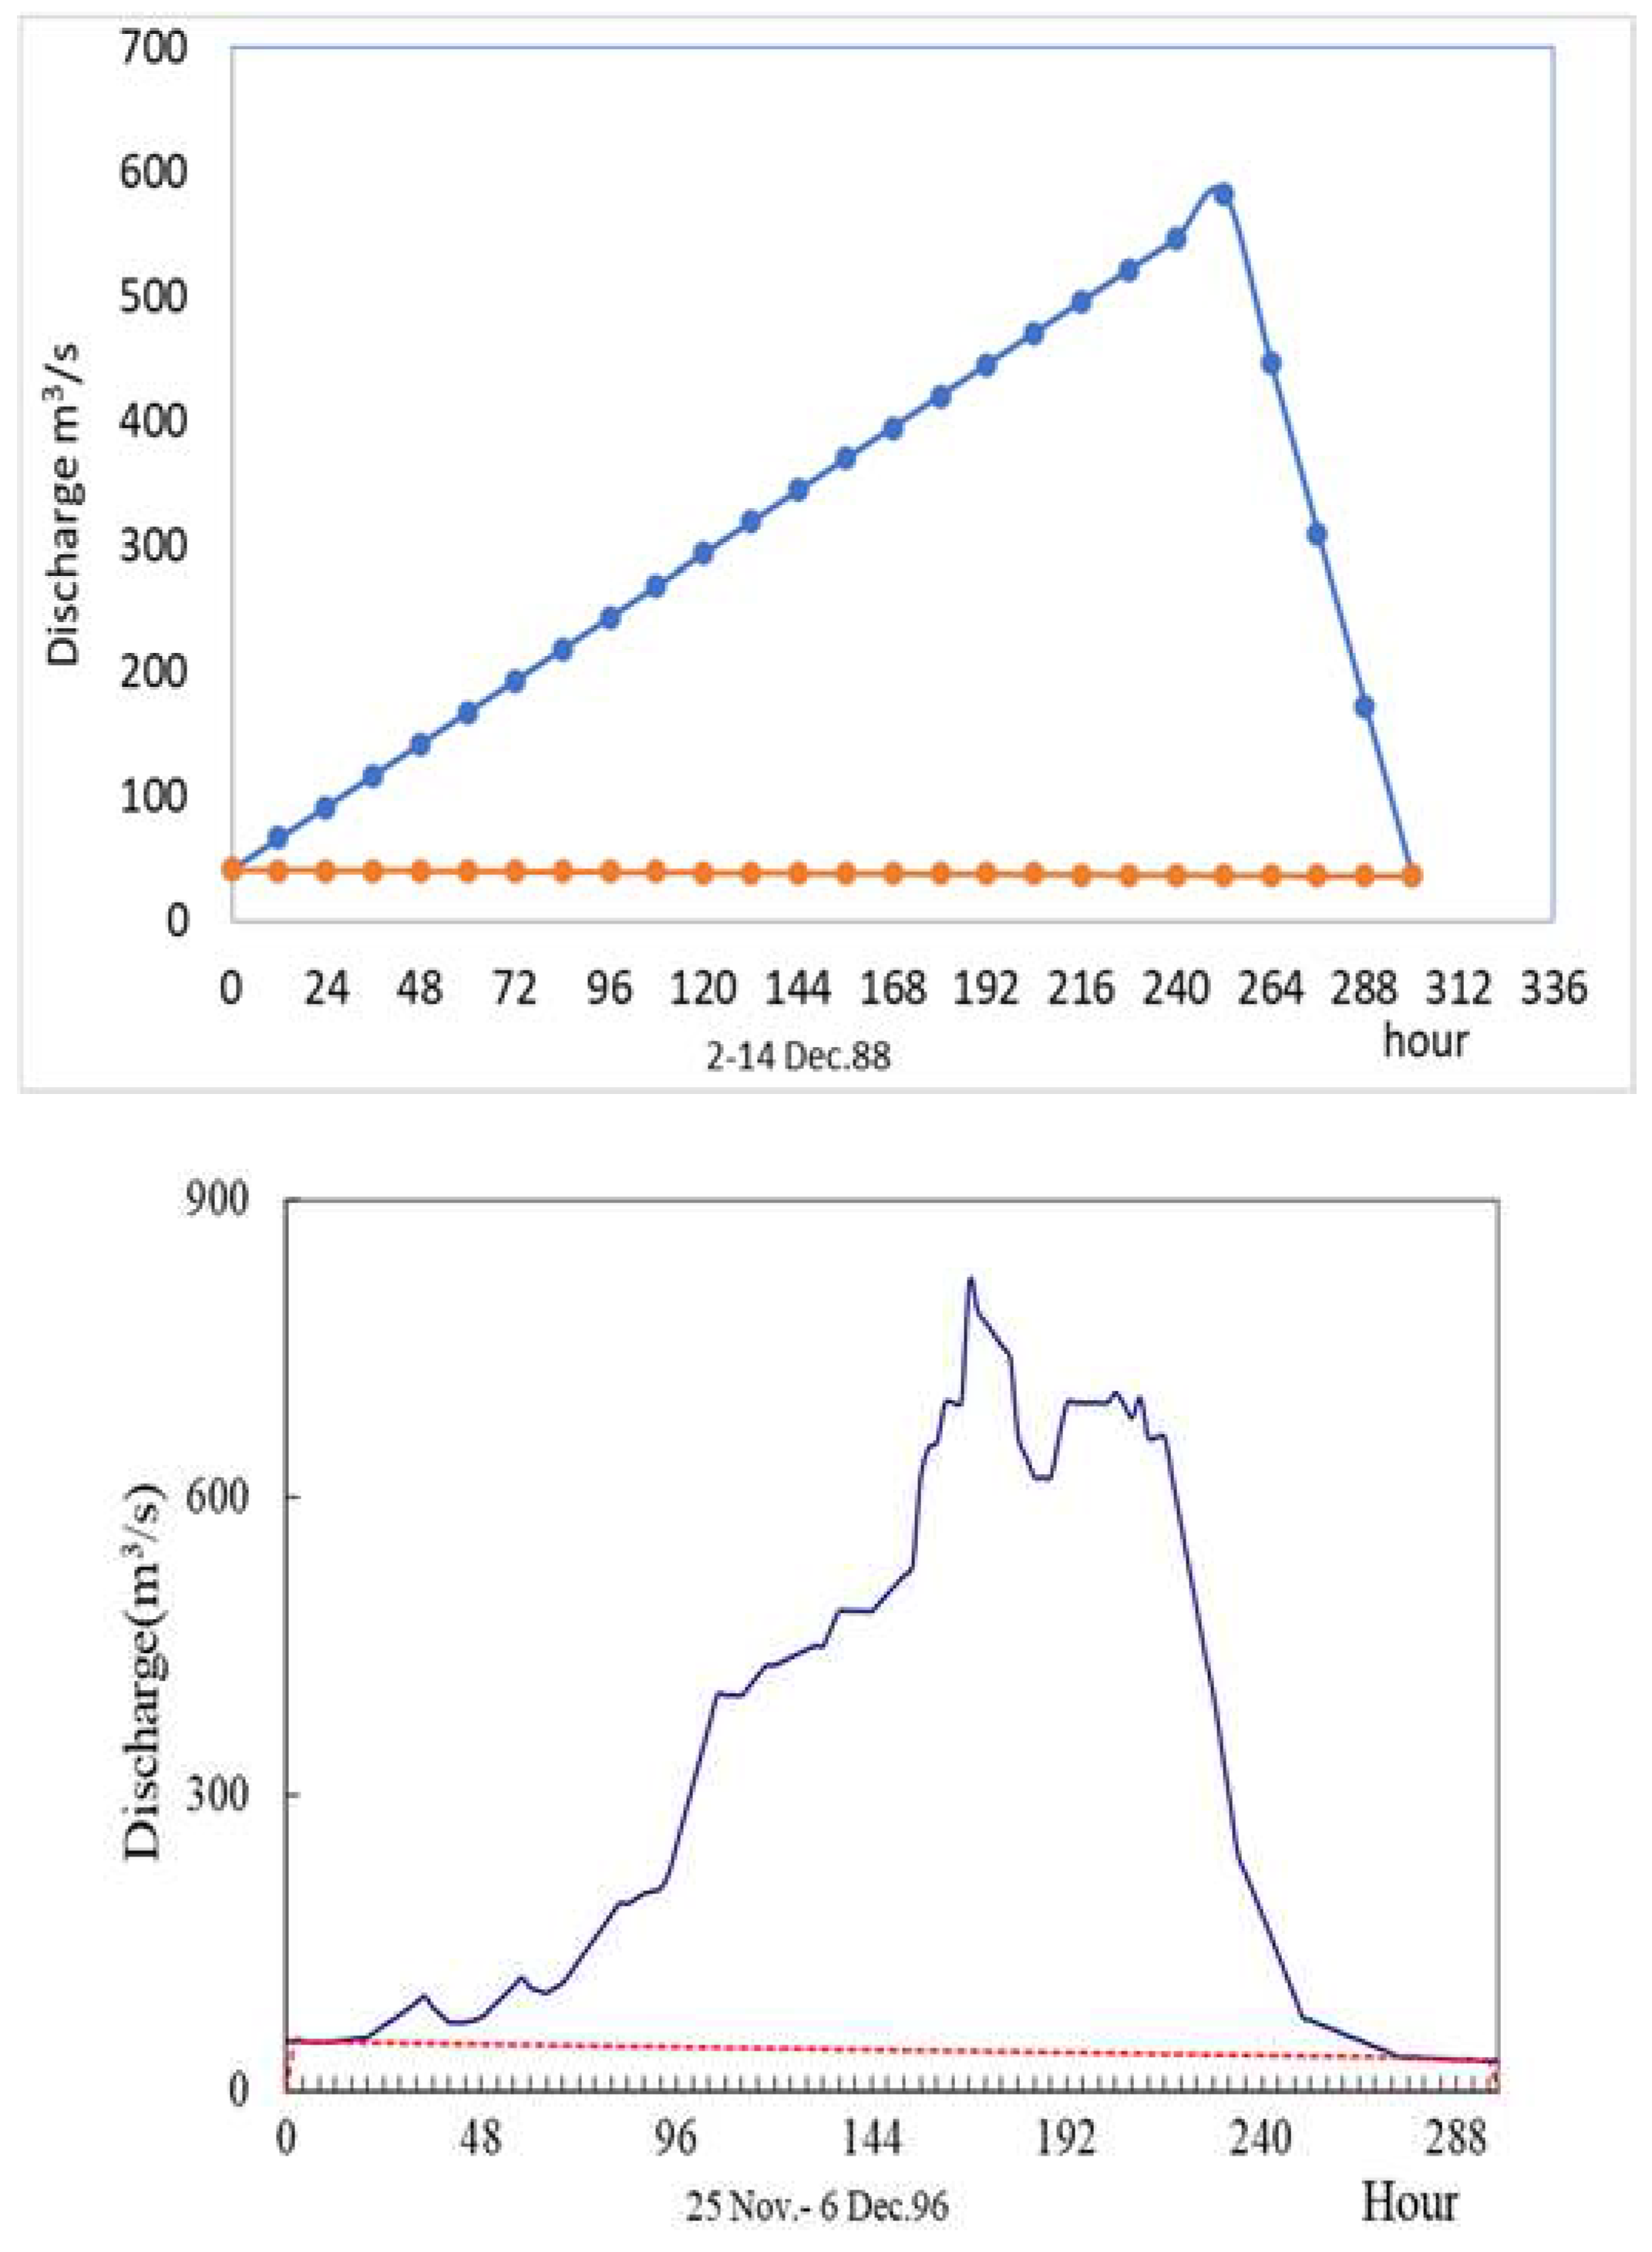
Usually, the period of one winter GLOF is about two weeks, while the longest duration was 18 days in 1958. The winter flood gradually rise in a linear function up to their peaks, then drop abruptly in less than three days to the base discharge as that as the first day in the beginning, and seldom in less than 24 hours. The peak discharge of the maximum winter GLOF is six times bigger than that of the minimum Glof. The water volume drains with a mean of 1.64 x 10⁸ m3 for each winter GLOF, which is 3.8% of the annual runoff at the gauge station. The largest volume of the winter GLOF was 2.836 x 10⁸ m3 in 1996, which corresponds to the average total runoff in four months during December to March. Systematic pattern can be found in the timing of the winter GLOF, in other words, more than 80% of them occurred between the late November and the early December.
2.3. Method description
There are two steps to process the satellite image of the lake area in the cold season for this study. the first one makes a standard of composited false color using the near-infrared (NIR), red and green band, respectively, this is a very effective processing to distinguish water bodies from other objects on land surface. For the charge-coupled sensor, the band 4, band 3 and band 2 were used to generate the composite image. For the sensor TM, band 4 (0.76–0.90 μm), band 3 (0.63–0.69 μm) and band 2 (0.52–0.60 μm) were chosen for the composite image.
The second step is to identify water body via visual interpretation by an expert using ArcGIS software, by this technique, the glacier lake and its outlet of flood drainage and the rivers of the downstream can be identified and delineated and its area is calculated. Then, the centerline of the lake can be derived using the tool of Collapse Dual Lines to centerline and its length can be estimated. Finally, the average width of the lake can be calculated easily by area/length.
The ascending discharge of the GLOF in cold season can be estimated by a linear function as follow:
where Q
o is the base flow at day d = 1 in the pre-Glof, d is day number of the ascending phase from the first day, and α is a constant of ascending flood curve every day in m
3/s. Both Q
o and α are obtained by fitting the linear curve to the GLOF discharge of the cold seasons.
3. Result
3.1. Prediction of the timing of the GLOF
The occurring probability of a winter GLOF in the last 64 year is about 9% in 1958, 1966, 1988,1996, 2004 and 2010, respectively, the shortest annual interval between two winter GLOF event is only 8 years. There was no any relationship between both the peak discharge and flood volume of the cold season GLOF and the winter air temperature.
The occurrence of winter GLOF has an important impact to the winter water resources in the Kunmalike River and runoff of the Aksu River and oasis in China. In some years, the North Merzbacher lake stores a lot of meltwater in the summer, then drains it in form of GLOF during the autumn or winter. Mostly the winter GLOF overlay on the normal subsurface flows in winter, thus the flood peaks have remarkably exceeded 38 m3/s, the mean discharge of annual December at the stream gauge.
The hydrographic curves of the GLOF show that the lake water drains out of the South Inylchek Glacier through gradually enlarging subglacial tunnels, this has been reported by Glzarin [8] after a summer GLOF in 1988.
Figure 4b shows the central outlet and flooding river bed under terminus of the South Inylchek Glacier. The curves are different from the graphs of GLOF in the Yarkant River on the China Karakoram mountains, where the lake sometimes outbursts with a breaking up of the glacier dam [21,32,34].
Figure 5 shows the daily hydrographs in picture of very regular triangle for five GLOF in cold season, except for that in 1996, which is the largest Glof on both the peak discharge and the flood volume in December, and shows a complex curve dissimilar as that as linear curve in the years of Glof in cold season, respectively, because the subglacial tunnels or the tunnel entrance maybe occurred burst or blocked by icebergs from the lake.
3.2. Expansion of the Merzbacher lake and outburst in 1996
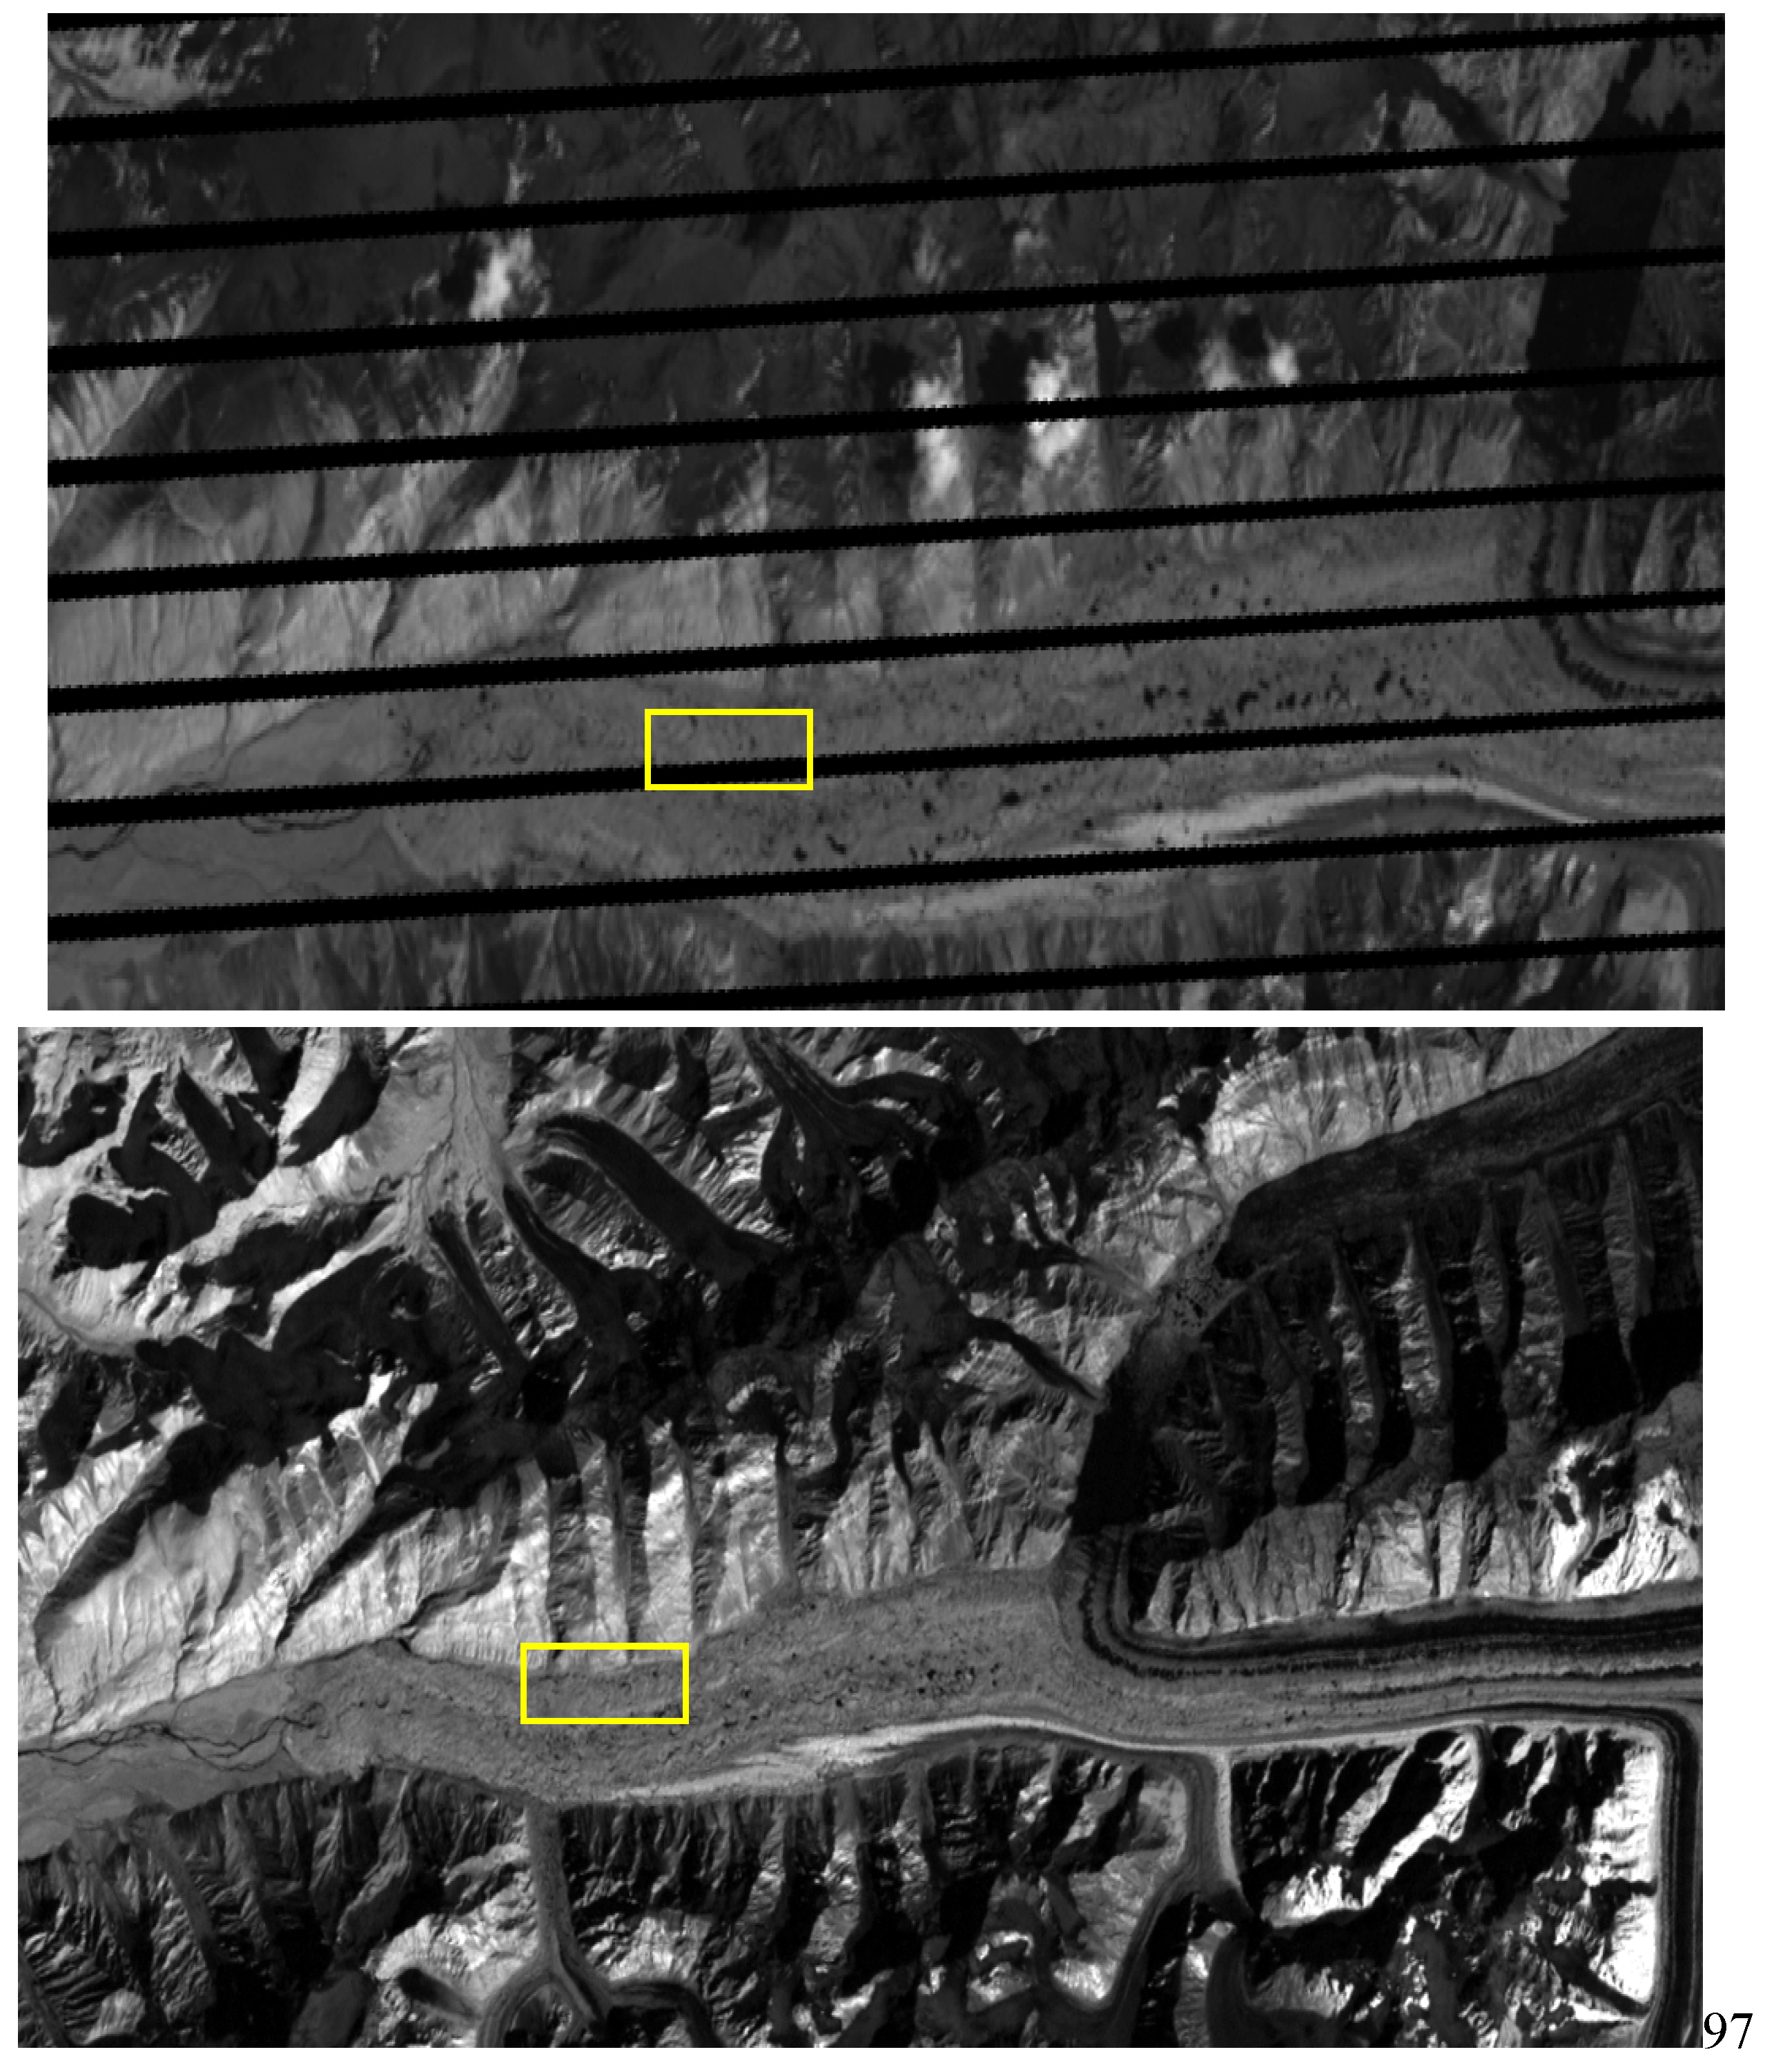
There is no any available image data for historical record of the lake water area before the 1990s, although three winter floods occurred in 1958, 1966 and 1988, respectively. Available and clear image data with cloudy cover in the studied lake area are from June to November in 1996 as listed in
Table 1.
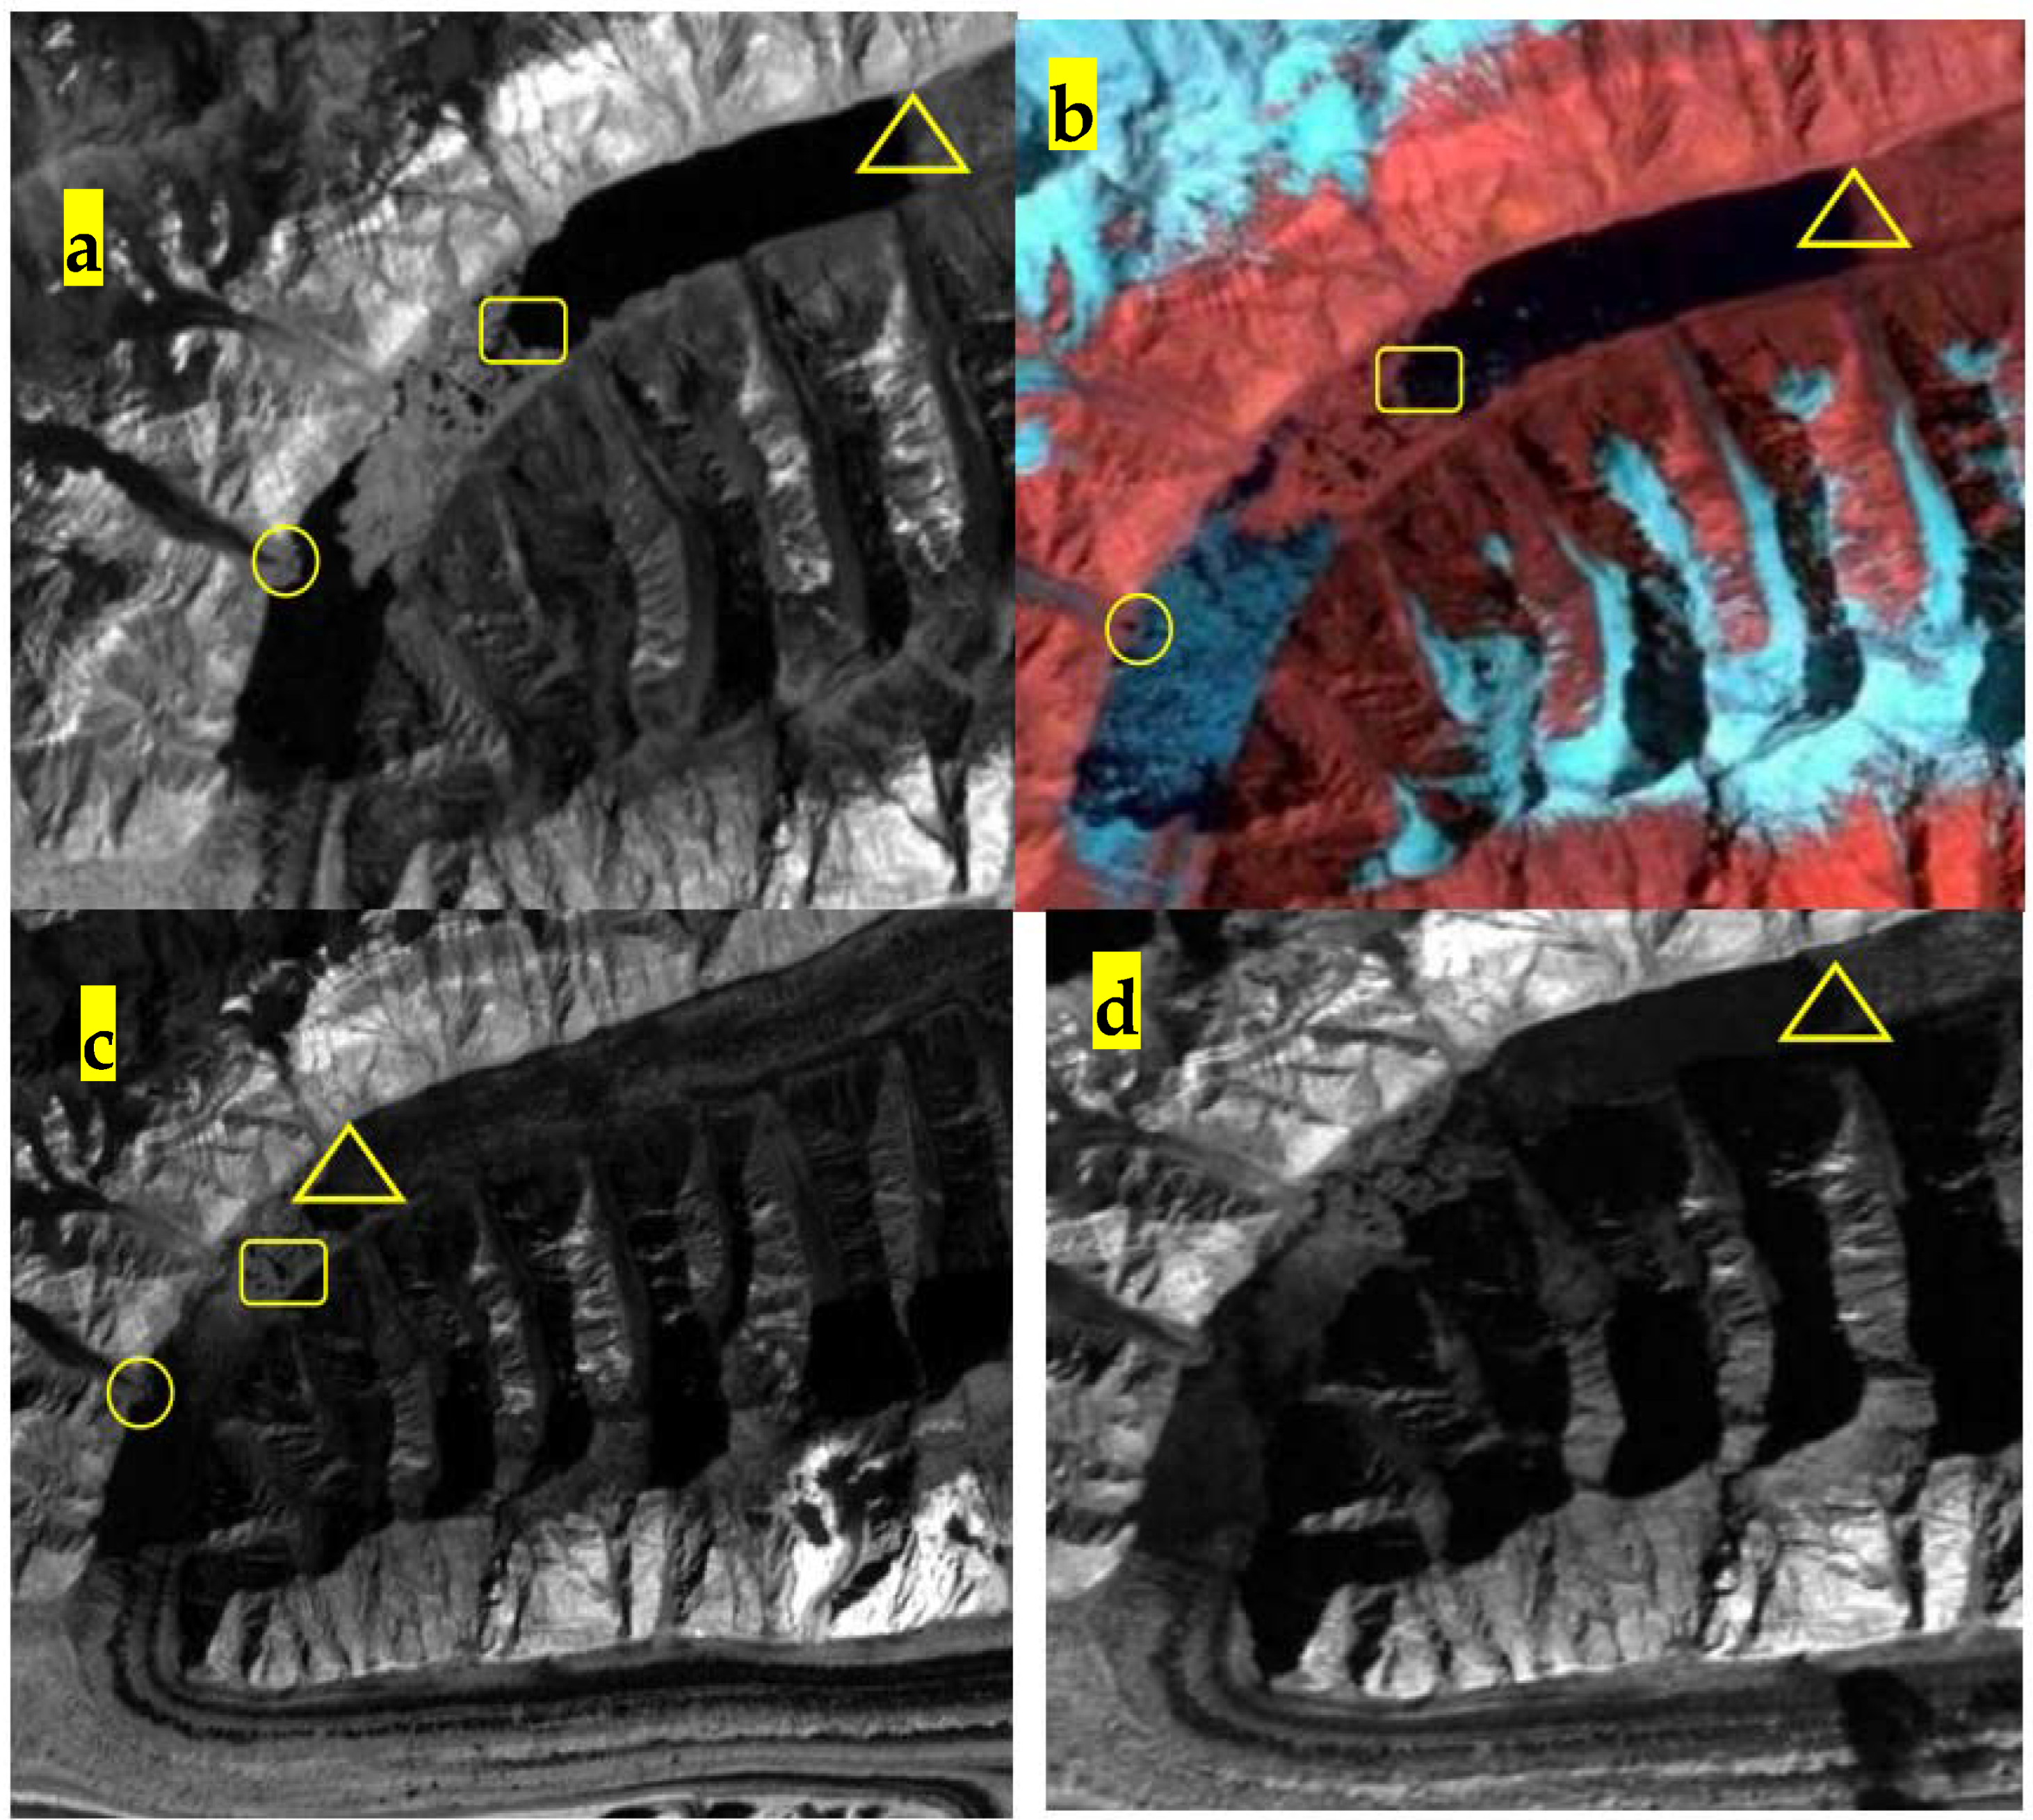
The total lake area was 5.94 km
2 in a length of 6580 m and an average width of 940 m in June 1996 as shown in
Figure 6a, then the lake was enlarged into 6.79 km
2 of the largest area with the longest length of 7180 m and an averaged width of 960 m on the 9
th August as shown in
Figure 5b, the lake area was slightly shrunk in 6.54 km
2 in September and 6.34 km
2 in October respectively, as shown in
Figure 5c, before the outburst in the late November 1996.
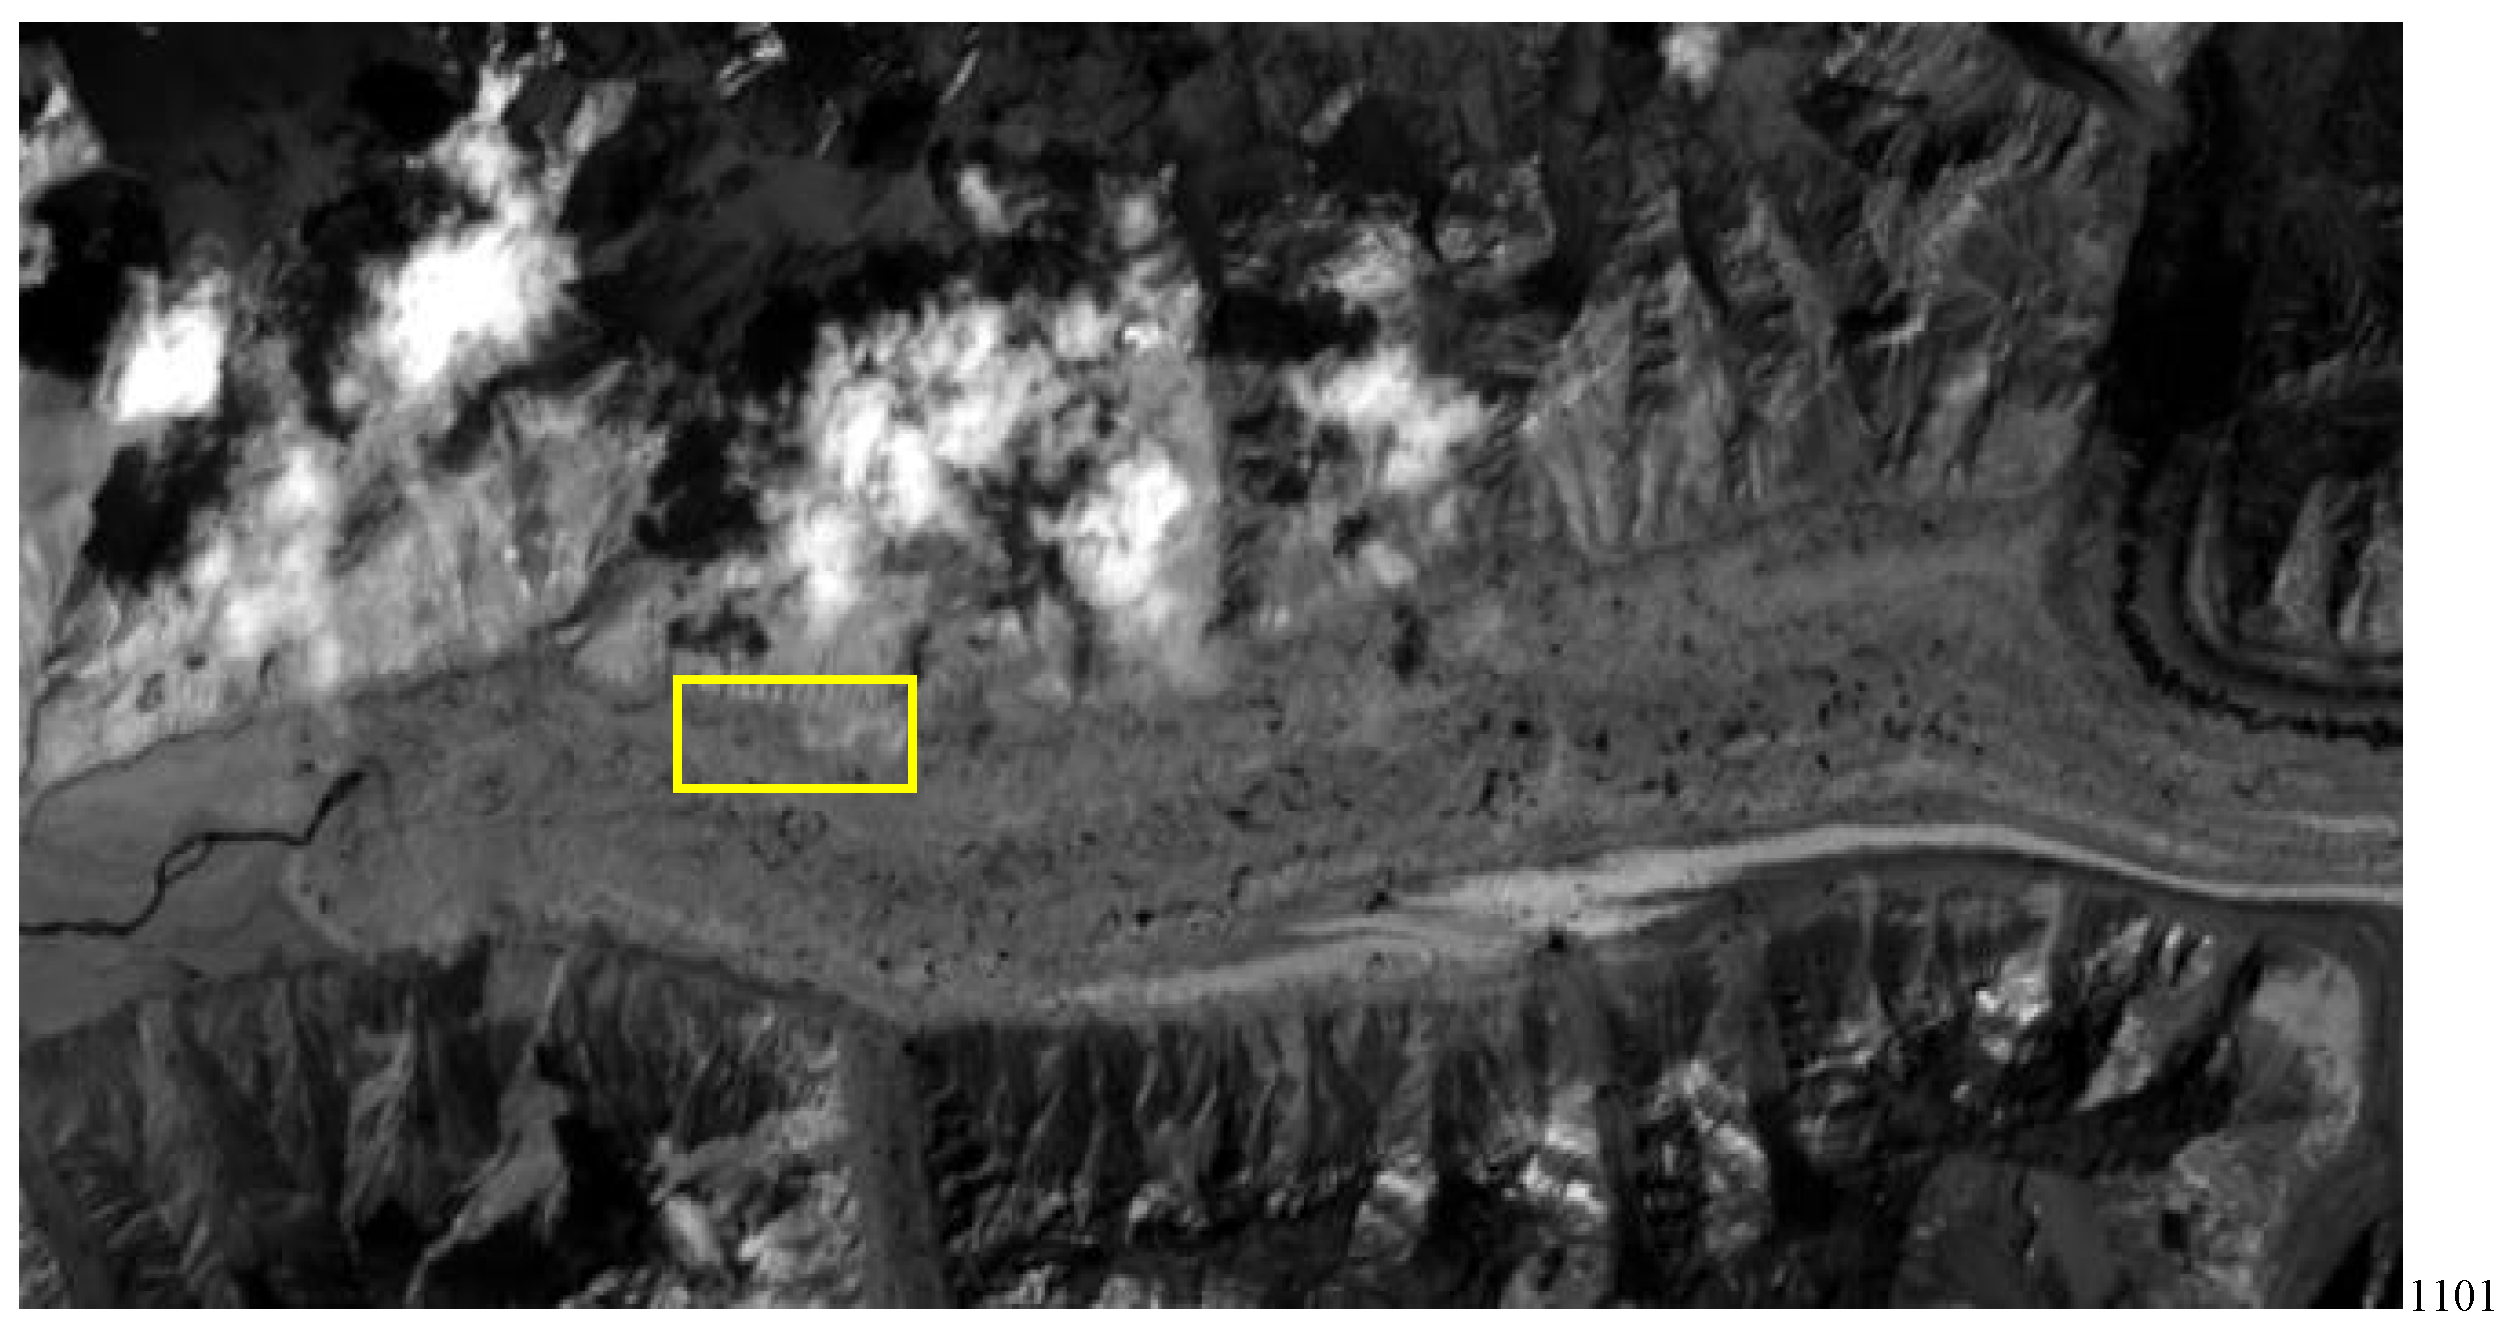
The yellow cycle, the triangle and box respectively represent position the left lake, the outlet position of right lake and the terminus of North Inyelchek Glacier. Size images of Merzbacher lake and terminus (yellow line) of the North Inylchek Glacier on 10 July (a), on 9 August (b) and on 15 October (c) 1996, 15 July (d) 1997 from Landsat 5 imagery.
The glaciated lakes usually release water downward to outlet after lake level rises by 90% at the height of the ice dam. However, winter GLOF has been triggered at lower lake levels. Further, the conditions of the glacier dam and the lake in winters are different from the cold winter to warm winter and are difficult to monitor. Prediction of the flood discharge of the winter GLOF is also difficult using theoretical models Ng and Liu [22,30], and Clarke et al. [23,31]. Such predictions would require data on the lake volume- elevation curve and data between the water depth and water temperature of the lake, these data are not readily available. Therefore, a forecasting model is constructed on statistics and the characteristics of their hydrographs.
If the mean daily discharge of the river in winter rise at a rate of 2 m3/s per day over one week or more, a winter GLOF is probably in development. Further, as the peak discharge once exceeds 20% of the first daily of the base flow, the prediction can be carried out by extrapolating the GLOF component Q in equation (1) as above. This component is derived from the measured daily hydrograph, Q, by subtracting the base flow Qo, and the daily outburst component, Qm, from the recorded discharge.
Figure 7 shows the values obtained for b in equation (1) as above. The peak discharge of the winter GLOF cannot be predicted accurately because we cannot predict the timing of the peak.
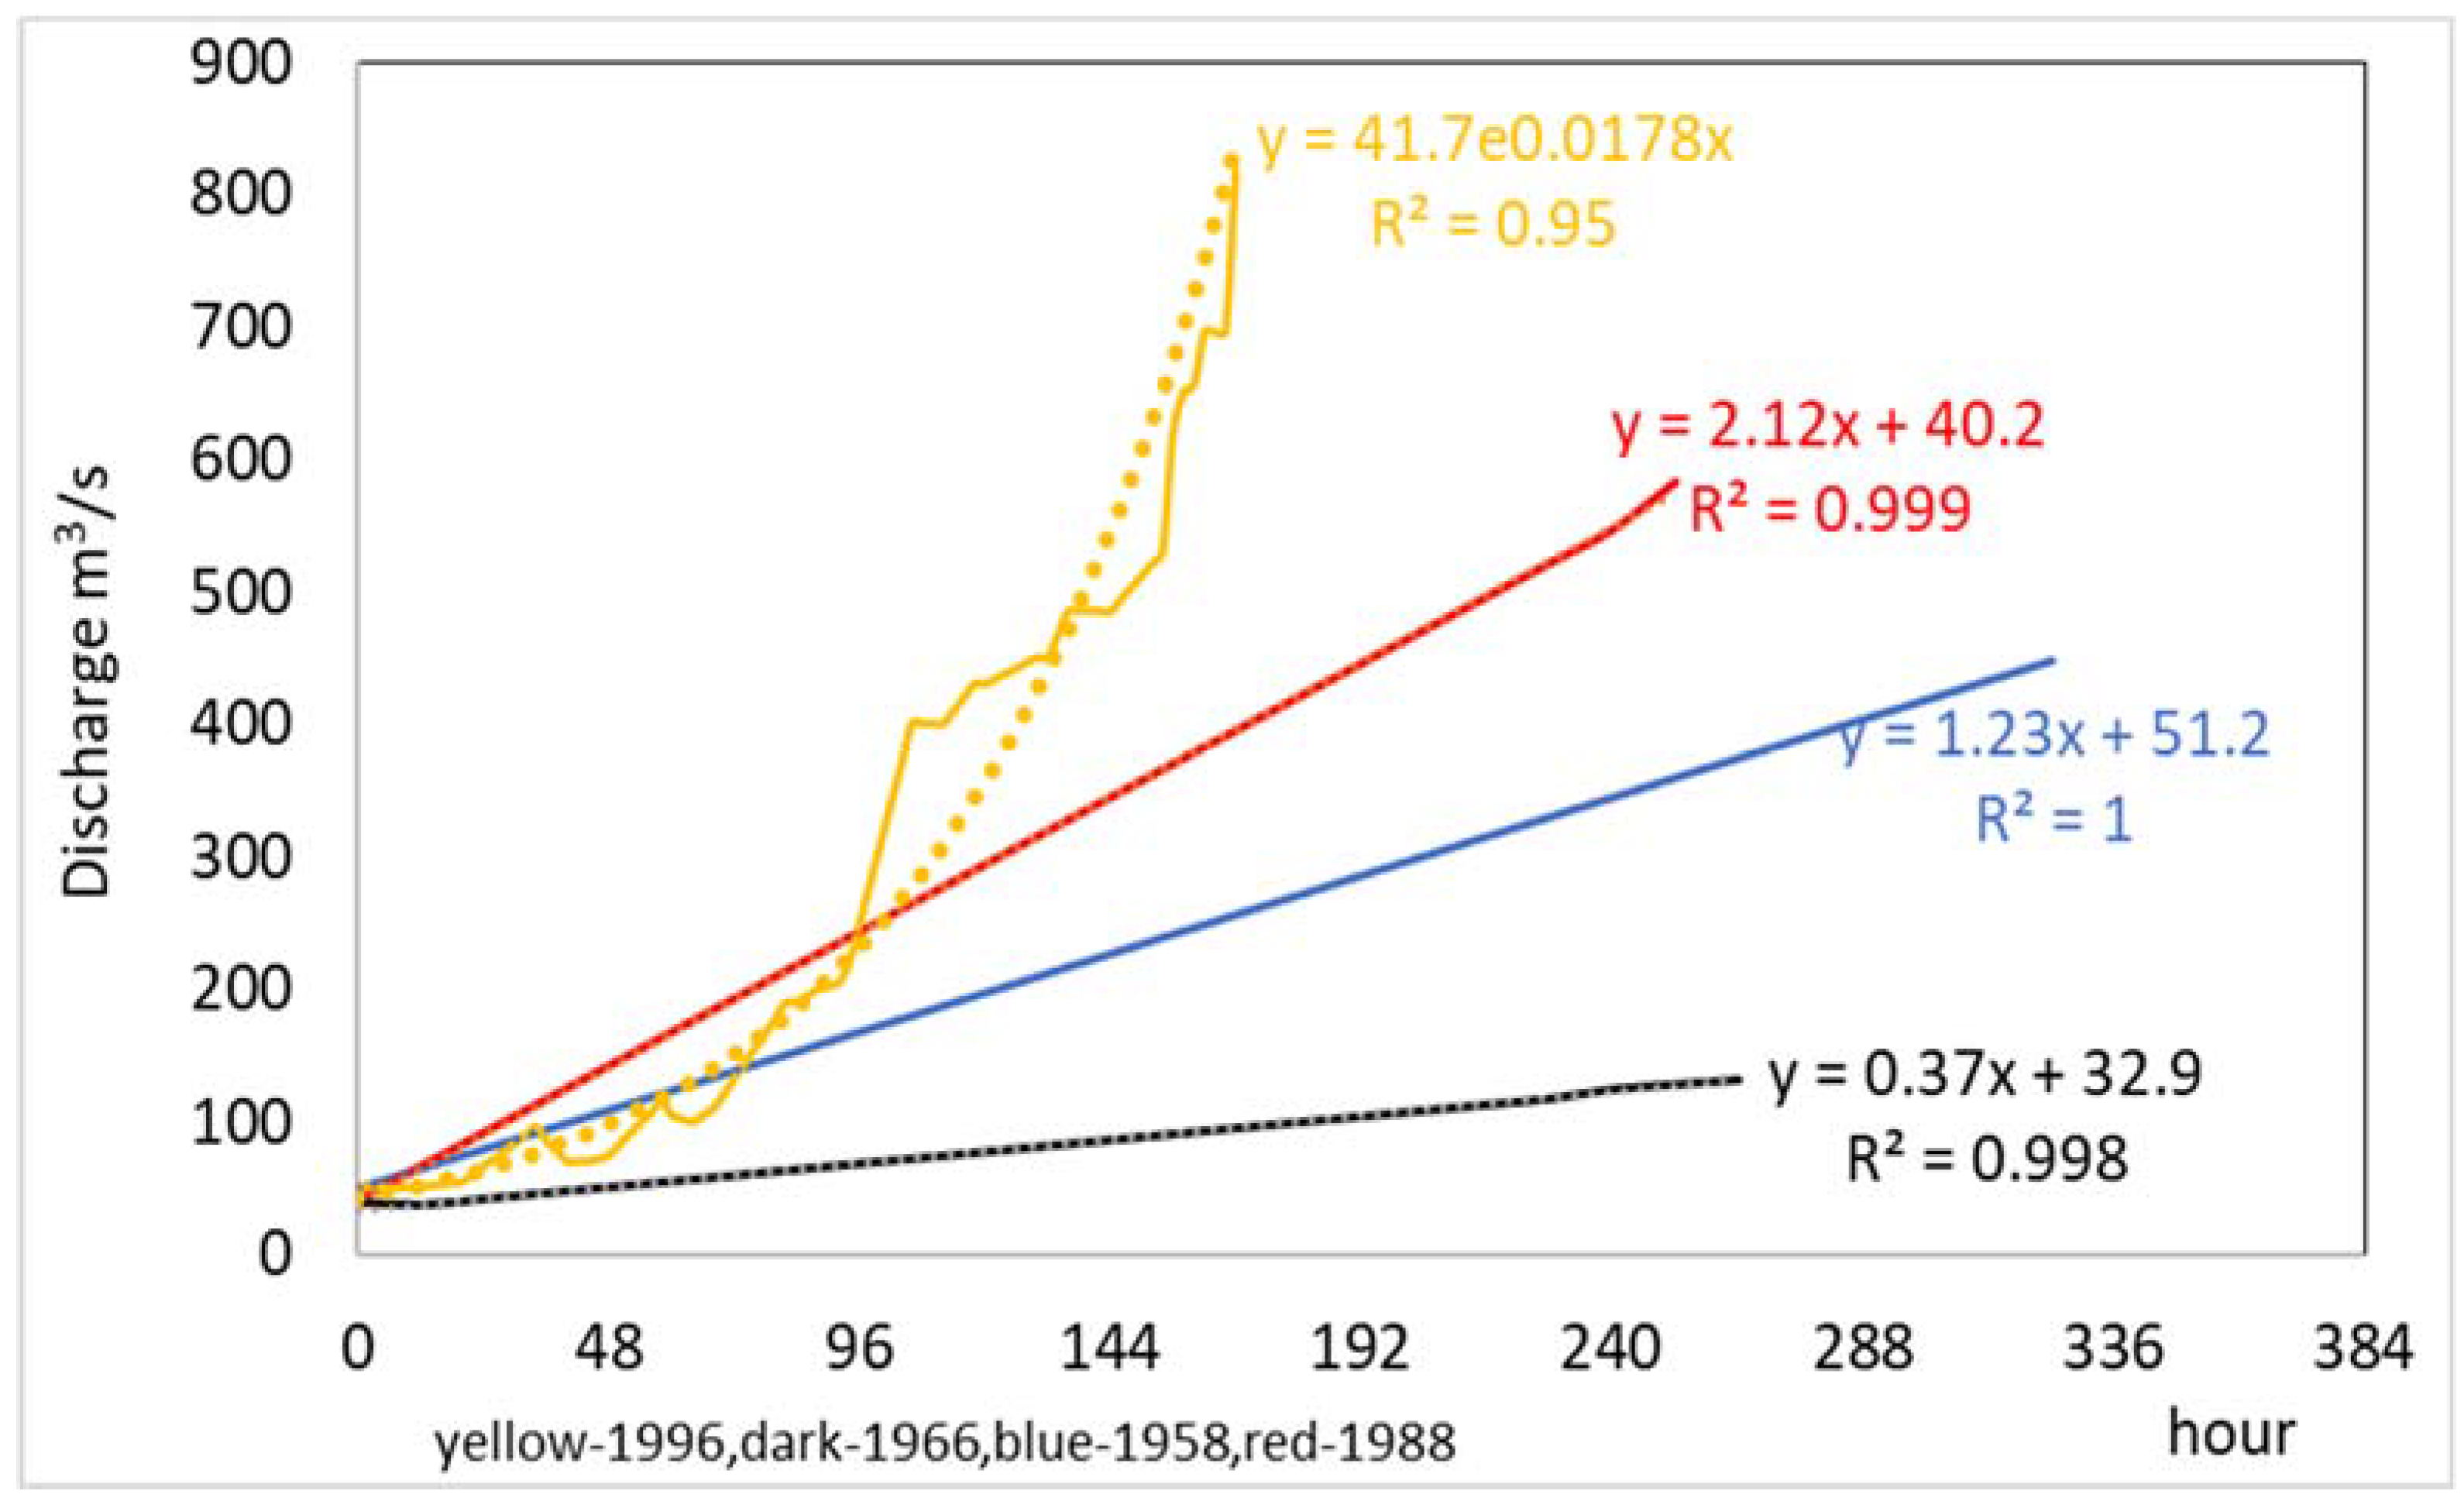
Table 1, however, shows that the ascending phase of a GLOF takes at least 10 days and usually 11 days in most of the winter GLOF (80%), the discharge increases approximately in linear curve with time after the first ten days.
Figure 6 compares a linear relationship with the measured hydrographs, the mean error of using the linear relationship is 10% of the measured discharge.
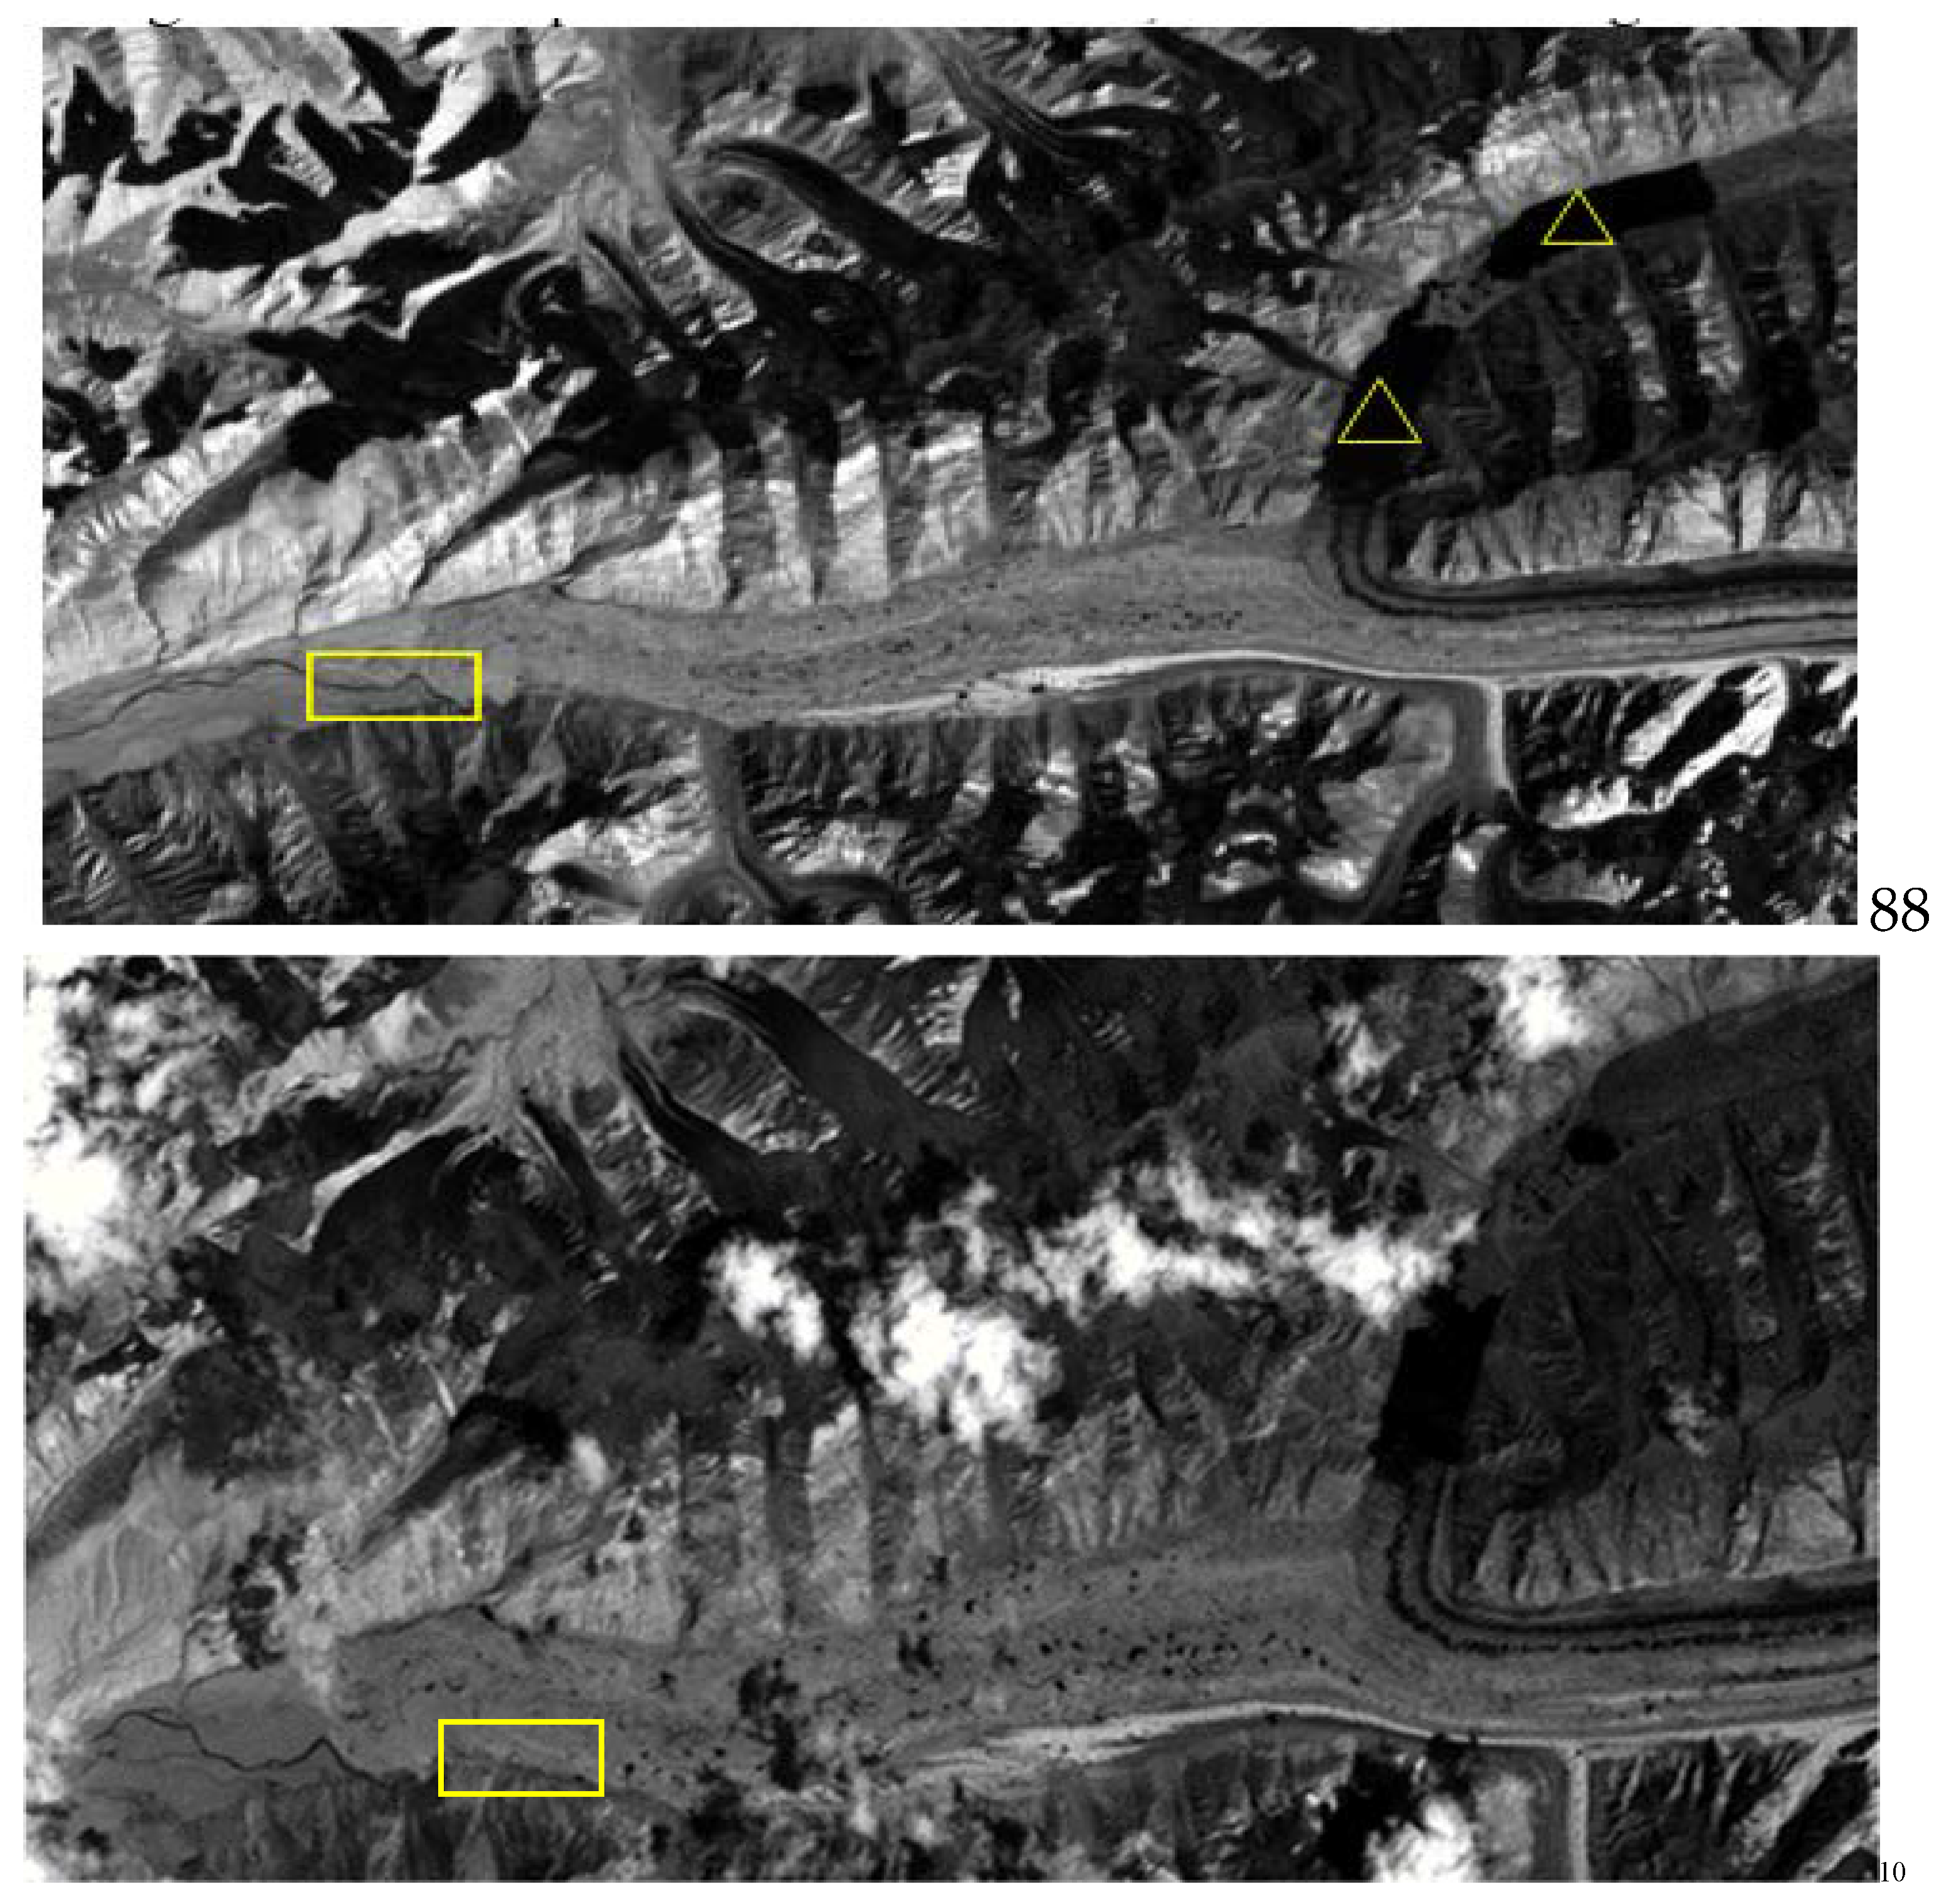
Figure 9 illustrates the outlet image in 1989 (top graph) of the post-winter Glof in 1988, the outlet of subglacial tunnel has been sealed without both drainage and the Glof river, the meltwater from glaciers of the southern surrounding flowed along the southern and marginal channel, the new large lakes were reforming (▲).
2009 image for the pre-Glof 2010 is similar the picture of 1988, the outlet of subglacial tunnel was closed without both drainage and the Glof river, the meltwater from glaciers of the southern surrounding was flowing along the southern and marginal riverbed, one large lake was reforming.
4. Discussion
Because the winter Glof in 1996 is the largest disaster event among the six cases, and four images of the Landsat 5 in 1996-1997 are available, both the glaciologic and limnologic processes can be investigated in detail as follow.
There was no iceberg in the two lakes in July 1996 shown in the graph 5a, but a lot of icebergs appeared in August 1996 on both the lakes in graph 5b. The maximum lake area was about 6.35 km2 (at maximum) in the mid-October 1996 in graph 5c, the lake length of the upper lake was much longer than that of the down lake in 1996. Because of the surge of the North Inylchek glacier in 1996 shown by position of the yellow line, not only area of the upper lake was greatly shrunk by 95% to 0.33km2 in image of July 1997 as shown by position of the yellow line on the graph 6d, but also the terminus of the North Inylchek Glacier advanced about 3400 meters which was replaced the almost water storage of the upper lake.
Another famous example of glacier-dam-lake (and) outburst flood is the Kyagar lake and the huge Kyagar glacier in the China-Karakoram between (two countries) China and Pakistan [23,29,33]. The Kyagar lake, drains in a stably subglacial channel with length about 4 km from east to west, its outlet also is at the center of the glacier terminus, opening the drain channel rely on the high hydraulic pressure from both the huge depth of the lake water and elevational interval between the lake and the glacier terminus. The outburst flood flows to the Aksu River in the West Tarim Basin in China, generating a lot of damage. The Kyagar river drains along the northern passage. If the lake does not drain, the valley size is much smaller than that of the outburst flood in the central valley. Recently, the Merzbacher lake drains from a new pathway partly along the northern moraine of Inylchek glacier, and the original outlet has shifted to the upper glacier due to shrinking of the glaciated lake.
Different from the Kyagar glacier, the ice-dam of Merzbacher Lake is much longer and thicker than that of the Kyagar glacier. The location of the latter glacier is at lower elevation (3200 m, asl.) with a higher latitude (40°N) and in a humid climate. Therefore, the glacier mass balance is in high negative value with fast glacier retreating and shrinking in a long-term period. Meanwhile, once the marginal channel forms, it is difficult to be close due to the meltwater floods in warming summers. Take the neighboring glacier Teram Kangri as an example, its terminus is very close to the dam of Shaksgam River and forming a larger lake than the Kyagar, but has never been dammed in the past 60 years because the frequently outburst flood from Kyagar Lake was too large to destroy the damming.
The difficulties of the Glof defense in cold season are remotely monitoring the daily change of the Merzbacher lake area with satellite images and its drainage at the outlet of the glacier terminus as early as possible under condition of clouds on the glacier-lake area at first, since the characteristics of the preceding flood peak, a big outburst flood in winter might occur significantly delayed before the lake begins to empty. The winter Glof likely has hydrological influence from compromised both below the huge lake and subglacial flow and high meltwater storage. It implied in the summer of the preceding winter outburst probably as an increasing meltwater restored in efficient channelized flow.
On other hand, the staff ability and accuracy of the flood water level and velocity in winter observation at the gauge station should be enhanced, because there are a lot of both floating iceberg and sediment to damage the gauge when the winter flooding.
5. Conclusion
The cold season Glof can be 18 times larger than the mean daily discharge of the preceding Glof over the past six decades, the occurring probability of one Glof is over 9% in late 50 years of 20th. Century. We found six large Glof that occurred in the cold season from the largest glacier Inylchek in the central Tien Shan mountains during the 1958-2010s, and the largest winter Glof was triggered by a quickly surge of the North Inylchek glacier in the later Autumn 1996. We propose that the Glof can be forecast day by day to extrapolate the measured hydrograph as a linear curve.
However, there are two potential factors to keep the lake recharged in many cold seasons: firstly, the strongly rising of the winter air temperature in high mountains results in an increase of ice and snow melting and accelerates the flooding of the subglacial tunnels with melted water. Secondly, the subglacial tunnels became thinner and thinner due to downwasting caused by regional warming. The damming ice barrier is the retreating part of the Southern Inylchek Glacier, therefore melted faster and released the water of Lake Merzbacher even in the winters.
Acknowledgments
This research was supported by the Third Xinjiang Scientific Expedition Program (Grant No. 2022xjkk0101) of China and the Scientific Fund of Kashi University, China (20213099). The authors would like to thank USGS for providing Landsat images.
References
- Ashraf, A., Naz, R., Roohi, R. Glacial lake outburst flood hazards in Hindukush, Karakoram and Himalayan Ranges of Pakistan: implications and risk analysis. Nat. Hazards Risk 2012, 3: 113-132. [CrossRef]
- Barrand, N. E.; Murray, T. Multivariate controls on the incidence of glacier surging in the Karakoram Himalaya. Arctic, Antarctic, and Alpine Research, 2006, 38(4): 489-498. [CrossRef]
- Round, V.; Leinss, S.; Huss, M.; et al. Surge dynamics and lake outbursts of Kyagar Glacier, Karakoram. The Cryosphere, 2017, 11(2): 723-739. [CrossRef]
- Hewitt, K.; Liu, J. Ice-dammed lakes and outburst floods, Karakoram Himalaya: historical perspectives on emerging threats. Physical geography, 2010, 31(6): 528-551. [CrossRef]
- Liu, S.; Cheng, G.; Liu, J. Jökulhlaup characteristics of the Lake Mertzbakher in the Tianshan mountains and its relation to climate change. J. Glaciol. Geocryol, 1998, 20(1): 30-36.
- Shangguan, D. H.; Bolch, T.; Ding, Y. J.; et al. Mass changes of Southern and Northern Inylchek Glacier, Central Tian Shan, Kyrgyzstan, during 1975 and 2007 derived from remote sensing data. The Cryosphere, 2015, 9: 703-717. [CrossRef]
- Glazirin, G. E. A century of investigations on outbursts of the ice-dammed lake Merzbacher (central Tien Shan) [J]. Austrian Journal of Earth Sciences, 2010, 103(2).
- Bormudoi, A.; Shabunin, A.; Hazarika, M. K.; et al. Studying the outburst of the Merzbacher lake of Inylchek Glacier, Kyrgyzstan with remote sensing and field data[C]//Proceedings 33rd Asian Conference on Remote Sensing. 2012: 26-30.
- Clarke, G. K. C. Fast glacier flow: Ice streams, surging, and tidewater glaciers. Journal of Geophysical Research: Solid Earth, 1987, 92(B9): 8835-8841.
- Guillet, G.; King, O.; Lv, M.; et al. A regionally resolved inventory of High Mountain Asia surge-type glaciers, derived from a multi-factor remote sensing approach. The Cryosphere, 2022, 16(2): 603-623. [CrossRef]
- Häusler, H.; Ng, F.; Kopecny A, et al. Remote-sensing-based analysis of the 1996 surge of Northern Inylchek Glacier, central Tien Shan, Kyrgyzstan. Geomorphology, 2016, 273: 292-307. [CrossRef]
- Jiang, Y.; Zhou, C. H.; Cheng, W. M. Analysis on runoff supply and variation characteristics of Aksu drainage basin[J]. Journal of Natural Resources, 2005, 20(1): 27-34.
- Kingslake, J.; Ng, F. Quantifying the predictability of the timing of Jökulhlaups from Merzbacher Lake, Kyrgyzstan[J]. Journal of Glaciology, 2013, 59(217): 805-818.
- Krysanova, V.; Wortmann, M.; Bolch, T.; et al. Analysis of current trends in climate parameters, river discharge and glaciers in the Aksu River basin (Central Asia). Hydrological Sciences Journal, 2015, 60(4): 566-590. [CrossRef]
- Liu, J. Forecasting on Jökulhlaups in Kunmalike River, southern Tianshan Mts[J]. Arid Land Geography, 1993, 16(3).
- Liu, J. Jökulhlaups in the Kunmalike River, southern Tien Shan Mountains, China[J]. Annals of Glaciology, 1992, 16: 85-88.
- Liu, J. The flood of Kunmalick River glacier - blocked lake and its effect on river water condition on the southern slope of Tianshan Mountain [J]. Arid Land Geography, 1993, 16(3): 70-74.
- Lutz, A.; Immerzeel, W. W.; Gobiet, A.; et al. New climate change scenarios reveal uncertain future for Central Asian glaciers[J]. Hydrology and Earth System Sciences Discussions, 2012, 9(11): 12691-12727.
- Mayer, C.; Lambrecht, A.; Hagg, W.; et al. Post-drainage ice dam response at lake merzbacher, inylchek glacier, kyrgyzstan[J]. Geografiska Annaler: Series A, Physical Geography, 2008, 90(1): 87-96.
- Mukherjee, K.; Bolch, T.; Goerlich, F.; et al. Surge-type glaciers in the Tien shan (central Asia) [J]. Arctic, Antarctic, and Alpine Research, 2017, 49(1): 147-171.
- Ng, F.; Liu, S.; Mavlyudov, B.; et al. Climatic control on the peak discharge of glacier outburst floods[J]. Geophysical Research Letters, 2007, 34(21).
- Nie, Y.; Pritchard, H. D.; Liu, Q.; et al. Glacial change and hydrological implications in the Himalaya and Karakoram[J]. Nature reviews earth & environment, 2021, 2(2): 91-106.
- Niu, J.; Liu J.; Wang D.; et al. Monitoring on ice-dammed lake and related surging glaciers in Yarkant River, Karakorum in 2009[J]. Journal of Mountain Science, 2011, 29(3): 277-282.
- Nobakht, M.; Motagh, M.; Wetzel, H. U.; et al. The Inylchek Glacier in Kyrgyzstan, Central Asia: insight on surface kinematics from optical remote sensing imagery. Remote Sensing, 2014, 6(1): 841-856. [CrossRef]
- Novikov, V.; Simonett, O.; Beilstein, M.; et al. Climate change in Central Asia—a visual synthesis. Swiss Federal Office for the environment (FOEN), Zoı Environment Network, 2009.
- Sakurai, N.; Narama, C.; Daiyrov, M.; et al. Simultaneous drainage events from supraglacial lakes on the southern Inylchek Glacier, Central Asia. Journal of Glaciology, 2022, 68(268): 209-220. [CrossRef]
- Solomina, O.; Barry, R.; Bodnya, M. The retreat of Tien Shan glaciers (Kyrgyzstan) since the Little Ice Age estimated from aerial photographs, lichenometric and historical data. Geografiska Annaler: Series A, Physical Geography, 2004, 86(2): 205-215. [CrossRef]
- Sun, M.; Zhou, S.; Yao, X.; et al. Surging glaciers in High Mountain Asia between 1986 and 2021. EGUsphere, 2022: 1-30. [CrossRef]
- Wang, D.; Liu, S. J.; Hu, L. J. et al. Monitoring and analyzing the glacier lake outburst floods and glacier variation in the Upper Yarkant River, Karakoram. J Glaciol Geocryol, 2009, 29(3): 808-814.
- Wang, X.; Ding, Y.; Liu, S.; et al. Changes of glacial lakes and implications in Tian Shan, central Asia, based on remote sensing data from 1990 to 2010. Environmental Research Letters, 2013, 8(4): 044052. [CrossRef]
- Wen, L.; Wang, C.; Li, Z.; et al. Thermal Responses of the Largest Freshwater Lake in the Tibetan Plateau and Its Nearby Saline Lake to Climate Change. Remote Sensing, 2022, 14(8): 1774. [CrossRef]
- Wortmann, M.; Krysanova, V.; Kundzewicz, Z. W.; et al. Assessing the influence of the Merzbacher Lake outburst floods on discharge using the hydrological model SWIM in the Aksu headwaters, Kyrgyzstan/NW China. Hydrological Processes, 2014, 28(26): 6337-6350. [CrossRef]
- Yan, W.; Liu, J.; Zhang, M.; et al. Outburst flood forecasting by monitoring glacier-dammed lake using satellite images of Karakoram Mountains, China[J]. Quaternary International, 2017, 453: 24-36. [CrossRef]
- Yao, T.; Wang, Y.; Liu, S.; et al. Recent glacial retreat in High Asia in China and its impact on water resource in Northwest China[J]. Science in China Series D: Earth Sciences, 2004, 47: 1065-1075.
- Ye, Z.; Chen, Y.; Zhang, Q.; et al. Research on Sediment Discharge Variations and Driving Factors in the Tarim River Basin[J]. Remote Sensing, 2022, 14(22): 5848.
- Zheng, G.; Allen, S. K.; Bao, A.; et al. Increasing risk of glacial lake outburst floods from future Third Pole deglaciation[J]. Nature Climate Change, 2021, 11(5): 411-417.
|
Disclaimer/Publisher’s Note: The statements, opinions and data contained in all publications are solely those of the individual author(s) and contributor(s) and not of MDPI and/or the editor(s). MDPI and/or the editor(s) disclaim responsibility for any injury to people or property resulting from any ideas, methods, instructions or products referred to in the content. |
© 2023 by the authors. Licensee MDPI, Basel, Switzerland. This article is an open access article distributed under the terms and conditions of the Creative Commons Attribution (CC BY) license (http://creativecommons.org/licenses/by/4.0/).
