Preprint
Article

Uneven Stiffness Coal Seam: A New Structural Factor Prone to Coal Bump Based on Stiffness Theory

Altmetrics

Downloads

66

Views

14

Comments

0

A peer-reviewed article of this preprint also exists.

Submitted:

26 October 2023

Posted:

26 October 2023

You are already at the latest version

Alerts
Abstract
An analysis of the stiffness theory reveals that coal mass compression bumps occur only when both the failure criterion and the stiffness criterion are simultaneously satisfied. Then a new structural factor called uneven stiffness coal seam structure (USCS) is proposed, which consists of an uneven stiffness coal seam along with continuous roof and floor. The USCS serves the dual functions of pressure concentration and stiffness reduction. The former facilitates stress concentration from the low stiffness zone (LSZ) to the high stiffness zone (HSZ), thus raising the risk (rF) of failure. The latter reduces the stiffness of the surrounding rock of the HSZ, allowing the system to meet the stiffness criterion even with a hard roof, thereby reconciling the contradiction between the stiffness theory and engineering experience and raising the risk (rI) of instability. The HSZ of the USCS, including thinning zones, bifurcating areas, magmatic intrusion areas, and remnant pillar affected areas, is more susceptible to coal bump incidents than a conventional coal seam. Mechanical analysis and simple numerical simulations validate the pressure concentration and stiffness reduction functions of the USCS. The results demonstrate the following: 1) The normal stress of the HSZ positively correlates with ER, HR, KH, and SL, but negatively correlates with KL and SH; The stiffness of surrounding rock of the HSZ negatively correlates with HR, KH, SL, and SH, but positively correlates with ER and KL. 2) Failures within the HSZ of the USCS enables the roof strata to release bending deformation energy without undergoing fracturing. 3) The alignment between the HSZ of an existing USCS and the HSZ of an artificial USCS advancing with the working face intensifies stress concentration and reduces stiffness, thereby significantly increases the risk (rCB) of coal bump. By applying the stiffness theory and relevant USCS findings, new explanations can be provided for engineering phenomena such as the time-delayed coal bumps, the inefficient pressure relief in ultra thick coal seams, and the “microseism deficiency” observed prior to certain coal bumps.
Keywords: 
Subject: Engineering  -   Mining and Mineral Processing

1. Introduction

Coal bump, also known as rockburst in coal mine, is a dynamic phenomenon arising from the rapid release of stored elastic energy within the coal and rock mass around the mining space [1,2,3]. This phenomenon manifests suddenly, accompanied by fragments ejection or notable displacement of coal, generating load noise and air blasts, and often resulting in significant damage [3,4]. Undoubtedly, coal bump stands out as a paramount dynamic hazard, posing a serious threat to the safety of coal mine production.
Clarify the mechanism underlying coal bump not only forms the basis for effectively preventing and controlling this dynamic hazard, but also represents one of the primary challenges within the realm of coal bump research [5,6]. Early researchers proposed four kinds of classical theory, including strength [7], energy [8], stiffness [9,10,11,12], and bursting liability [13,14]. Subsequently, new concepts such as instability [15], damage [16], catastrophe [17,18,19], and fractal [20], were introduced to provide additional perspectives on understanding coal bump. In recent years, integrating and advancing previous research has led to the proposal of new mechanisms, including the “three-factor” mechanism [21], the rockburst start-up mechanism [22], the dynamic and static combined load-induced mechanism [23], and the disturbance response instability mechanism [24]. Despite considerable achievements in the study of coal bump mechanisms, the academic community has yet to reach a consensus on a universally accepted theory [25]. Amongst the aforementioned mechanism, the advantages and limitations of the stiffness theory are extremely prominent, and therefore deserve special attention.
In the early era of rock mechanics, the stiffness of conventional testing machines was inadequate, resulting in abrupt and intense fracturing of rock specimens when subjected to compression [26]. Eminent scholars including Cook, Salamon, Blake, drew a parallelism between the violent failures observed in specimens tested on flexible testing machines and the occurrence of rockburst phenomena, formulating the stiffness theory [9,10,11,12]. Hence, any documented instances of rock specimens undergoing violent failures in uniaxial compression tests prior to the introduction of rigid testing machines can be considered as corroborative evidence supporting the stiffness theory.
In recent years, the experimental results of several scholars have provided direct or indirect support for the stiffness theory. Liu J.X. et al, Li J.Q. et al, and Dou L.M. et al. individually conducted numerical or laboratory experiments on series-connected combined coal and rock samples, and their studies uniformly concluded that a positive relationship exists between the proportion of rock in the composite samples and the overall bursting liability of composite samples [27,28,29]. Gu J.C. et al. successfully reproduced projective rock bursts in indoor experiments by introducing springs between the specimen and the testing machine [30]. Yin Y.C. et al. utilized a stiffness-adjustable testing machine to examine the bursting liability of coal and the results demonstrated that a lower stiffness ratio between the testing machine and the specimen led to more intense destruction to the coal samples, shorter dynamic failure times, and higher impact energy index [31].
Zhang M.T. proposed that the the involvement of the surrounding rock in energy release is a necessary condition of coal bump, and deduced, based on the principle of minimum potential energy, that this prerequisite is equivalent to the stiffness of the surrounding rock being smaller than the post-peak equivalent stiffness of the coal mass [15]. Tang C.A. [17], Pan Y.S. [18], and Wang S.Y. [19] derived, using the cusp-type catastrophe theory, that the instability failure or coal bump requires a stiffness ratio between the surrounding rock and the coal mass of less than 1. Although the theoretical basis of the aforementioned studies differs, their conclusions align with the stiffness theory. These theoretical research findings have further enhanced the credibility of the stiffness theory.
While the stiffness theory has garnered significant experimental support and aligns with numerous theoretical research findings, it is not without its shortcomings. One of the notable drawbacks lies in its inability to reconcile with practical engineering experience. According to the stiffness theory, a decrease in the stiffness of the surrounding rock increases the likelihood of system instability. However, in real-world engineering scenarios, coal seams often exhibit a higher propensity for coal bump occurrences under conditions of high-stiffness and hard roof or floor [3]. This contradiction with engineering experience poses a challenge to the widespread acceptance and recognition of the stiffness theory.
This article provides a review and analysis of the stiffness theory, incorporating the structural concept from the “three factors” mechanism to propose an uneven stiffness coal seam structure (USCS), which has the functions of pressure concentration and stiffness reduction. These two functions make USCS a new structural factor prone to coal bump distinct from the stick-slip weak surface structure, and enable it to address the contradiction between the stiffness theory and engineering practical experience to a certain extent. The influence of key parameters of USCS on its ability to focus pressure, reduce stiffness, and increase the risk of coal bump is discussed through theoretical analysis and simple numerical simulations. Relevant conclusions provide new explanations for engineering phenomena such as time-delayed effects of some coal bumps, inefficient pressure relief in ultra thick coal seams, and “microseism deficiency” Before occurrence of certain coal bumps.

2. Review and Analysis of Stiffness Theory

2.1. Stiffness Theory and Its Experimental and Theoretical Support

The stiffness theory originated from the research on the influence of testing machine stiffness on the bursting intensity of rock specimen failure. Prior to the development of rigid test machines, when rock compression tests were conducted using ordinary test machines, the specimens would often abruptly fracture with a loud noise upon reaching their ultimate strength, and the residual strength after the failure could not be measured [32,33]. The measurement of the load-displacement curve of entire failure process of rock was first achieved in 1965 by Cook, who employed copper pipes to augment the stiffness of conventional test machines [9,26]. Cook emphasized the resemblance between the instable failure of specimens on low-stiffness test machines and rockburst incidents, and proposed that the necessary condition for unstable failure criterion of specimens is also a prerequisite for rockburst or coal bump [9,10]. In 1970, Salamon put forth the conditions for specimen instable failure through energy analysis [11]. It is mathematically given as:
k p + λ b < 0   or   k p / λ b < 1
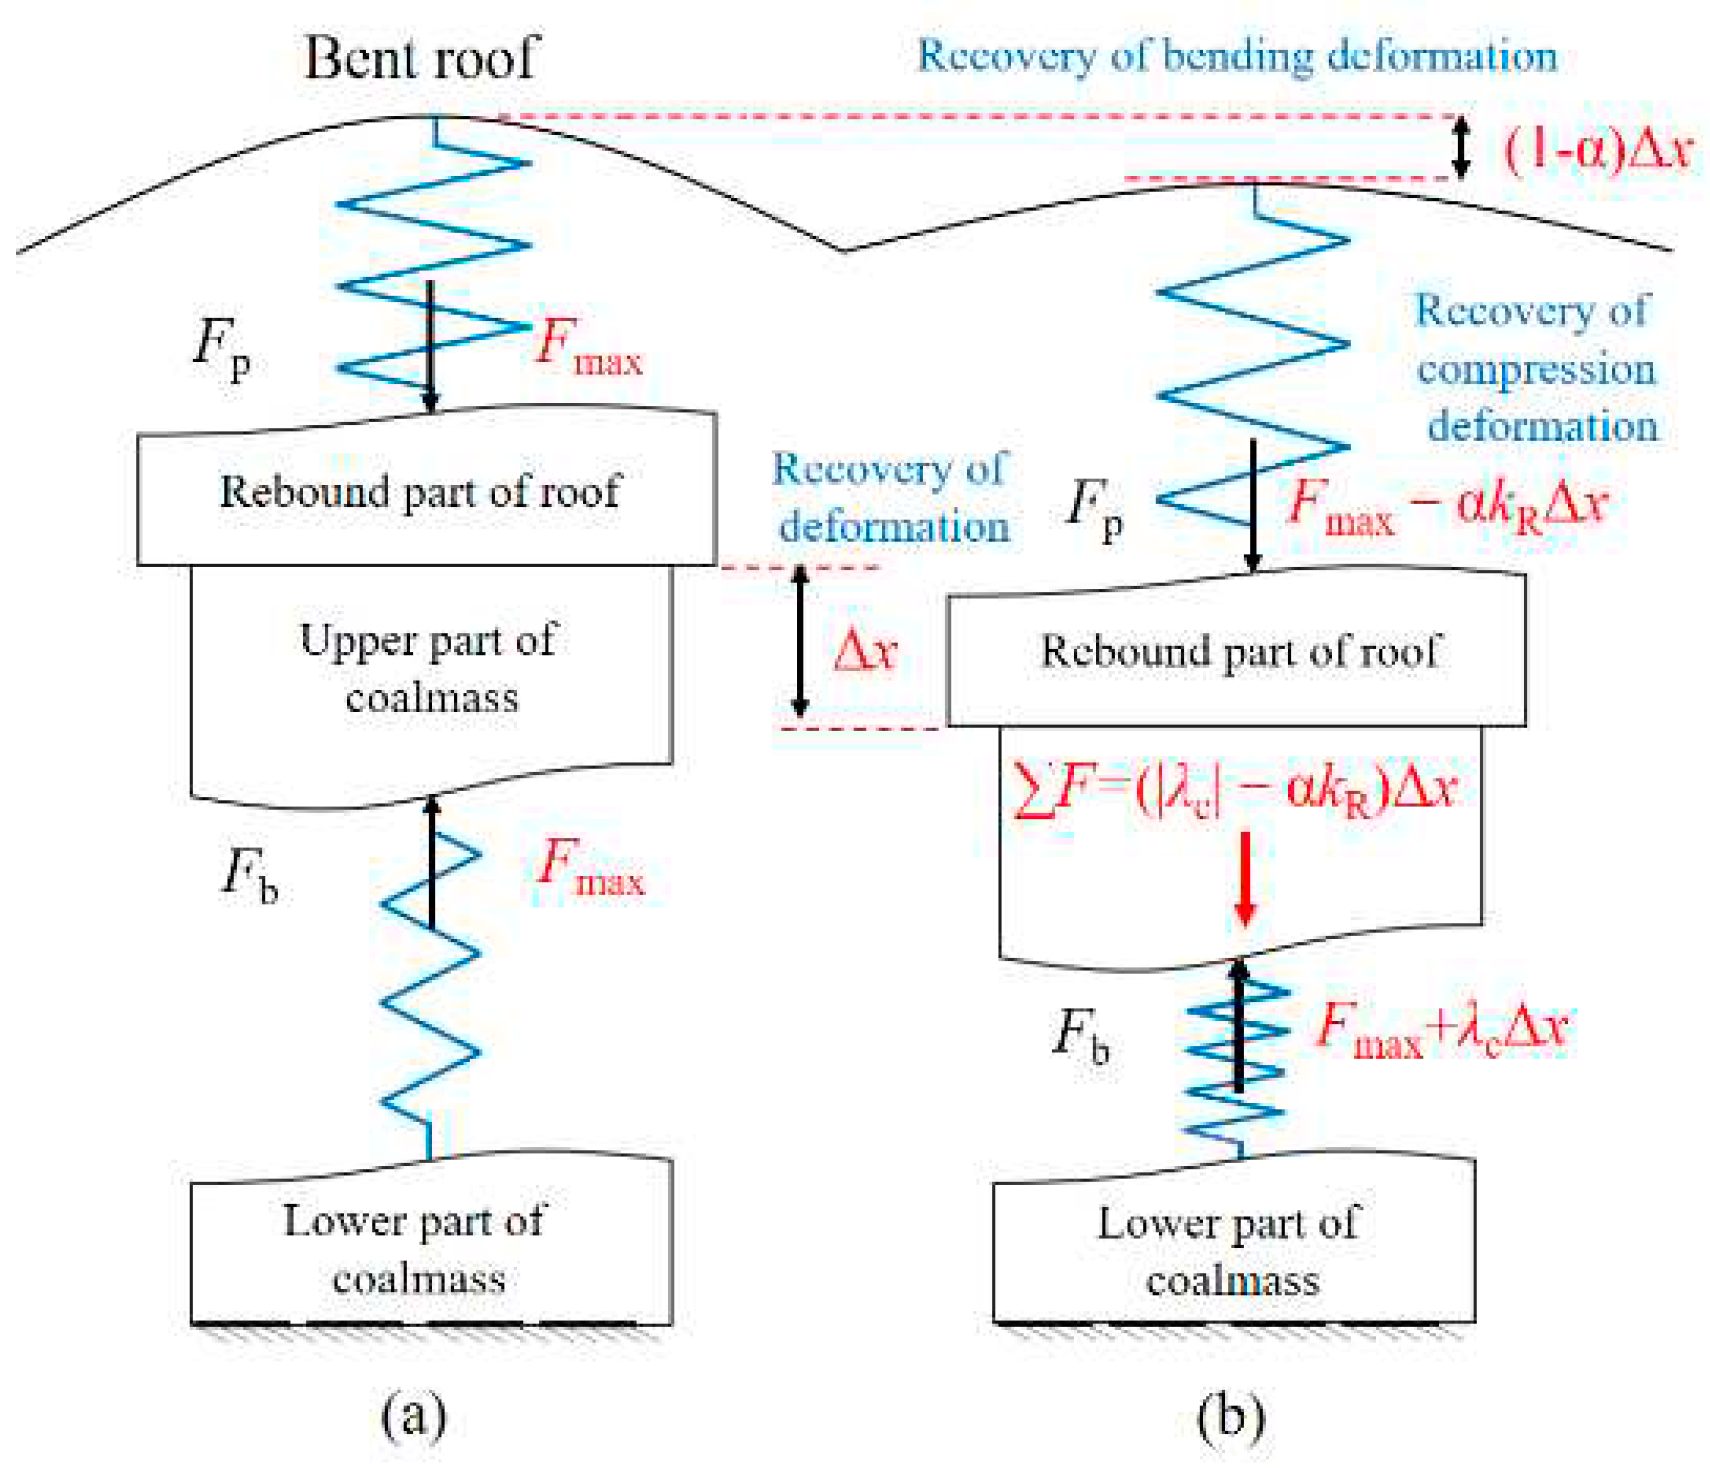
where kp is the stiffness of the test machine as the pressure provider, λb is the average slope of the load-displacement curve of the specimen as the pressure bearer during the post-peak strain softening stage, and |λb| is referred to as the post-peak equivalent stiffness. A testing machine that satisfies equation (1) can be referred to as a flexible testing machine [26]. If we consider the main body of a flexible testing machine and the lower end of the specimen as fixed, the simplified model of the specimen-testing machine system is illustrated in Figure 1.
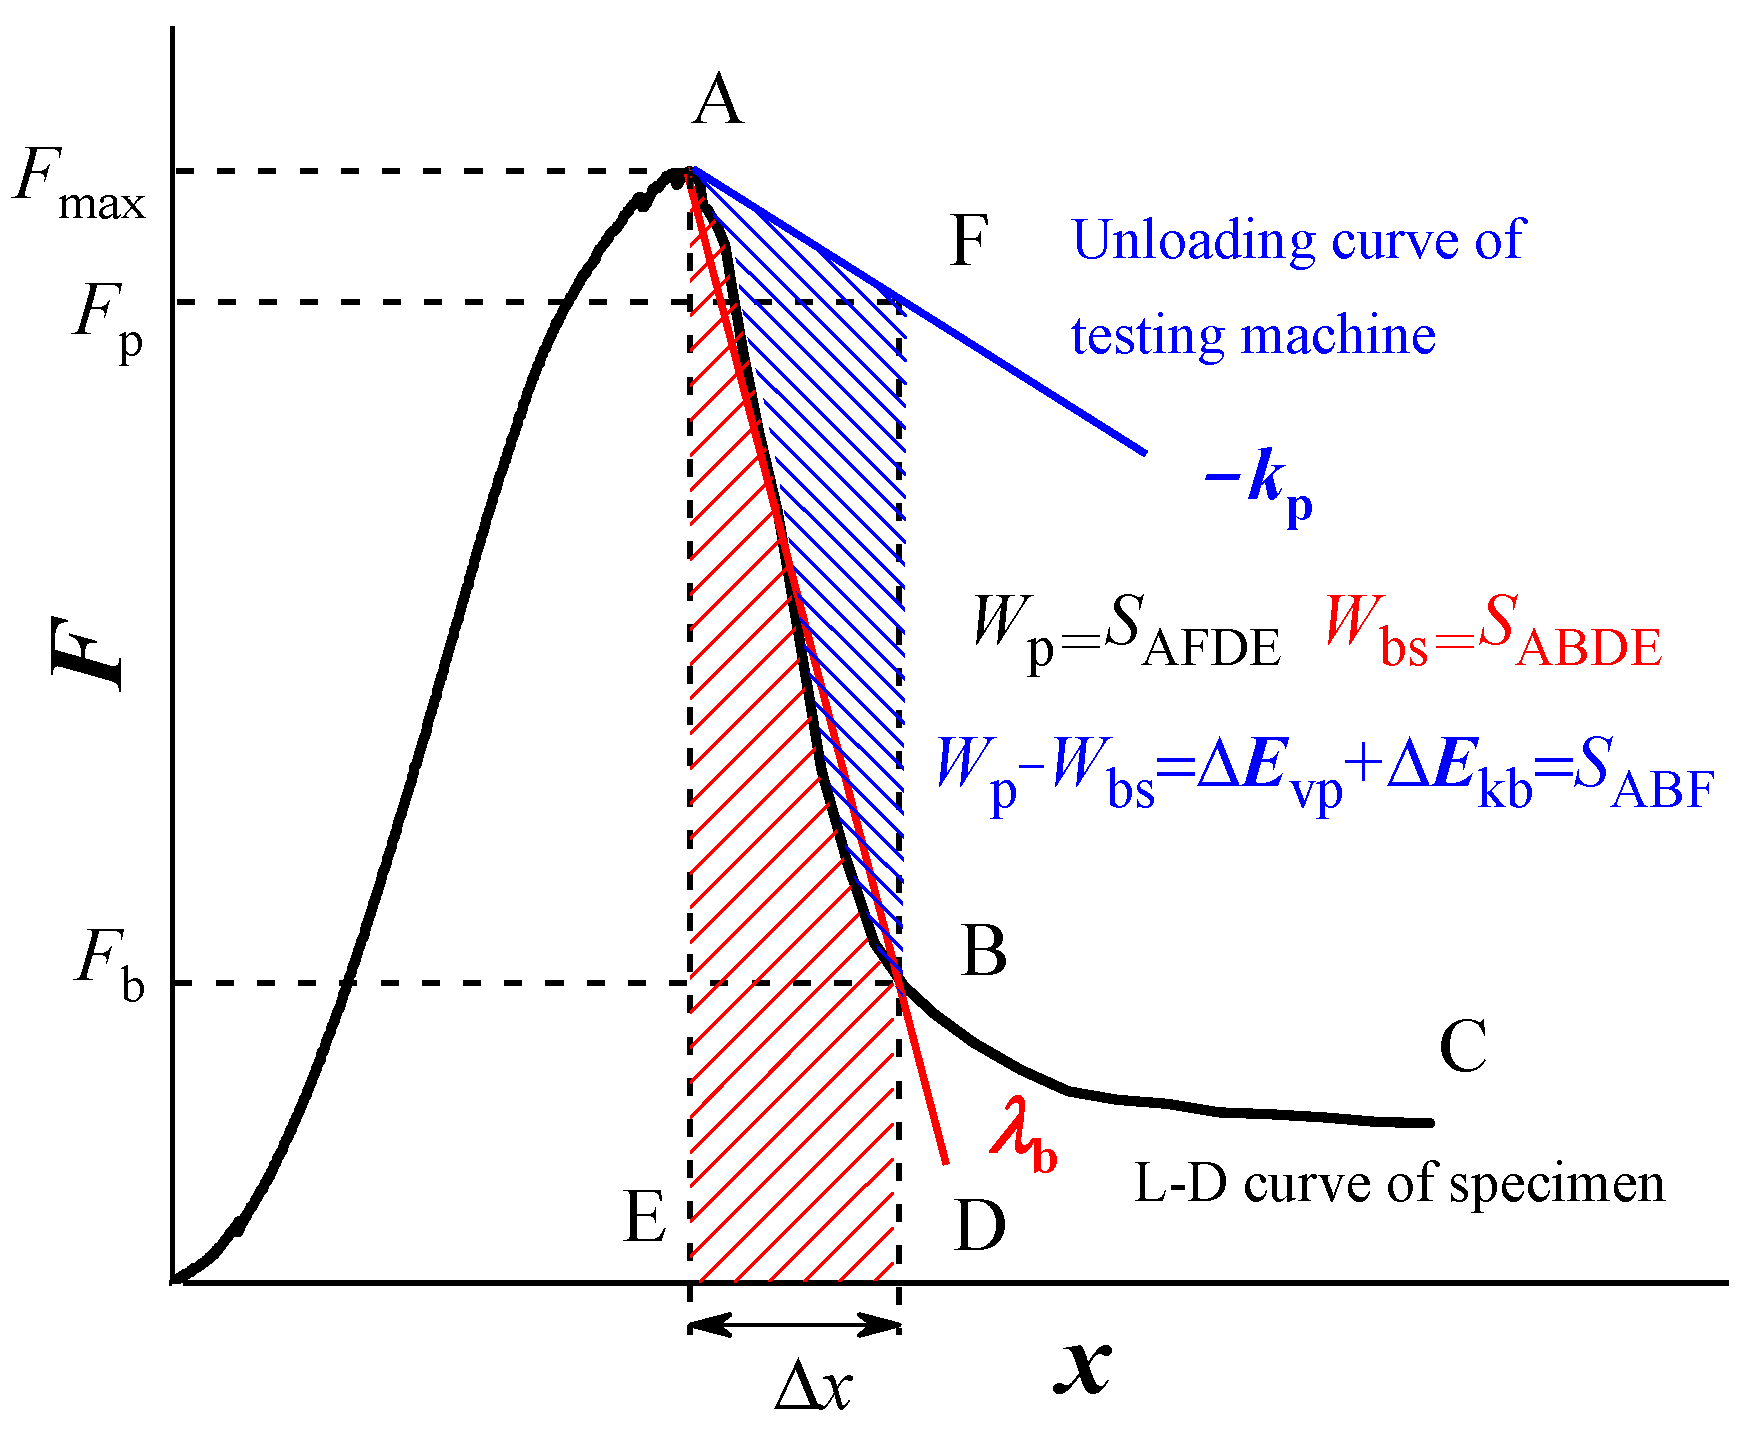
As shown in Figure 1, At the peak, the specimen’s internal force Fb and the testing machine’s internal force Fp both attain the maximum value, Fmax, establishing a state of equilibrium. The velocity vb of the upper part of the specimen and the rebound velocity vp of the testing machine are both 0. After reaching its peak, Fb diminishes as a result of strain softening, while Fp decreases due to the testing machine’s deformation recovery. Assuming that shortly after the peak, the rebound part of the testing machine and the upper part of the specimen move downwards synchronously by a distance Δx, we can deduce equation (2) from equation (1).
Δ F p = k p Δ x - λ b Δ x = | λ b | Δ x = Δ F b
where ΔFp is decreasing range of Fp, ΔFb is decreasing range of Fb. Figure 1(b) and equation (2) indicates that the specimen-testing machine system that satisfies equation (1) will lose its balance after the peak and be in an instable state until the system regains its balance. The instability of the system increases vb and vp. According to the kinetic energy theorem, equation (3) can be derived.
Δ Ε vp + Δ Ε kb = 0 Δ x ( F p - F b ) d x 1 2 ( | λ b | - k p ) Δ x 2
where ΔEvp is the kinetic energy increment of the testing machine’s rebound part during specimen’s destruction process, which would becomes the testing machine’s own vibration energy after complete failure of specimen. ΔEkb is the kinetic energy increment of the specimen due to the release of the testing machine’s elastic energy during the destruction process. The larger ΔEkb is, the greater the total kinetic energy of the fragments ejected after the specimen disintegrates, indicating a more impactful destruction. Before the testing machine and the specimen disengage, the velocities of the pressure provider (vp) and the pressure bearer (vb) are equal. Therefore, it can be assumed that both ΔEvp and ΔEkb are positively correlated with |λb| and negatively correlated with kp.
Figure 2 illustrates the post-peak instability of specimen-testing machine system. The black curve is the load-displacement curve of the specimen, while the blue line is the unloading curve of the testing machine with a slope of -kp, and the red line is the approximate straight line of the post-peak black curve, with a slope of λb. The trapezoid SAFDE symbolizes the energy released by the testing machine during the failure process, labeled as Wp. The curved trapezoid SABDE signifies the external input energy required for stable failure of the specimen after the peak, denoted as Wbs. The difference between these two areas, SABF, represents the portion of the energy released by the testing machine that exceeds the energy required for stable failure. This excess energy is then converted into the kinetic energy of the rebound part of the testing machine and the specimen fragments after failure. From Figure 2, it can be directly observed that as the stiffness (kp) of the testing machine decreases, the kinetic energy of both the rebound part of the testing machine and the specimen fragments increases. This indicates a stronger impact during specimen failure and more pronounced vibrations of the testing machine.
The instability failure of the specimen on the flexible testing machine bears resemblance to coal bump phenomena. In both scenarios, pressure is exerted by the pressure provider, resulting in the failure of the pressure bearer while the pressure provider remains relatively intact. Subsequently, the pressure provider undergoes deformation recovery and releases accumulated elastic energy after reaching the peak, leading to system instability and intensifying the burst intensity of the pressure bearer’s failure. Given the striking similarities between these two systems, the conclusions about specimen-testing machine system can also be applied to describe the coal mass-surrounding rock system. Both the specimen and coal mass serve as pressure bearers, with the relevant variables denoted by subscript b. Similarly, the testing machine and surrounding rock act as pressure providers, with the relevant variables indicated by subscript p. Therefore, equation (1), initially depicting the necessary condition for specimen instability failure, can also be considered a prerequisite for coal bump, It can be referred to as the stiffness criterion, where kp represents the stiffness of the surrounding rock as the pressure provider, and |λb| denotes the post-peak equivalent stiffness of the coal mass as the pressure bearer.
The examination of Figure 2 reveals that in a coal mass-surrounding rock system meeting the stiffness criterion, the energy Wp (SAFDE in Figure 2) released from the surrounding rock during the failure process will exceed the external input energy Wbs (SABDE) required for stable failure of coal mass, leading to system instability. The excess energy (SABF) is then converted into incremental kinetic energy ΔEkb of the coal and incremental vibration energy ΔEvp of the surrounding rock. ΔEvp will diffuse as waves and generate dynamic loads on the adjacent coal and rock mass, similar to the vibration of the testing machine after specimen failure. if ΔEvp is small, it is manifested as acoustic emission or microseismic events, and if it is large, it is manifested as mine earthquakes. Following the failure and disintegration of the coal mass, ΔEkb dissipates into the ejection kinetic energy of each coal fragment, with higher values indicating stronger burst intensity of coal failure. If such failure occurs in proximity to mining areas and ΔEkb reaches sufficiently high levels, it can trigger rock bursts.
The stiffness theory has garnered support from a plethora of experimental studies, which have provided direct and indirect validation. Gu J.C. et al, for instance, conducted an experiment where a spring was introduced between the jack-type loader and the cement specimen. This modification caused the specimen, which was previously prone to failure in the form of cracking, to experience a more severe type of failure known as ejective rock burst [30]. Assuming the stiffness of the jack is kp1 and the stiffness of the spring is kp2,then the overall stiffness (kp12) of the Pressure provider, consisting of the jack and the spring connected in series, would meet the following formula.
k p 12 = k p 1 k p 2 / ( k p 1 + k p 2 ) min ( k p 1 , k p 2 )
Based on equation (4), the essence of Gu’s experiment lies in reducing the stiffness of pressure provider by introducing springs, thereby satisfying the stiffness criterion. As a result, the system encounters post-peak instability, resulting in a shift from stable cracking failure to an intense rock burst-type failure in the specimen’s failure mode. Thus, Gu’s experiment directly verifies the effectiveness of the stiffness theory.
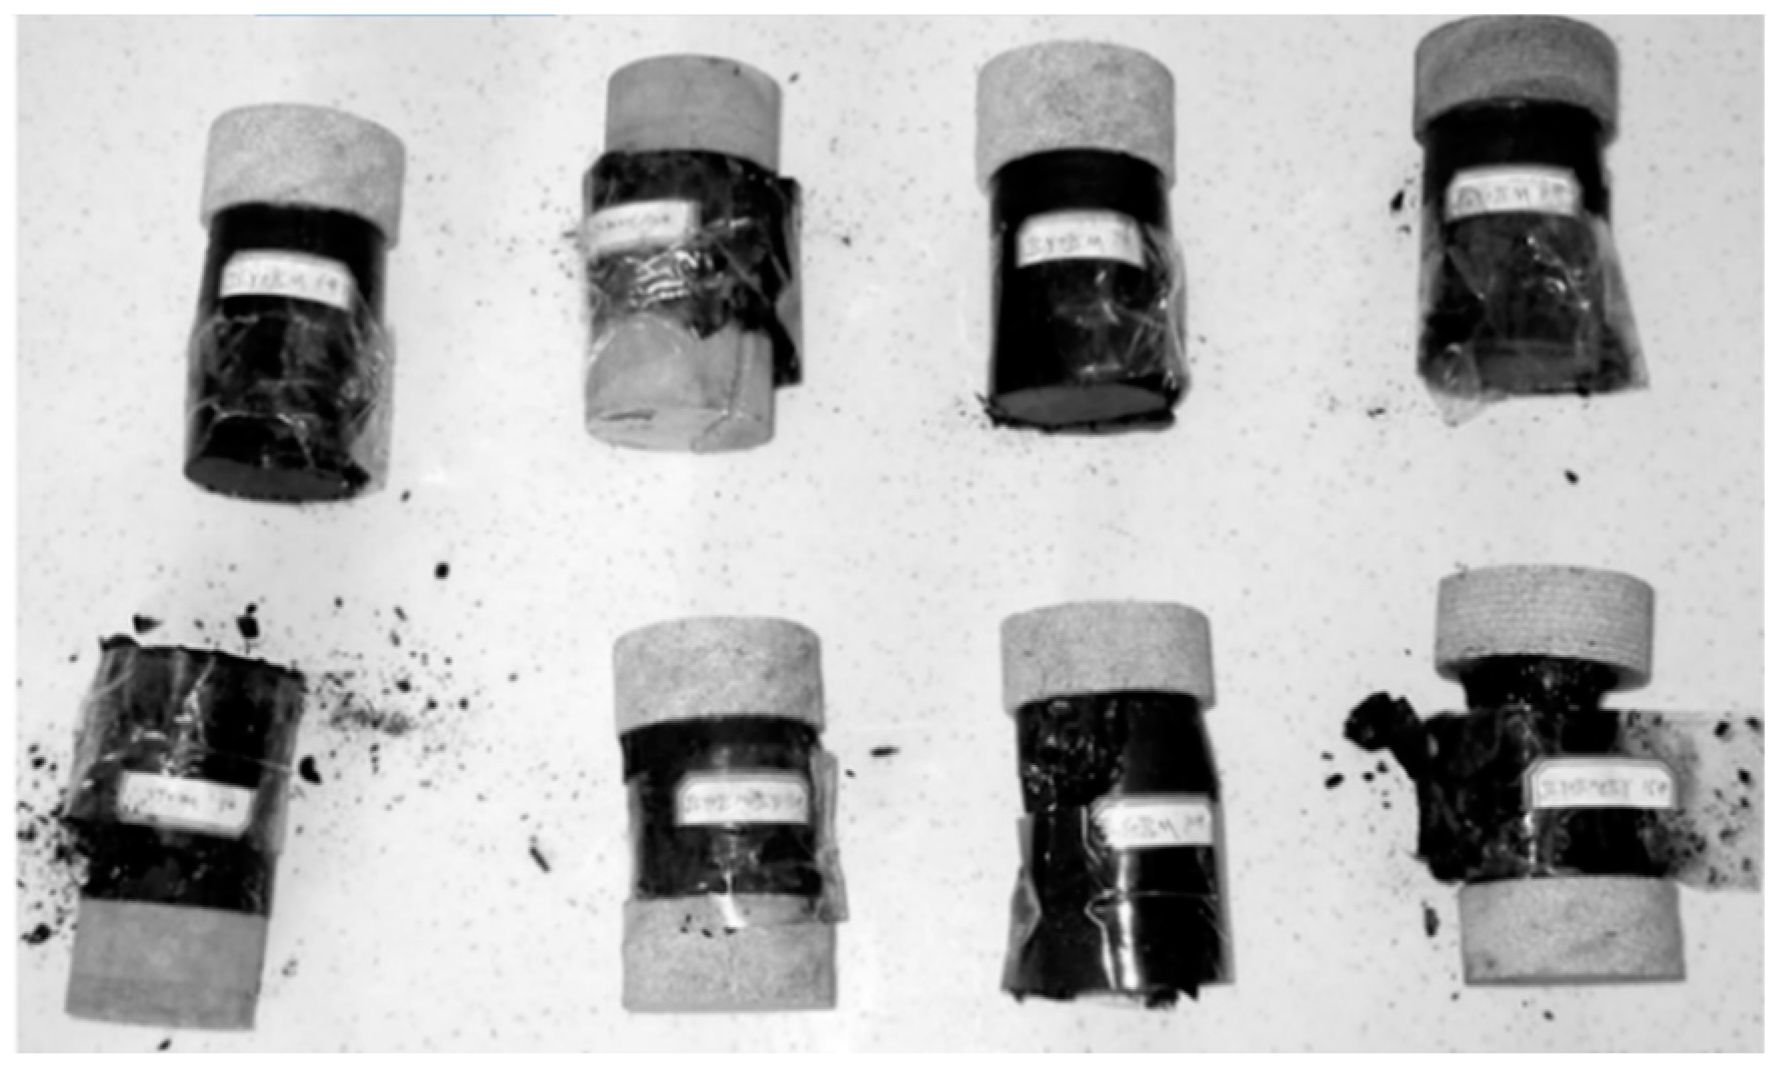
Li J.Q. et al. and Dou L.M. et al. conducted separate uniaxial compression tests on combined coal and rock samples connected in series [28,29]. In these tests, the coal segment of the combined samples often fail prior to the rock segment, attributable to the relatively lower strength of coal compared to rock, as depicted in Figure 3. From a stiffness perspective, it can be inferred that the rock segment are not part of the pressure bearer in series with the coal segment but rather part of the pressure provider in series with the testing machine. The rock segment decrease the stiffness of the pressure provider (kp), analogous to the spring employed in Gu’s experiment. An increase in the proportion of rock in combined coal and rock samples results in a lower kp value. This signifies a stronger burst intensity of failure as per equation (3) and consequently increases the measured bursting liability of the combined coal and rock sample in experiments. Hence, the stiffness theory provides an explanation for the tendency of combined coal and rock samples with a higher rock proportion to exhibit brittle failure. Moreover, the consistent results from all similar series of combined coal and rock sample tests can be viewed as indirect validation of the stiffness theory.
The stiffness theory is also substantiated by numerous existing theoretical research findings. For instance, the energy theory posits that coal bump transpires when the accumulated energy in the system exceeds the dissipated energy required for coal mass failure [8]. One possible representation of the energy criterion can be expressed as equation (5).
W b + W p W bd
where Wb is the stored energy of the coal mass itself, Wp is the released energy from the surrounding rock during the failure process, Wbd is the dissipated energy required for coal mass failure and can be calculated with Equation (6).
W bd = W b + W bs
where Wbs is the external input energy required for stable failure of the coal mass following its peak. As depicted in Figure 2, in a coal mass-surrounding rock system that meets the stiffness criterion, the released rock energy Wp will exceed Wbs. Consequently, when the stiffness criterion is satisfied, it also indicates the fulfillment of the energy criterion.
Qi Q.X. proposed the “three-factor” mechanism, highlighting that structural surfaces, contact surfaces, and weak thin layers prone to stick-slip contribute to the occurrence of coal bumps [3,21]. Collectively, these specific structural factors are referred to as stick-slip weak surface structures. When considering the surrounding rock as a pressure provider, the relative sliding can be viewed as the failure of a pressure bearer, with the sliding surface serving as the main fracture surface and the friction force as its primary internal force component. The initiation of stick-slip results in a sudden decrease in frictional resistance and internal forces of the pressure bearer, disrupting the force equilibrium between the pressure provider and pressure bearer, thereby causing post-peak instability. The stick-slip instability can be analyzed using stiffness theory, similar to the post-peak instability observed in other specimen-testing machine systems. As depicted in Figure 2, the occurrence of stick-slip leads to an increased steepness of the post-peak curve (the ABC segment of the black curve in Figure 2) and an increase in the absolute value of |λb|, prompting the system to meet the stiffness criterion.
The stiffness theory has garnered substantial credibility thanks to extensive experimental evidence and theoretical support. Thus, it is plausible that the contradiction between the stiffness theory and engineering practical experience stems not from an intrinsic flaw in the stiffness theory itself, but rather from the existence of certain overlooked structures or mechanisms in real-world engineering scenarios. These factors can diminish the stiffness of the surrounding rock comprised of a hard roof and floor, and enable the system satisfies the stiffness criterion.

2.2. Important But Easily Overlooked Details in Stiffness Theory

Upon reviewing the stiffness theory, in addition to the classical conclusions, the following four details, which have been easily overlooked in previous research, can be clarified:
1. It is important to consider the applicability of the stiffness theory in light of the similarities between experimental phenomena and engineering disasters on which it is based. coal bumps can be broadly categorized into three types: coal mass compression type bumps, roof crack type bumps, fault dislocation type bumps [4]. The violent failure of rock specimens in flexible testing machines resembles coal mass compression bumps, but significantly differs from other types of coal bumps. Consequently, while the stiffness theory is applicable to coal mass compression bumps, its applicability to other types remains subject to debate. For the purpose of avoiding confusion, unless specified otherwise, the ensuing discussions the coal bumps referred to are of the coal mass compression type bumps.
2. The stiffness criterion is a post-peak instability condition. So when discussing the stiffness criterion, it is already assumed that the coal mass satisfies the failure criterion. Therefore, the necessary conditions for coal bump according to the stiffness theory contain both the failure criterion and the stiffness criterion. The former determines whether the coal undergoes failure and enters the post-peak stage, providing the basis for the latter. The latter determines whether the system instability occurs and is crucial in determining the burst intensity of failure.
3. There are two distinctions between the coal mass-surrounding rock system and the specimen-testing machine system. Firstly, while the testing machine applies pressure to the specimen from a single direction, the surrounding rock exerts pressure on the coal mass from multiple directions. This necessitates considering the stiffness of the coal in various directions. Secondly, the boundary between the specimen and testing machine is clear-cut, whereas determining the exact boundary between the coal and surrounding rock prior to the peak is diffcult. Typically, only the portion of the coal seam that experiences failure is deemed as coal mass, while the undamaged part of the coal seam, along with the roof and floor, is categorized as the surrounding rock. The determination of kp and |λb| laterally becomes more complex due to these factors. In this case, it might be wiser to initially evaluate the relative risk of coal bumps using the relatively simpler determination of normal stiffness. Therefore, unless explicitly specified in the subsequent text, kp refers to the normal stiffness of surrounding rock. The stiffness theory identifies two essential conditions for coal bumps: the failure criterion and the stiffness criterion. As a result, it is necessary to estimate the risk of coal bumps by utilizing Equation (7).
r CB = r F × r I
where rCB is the probability of rock burst occurrence, known as the risk of coal bump; rF is the probability of coal mass failure, known as the risk of failure; rI is the probability that the system meeting the stiffness criterion and experiencing post-peak instability, known as the risk of instability. Higher values of dynamic and static loads, as well as lower coal strength and confining pressure, increase the likelihood of meeting the failure criterion, resulting in a higher rF. While, lower values of kp or higher values of |λb| make it easier to satisfy the stiffness criterion and post-peak instability, leading a higher rI.
4. Stiffness is a parameter that pertains to the structural properties rather than the material itself. Different stiffness levels can be achieved using same material. For example, hollow structures made of high modulus materials can have lower overall stiffness compared to solid structures composed of low modulus materials. Hence, structures incorporating highly rigid materials (with high elastic modulus) while maintaining lower stiffness characteristics do exist. If such a structure situated within coal measure strata experiences a coal bump, it will conform to both the stiffness theory and engineering experience.

3. Uneven Stiffness Coal Seam Structure (USCS)
3.1. Structure Composition, Functions, and Typical Examples of USCS

A flexible testing machine is typically constructed using a harder metal compared to the rock specimens it tests,which can be seen as a structure with a harder material but lower stiffness than the specimen. Cook made modifications to the flexible testing machine by incorporating parallel copper pipes with the crossbeam to deduce its bending deformation. This innovative approach enabled the measurement of the post-peak curve of the rock for the first time [26]. This suggests that the bending deformation of the crossbeam plays a crucial role in generating the low stiffness of the flexible testing machine.
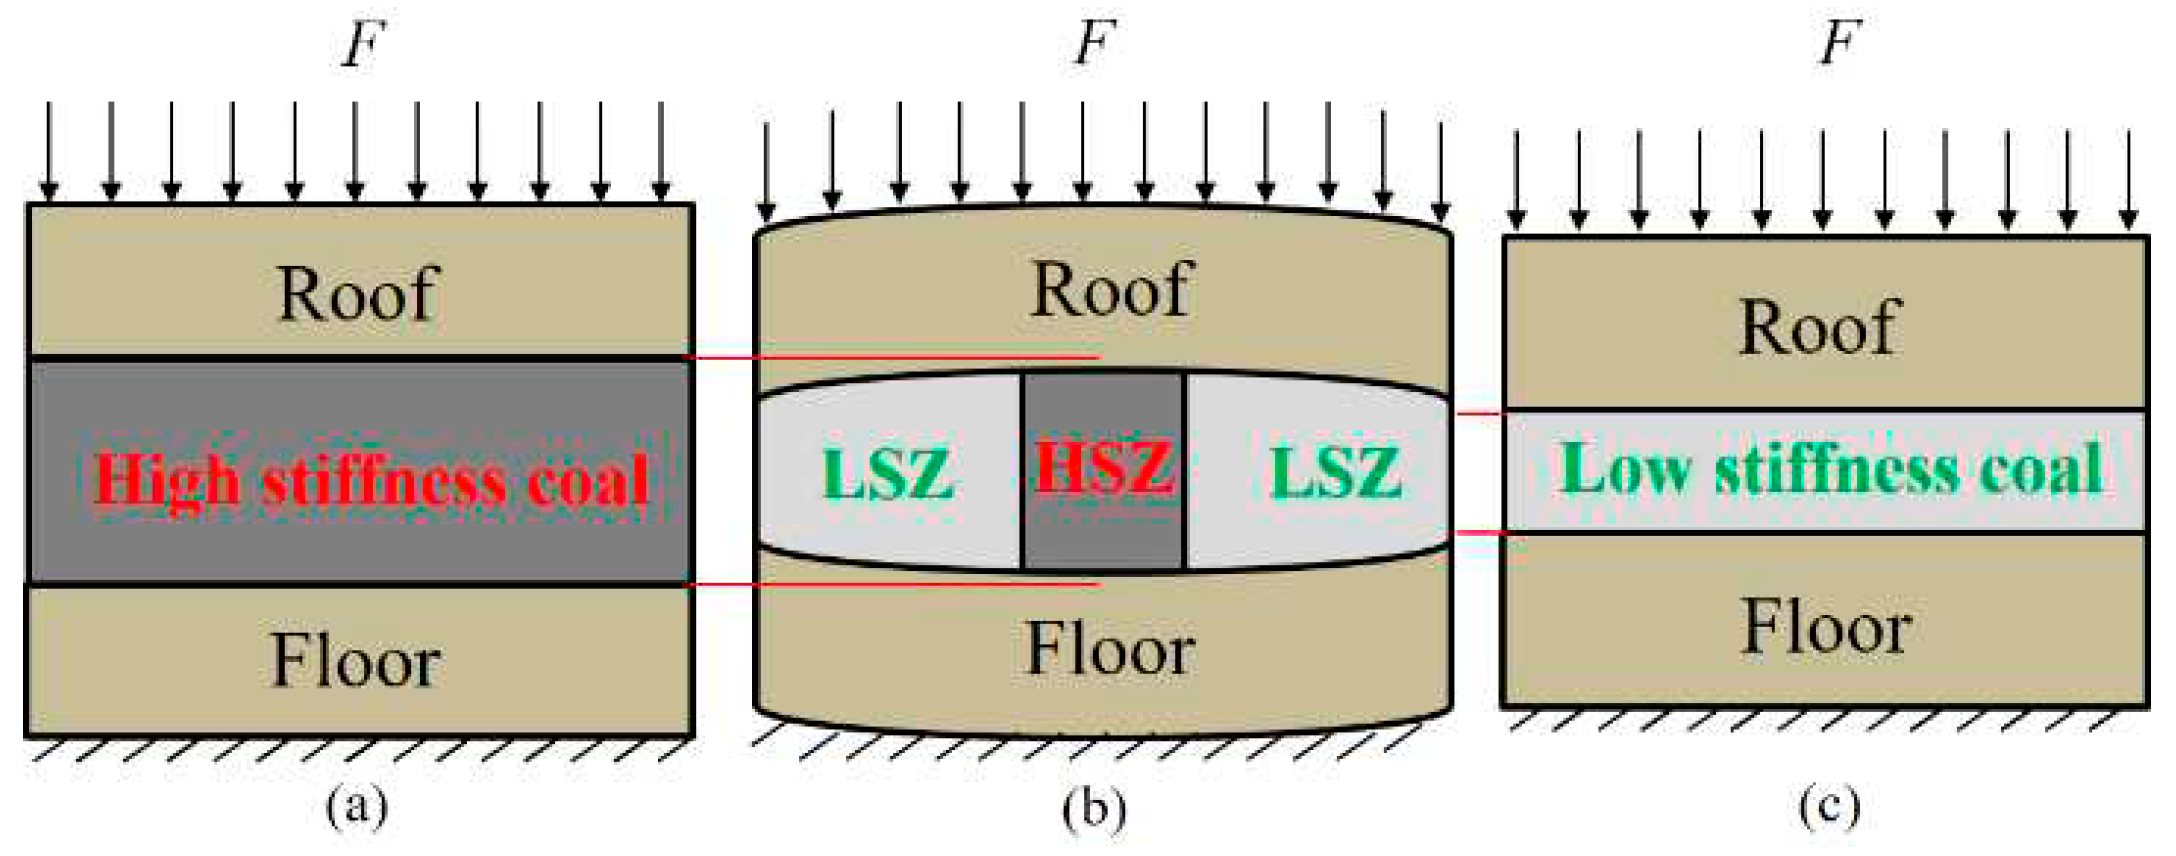
If a special structure similar to a flexible testing machine exists within the coal measure strata, the key parts responsible for reducing the overall stiffness of the structure through bending, similar to the flexible testing machine’s crossbeam, would be the roof or the floor. To achieve bending in either the roof or the floor, it is necessary for varying compression deformations to occur at different positions along the coal seam. This implies that the normal stiffness of the coal seam is uneven, resulting in the desired bending effect. Hence, this unique structure within the coal measure strata can be termed as the Uneven Stiffness Coal seam Structure, abbreviated as USCS. USCS is composed of continuous roof and floor that sandwich coal seam or composite coal seam with uneven stiffness distribution. Just like stress is used to quantify uneven force distribution, the uneven distribution of stiffness is quantified using the Normal Stiffness Coefficient (NSC), which represents the normal stiffness per unit area and is measured in N/m³. Within the USCS, sections of the coal seam with higher NSC values are identified as high stiffness zone (HSZ), whereas regions with lower NSC values are classified as low stiffness zone (LSZ). On the other hand, the Even Stiffness Coal Seam Structure (ESBS) represents the contrasting counterpart of USCS, comprising continuous roof and floor along with a coal seam exhibiting an even distribution of stiffness. Figure 4 provides a visual comparison between these two structures.
The uneven distribution of normal stiffness enable USBS to have pressure concentration function which make the HSZ bears a higher static pressure under evenly distributed overlying loads. This function results in the HSZ coal mass reaching the failure criterion more easily compared to the LSZ. Once the failure criterion is reached, the USCS experiences post-peak instability similar to the specimen-testing machine system. In this process, the coal mass of HSZ serves as a pressure bearer and undergoes failure, while the surrounding rock, including the roof, floor, and LSZ in series, serves as a pressure provider and releases stored energy. Considering equation (4), it is apparent that connecting elastic elements in series inevitably leads to an overall stiffness of the series structure being lower than stiffness of any constituent unit. Therefore, regardless of the hardness of the roof and floor, the overall stiffness (kp) of the pressure provider is in a state lower than the LSZ until the roof and floor separate from contact with the LSZ. This stiffness reduction function makes the USCS more likely to meet the stiffness criterion compared to the ESBS with the same roof and floor. Therefore, the USCS can exhibits lower structural stiffness even when the roof and floor are hard, thus reconciling the contradiction between stiffness theory and engineering common sense.
USCS exhibits both the pressure concentration function and the stiffness reduction function. The pressure concentration function enables stress to concentrate from the LSZ to the HSZ, thereby increasing the risk (rF) of failure. On the other hand, the stiffness reduction function reduces the overall stiffness observed in the failure process of the surrounding rock, making it easier to meet the stiffness criterion and leading to post-peak instability, thus elevating the risk (rI) of instability. In contrast, ESBS lacks any pressure concentration or stiffness reduction function, regardless of the normal stiffness of the coal seam. Equation (7) supports the conclusion that the risk (rCB) of coal bump occurrence in the HSZ of USCS surpasses that in ESBS. Therefore, USCS is a structural factor that promotes the onset of coal bump incidents.
In the case of a uniform rock stratum with an elastic modulus represented by E and a thickness denoted by H, Equation (8) can be employed to calculate the NSC.
K = k / S = E / H
Equation (8) states that altering the elastic modulus of coal or reducing the thickness of the coal seam can both modify the Normal Stiffness Coefficient (NSC) of the coal seam, leading to the formation of USCS. Extensive engineering practices have confirmed that the risk (rCB) of coal bump is higher in regions with varying coal seam thickness compared to regions with a consistently thick or thin coal seam. This is primarily due to the formation of the USCS in the zones of coal thickness variation, which are more prone to coal bump occurrences compared to ESBS consisting of a homogenous coal seam with uniform thickness. Moreover, if certain sections of the local coal seam are replaced by rock with higher elastic modulus, it can also result in a change in the NSC. For a compound coal seam with a total thickness of H, a coal elastic modulus of Ec, and the inclusion of strata with a thickness of hr and an elastic modulus of Er (>Ec), the normal stiffness coefficient of the composite coal seam, denoted as Kc+r, satisfies equation (9).
K c + r = E c H h r E r h r / ( E c H h r + E r h r ) = E c H h r + h r E c / E r E c H = K c
According to equation (9), when the overall thickness of the coal seam and the elastic modulus of the coal remain constant, the normal stiffness coefficient (Kc+r) of a composite coal seam containing igneous rock or rock parting is higher than that of a pure coal seam. As a result, the magmatic intrusion zone or the bifurcation zone of coal seam with thickened rock parting will be categorized as HSZ and contribute to the formation of the USCS along with the surrounding coal seam, roof, and floor. The USCS in Figure 4(b), resulting from variations in elastic modulus of coal is known as material USCS, while the USCS arising from changes in coal seam thickness or the ratio of coal rock thickness is referred to as thickness USCS.
Coal seam thinning zones, bifurcation zones, magmatic intrusion zones are all areas with high incidence of coal bump. In Tianchi Coal Mine in Sichuan Province, for instance,approximately 50% of the 28 major coal bump accidents happened in areas where the coal seam thickness underwent sudden changes, like floor protrusion zones, zones with sharp changes in coal seam dip angles, coal seam thinning zones, and strata pinch-out zones [3]. Notable coal bump incidents, such as the “7.29” event on the 1305 working face of Zhaolou Coal Mine of Yankuang Group in 2015 and the “10.20” major coal bump disaster on the 1303 working face of Shandong Longyun Coal Mine in 2018, occurred near coal seam bifurcation zones [35]. Similarly, coal mines like Pingzhuang Gushan, Huaibei Haizi, and Shandong Liangbaosi have all experienced coal bump accidents near magmatic intrusion areas [36]. Despite the varying locations depicted in Figure 5, the common feature among these coal bump locations is exhibit higher normal stiffness than the surrounding regions.To gain a unified understanding and implement targeted prevention and control measures based on their shared characteristics, these areas where the thickness of coal and rock has changed locally due to geological factors can be classified as the high stiffness zones of thickness USCS.

3.2. Analysis of Pressure Concentration Function of USCS

In analyzing coal bumps, scholars frequently utilize stress concentration and often attribute the cause of stress concentration to tectonic stress without exploring the topic in depth. However, it is important to note that the natural USCS represents a range of tectonic structures and can serve as a starting point for investigating stress concentration resulting from tectonic factors. Under the condition of uniform distribution of overlying loads, stress tends to concentrate from low stiffness zone (LSZ) to high stiffness zone (HSZ), particularly at the boundary between HSZ and LSZ. Furthermore, the degree of stress concentration increases with the magnitude of stiffness variation.
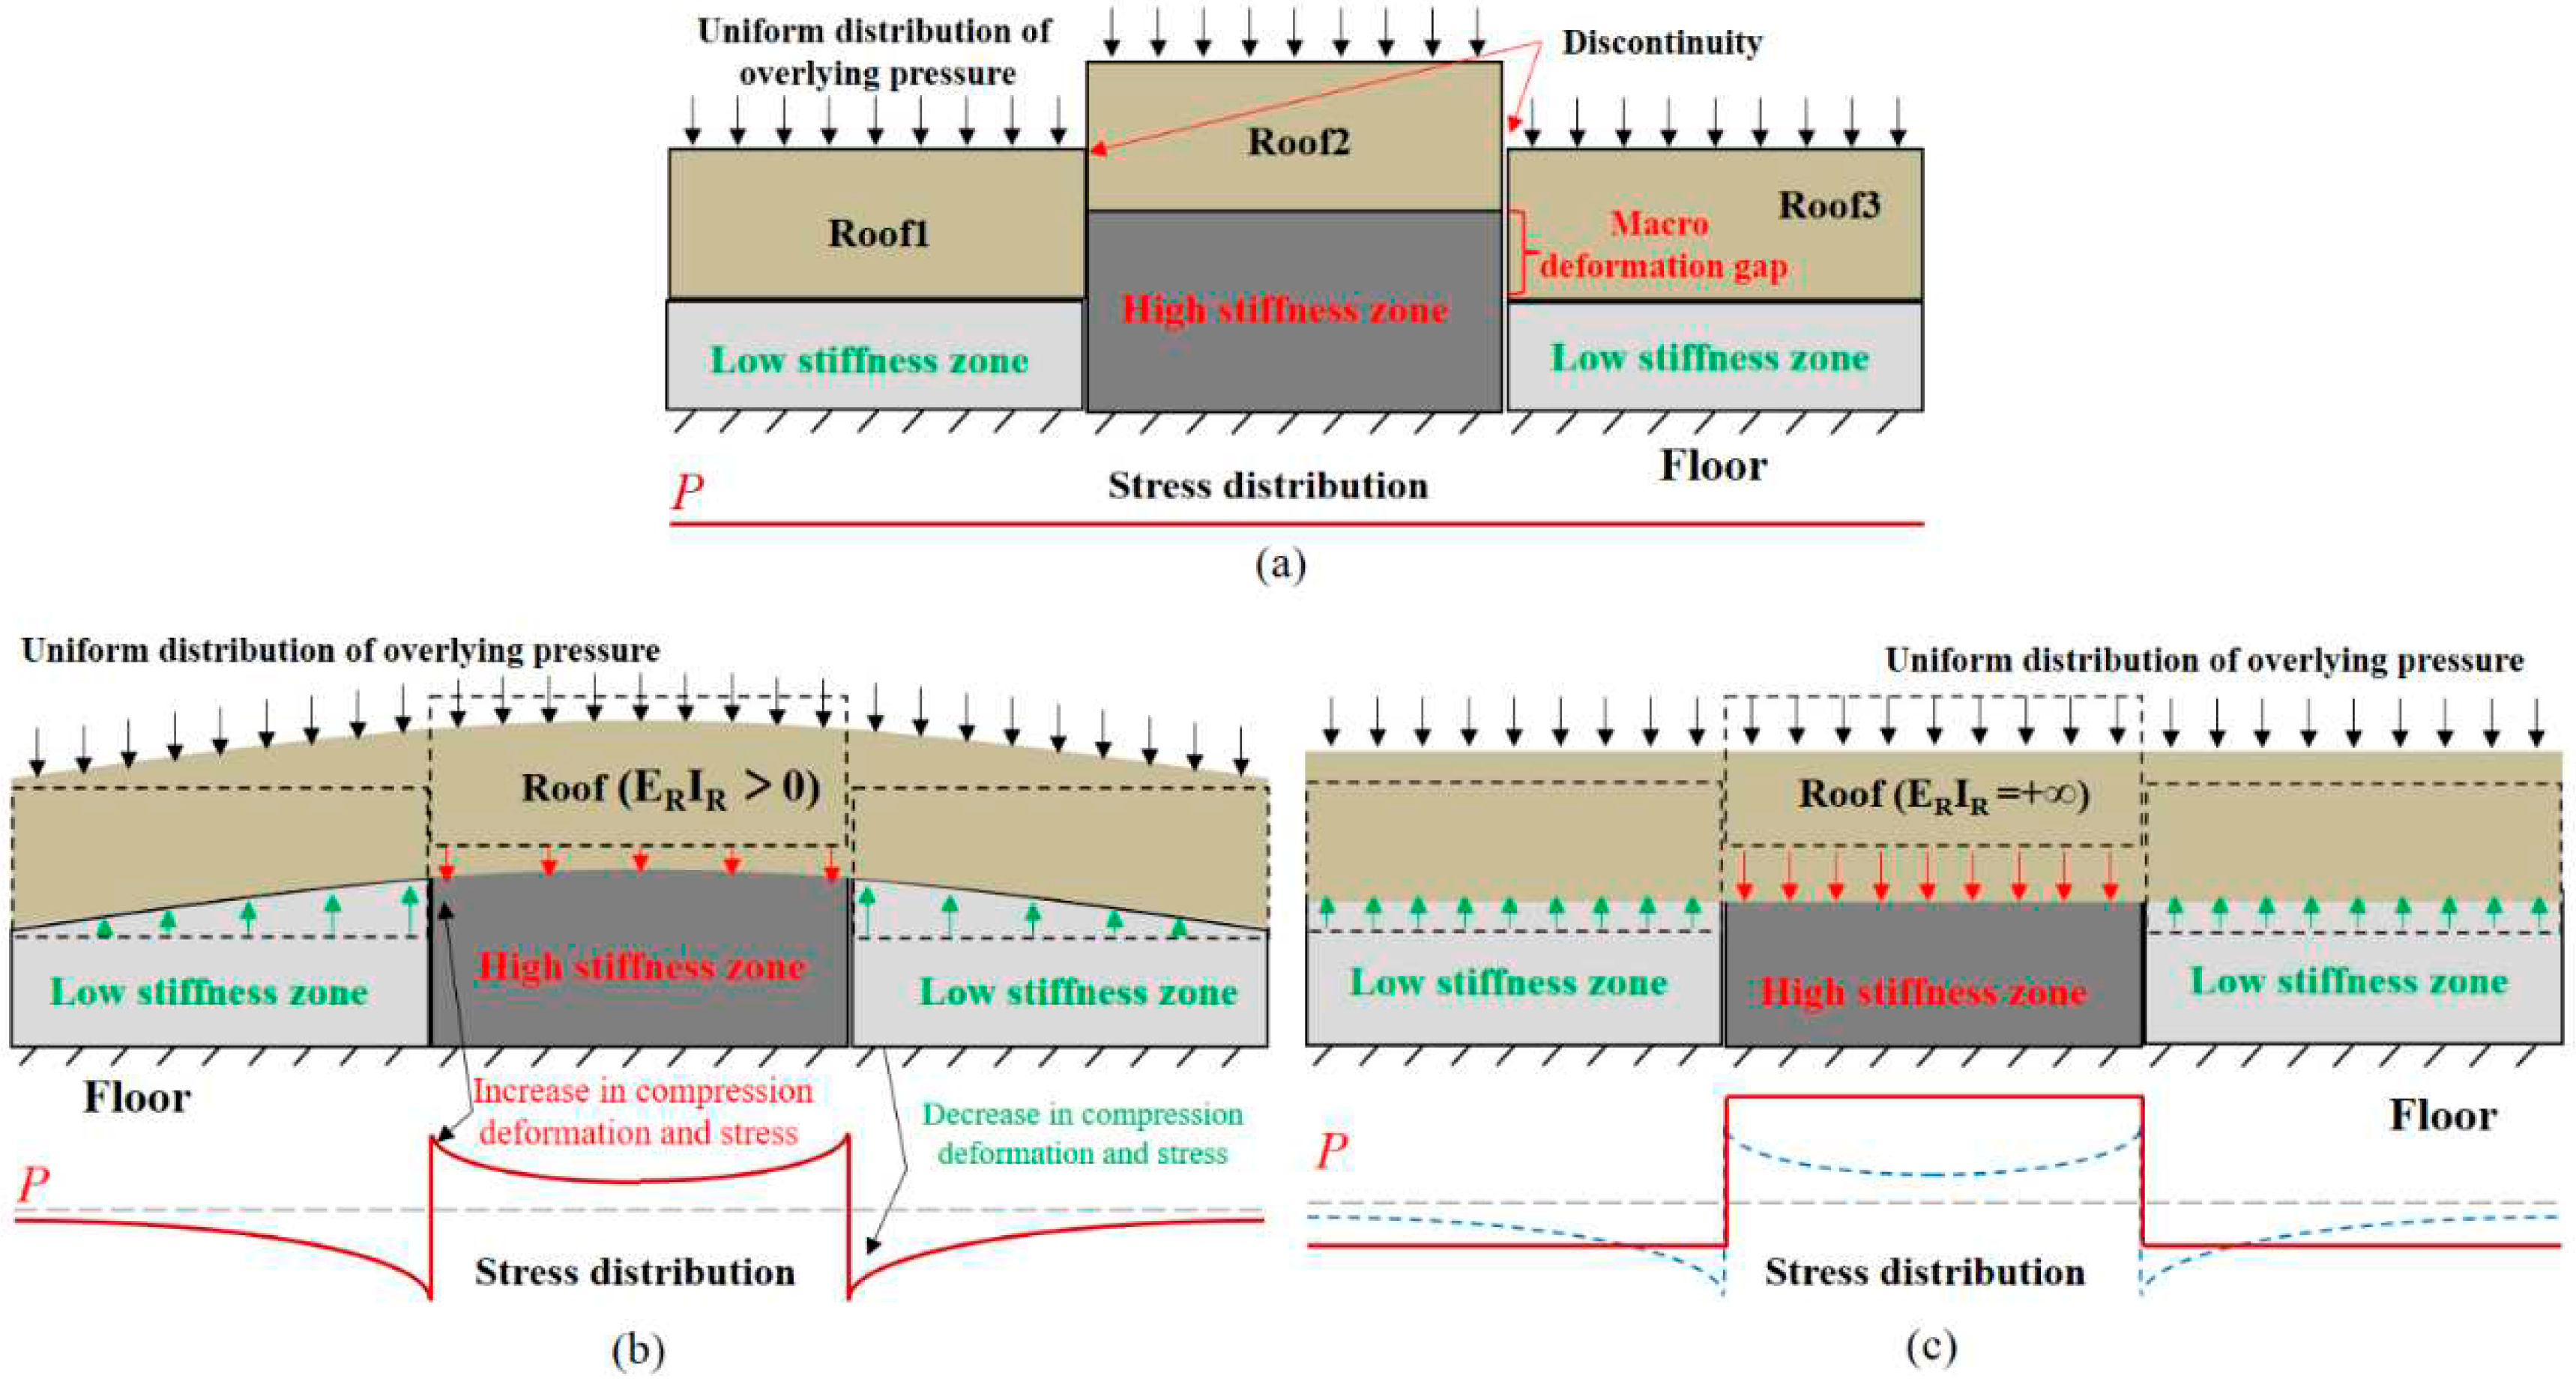
Figure 6 illustrates the simplified analysis conducted to study the stress distribution in an uneven stiffness coal seam under a uniformly distributed load. The approach involves fixing the floor and considering only the deformation of the coal seam and roof. The focus is on examining the normal deformation and normal stress distribution in the coal seam under three different scenarios.
In the first scenario, if the roof and coal seam exhibit extreme flexibility (with a bending stiffness of 0) or if there are discontinuities at the boundaries between the high stiffness zone (HSZ) and low stiffness zone (LSZ), the normal stress in each area of the coal seam will be uniformly distributed and denoted as P. However, a macro deformation gap will be present between the HSZ and LSZ, as depicted in Figure 6 (a).
Moving to the second scenario, when the roof is continuous and possesses a finite bending stiffness greater than 0, it will bend to eliminate the macroscopic deformation gap and maintain a continuous coordination of deformation. This bending action leads to increased compression deformation in the HSZ, particularly at its boundary, and reduced compression deformation in the LSZ, especially at its boundary. As a result, the normal stress in the coal seam will be greater than P in the HSZ and less than P in the LSZ, as shown in Figure 6 (b). Considering the premise of maintaining the bending stiffness of the roof, the greater the difference in normal stiffness between the HSZ and LSZ, the more significant the bending deflection of the roof, leading to a higher concentration of normal stress in the HSZ.
The third scenario involves a continuous roof with infinite bending stiffness, thereby preventing any bending from occurring. Consequently, the deformation in both the HSZ and LSZ will be forced to be consistent, as depicted in Figure 6 (c). In this case, the normal stress σH’ in HSZ and σL’ in LSZ will satisfy equation (10).
{ σ H S H + σ L S L = P ( S H + S L ) σ H S H / k H = σ L S L / k L = σ H / K H = σ L / K L
where, KH and SH is the NSC and area of the HSZ, respectively; and KL and SL is the NSC and area of LSZ, respectively. The solution of equation (10) can be writed as follows:
{ σ H = P ( S H / S L + 1 ) ( S H / S L + K L / K H ) σ L = P ( S L / S H + 1 ) ( S L / S H + K H / K L )
Upon observing equation (11), it becomes evident that the ratio KH/KL exhibits a positive correlation with σH’ and a negative correlation with σL’. Given that KL/KH is less than 1 (indicating that the normal stiffness coefficient of the coal seam in the high stiffness zone must surpass that of the low stiffness zone), it follows that σH’ must exceed P. Additionally, as the SL/SH ratio becomes larger, σH’ tends to approach P. Therefore, σH’ displays a negative correlation with SL/SH, or equivalently, a positive correlation with SL/SH. Similarly, KH/KL is greater than 1, and σL’ must be less than P. Furthermore, as the ratio SL/SH increases, σL’ progressively approaches P. Hence, σL’ also exhibits a positive correlation with SL/SH.
The bending stiffness of the roof have two ideal extreme cases: either 0 or infinity. However, in practical scenarios, the actual bending stiffness of the roof lies between these two extremes. Consequently, the normal stress σH in the high stiffness zone (HSZ) also falls between the values of P and σH’. Moreover, as the bending stiffness of the roof increases, σH approaches σH’ more closely, establishing a positive correlation between σH and the roof’s bending stiffness. Typically, the roof is simplified as a rectangular cross-section beam, with the bending stiffness being the product of the elastic modulus (ER) of the roof and the inertia moment (IR) of the roof section. It is worth noting that the IR is positively correlated with the roof’s thickness (HR). Considering that σH’ represents the limit of σH, it can be inferred that σH is similar to σH’ and shows a positive correlation with both KH/KL and SL/SH. Similarly, it can be deduced that σL exhibits a negative correlation with ER, HR, and KH/KL but a positive correlation with SL/SH.
Based on the analysis above, it is evident that the pressure concentration function of USCS induces stress redistribution, ultimately resulting in stress concentration within a uniform stress field. This function stems from the ability of the roof and floors to transfer the load originally assigned to the LSZ through bending to the HSZ. Consequently, the bending stiffness of the roof and floor directly influences the later al transfer capacity. The higher elastic modulus (ER) or larger thickness (HR) of roof make it easier to bend, leading more concentrated stress states appear in the HSZ. Additionally, the discrepancy in stiffness (KH/KL) and area (SL/SH) between the HSZ and LSZ leads to an increased load per unit area in the HSZ, exacerbating stress concentration. Hence, it is apparent that besides damage caused by superimposed mining stress or external dynamic loads, enhancing the values of KH/KL or SL/SH in the USCS can also further improve σH, consequently enabling the coal mass in the HSZ to approach or reach the failure criterion.

3.3. Analysis of Stiffness Reduction Function of USCS

A simplified model of the coal mass-surrounding rock system during the failure process, focusing on the roof deformation while assuming a fixed floor, is depicted in Figure 7. When the coal mass reaches its peak pressure, both the internal force (Fb) of the coal mass and the internal force (Fp) of roof experience the maximum load, Fmax. Post-peak, Fb decreases due to the strain softening of the coal mass, while Fp decreases due to roof deformation recovery.
During the coal mass failure process, the overall amount of roof deformation recovery is denoted by Δx. In the case of even stiffness coal seam structure (ESCS), the roof has no bending deformation under uniform overlying loads. At this stage, the amount of recovery is Δx for compression deformation, so the overall stiffness (kp) of the pressure provider is equal to the normal stiffness (kR) of the roof, which can be computed using Equation (12).
k p = k R = E R S R / H R
In contrast, when USCS sustains uniform overlying loads, both compression deformation and bending deformation of the roof and floors recover. The recovery amount of compression deformation is αΔx, where α is the stiffness reduction coefficient of the USCS and is greater than 0 but less than 1. Consequently, the recovery amount of roof bending deformation is (1-αx. The reduction in internal force (ΔFp) of the pressure provider is solely proportional to the recovery amount of compression deformation, with αKRΔx representing the decrease in internal force. So the stiffness (kp) of the surrounding rock structure is determined using Equation (13) and must be less than kR.
k p = Δ F p / Δ x = k R α Δ x / Δ x = α k R = α E R S R / H R
Equation (13) illustrates that bending of the roof and floor can reduce its internal force reduction under the same amount of deformation recovery after the peak, leading to a decrease in the slope of the pressure provider’s unloading line (depicted as the blue line in Figure 2). Consequently, the stiffness (kp) is reduced as a result. Through a stiffness theory analysis, it becomes apparent that a lower stiffness in the surrounding rock yields greater compliance with stiffness criteria, thereby intensifying the burst intensity for coal mass failure and elevating the risk of instability (rI). Thus, when compared to the ESCS operating under identical conditions, the USCS exhibits a higher rI owing to its innate capability to reduce stiffness.
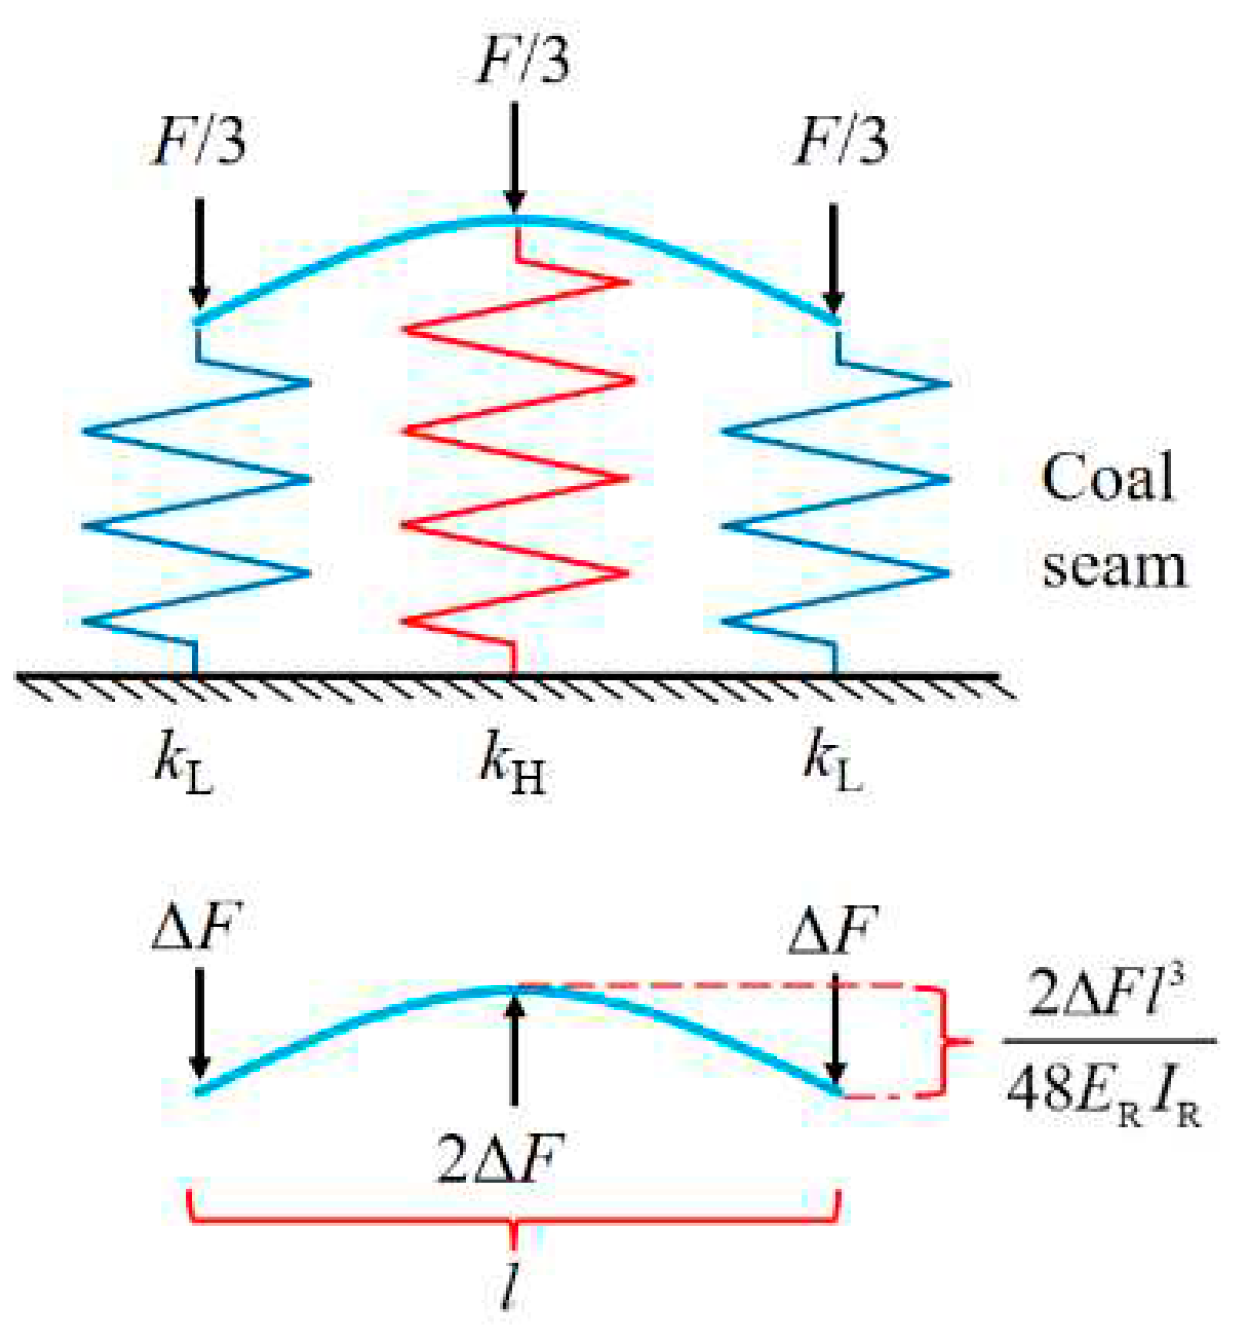
Considering the coal seam’ s HSZ and two equally sized LSZs, we can treat them as a combination of hard springs (kH) and soft springs (kL), respectively. Fix the floor and simplify the roof to be a flexible rectangular cross-section beam, and a trisection model of the USCS, as depicted in Figure 8, can be constructed. Assuming that the discrepancy between the internal force FL representing the LSZ and the average load is ΔF, Equation 14 can be deduced accordingly.
{ y L = F L / k L = ( F / 3 Δ F ) / k L y H = F H / k H = ( F / 3 + 2 Δ F ) / k H w = y L y H = 2 Δ F l 3 / 48 E R I R
Where, FH and FL represent the internal force of the spring in the high and low stiffness regions, yH and yL represent the compression deformation of the hard and soft springs, w is the bending deflection of the roof, and l is the lateral span of the structure. Equation (15) can be inferred from Equation (15).
{ Δ F = ( k H k L ) F / 3 2 k L + k H + ( k L k H ) l 3 / 24 E R I R = ( 1 1 / ( k H / k L ) ) F / 3 1 + 2 / ( k H / k L ) + k L l 3 / 24 E R I R w = Δ F l 3 24 E R I R = F / 3 ( 1 1 / ( k H / k L ) ) l 3 ( 1 + 2 / ( k H / k L ) + k L l 3 / 24 E R I R ) 24 E R I R = F / 3 ( 1 1 / ( k H / k L ) ) l 3 ( 24 E R I R + 48 E R I R / ( k H / k L ) + k L l 3 )
Given that the roof’s rotational inertia (IR) is positively correlated with its thickness (HR), it becomes evident from Equation (15) that both ERHR and KH/KL exhibit positive correlations with the value of ΔF. This observation reinforces the previously discussed findings regarding the impact of cohesive forces, as ΔF serves as an indicator of stress concentration in the HSZ. Conversely, it should be noted that w demonstrates a positive relationship with KH/KL, but an inverse relationship with ERHR. By incorporating the stiffness definition and combining Equations (13) and (15), the stiffness kp of the surrounding rock can be determined using Equation (16) within the trisection model of USCS.
k p = Δ F p Δ x = F H U H = F H w H + F H / k R = 1 Δ F l 3 / ( ( F / 3 + 2 Δ F ) 24 E R I R ) + 1 / k R = 1 / ( l 3 / ( 24 E R I R + 48 E R I R / ( k H / k L ) + k L ( 1 1 / ( k H / k L ) ) + 48 E R I R ) + H R E R l )
The stiffness ratio KH/KL of the coal seam is indeed equal to the NSC (Normal Stiffness Coefficient) ratio KH/KL. Equation (16) indicates that the stiffness (kp) of the surrounding rock structure has a negative correlation with the coal seam NSC ratio KH/KL, and a positive correlation with the elastic modulus of the roof (ER). In an Even Stiffness Coal Seam Structure (ESCS), the NSC ratio KH/KL is equal to 1, so the kp is equivalent to the stiffness (σy) of the roof. On the other hand, in an USCS, the NSC ratio KH/KL is greater than 1, resulting in a smaller kp compared to kR. This explains why the USCS exhibits a stiffness reduction function, while the ESCS does not. As the coal seam NSC ratio KH/KL increases, the stiffness of the surrounding rock decreases, making it easier to meet the stiffness criterion. This leads to a stronger burst intensity of coal mass failure and a higher risk of instability (rI). Therefore, when the risk of failure (rF) remains unchanged, the risk of coal bump (rCB) is higher as the coal seam NSC ratio KH/KL increases.

4. Simple Numerical Simulation of Uneven Stiffness Coal Seam Structure (USCS)
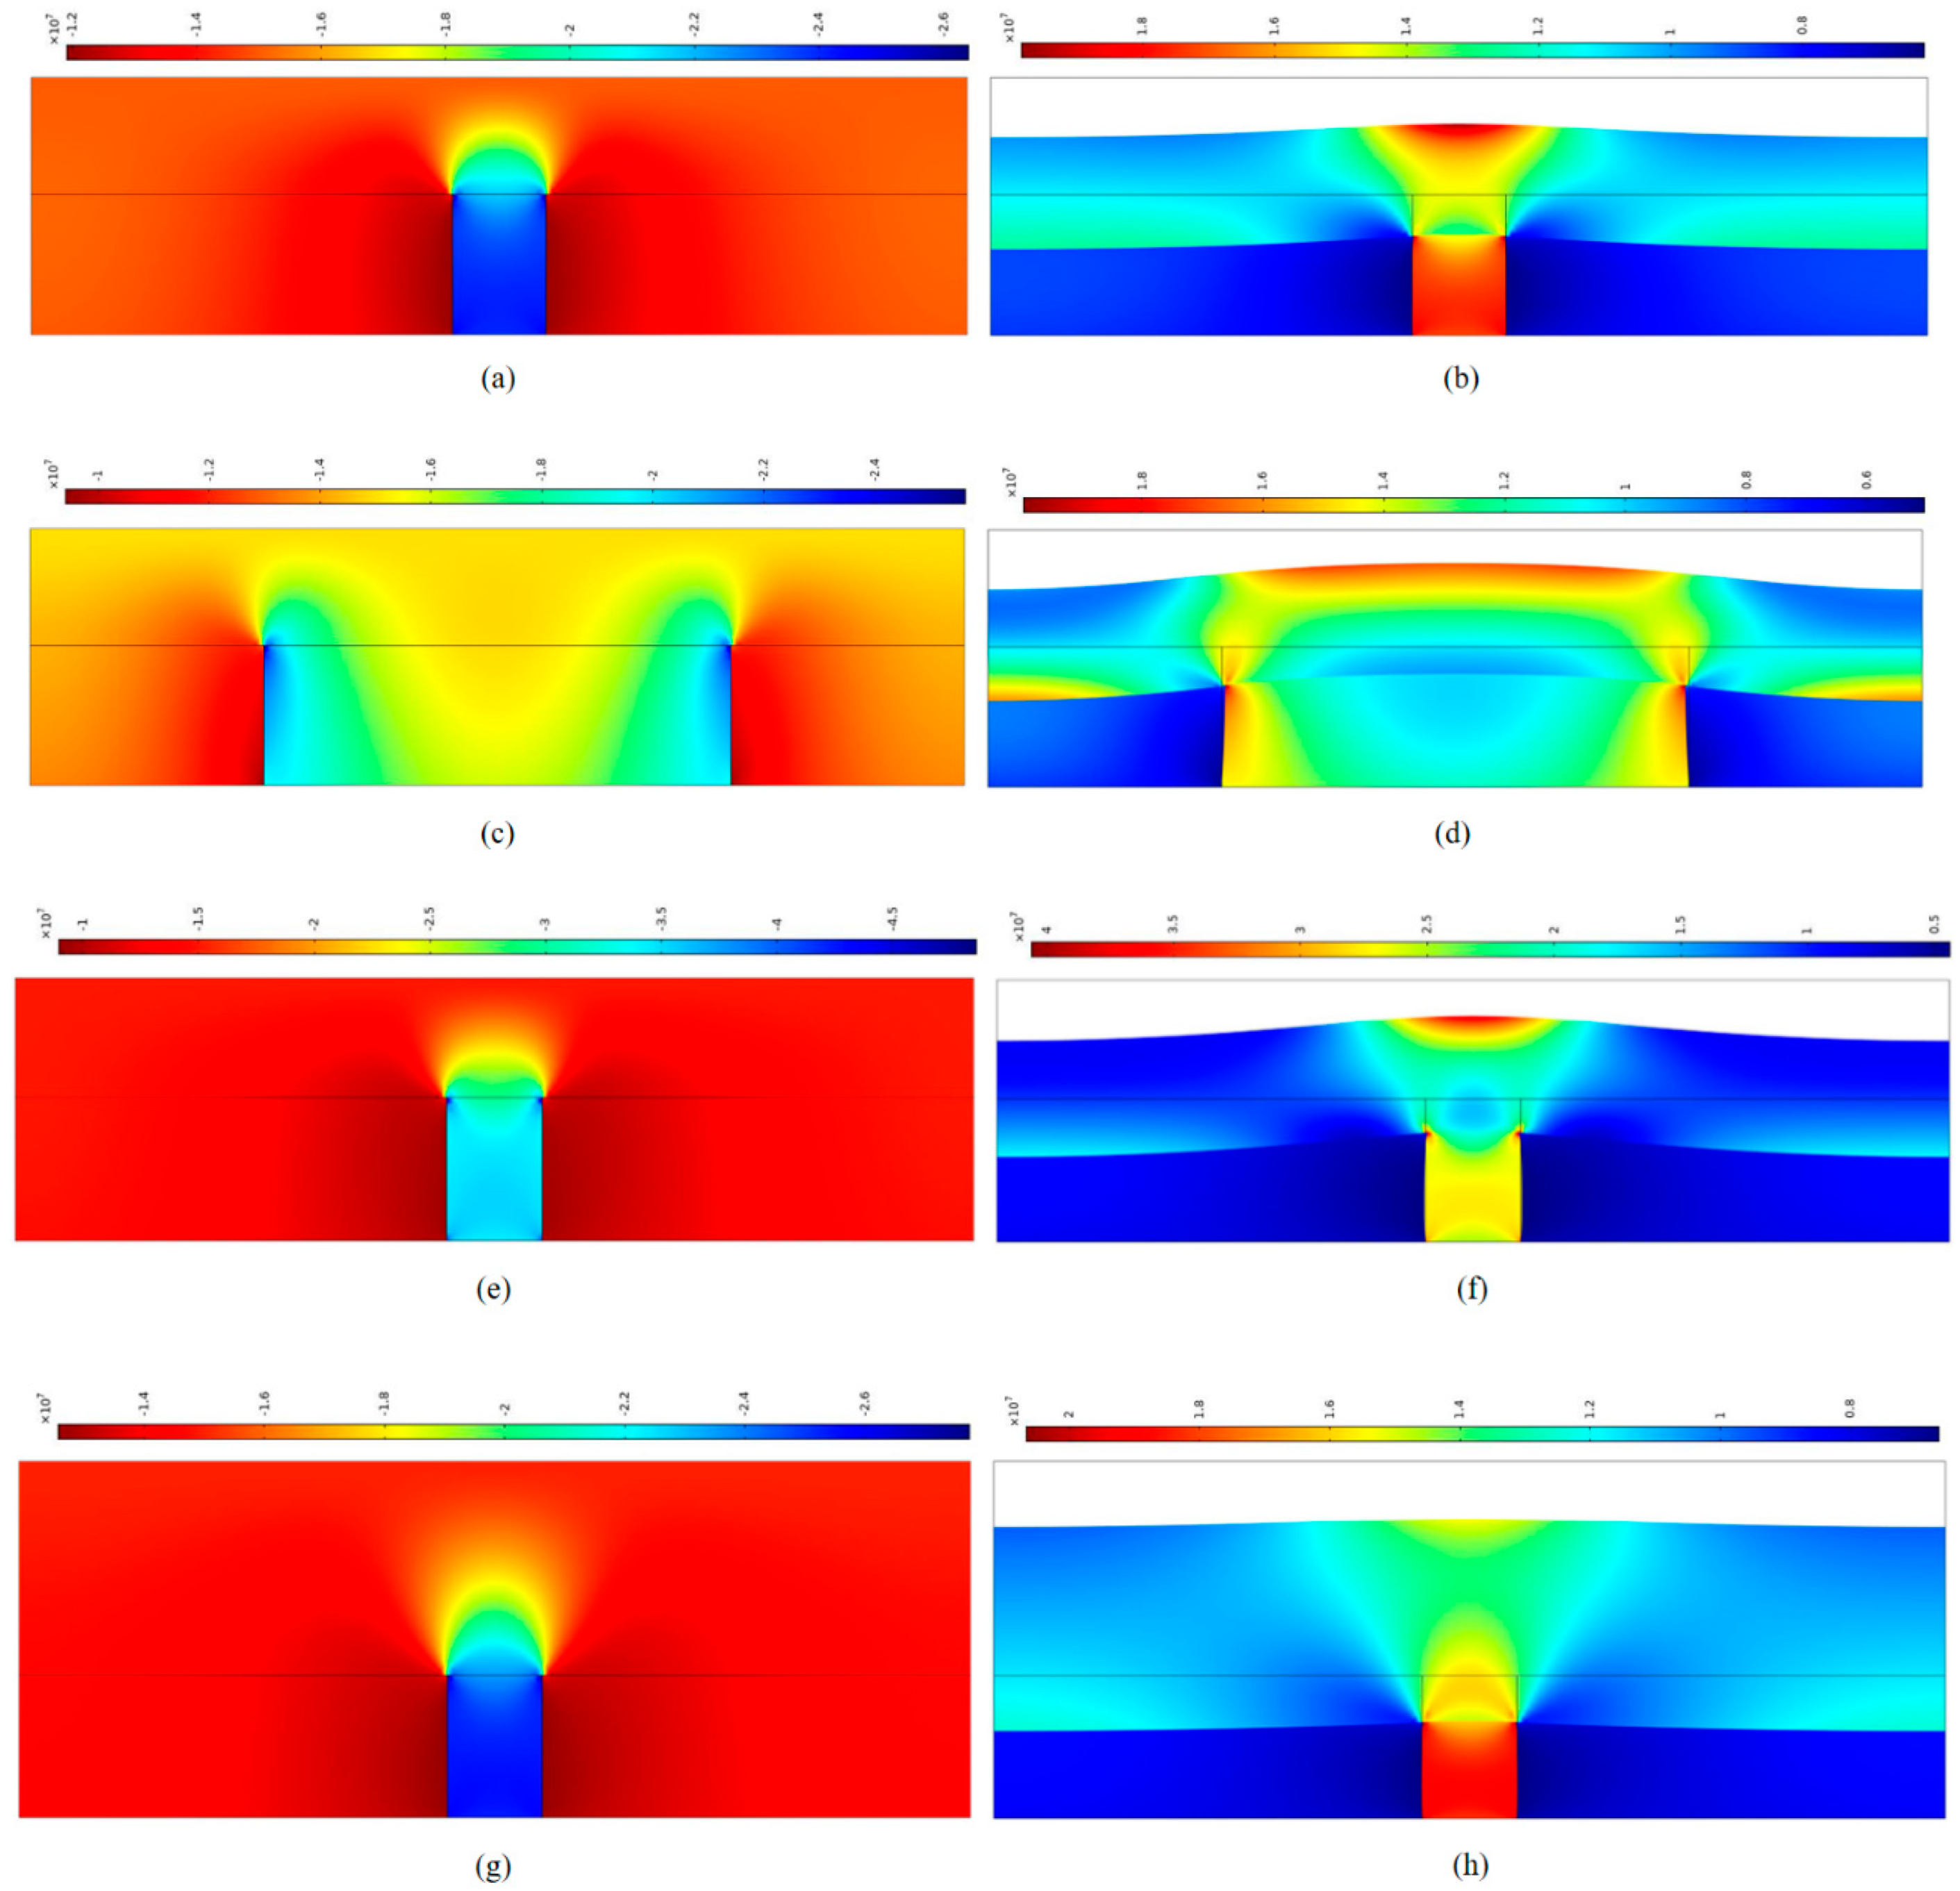
To validate previous analytical conclusions and examine the characteristics of USCS, a set of two-dimensional simplified models using COMSOL software was constructed. These models were created based on the controlled variables method, aiming to simulate different responses of the USCS under identical working conditions but with varying parameters. To simplify calculations, no failure criteria were established. In the constructed models, there is no floor and the bottom of the coal seam was subjected to constrained displacement in the normal direction, while the upper portion of the roof experienced no constraints but sustained a uniform pressure of 15MPa. The lateral displacements of both the roof and the coal seam were constrained at the left and right boundaries. The coal seam had a thickness of 6m with an inclination angle of 0 degrees. Notably, the model delineated distinct regions with different stiffness, comprising hard coal in the central section and soft coal on both sides. In terms of material properties, the Poisson’s ratio was set to 0.2 for the roof, 0.22 for the hard coal, and 0.3 for the soft coal. Detailed information regarding the model parameters can be found in Table 1. The 14 models were categorized into 6 groups based on different control variables (SH, ER, EH, EL, HR, SR, or SL). Model 1 served as a common member for each group, with the other models derived by modifying the values of the control variables in this group. Furthermore, modifying EH and EL essentially involved altering KH and KL. Additionally, since the USCS comprises coal seams, a continuous roof, and a floor, adjusting SH when SR remains unchanged or adjusting SR when SH remains unchanged in group 6 would effectively modify SL. The stress distribution and deformation of the models were computed, as depicted in Figure 9.
By examining Figure 9, it is evident that:
1) The normal stress and the Mises stress in the HSZ demonstrate notably higher values compared to those in the LSZ, providing evidence for the pressure concentration function of USCS. Furthermore, the roof displays bending deformation with its axis of symmetry aligned with the middle axis of the HSZ, substantiating the stiffness reduction function of USCS.
2) At the HSZ-LSZ boundary, significant stress concentrations are present, particularly at the shoulders of the HSZ. These areas are prone to crack development, and the normal stiffness coefficient (NSC) varies as the cracks progress, resulting in a transitional zone where NSC undergoes continuous changes. This aids in reducing stress concentration at the boundary, similar to decreasing the area (SH) of the HSZ. Consequently, the actual stress distribution differs from the results of a simple simulation. For instance, regions of high stress shift towards the middle, moving away from the boundary of the HSZ. Nevertheless, this does not impact the overall pattern of stress concentration towards the HSZ and roof bending.
3) Noteworthy discrepancies in stress distribution and roof deformation arise among different models within the same group. This indicates that the six parameters of USCS can influence pressure concentration and stiffness reduction functions.
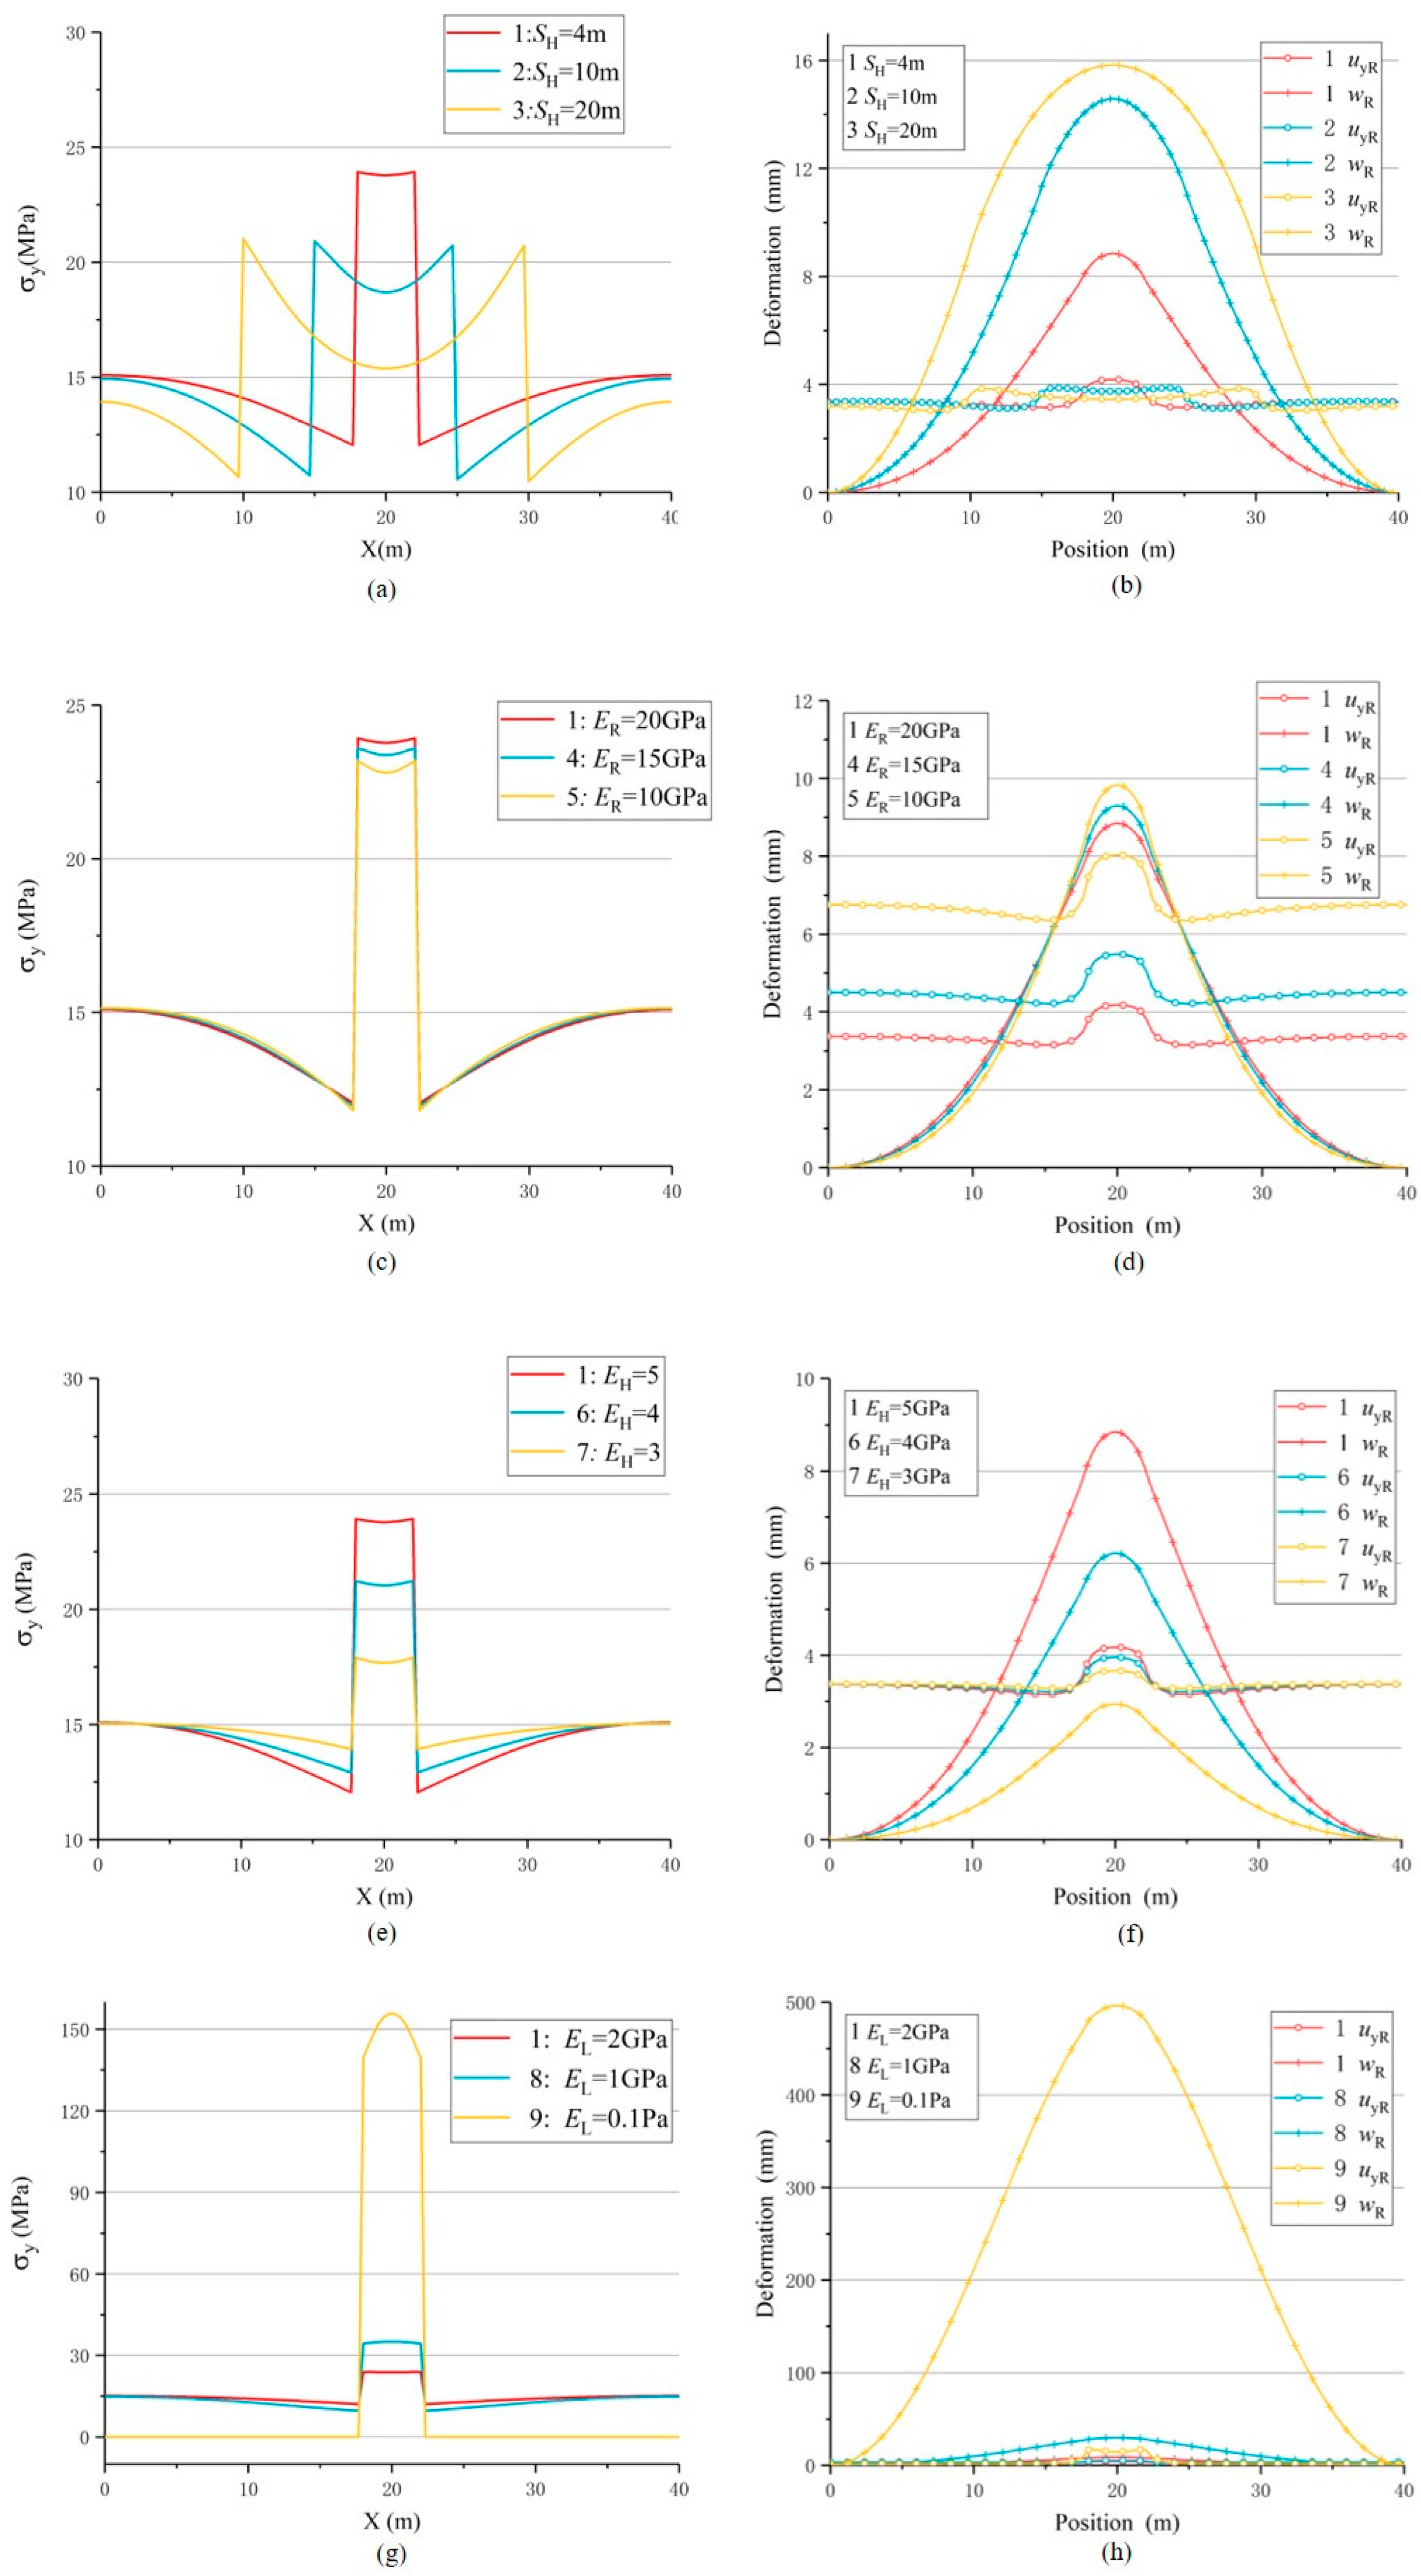
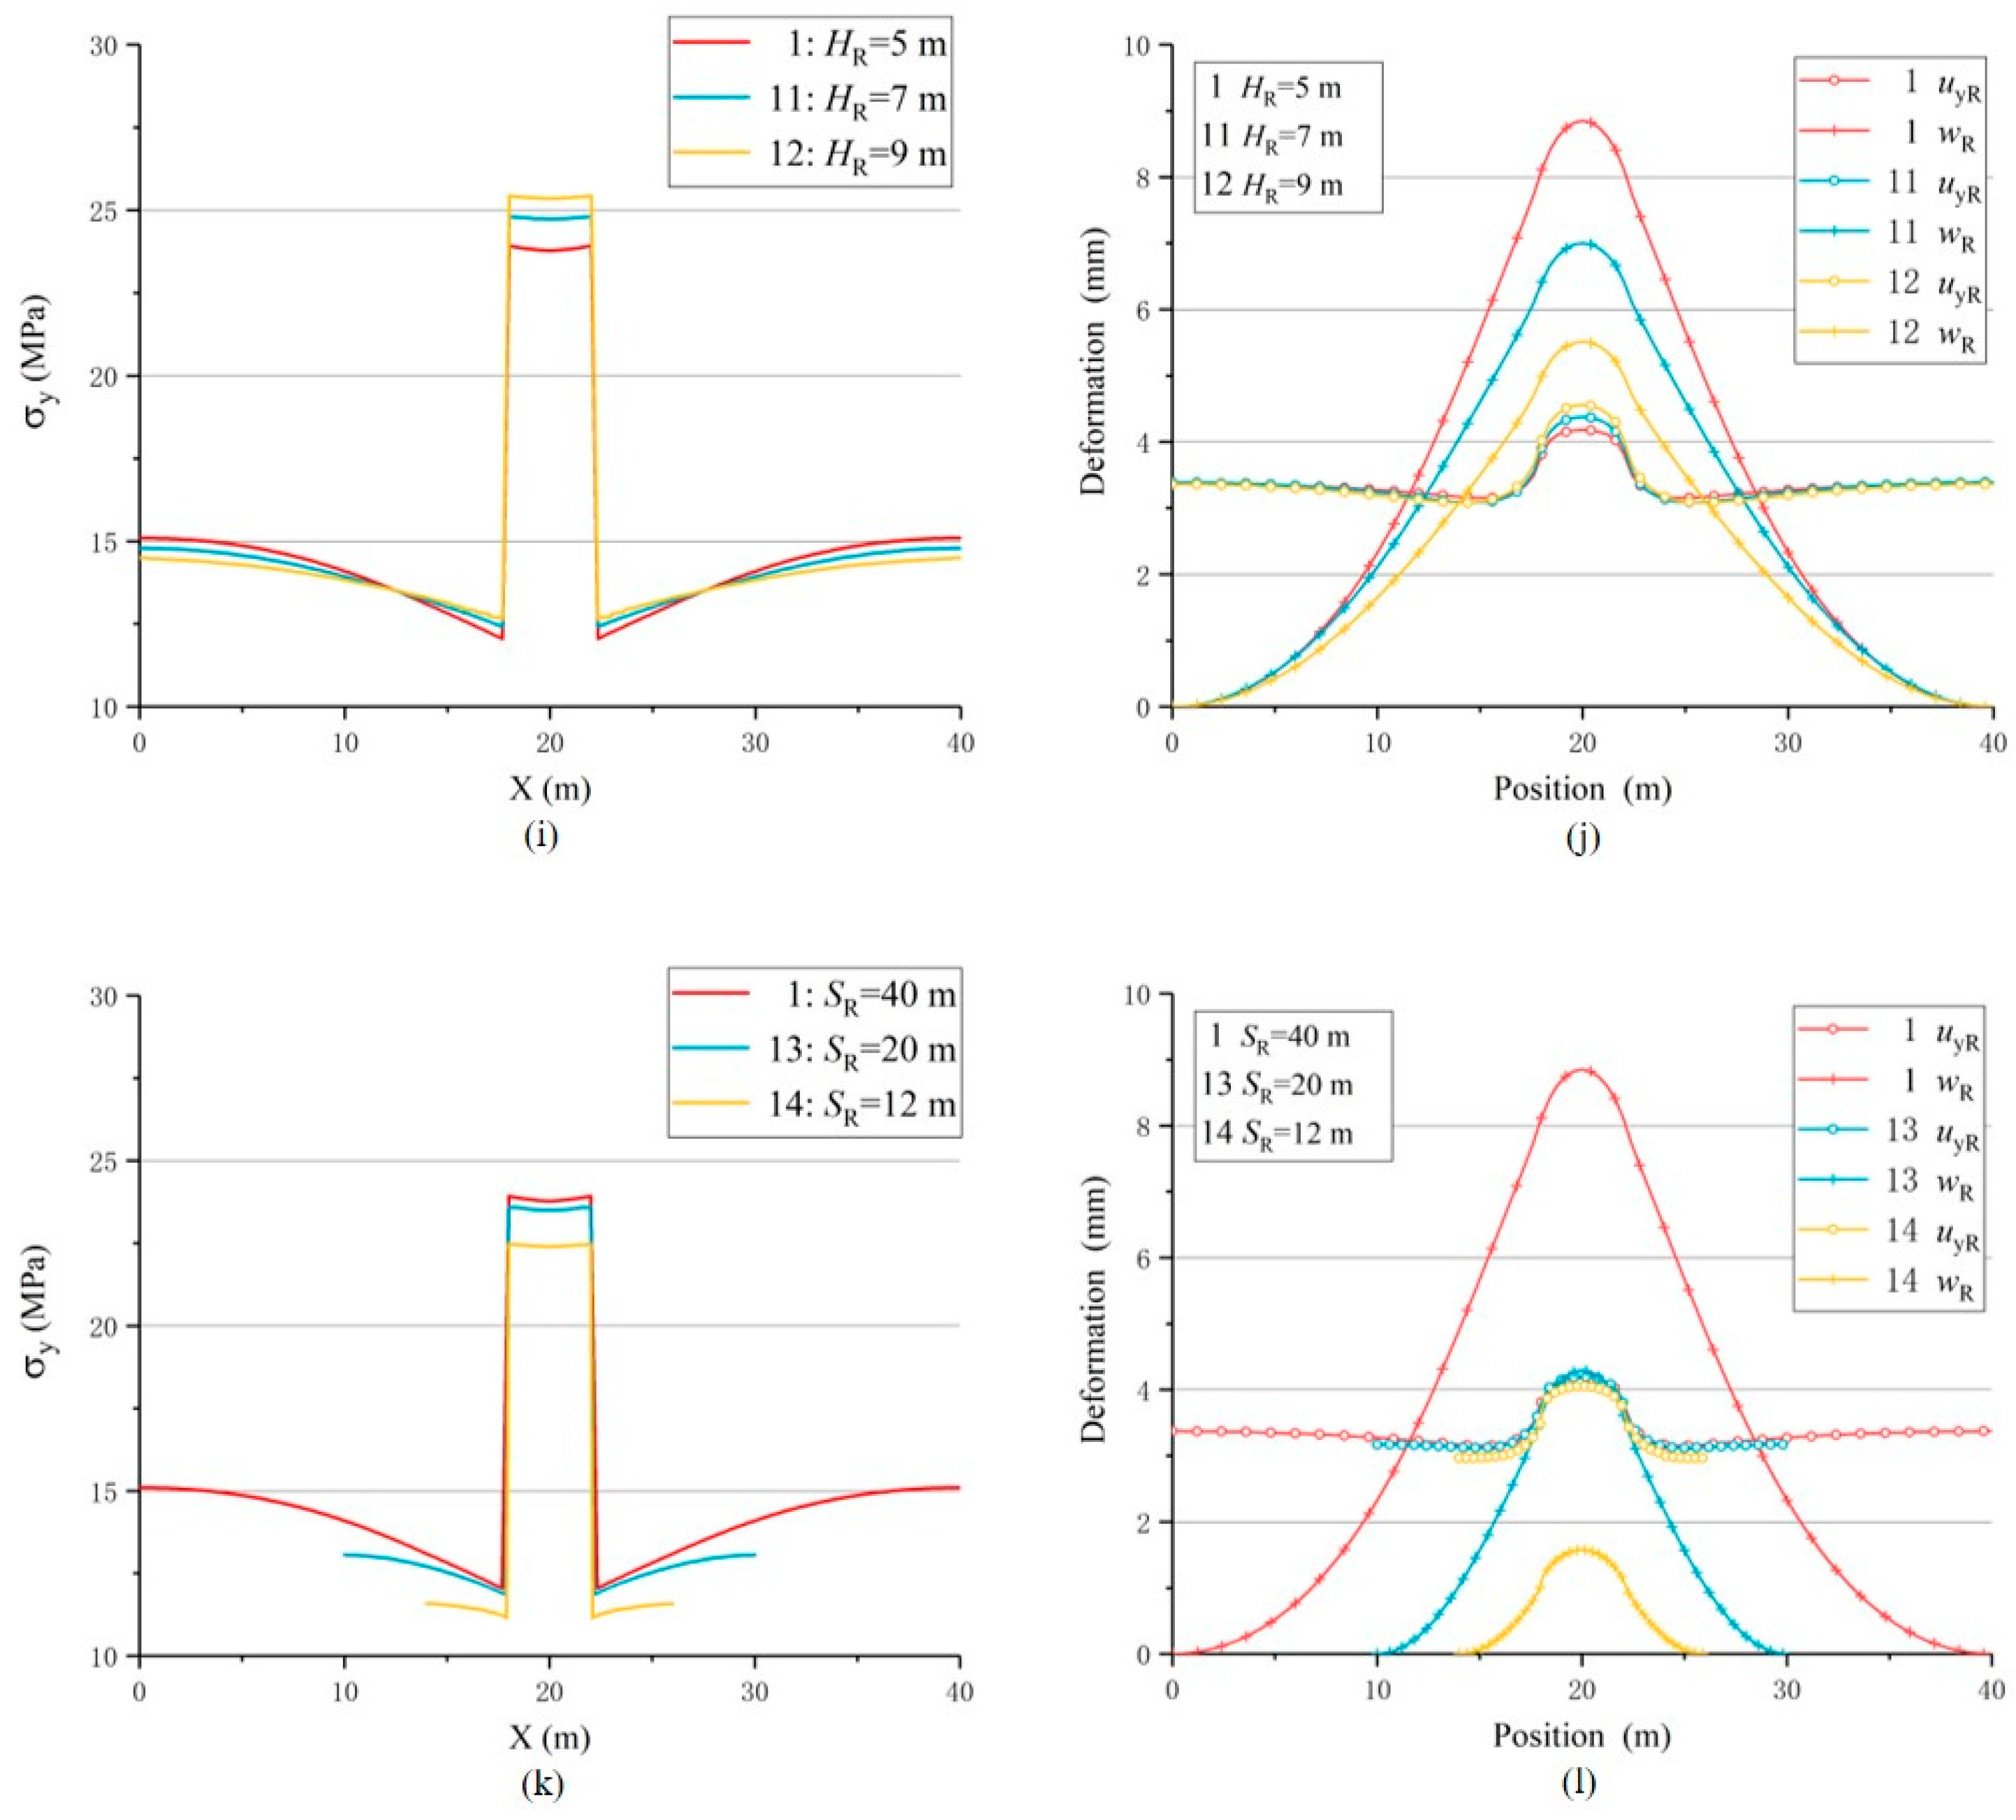
The variations in normal stress (σy), roof compression deformation (uyR), and roof bending deflection (wR) along the horizontal axis of different USCS models in six groups are determined through simulation calculations, as depicted in Figure 10. In the figure, the σy represents the stress values at the nodes located on the median line of the coal seam (with a vertical coordinate of 3m). The uyR is calculated as the disparity between the normal displacement values of nodes located on the lower boundary and their corresponding nodes on the upper boundary of the roof. Moreover, the wR is obtained by subtracting the minimum average normal displacement value from the mean normal displacement values calculated for the upper and lower boundary nodes of the roof. As a result, the wR on both sides of the roof is determined to be 0.
Figure 10. Variation curves of σy, uyR and wR of USCS models in six groups: (a) Curves of σy of models with different SH; (b) Curves of uyR and wR of models belong to group 1 ; (c) Curves of σy of models with different ER; (d) Curves of uyR and wR of models belong to group 2; (e) Curves of σy of models with different EH (or KH); (f) Curves of uyR a1nd wR of models belong to group 3; (g) Curves of σy of models with different EL (or KL); (h) Curves of uyR and wR of models belong to group 4; (i) Curves of σy of models with different HR ; (j) Curves of uyR and wR of models belong to group 5; (k) Curves of σy of models with different SR (or SL); (l) Curves of uyR and wR of models belong to group 6.
Preprints 88774 g010aPreprints 88774 g010b
Based on Figure 10, the following observations can be made:
1) The HSZ exhibits higher normal stress, compression deformation, and bending deflection compared to the LSZ in all models. The normal stress value (σyH) in the HSZ is positively correlated with the value of ERHRKHSL/KLSH, while the normal stress value (σyL) in the LSZ is positively correlated with the value of KLSL/ERHRKHSH.
2) In cases where the ratio of SL/SH remains constant (group 2 to 5), models with higher normal stress in the HSZ (σyH) exhibit lower normal stress in the LSZ (σyL) compared to other models within the same group. This indicates that the increase in σyH is attributed to the HSZ bearing a larger portion of the load that should have been borne by the LSZ, thus causing a reverse change in σyH and σyL. However, if the ratio of SL/SH changes (group 1 and 6), σyH and σyL decrease simultaneously with the decrease in SL/SH, demonstrating a consistent trend. This validates the conclusion derived from equation (11) that σH and σL are positively correlated with SL/SH.
3) The NSC (Normal Stiffness Coefficient) undergoes a significant step-like change at the boundaries between the HSZ and LSZ, leading to a mutation in the stress trend. As the distance from these boundaries increases, the normal stress in the HSZ (σyH) gradually decreases and approaches the average load P. Conversely, the normal stress in the LSZ (σyL) increases as the distance from the boundaries increases and tends towards the average load P gradually. Once the distance from the boundaries exceeds a certain limit, the stress distribution becomes similar to that of an ESBS. This finding suggests that the local stiffness mutation of USCS has a certain influence range on the stress field, and the influence outside this range can be neglected, which is in line with the Saint Venant principle. Through analysis of various models, it can be observed that a a greater /KL (representing greater stiffness mutation) or larger ERHR (indicating higher roof bending stiffness) corresponds to a larger influence range of USCS.
Table 2 presents the calculated average normal stress concentration factor ( f ¯ s c H ), average stiffness reduction coefficient ( α ¯ ), and average normal stiffness coefficient ( K ¯ pH ) in the HSZ for different models based on the simulation results. These coefficients provide an overview of the HSZ and can be estimated using Equation (17) as mentioned in the table.
{ f scH = σ ¯ yH / P K ¯ pH = α ¯ K R = u ¯ yRH U ¯ yRH E R H R = u ¯ yRH u ¯ yRH + w ¯ RH E R H R
Where, σ ¯ yH is the average normal stress value in the HSZ; P is the overlying pressure, set to 15MPa in the simulation; And u ¯ yRH and w ¯ RH are the average value of compression deformation and bending deflection of the roof in the HSZ, respectively.
Analyzing the information provided in Table 2 reveals the following findings:
1) Across all models of USCS, it is evident that the stress concentration factor of the HSZ (fscH) consistently exceeds Model 1. Additionally, the stiffness of the surrounding rock in the HSZ (KpH) remains lower than the stiffness of the roof (KR). These findings indicate that USCS exhibits the dual characteristics of pressure concentration and stiffness reduction functions.
2) The normal stress (σyH) in the HSZ positively correlates with ER, HR, KH, and SL, but negatively correlates with KL and SH; The stiffness (KpH) of surrounding rock in the HSZ negatively correlates with HR, KH, SL, and SH, but positively correlates with ER and KL.
3) An increase in the Elastic Modulus of the roof (ER) leads to a relatively smaller growth in KpH. When switch Model 1 to Model 5, where ER increases from 10 GPa to 20 GPa, the stiffness of the roof (KR) shows a 100% increase. In contrast, the relative increase in KpH is only 41.7%. The reduction in the value of α helps partially offset the influence of roof hardening on the stiffness of the surrounding rock.
For ESCS systems consisting of a continuous roof and floor that sandwich a coal seam with an even stiffness distribution, the normal stiffness of the surrounding rock (kp) is equivalent to that of the roof (kR). In cases where the roof is considered “hard,” indicating a higher elastic modulus (ER), the kR is elevated, resulting in a higher kp. Consequently, meeting the required stiffness criterion becomes a challenge. This clash between stiffness theory and practical engineering experience remains unresolved within ESCS arrangements.
In contrast, for USCS systems consisting of a continuous roof and floor that sandwich a coal seam with an uneven stiffness distribution, the stiffness reduction function allows for a decrease in kp, making it easier to meet the stiffness criterion. Although an increase in ER results in a higher kp, the increment in kp for USCS is considerably smaller compared to ESBS. Simulation results indicate that parameters such as HR, SR, and KH/KL, in addition to ER, can affect the value of kp. Certain USCSs have HRSRKH/KL values that are sufficiently large, effectively reducing kp below the threshold stated in equation (1). Even with an increase in ER within a specific range, these USCSs continue to satisfy the stiffness criterion, thereby maintaining a high risk (rI) of instability. In accordance with equation (7), raising the ER of specific USCSs with sufficiently larger HRSRKH/KL values can lead to an increase in risk (rF) of failure while keeping the risk (rI) of instability constant, thereby resulting in an increase in the risk of coal bump. This observation regarding USCS aligns with engineering expertise, which suggests a greater likelihood of coal bumps under the presence of a hard roof with higher ER. Thus, USCS can explain why hard roofs and floors are more susceptible to coal bumps without contradicting the stiffness theory. This partially resolves the conflict between stiffness theory and practical engineering experience.
Additionally, the widely accepted engineering consensus on the heightened probability of coal bumps occurring in regions with hard roofs and floors can be attributed to the prevalence of specific USCSs with sufficiently large HRSRKH/KL values in practical engineering scenarios. This suggests a higher abundance of these USCSs within coal measure strata, highlighting the potentially greater importance of USCSs as a contributing factor to coal bumps than initially anticipated.

5. Further Discussion about USCS

5.1. Connection between USCS and Existing Mechanism Research Results about Coal Bump

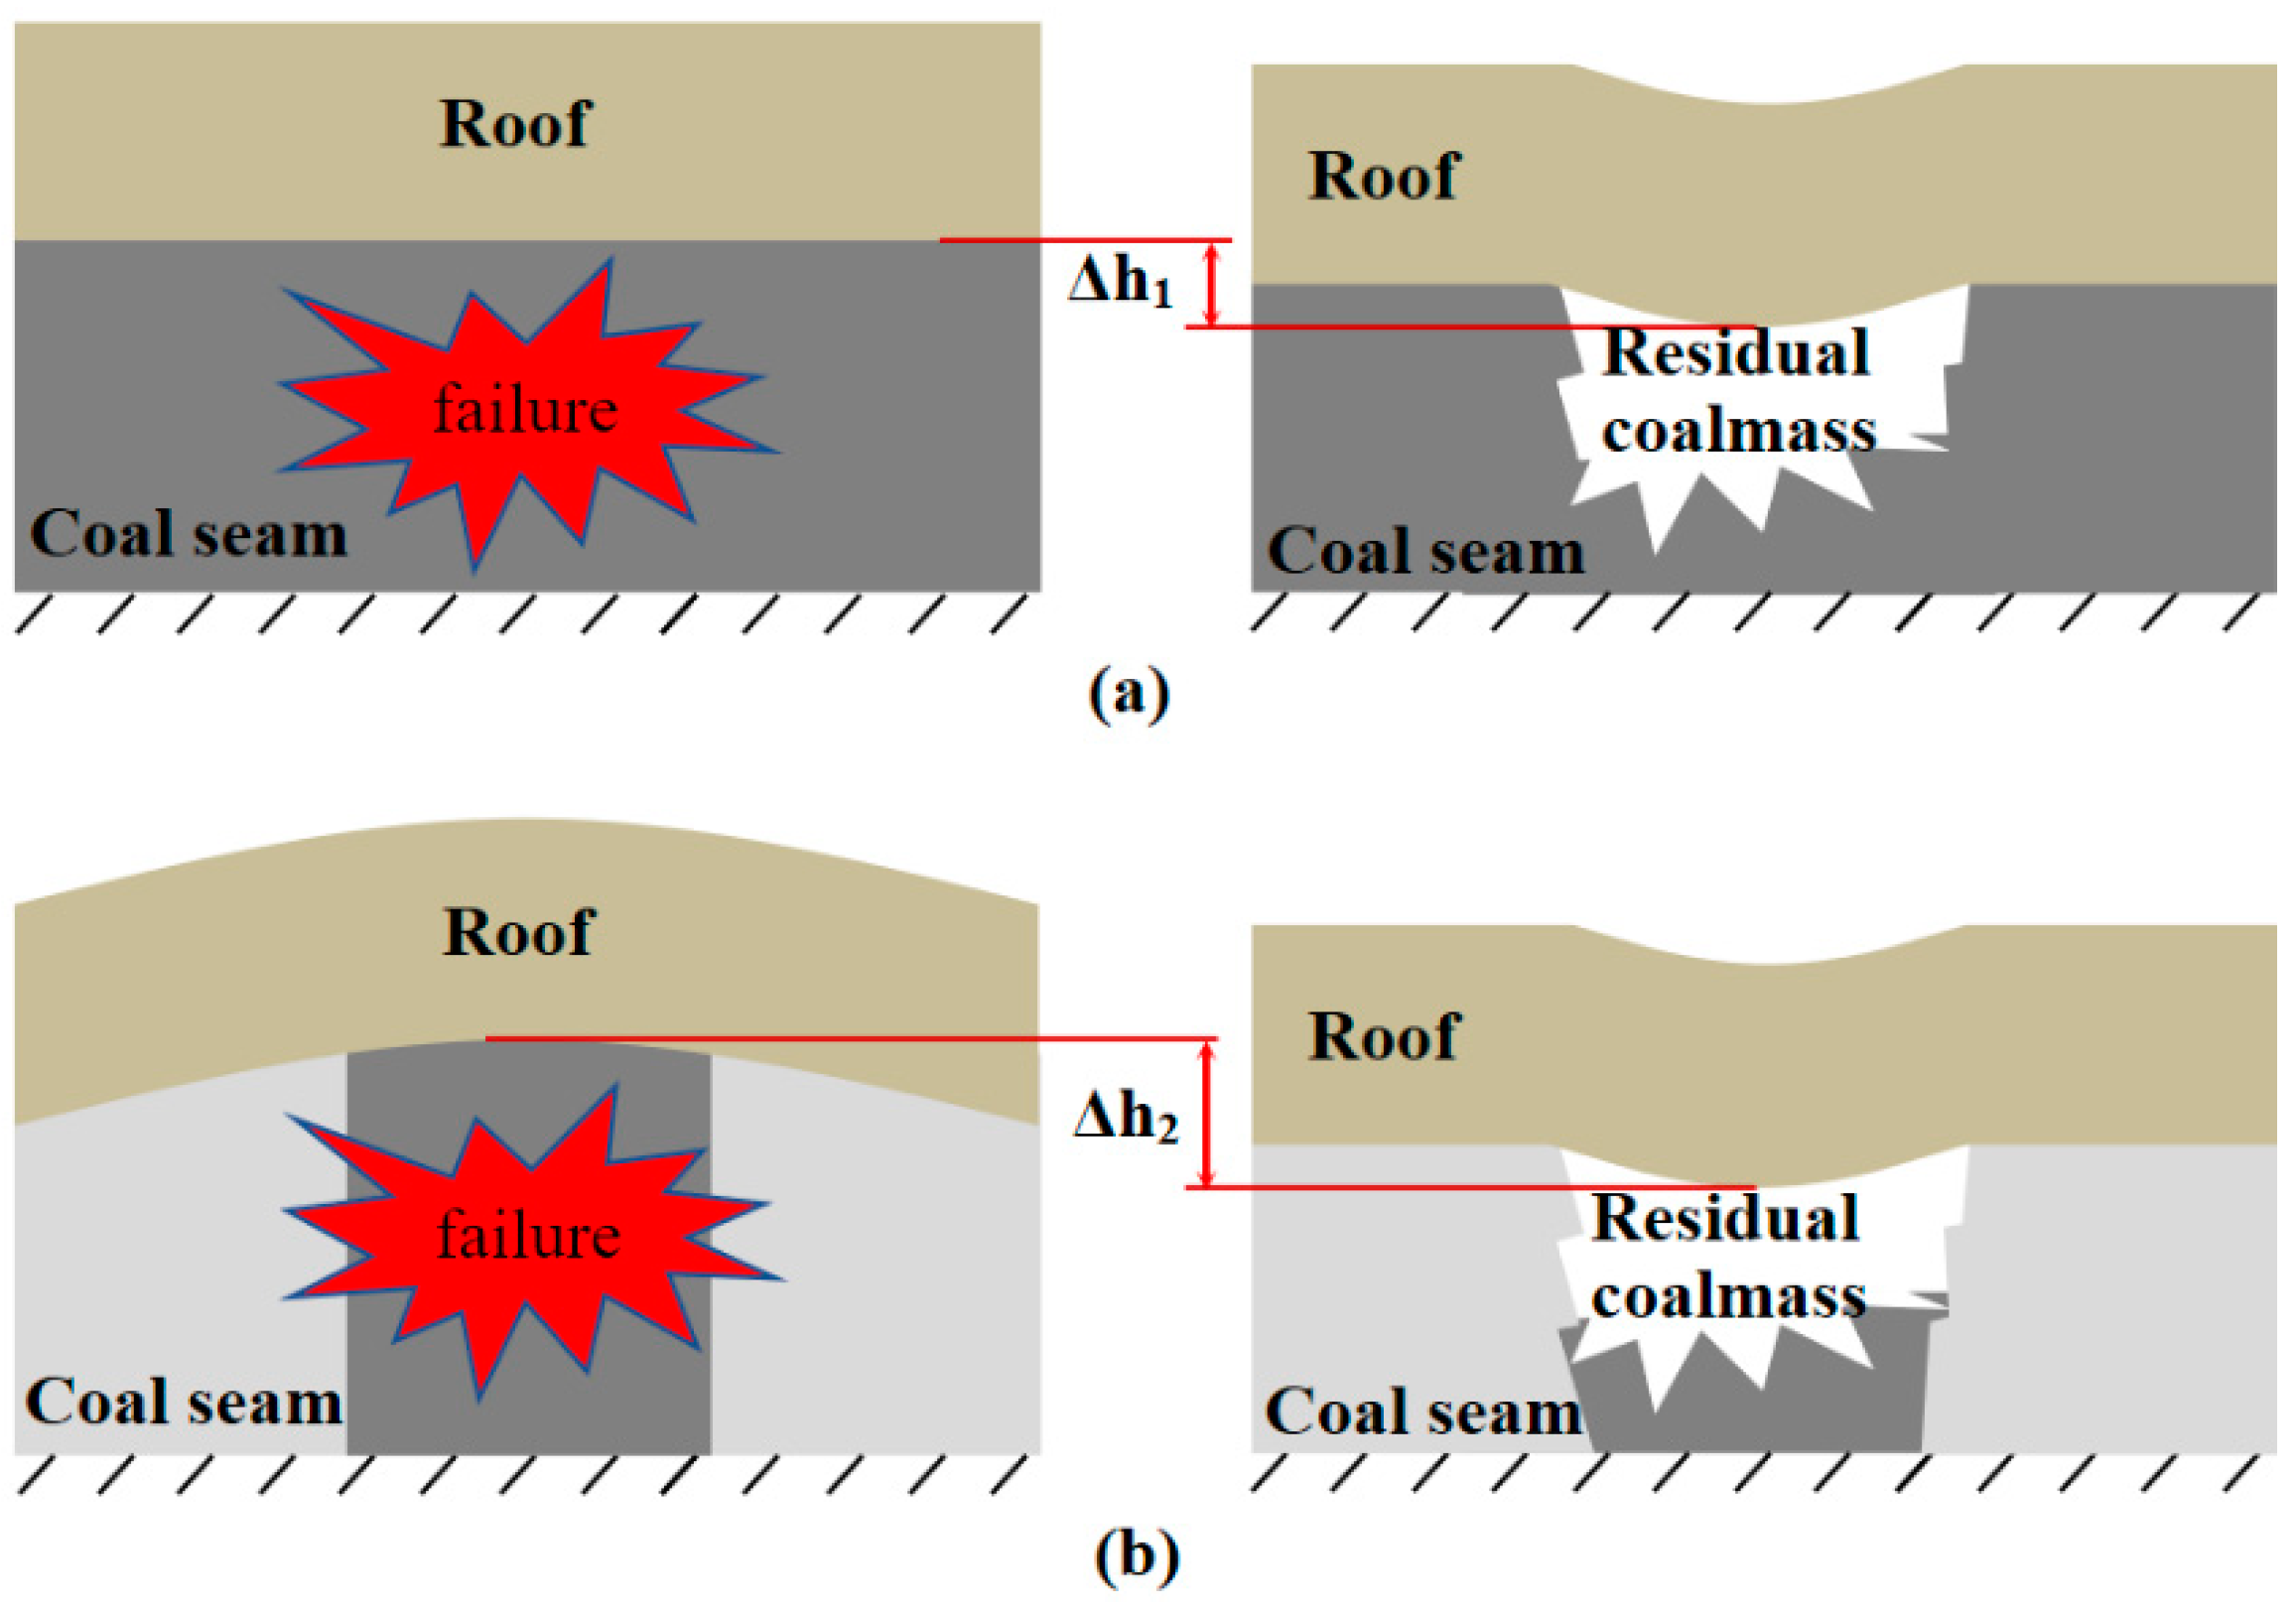
Based on the cusp-type catastrophe theory, Pan Y.S. [18] highlighted that the occurrence of coal bumps is contingent upon the roof experiencing a sudden jump subsidence characterized by an adequate amplitude. The roof above the damaged coal mass is expected to sink, but the presence of surrounding undamaged coal mass provides some support and inhibits further subsidence. In Figure 11, it can be observed that roof in the HSZ of USCS exhibits an upper convex bending prior to the failure of the coal mass, and the subsidence of the roof after failure (ΔH2) is considerably greater than that of the ESBS (ΔH1). Based on Pan Y.S.’s viewpoint, it can be inferred that coal mass fails in the HSZ of USCS is more likely to result in coal bump than ESCS.
According to Cook’s findings, rock bursts often occur due to the violent failure of columnar rock units that are relatively isolated [10]. These “relatively isolated columnar rock units” mentioned by Cook, similar to the “mine pillars” in Blake’s description of stiffness theory [12], were previously understood by most researchers as coal pillar. However, these terms can also encompass columnar coal units with high stiffness surrounded by a lower stiffness coal mass.
Consequently, when the high stiffness zone (HSZ) is enclosed by the low stiffness zone (LSZ) and form USCS together with continuous roof and floor, the contrasting stiffness levels result in disparate deformations and create the appearance of isolation in in mechanical behavior for the HSZ amidst the LSZ. Similar to load-bearing column, the HSZ plays a crucial role in supporting the roof within a broader range than its own cross-sectional area. Once the coal mass of HSZ fails, it triggers significant stress adjustments and configuration changes within the coal mass-surrounding rock system, which may cause the significant sudden subsidence of the roof proposed by Pan Y.S. [18], and ultimately leading to coal bumps.
From an energy perspective, when the ESBS coal mass undergoes failure, the energy released by the surrounding rock is the elastic deformation energy accumulated by its mutual compression with the coal mass; Under the same conditions, when the coal mass in the HSZ of USCS fails, the surrounding rock not only releases the same amplitude of elastic deformation energy, but also additionally releases the bending deformation energy of the roof and floors. Therefore, the failure of coal in the HSZ of USCS is more likely to meet energy criterion, and according to energy theory, it also has a higher risk of coal bump.
Several scholars have emphasized the significant role of accumulating and releasing bending deformation energy in promoting coal bump incidents [3,4]. Nevertheless, it is challenging for the uniformly stiff roof above a coal seam to undergo bending. Consequently, a sufficient span of hanging roof is required in the goaf to amass an ample amount of bending deformation energy, often necessitating roof breakage to facilitate its release. In the primary roadway or excavation tunnels, the hanging roof span is typically below 10 meters. Although a thick and rigid roof can accumulate a substantial amount of bending deformation energy, it resists breakage. Conversely, a soft or thin roof can fracture but fails to accumulate enough bending deformation energy to cause a coal bump. Therefore, while the assertion that bending deformation is released through roof fracture, leading to coal bumps, can account for coal bumps near the mining face, goaf pillars, and similar areas, it struggles to explain coal bumps occurring in the main or excavation roadways located far from the working face and goaf.
The “11.3” coal bump incident in 2011, which took place in the lower roadway of the 2121221 excavation working face at Qianqiu Coal Mine in Yima, Henan, occurred at a distance exceeding 200m from the nearest goaf and more than 500m from the closest mining working face [35]. Similarly, in 2016, the “8.15” coal bump occurred in the centralized track roadway of the 35000 mining district at Liangbaosi Coal Mine in Shandong, with the epicenter being 379 meters away from the actively mined 35001 working face. Notably, coal bumps like the “6.5” incident in 2014, which transpired in the main transportation roadway at Mengcun Coal Mine in Shaanxi, and the “11.13” coal bump at the auxiliary transportation roadway of the first panel of Gaojiabao Coal Mine, occurred at the excavation roadway. These coal bump locations lacked sufficient span of suspended roof conditions, leading to limited accumulation of bending deformation energy on the roof. In areas with USCS, the uneven distribution of stiffness induces roof bending, allowing for the accumulation of bending deformation energy even in the absence of hanging roof conditions. When the coal mass in the HSZ experiences failure caused by the pressure concentration effect of USCS, the roof will restore its bending deformation and release energy without suffering from roof breakage. Therefore, the utilization of USCS provides distinct advantages in explaining coal bumps in significant or excavation tunnels that are located far from the mining face and goaf, compared to coal seams with uniform stiffness. In the previously mentioned instances of coal bumps, the lower roadway of the 21221 working face at Qianqiu Coal Mine, which experienced the coal bump, passed through the combined zone of 2-1 coal and 2-3 coal, where the coal seam thickness displayed significant variations [35]. Additionally, the coal bump site at Liangbaosi Coal Mine was characterized by the presence of a magmatic rock intrusion zone [35]. Based on previous analyses, all of these instances are classified as the HSZs of USCSs.
There are many possible structures in coal measure strata, and Qi Q.X. did not specify that there is only one type of structural factor, namely the stick-slip weak surface. As depicted in Figure 2, the occurrence of stick-slip leads to an increased steepness of the post-peak curve and an increase in the absolute value of |λb|, prompting the system to meet the stiffness criterion. Furthermore, the existence of weak surfaces diminishes the overall strength of the pressure bearer, further prompting the system to meet the failure criterion. Although the stick-slip weak surface structure and the uneven stiffness coal seam structure (USCS) promote the system’s failure and stiffness criteria in different ways, both structures present higher risks of failure and instability compared to conventional coal seams, thus increasing the likelihood of coal bumps. Therefore, it can be used as a new coal bump structural factor in addition to the stick-slip weak surface structure.

5.2. Artificial USCS and stiffness perspective

Two extreme cases, Model 9 and Model 10, were simulated in the simple simulation of USCSs. Model 9 features the LSZs composed of ideal coal seam with an extremely low elastic modulus (EL=0.1Pa). Model 10 represents the scenario of a coal pillar and goaf with a continuous roof, achieved by removing the LSZs within Model 9. Figure 12 portrays the calculation of Mises stress distribution and deformation for both models.
Based on the information provided by Figure 12 and Table 2, the simulation results of the two models demonstrate a high level of consistency. Substituting the goaf in Model 10 with an ideal coal seam with a normal stiffness coefficient (NSC) close to 0 in Model 9 leads to negligible changes in stress distribution and deformation. This indicates that considering the goaf as a coal seam with an extremely low NSC is justified. Consequently, the combination of the entity coal and goaf can be seen as an uneven stiffness coal seam that, when coupled with the roof and floor, forms a distinctive USCS known as artificial USCS. When USCS is present in the coal seam, the HSZ would bears a portion of the overlying load of the LSZ due to the pressure concentration function. The extent to which the HSZ shares the load depends on the stiffness contrast between the LSZ and the HSZ. A higher stiffness contrast means a greater proportion of the overlying load is borne by the HSZ. Similarly, mining and tunnelling in the coal seam while maintaining continuous roof and floor leads to the reduction of normal stiffness and the formation of artificial USCS. The NSC of the excavated areas such as goafs and roadways in the coal seam reduces to 0, creating artificial LSZ. Conversely, the areas that haven’t been excavated, such as entity coal and coal pillars, become relatively stiffer HSZs due to the retained original NSC. The stiffness contrast between the goaf and coal pillar is extremely significant, resulting in the HSZ of artificial USCS bearing almost the entire overlying load.
From a stiffness perspective, the process of mining, excavation, slotting, drilling, failure and fracture development in coal seams can be seen as a process of reducing stiffness and then adjusting related parameters of existing USCS or creating new USCS. In this context, entity coal, coal pillars, and affected areas of remnant pillars represent the HSZs of artificial USCS. Conversely, the goaf, roadway, and affected areas of protective layer represent the artificial LSZs. Similarly, the HSZs of natural USCSs, such as thinning zones, bifurcating areas, and magmatic intrusion areas, can be regarded as coal pillars or isolated islands hidden in coal seam. Despite their apparent differences, both artificial and natural USCSs pose greater risks of failure and instability compared to conventional coal seams. This perspective provides a novel approach to understanding various engineering phenomena associated with coal bump. By applying stiffness theory and the relevant findings of USCS, valuable insights can be obtained, further elucidating these phenomena.
The entity coal preceding the mining face and the goaf situated behind it collectively constitute a variable stiffness coal seam, and form an artificial USCS under the condition of continuous roof and floor. As the mining face progresses, the area (SL) of the artificial LSZ (goaf) gradually increases until the bending moment of the roof exceeds its bending limit, resulting in roof fracture and a sudden decrease in SL. Simulation results demonstrate that these periodic changes in SL lead to corresponding fluctuations in the normal stress of the coal seam and the risk of coal bump (rCB) within the HSZ (entity coal), referred to as periodic pressure.
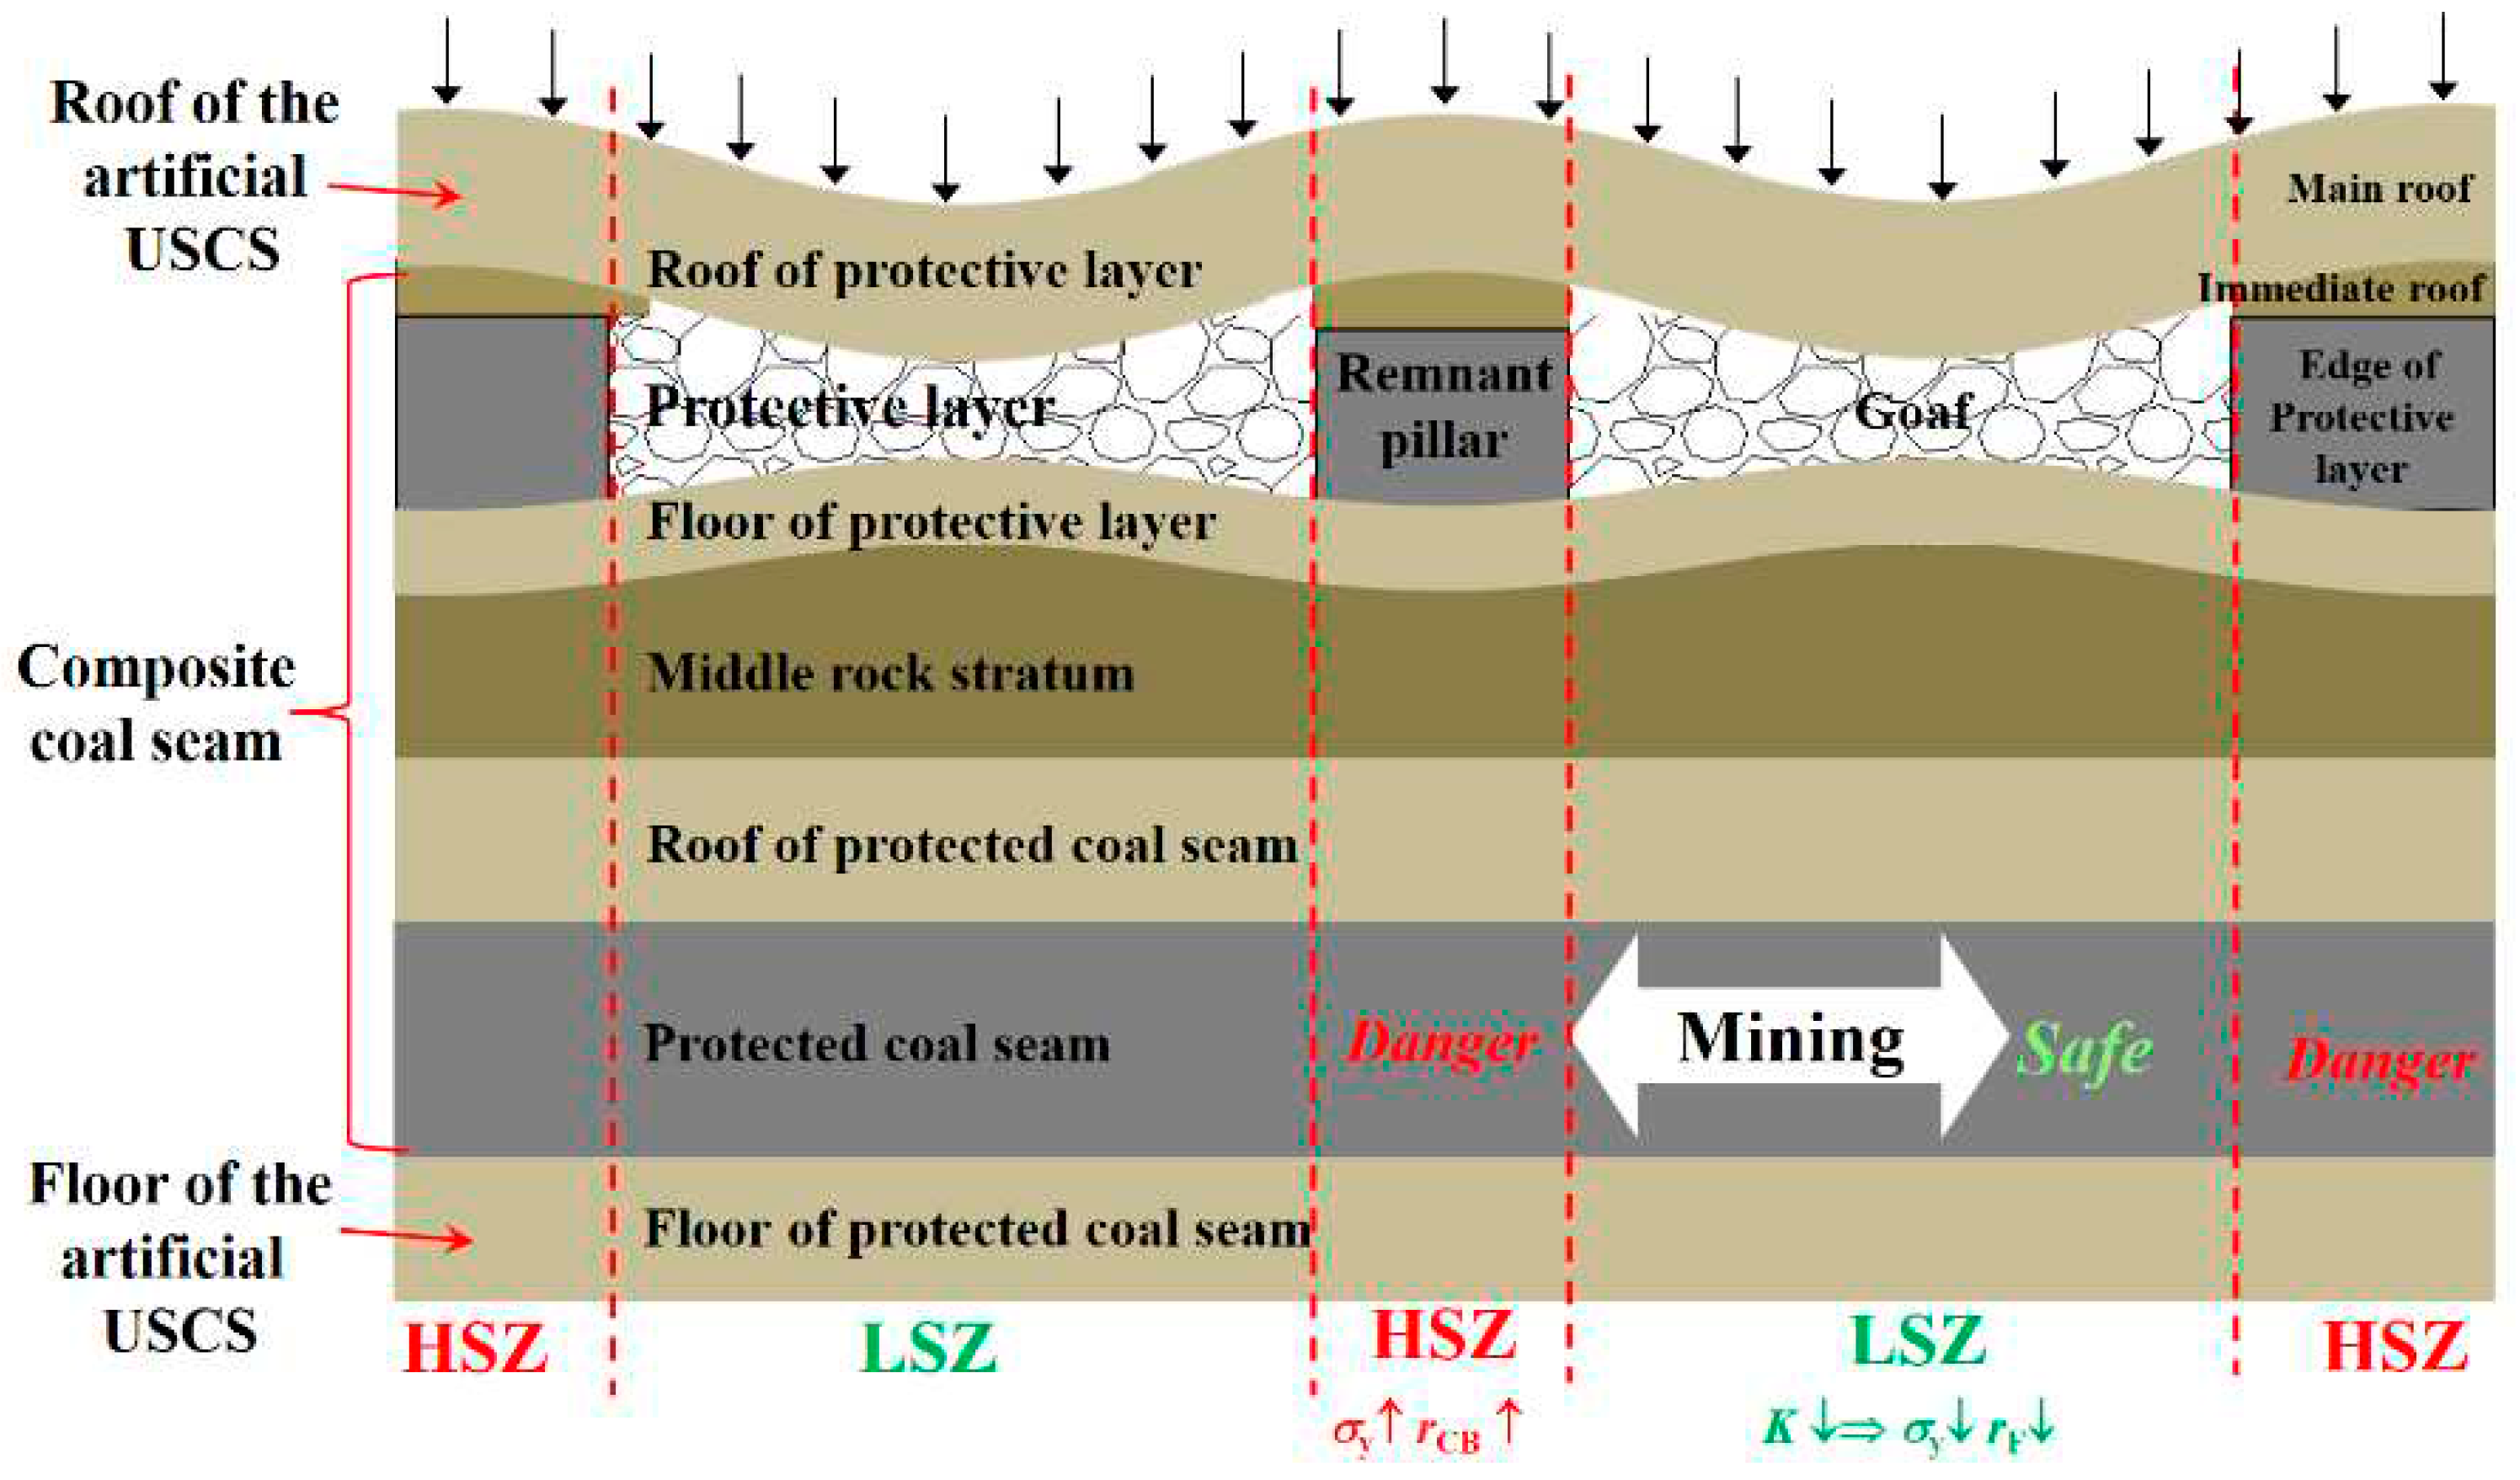
By mining the protective layers, the stress level exerted on the coal seam can be reduced, effectively mitigating the risk of coal bump. From a stiffness perspective, the combined presence of the protective layer, the protected coal seam, and the intermediate rock layers forms a composite coal seam with an uneven distribution of stiffness. The roof of the upper protective layer, the floor of the protected coal seam, and the composite coal seam, characterized by varying stiffness, collectively create an artificial USCS, as depicted in Figure 13. Drawing upon previous theoretical analysis and simulation results regarding USCSs, it is evident that the artificial LSZs, encompassing the affected areas of the protective layer, exhibit comparatively lower stress levels and a reduced risk of coal bump within the protected coal seam. In contrast, the artificial HSZs, including the affected areas surrounding the remnant coal pillar and the boundary of the protective layer, experience relatively higher stress levels and an increased risk of coal bump.
The goaf area surrounding isolated island working faces is larger compared to that of straight mining faces, indicating a higher SL value in the artificial USCS formed by isolated island working faces. According to relevant USCS findings, the SL positively correlates with the normal stress (σyH) in the HSZ, but negatively correlates with normal stiffness coefficient (KpH) of surrounding rock in the HSZ. This higher SL value is likely the main contributor to the increased stress level and risk of coal bump in isolated island working faces when compared to straight mining faces.
The majority of technical measures implemented to prevent and control coal bump or relieve pressure can be viewed as strategies for adjusting key parameters of the USCSs existing in coal measure strata. Measures such as coal seam slotting, blasting, water injection softening, large diameter drilling, and high pressure water jet cutting are capable of reducing the normal stiffness coefficient (KH) in the HSZ. Conversely, actions such as grouting, goaf filling, and providing hydraulic supports, single props, anchor bolts can increase the normal stiffness coefficient (KL) in the LSZ. For a specific rock stratum in the roof, roof cutting measures like directional hydraulic fracturing and deep hole blasting can decrease the area (SR) of continuous roof and area (SL) in the LSZ. In practice, the roof and floor consist of multiple rock strata, making it challenging to carry out roof cutting measures for each individual layer in a multi-layered roof. Therefore, selecting a rock stratum with greater thickness or higher elastic modulus for fracturing or blasting among the various layers, instead of choosing randomly, can effectively reduce the thickness (HR) or elastic modulus (ER) of the continuous composite roof. The essence of these measures lies in reducing KH, SL (SR), HR, ER, or increasing KL, respectively. Simulation results in Table 2 demonstrate that adjusting these key parameters of USCS can decrease normal stress (σyH) of coal mass or increase normal stiffness coefficient (KpH) of the surrounding rock in the HSZ, thereby achieving pressure relief and preventing coal bump.
Furthermore, the proximity of the roof cutting position to the HSZ-LSZ boundary plays a crucial role. The closer the position is to this boundary, the smaller the SL (SR), resulting in an enhanced pressure relief and coal bump prevention effect. Therefore, when selecting the roof cutting position, accurately determining the boundary between the LSZ and HSZ within the coal seam and identifying the specific stratum with a thicker or higher elastic modulus among the overlying rock layers is essential.
In the mechanism analysis and simplified simulation, six key parameters of USCS are involved, namely, thickness (HR) of roof, elastic modulus (ER) of roof, NSC of HSZ (KH), NSC of LSZ (KL), area (SH) of HSZ, and area (SL) of LSZ, when SH remains constant, The change in SL can be equivalent to the change in area (SR) of roof. These parameters can have either positive or negative effects on the pressure concentration function and stiffness reduction function of the USCS, thereby influencing the risk of failure, instability, and coal bump of the HSZ. By considering mining, fracturing, blasting, drilling, and slot cutting as a reduction in stiffness of coal seam, and considering support and backfilling as an increase in stiffness of coal seam, and treating goaf or roadway as an LSZ of the artificial USCS, it is possible to reconsider past engineering experience and summarize the impact of these six key parameters on indicators related to impact risk. Table 3 presents the correlations between the six key parameters and risk indicators of coal bump, which are derived from the analysis results, simulation results, and engineering experience.
From Table 3, it can be seen that:
1) When ER, HR, KH, and SL increase, or KL and SH decrease, the pressure concentration function of the USCS becomes stronger, resulting in a higher concentration of stress and an increased risk (rF) of failure in the HSZ. Conversely, when HR, KH, SL, and SH increase, or ER and KL decrease, the stiffness reduction function of the USCS becomes stronger, leading to lower surrounding rock stiffness and an increased risk (rI) of instability in the HSZ.
2) The analysis results and simulation results are in agreement with engineering experience in many cases, affirming the suitability of utilizing uneven stiffness coal seam structure for investigating coal bump phenomena.
3) To effectively mitigate the risk of coal bump in the HSZ, it is crucial to reduce KH, SL (SR), or increase KL of USCS. This approach simultaneously decreases the likelihood of failure and instability. Currently, the majority of coal bump prevention measures aim to achieve pressure relief and coal bump prevention by modifying these three key parameters.
Based on the findings presented in Tables 3, when dealing with isolated island working faces, reducing SL and SR can be achieved through roof fracturing or blasting, while KH can be minimized through slot cutting, large-diameter drilling, and coal seam blasting. Additionally, a viable approach to reduce the risk of coal bump in isolated working faces involves implementing goaf backfilling during the extraction of adjacent working faces around the perimeter. This method can increases KL, then mitigating the risk of coal bump.
Additionally, the artificial USCS can undergo movement during the mining process. When mining or excavation activities take place near existing USCS, it leads to the dynamic superposition of two USCSs. This becomes particularly problematic when the HSZs of these two USCSs coincide, intensifying stress concentration and stiffness reduction, and thus escalating the risk of coal bump. Importantly, many coal bump occurrences happen when the working face advances through the HSZs of fixed USCSs, such as thinning zones, bifurcation areas, magmatic rock intrusion areas, or areas affected by remnant pillars. It is at the intersection of these HSZs where the failure and stiffness criteria are met, triggering coal bump incidents.

6. New Explanation of Engineering Phenomena Based on USCS

6.1. New Explanation of the Time-delayed of Partial Coal bumps

Certain coal bump accidents exhibit an unconventional characteristic known as the time-delayed property [37]. These coal bumps occur after a certain lag time following excavation disturbance. For instance, during the “11.3” coal bump incident at the 2121221 working face of Qianqiu Coal Mine, Yima in 2011, the location of the coal bump lagged behind the heading face of the excavation roadway by a distance ranging from 65 to 425 meters [35]. Similarly, in 2017, the “2.3” coal bump transpired on the main roadway of Gaojiabao Coal Mine in Shaanxi during the mine’s shutdown period for the Spring Festival [37]. It is possible that the coal bump resulted from mining disturbance prior to the shutdown period and only manifested during the Spring Festival shutdown period.
Excavation and unloading operations induce stress redistribution in the surrounding rock mass of roadways, leading to localized fracture aeras known as loose rings, which consist of annular zones of broken rock distributed around the roadway [38]. The unloading effects of a developing loose ring can cause damage to the outer layer of coal and rock mass, gradually expanding the loose ring layer by layer. However, once the stable equilibrium of the surrounding rock is restored, the developed loose ring ceases to grow further. It is important to note that although the fractures resulting from the developing loose ring possess some elements of spontaneous and time-delayed characteristics, their weak burst intensity renders them incapable of causing coal bumps. Therefore, relying solely on the presence of a developing loose ring is insufficient to explain the time-delayed property of coal bumps. It is necessary to consider other factors, such as USCS, in conjunction with the loose ring phenomenon.
Based on the preceding analysis of USCS, it can be concluded that, along with increasing the static or dynamic load on the coal mass, the enhancement of the value of ER HRKHSL/KLSH can also meet the failure criterion in the HSZ of USCS. From a stiffness standpoint, the primary objective of loose ring development is to reduce the NSC of coal seams. If the development of the loose ring occurs in the LSZ of USCS, the reduction in NSC can lead to a higher stress concentration in the coal mass and a lower stiffness of the surrounding rock in the HSZ, which promotes the satisfaction of failure criterion and instability criterion.
When mining operations cause the stress on the coal mass in the HSZ of an existing USCS to approach the critical failure value, the development of loose ring in the LSZ can increase the normal stress in the HSZ, resulting in failure, even in the absence of excavation disturbance or external dynamic load disturbance. If the stiffness reduction function of USCS make system satisfies the stiffness criterion, the failure caused by the development of loose ring will trigger post-peak instability of the system, even leading to a coal bump. Dynamic loads or excavation disturbances are direct and easily detectable, while the development of the loose ring is gradual and challenging to detect. Consequently, a coal bump caused by loose ring development exhibits a time-delayed or spontaneous property (without a specific disturbance source). The entire process of the loose ring, from initiation to stability, can range from as short as 3-7 days to as long as 1-3 months [38]. For coal bumps with a lag time of less than 3 months, the combination of the loose ring and USCS provides a suitable explanation.
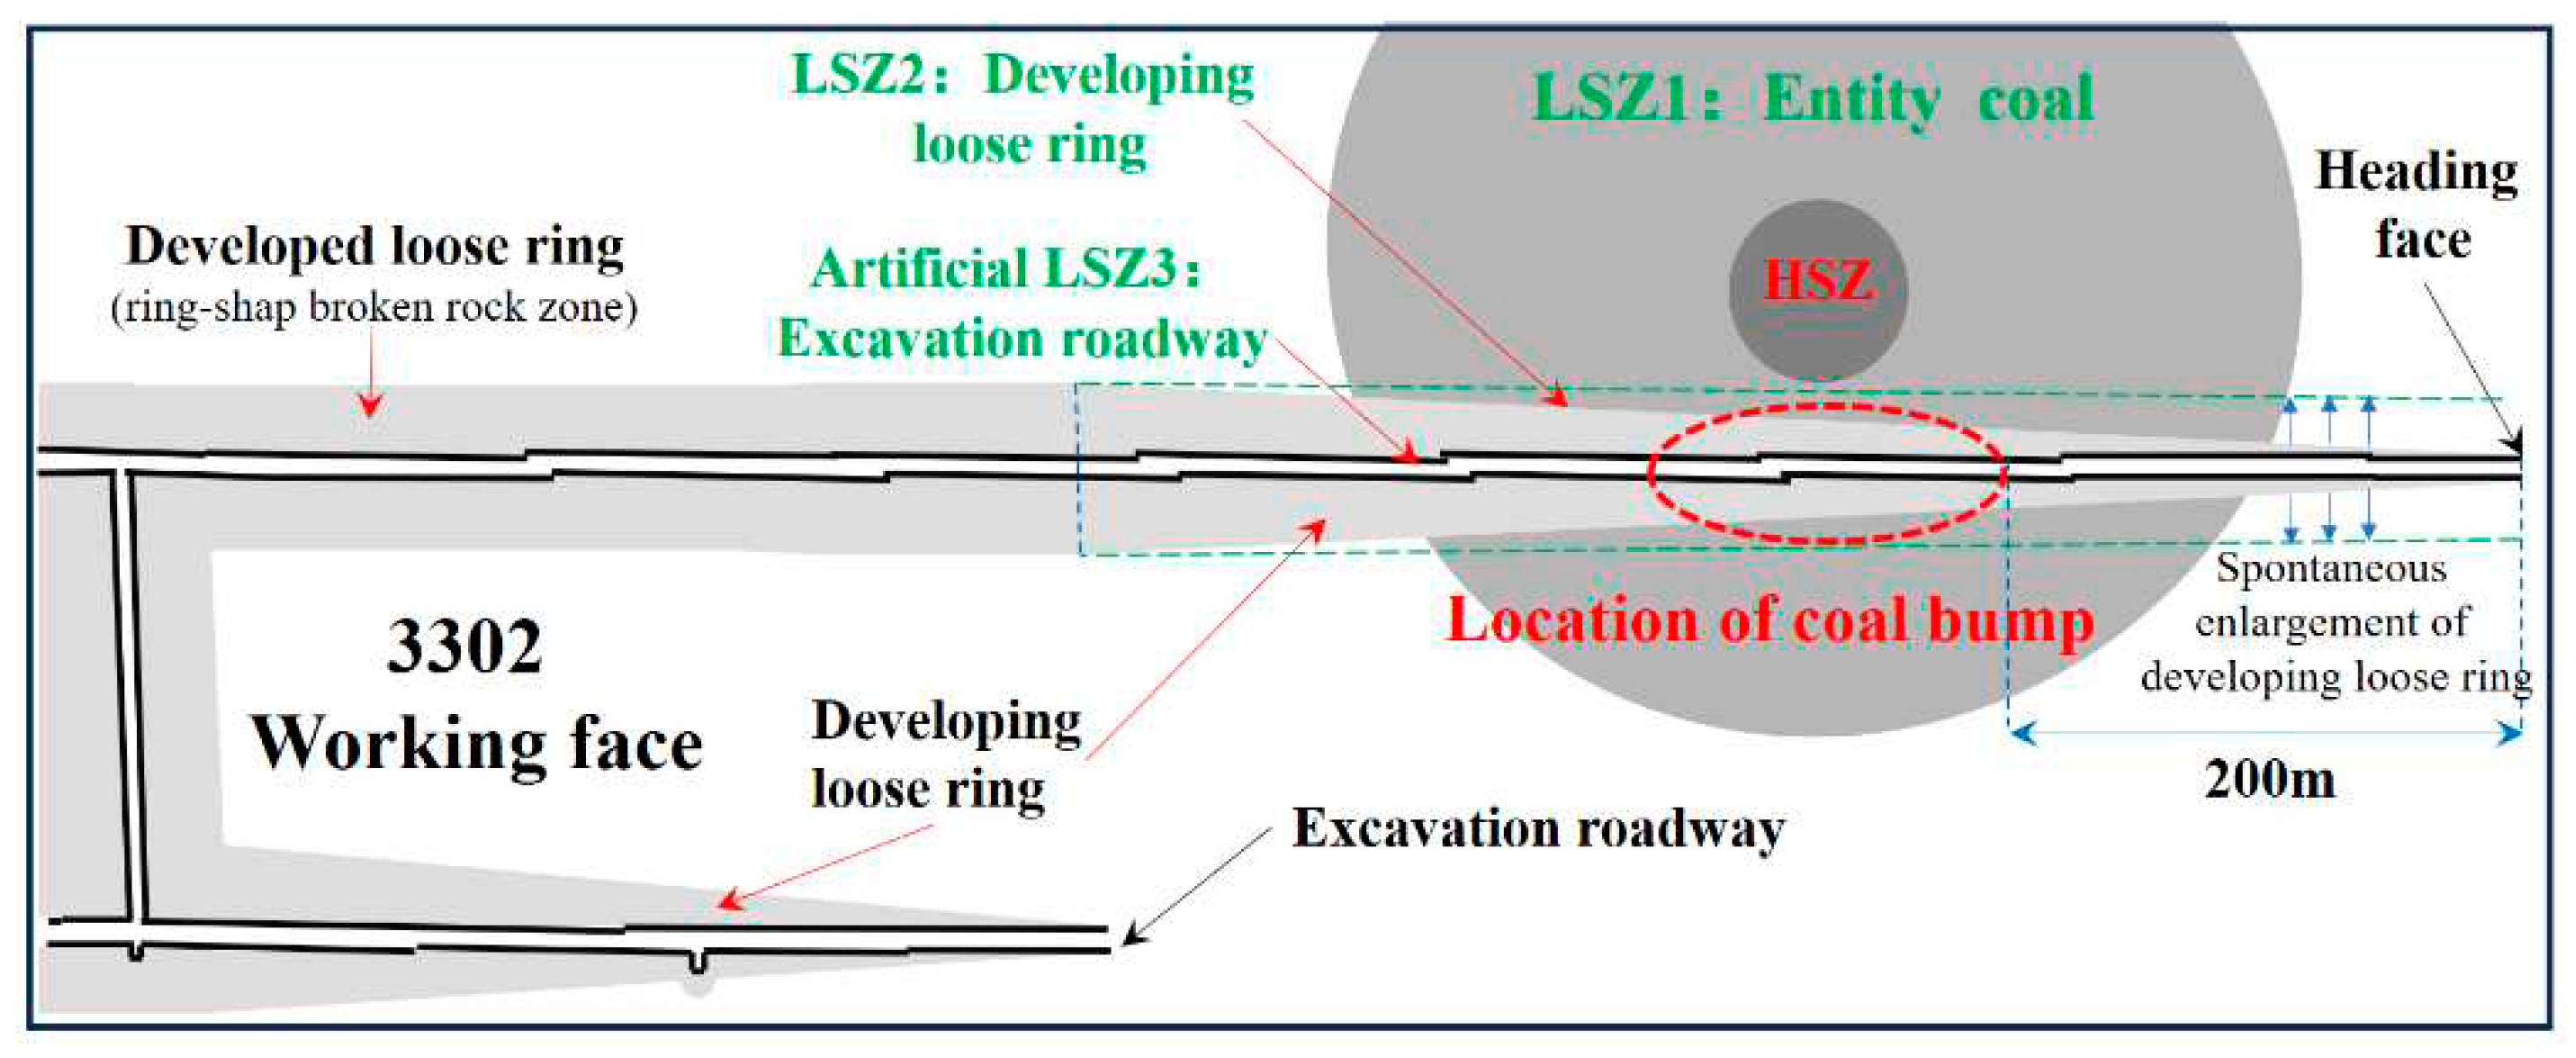
In 2013, the “8.5” coal bump in the upper roadway of the 3302 excavation working face at Shandong Xingcun Coal Mine. The location of the coal bump was approximately 200m away from the excavation heading face, surpassing the disturbance range of the excavation. Since 3302 working face was the first mining face, there were no other sources of disturbance in its vicinity. From a stiffness perspective, it is plausible that the coal seam near the location of the coal bump exhibited relatively higher NSC. Together with the surrounding coal seam, roof, and floor, this formed an USCS. The excavation in the LSZ resulted in an increased stiffness discrepancy between the HSZ and the LSZ. As depicted in Figure 14, following the excavation of the roadway, the LSZ of the USCS can be divided into three sections: the entity coal section with a lower NSC, the loose ring, and the roadway. The artificial LSZ, represented by the roadway, has an NSC close to zero, thereby reducing the average NSC in the LSZ and elevating the stress levels in the HSZ to a state close to critical. As the excavation advanced 200m away, the impact of mining disturbance became negligible. Concurrently, the ongoing development of the loose ring around the newly excavated roadway led to a persistent reduction in the KL and a subsequent rise in stress within the coal mass situated in the HSZ. As a result, the stress concentration within the HSZ continued to escalate, eventually surpassing the critical threshold. Subsequently, this resulted in failure of the coal mass in the HSZ and triggered the occurrence of the coal bump.

6.2. New explanation of the inefficient pressure relief in ultra thick coal seam

From April to May 2014, continuous roof caving with strong burst intensity occurred at the heading face of a excavation roadway in China Xinjiang’s Liuhuanggou Coal Mine [39]. The coal seam in close proximity to the incident site can be categorized as an ultra thick coal seam, given its substantial thickness of 36m. To mitigate the issue, extensive large-diameter pressure release drilling operations, with a depth of 25m and a diameter of 120-150mm, were conducted the front and both sides of the heading face. Regrettably, the desired pressure relief outcomes were not achieved. Consequently, adjustments were made to the initial plan, wherein a fan-shaped arrangement of 15 to 20 boreholes was implemented at the front to enhance compaction. Nonetheless, the mine pressure behavior was still strong during the excavation. Subsequently, a revised construction plan was devised and depicted in Figure 15 [39]. This revised approach involved the addition of two inclined pressure relief drillings, facing upwards and downwards respectively, resulting in effective control of the roof caving disaster.
From a stiffness standpoint, the strong mine pressure behavior observed at the heading face can potentially be attributed to the relatively high local stiffness of the coal seam in close proximity to the heading face. This creates an USCS in conjunction with the surrounding coal seam with lower stiffness, as well as the roof and floors. The USCS, through its pressure concentration function, leads to stress concentration in the HSZ ahead of the heading face. Additionally, the stiffness reduction function of the USCS further amplifies the burst intensity of localized failure and triggers impactful roof caving incidents.
The utilization of large-diameter pressure release drilling within the HSZ can induce modifications in the deformation characteristics of the coal mass within a specific range surrounding the borehole. This leads to a reduction in the average elastic modulus of the modified area, encompassing both the borehole and the adjacent fracture region. The creation of such a modified area within the HSZ plays a crucial role in diminishing the KH value, subsequently lowering the stress level and mitigating the risk of coal bumps. This favorable outcome is evident in Table 2 and Table 3, reaffirming the achievement of pressure relief and coal bump prevention objectives. It is worth noting that a thicker modified area or a greater decrease in the average elastic modulus corresponds to a proportionally larger relative decrease in KH, indicating a more effective pressure relief of the large-diameter pressure release drilling technique. The relative decrease in KH can be determined using Equation (16).
Δ K H K H 0 = K H 0 K H 1 K H 0 = ( E H 0 H c ( E H 0 H c h d E H 1 h d ) / ( E H 0 H c h d + E H 1 h d ) ) / E H 0 H c = E H 0 H c E H 0 E H 1 ( H c h d ) E H 1 + h d E H 0 E H 0 / H c = ( h d H c ( E H 0 E H 1 1 ) ) / ( h d H c ( E H 0 E H 1 1 ) + 1 ) = ( E H 0 E H 1 1 ) / ( E H 0 E H 1 1 + H c h d )
Where, KH0 is the initial normal stiffness coefficient (NSC) of the coal seam within the HSZ prior to drilling, KH1 is the NSC subsequent to drilling. Hc is the thickness of the coal seam, EH0 is the elastic modulus of the coal. hd is the thickness of the modified area generated by drilling, EH0 is its average elastic modulus.
The level of stress concentration in the HSZ exhibits a positive correlation with the KH value, so the effectiveness of pressure relief is positively correlated with the relative decrease in KH. By examining Equation (18), it becomes evident that the pressure relief effect achieved through large-diameter drilling technique displays a negative correlation with the thickness of the coal seam, but presents a positive correlation with the thickness (hd) of the modified area formed subsequent to drilling. Consequently, under similar conditions, thicker coal seams yield a less favorable pressure relief effect when implementing large-diameter drilling. Zhang D.X. et al. [40] conducted a numerical simulation study to analyze the influence of coal seam thickness on the pressure relief effect of large-diameter drilling. Their findings affirmed that, with identical pressure relief drilling parameters, thin coal seams offer superior pressure relief effects compared to thick coal seams. These research results align consistently with Equation (18).
The inefficient pressure relief observed in ultra thick coal seams as the Liuhuanggou Coal Mine is primarily attributed to the reduction in pressure relief effect resulting from the significant thickness. While dense construction fan-shaped drilling can extend the pressure relief range, the increase in hd (thickness of the low stiffness portion) is limited, leading to suboptimal pressure relief effects. Based on equation (16), it becomes apparent that increasing hd is necessary to enhance the pressure relief effect for ultra thick coal seams. Expanding the drilling diameter or increasing the number of boreholes in the normal direction can accomplish this, but in engineering practice, the latter is typically more feasible. The final adjusted pressure relief plan, as illustrated in Figure 15, involves achieving effective pressure relief for the ultra thick coal seam by adding boreholes in the normal direction.

6.3. New Explanation of the “Microseism Deficiency” Phenomenon Before Coal bump

During microseismic monitoring of the mining face, occasional observations of a phenomenon known as “microseism deficiency” have been made. This phenomenon signifies a significant decrease in both the frequency and energy of microseismic events during specific time periods or in certain areas [41,42]. The occurrence of a “microseism deficiency” phenomenon often indicates a high probability of coal bump, strong mine pressure behavior, or the emergence of high-energy microseismic events. For instance, in 2006, when the 1410 working face of Shandong Huafeng Coal Mine approached a remnant coal pillar in the lower protective layer, the extension of the microseismic event distribution area did not proceed as usual with the advancement of the working face. Instead, it was halted at a distance of 50m ahead of the remnant pillar, resulting in a continuous reduction in the advancement fracture area. Then a coal bump occurred, characterized by an energy release of 2.2×10⁷J, once the working face exceeded the coal pillar [43]. Similarly, during a 5-day period from October 4th to 8th, 2011, the frequency and energy of microseismic events in the 8935 fully mechanized caving working face of Yao Coal Mine in Xinzhou remained consistently lower than the average. Subsequently, on October 9th, a coal bump occurred, releasing an energy of 5.9×10⁵J [41]. In another case, the 31103 working face of Bayangaole Coal Mine in Inner Mongolia experienced a “microseism deficiency” period lasting 2-3 days during monitoring before and after September 20th, 2017. This was followed by a high-energy microseismic event with an energy release of 1.1×10⁵J in the middle of the working face on the 22nd, which fortunately did not cause serious damages due to its distance from the roadway [42]. Consequently, scholars have widely acknowledged the “microseism deficiency” phenomenon as a precursor feature of coal bump [41,42].
When the normal stress surpasses a specific critical threshold, weak sections within the coal mass undergo damage and subsequently release energy. If this released energy exceeds the threshold of the microseismic monitoring system, a microseismic event occurs. Generally, as stress levels increase, higher frequencies and energy levels of microseismic events are observed. Conversely, when the stress remains below the critical threshold, the coal sections encounter difficulties in releasing enough energy to reach the microseismic monitoring system’s threshold. Consequently, the monitoring results indicate a scarcity of microseismic events.
As illustrated by the yellow line in Figure 16, the mining stress field undergoes movement as the working face progresses. Each point within the coal mass ahead of the working face typically undergoes a process wherein the normal stress gradually increases from the average pressure (P) to the peak value (σymax), followed by a rapid decrease below P. Therefore, in the absence of notable variations across different positions within the coal mass, the microseismic events in the monitoring results should exhibit an even distribution. The occurrence of the “microseism deficiency” phenomenon indicates notable disparities among various positions within the coal seams.
In Figure 16, it is shown that if a fixed USCS is present within the entity coal ahead of the mining face, the artificial USCS generated due to mining operations will overlay with the fixed USCS to varying extents at different positions as the working face progresses. The superposition of two USCSs does not augment the total load, but rather redistributes stress, resulting in an increase of mining stress in the HSZ and a decrease in the LSZ. Simulation results indicate a positive correlation between the normal stress (σyL) in the LSZ and the value of KLSL/ERHRKHSH. Moreover, the closer a position in the LSZ is to the HSZ-LSZ boundary, the greater the reduction in stress relative to the average pressure (P). If the fixed USCS has a sufficiently small KLSL/ERHRKHSH value, a specific zone near the HSZ-LSZ boundary in the LSZ may witness a significant reduction in normal stress, effectively preventing the actual stress after redistribution from reaching the critical threshold, even when the mining stress peaks in that zone. Prior to the overall failure occurring in the HSZ, the frequency and energy of microseismic events within this specific zone will be notably lower than in conventional scenarios, leading to the designation of this zone as a “microseism deficiency” zone. As the working face progresses, there will be a “microseism deficiency” period when the high-stress section of the mining stress field traverses through this zone.
From an energy perspective, the HSZ of USCS acts as an energy storage device during the “microseism deficiency” period: the energy that should have been released by microseismic events under normal circumstances will be converted into compressive deformation energy of coal mass in the HSZ. Considering the proximity of the “microseism deficiency” zone near the HSZ-LSZ boundary, the high-stress section of the mining stress field enters the HSZ of USCS after passing through this zone. As a result, there is a significant increase in the actual stress, which makes the HSZ highly vulnerable to potential damage. The compressive deformation energy stored in the HSZ during the “microseism deficiency” period will be released together with the bending potential energy of the roof, and its burst intensity will significantly exceed the failure of other parts in the entity coal. The energy of corresponding microseismic events will also be significantly higher than that of other microseismic events. If the HSZ of USCS is damaged when it is close to the mining space, it is likely to cause coal bump.
Figure 17 illustrates the distribution of microseismic events prior to and following the “9.9” impact that occurred in the 1410 working face of Huafeng Coal Mine in 2006 [43]. The composite coal seam, comprising the No.14 coal seam, the mined No.16 coal seam, and their intermediary rock strata, exhibits an uneven normal stiffness. Consequently, the composite coal seam, along with the roof of the No.14 coal seam and the floor of the No.16 coal seam, constitutes a fixed artificial USCS. The majority of the 1410 working face falls within the LSZ, resulting in reduced stress and reduced risk (rCB) of coal bump. However, the affected region of the underlying remaining pillar represents a HSZ, which escalates stress levels and increases the rCB. Based on the analysis, the HSZ gives rise to the creation of a “microseism deficiency” zone with a width of approximately 50 meters surrounding the remnant coal pillar. Consequently, the advancement of the 1410 working face in proximity to the remnant coal pillar leads to the occurrence of the “microseism deficiency” phenomenon, as depicted in Figure 17.

7. Conclusions

(1) The coal mass-surrounding rock system that meets the stiffness criterion will only lose stability after reaching the peak load. Therefore, the necessary condition for coal bump based on the stiffness theory include both failure criterion and stiffness criterion. The strength and stress of the material contribute to the challenge of satisfying the failure criterion, thereby influencing the risk (rF) of failure. The stiffness of the surrounding rock affects the ability to meet the stiffness criterion, consequently influencing the risk (rI) of instability. The risk (rCB) of coal bump is determined by multiplying rF and rI.
(2) The Uneven Stiffness Coal seam Structure (USCS) is a structural factor prone to coal bump proposed based on stiffness theory and the “three factor” mechanism. It comprises an uneven stiffness coal seam, along with continuous roof and floor, and serves two functions: the pressure concentration function and the stiffness reduction function. The former promote the convergence of normal stress from the low stiffness zone (LSZ) of coal seam to the high stiffness zone (HSZ), thus raising the risk (rF) of failure. The latter decreases the stiffness of the surrounding rock during the coal failure process, enabling the system to meet the stiffness criterion even with a hard roof, thus reconciling the contrast between the stiffness theory and engineering experience to some extent and increasing the risk (rI) of instability. Many areas prone to coal bumps, such as thinning zones, bifurcating areas, magmatic intrusion areas, and remnant pillar affected areas of coal seam, are the HSZs of USCSs.
(3) The simulation results indicate that the normal stress in the HSZ is positively correlated with the elastic modulus (ER) and thickness (HR) of the roof, the normal stiffness coefficient (KH) of the HSZ, and the area (SL) of the LSZ, while negatively correlated with the NSC (KL) of the LSZ and area (SH) of the HSZ; The stiffness of the surrounding rock in the HSZ is negatively correlated with the HR, KH, and SL, while it is positively correlated with the KL and the ER. These six key parameters of USCS influence both the normal stress of the coal mass and the surrounding rock’s stiffness, consequently affecting the risks of failure (rF), instability (rI), and coal bump (rCB) within the HSZ.
(4) Compared to failure in even stiffness coal seams, failure in the HSZs of USCSs results in a larger magnitude of sudden jump subsidence of the roof and release of bending deformation energy without roof breaking. In the roadway located far from the goaf, there are insufficient hanging roof conditions to cause roof breakage. Therefore, it is more appropriate to attribute coal bumps occurring in the main roadway or excavation roadway to the failure of coal mass in the HSZs.
(5) Applying USCS for practical engineering analysis often involves a shift in research perspectives. Fractures, failures, and voids in coal seams resulting from excavation, cutting, and drilling cause a reduction in coal seam stiffness and thus adjustments to existing USCS’s parameters or generating new USCS. The goaf and roadway can be seen as coal seam with zero stiffness or LSZs of artificial USCSs, while the thinning zones and magmatic intrusion areas can be seen as concealed coal pillars. It becomes very dangerous when the HSZ of an existing USCS coincides with the HSZ of an artificial USCS that advances with the working face. This coincidence intensifies stress concentration and stiffness reduction, significantly increasing the risk (rCB) of coal bump within the HSZ.
(6) Relevant USCS findings can offer fresh insights into some engineering phenomena associated with coal bump: A developing loose ring in the LSZ increases the normal stress of the coal seam in the HSZ, potentially leading to time-delayed coal bumps. The effect of pressure relief within the HSZ depends on the relative decrease in KH. Thicker coal seams may require larger borehole diameters or more boreholes to prevent inefficient pressure relief. Certain USCS can significantly reduce normal stress near the HSZ-LSZ boundary, thereby mitigating the frequency and energy of microseismic events within a specific range during mining operations.

Author Contributions

Conceptualization, T.T.; methodology, T.T., Z.D. and W.R.; formal analysis, T.T. and S.Z.; Investigation, T.T. and W.R.; writing-original draft preparation, T.T., Y.W., and Y.Z.; writing-review and editing, S.Z. and Z.D.; Visualization, T.T., W.R., and Y.W.; supervision, S.Z., Z.D. and W.L.; funding acquisition, T.T., Y.Z. and W.L.

Funding

This research was funded by Science and Technology Development Fund Project of China Coal Research Institute [grant No. 2021CX-II-11 & No.2022CX-I-04], Mechanism and prevention and control technology of mutual interference caused by combined mining in deep and complicated geological conditions. [grant No. SICGM202106].

Conflicts of Interest

The authors declare no conflict of interest.

References

  1. M. C., He; J.L., Miao; J.L., Feng. Rock burst process of limestone and its acoustic emission characteristics under true-triaxial unloading conditions. International Journal of Rock Mechanics & Mining Sciences. 2010, 47:286–298.
  2. Horst; Lippmann, H. Mechanics of “bumps” in coal mines: a discussion of violent deformations in the sides of road-ways in coal seams. Applied Mechanics Reviews. 1987, 40(8):1033–1043.
  3. Qi, Q.X.; Dou, L.M. Theory and Technology of Coal Bump; China University of Mining and Technology Press: Xuzhou, China, 2008. (In Chinese).
  4. Pan, Y.S.; Li, Z.H.; Zhang M.T. Distribution, type, mechanism and prevention of rockbrust in China. Chinese Journal of Rock Mechanics and Engineering, 2003,22(11):1844–1844. (In Chinese).
  5. Jiang, Y.D.; Pan Y.S.; Jiang, F.X.; et al. State of the art review on mechanism and prevention of coal bumps in China. Journal of China Coal Society, 2014, 39(2): 205–213. (In Chinese).
  6. Qi, Q.X.; Li, Y.Z.; Zhao, S.K., et al. Seventy years development of coal mine rockburst in China: establishment and consideration of theory and technology system. Coal Science and Technology, 2019, 47(9): 1–40. (In Chinese).
  7. Brauner, G. Ground Pressure and Coal Bumps; Li, Y.S., Translator; Coal Industry Press: Beijing, China, 1985.
  8. Cook, N.G.W.; Hoek E.; Salamon, M.D.G. Rock Mechanics Applied to Study of Rockbursts [J]. Journal of South African Institute of Mining & Metallurgy,1966, 435-528.
  9. Cook, N.G.W. The failure of rock. International Journal of Rock Mechanics & Mining Sciences & Geomechanics Abstracts, 1965,2(4): 389-403.
  10. Cook, N.G.W. A note on rock bursts considered as a problem of stability. Journal of the South African Institute of Mining and Metallurgy, 1965, 65(1): 437-446.
  11. Salamon, M.D.G. Stability, instability and design of pillar workings. International Journal of Rock Mechanics and Mining Sciences & Geomechanics Abstracts, 1970, 7(6):613-631.
  12. Blake, W. Rockburst mechanics. Quarterly of Colorado School of Mines, 1972, 67: 1-64.
  13. KIDYBINSKI A. Bursting liability indices of coal. International Journal of Roc Mechanics and Mining Sciences and Geomechanics Abstracts, 1981, 18(4): 295–304.
  14. Singh, S.P. Burst energy release index. Rock Mechanics and Rock Engineering, 1988, 21(2):149-155.
  15. Zhang M.T.Discussion on the mechanism of coal burst. Journal of Fuxin Mining Institute, 1985, 4(S1):65–72. (In Chinese).
  16. Li, G.P. The Mechanism of Compression-Shear Damage for Rock Mass with Its Application to Rockburst. Chinese Journal of Geotechnical Engineering, 1997, 19 (6): 49-55. (In Chinese).
  17. Tang, C.A.; Xu, X.H. A cusp catastrophic model of rock unstable failure. Chinese Journal of Rock Mechanics and Engineering, 1990, 9(2): 100-107. (In Chinese).
  18. Pan, Y.S.; Zhang M.T.The study of coal burst by catastrophe theory. Journal of Fuxin Mining Institute, 1992, 11(1):12-18. (In Chinese).
  19. Wang, S.Y.; Lam, K.C.; Au, S.K.; et al. Analytical and Numerical Study on the Pillar Rockbursts Mechanism. Rock Mech. Rock Engng. 2006, 39 (5): 445–467. [CrossRef]
  20. Xie, H.P.; W.G.Pariseau. Fractal character and mechanism of rock bursts. Chinese Journal of Rock Mechanics and Engineering, 1993, 12(1): 28-37. (In Chinese).
  21. Qi, Q.X.; Shi Y.W.; Liu T.Q.Experimental study on stick slip instability mechanism of rockburst. Journal of China Coal Society, 1997, 21(2): 34-38. (In Chinese).
  22. Pan, J.F.; Ning, Y.; Mao D.B.; et al.Theory of rockburst star-up during coal mining. Chinese Journal of Rock Mechanics and Engineering, 2012, 31(3):586-596. (In Chinese).
  23. Dou, L.M.; He, J.; Cao, A.Y.; et al.Rock burst prevention methods based on theory of dynamic and static combined load induced in coal mine. Journal of China Coal Society, 2015, 40(7): 1469-1476. (In Chinese).
  24. Pan Y.S.Disturbance response instability theory of rockburst in coal mine. Journal of China Coal Society, 2018, 43(8): 2091-2098. (In Chinese).
  25. Dou, L.M.; Tian, X.Y.; Cao, A.Y.; et al. Present situation and problems of coal mine rock burst prevention and control in China. Journal of China Coal Society, 2022, 47(1): 152-171. (In Chinese).
  26. Dou, L.M.; Tian, X.Y.; Cao, A.Y.; et al. Present situation and problems of coal mine rock burst prevention and control in China. Journal of China Coal Society, 2022, 47(1): 152-171. (In Chinese).
  27. Liu, J.X.; Tang, C.A.; Zhu, W.C.; et al. Rock-coal model model for studying the rockburst. Chinese Journal of Geotechnical Engineering, 2004, 26(2): 276-280. (In Chinese).
  28. Li, J.Q.; Qi, Q.X.; Mao, D.B.; et al.Discussion on evaluation method of bursting liability with composite model of coal and rock.Chinese Journal of Rock Mechanics and Engineering, 2005, 24(Supp.1): 4805—4810. (In Chinese).
  29. Dou, L.M.; Lu, C.P.; Mu, Z.L.; et al.Rock burst tendency of coal-rock combinations sample.Journal of Mining & Safety Engineering,2006,23(1): 43-46. (In Chinese).
  30. Gu, J.C.; Fan, J.Q.; Kong, F.L.; et al. Mechanism of ejective rockburst and model testing technology. Chinese Journal of Rock Mechanics and Engineering, 2014, 33(6): 1081-1089. (In Chinese).
  31. Yin, Y.C.; Zhao, T. B.; Li, H.T.; et al.Bursting liability test and evaluation index analysis of coal under different loading stiffness. Chinese Journal of Rock Mechanics and Engineering, 2023, https://doi.org/10.13722/j.cnki.jrme.2023.0046. (In Chinese).
  32. Hudson, J.A.; Crouch, S.L.; Faihturst, C. Soft, stiff and servo-controlled testing machines: a review with reference to rock failure. Engineering Geology, 1972, 6:155-189. [CrossRef]
  33. Hojem, J.P.M.; Cook, N.G.W.; Heins, C. Stiff, two meganewton testing machine for measuring the work-softening behaviour of brittle materials. South Africa of Mechanical Engineering. 1975, 25: 250–270.
  34. Tan, Y.L.; Zhang, M.; Xu, Q.; et al.Study on occurrence mechanism and monitoring and early warning of rock burst caused by hard roof. Coal Science and Technology, 2019, 47 (1):166–172. (In Chinese).
  35. Qi, Q.X.; Zhao, S. K.; Zhang, Y.; et al. Ten typical accidents of coal mine rockburst and their analysis; Emergency Management Press: Beijing, China, 2021. (In Chinese).
  36. Liu, S.H.; Pan, J.F.; Wang, S.W.; et al. Rock burst mechanism of heading roadway in thick coal seam in magmatic intrusion areas. Chinese Journal of Rock Mechanics and Engineering. 1975, 25: 250–270. (In Chinese).
  37. Pan, J.F.; Qi, Q.X.; Liu, S.H.; et al. Characteristics, types and prevention and control technology of rock burst in deep coal mining in China[J]. Journal of China Coal Society, 2020, 45(1):111-121. (In Chinese).
  38. Dong, F.T. Roadway Support Theory and Applied Technology Base on Broken Rock Zone; China University of Mining and Technology Press: Xuzhou, China, 2001. (In Chinese).
  39. Zhu; S.T.; Dong X.K.; Jiang; F.X.; et al. Failure mechanism of pressure relief with advance drilling in driving face of strong burst ultra thick coal seam in Liuhuanggou coal mine. Journal of Mining & Safety Engineering. 2022, 39(1): 45-53.
  40. Zhang; D.X.; Wang; X.Y.; Guo; W.Y.; et al. The influence of coal seam thickness on the pressure relief and energy release mechanism of large-diameter drilling hole. Coal Science and Technology. 2022, https://doi.org/10.12438/cst.2023-0654. (In Chinese).
  41. Zhao; Y.X.; Jiang; Y.D.; Wang; T.; et al. Features of microseismic events and precursors of rock burst in underground coal mining with hard roof. Journal of China Coal Society, 2022, 37(12): 1960-1966. (In Chinese).
  42. Zhao; S.K.; Mechanism of force-structure cooperative prevention and control of deep hole roof pre-blasting for rock burst. Journal of China Coal Society, 2021, 46(11):3419- 3432. (In Chinese).
  43. Wang; C.W.; Jiang; F.X.; Wang; P.; et al. Microseismic events distribution characteristic and mechanism of rock bursting induced by a coal pillar. Journal of China Coal Society, 2009, 34(11): 1169-1173. (In Chinese).
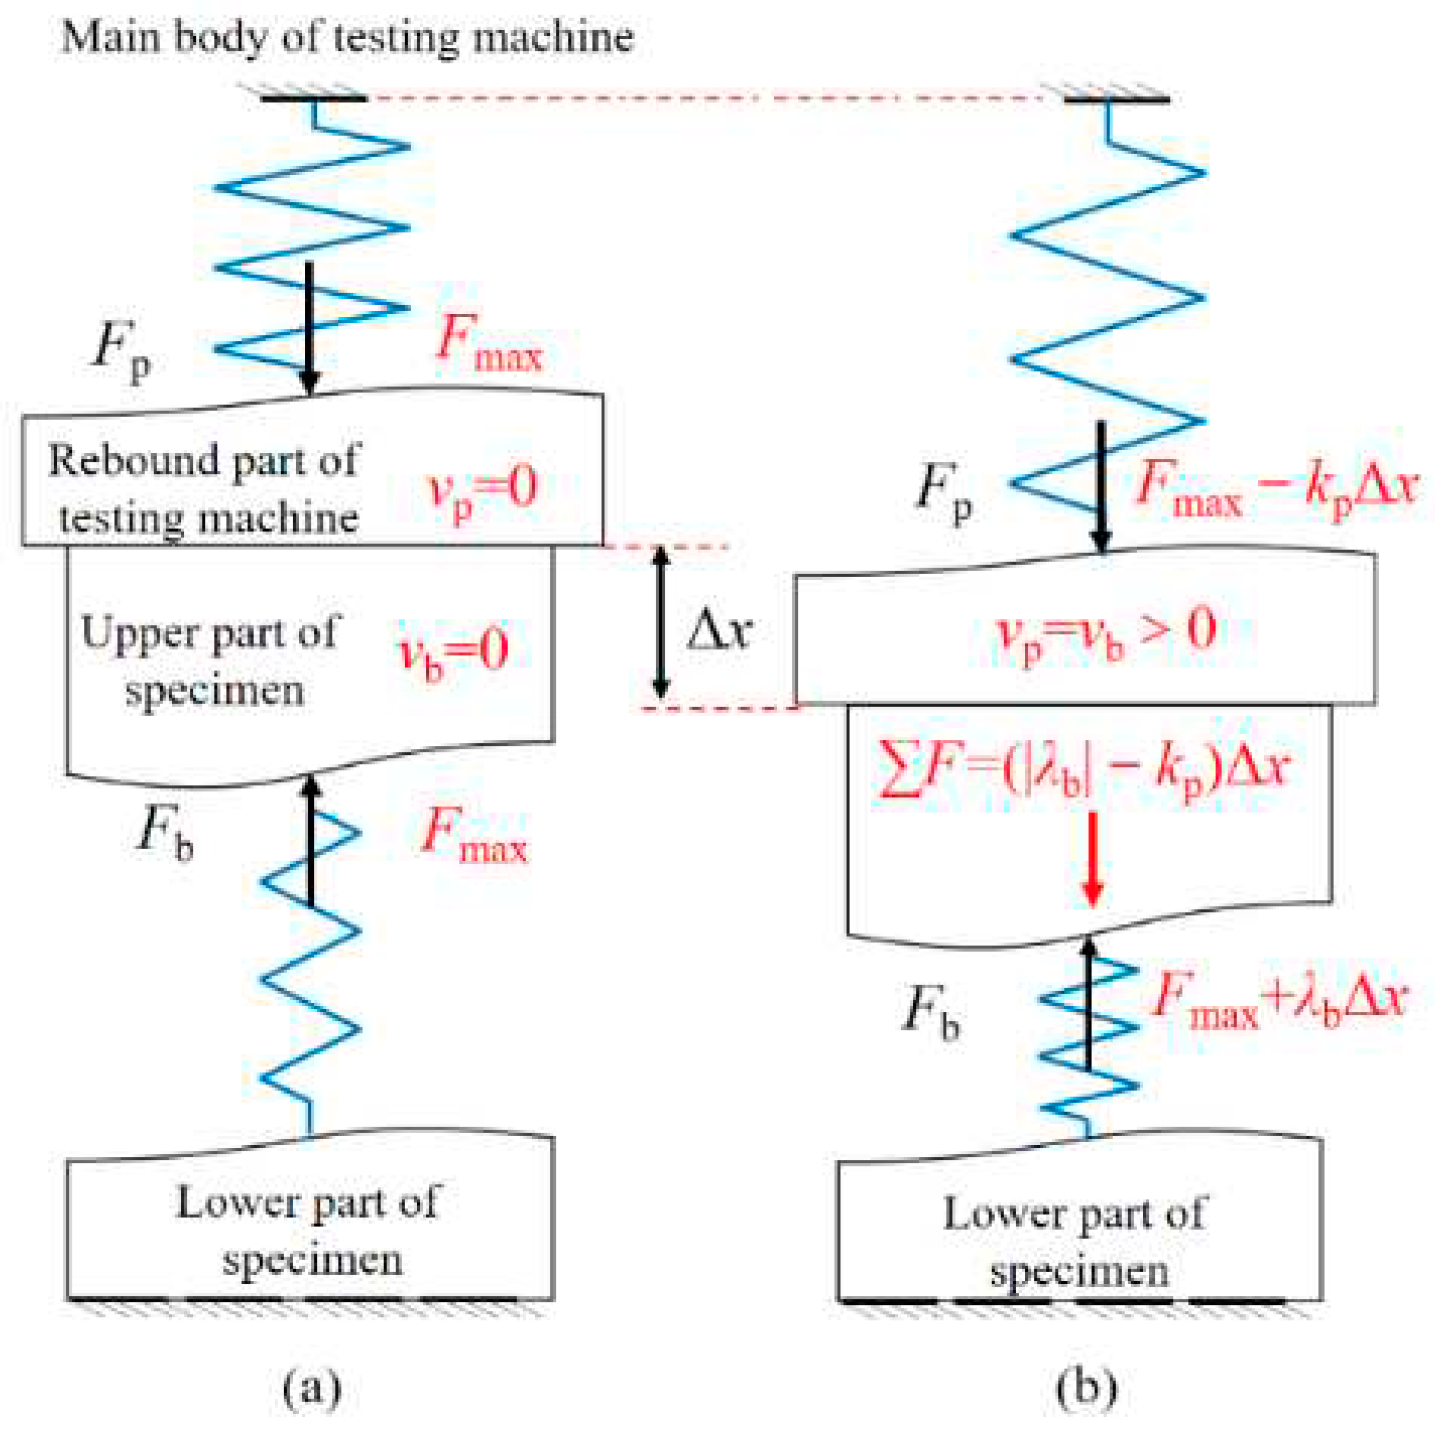
Figure 1. simplified model of the specimen-testing machine system. (a) System at peak: two force equilibrium; (b) Post peak system: unbalanced or instable.
Preprints 88774 g001
Figure 2. Post-peak instability of pressure bearer-pressure provider system.
Preprints 88774 g002
Figure 3. Damaged combined coal and rock samples connected in series [29].
Preprints 88774 g003
Figure 4. Comparison between USCS and two types of ESCS: (a) ESCS with high stiffness coal seam. (b) USCS with uneven stiffness coal seam. (c) ESCS with low stiffness coal seam.
Preprints 88774 g004
Figure 5. Three kinds of typical USCS in coal measure strata: (a) Coal seam thinning zones (a certain coal bump accident in Tianchi Coal Mine, Sichuan) [3]. (b) Coal seam bifurcation zones. (c) Magmatic intrusion zone (2015 “8.5” coal bump accident in a coal mine in Inner Mongolia) [36].
Preprints 88774 g005
Figure 6. Stress distribution and deformation of uneven stiffness coal seam under three kinds of roof: (a) discontinuous roof and coal seam. (b) continuous elastic roof and coal seam. (c) rigid roof and continuous elastic coal seam.
Preprints 88774 g006
Figure 7. Stress distribution and deformation of uneven stiffness coal seam under three kinds of roof: (a) discontinuous roof and coal seam. (b) continuous elastic roof and coal seam. (c) rigid roof and continuous elastic coal seam.
Preprints 88774 g007
Figure 8. The trisection model of the uneven stiffness coal seam structure (USCS).
Preprints 88774 g008
Figure 9. Simulation results of different USCS models (stress unit: Pa): (a) Normal stress cloud map of model 1 (common member); (b) Deformation and the Mises stress cloud map of model 1; (c) Normal stress cloud map of model 3 (single variable: SH); (d) Deformation and the Mises stress cloud map of model 3; (e) Normal stress cloud map of model 8 (single variable: EL); (f) Deformation and the Mises stress cloud map of model 8; (g) Normal stress cloud map of model 12 (single variable: HR); (h) Deformation and the Mises stress cloud map of model 12; (i) Normal stress cloud map of model 14 (single variable: SR or SL); (j) Deformation and the Mises stress cloud map of model 14.
Preprints 88774 g009aPreprints 88774 g009b
Figure 11. Roof subsidence after coal mass failure of ESCS and USCS. (a) Roof subsidence after coal mass failure of even stiffness coal seam structure; (b) Roof subsidence after coal mass failure of uneven stiffness coal seam structure.
Preprints 88774 g011
Figure 12. Comparison between Model 9 and Model 10 (stress unit: Pa): (a) Simulation results of Model 9; (b) Simulation results of artificial Model 10.
Preprints 88774 g012
Figure 13. Artificial uneven stiffness coal seam structure produced by protective layer mining.
Preprints 88774 g013
Figure 14. USCS that may exist and cause time-delayed coal bump in Xingcun Coal Mine.
Preprints 88774 g014
Figure 15. Final adjusted pressure relief plan for ultra thick coal seam in Liuhuanggou Coal Mine (Strike section of excavation road) [39].
Preprints 88774 g015
Figure 16. Microseism deficiency phenomenon caused by the dynamically superposition of moving artificial USCS (the mining face) and fixed USCS.
Preprints 88774 g016
Figure 17. Distribution of microseismic events before the “9.9” coal bump in Huafeng Coal Mine [43].
Preprints 88774 g017
Table 1. Table 1. Model parameters of 14 uneven stiffness coal seam structures
Model Aera (Width) of Roof
SR/m
Thickness
of Roof
HR /m
Young’s modulus of Roof
ER /GPa
Young’s modulus of Hard Coal
EH /GPa
Young’s modulus of Soft Coal
EL /GPa
Aera (Width) of High Stiffness Zone SH /m Aera (Width) of Low Stiffness Zone
(one side) SL /m
1 40 5 20 5 2 4
0
20.14
18
2 40 5 20 5 2 10
0
20.14
15
3 40 5 20 5 2 20
0
20.14
10
4 40 5 15 5 2 4
0
20.14
18
5 40 5 10 5 2 4
0
20.14
18
6 40 5 20 4 2 4
0
20.14
18
7 40 5 20 3 2 4
0
20.14
18
8 40 5 20 5 1 4
0
20.14
18
9 40 5 20 5 1×10⁻¹⁰ 4
0
20.14
18
10 40 5 20 5 0 4
0
20.14
No Coal (goaf)
11 40 7 20 5 2 4
0
20.14
18
12 40 9 20 5 2 4
0
20.14
18
13 20 5 20 5 2 4
0
20.14
8
14 12 5 20 5 2 4
0
20.14
4
Table 2. Average value of calculation results in high stiffness zone of 14 USCS models.
No. Controlled
Variable
Controlled Variable
Value
Normal
Stress
σ ¯ yH /MPa
Stress Concentration Factor
f ¯ s c H
Compression
Deformation
u ¯ yRH /mm
Bending
Deflection
w ¯ RH /mm
Total
Deformation
u ¯ yRH /mm
NSC of Roof
KR/N•mm-3
α ¯ NSC of Pressure provider
K ¯ pH /N•mm-3
1 SH/m 4 23.837 1.589 4.065 8.569 12.635 4.000 0.322 1.287
2 10 19.576 1.305 3.798 13.471 17.269 4.000 0.220 0.880
3 20 17.442 1.163 3.602 13.638 17.241 4.000 0.209 0.836
1
ER/GPa 20 23.847 1.589 4.065 8.569 12.635 4.000 0.322 1.287
4 15 23.469 1.564 5.346 8.978 14.324 3.000 0.373 1.120
5 10 22.955 1.530 7.861 9.453 17.314 2.000 0.454 0.908
1 EH /Gpa
(KH)
5 23.837 1.589 4.065 8.569 12.635 4.000 0.322 1.287
6 4 21.110 1.407 3.862 6.007 9.869 4.000 0.391 1.565
7 3 17.759 1.184 3.608
2.830 6.438 4.000 0.564 2.242
1 EL /GPa
(KL)
2 23.837 1.589 4.065 8.569 12.635 4.000 0.322 1.287
8 1 34.829 2.322 4.996 29.159 34.155 4.000 0.146 0.585
9 1×10⁻¹⁰ 149.758 9.984 15.640 490.043 505.683 4.000 0.031 0.124
10 0 149.776 9.984 15.640 490.043 505.683 4.000 0.031 0.124
1 HR/m 5 23.837 1.589 4.065 8.569 12.635 4.000 0.322 1.287
11 7 24.762 1.651 4.220 6.785 11.005 2.857 0.383 1.096
12 9 25.385 1.692 4.379 6.003 10.382 2.222 0.422 0.937
1 SR(SL) /m 40(36) 23.837 1.589 4.065 8.569 12.635 4.000 0.322 1.287
13 20(16) 23.541 1.569 4.093 4.059 8.152 4.000 0.502 2.008
14 12(8) 22.427 1.495 3.961 1.431 5.393 4.000 0.735 2.938
Table 3. Correlation between the six key parameters of USCS and coal bump risk of high stiffness zone.
Key
Parameters
Mechanical Analysis Numerical Simulation Engineering Experience Corresponding Available Ways of
Coal Bump Prevention
fscH rF KpH rI rCB fscH rF KpH rI rCB fscH rCB
SH - - - - - + - - Avoiding a decrease inSH:
Avoid mining isolated working faces and expanding existing roadways
ER + + + - + + + - + + Reduce ER of continuous composite roof:
Carried out roof cutting measures in rock stratum with higher ER.
EH (KH) + + - + + + + - + + + + Reduce KH: coal seam slotting or blasting, large diameter boreholes, water injection softening, high pressure water jet cutting
EL (KL) - - + - - - - + - - - - Increase KL: hydraulic support, single prop, anchor bolts and cables, grouting, goaf filling
HR + + + + - + + + + Reduce HR of continuous composite roof:
Carried out roof cutting measures in rock stratum with higher HR.
SR(SL) + + + + - + + + + Cutting roof or floor to reduce the SR(SL): directional hydraulic fracturing, deep hole blasting
+: Positive Correlation, -: Negative Correlation, leave a blank space: Uncertain Correlation.
Disclaimer/Publisher’s Note: The statements, opinions and data contained in all publications are solely those of the individual author(s) and contributor(s) and not of MDPI and/or the editor(s). MDPI and/or the editor(s) disclaim responsibility for any injury to people or property resulting from any ideas, methods, instructions or products referred to in the content.
Copyright: This open access article is published under a Creative Commons CC BY 4.0 license, which permit the free download, distribution, and reuse, provided that the author and preprint are cited in any reuse.
Prerpints.org logo

Preprints.org is a free preprint server supported by MDPI in Basel, Switzerland.

Subscribe

© 2024 MDPI (Basel, Switzerland) unless otherwise stated