Preprint
Article

On the Compatibility Between Elastically Distorted Austenite and Martensite in NiTi

Altmetrics

Downloads

154

Views

97

Comments

0

This version is not peer-reviewed

Submitted:

25 October 2023

Posted:

27 October 2023

You are already at the latest version

Alerts
Abstract
The cubic B2 to monoclinic B19’ martensitic transformation in NiTi shape memory alloys proceeds by the nucleation and propagation of habit plane interfaces that remain undistorted and unrotated by the transformation. Due to incompatibility of austenite and martensite lattices in NiTi, the interfaces form between austenite and twinned martensite as described by Phenomenological Theory of Martensite Crystallography (PTMC). This have been assumed also for stress-induced martensitic transformation where, however, interfaces with single martensite variant have been frequently reported. On this account, we propose a different solution of strain compatibile habit planes by considering the effect of elastic deformation of both lattices due to external stress. Using modified PTMC theory, we evaluate the magnitudes and orientations of the critical uniaxial stress in tension and compression for which strain compatible habit plane interfaces with a single variant of martensite can form. The calculated stress is too high, but considering the pre-transformation softening of the C’ elastic constant for the {110}A⟨110⟩A austenite shear mode, the critical stress decreases down to 500 MPa. For such situation, we analyse orientation dependence and tension-compression asymmetry of required C’ softening, and the orientations of strain compatible habit planes that are compared with available experimental results. All calculations, including source code and interactive graphs, are available for download.
Keywords: 
Subject: Chemistry and Materials Science  -   Materials Science and Technology

1. Introduction

Industrial applications of near-equiatomic NiTi alloys benefit from the large amount of recoverable strain, on the order of percentages, that can be repeatedly induced and recovered by thermal and/or mechanical actuation. It stems from the reversible martensitic transformation (MT) between the parent austenite and product martensite phases that gives rise to related functional properties called superelasticity and shape memory. MT is a diffusionless solid-solid phase transition that proceeds via thermomechanically driven nucleation and propagation of interfaces between the two phases. One of the conditions for MT to be reversible is that the crystal structures of the two phases must be coherent at some crystallographic planes. Such habit planes ensure the propagation of austenite-martensite interfaces without creating lattice defects that would otherwise lead to unrecoverable strains and unstable thermomechanical response.
The reversibility of MT was related to no or negligible specific volume changes and compatibility at austenite-martensite interfaces [1]. The latter is related to the existence of compatible habit planes. These are invariant lattice planes (ILPs) shared by the austenite and martensite lattices. It has been proposed that such low-interface-energy habit planes propagate and transform the austenite structure into the martensite structure, or vice versa, without the generation of crystal defects. The ILP exists when the symmetric distortion matrix of the MT is such that its second eigenvalue, denoted λ 2 , is equal to 1 and the associated transformation strain, denoted ε 2 , is equal to 0. Furthermore, invariant planes also exist between austenite and martensite microstructures formed from martensite variants twinned at arbitrary volume fraction ratios [1] if the distorsion matrix satisfies a set of so-called co-factor conditions, including λ 2 = 1 . Such supercompatibility [2] ensures invariant lattice planes for a range of transformation strains, which can thus help accommodate applied macroscopic deformation. Finally, four- [3] and three-fold [4] conditions of compatibility between domains of twinned martensite have been formulated. Such compatibility is thought to ensure that no crystal defects are generated in the process of detwinning of martensite when it is subjected to external loading.
Whether or not the crystallographic conditions are satisfied depends on the type of lattice and the lattice parameters. Unfortunately, NiTi alloys do not satisfy the λ 2 = 1 condition or the set of cofactor conditions. Interestingly, however, NiTi alloys are the most widely used SMAs due to their resistance to plastic deformation and relatively stable thermo-mechanical response. Theoretically, the only way for monoclinic B19’ martensite in NiTi alloys to have ILPs with cubic B2 austenite is on a larger scale of Type I or Type II twins of pairs of lattice correspondence variants (CVs) of martensite. The Phenomenological Theory of Martensite Crystallography (PTMC) extended to shape memory alloys [5,6] provides several solutions for so-called Habit Plane Variants (HPVs) specified in terms of pairs of CVs and their volume fraction ratios for which ILPs with austenite exist [3]. Some of these HPVs were found to be consistent with experimental observations of specimens subjected to stress-free MT. Experimentally observed habit planes were to some consistent with PTMC solutions for < 011 > M Type II HPVs [7,8,9] and for { 111 } M Type I HPVs, although less frequently [9]. Nevertheless, Cayron [10] critically evaluated these experimental results and concluded that their scatter from PTMC solutions is beyond the experimental error. More recently, specific clusters of multiple < 011 > M Type II HPVs [11] or ( 001 ) M compound twins [12] have been experimentally observed and justified using PTMC [4]. These self-accommodating martensite microstructures observed during stress-free MT provide both a plausible habit plane and a minimized average transformation strain.
Although martensite microstructures provide coherent habit planes as described above, plastic deformation processes occur in these alloys whenever MT proceeds under external stress. We have systematically investigated plastic deformation processes in NiTi wires with defined initial microstructures of nano- to micrometer-sized grains. Surprisingly, plasticity in NiTi alloys was found to be related not only to loading above the yield stress [13,14,15,16,17], but also to forward and reverse MT [18,19,20,21,22], even when proceeding under stresses well below the yield stresses of austenite and martensite [19,21]. In contrast, reorientation of martensite by loading to its yield stress followed by unloading and stress-free reverse MT into austenite did not produce any appreciable irreversible strain [19]. Thus, it is clear that strained MT proceeds differently than stress-free MT. Thus, for theoretical predictions of strain planes under stress, PTMC should consider the effects of deformation constraints and external stresses.
Published experimental results on martensite microstructures produced by stress-induced MT have led to conflicting conclusions. Partly this is certainly due to the different types of NiTi samples that were under investigation. Transmission electron microscopy (TEM) studies suggest that stress-induced martensite microstructures in single crystals or coarse-grained NiTi are formed from < 011 > M type II twins [23], while nano-grained NiTi are preferentially formed from ( 001 ) M compound twins [12,24]. The preferred orientations of stress-induced martensite in < 111 > A textured nano-grained NiTi suggest that stress-induced MT favors ( 001 ) M twins, which provide the largest transformation strain in the loading direction, as measured by in-situ synchrotron X-ray diffraction during stress-induced MT [25]. Martensite textures analyzed in a deformed NiTi sheet using EBSD [26] also met the criterion of the largest transformation strain and interaction work. In addition, the appearance of single variants of martensite rather than HPVs was suggested by the texture predictions. On the other hand, close agreement with simulated virtual diffraction of HPVs was demonstrated by high energy diffraction experiment during in-situ tension of NiTi single crystals [27]. In addition, the identified HPVs generally did not provide the largest transformation strain and maximum deformation work. This may be due to the presence of Ni4Ti3 precipitates, subgrains or intermediate R-phase in the samples studied. To sum up, there is no general agreement whether stress-induced MT tends to form martensite microstructures from HPVs, single variants of martensite or ( 001 ) M compound twins, and whether the criterion of maximum transformation strain holds for selecting martensite microstructures formed under the characteristic stress at which MT is induced.
Experimental identification of the habit planes between austenite and stress-induced martensite has been carried out by means of TEM and scanning electron microscopy (SEM). Surprisingly, these published results suggest that stress-induced MT in polycrystalline NiTi proceeds, at least to some extent, via the propagation of interfaces between austenite and a single variant of martensite. In-situ experiments on NiTi micro-samples showed the propagation of single variants of martensite during straining in TEM [28,29]. Based on statistical analysis of transformation strains measured in-situ in SEM, a non-negligible fraction of single variants of martensite together with HPVs was estimated in strained NiTi [30]. Post-mortem TEM analysis of deformed superelastic NiTi [16] showed interfaces between austenite and a single variant of residual martensite in the vicinity of the austenite { 112 } A plane. Similarly, the austenite { 112 } A plane was suggested as the habit plane with single variant of martensite by post-mortem statistical electron backscatter diffraction (EBSD) analysis on the deformed NiTi sample [10]. Note that Miyazaki et al. [7] in 1984 identified a similar habit plane at { 5 , 6 , 14 } A using optical trace analysis of deformed solution annealed NiTi single crystal. Most recently, a new habit plane { 114 } A between austenite and a single variant of martensite was experimentally measured in [31] and explained by the PTMC using dislocation slip { 110 } A 001 A as lattice invariant shear. However, these published results are not conclusive with respect to the reversibility of interfaces with individual variants of the martensite. On the one hand, the statistical analysis of the transformation strains correlated the appearance of single variants with higher residual strains as measured after unloading. Moreover, post-mortem observations of residual martensite [16,32] at temperatures above the austenite finish temperature ( A f ) suggest their irreversibility. This is also supported by the curved nature of the interfaces. On the other hand, in-situ TEM observations [28,29] have shown their reversibility in polycrystalline samples.
This work contributes to the understanding of stress-induced MT in NiTi by investigating the mechanical conditions under which a coherent interface between cubic B2 austenite and a single variant of monoclinic B19’ becomes possible. To do this, we extend PTMC to include the effect of elastic deformation of the austenite and martensite lattices due to external stress. To the best of our knowledge, such an attempt has only been made in [27], where the authors evaluated the effect of hydrostatic strain on the volume fractions of the CVs in HBVs.
It is crucial to note that we will address the issue of stress-induced compatibility by relying on the widely accepted lattice correspondence between cubic B2 austenite and monoclinic B19’ martensite. Despite this assumption, we will determine the deformation gradients between the two lattices by employing lattice vectors elastically distorted through uniaxial tensile or compression loading, in consideration of all loading directions.
In the following sections, we introduce the problem of austenite-martensite incompatibility in NiTi resulting from the orientation-dependent transformation strain, specifically ε 2 0 . Additionally, we provide an overview of the elastic anisotropy of austenite and martensite, considering their orientation relationship in NiTi. The following section provides a description of the PTMC method, which incorporates external stress, along with reference to Appendix A for detailed descriptions. Subsequently, this method is applied to gain insight into the sensitivity of the second eigenvalue λ 2 and the associated transformation strain ε 2 to uniaxial stress and lattice softening of austenite in the { 110 } A 110 A shear mode. The potential existence of the latter is based on C’ modulus softening, reported as a premartensitic phenomenon in NiTi during thermally induced stress-free MT [33]. Although C’ modulus softening has not been reported as a precursor to stress-induced MT in NiTi, it has been observed in a single crystal of CuAlNi [34]. To exemplify the effect of C’ softening, we first present the orientation dependencies of critical stresses necessary for ε 2 to become zero that allows for the habit plane formation. Subsequently, this paper demonstrates that the softening of C’ decreases the uniaxial stress, required to reach ε 2 = 0 , to realistic values comparable to those typically utilized. Alongside, the normals of habit planes between austenite and a single variant of martensite under external stress are reported. They are compared with experimentally identified habit planes observed under tension, namely, with { 6 5 14 } A , { 9 8 14 } A [7], { 4.138 2.6878 8.684 } A [8], { 4.8 3.9 7.8 } A [35].

2. Austenite-martensite incompatibility problem in NiTi

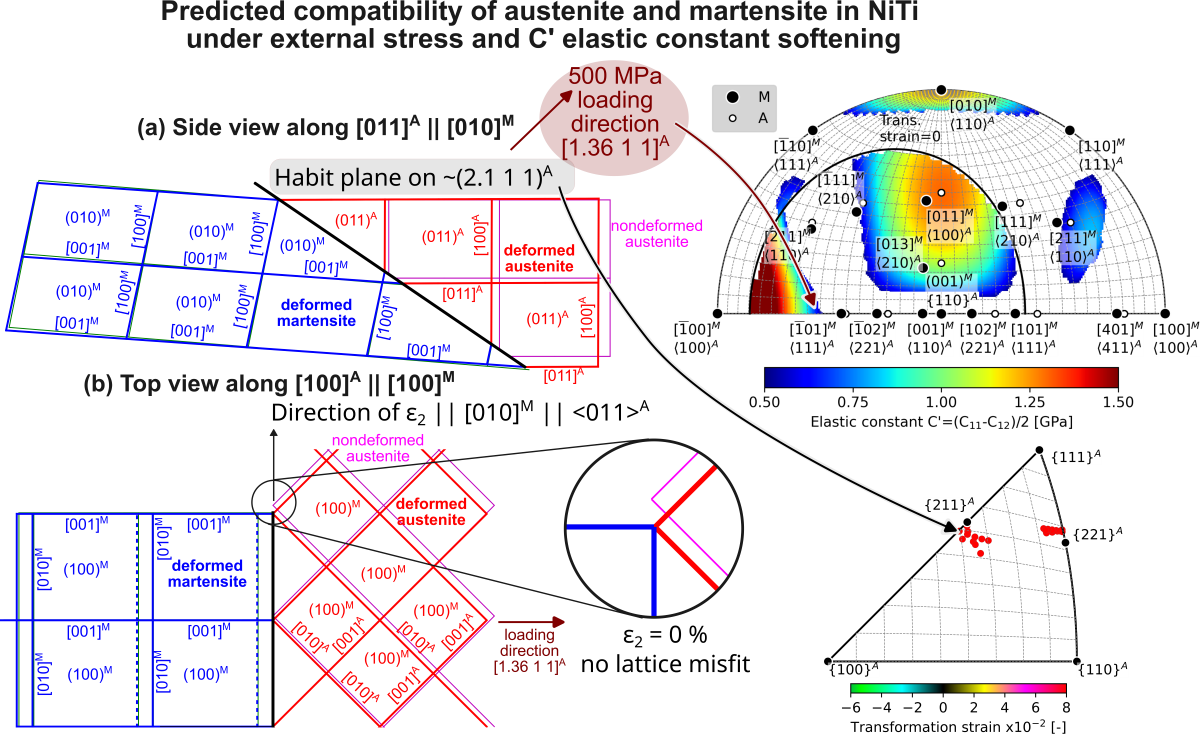
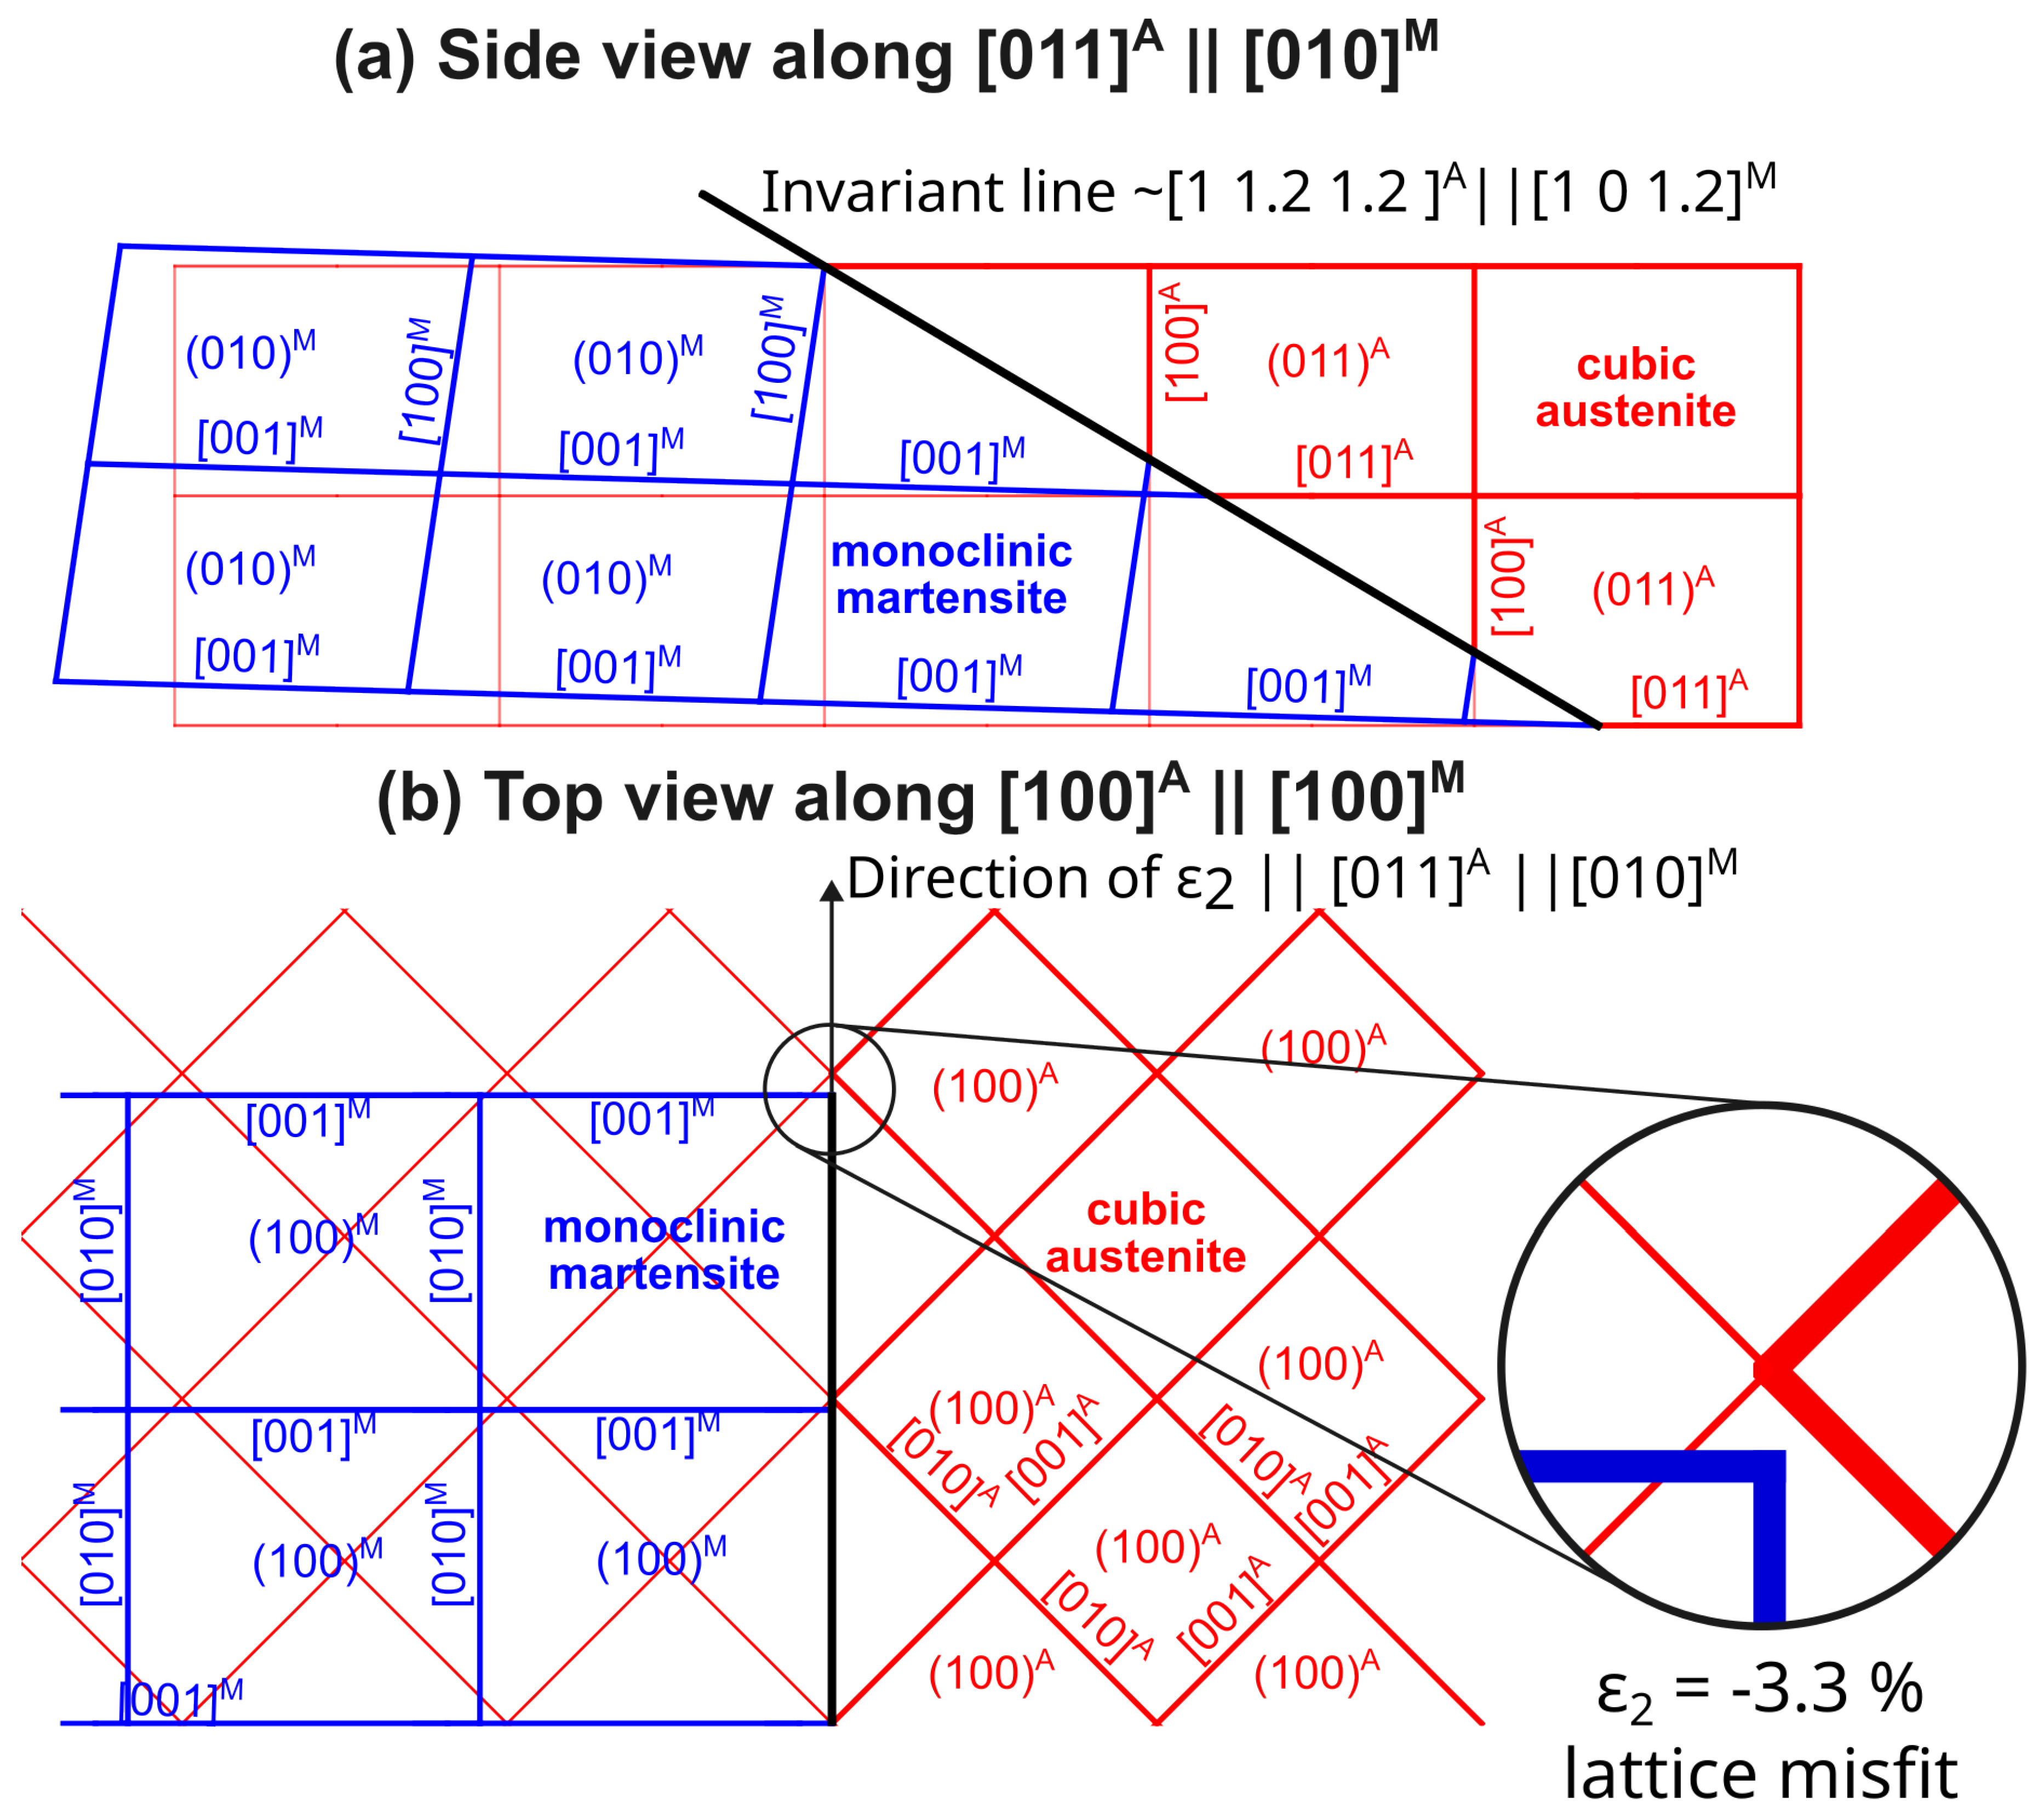
Since austenite and martensite lattices in NiTi have nearly the same specific volume, the compatibility of austenite and martensite lattices is generally possible. As a result, the transformation strain is positive along some orientations and negative in others, as shown by the red and blue shading in the color maps in Figure 1. Note that this presentation of orientation-dependent variables within the fundamental zone of B19’ martensite and using equal-area projection will be primarily used in this work.
It is clear from Figure 1 that the transformation strain in NiTi is not a plane strain and does not provide a habit plane because the zero transformation strain directions are not on a plane but on a surface as indicated in Figure 1 by the black isoline. In order for the transformation strain to become a plane strain, an additional distortion of the lattice is required such that the second principal strain ε 2 vanishes and the associated stretch λ 2 is equal to 1. Since the second principal strain is along the martensitic lattice direction [ 010 ] M , the compatibility problem is related to the mismatch between the lattice parameters a A and b M as ε 2 = 0.5 b M / ( 2 a A ) 2 1 = 3.32 % for the lattice parameters and strain measure used in this work. This mismatch is explicitly displayed in Figure 2b, representing the geometrical model of both latices viewed along [ 100 ] A || [ 100 ] M , which are perpendicular to the direction of the second principal strain. On the other hand, the side view along [ 011 ] A || [ 010 ] M displayed in Figure 2a reveals the invariant line [ 1 1.2 1.2 ] A || [ 1 0 1.2 ] M that is shared by the two lattices. Note that there is a second invariant line along [ 5.1 1 1 ] A || [ 5.1 0 1 ] M that is not shown in Figure 2. The invariant lines lie in the symmetry plane ( 010 ) M of the monoclinic martensite, where the directions of maximum transformation elongation and contraction are also located.

3. Preliminary Insight into Elastic Deformation Effects on Austenite-Martensite Incompatibility
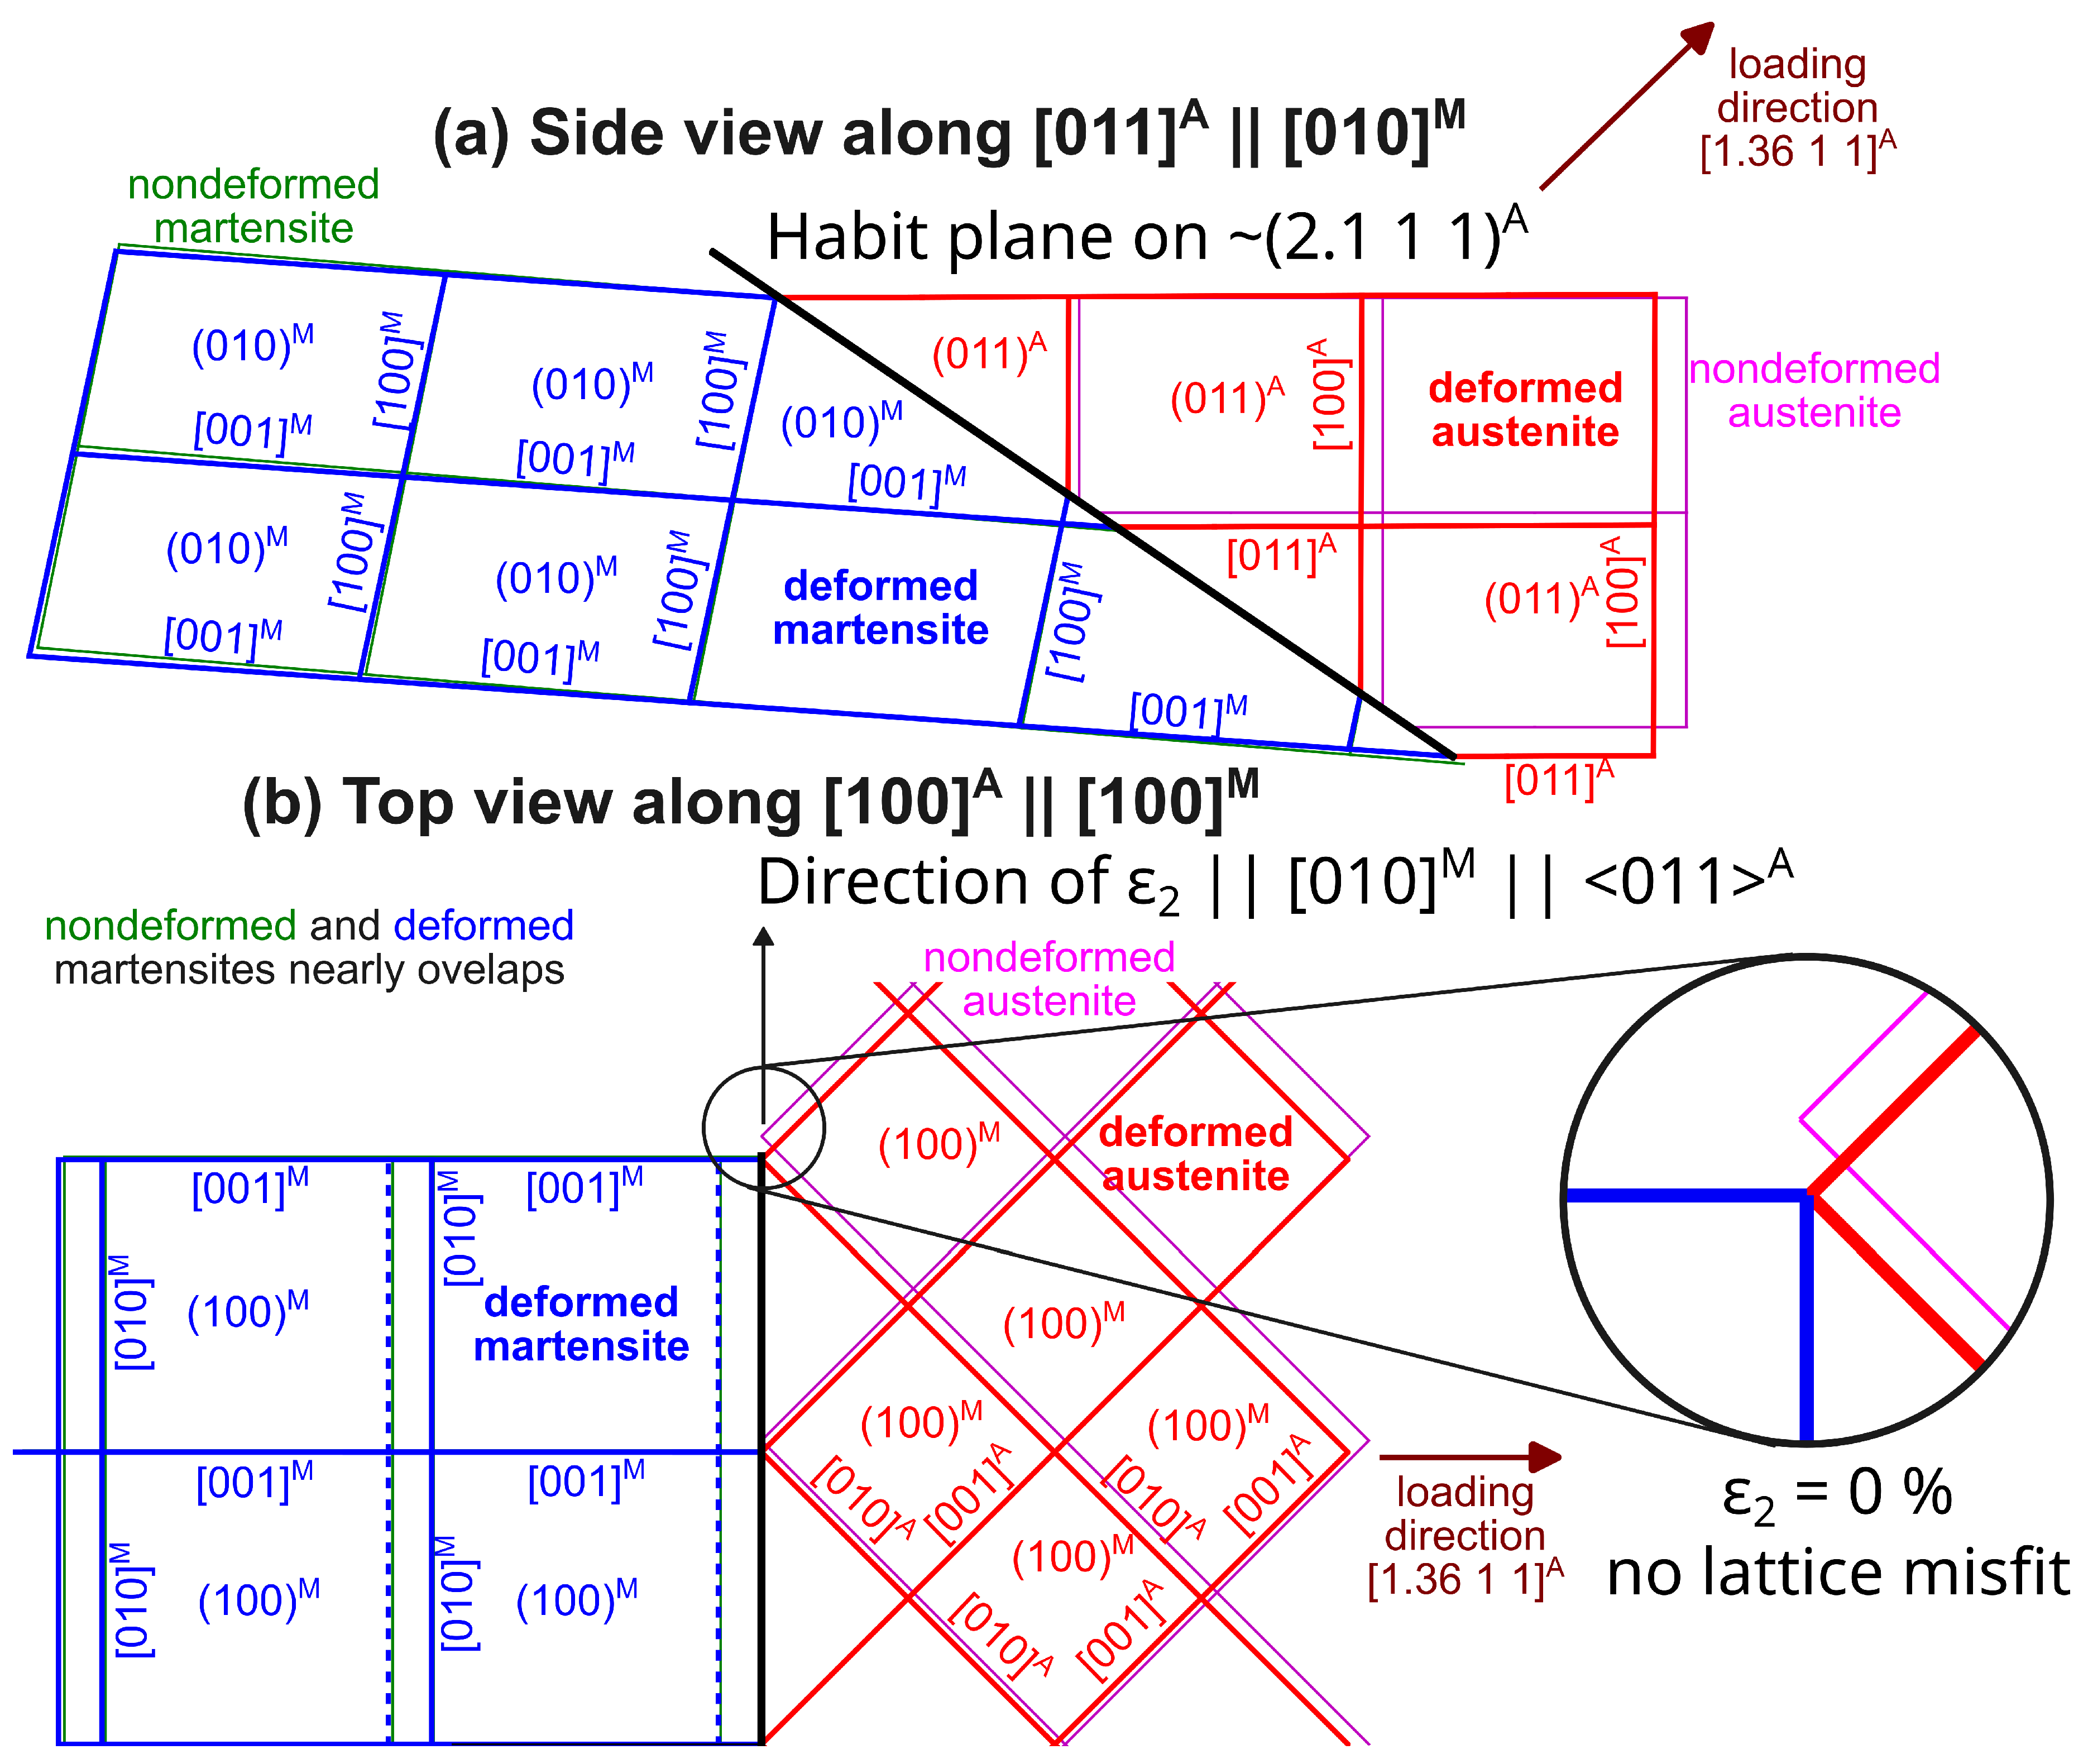
The elastic properties are essential to this work, that aims to understand the role of elastic strains in the compatibility problems at the austenite-martensite interfaces. Specifically, whether the elastic deformation of both lattice might make the second principal transformation strain vanish thus enabling the habit plane formation between austenite and a single variant of martensite. The example of such situation is shown in Figure 3 by the geometrical model of the two lattices in the initial nondeformed and elastically deformed states. The latter is result of our computations presented hereinafter. It represents the two lattices deformed due to a uniaxial tension along the indicated direction and a softening of C’ elastic constant of austenite. It will be shown that such circumstances can indeed enable the habit plane formation as illustrated in Figure 3.
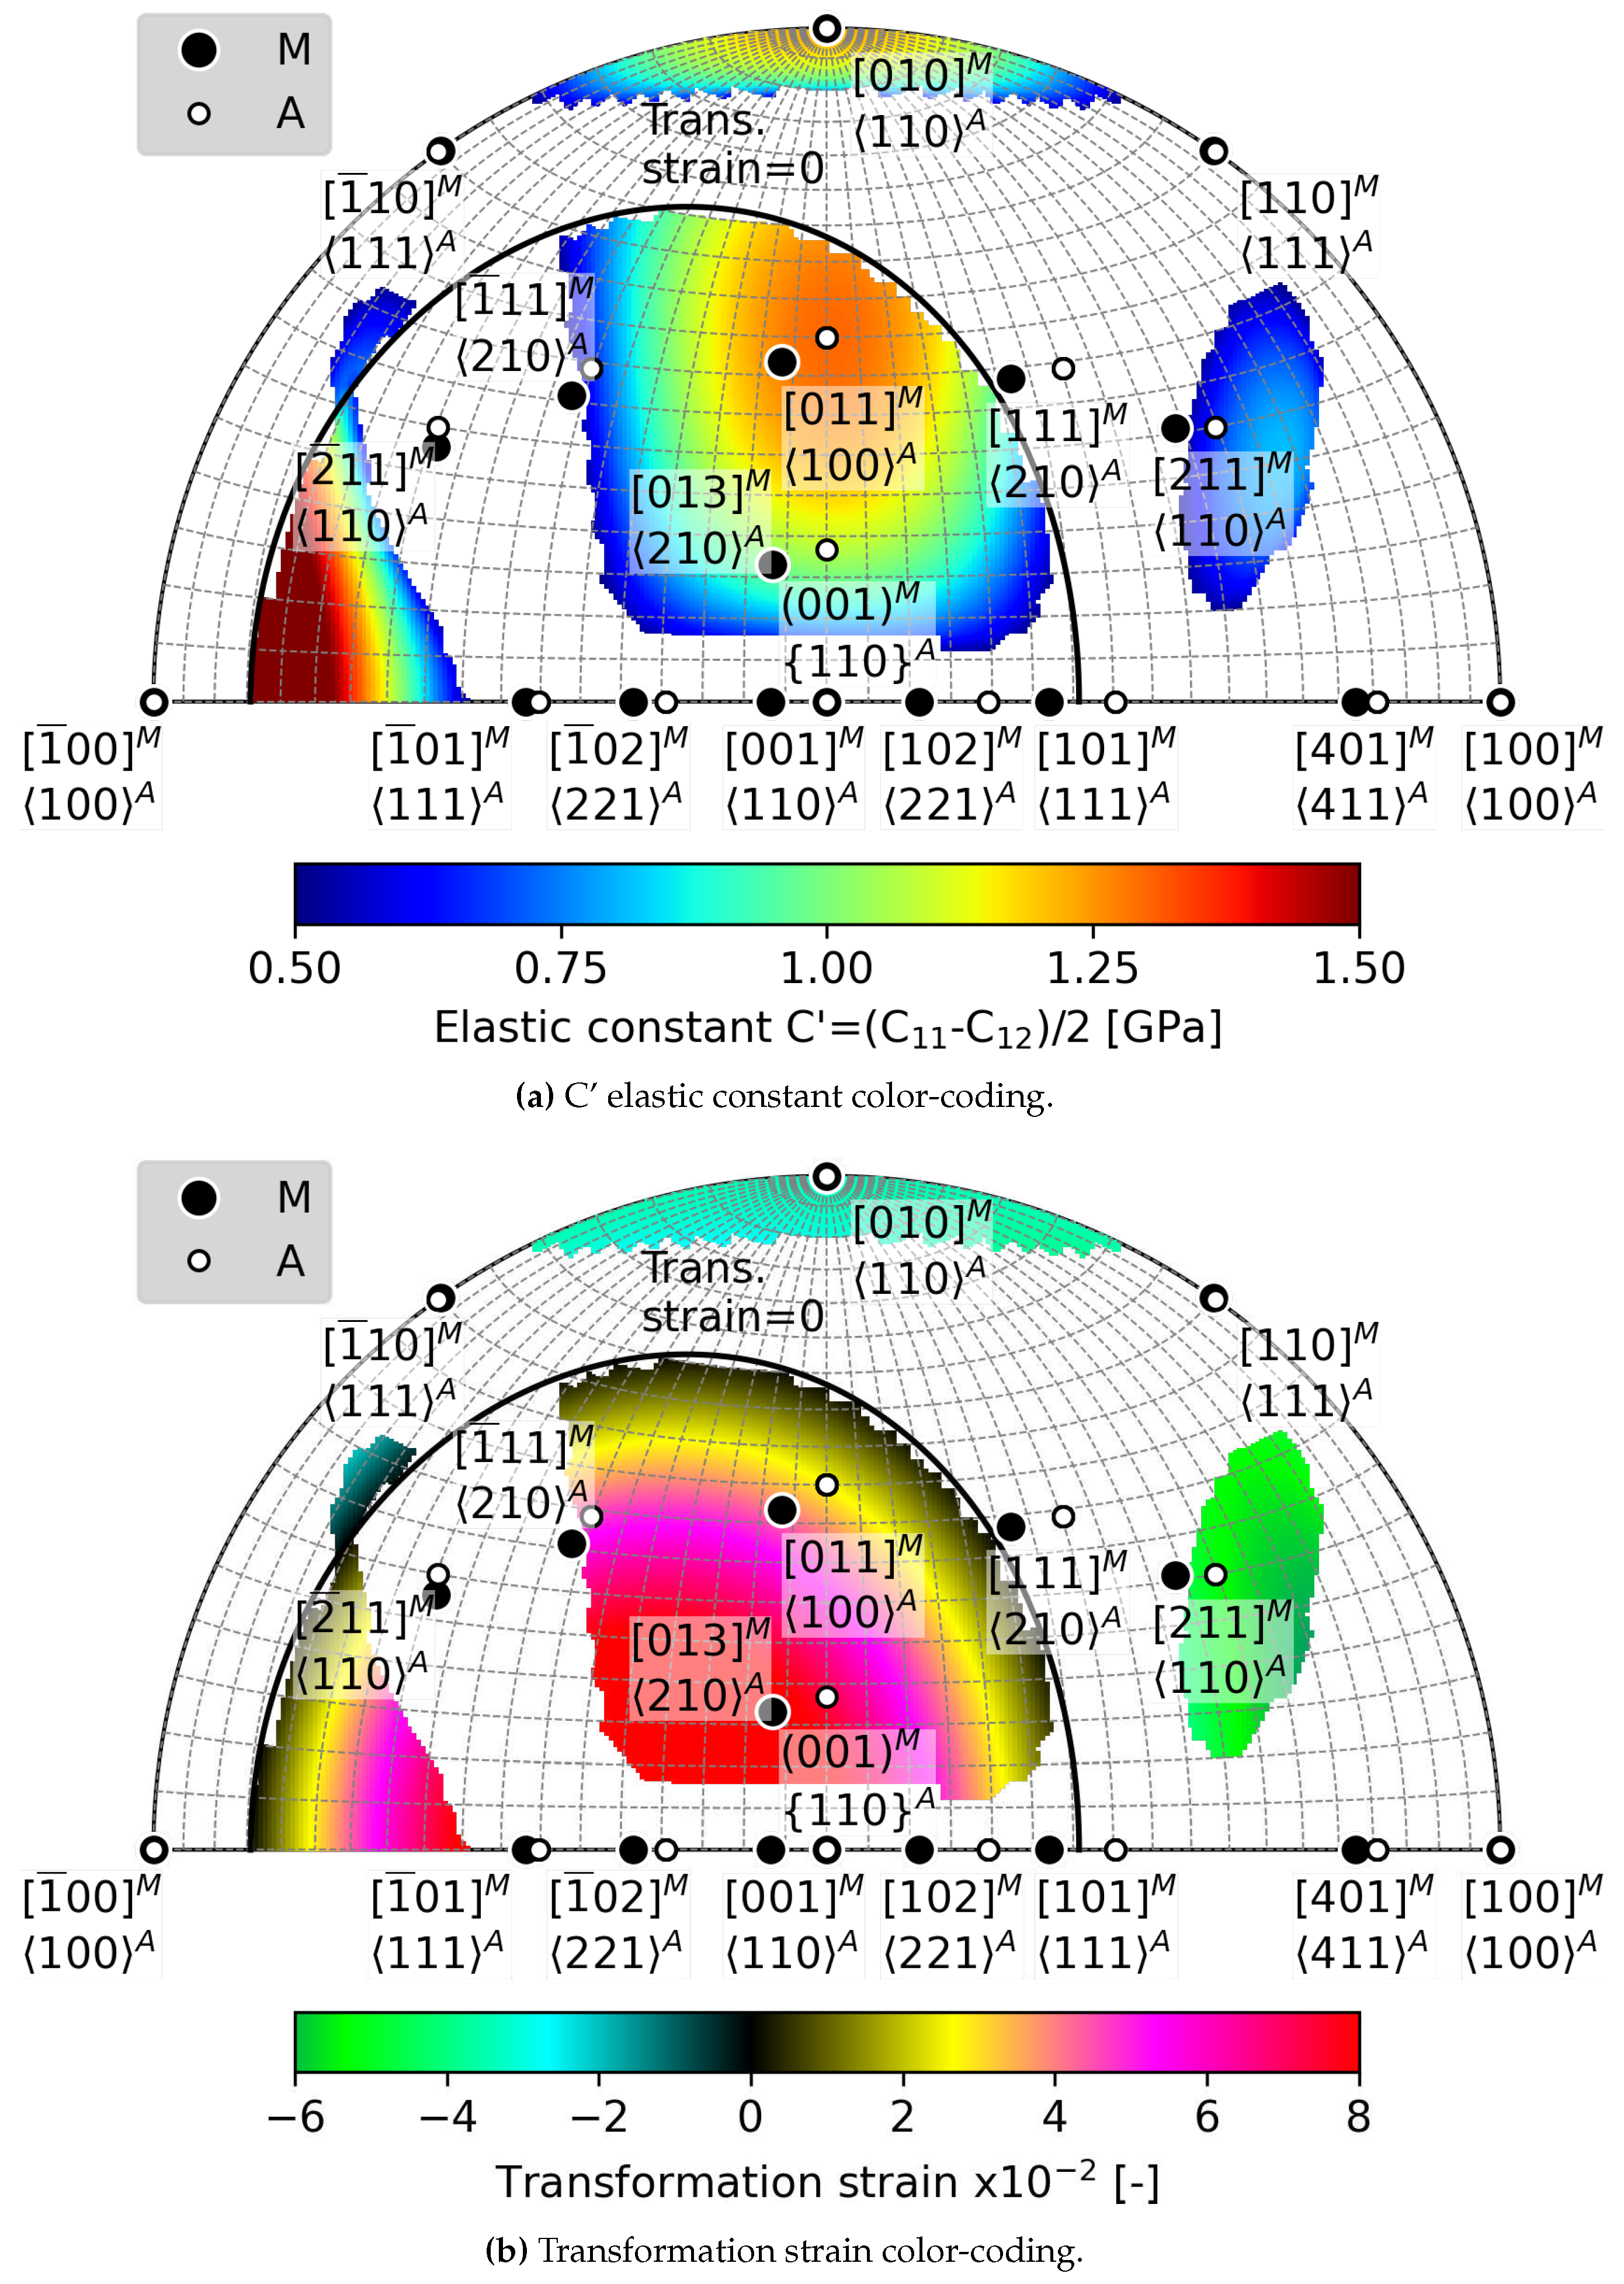
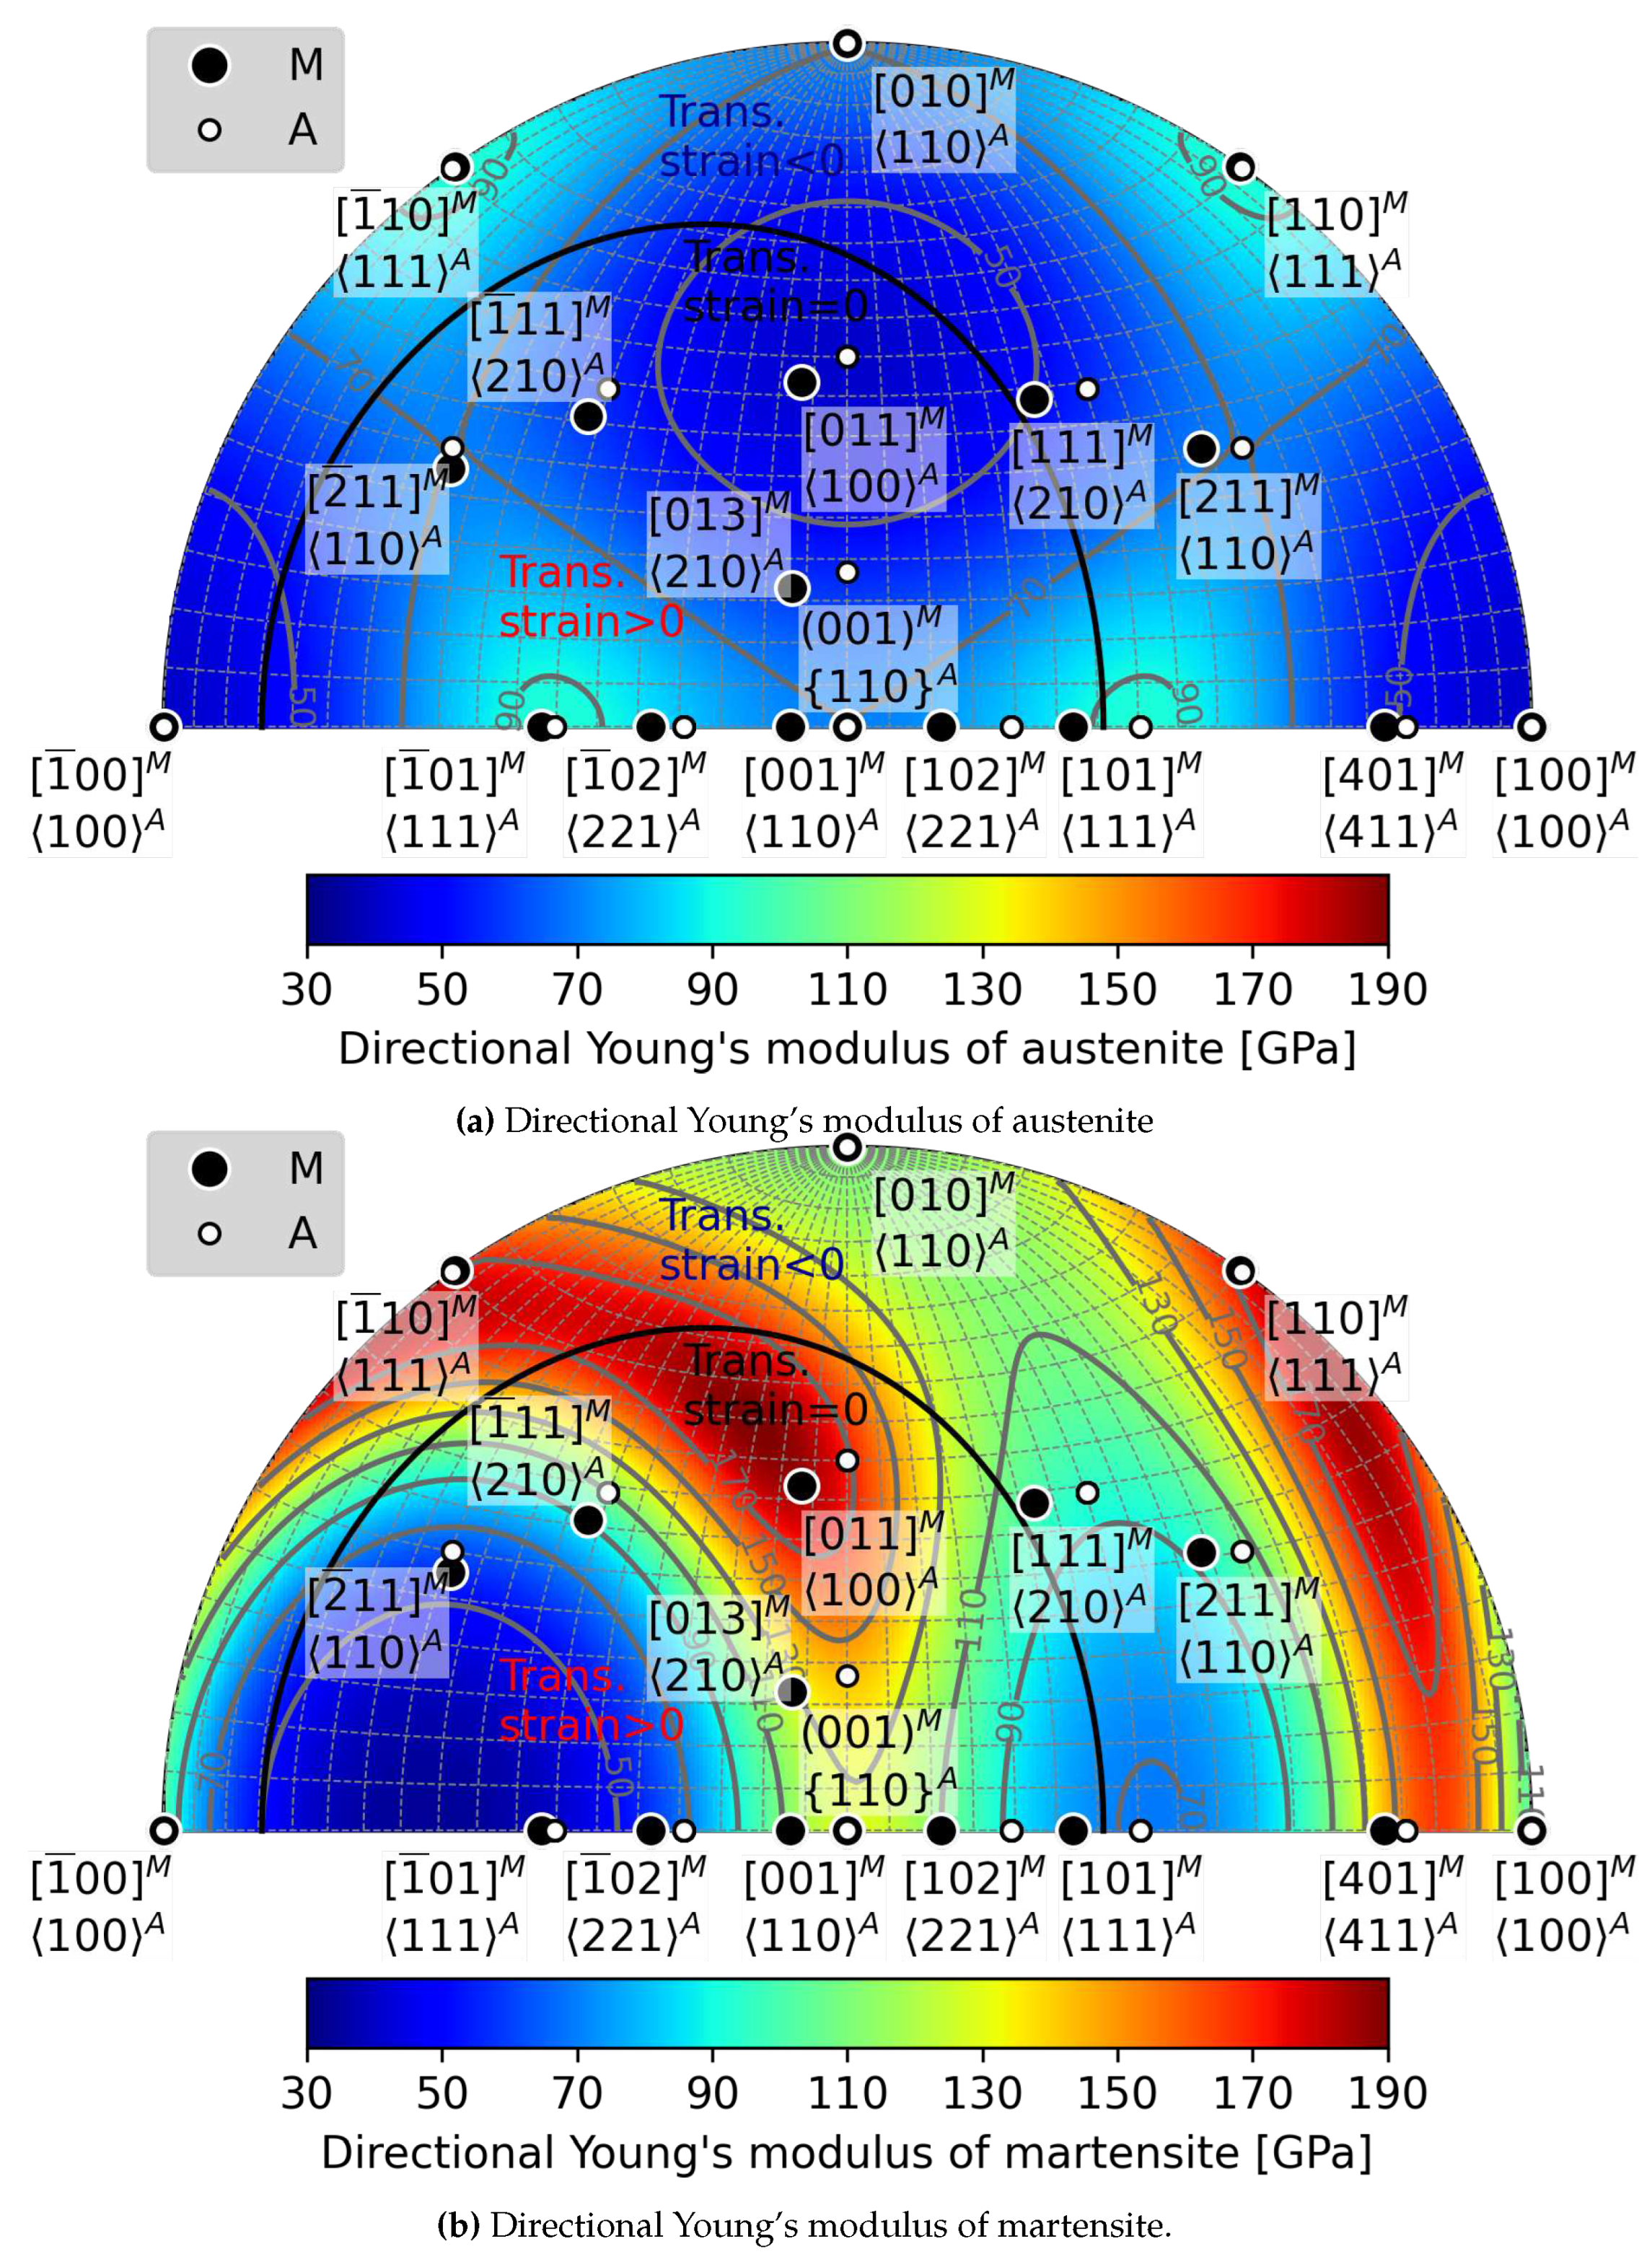
The formation of the habit plane presented in Figure 4a is effectively due to relative differences in the directional Young’s moduli and Poisson’s ratios of the two crystals. The former is presented in Figure 4 for austenite (Figure 4a) and martensite (Figure 4b). For comparison purposes, the are plotted in the common fundamental zone of martensite, taking into account the orientation relationship given by the lattice correspondence. The color mapss in Figure 4 also divide the orientation space into zones of tensile and compressive transformation strains by the black isoline. Note that the actual values of the elastic constants used in this work are described in detail Section 4. Furthermore, the directional Young’s modulus of austenite in the equal-area triangle is shown in Figure A2 in Appendix B.1.
As pointed out in [36,37], the stiffest 111 A austenite direction is near the softest [ 1 ¯ 01 ] M martensite in the zone of tensile transformation strains. Consequently, one can estimate the effect of tensile loading along this direction on the negative value of ε 2 along the perpendicular [ 010 ] M . Since martensite is softer than austenite along [ 1 ¯ 01 ] M , contractions along [ 010 ] M due to Poisson effect will be larger for martensite, thus making the magnitude of ε 2 even larger. One can thus estimate a negative effect of this type of loading on austenite-martensite compatibility. Note that in the zone of tensile transformation strain we do not assume compressive loading and vice versa, since the negative deformation energy does not make physical sense. In the case of compressive loading, the effect of elastic deformation can be estimated for the loading direction [ 010 ] M , i.e., along the direction of ε 2 . In this case, it is the deformation along the loading direction that affects ε 2 , as opposed to the Poisson effect in the previous case. Since martensite is stiffer than austenite along the loading direction, a reduction in the magnitude of ε 2 can be expected, i.e., an improvement in austenite-martensite compatibility. In summary, the effect of elastic deformation on ε 2 depends on the difference in elastic properties, the direction of loading and its deviation from the direction of ε 2 , and the loading mode (tension/compression). In this paper we analyze this dependence and identify the critical uniaxial loading stresses that make ε 2 vanish. It is shown that such conditions can be satisfied only for a subset of loading directions and magnitudes on the order of GPa. We also simulate the effect of austenite instability on the critical stresses. We assume an elastic constant softening C’ and search for its critical value at which ε 2 vanishes for a fixed reasonable value of the loading stress.
Figure 4. Directional Young’s modulus of austenite (b) and martensite (a), both plotted in the coordinate system of the martensite lattice. (a) is based on the set of elastic constants of martensite considered in this paper from the ab-initio calculation [38]. (b) is based on experimental results [33]. The black isoline divides the orientation space into tensile and compressive transformation strain zones. Superscript M and black solid circles denote crystallographic directions of the martensite lattice. Superscript A and white solid circles denote crystallographic directions of the austenite lattice, taking into account the orientation relationship of martensitic transformation in NiTi.
Preprints 88715 g004

4. Methods

The transformation strain and compatibility equation, which consider elastic strains, are essential for determining the presence of a habit plane between elastically strained austenite and martensite. To evaluate these components, we utilized standard PTMC techniques by examining sets of three independent basal lattice vectors from the elastically deformed lattices of both austenite and martensite. The elastically distorted lattice vectors were utilized to compute the transformation deformation gradients, which were then inserted into the compatibility equation for the purpose of verifying the presence of a habit plane. For a thorough description of how transformation deformation gradients between elastically deformed lattices of austenite and martensite were assessed, please refer to Appendix A. The properties are completely dependent on the lattice parameters of the B2 cubic austenite, the B19’ monoclinic martensite, the orientation relationship between the two lattices, their elastic constants, and the applied stress.
As stated in the introduction, we assert that the elastic strain has no impact on the nature of the MT in NiTi, despite its affects on lattice symmetries. Therefore, we consider the same orientation relationship and lattice correspondence as observed under stress-free condition. However, we account for the change in transformation deformation gradients by considering elastically distorted basal lattice vectors of austenite and martensite.

4.1. Equation of Compatibility between Austenite and Martensite under Stress

Austenite-martensite compatibility during stress-induced MT is ensured when the deformation from elastically strained austenite to elastically strained martensite is an invariant plane strain (IPS). This results in a habit plane with a normal n that remains undistorted and unrotated, allowing for the propagation of such a plane and transformation of austenite to martensite without generating lattice defects. PTMC postulates that IPS is a result of the combined effects of a deformation gradient F , which yields an undistorted habit plane, and a suitable rigid body rotation of the martensite lattice Q , ensuring the habit plane’s invariant orientation [39]. In this scenario, the plane strain resulting from the transformation deformation Q F I (where I refers to the identity matrix) is defined by the habit plane normal n and the shape strain vector a in accordance with the compatibility equation [3,5,6]
Q F I = a n ,
where ⊗ denotes outer product. In this study, we examine whether an applied stress σ provides compatibility between B2 austenite and B19’ martensite by testing the compatibility Equation (2) with deformation gradients for elastically deformed lattices (Eq. A20). The Appendix A provides a detailed calculation of the deformation gradients, F i A ( σ ) , i = 1 12 , between the austenite lattice and 12 variants of martensite that are distorted by external stress σ .
Q F i A ( σ ) I = a n ,
To determine if a given deformation gradient satisfies the compatibility Equation (2), we follow the process outlined in Result 5.1 of [3]. The Equation (2) has a solution only when the eigenvalues λ 1 , λ 2 , λ 3 of C = F i A ( σ ) T F i A ( σ ) meet the conditions λ 1 1 , λ 2 = 1 , λ 3 1 , with the eigenvalues arranged in ascending order. Here, the matrix C is Cauchy-Green deformation tensor. Its eigenvalues correspond to the squares of the principal stretches connected to MT. If these conditions are met, Equation (2) has two solutions. These solutions are two pairs of habit plane normal n and shape strain a , both of which are computed from the eigenvalues and eigenvectors. This finding is cited as result 5.1 in [3]. The martensite lattice rotation Q is calculated by inputting each pair of vectors into Equation (2). To quantify the transformation deformation, we utilize the principal transformation strains ε 1 , ε 2 , ε 3 of the Green-Lagrange strain tensor. These quantities are directly correlated to the eigenvalues λ 1 , λ 2 , λ 3 via Equation (3).
ε i = 1 2 ( λ i 1 ) , i = 1 3
In regards to the principal transformation strains (eq. 3), the compatibility Equation (2) has a solution if the transformation deformation is a plane strain, i.e., ε 2 = 0 . This means that an elongation along the third principal direction, i.e., ε 3 > 0 , is compensated by a contraction along the first principal direction, i.e., ε 1 < 0 . As a result, this particular transformation deformation is classified as an IPS. Note that the requirements for ε 1 and ε 3 are fulfilled implicitly due to the nearly volume-preserving transformation of MT in NiTi.

4.2. Considered stress state and lattice correspondence

This study examines only uniaxial tensile and compressive loading in all spatial directions. As elastic deformation is invariant to crystal symmetry operations, it suffices to verify the compatibility Equation (2) for a single lattice correspondence, as long as the loading directions cover the fundamental zone of the lower symmetry monoclinic martensite. The paper presents findings on loading directions within one hemisphere of the martensite lattice space, along with results displayed through equal-area projection. There are exceptions, however, with habit plane normals presented using equal-area projection in the fundamental zone of cubic austenite.

4.3. Numerical implementation

The second principal strain was made to vanish by iteratively solving compatibility Equation (2) through a search for critical loading. This search was conducted using spatial directions within the fundamental zone of monoclinic martensite with a loading range of -10 to 10 GPa. Secondly, the loading was set at -500 MPa and 500 MPa to identify the critical C’ softening point that results in the disappearance of ε 2 . This was done by considering a C’ range between 0.5 and 10 GPa and loading directions within the fundamental zone of monoclinic martensite. The orientation space was discretized by incrementing the angles of spherical coordinates by 2 degrees. The critical value search was performed numerically using a basic Bisection method applied to evaluated dependencies of ε 2 against loading stress and C. These dependencies were iteratively refined around previously estimated roots. When the magnitude of ε 2 reached a value below 10 5 , the iterative process was stopped. The numerical procedure was applied simultaneously to all loading directions by utilizing linear algebra operations on higher-dimensional arrays implemented in the Python package Numpy [40]. This work’s results were calculated in Python by utilizing a downloadable Jupyter notebook containing the author’s modules implementing crystallography computations and visualization tools [41].

4.4. Lattice parameters and elastic properties

4.4.1. Austenite

The lattice parameter of cubic B2 austenite, denoted a A in Appendix A, was assumed to be 3.015 Å according to [3,42]. Experimental methods were used to derive the elastic properties of austenite, including changes during stress-free cooling to the martensite start temperature [33]. Based on these results, a referential set of elastic constants is listed in Table 1. The elasticity of austenite, as defined by this set, exhibits a directional Young’s modulus illustrated in Figure 1. Moreover, it displays primary and secondary stiff directions along 111 A and 110 A , respectively. Conversely, the austenite stiffness is the lowest along the 100 A direction, which is more than two times softer compared to the stiffest direction.

4.4.2. Simulation of Elastic Softening of Austenite

In addition, we simulated the elastic softening of the austenite lattice in the { 110 } A 110 > A shear mode, leading to a reduction of the C A constant defined as C A = C 11 A C 12 A 2 from its referential value C A r (see Table 1). To model the softening of C A , we kept C 44 A constant at its referential value C 44 A r (refer to Table 1). Simultaneously, C 11 A and C 12 A undergo a decrease and an increase from their reference values C 11 A r and C 12 A r (see Table 1) by the same magnitude. This balanced decrease and increase of C 11 A and C 12 A correlates with the aforementioned decline of C A from its reference value C A r by the amount of | Δ C A | = | C A C A r | as presented in Equation (4).
C 11 A = C 11 A r | Δ C A | C 12 A = C 12 A r + | Δ C A | | Δ C A | = | C A C A r |

4.4.3. Martensite

The lattice parameters of monoclinic B19’ martensite, denoted as a M , b M , c M , and β M in Appendix A, were assumed to be 2.889 Å, 4.120 Å, 4.622 Å, and 96.8°, respectively, according to the studies by Otsuka and their use by Bhattacharya (2003). As no experimentally derived elastic constants are available in the literature for a single crystal of B19’ martensite, we used the elastic constants calculated ab-initio (Wagner, 2008) which are listed in Table 2. The directional Young’s modulus exhibits significant anisotropy, with maximum values approaching 190 GPa along the [ 110 ] M , [ 111 ] M , [ 011 ] M , [ 1 ¯ 10 ] M directions and minimum values of approximately 30 GPa and 70 GPa near the [ 1 ¯ 01 ] M and [ 102 ] M directions, respectively. Figure 4b presents a clear visualization of these findings.

5. Results

In this section, we present the impact of tension and compression on ε 2 . Our findings demonstrate that loading enhances austenite-martensite compatibility solely within certain loading directions zones, whose areas increases with increasing loading magnitudes. Furthermore, our results indicate that a critical loading of GPa order is necessary to eliminate ε 2 . Therefore, we demonstrate the enhancement of elastic deformation effects and reduction of critical loading through the simulation of austenite lattice instability using the softening of the elastic constant C.
The findings are displayed through an equal-area projection of loading directions in the martensite lattice space, providing details on the position of the lattice corresponding austenite directions. Every loading direction is assigned a color indicating the visualized result value, such as ε 2 , critical loading or C’, calculated through the assumption of loading along that particular direction.

5.1. Loading direction dependent effects of tension and compression on ε 2

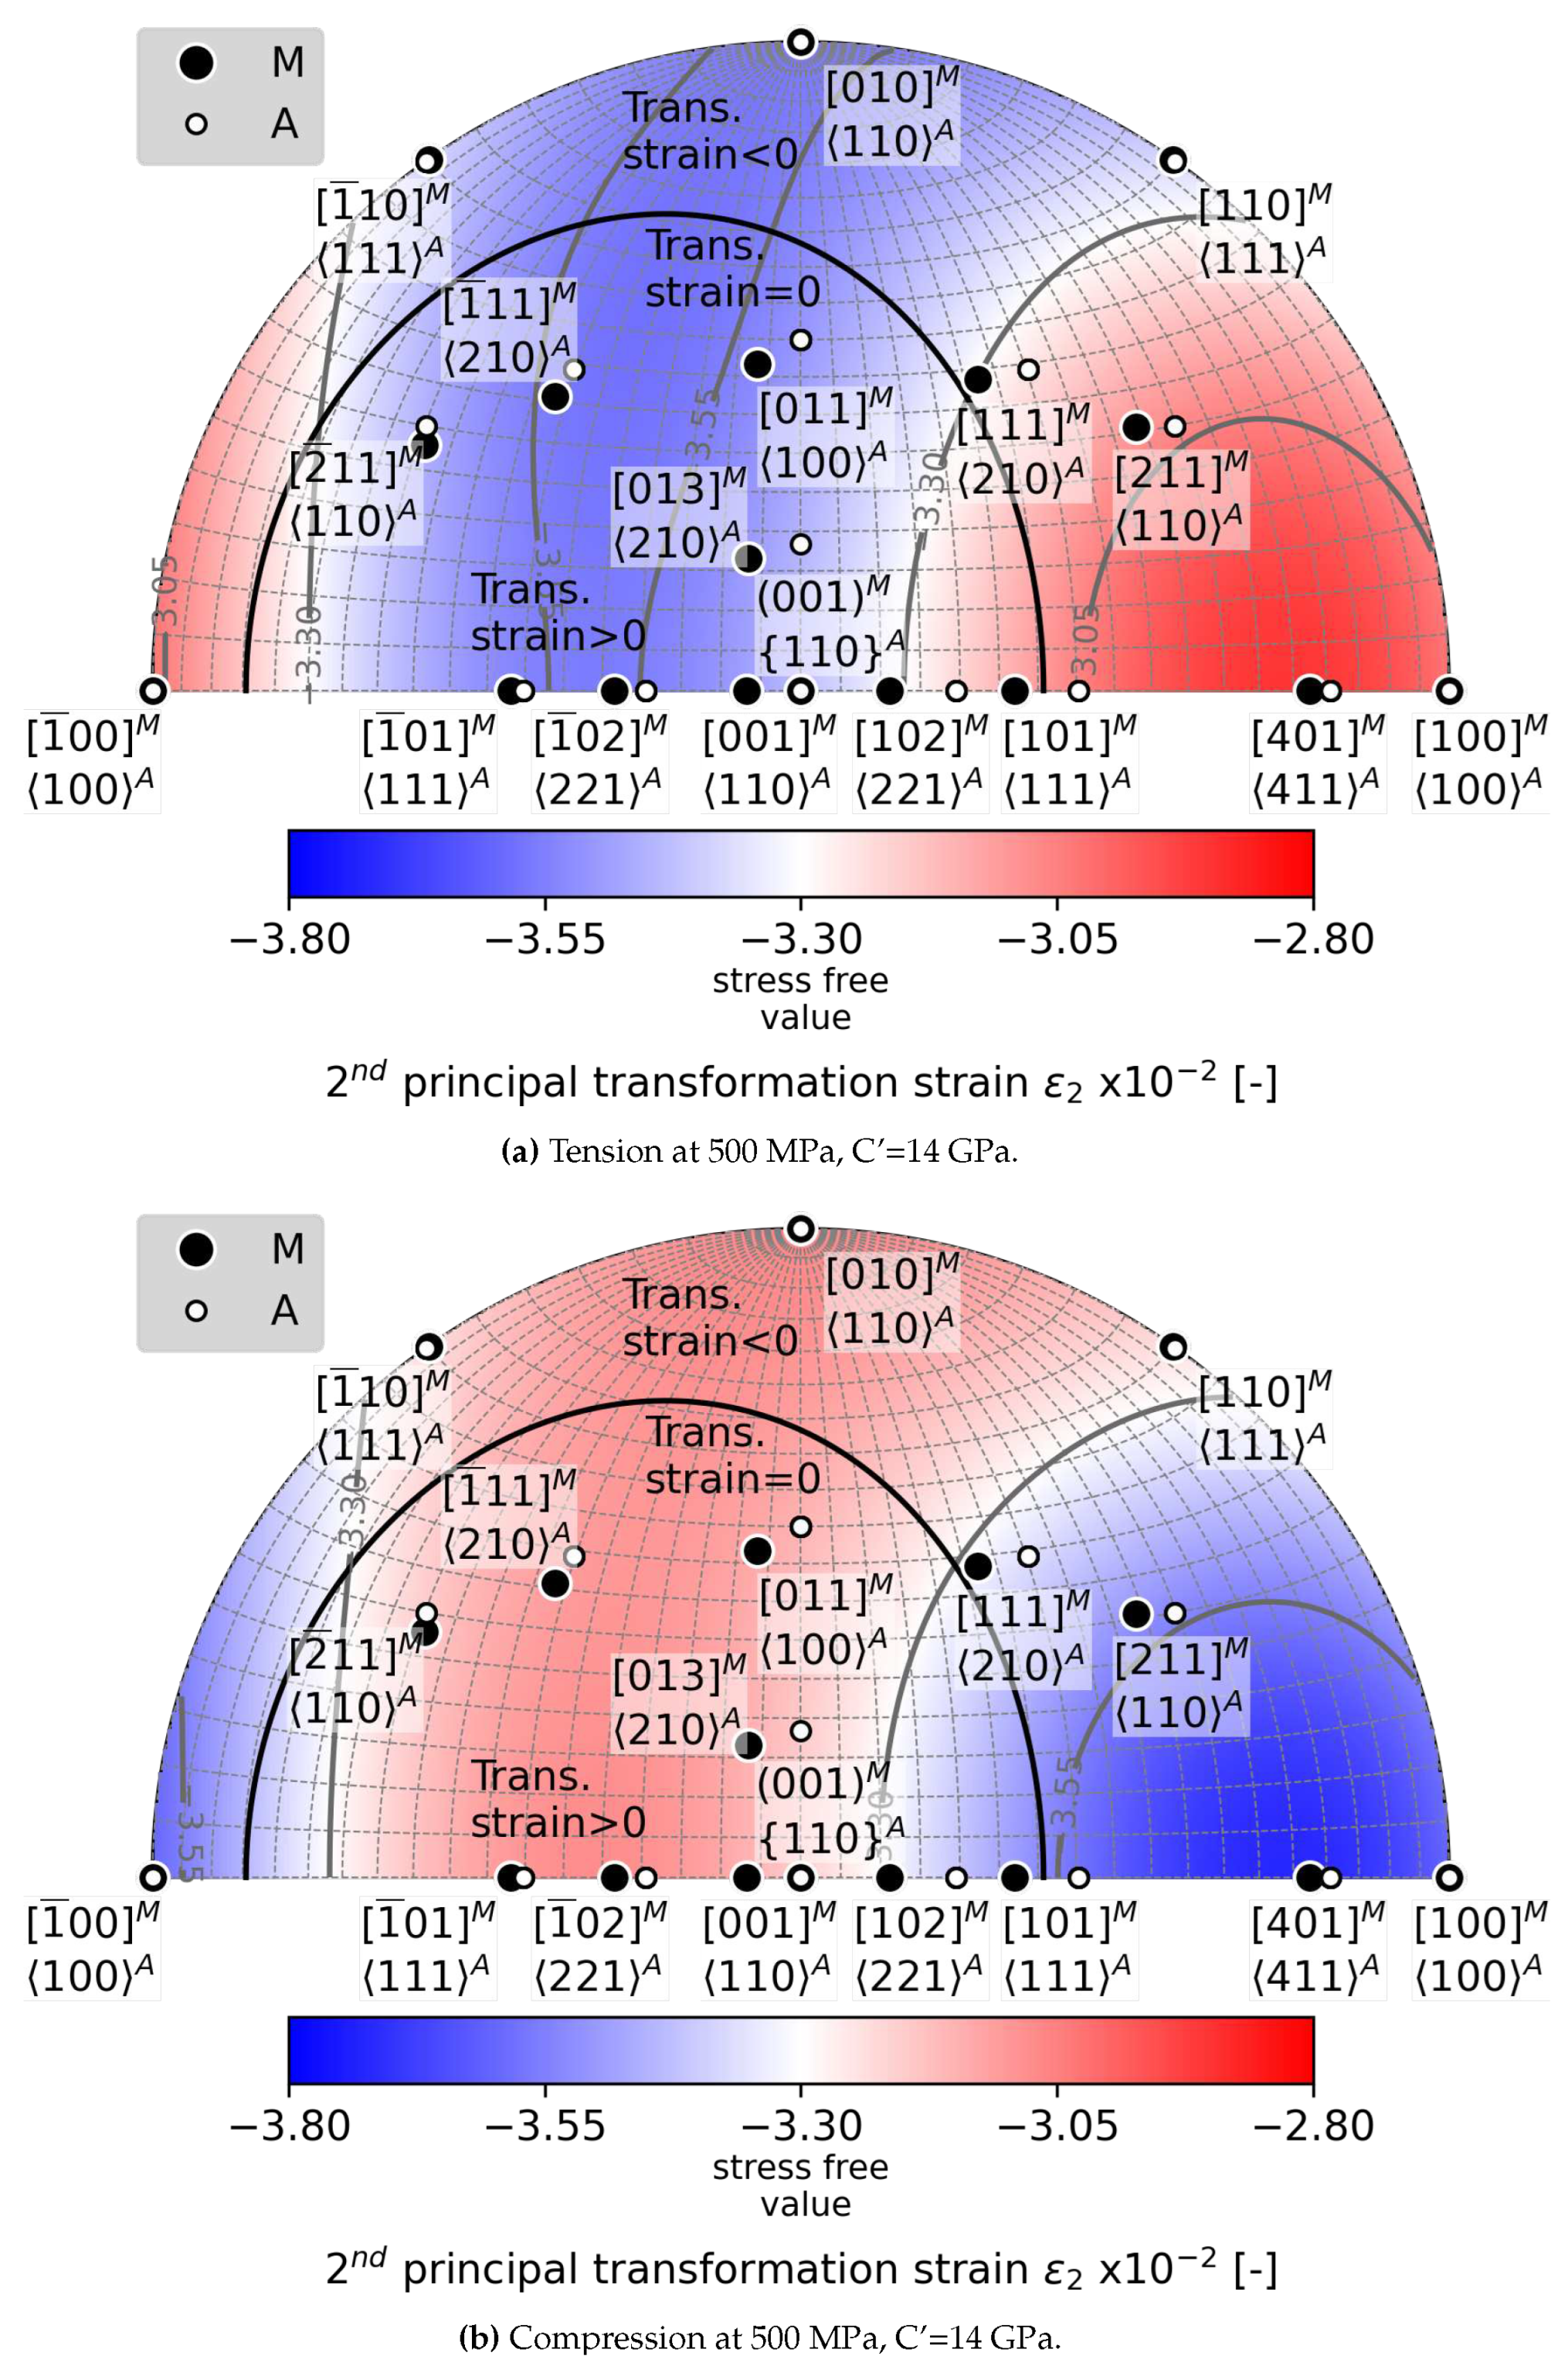
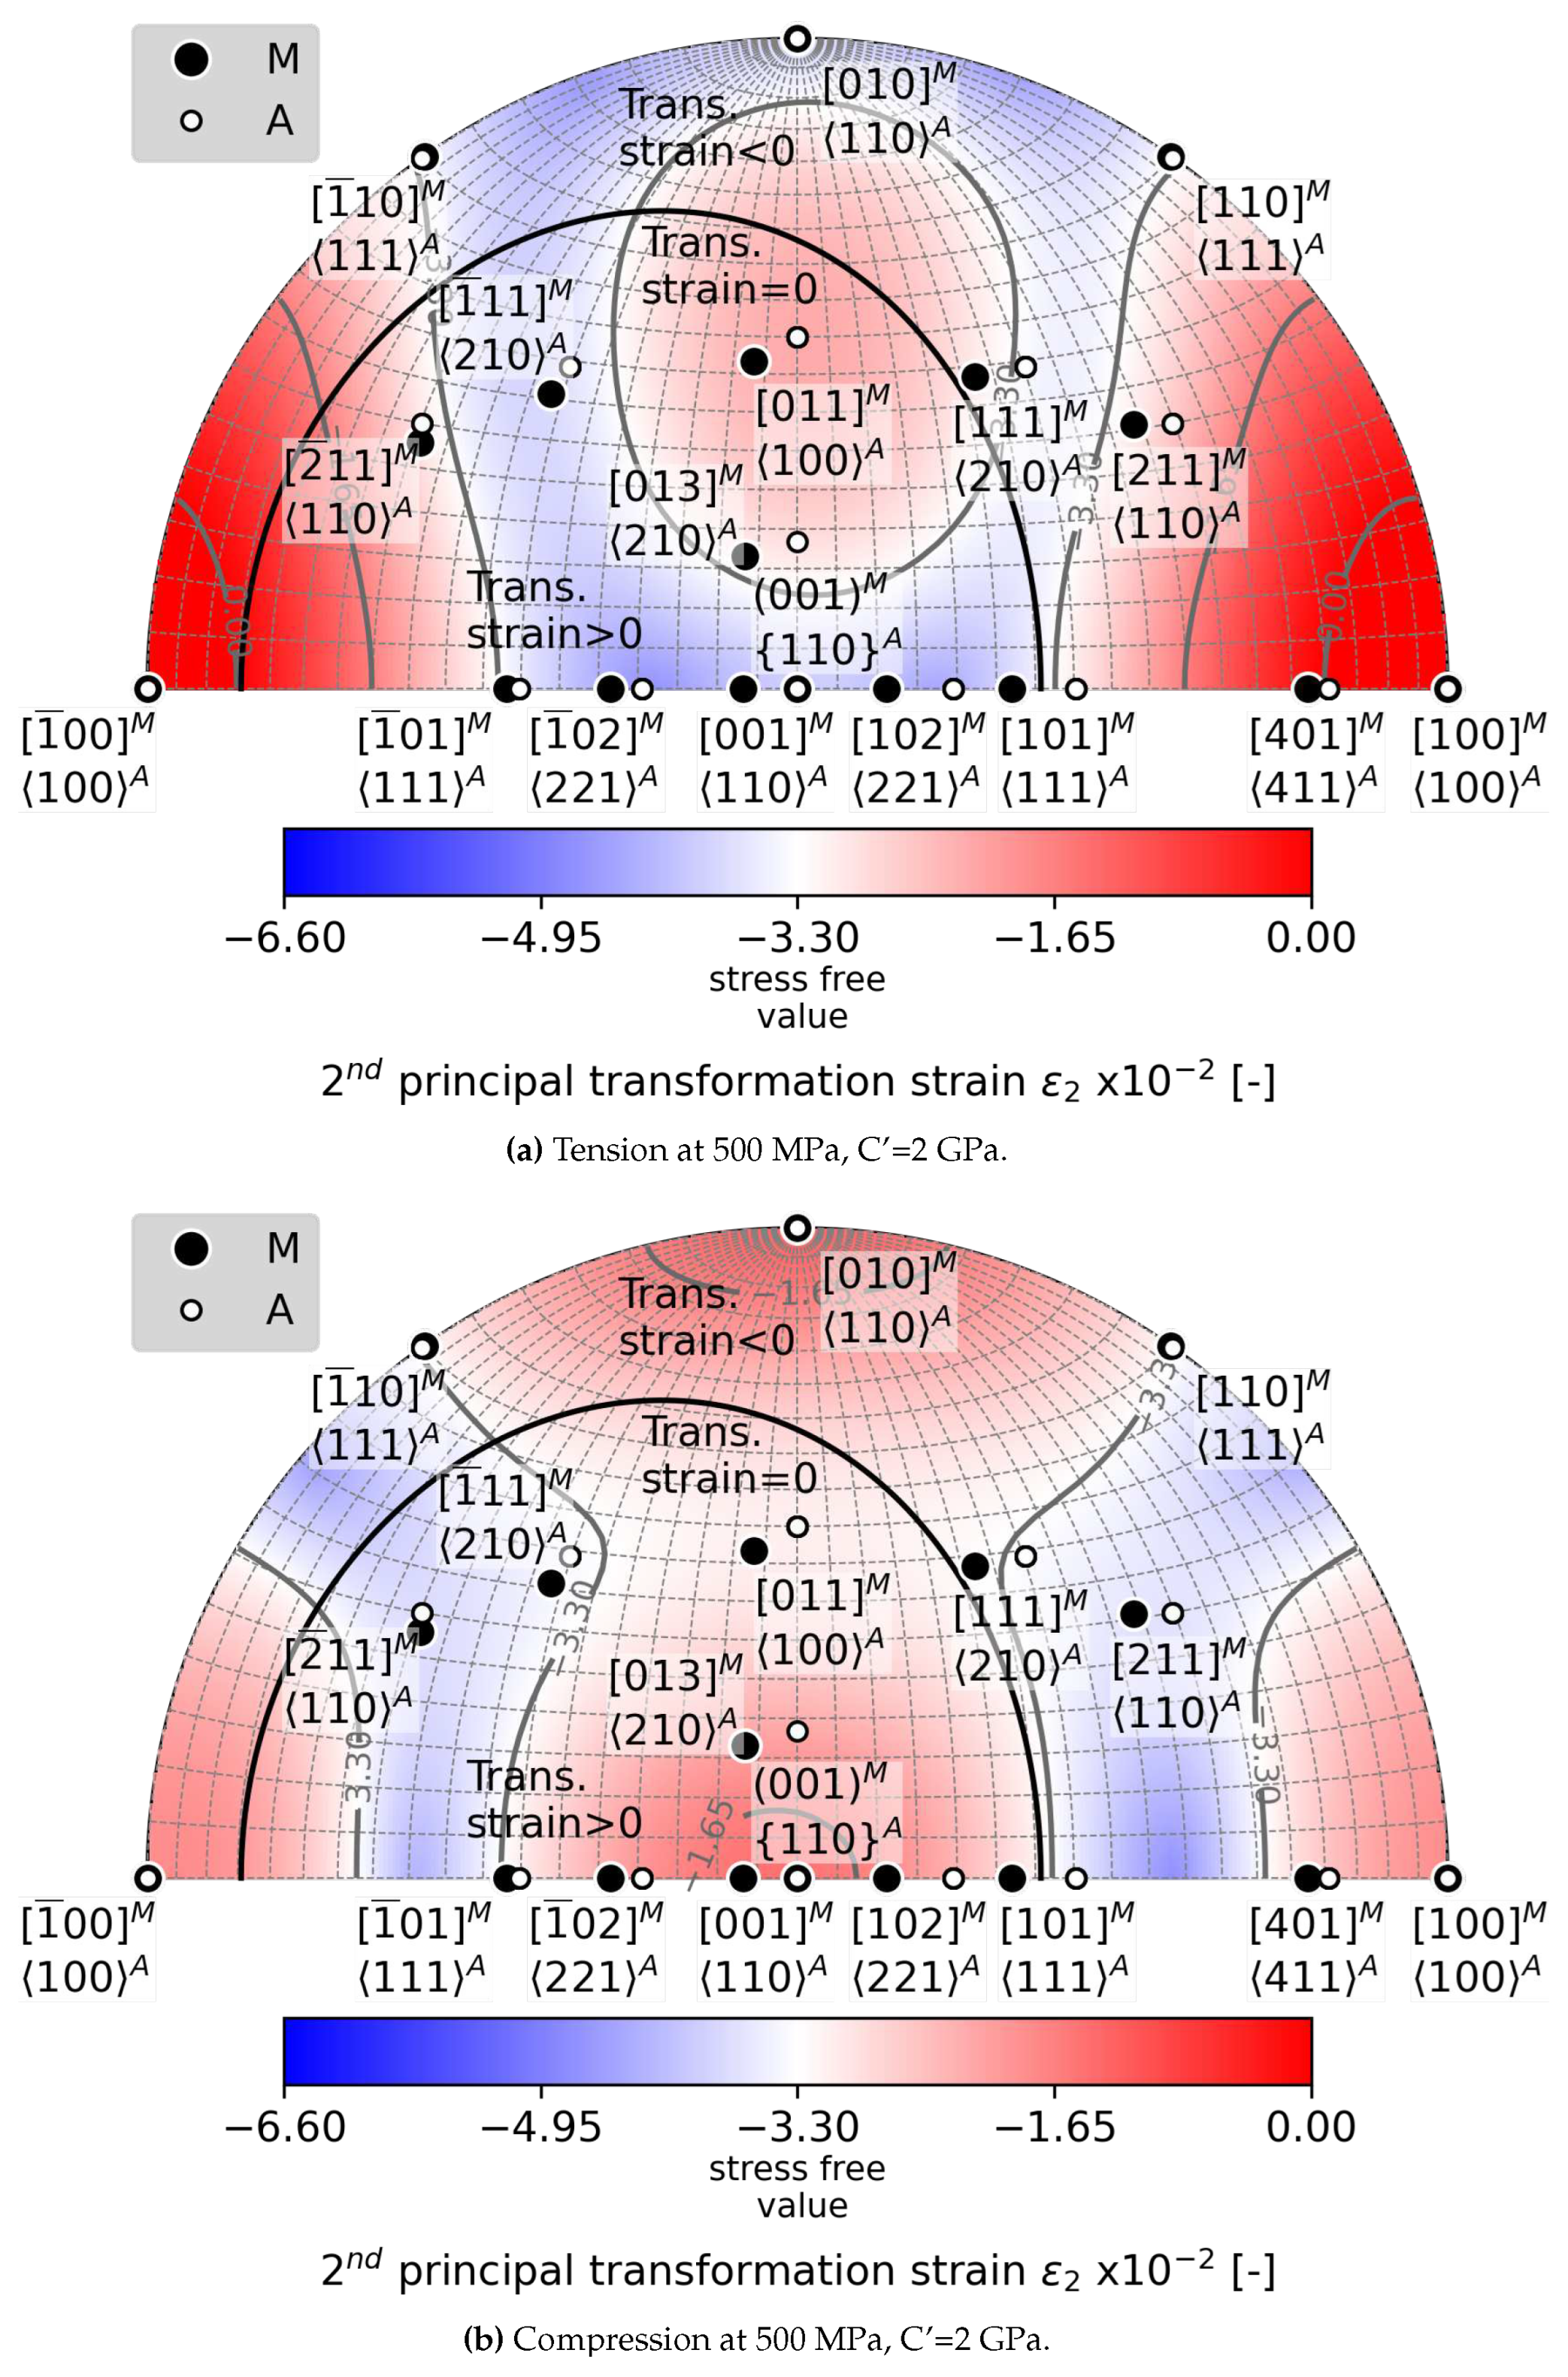
Figure 5 illustrates the effects of 500 MPa tensile and compressive loading (Figure 5a and 5b, respectively) on the value of ε 2 , as computed using sets of reference elastic constants. The red shading indicates reductions in the magnitude of ε 2 , which lead to an improvement in the compatibility between austenite and martensite. Additionally, relevant loading directions for tension fall within the region delineated by the black isoline, where positive transformation strain is present, while relevant loading directions for compression fall outside of this region. Therefore, it is evident from Figure 5b that compression can improve compatibility at orientations ranging from [ 1 ¯ 10 ] M to [ 110 ] M at a relatively common magnitude of loading. In contrast, tension has a limited effect (see Figure 5a) on orientation space near [ 101 ] M and [ 1 ¯ 00 ] M (see Figure 6). Overall, the elastic deformation effects on austenite-martensite compatibility exhibit anisotropy with respect to loading direction and tension-compression loading mode. The elastic effects at 500 MPa can reduce the magnitude of ε 2 by up to 0.3%.
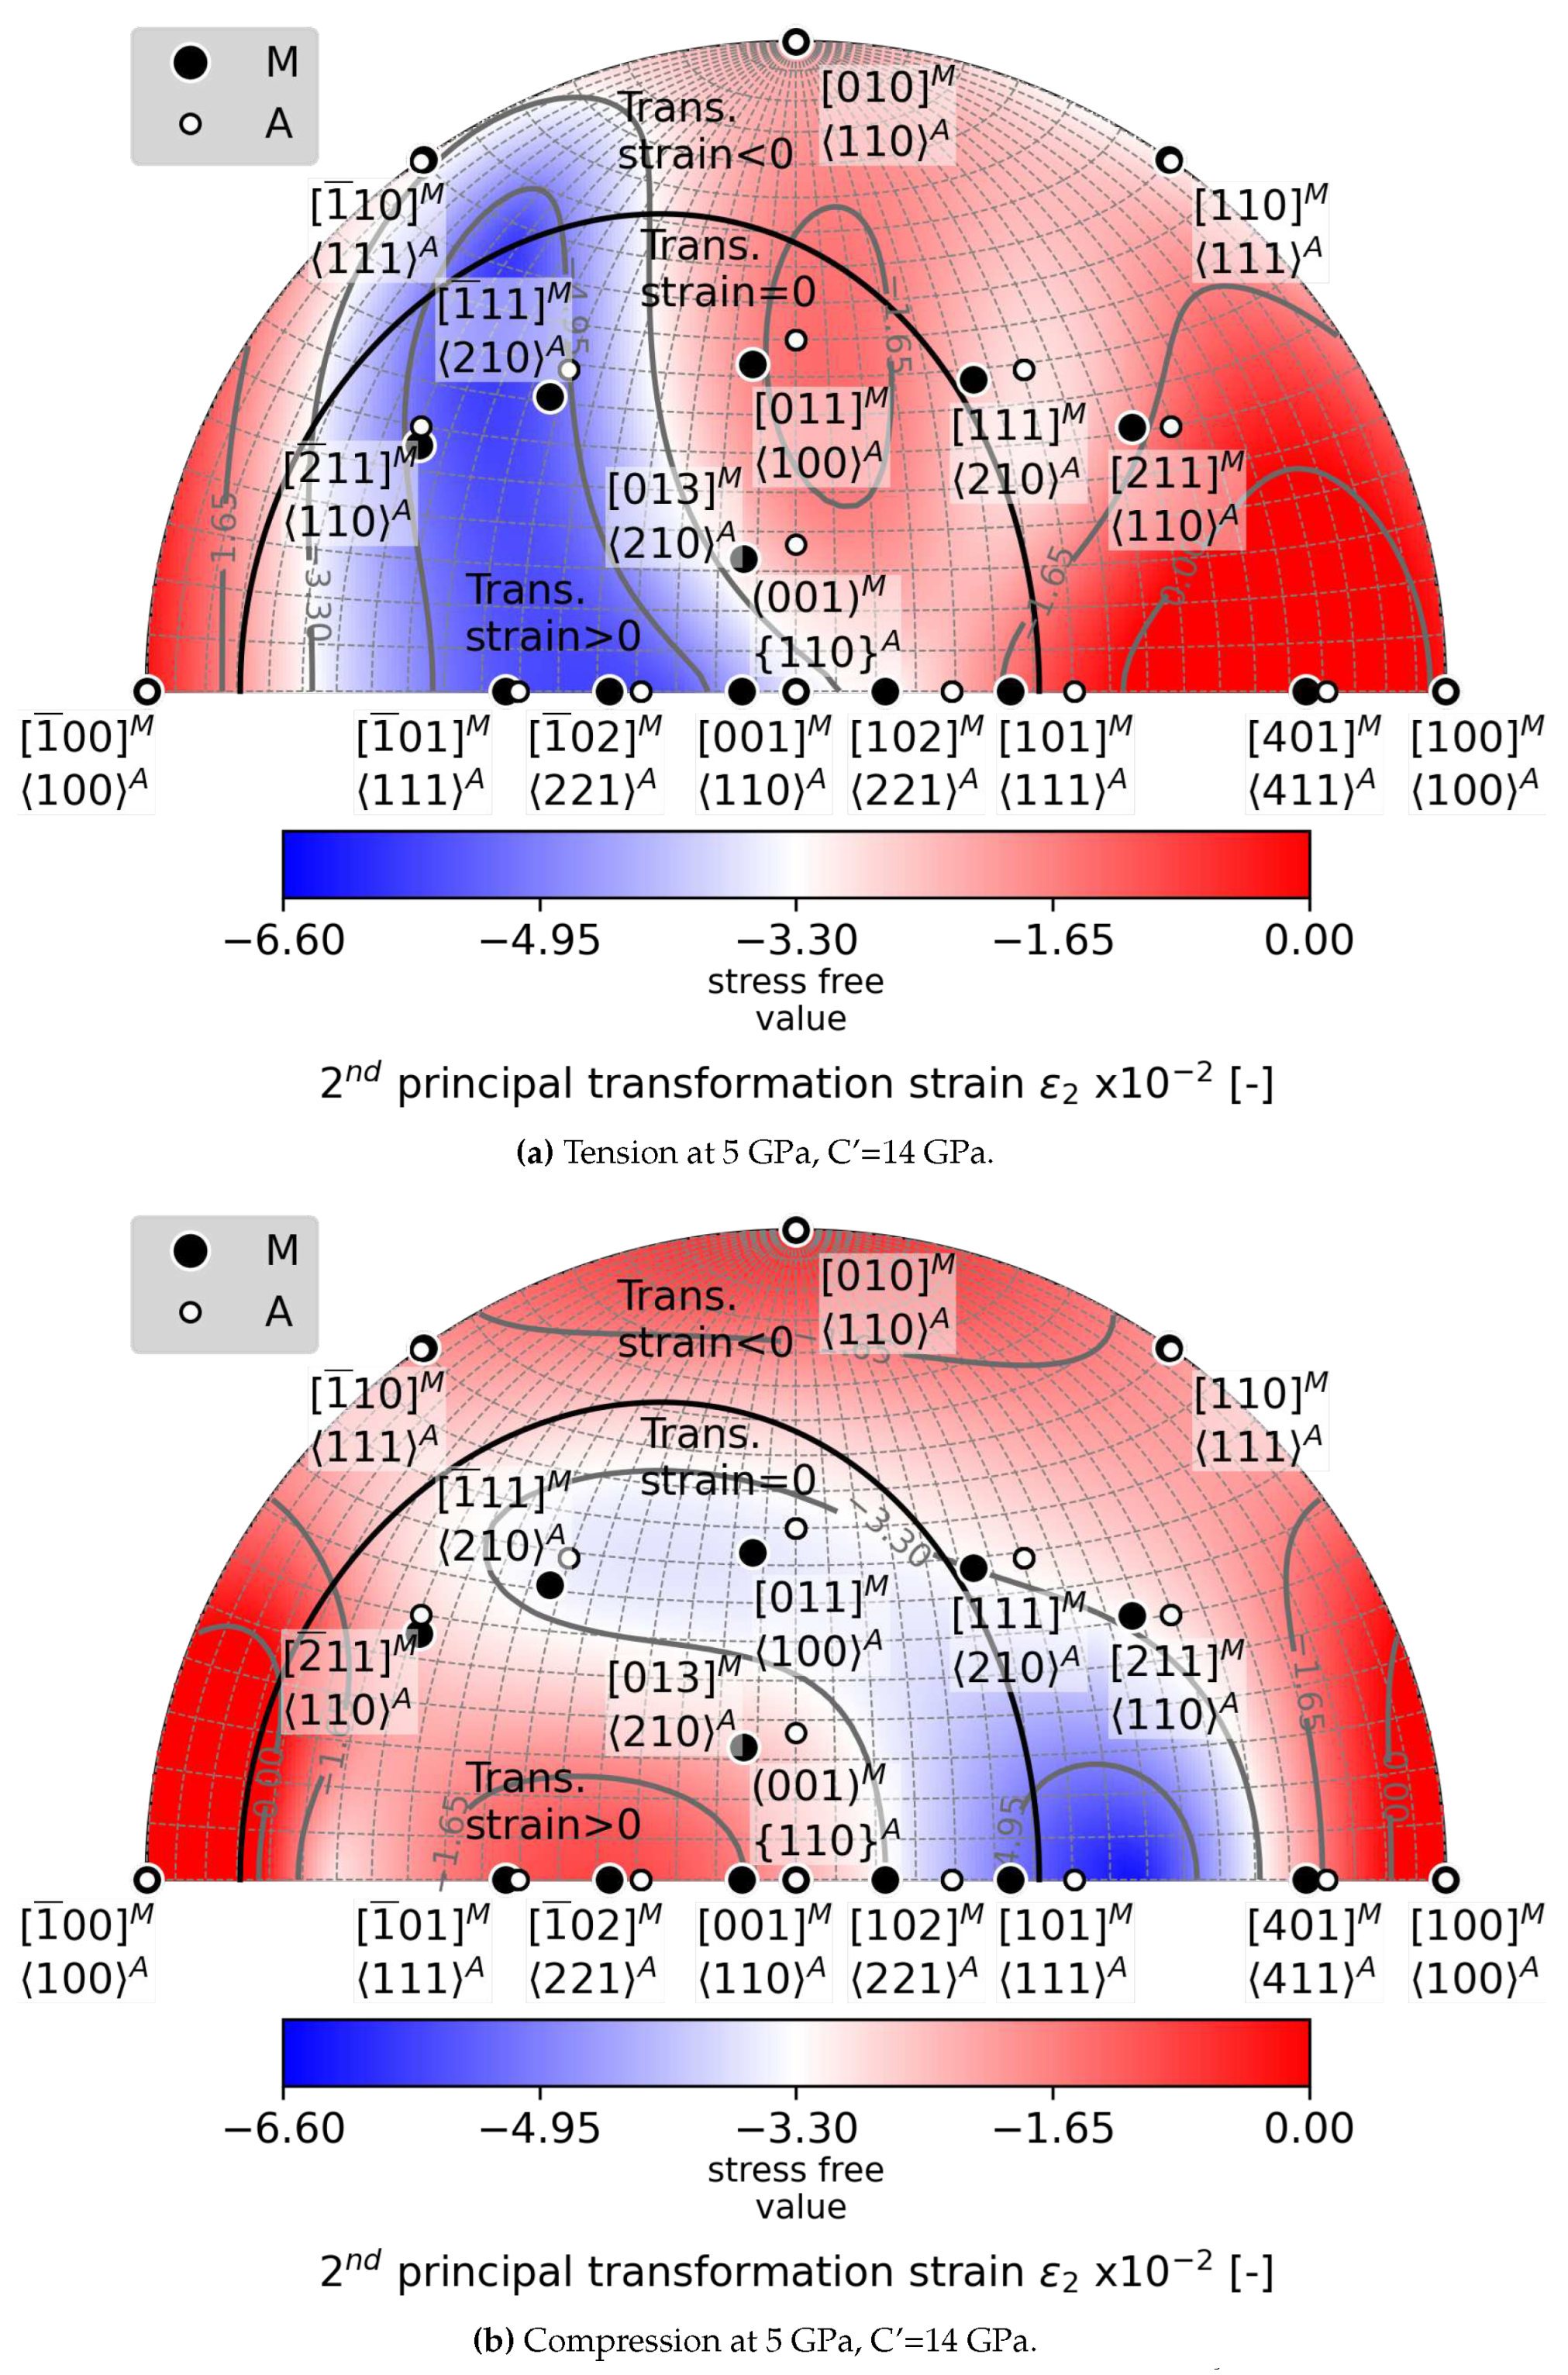
To investigate the impact of increasing loading, we present color maps of ε 2 for a stress of 5 GPa in both tension (Figure 6a and compression (Figure 6b). It is evident that an increase in loading leads to the expansion of the orientation space where it improves the compatibility. This phenomenon is primarily observed in tension, where a new orientation space surrounding [ 011 ] M becomes apparent when comparing Figure 5a with Figure 6a. When compressed, loading in the basal martensite direction [ 100 ] M contributes positively to the compatibility (see Figure 6b), whereas loading at 500 MPa along this direction results in negative effects (see Figure 5b). The enlargement of loading orientation spaces, which improve compatibility, is linked to the direction of ε 2 , that is dependent on loading magnitude. Under stress, the direction of ε 2 deviates from its stress-free direction [ 010 ] M . At 500 MPa, there can be up to 6 degrees of deviation, which rises to over 60 degrees at 5 GPa, as illustrated in Figure B2 in Appendix B.1. Despite the large deformation effects, there is a direct correlation between the magnitude of loading stress and the change in ε 2 .

5.2. Loading Direction Dependent Effects of C’ Softening of austenite on ε 2

Instead of the previously assumed unrealistic loading stress, we hypothesize that there is austenite instability before stress-induced MT. To simulate this, we soften the austenite C’ elastic constant. We calculated ε 2 to understand the impact of lattice softening for both tensile and compressive loading at 500 MPa and a C’ of 2 GPa. This is seven times lower than the 14 GPa measured under stress-free conditions. The results are presented in Figure 7 through loading direction dependencies of ε 2 . Comparing the results presented in Figure 3 and Figure 4, assuming a C’ value of 14 GPa at two different stress levels, with the results shown in Figure 5, we can analyze the contrast between the effects of C’ softening and an increase in loading stress. It is concluded that C’ softening amplifies the effects of elasticity similarly to an increase in loading stress. Elastic deformation caused by external loading can significantly enhance austenite-martensite compatibility when subjected to reasonable stress, provided that the austenite lattice softens in the 110 A 110 5 shear mode.

5.3. Critical Uniaxial Loading Ensuring Austenite-Martensite Compatibility

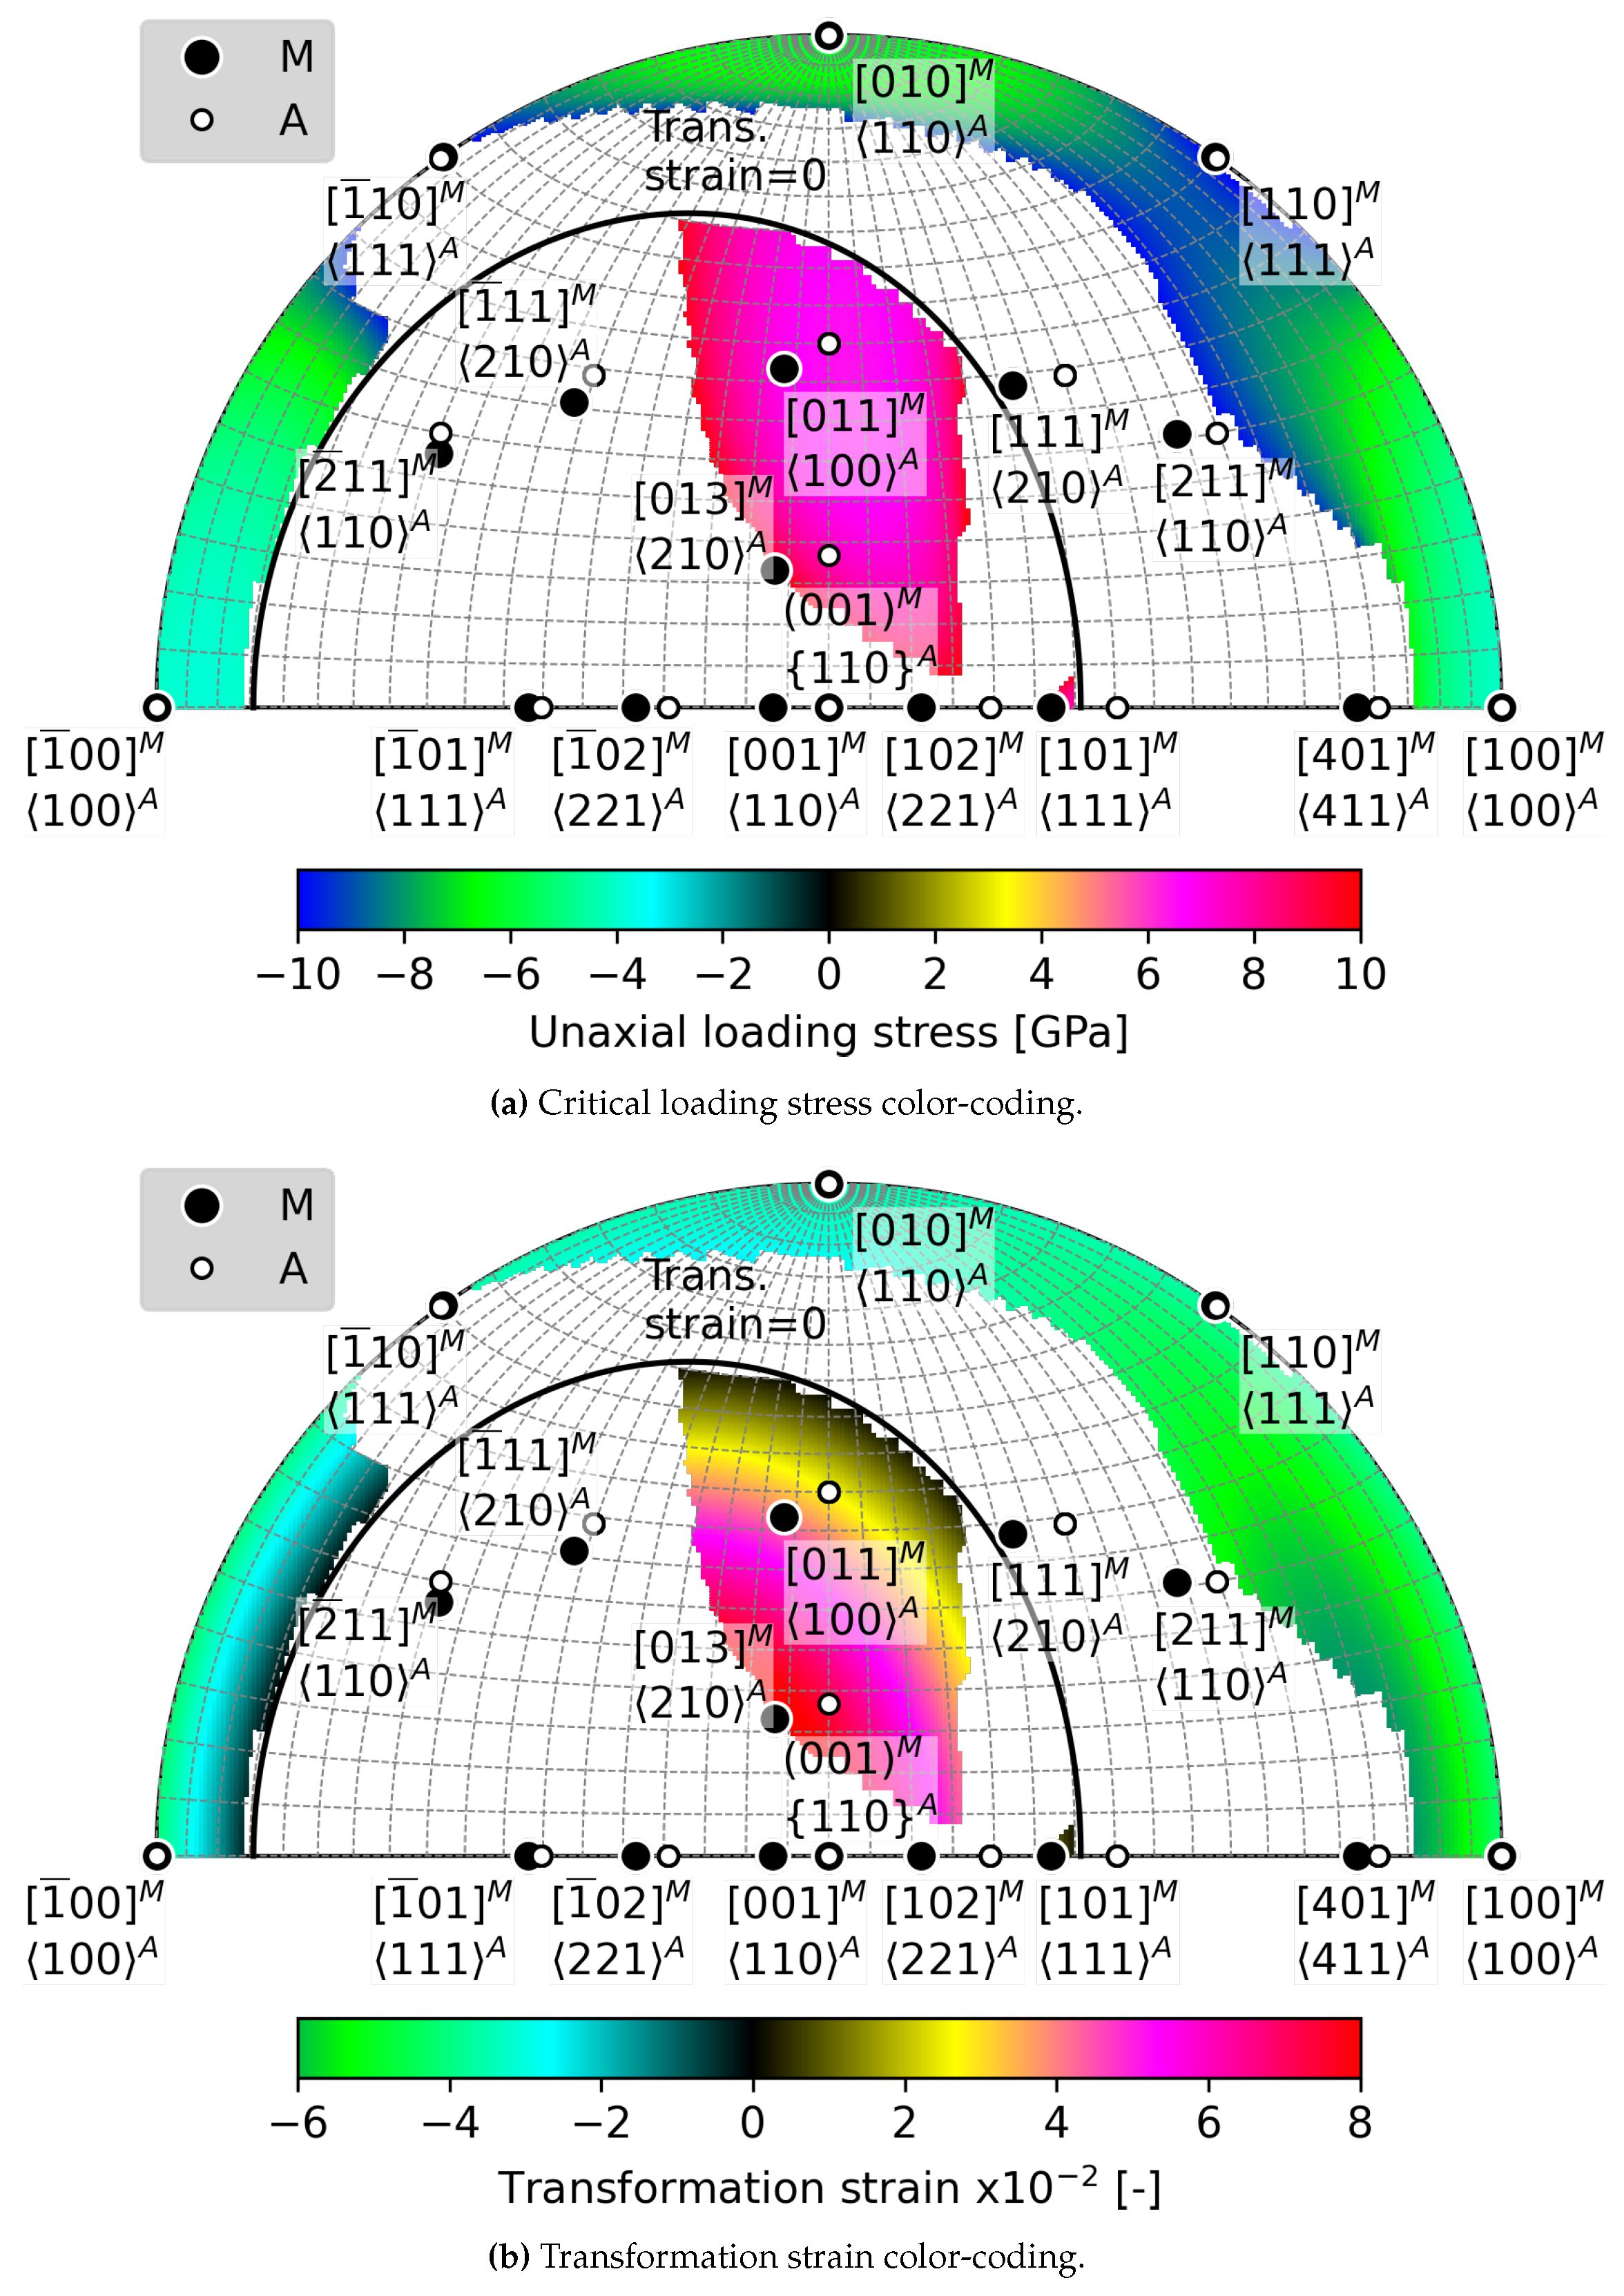
Figure 8 depicts the regions of loading direction where a critical loading stress causes the vanishing of ε 2 , ensuring the habit planes’ existence between austenite and a single variant of martensite. The color map in Figure 8a displays these regions colored based on critical loading stress while Figure 8a based on the transformations strain in the loading direction. The results were obtained with loading stress limits ± 10 GPa by assuming a magnitude of ε 2 be lower than 10 5 that was fulfilled in depicted regions as shown in Figure A4 in Appendix B.1. The evolutions of ε 2 against loading stress were inspected and revealed divergent tendencies from ε 2 = 0 for loading directions outside of the colored regions. As a result, austenite-martensite compatibility is not improved by elastic deformation from loading along these directions. Note that interactive version of the graphs in Figure 8, Figure 9, Figure 11, Figure 12 can be downloaded here.
Differences are apparent in the results for tension and compression. The orientation zone’s area of critical loading in compression is larger in compression, and critical stresses associated with it are lower in magnitude than those in tension. Specifically, the critical stress range of critical stresses in compression begins at -3 GPa, while in tension, it starts at 6 GPa. Furthermore, there are three low index austenite directions 100 A , 111 A , 110 A associated with orientations of critical loading in compression making ε 2 vanish. In contrast, the critical loading in tension accompanied with a considerable transformation strain comprises only orientations around 100 A .
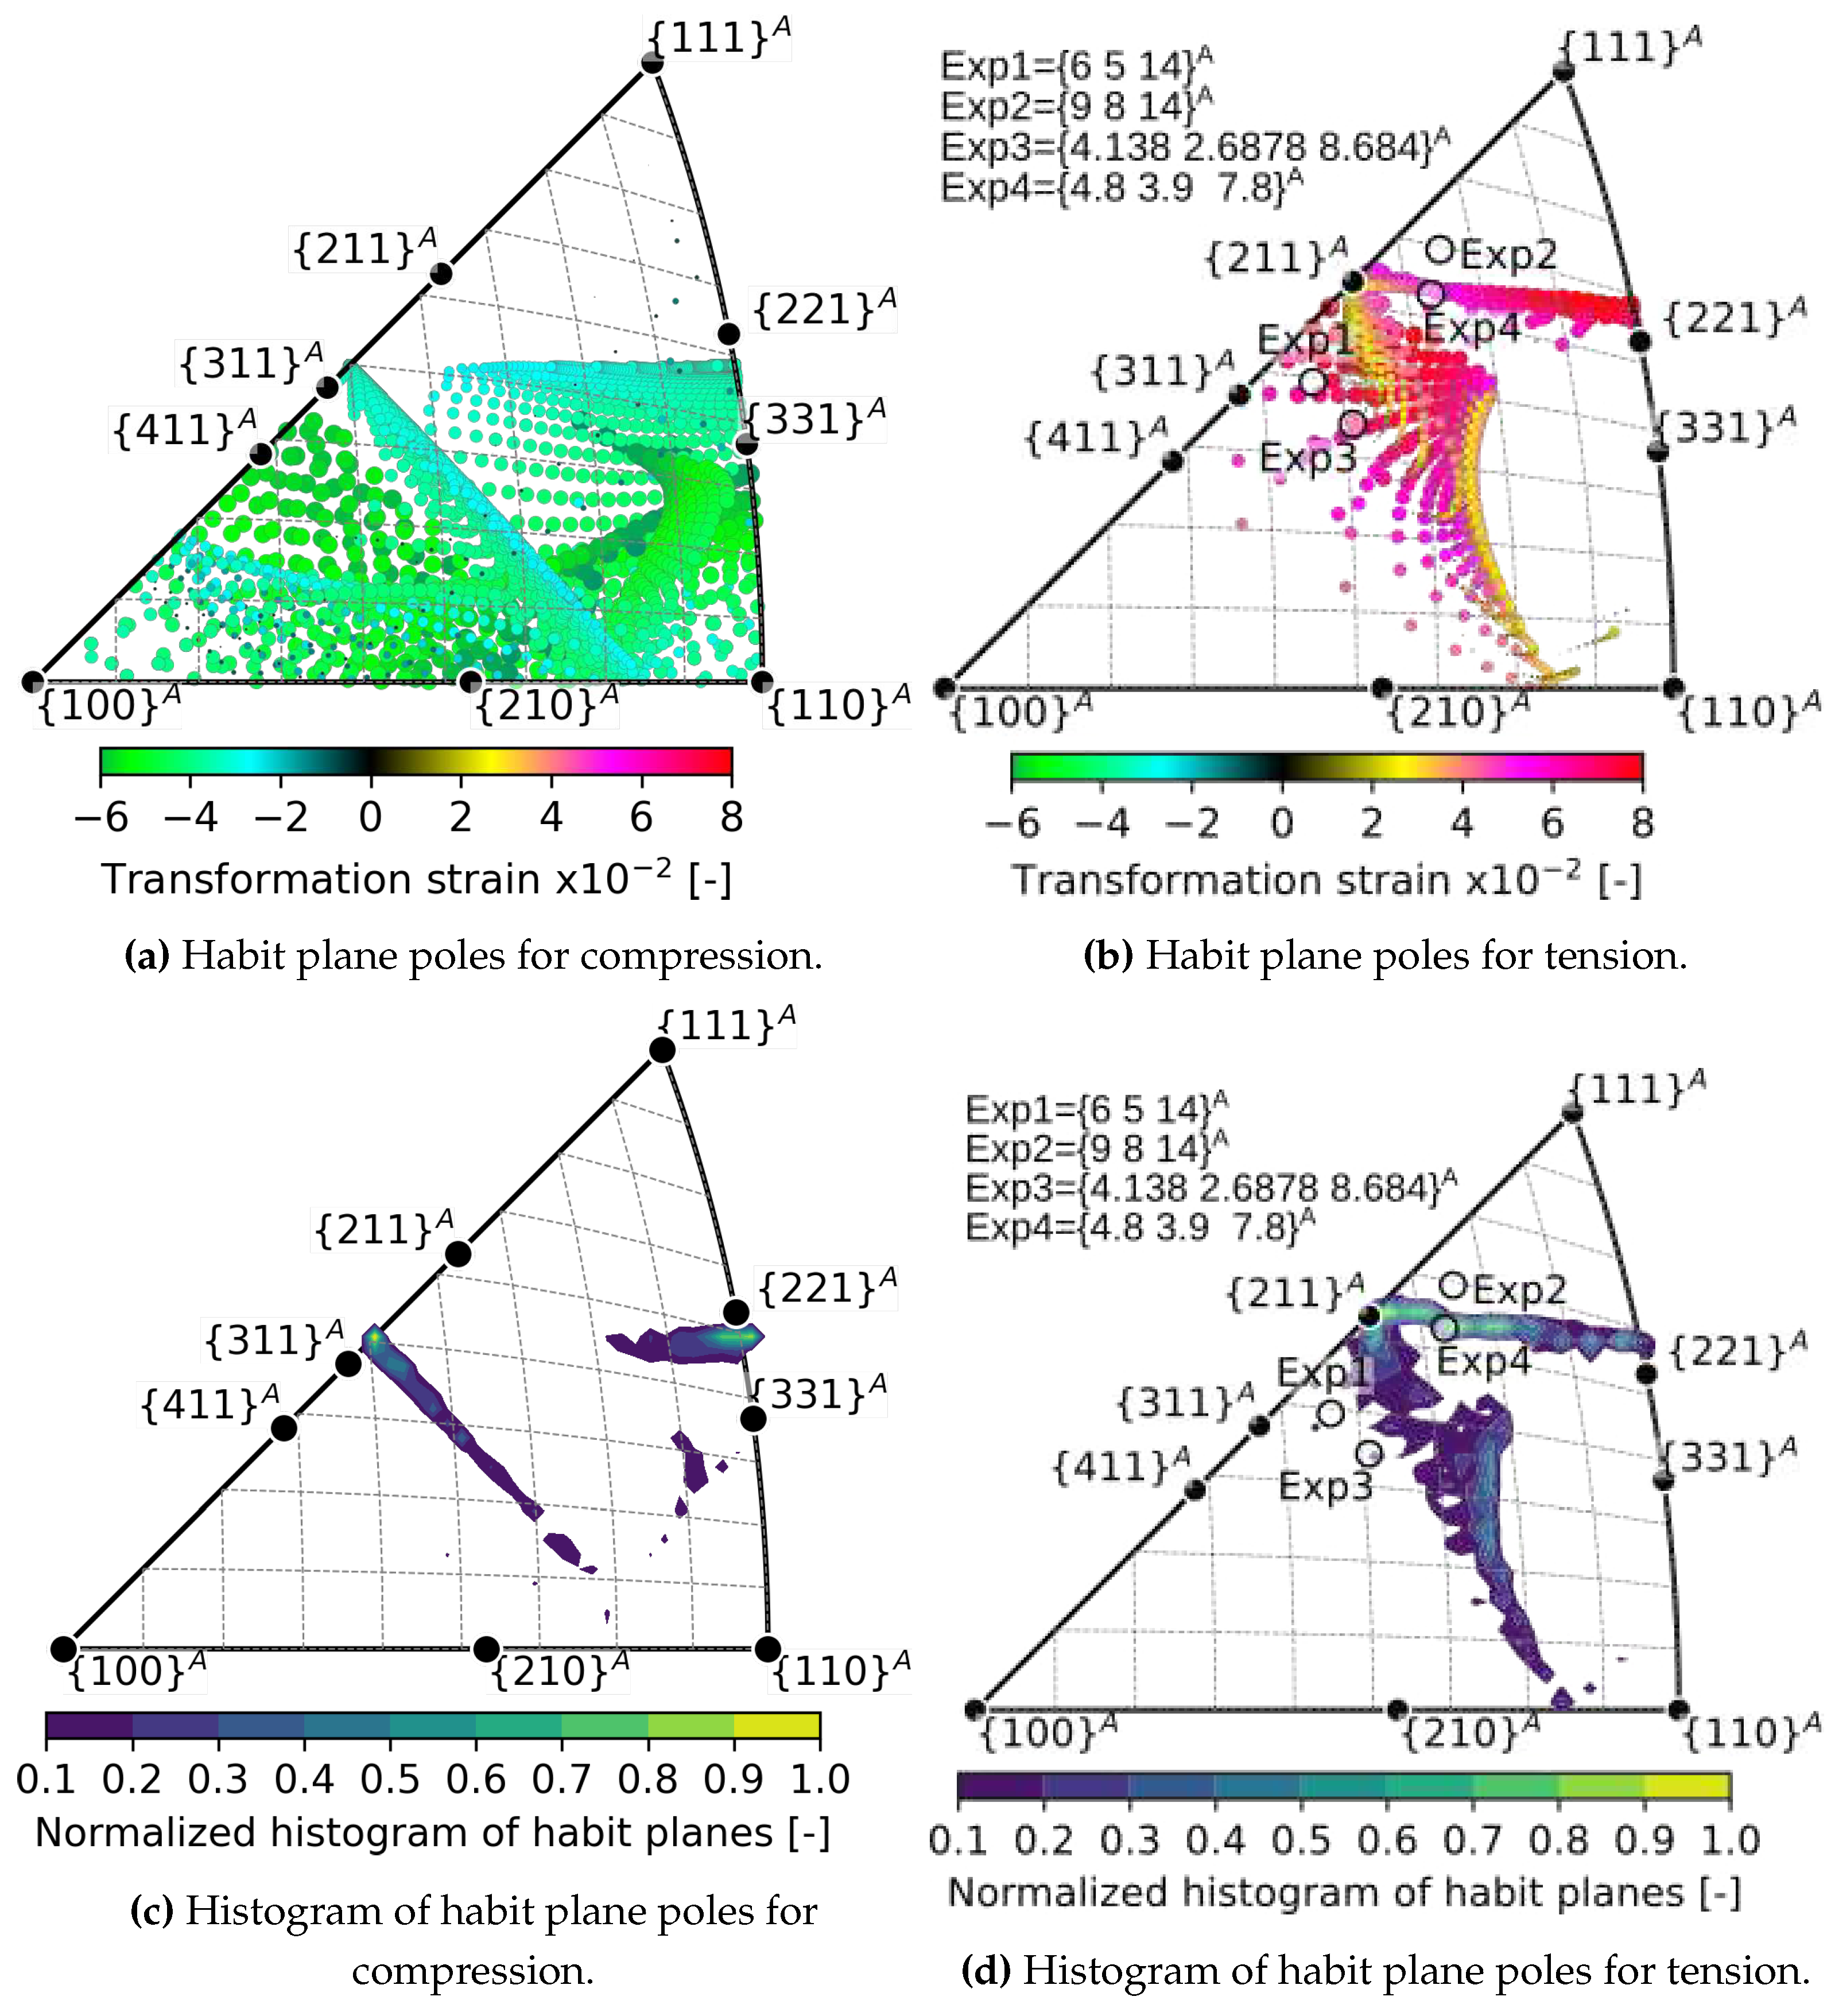
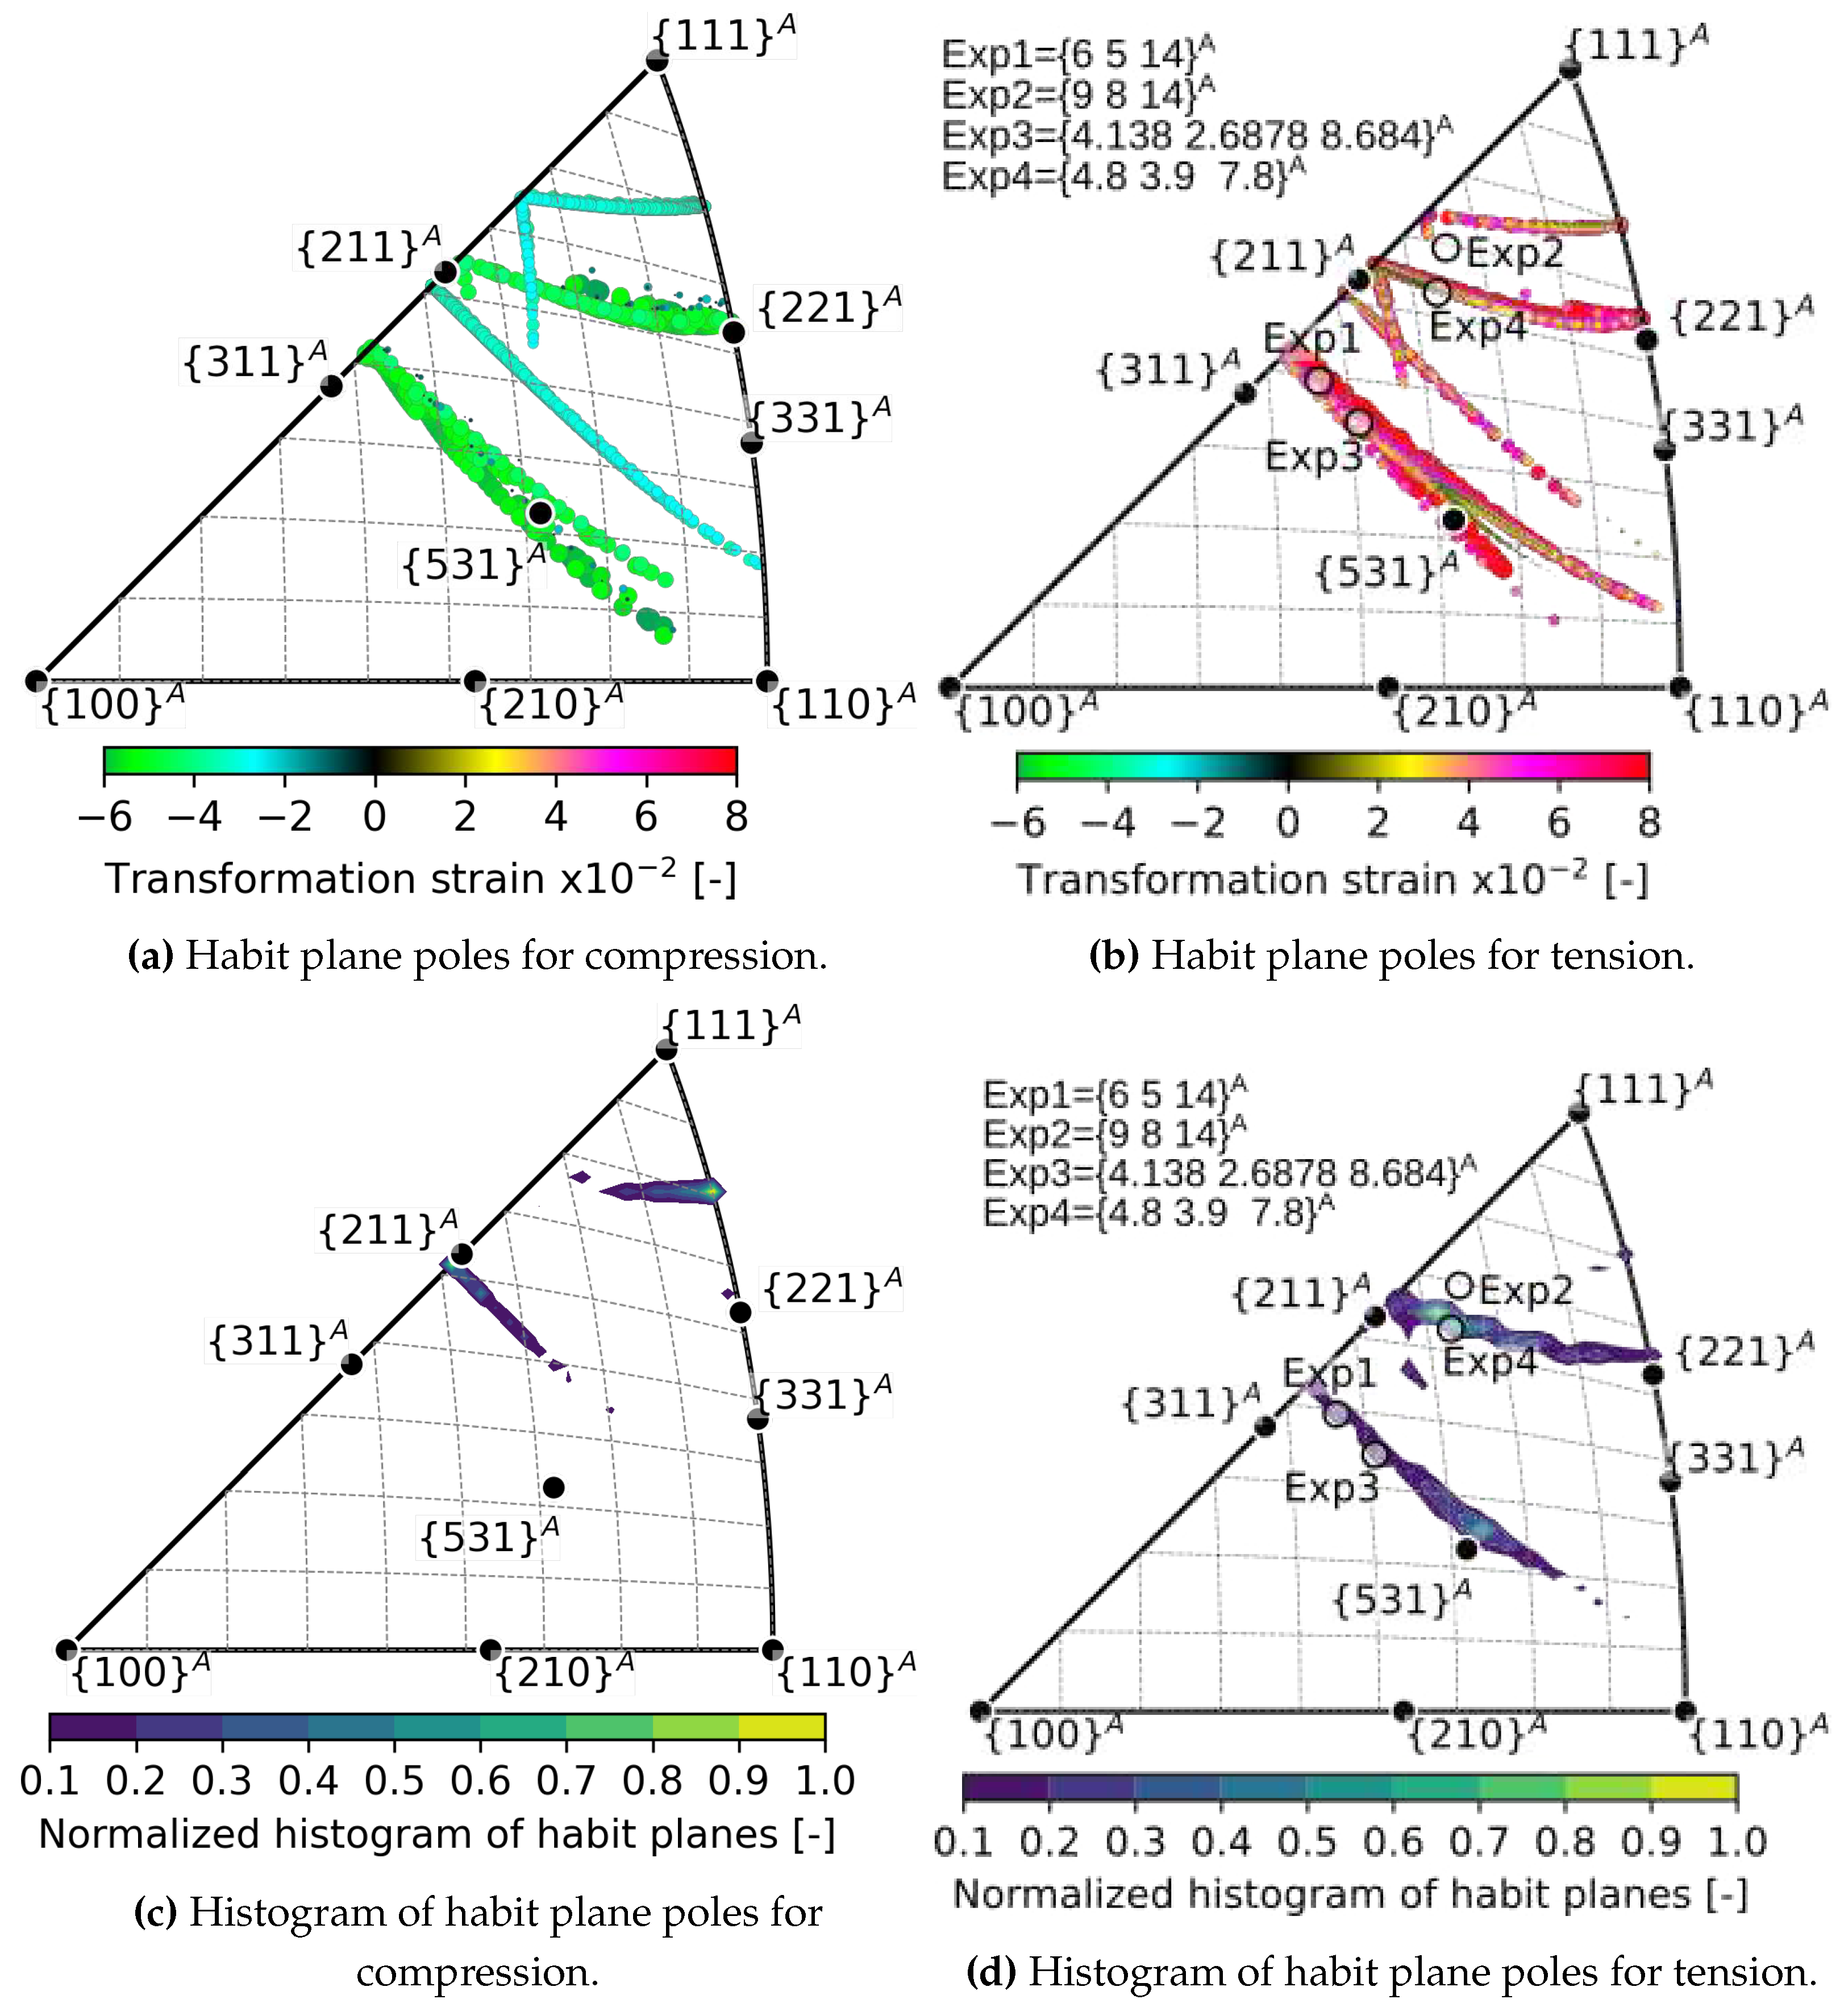
Consequently, the poles of habit planes between austenite and a single variant of martensite induced by critical compression loading, as shown in Figure 9a, cover a larger orientation space in austenite compared to the case of tension shown in Figure 9b. Note, that the visualization of habit planes poles in Figure 9 reflects the discrete nature of the computations in this work based on discretized orientation space of loading directions. Additionally, the habit plane poles in Figure 9 are scaled and color-coded based on the associated transformation strain into the loading direction. The histograms of habit plane normals displayed in Figure 9c for compression and in Figure 9d for tension reveal the most frequently represented habit planes. It should be noted that the histograms are weighted based on the magnitude of the transformation strain connected with each habit plane and normalized to the maximum of the bin counts. The compression histogram shows that the most frequent habit planes are in the vicinity of { 311 } A and { 221 } A . The most commonly occurring habit planes under tension are situated near { 211 } A , extending from this pole towards { 221 } A . In addition, low-index habit planes are dispersed in the central region of the equal-area triangle.
The most frequent habit planes for tension include those providing the largest transformation strains above 8 % as evident from the comparison of Figure 9d with Figure 10b. On the other hand, the most frequent habit planes for compression exclude those associated with largest compressive transformation strains (compare Figure 9c with Figure 10a). The latter with transformation strain magnitudes large than 5 % in compression spans from the pole { 210 } A towards the pole { 331 } A and towards the pole { 411 } A as displayed in Figure 10a

5.4. Compatibility of austenite and martensite under uniaxial loading and austenite C softening

The results presented here stem from investigating habit planes under the influence of tensile or compressive stress of 500 MPa, and a reduction in the C’ elastic constant. In this scenario, tension is the prominent loading mode compared to compression, providing more extensive orientation space for loading that leads to habit planes between austenite and a single variant of martensite. As shown in Figure 11, only compression centered around two { 110 } A poles results in ε 2 becoming zero at critical C’ values. These areas comprise only a small portion of the entire orientation space for negative transformation strains. On the other hand, the loading-orientation space, where the habit plane could form under a 500 MPa tensile stress and with appropriate C’ softening, accounts for over half of the positive transformation strain orientation space. Nevertheless, the orientations centered around the maximum transformation strains along { 221 } A are excluded from the orientation space in which the habit plane can form under stress. Note that interactive version of the graphs in Figure 8, Figure 9, Figure 11, Figure 12 can be downloaded here. Furthermore, Figure A2 in Appendix B.1 can be checked for the correctness of compatibility solutions that required magnitudes of ε 2 be lower than 10 5 .
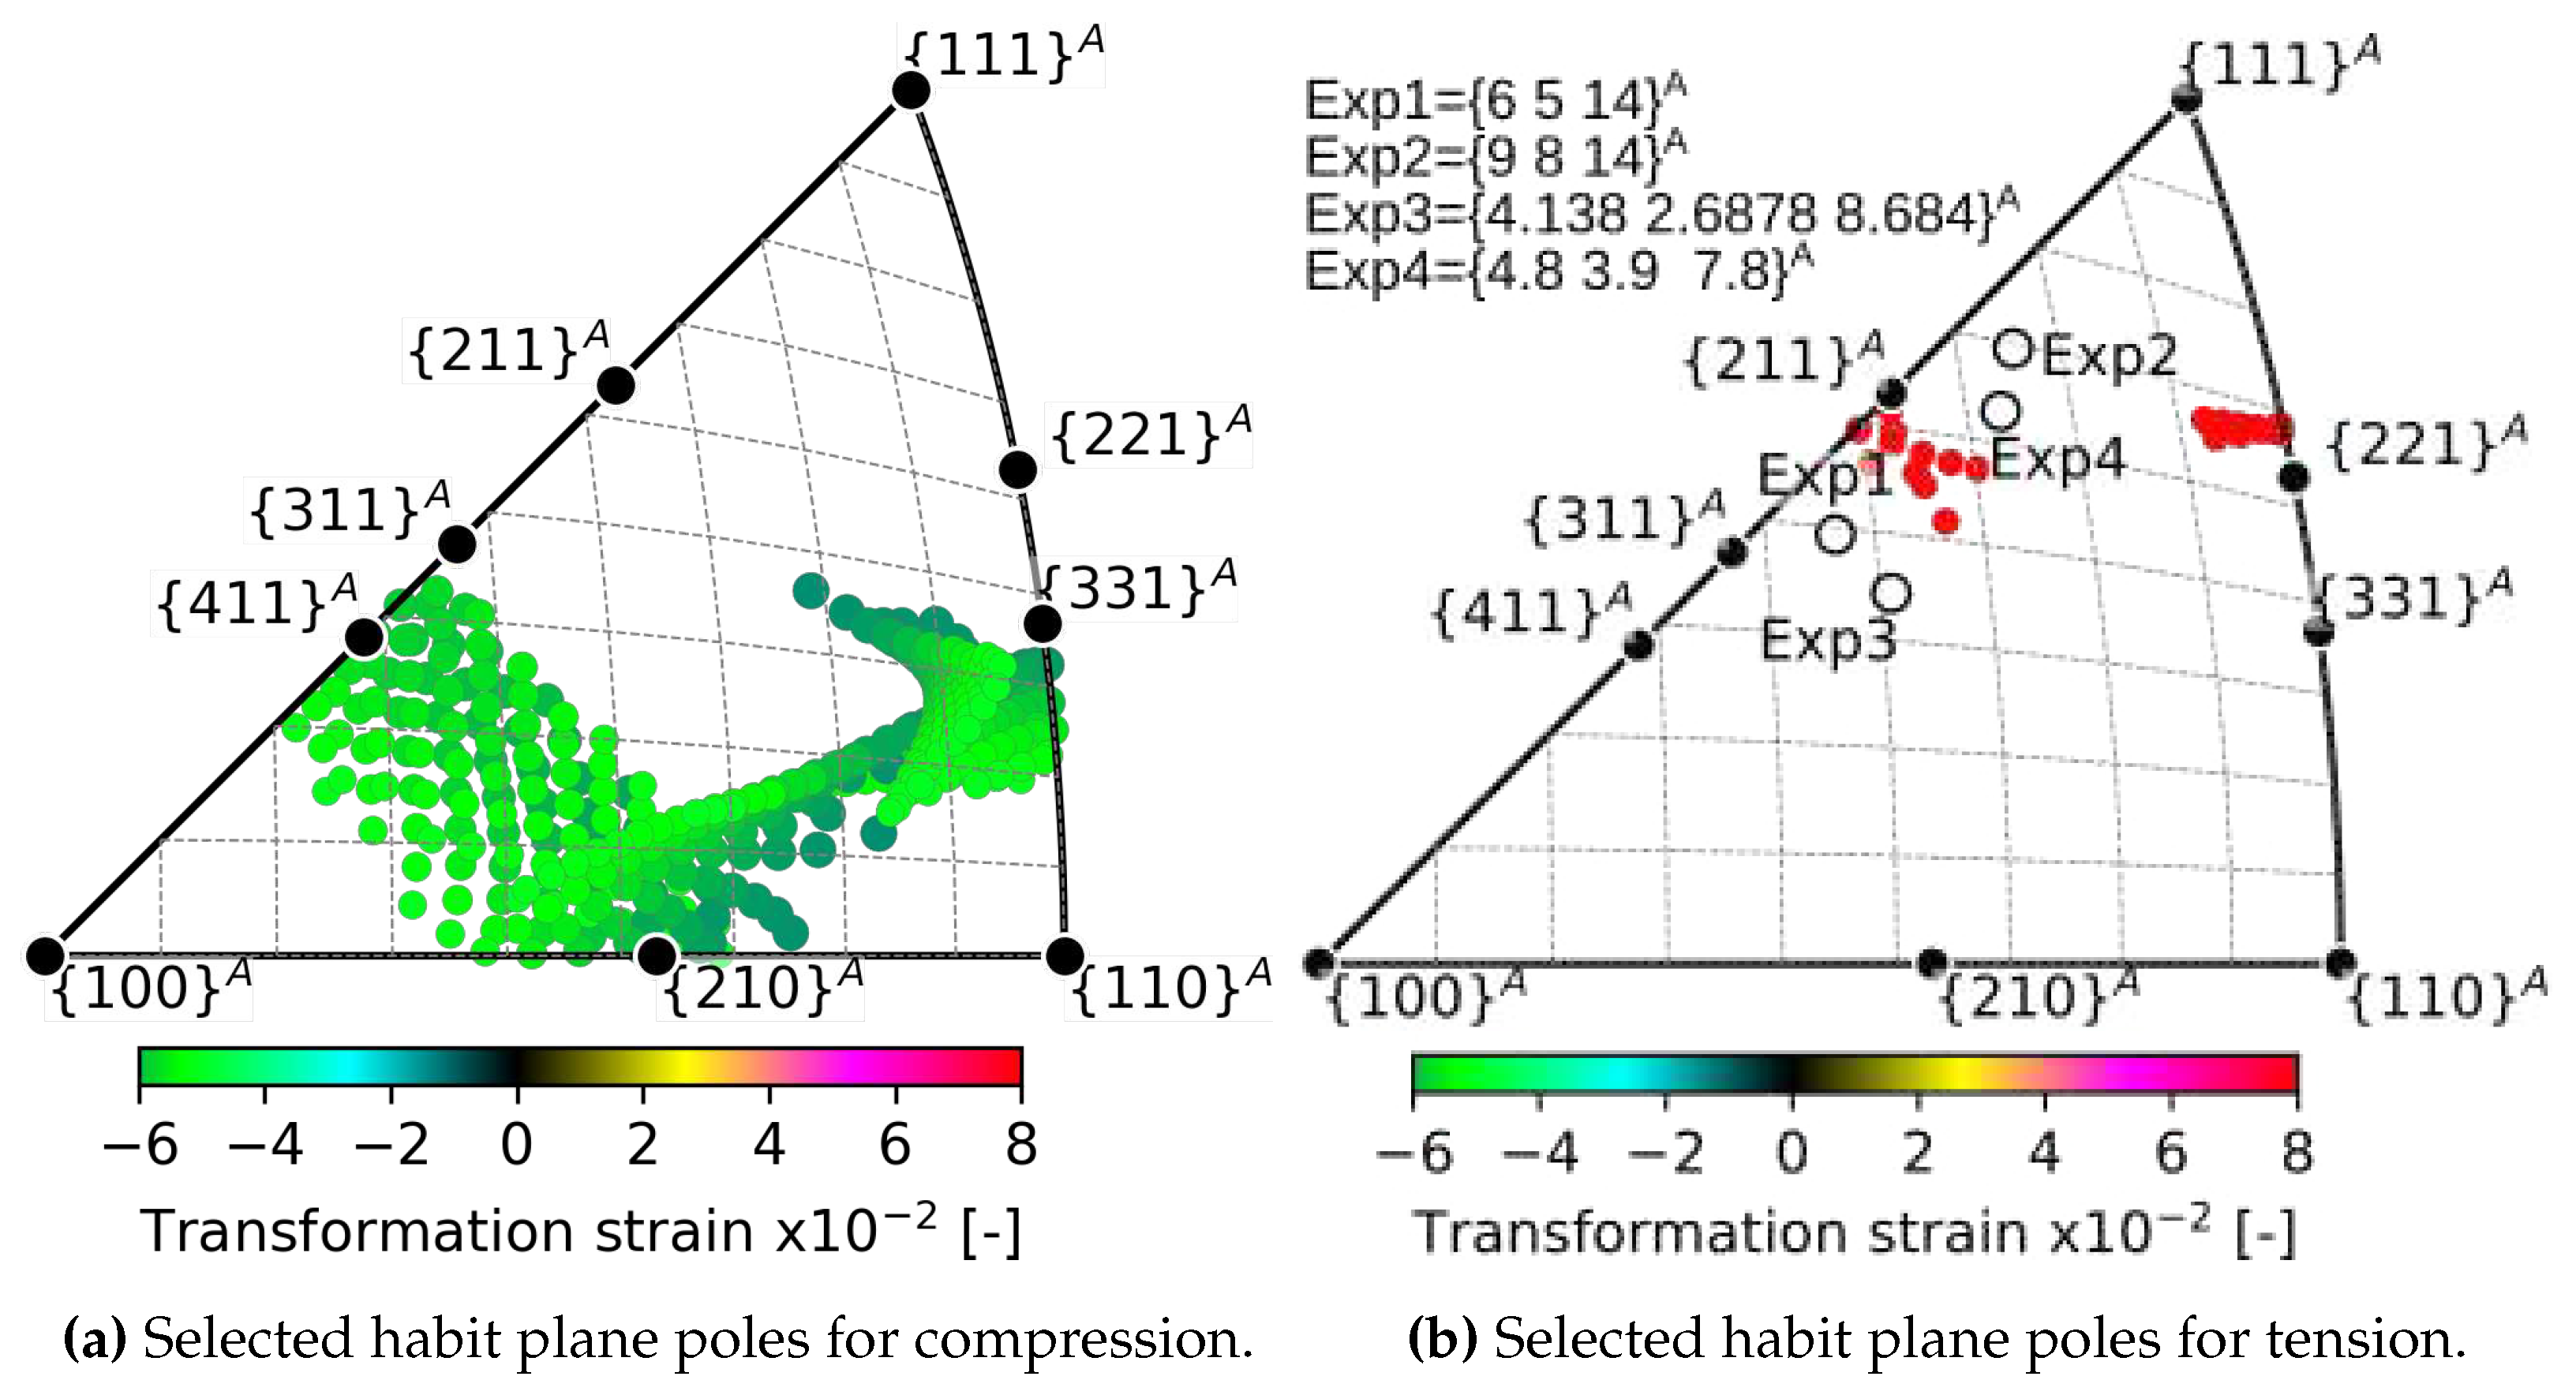
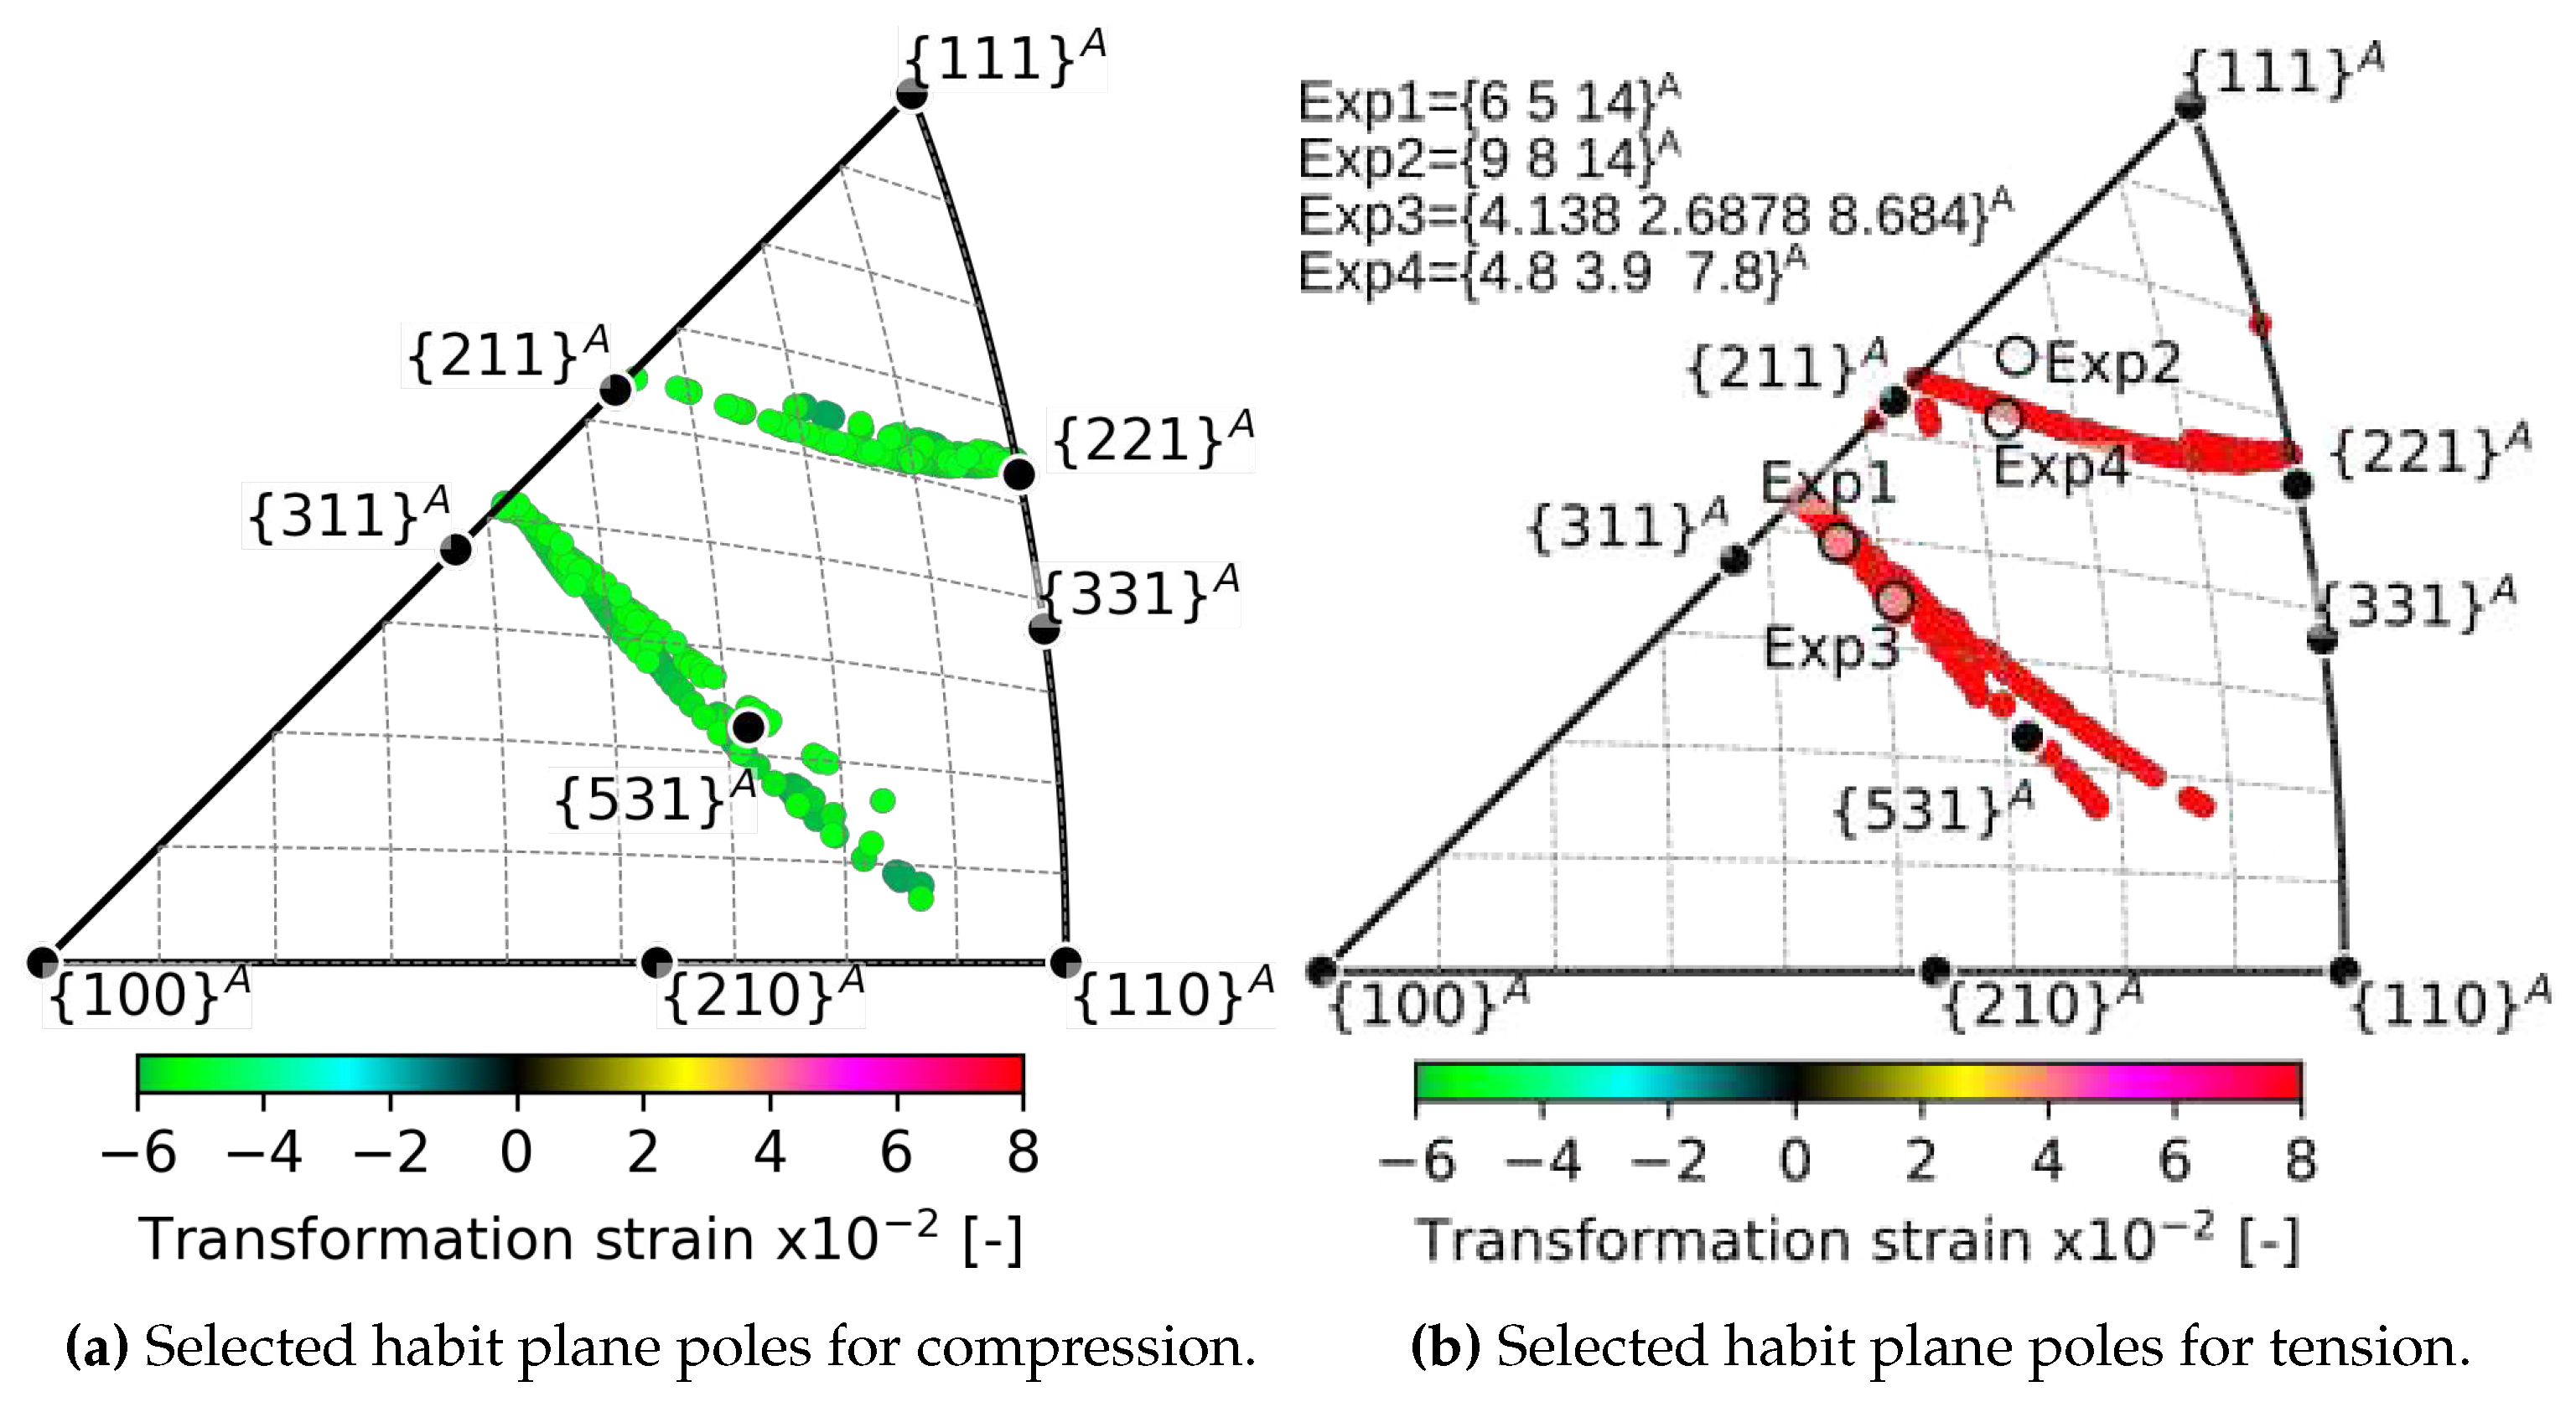
The critical C’ softening under a 500 MPa of uniaxial loading allows for the formation of habit planes, as illustrated by their normals depicted in Figure 9a for compression and in Figure 9b for tension. As oppose to pure stress-induced habit planes without C’ softenning, where the poles cover entire areas of the orientation space, in this case, the habit plane poles align along arcs. The histograms of habit plane normals displayed in Figure 9c for compression and in Figure 9d for tension reveal the most frequently represented habit planes. It should be noted that the histograms are weighted based on the magnitude of the transformation strain connected with each habit plane and normalized to the maximum of the bin counts. The compression histogram shows that the most frequent habit planes are in the vicinity of { 211 } A and between poles { 221 } A and { 111 } A . Similar to results without C’ softening, the most frequently occurring habit planes under tension are located near { 211 } A , extending from this pole toward { 221 } A . Additionally, some low-index habit planes are dispersed in the central region of the equal-area triangle with a concentration near { 531 } A .
The most frequent habit planes for tension include those providing the largest transformation strains above 8 % as evident from the comparison of Figure 9d with Figure 10b. On the other hand, the most frequent habit planes for compression exclude those associated with largest compressive transformation strains (compare Figure 9c with Figure 10a). The latter with transformation strain magnitudes larger than 5 % in compression spans from the pole { 221 } A towards the pole { 211 } A and from the vicinity of the pole { 311 } A towards the high-index pole { 531 } A as displayed in Figure 10a.

6. Discussion

The martensitic transformation (MT) in NiTi typically occurs by two habit plane variants (HPVs) of martensite propagating. This is because they create an invariant plane strain deformation (IPS) on a larger scale than a lattice unit cell. It is impossible on a single martensite lattice level since they are not compatible. The second principal transformation strain ε 2 is -3.3%, while the IPS requires ε 2 to be zero. This is a commonly accepted description of MT in NiTi, although it does not account for lattice changes caused by external stress fields. Our calculations demonstrate that elastic strains from typically applied stress of 500 MPa modify the value of ε 2 by approximately 0.3 % in magnitude and alter its directions from [ 010 ] M by multiple degrees. Since the volume ratio of martensite variants and the orientation of habit planes formed by HPVs depend on ε 2 , the volume fractions of HPVs and associated habit planes have to be considered as stress-dependent in tha case of stress-induced MT.
Larger stress can be considered in polycrystals where grain misorientations cause stress inhomogeneities within and among grains, with stress peaks exceeding the nominal values. Our calculations indicate that, as stresses increase, the anisotropy of elasticity effects changes due to significant deformation and considerable deviation of the ε 2 direction from [ 010 ] M . Under large stresses, the regions of loading directions that positively effects the compatibility between austenite and martensite greatly increase. The changes are rather counter-intuitive as the loading orientations having negative effects of compatibility at moderate stresses become to have positive effects at large stresses. We attribute this to a change in ε 2 direction that can no longer by associated with [ 010 ] M direction at high stresses and elastic distortions.
As a limit case, it is worth considering the critical loading stresses necessary to achieve compatibility between austenite and martensite, specifically the elimination of ε 2 . Our calculation showed that there is orientation selectivity and tension-compression asymmetry. Firstly, only a subset of loading orientations result in compatibility, with a larger subset for compression. For tension, only orientations around 100 A | | [ 011 ] M are suitable for stress-induced compatibility, but at the cost of high stresses of 7-10 GPa. In contrast, compression provides a larger orientation space for loading direction, particularly 100 A | | [ 100 ] M , where the critical stress is around 3-4 GPa. The critical loading stresses in tension were most frequently associated with habit planes in the vicinity of the pole { 211 } 8 , including the loading directions providing the highest transformation strains of above 8 %. In contrast, under the critical compression stresses, the habit planes associated with the largest transformation strain magnitudes above 5 % do not fall in into the family of planes near the pole { 311 } 8 most frequently enabled by compresssion. Note that, the two experimentally identified habit planes observed under tension { 9 8 14 } B 2 [7] { 4.8 3.9 7.8 } B 2 [35] fall in the proximity of the most frequent habit planes calculated for critical tensile loading.
In a similar way to thermally induced MT, the austenite lattice may be considered to be unstable when it converts into martensite under the action of an external stress. This instability can be replicated through softening of C’ elastic constant softening, resulting in a significant drop in the critical stress making austenite and martensite compatible. Furthermore, the orientation dependence of critical loading differs when considering the instability. Our simulation showed that significant C’ softening below 2 GPa reduces the critical loading stress for a habit plane with a single martensite variant to 500 MPa. It should be noted that C’ softening favors the formation of habit planes within larger loading orientation space compared to the case without softening considered. In contrast, the orientations space of compression loading was larger in the case of high stress magnitude and absence of C’ softening. Under the selected stress of 500 and C’ softening allowed down to 0.5 GPa, compression only along loading directions concentrated around 110 A | | [ 010 ] M and 110 A | | [ 211 ] M allowed for habit planes with a single martensite variant. In terms of habit planes activated by the combined effect of stress and C softening, they are similar to those activated in the absence of C softening for tension only. The most frequent habit planes calculated for tension and C’ softening were located near the pole 211 A and high-index 531 A . These poles coincide with habit planes related to the largest tensile transformation strain, which exceeds 8%. Note that, experimentally identified habit planes observed under tension { 6 5 14 } B 2 , { 9 8 14 } B 2 [7], { 4.138 2.6878 8.684 } B 2 [8], { 4.8 3.9 7.8 } B 2 [35] fall in the proximity of the most frequent habit planes calculated for tension and C’ softening.
In comparison with pure compression effects, the softening effect of C’ allows for the emergence of new habit planes under compression. These habit planes are situated in close proximity to the pole 211 A , similar to tension, and also consist of high-index normals situated between poles 221 A and 111 A . A larger transformation strain magnitude is generally associated with only the most common habit planes neighboring the pole 211 A . Otherwise, the significant strains resulting from transformation during compression are linked to habit planes located near 311 A and 221 A that are not among the most frequent ones.

7. Conclusions

In this study, The Phenomenological Theory of Martensite Crystallography was adapted to consider the effect or elastic strains resulting from external stress fields acting on stress-induced B2-B19’ martensitic transformation in NiTi shape memory alloys. A hypothetical softening of C‘ elastic constant of austenite prior the stress induced martensitic transformation was considered in the adaptation.
The method was utilized to determine theoretical critical stresses, above which strain compatible habit planes between austenite and a single variant of martensite in NiTi can form during the stress induced transformation. The orientation of such habit planes is predicted for uniaxial tension and compression stress.
It is found that,
  • The elastic strain impacts the second principal transformation strain, ε 2 , and the corresponding eigenvalue λ 2 , in both magnitude and direction. Considering a moderate stress of 500 MPa, the magnitude of ε 2 decreases from -3.3 % to -3 %, and simultaneously, its direction moves away from [ 010 ] M by as much as 6 degrees. Therefore, it is likely that elastic strains affect the location of habit planes observed in situ on samples subjected to external stress.
  • Above a critical uniaxial stress, strain compatible habit plane interfaces between austenite and single variant of martensite exists within a limited region of orientation space. There is a larger orientation spread of habit planes in compression than in tension and magnitudes of critical stresses tend to be lower in compression.
  • When the C’ elastic constant softens below 2 GPa, the critical loading stress for formation of habit planes between austenite and a single variant of martensite decreases to 500 MPa.
  • Softening of the C’ elastic constant has more favorable impact on habit plane formation in tension than in compression. There is a larger orientation space available for critical loading in tension compared to compression.
  • The predicted habit plane normals lie in two narrow bands within the austenite orientation space near the low-index poles 211 A - 221 A , and 311 A - 531 A . These theoretical predictions were compared with experimentally determined orientations of habit planes of tensile stress induced B2-B19’ transformation in NiTi single crystals in the literature - { 6 5 14 } B 2 , { 9 8 14 } B 2 [7], { 4.138 2.6878 8.684 } B 2 [8], { 4.8 3.9 7.8 } B 2 [35].

Author Contributions

“Conceptualization, P.Š., L.H.; methodology, L.H.; Formal analysis, Investigation, Software, Vizualization, Validation, L.H.; writing—review and editing, L.H., P.Š.; funding acquisition, P.Š., L.H. All authors have read and agreed to the published version of the manuscript.”

Funding

“This research was funded by Czech Science Foundation grant number 22-15763S (L. Heller), grant number 22-20181S (P. Šittner), and by Czech Academy of Sciences through Praemium Academiae.”.

Data Availability Statement

This work’s results were calculated in Python by utilizing a Jupyter notebook containing the author’s modules implementing crystallography computations and visualization tools that are available for download here. Interactive version of the graphs in Figure 8, Figure 9, Figure 11, Figure 12 can be downloaded here.

Acknowledgments

In this section you can acknowledge any support given which is not covered by the author contribution or funding sections. This may include administrative and technical support, or donations in kind (e.g., materials used for experiments).

Conflicts of Interest

The authors declare no conflict of interest.

Appendix A. Deformation gradients between elastically distorted cubic B2 austenite and monoclinic B19’ martensite

To evaluate whether a habit plane exists between elastically strained austenite and martensite in NiTi, the compatibility equation has to be verified for deformation gradients between the elastically distorted lattices of cubic B2 austenite and monoclinic B19’ martensite. Therefore, we adapted standard methods of PTMC by considering sets of three independent basal lattice vectors of elastically deformed lattices of austenite and martensite. They are fully described by the lattice parameters of B2 cubic austenite, B19’ monoclinic martensite, orientation relationship of both lattices, their elastic constants, and applied stress.
In what follows, lower case italic letters denote scalars, lower case bold letters denote vectors, and upper case bold letters denote matrices and tensors. m , x denote vectors in the space of Miller indexes and real space, respectively. Superscripts A, M relate the symbols to lattice space or standard Cartesian coordinate system of parent austenite phase and product martensite phase, respectively. Subscripts d, r relate symbols to direct- and reciprocal- lattice space, respectively. Superscript T denotes transpose of vector or matrix.

Appendix A.1. Relationships between stress-free austenite and martensite lattices
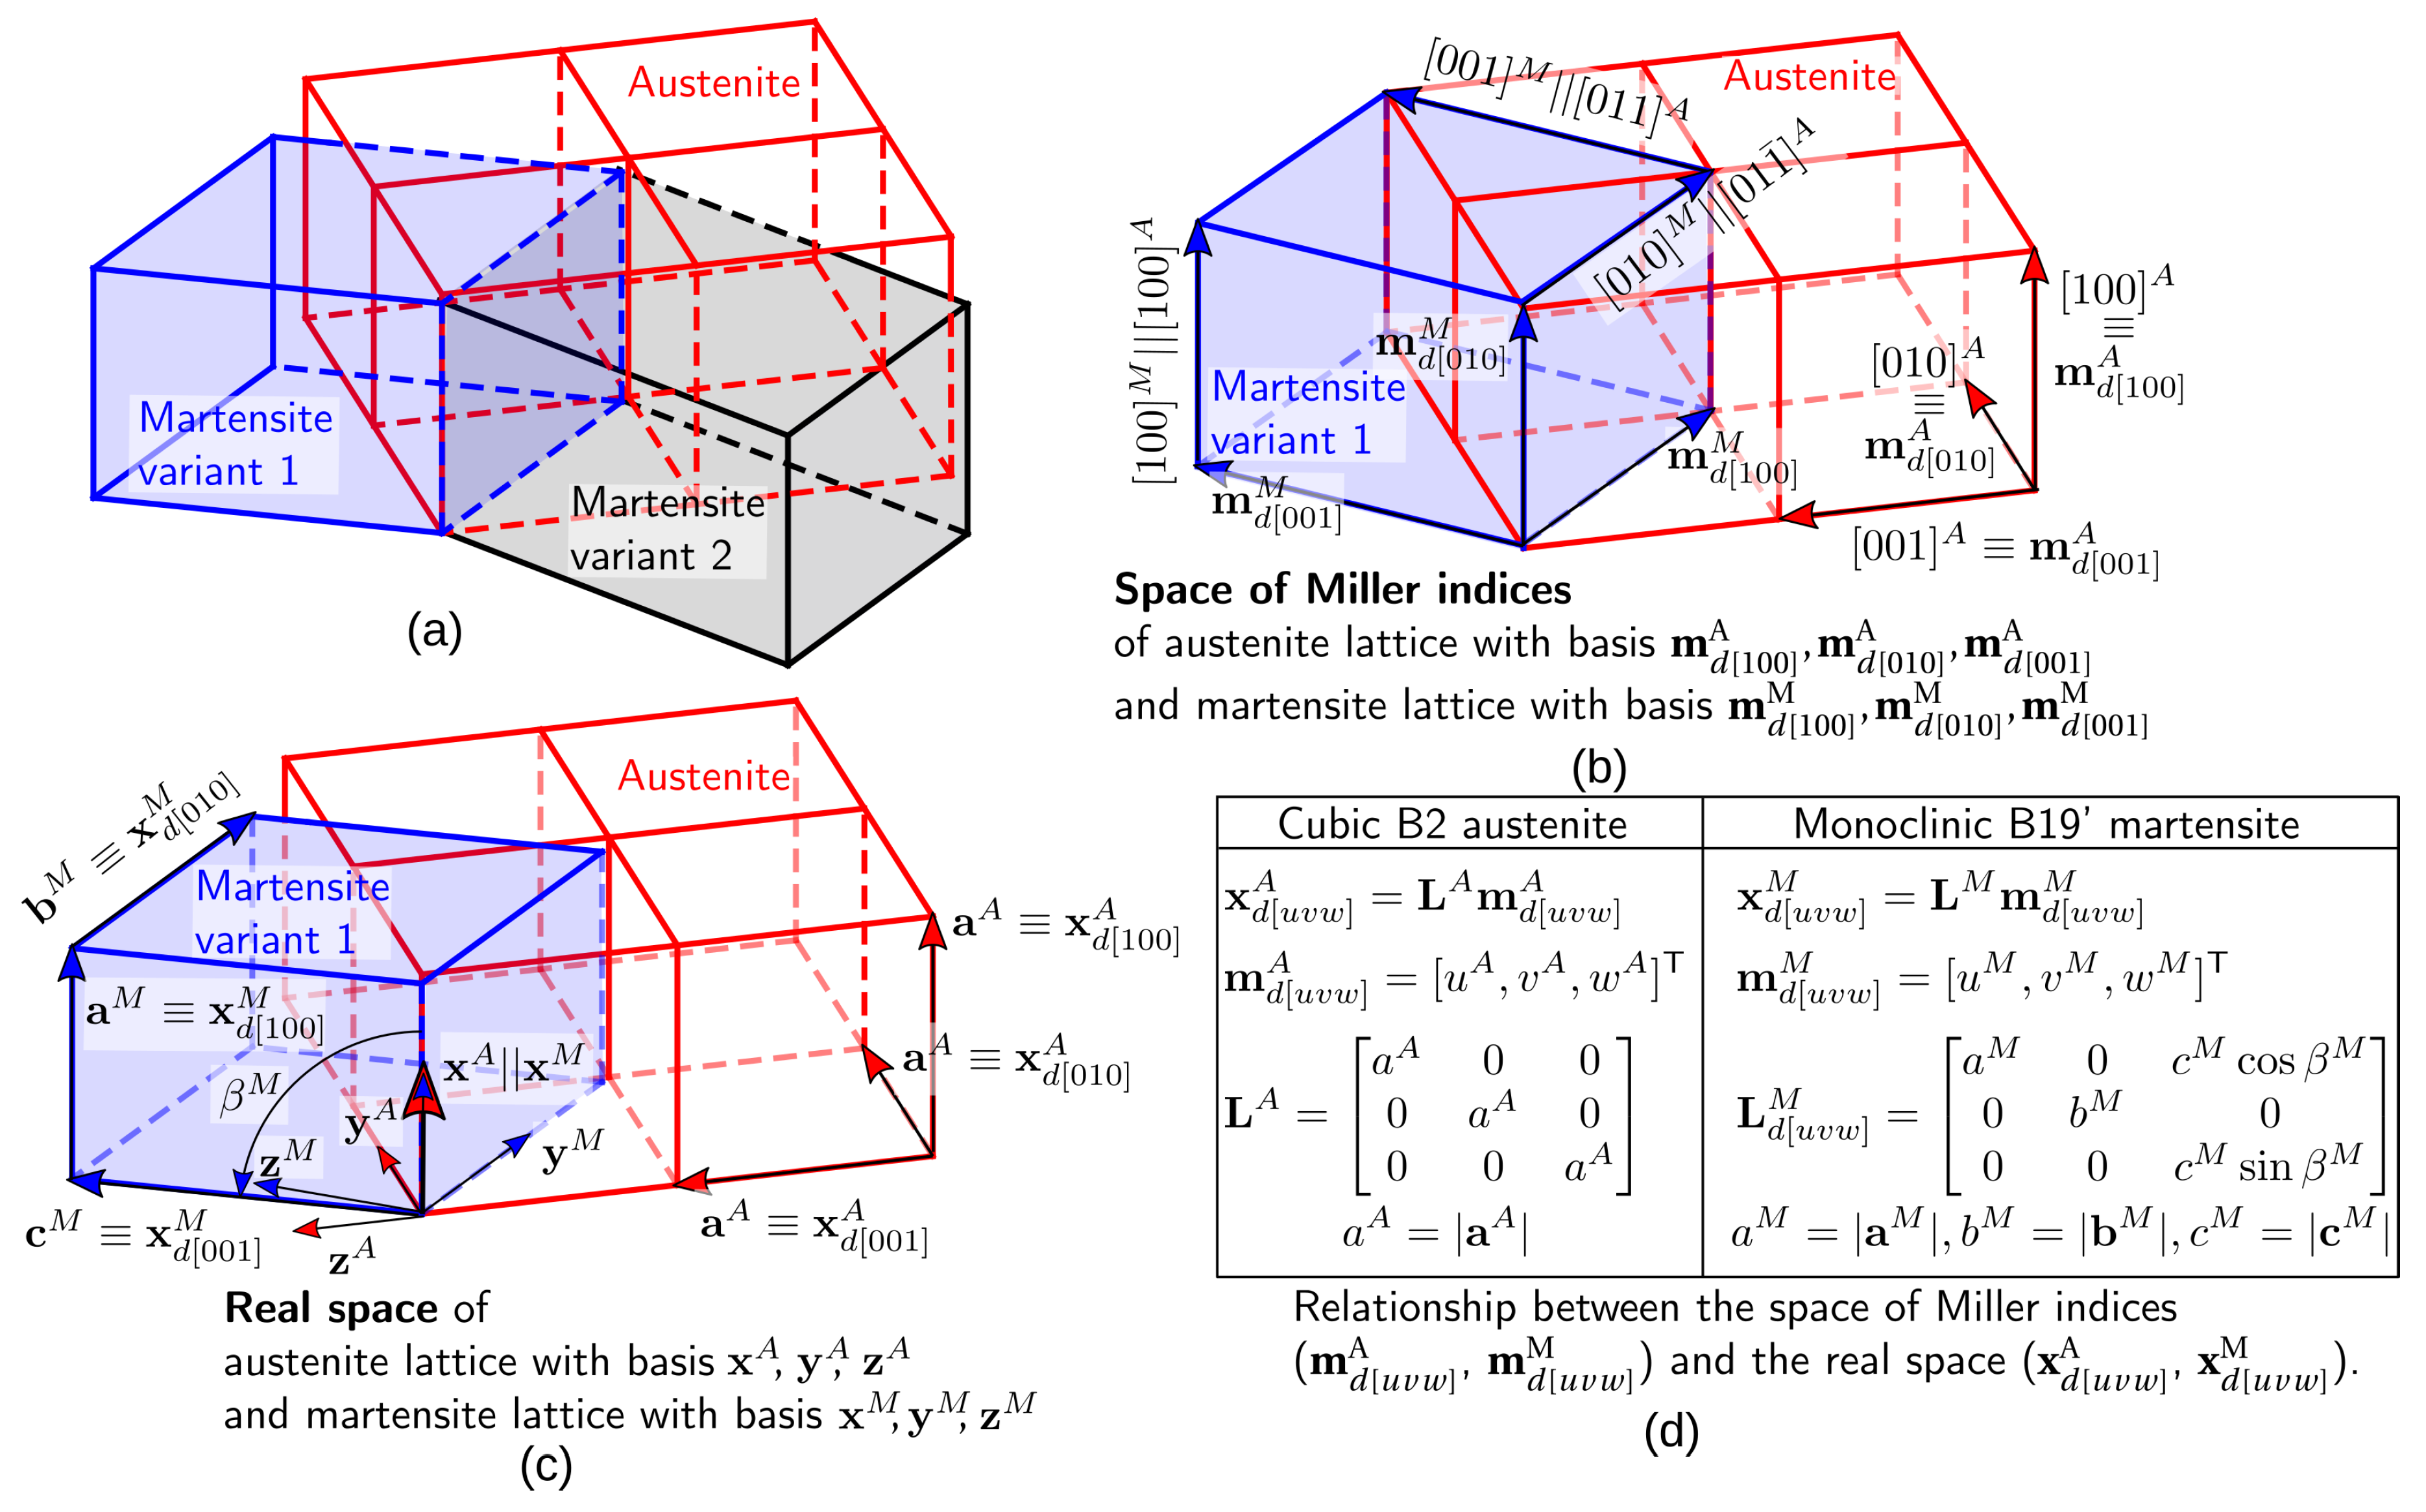
The compatibility and possible habit planes between austenite and martensite depend on orientation relationship between austenite and martensite and structural distortion the austenite lattice undergoes when transforming into martensite lattice. The orientation relationship between austenite and martensite lattices stems from the mechanism of a specific MT at hand. It is defined by lattice correspondence between Miller indices of lattice directions that are preserved during the sudden change from austenite into martensite lattice. Since cubic B2 austenite has higher symmetry than the monoclinic B19’ martensite lattice, the latter can be oriented differently with respect to the reference austenite lattice. Austenite lattice of NiTi can thus transform into 12 mnoclinic martensite variants [3,6] as illustrated in Figure A1a showing two martensite variants. Consequently, a single lattice direction of martensite corresponds to a set of twelve equivalent austenite lattice directions.
Figure A1. (a) Real space orientation relationship between austenite (red) and two variants of martensite (blue and grey). (b) Lattice space orientation relationship between austenite (red) and martensite variant 1 (blue) with indicated basal lattice vectors of austenite (A)/martensite (M) ( m d [ 100 ] A / M , m d [ 010 ] A / M , m d [ 001 ] A / M ) and lattice correspondence ( m d [ 100 ] M | | m d [ 100 ] A , m d [ 010 ] M | | m d [ 01 1 ¯ ] A , m d [ 001 ] M = m d [ 011 ] A . (c) Real space orientation relationship between austenite (red) and martensite variant 1 (blue) with indicated standard coordinate system of austenite/martensite ( x A / M , y A / M , z A / M ) and vectors of basal lattice directions of austenite/martensite ( x d [ 100 ] A / M , x d [ 010 ] A / M , x d [ 001 ] A / M ). (d)Mathematical relationships between lattice vectors in the space of Miller indices m d [ u v w ] A / M and in the real space x d [ u v w ] A / M .
Preprints 88715 g0a1

Appendix A.2. Lattice correspondence

Lattice correspondence between austenite and martensite is defined by transformation matrices C d M i A , i = 1 12 converting Miller indices of a direction in martensite lattice to Miller indices in the austenite lattice according to Equation (A1)
m d [ u i v i w i ] A = C d M i A m d [ u v w ] M , i = 1 12
, where m d [ u v w ] M = [ u M , v M , w M ] T and m d [ u i v i w i ] A = [ u i A , v i A , w i A ] T are column vectors of Miller indices of a martensite lattice direction and i t h corresponding austenite lattice direction, respectively.
The columns of the correspondence matrices thus contain the vectors of Miller indices of austenite lattice directions corresponding to Miller indices of martensite basal lattice directions [100]M, [010]M, [001]M. In this work we use a generally accepted lattice correspondence for MT in NiTi [7,8,43], where a-axis of monoclinic B19’ martensite [ 100 ] M corresponds to one of three < 100 > A lattice directions in the cubic B2 austenite, and b- and c- axes [ 010 ] M , [ 001 ] M correspond to one of twelve perpendicular pairs of the lattice directions < 0 1 ¯ 1 > A , < 011 > A as listed in Table A1. Twelve correspondence matrices C d M i A , i = 1 12 are listed in (Table A3).
Table A1. Miller indices of 12 possible sets of B2 austenite lattice directions (superscript A) corresponding to Miller indices of basal lattice directions of monoclinic B19’ martensite (in bold with superscript M). Each set of austenite lattice directions defines orientation relationship between austenite and a martensite variant enumerated 1-12 according to the very left column Correspondence variant notation.
Basal lattice directions of martensite
Correspondence [100]M [010]M [001]M
variant notation Corresponding lattice directions of austenite
1 [100]A [01 1 ¯ ]A [011]A
2 [100]A [0 1 ¯ 1]A [0 1 ¯ 1 ¯ ]A
3 [100]A [011]A [0 1 ¯ 1]A
4 [100]A [0 1 ¯ 1 ¯ ]A [01 1 ¯ ]A
5 [0 1 ¯ 0]A [ 1 ¯ 01]A [ 1 ¯ 0 1 ¯ ]A
6 [0 1 ¯ 0]A [10 1 ¯ ]A [101]A
7 [010]A [101]A [10 1 ¯ ]A
8 [010]A [ 1 ¯ 0 1 ¯ ]A [ 1 ¯ 01]A
9 [00 1 ¯ ]A [1 1 ¯ 0]A [ 1 ¯ 1 ¯ 0]A
10 [00 1 ¯ ]A [ 1 ¯ 10]A [110]A
11 [001]A [ 1 ¯ 1 ¯ 0]A [1 1 ¯ 0]A
12 [001]A [110]A [ 1 ¯ 10]A
Inversion of Equation (A1) provides correspondence matrices C d A i M , i = 1 12 that using Equation (A2) convert Miller indices of a direction in austenite lattice into Miller indices of twelve martensite lattice directions corresponding to 12 possible martensite variants differently oriented with respect to austenite lattice as listed for selected austenite lattice directions in Table A2.
m d [ u i v i w i ] M = C d M i A 1 m d [ u v w ] A = C d A i M m d [ u v w ] A , i = 1 12
Table A2. Miller indices of 12 possible sets of monoclinic B19’ martensite lattice directions (superscript M) corresponding to Miller indices of basal and [101], [111] lattice directions of cubic B2 austenite (in bold with superscript A).
Lattice directions of austenite
Correspondence [ 100 ] A [ 010 ] A [ 001 ] A [ 101 ] A [ 111 ] A
variant notation Corresponding lattice directions of martensite
1 [ 100 ] M [ 011 ] M [ 0 1 ¯ 1 ] M [ 2 1 ¯ 1 ] M [ 101 ] M
2 [ 100 ] M [ 0 1 ¯ 1 ¯ ] M [ 01 1 ¯ ] M [ 21 1 ¯ ] M [ 10 1 ¯ ] M
3 [ 100 ] M [ 01 1 ¯ ] M [ 011 ] M [ 211 ] M [ 110 ] M
4 [ 100 ] M [ 0 1 ¯ 1 ] M [ 0 1 ¯ 1 ¯ ] M [ 2 1 ¯ 1 ¯ ] M [ 1 1 ¯ 0 ] M
5 [ 0 1 ¯ 1 ¯ ] M [ 1 ¯ 00 ] M [ 01 1 ¯ ] M [ 00 1 ¯ ] M [ 1 ¯ 0 1 ¯ ] M
6 [ 011 ] M [ 1 ¯ 00 ] M [ 0 1 ¯ 1 ] M [ 001 ] M [ 1 ¯ 01 ] M
7 [ 011 ] M [ 100 ] M [ 01 1 ¯ ] M [ 010 ] M [ 110 ] M
8 [ 0 1 ¯ 1 ¯ ] M [ 100 ] M [ 0 1 ¯ 1 ] M [ 0 1 ¯ 0 ] M [ 1 1 ¯ 0 ] M
9 [ 01 1 ¯ ] M [ 0 1 ¯ 1 ¯ ] M [ 1 ¯ 00 ] M [ 2 ¯ 1 1 ¯ ] M [ 1 ¯ 0 1 ¯ ] M
10 [ 0 1 ¯ 1 ] M [ 011 ] M [ 1 ¯ 00 ] M [ 2 ¯ 1 ¯ 1 ] M [ 1 ¯ 01 ] M
11 [ 0 1 ¯ 1 ] M [ 0 1 ¯ 1 ¯ ] M [ 100 ] M [ 2 1 ¯ 1 ] M [ 1 1 ¯ 0 ] M
12 [ 01 1 ¯ ] M [ 011 ] M [ 100 ] M [ 21 1 ¯ ] M [ 110 ] M
Table A3. Table of correspondence matrices ( C d M i A , i = 1 12 ) converting Miller indices of B19’ martensite into that of B2 austenite and transformation matrices ( T M i A , i = 1 12 ) converting components of real space vectors from standard coordinate system of B19’ martensite into that of B2 austenite.
Variant 1 Variant 2 Variant 3 Variant 4
C d M 1 A = C d M 2 A = C d M 3 A = C d M 4 A =
1 0 0 0 1 1 0 1 1 1 0 0 0 1 1 0 1 1 1 0 0 0 1 1 0 1 1 1 0 0 0 1 1 0 1 1
T M 1 A = T M 2 A = T M 3 A = T M 4 A =
1 0 0 0 1 / 2 1 / 2 0 1 / 2 1 / 2 1 0 0 0 1 / 2 1 / 2 0 1 / 2 1 / 2 1 0 0 0 1 / 2 1 / 2 0 1 / 2 1 / 2 1 0 0 0 1 / 2 1 / 2 0 1 / 2 1 / 2
Variant 5 Variant 6 Variant 7 Variant 8
C d M 5 A = C d M 6 A = C d M 7 A = C d M 8 A =
0 1 1 1 0 0 0 1 1 0 1 1 1 0 0 0 1 1 0 1 1 1 0 0 0 1 1 0 1 1 1 0 0 0 1 1
T M 5 A = T M 6 A = T M 7 A = T M 8 A =
0 1 / 2 1 / 2 1 0 0 0 1 / 2 1 / 2 0 1 / 2 1 / 2 1 0 0 0 1 / 2 1 / 2 0 1 / 2 1 / 2 1 0 0 0 1 / 2 1 / 2 0 1 / 2 1 / 2 1 0 0 0 1 / 2 1 / 2
Variant 9 Variant 10 Variant 11 Variant 12
C d M 9 A = C d M 10 A = C d M 11 A = C d M 12 A =
0 1 1 0 1 1 1 0 0 0 1 1 0 1 1 1 0 0 0 1 1 0 1 1 1 0 0 0 1 1 0 1 1 1 0 0
T M 9 A = T M 10 A = T M 11 A = T M 12 A =
0 1 / 2 1 / 2 0 1 / 2 1 / 2 1 0 0 0 1 / 2 1 / 2 0 1 / 2 1 / 2 1 0 0 0 1 / 2 1 / 2 0 1 / 2 1 / 2 1 0 0 0 1 / 2 1 / 2 0 1 / 2 1 / 2 1 0 0

Appendix A.3. Real space orientation relationships

Correspondence matrices operate in the space of Miller indices that is independent of lattice parameters as illustrated in Figure A1b. Real space vectors x d [ u v w ] A , x d [ u v w ] M shown in Figure A1c are calculated from vectors of Miller indices m d [ u v w ] M , m d [ u v w ] A by Equation (A7), A8 using lattice matrices of austenite L A and martensite L M , as summarized in Figure A1d. Columns of lattice matrices are formed from basal lattice vectors of austenite ( L A = [ a A , b A , c A ] ) and martensite ( L M = [ a M , b M , c M ] ) depicted in Figure A1c. Therefore, as summarized in Figure A1d, they are defined by a single lattice parameter a A for austenite (Eq. A3) and by four lattice parameters a M , b M , c M , β M for martensite (Eq. A4).
x d [ u v w ] A = L A m d [ u v w ] A , L A = a A 0 0 0 a A 0 0 0 a A
x d [ u v w ] M = L M m d [ u v w ] M , L M = a M 0 c M cos β M 0 b M 0 0 0 c M sin β M
The lattice matrices L A (Eq. A3), L M (Eq. A4) operate in standard coordinate systems of austenite ( x A , y A , z A ) and martensite ( x M , y M , z M ) that are not aligned as shown in Figure A1c. Deformation and incompatibilities between austenite and martensite must, however, be evaluated in a fixed reference coordinate system. For this the transformation matrices T M i A , i = 1 12 are used to express real space vectors x d [ u v w ] M of martensite variant i in the coordinate system of austenite x d [ u v w ] M i A and vice-versa using transformation matrices T A i M , i = 1 12 according to Equation (A5),A6.
x d [ u v w ] M i A = T M i A x d [ u v w ] M , i = 1 12
x d [ u v w ] A i M = T A i M x d [ u v w ] A , i = 1 12
The transformation matrices T M i A , T A i M , i = 1 12 are associated with correspondence matrices C d M i A , C d A i M , i = 1 12 that, however, transform vectors of rational Miller indices without preserving the metric of vectors, e.g., [001]M transforms into [011]A (see Table A1). The transformation matrices are thus rotational parts of the polar decomposition of corresponding matrices [44] calculated using Equation (A7),A8. Twelve transformation matrices T A i M , i = 1 12 are listed in (Table A3) in Appendix A.
T M i A = C d M i A C d M i A T C d M i A 1 , i = 1 12
T A i M = C d A i M C d A i M T C d A i M 1 , i = 1 12
Since the columns of the individual correspondence matrices C d M i A , C d A i M are orthogonal, the result of matrix products C d M i A T C d M i A and C d A i M T C d A i M are diagonal matrices. Moreover, the result of the matrix products is the same for all variants i = 1 12 . This results from the fact that individual columns of the correspondence matrices have identical non-zero elements for all variants i = 1 12 with only variant-dependent permutation of their row-positions (e.g. first column of C d M i A has a single non-zero element for all variants). Therefore, equations for transformation matrices A7, A8 can be simplified into Equations (A9), A10.
T M i A = C d M i A 1 0 0 0 1 / 2 0 0 0 1 / 2 , i = 1 12
T A i M = C d A i M 2 0 0 0 2 0 0 0 1 , i = 1 12

Appendix A.4. Transformation deformation gradients

Deformation gradients F i A , i = 1 12 describe, in the reference standard coordinate system of austenite lattice, the materials distortion due to austenite to martensite transformation. They are calculated based on distortion of lattice directions. They describe how an austenite lattice direction is distorted during its transformation into i t h corresponding martensite lattice direction. This is expressed by Equation (A11) where the deformation gradient F i A maps a real space austenite lattice direction x d [ u v w ] A = L A m d [ u v w ] A into i t h corresponding martensite lattice direction [ u i , v i , w i ] M expressed in the reference space of austenite lattice (denoted x d [ u i , v i , w i ] M i A in Equation (A11)).
x d [ u i , v i , w i ] M i A = F i A x d [ u v w ] A
T M i A L M C d A i M m d [ u v w ] A = F i A L A m d [ u v w ] A
As detailed in Equation (A12), i t h corresponding martensite lattice direction x d [ u i , v i , w i ] M i A is calculated from Miller indices of the austenite lattice direction m d [ u v w ] A through a sequence of transformations (left-hand side of Equation (A12). First, it is transformed using correspondence matrix C d A i M into the vector of Miller indices of corresponding martensite lattice direction. Second, this vector is further transformed into the real space of martensite lattice using lattice matrix of martensite L M . Third, this vector is brought into the real space of austenite lattice using the transformation matrix T M i A .
It is seen from Equation (A12) and Equation (A7),A8, that the deformation gradients F i A , i = 1 12 are uniquely defined by lattice correspondence matrices, lattice matrices and a matrix of three independent austenite lattice directions replacing m d [ u v w ] A in Equation (A12). Natural choice of the latter is three basal direction of austenite forming an identity matrix replacing m d [ u v w ] A in Equation (A12), that can be thus rewritten for all correspondence variants as Equation (A13).
T M i A L M C d A i M = F i A L A , i = 1 12
Inversion of Equation (A13) enables us to calculate deformation gradients as
F i A = T M i A L M C d A i M L A 1 , i = 1 12 .
Similarly, the deformation gradient of austenite to martensite transformation can be defined in the standard coordinate system of martensite lattice. In this coordinate system, the deformation gradient is uniquely define by a single gradient F M (Equation (8) in [45] directly linked to ratios of lattice parameters of as shown in Equation (A15).
x d [ u v w ] M = F i M x d [ u i , v i , w i ] A i M L M m d [ u v w ] M = F i M T A i M L A C d M i A m d [ u v w ] M F i M = L M C d A i M L A 1 T M i A F i M = F M = a M / a A 0 c M cos β M / ( 2 a A ) 0 b M / ( 2 a A ) 0 0 0 c M sin β M / ( 2 a A ) i [ 1 12 ]

Appendix A.5. Lattice matrices of elastically distorted austenite and martensite

Basal lattice vectors of B2 cubic austenite/B19’martensite a A , b A , c A / a M , b M , c M become elastically distorted lattice vectors a σ A , b σ A , c σ A / a σ M , b σ M , c σ M due to the action of a stress tensor σ and elastic competences of austenite/martensite S A / S M . Mathematically, elastically distorted basal lattice vectors of austenite arranged into columns of distorted austenite lattice matrix L σ A = [ a σ A , b σ A , c σ A ] is calculated from its stress-free counterpart L A according to Equation (A16), where symbol I denotes identity matrix.
L σ A = S A σ + I L A
Similarly for martensite, where, however the stress tensor σ , defined in the standards coordinate system of austenite lattice, has to be transformed into the standard coordinate system of martensite lattice, where the martensite lattice matrix L M is expressed. Since the two standard coordinate systems are not aligned the transformation matrices T A i M , i = 1 12 from the system of austenite into that of martensite and the inverse matrices T M i A , i = 1 12 are used in Equation (A17) to calculate elastically distorted martensite lattice matrices L σ M i , i = 1 12 .
L σ M i = S M T A i M σ T M i A + I L M , i = 1 12
The elastic compliance matrix of B2 cubic austenite lattice (Eq. A18) is the inverse of stiffness matrix C A fully determined by three elastic constants C 11 A , C 12 A , C 44 A . The elastic compliance matrix of B19’ monoclinic martensite lattice (Eq. A19) is determined by 13 elastic constants C 11 M , C 12 M , C 13 M , C 15 M , C 22 M , C 23 M , C 25 M , C 33 M , C 35 M , C 44 M , C 46 M , C 55 M , C 66 M .
S A = C A 1 = C 11 A C 12 A C 12 A 0 0 0 C 12 A C 11 A C 12 A 0 0 0 C 12 A C 12 A C 11 A 0 0 0 0 0 0 C 44 A 0 0 0 0 0 0 C 44 A 0 0 0 0 0 0 C 44 A 1
S M = C M 1 = C 11 M C 12 M C 13 M 0 C 15 M 0 C 12 M C 22 M C 23 M 0 C 25 M 0 C 13 M C 23 M C 33 M 0 C 35 M 0 0 0 0 C 44 M 0 C 46 M 0 0 0 0 C 55 M 0 0 0 0 C 46 M 0 C 66 M 1

Appendix A.6. Deformation gradients for elastically distorted lattices

The deformation gradient F i A ( σ ) describes, in the standard coordinate system of austenite lattice, the materials distortion due to MT proceeding between austenite and i t h martensite variant the lattices of which are elastically distorted by an applied external stress σ . It is thus evaluated by Equation (A20) being adapted Equation (A13) considering elastically distorted lattice matrices instead of their stress-free counterparts.
F i A ( σ ) = T M i A L σ M i C d A i M L σ A 1 , i = 1 12

Appendix A.7. Directional Transformation Strains

Since the directional transformation strain is being evaluated in this paper, Equation (A21),A22 show how it is evaluated along x A direction defined in the standard coordinate system of the austenite lattice for i t h martensite variant (Eq. A21) and along x M direction defined in the standard coordinate system of the martensite lattice (Eq. A22). The latter is presented in this paper only for stress free state using the deformation gradient F M  A15 that does not depend on the martensite variant since it is defined in the standard coordinate system of the martensite lattice. Notably, the definition of directional transformation strain used here measures the relative change of length along a given direction ([3]).
ε i A ( σ , x A ) = x A T F i A ( σ ) T F i A ( σ ) x A 1
ε M ( x M ) = x M T F M T F M x M 1

Appendix B. Supplementary Figures

Appendix B.1. Directional Young’s modulus of austenite
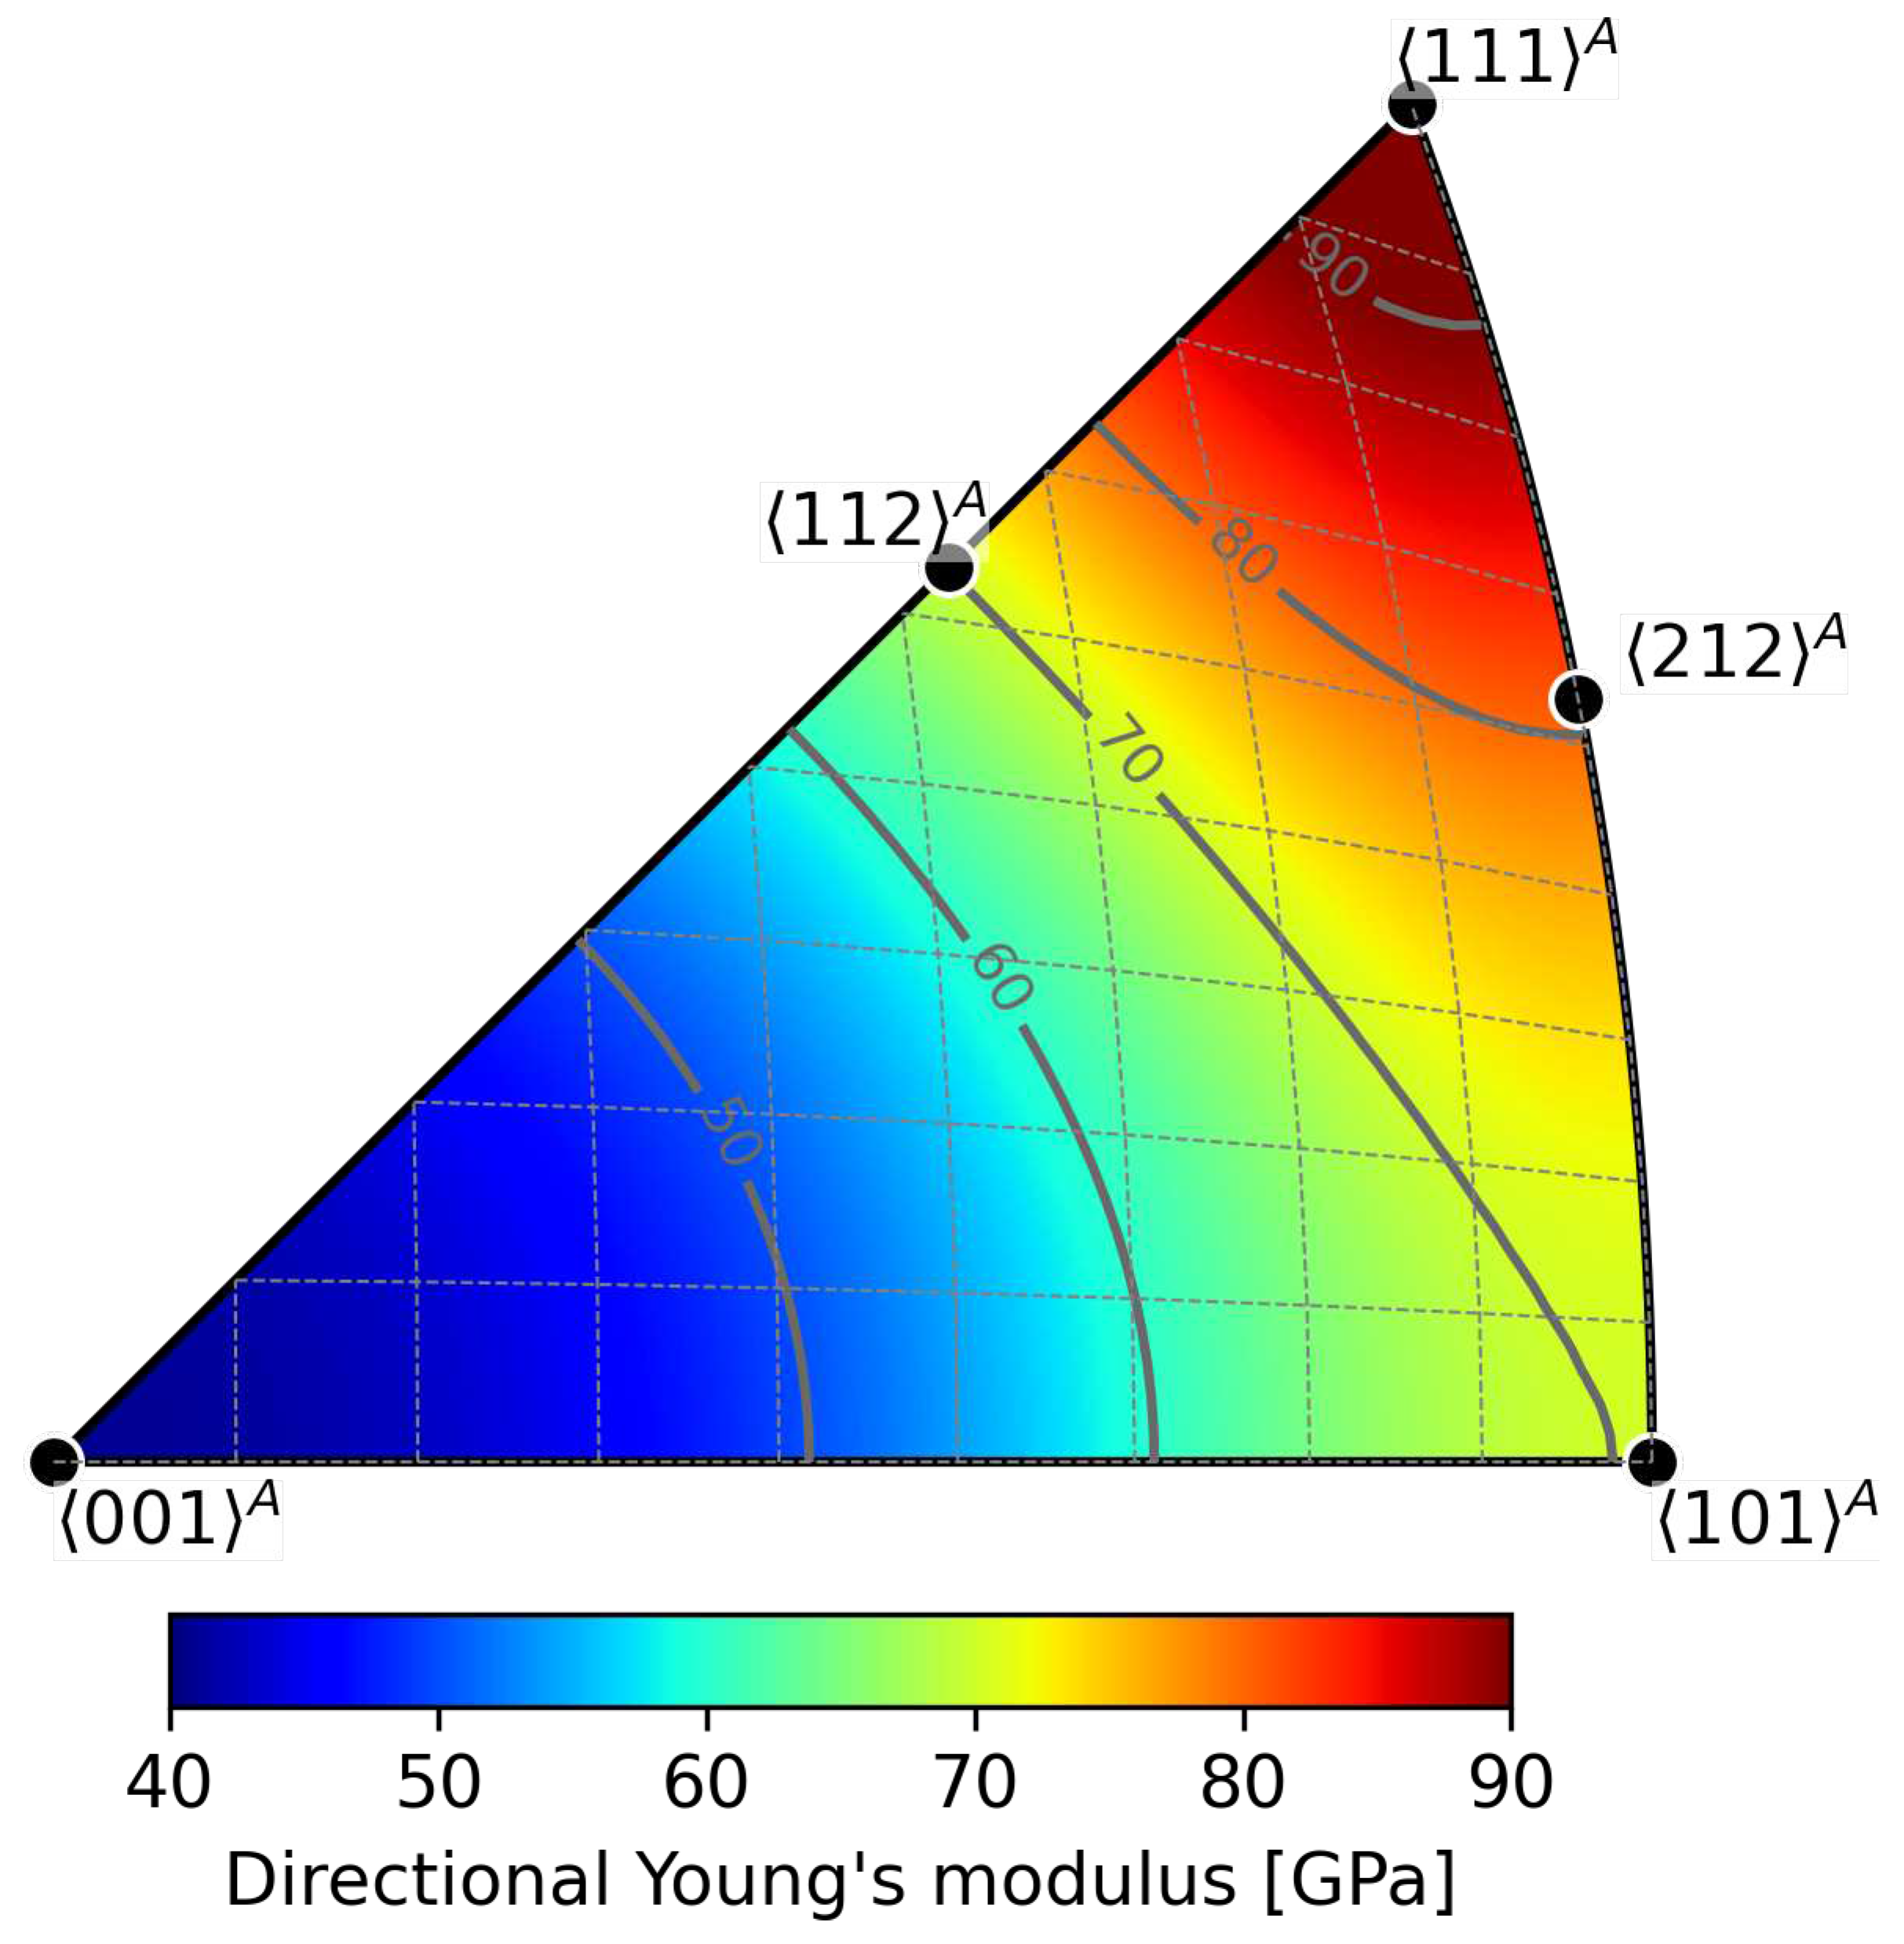
Figure A2. Directional Young’s modulus of austenite corresponding to the referential set of elastic constants of austenite considered in the work is according to reported experimental results [33].
Preprints 88715 g0a2

Appendix B.2. Deviations of ε2 direction from [010] M
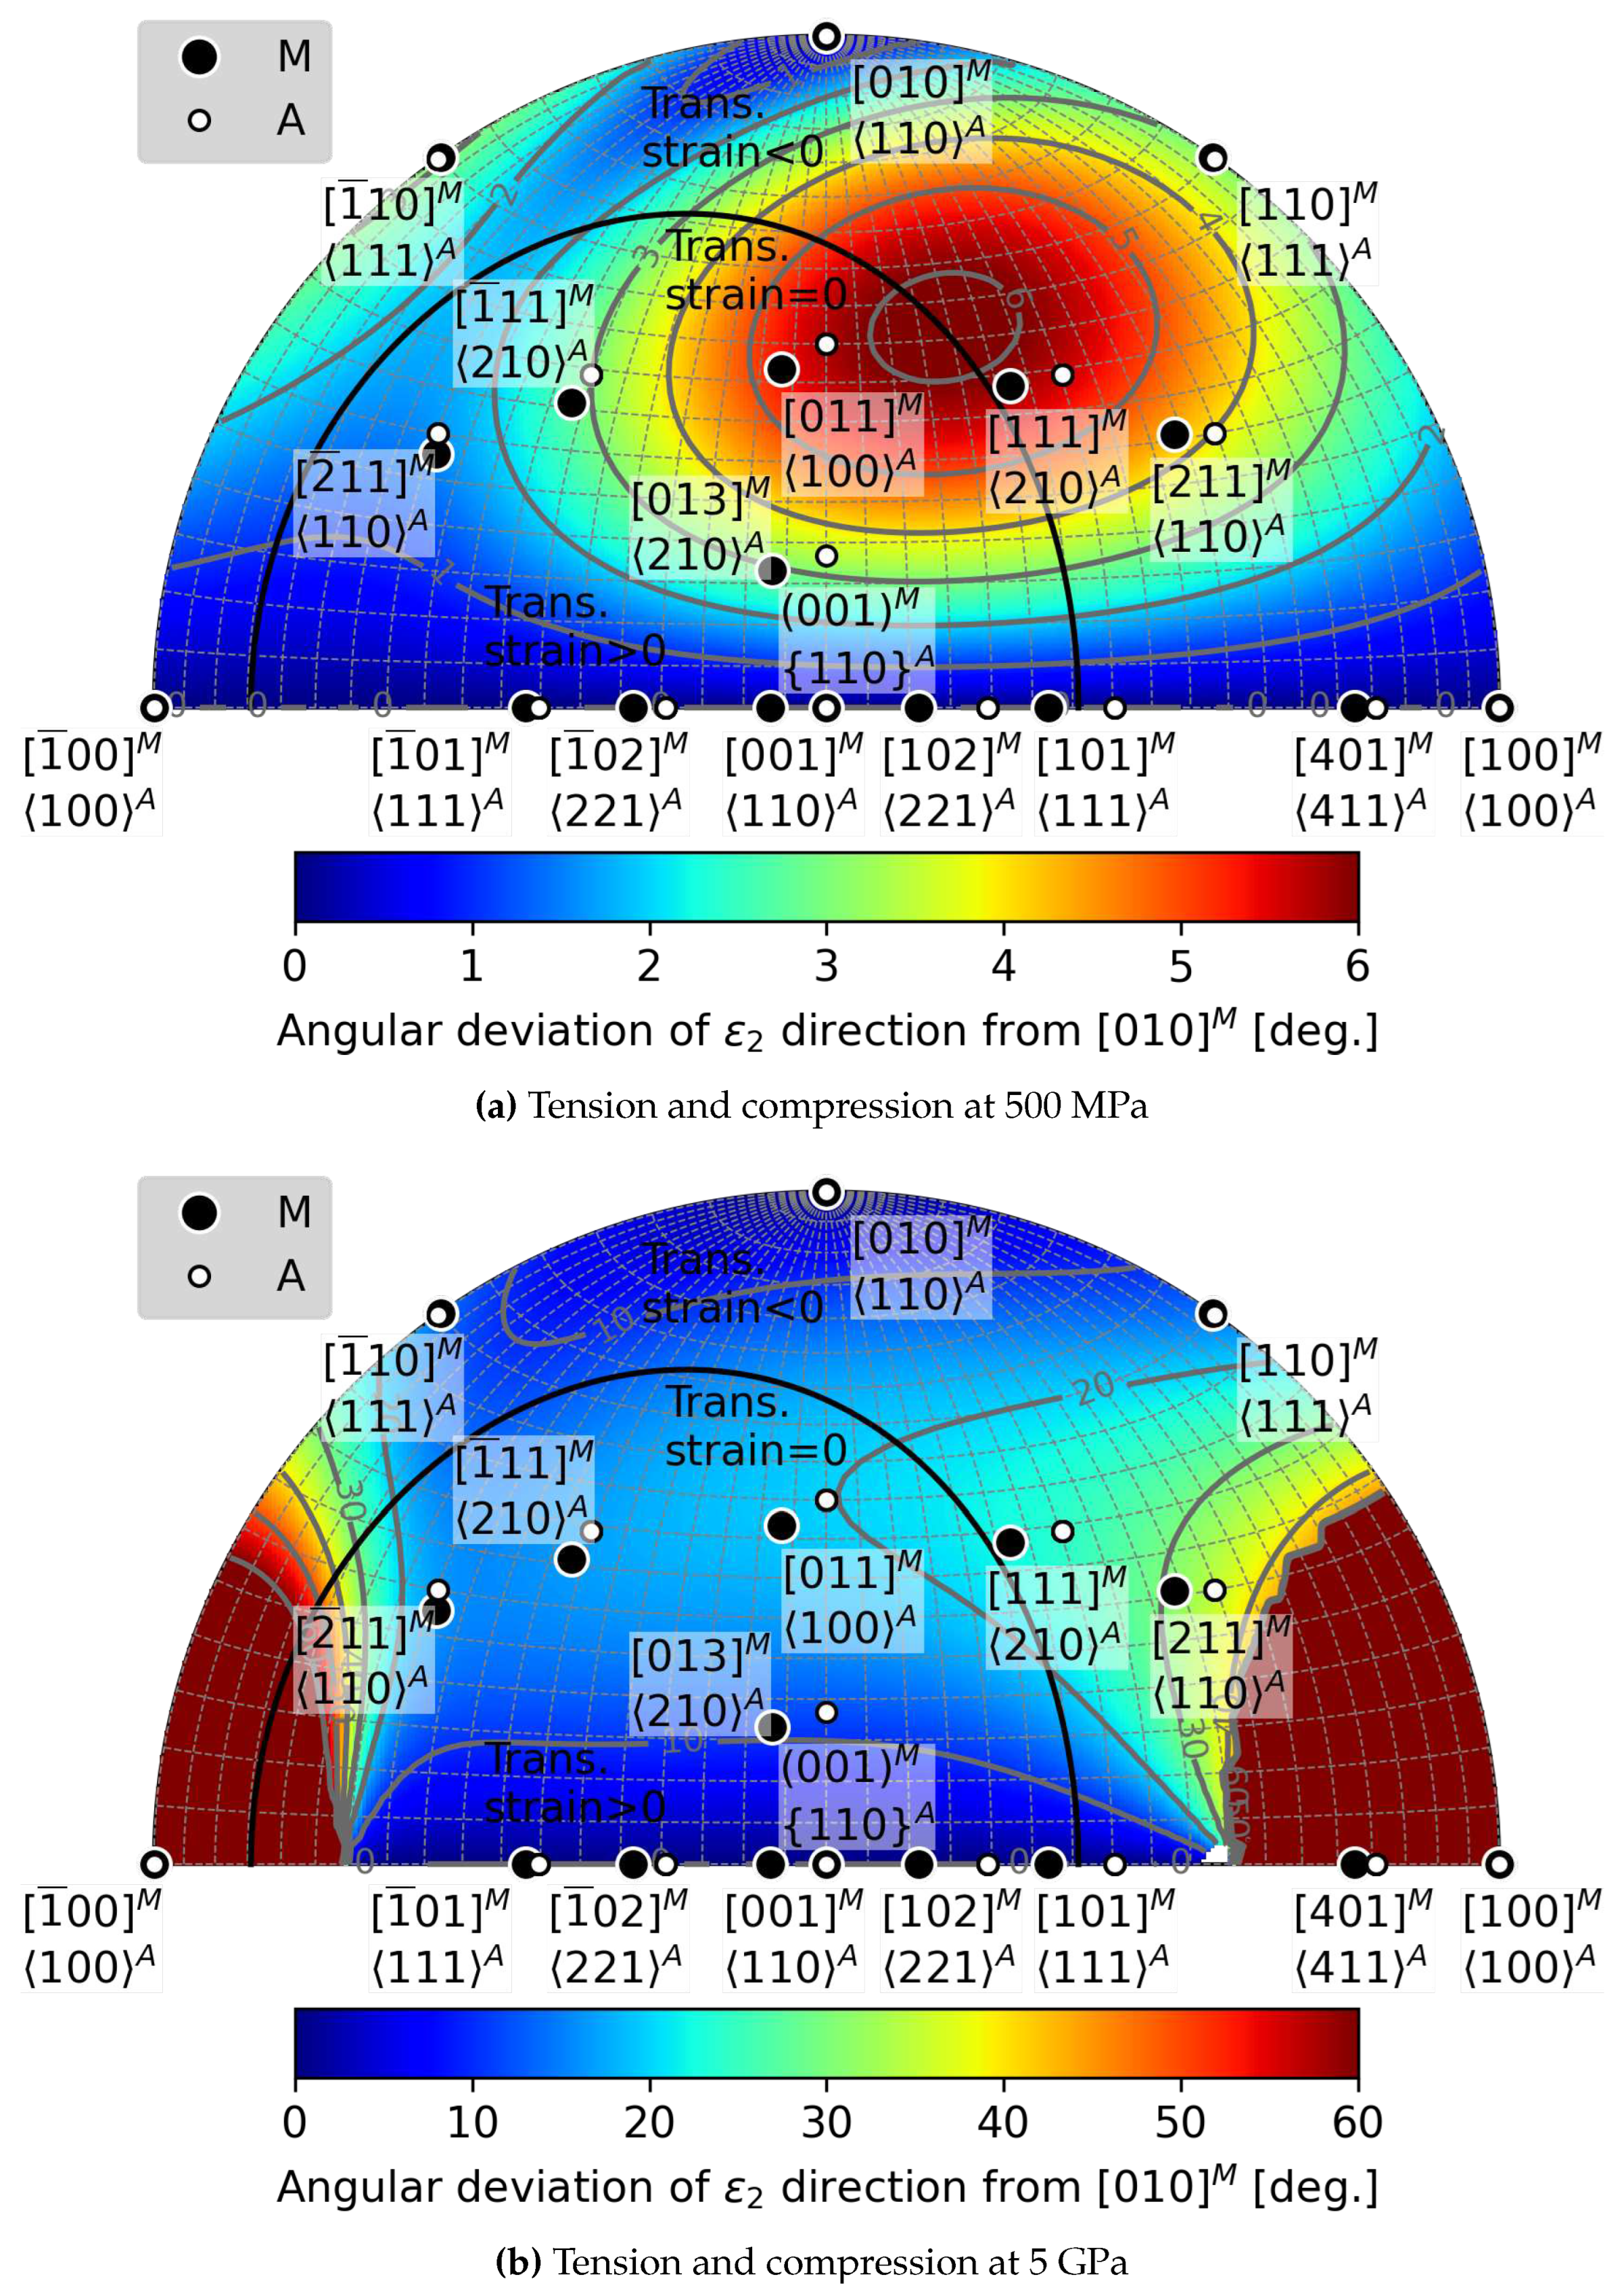
Figure A3. The equal-area projection of the loading direction dependence of the deviation of ε 2 direction from [ 010 ] M due to elastic strains from tensile or compressive loading 500 MPa (a) and 5 GPa (b) as calculated with the referential set of austenite elastic constants
Preprints 88715 g0a3

Appendix B.3. Magnitudes of ε2 for Calculated Habit Planes
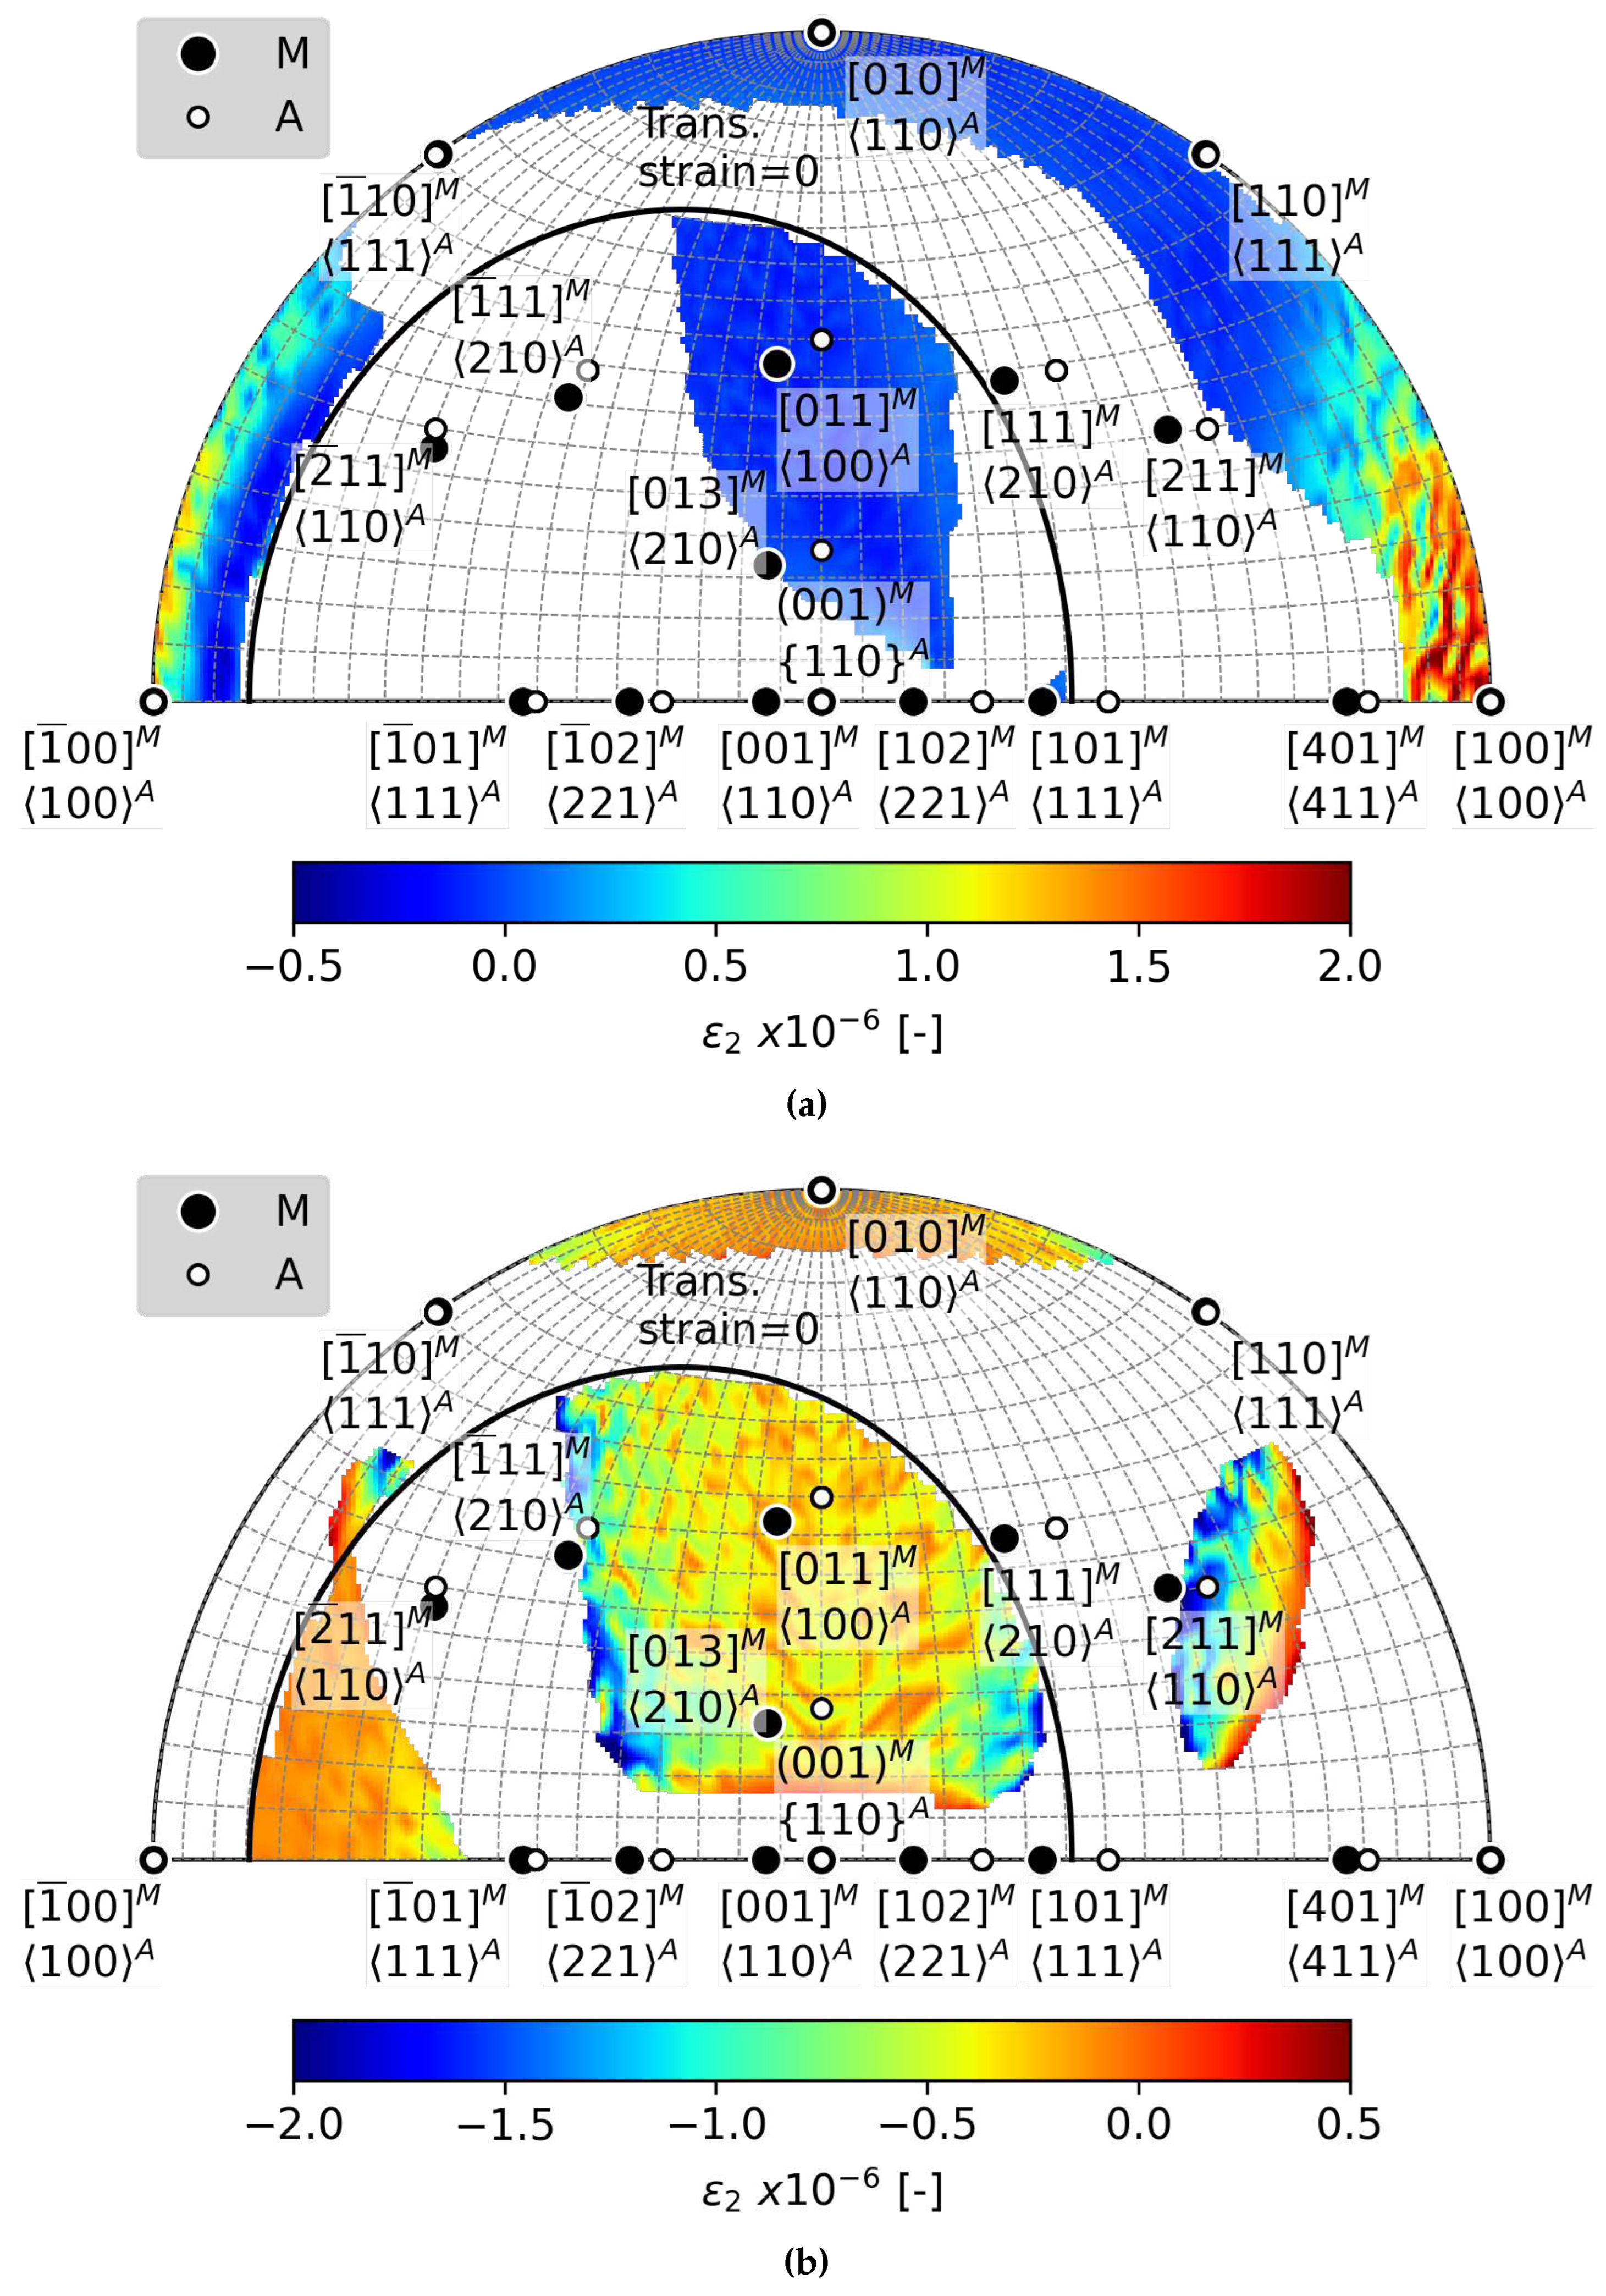
Figure A4. The equal-area projection of the loading direction dependence of the ε 2 for the critical loading condition (a) and simultaneous C’ elastic constant softening (b) that enable for the habit plane formation.
Preprints 88715 g0a4

References

  1. James, R.D.; Zhang, Z.; James, R.D.; Zhang, Z. A Way to Search for Multiferroic Materials with “Unlikely” Combinations of Physical Properties. In Magnetism and Structure in Functional Materials; Planes, A., Manosa, L., Saxena, A., Eds.; Springer Berlin Heidelberg: Berlin, Heidelberg, 2005; pp. 159–175. [Google Scholar] [CrossRef]
  2. Gu, H.; Bumke, L.; Chluba, C.; Quandt, E.; James, R.D. Phase engineering and supercompatibility of shape memory alloys. Mater. Today 2018, 21, 265–277. [Google Scholar] [CrossRef]
  3. Bhattacharya, K. Microstructure of martensite : Why it forms and how it gives rise to the shape-memory effect; Oxford University Press, 2003; p. 288.
  4. Porta, F.D.; Heima, A.; Shinohara, Y.; Akamine, H.; Nishida, M.; Inamura, T. Triplet condition: A new condition of supercompatibility between martensitic phases. J. Mech. Phys. Solids 2022, 169, 105050. [Google Scholar] [CrossRef]
  5. Ball, J.; James, R. Fine phase mixtures as minimizers of energy. Arch. Ration. Mech. Anal. 1987, 100, 13–52. [Google Scholar] [CrossRef]
  6. Hane, K.; Shield, T. Microstructure in the cubic to monoclinic transition in titanium–nickel shape memory alloys. Acta Mater. 1999, 47, 2603–2617. [Google Scholar] [CrossRef]
  7. Miyazaki, S.; Kimura, S.; Otsuka, K.; Suzuki, Y. The habit plane and transformation strains associated with the martensitic transformation in Ti-Ni single crystals. Scr. Metall. 1984, 18, 883–888. [Google Scholar] [CrossRef]
  8. Matsumoto, O.; Miyazaki, S.; Otsuka, K.; Tamura, H. Crystallography of martensitic transformation in Ti-Ni single crystals. Acta Metall. 1987, 35, 2137–2144. [Google Scholar] [CrossRef]
  9. Onda, T.; Bando, Y.; Ohba, T.; Otsuka, K. Electron Microscopy Study of Twins in Martensite in a Ti-50.0 at%Ni Alloy. Mater. Trans. JIM 1992, 33, 354–359. [Google Scholar] [CrossRef]
  10. Cayron, C. What EBSD and TKD Tell Us about the Crystallography of the Martensitic B2-B19’ Transformation in NiTi Shape Memory Alloys. Crystals 2020, 10. [Google Scholar] [CrossRef]
  11. Inamura, T.; Nishiura, T.; Kawano, H.; Hosoda, H.; Nishida, M. Self-accommodation of B19’ martensite in Ti–Ni shape memory alloys. Part III. Analysis of habit plane variant clusters by the geometrically nonlinear theory. Philos. Mag. 2012, 92, 2247–2263. [Google Scholar] [CrossRef]
  12. Waitz, T. The self-accommodated morphology of martensite in nanocrystalline NiTi shape memory alloys. Acta Mater. 2005, 53, 2273–2283. [Google Scholar] [CrossRef]
  13. Heller, L.; Šittner, P.; Sedlák, P.; Seiner, H.; Tyc, O.; Kadeřávek, L.; Sedmák, P.; Vronka, M. Beyond the strain recoverability of martensitic transformation in NiTi. Int. J. Plast. 2019, 116, 232–264. [Google Scholar] [CrossRef]
  14. Chen, Y.; Molnárová, O.; Tyc, O.; Kadeřávek, L.; Heller, L.; Šittner, P. Recoverability of large strains and deformation twinning in martensite during tensile deformation of NiTi shape memory alloy polycrystals. Acta Mater. 2019, 180, 243–259. [Google Scholar] [CrossRef]
  15. Šittner, P.; Sedlák, P.; Seiner, H.; Sedmák, P.; Pilch, J.; Delville, R.; Heller, L.; Kadeřávek, L. On the coupling between martensitic transformation and plasticity in NiTi: Experiments and continuum based modelling. Prog. Mater. Sci. 2018, 98, 249–298. [Google Scholar] [CrossRef]
  16. Šittner, P.; Molnárová, O.; Kadeřávek, L.; Tyc, O.; Heller, L. Deformation twinning in martensite affecting functional behavior of NiTi shape memory alloys. Materialia 2020, 9, 100506. [Google Scholar] [CrossRef]
  17. Alarcon, E.; Heller, L.; de Prado, E.; Kopeček, J. Temperature and microstructure dependent tensile behavior of coarse grained superelastic NiTi. Mater. Des. 2023, 226, 111617. [Google Scholar] [CrossRef]
  18. Delville, R.; Malard, B.; Pilch, J.; Sittner, P.; Schryvers, D. Transmission electron microscopy investigation of dislocation slip during superelastic cycling of Ni–Ti wires. Int. J. Plast. 2011, 27, 282–297. [Google Scholar] [CrossRef]
  19. Heller, L.; Seiner, H.; Šittner, P.; Sedlák, P.; Tyc, O.; Kadeřávek, L. On the plastic deformation accompanying cyclic martensitic transformation in thermomechanically loaded NiTi. Int. J. Plast. 2018, 111, 53–71. [Google Scholar] [CrossRef]
  20. Chen, Y.; Tyc, O.; Molnárová, O.; Heller, L.; Šittner, P. Tensile Deformation of Superelastic NiTi Wires in Wide Temperature and Microstructure Ranges. Shape Mem. Superelasticity 2019, 5, 42–62. [Google Scholar] [CrossRef]
  21. Chen, Y.; Tyc, O.; Kadeřávek, L.; Molnárová, O.; Heller, L.; Šittner, P. Temperature and microstructure dependence of localized tensile deformation of superelastic NiTi wires. Mater. Des. 2019, 174, 107797. [Google Scholar] [CrossRef]
  22. Tyc, O.; Heller, L.; Šittner, P. Tensile Deformation of Superelastic NiTi Wires in Wide Temperature and Microstructure Ranges. Shape Mem. Superelasticity 2021, 7, 65–88. [Google Scholar] [CrossRef]
  23. Liu, Y.; Xie, Z. Detwinning in shape memory alloy. Prog. Smart Mater. Struct. 2007, 3, 29. [Google Scholar]
  24. Molnárová, O.; Tyc, O.; Heller, L.; Seiner, H.; Šittner, P. Evolution of martensitic microstructures in nanocrystalline NiTi wires deformed in tension. Acta Mater. 2021, 218, 117166. [Google Scholar] [CrossRef]
  25. Bian, X.; Heller, L.; Tyc, O.; Kadeřávek, L.; Šittner, P. In-situ synchrotron x-ray diffraction texture analysis of tensile deformation of nanocrystalline superelastic NiTi wire at various temperatures. Mater. Sci. Eng. A 2022, 853, 143725. [Google Scholar] [CrossRef]
  26. Xiao, J.; Cayron, C.; Logé, R. An investigation on reorientation and textural evolution in a martensitic NiTi rolled sheet using EBSD. Int. J. Plast. 2022, 159, 103468. [Google Scholar] [CrossRef]
  27. Bucsek, A.N.; Dale, D.; Ko, J.Y.P.; Chumlyakov, Y.; Stebner, A.P. Measuring stress-induced martensite microstructures using far-field high-energy diffraction microscopy. Acta Crystallogr. Sect. A 2018, 74, 425–446. [Google Scholar] [CrossRef] [PubMed]
  28. Pourbabak, S.; Orekhov, A.; Samaee, V.; Verlinden, B.; Van Humbeeck, J.; Schryvers, D. In-Situ TEM Stress Induced Martensitic Transformation in Ni50.8Ti49.2 Microwires. Shape Mem. Superelasticity 2019, 5, 154–162. [Google Scholar] [CrossRef]
  29. Tirry, W.; Schryvers, D. In situ transmission electron microscopy of stress-induced martensite with focus on martensite twinning. Materials Science and Engineering: A 2008, 481-482, 420–425, Proceedings of the 7th European Symposium on Martensitic Transformations, ESOMAT 2006. [Google Scholar] [CrossRef]
  30. The effect of microstructure on stress-induced martensitic transformation under cyclic loading in the SMA Nickel-Titanium. J. Mech. Phys. Solids 2016, 89, 16–30. [CrossRef]
  31. Xiao, J.; Cayron, C.; Logé, R. Revealing the microstructure evolution of the deformed superelastic NiTi wire by EBSD. Acta Mater. 2023, 255, 119069. [Google Scholar] [CrossRef]
  32. Casalena, L.; Bucsek, A.N.; Pagan, D.C.; Hommer, G.M.; Bigelow, G.S.; Obstalecki, M.; Noebe, R.D.; Mills, M.J.; Stebner, A.P. Structure-Property Relationships of a High Strength Superelastic NiTi–1Hf Alloy. Adv. Eng. Mater. 2018, 20, 1800046. [Google Scholar] [CrossRef]
  33. Ren, X.; Miura, N.; Zhang, J.; Otsuka, K.; Tanaka, K.; Koiwa, M.; Suzuki, T.; Chumlyakov, Y.; Asai, M. A comparative study of elastic constants of Ti–Ni-based alloys prior to martensitic transformation. Mater. Sci. Eng. A 2001, 312, 196–206. [Google Scholar] [CrossRef]
  34. Ding, X.; Zhang, J.; Wang, Y.; Zhou, Y.; Suzuki, T.; Sun, J.; Otsuka, K.; Ren, X. Experimental study of elastic constant softening prior to stress-induced martensitic transformation. Phys. Rev. B 2008, 77, 174103. [Google Scholar] [CrossRef]
  35. S. MIYAZAKI and K. OTSUKA. THE SHAPE MEMORY MECHANISM ASSOCIATED WITH THE MARTENSITIC TRANSFORMATION IN Ti-Ni. Acta Metall. 1989, 7, 1873–1884.
  36. Šittner, P.; Heller, L.; Pilch, J.; Curfs, C.; Alonso, T.; Favier, D. Young’s modulus of austenite and martensite phases in superelastic NiTi wires. J. Mater. Eng. Perform. 2014, 23, 2303–2314. [Google Scholar] [CrossRef]
  37. Iaparova, E.; Heller, L.; Tyc, O.; Sittner, P. Thermally induced reorientation and plastic deformation of B19’ monoclinic martensite in nanocrystalline NiTi wires. Acta Mater. 2023, 242, 118477. [Google Scholar] [CrossRef]
  38. Wagner, M.F.; Windl, W. Lattice stability, elastic constants and macroscopic moduli of NiTi martensites from first principles. Acta Mater. 2008, 56, 6232–6245. [Google Scholar] [CrossRef]
  39. Geometry of crystals, polycrystals, and phase transformations. Geometry of Crystals, Polycrystals, and Phase Transformations, 2017; 1–252. [CrossRef]
  40. Harris, C.R.; Millman, K.J.; van der Walt, S.J.; Gommers, R.; Virtanen, P.; Cournapeau, D.; Wieser, E.; Taylor, J.; Berg, S.; Smith, N.J.; Kern, R.; Picus, M.; Hoyer, S.; van Kerkwijk, M.H.; Brett, M.; Haldane, A.; del Río, J.F.; Wiebe, M.; Peterson, P.; Gérard-Marchant, P.; Sheppard, K.; Reddy, T.; Weckesser, W.; Abbasi, H.; Gohlke, C.; Oliphant, T.E. Array programming with NumPy. Nature 2020, 585, 357–362. [Google Scholar] [CrossRef] [PubMed]
  41. Heller, L. Jupyter notebook containing computations the result of which are presented in this work. The notebook is available for download here. github.com, Accessed 04/10/2023.
  42. Otsuka, K.; Sawamura, T.; Shimizu, K. Crystal structure and internal defects of equiatomic TiNi martensite. Phys. Status Solidi (a) 1971, 5, 457–470. [Google Scholar] [CrossRef]
  43. Knowles, K.; Smith, D. The crystallography of the martensitic transformation in equiatomic nickel-titanium. Acta Metall. 1981, 29, 101–110. [Google Scholar] [CrossRef]
  44. Cayron, C. The Correspondence Theory and Its Application to NiTi Shape Memory Alloys. Crystals 2022, 12. [Google Scholar] [CrossRef]
  45. Otsuka, K.; Ren, X. Physical metallurgy of Ti–Ni-based shape memory alloys. Prog. Mater. Sci. 2005, 50, 511–678. [Google Scholar] [CrossRef]
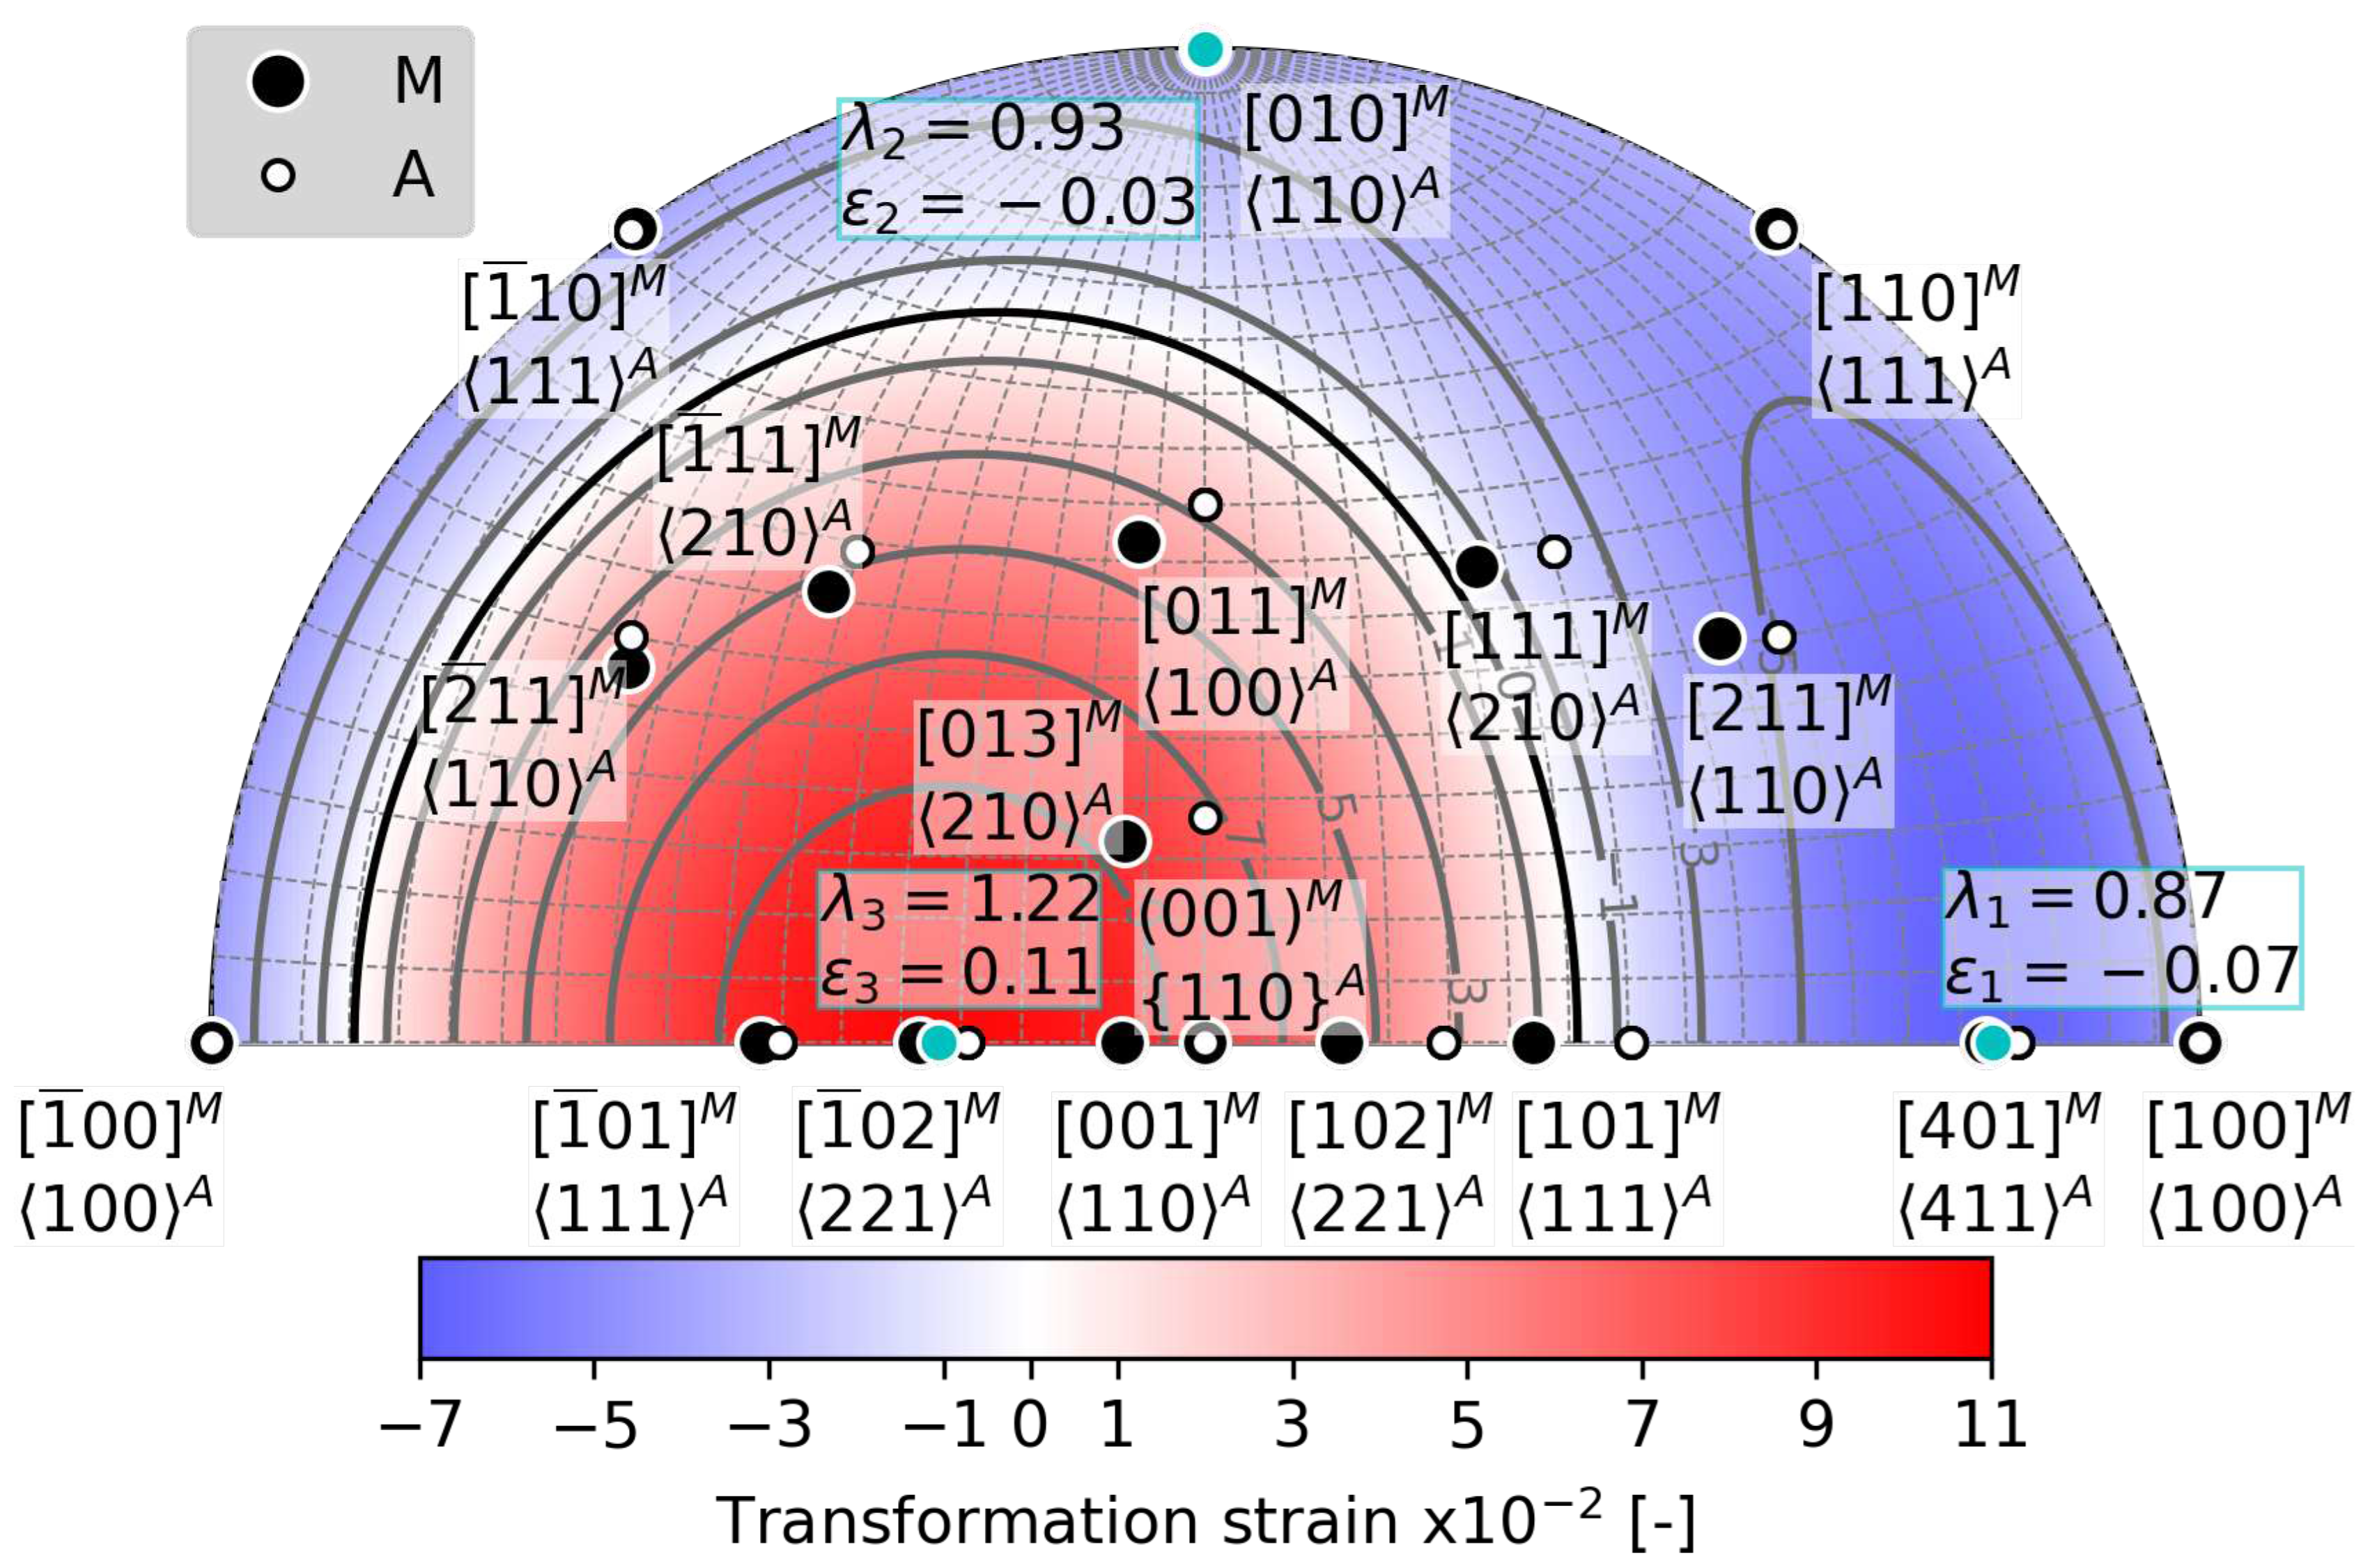
Figure 1. The equal-area projection of the directional transformation strain in the space of martensite lattice. The three principal strain directions are depicted in cyan color while the black isoline connects directions of zero transformation strain. Superscript M and black solid circles denote crystallographic directions of martensite lattice. Superscript A and white solid circles denote crystallographic directions of austenite lattice, considering the orientation relationship of martensitic transformation in NiTi.
Preprints 88715 g001
Figure 2. Geometrical model of austenite and martensite lattices. (a) side view along the direction of the second principal transformation strain reveals the invariant line shared by both lattices. (b) top view along the direction perpendicular to the direction of the second principal strain displayes mismath ε 2 between the two lattices due to which there is no habit plane shared by both lattices.
Preprints 88715 g002
Figure 3. Geometrical model of nondeformed and elastically deformed lattices of austenite and martensite. (a) shows the trace of the habit plane near ( 2 1 1 ) A between austenite and a single variant of martensite enabled by elastic deformation due to uniaxial loading along [ 1.36 1 1 ] A and softening of C’ elastic constant of austenite. Both loading and softening make the second principal transformation ε 2 vanish as shown in top view (b).
Preprints 88715 g003
Figure 5. The equal-area projection of the loading direction dependence of the 2nd principal transformation strain ε 2 for tension (a) and compression (a) at loading magnitude of 500 MPa, calcultaed using the referential set of austenite elastic constants. Loading directions in martensite lattice space that do not impact ε 2 are denoted in white. Loading directions colored red indicate improved compatibility, while the blue loading directions increase the lattice incompatibility.
Preprints 88715 g005
Figure 6. The equal-area projection of the loading direction dependence of the 2nd principal transformation strain ε 2 for tension (a) and compression (a) at loading magnitude of 5 GPa and the referential set of austenite elastic constants. Loading directions in martensite lattice space that do not impact ε 2 are denoted in white. Loading directions colored red indicate improved compatibility, while the blue loading directions increase the lattice incompatibility.
Preprints 88715 g006
Figure 7. The equal-area projection of the loading direction dependence of the 2nd principal transformation strain ε 2 for tension (a) and compression (a) at loading magnitude of 500 MPa when considering elastic softening of austenite C’ elastic constant from 14 GPa down to 2 GPa. Loading directions in martensite lattice space that do not impact ε 2 are denoted in white. Loading directions colored red indicate improved compatibility, while the blue loading directions increase the lattice incompatibility.
Preprints 88715 g007
Figure 8. The equal-area projection shows the critical loading stress dependence on the loading direction which causes ε 2 become zero in tension or compression (a). Tensile loading directions fall within the semi-oval region delineated by the black isoline, while compression loading directions fall outside this region. (b) The same regions of loading orientations are color-coded based on the associated transformation strain in the loading direction. Interactive version of the graphs in Figure 8, Figure 9, Figure 11, Figure 12 can be downloaded here.
Preprints 88715 g008
Figure 9. The poles of habit planes between austenite and a single variant of martensite when the critical uniaxial stress causing ε 2 to become zero is applied. These poles are scaled and color-coded based on the associated transformation strain into the loading direction. The habit planes resulting from critical compression loading are displayed in (a). The critical loading under tension leads to the formation of habit planes, whose poles are shown in (b). Histogram of habit plane poles weighted on the magnitude of transformation strain and normalized to the maximum of the bin counts for compression (c) and tension (d). Habit planes denoted Exp1-Exp4 in (b) and (d) were reported from experiments under tension in [7,8,35]. Interactive version of the graphs in Figure 8, Figure 9, Figure 11, Figure 12 can be downloaded here.
Preprints 88715 g009
Figure 10. Selected poles of habit planes between austenite and a single variant of martensite when the critical uniaxial stress causing ε 2 to become zero is applied. The habit planes resulting from critical compression loading displayed in (a) are associated with transformation strain magnitudes larger than 5 %. The habit planes resulting from critical tension loading displayed in (b) are associated with transformation strain magnitudes larger than 8 %. Habit planes denoted Exp1-Exp4 in (b) were reported from experiments under tension in [7,8,35].
Preprints 88715 g010
Figure 11. The equal-area projection shows the critical C’ softening which causes ε 2 become zero under the stress of 500 MPa in tension or compression (a). Tensile loading directions fall within the semi-oval region delineated by the black isoline, while compression loading directions fall outside this region. (b) The same regions of loading orientations are color-coded based on the associated transformation strain in the loading direction. Interactive version of the graphs in Figure 8, Figure 9, Figure 11, Figure 12 can be downloaded here.
Preprints 88715 g011
Figure 12. The poles of habit planes between austenite and a single variant of martensite when the critical C’ softening causes ε 2 to become zero under the stress of 500 MPa in tension or compression. These poles are scaled and color-coded based on the associated transformation strain into the loading direction. The habit planes resulting from critical compression loading are displayed in (a). The critical loading under tension leads to the formation of habit planes, whose poles are shown in (b). Histogram of habit plane poles weighted on the magnitude of transformation strain and normalized to the maximum of the bin counts for compression (c) and tension (d). Habit planes denoted Exp1-Exp4 in (b) and (d) were reported from experiments under tension in [7,8,35]. Interactive version of the graphs in Figure 8, Figure 9, Figure 11, Figure 12 can be downloaded here.
Preprints 88715 g012
Figure 13. The poles of habit planes between austenite and a single variant of martensite when the critical C’ softening causes ε 2 to become zero under the stress of 500 MPa in compression (a) and tension (b) selected from Figure 12a and 12b such that the associated transformation strain magnitudes are larger than 5 % for compression in (a) and 8 % for tension in (b). Habit planes denoted Exp1-Exp4 in (b) were reported from experiments under tension in [7,8,35].
Preprints 88715 g013
Table 1. A referential set of elastic constants of austenite, which are considered in this work according to the experimental results [33].
C 11 A r C 12 A r C 44 A r C A r = C 11 A r C 12 A r 2 A A r = C 44 A r C A r
[GPa] [GPa] [GPa] [GPa] [-]
169 141 33 14 2.4
Table 2. Elasticity constants of martensite considered in this paper from ab-initio calculations [38].
C 11 M C 12 M C 13 M C 15 M C 22 M C 23 M C 25 M C 33 M C 35 M C 44 M C 46 M C 55 M C 66 M
[GPa] [GPa] [GPa] [GPa] [GPa] [GPa] [GPa] [GPa] [GPa] [GPa] [GPa] [GPa] [GPa]
223 129 99 27 241 125 -9 200 4 76 -4 21 77
Disclaimer/Publisher’s Note: The statements, opinions and data contained in all publications are solely those of the individual author(s) and contributor(s) and not of MDPI and/or the editor(s). MDPI and/or the editor(s) disclaim responsibility for any injury to people or property resulting from any ideas, methods, instructions or products referred to in the content.
Copyright: This open access article is published under a Creative Commons CC BY 4.0 license, which permit the free download, distribution, and reuse, provided that the author and preprint are cited in any reuse.
Prerpints.org logo

Preprints.org is a free preprint server supported by MDPI in Basel, Switzerland.

Subscribe

© 2024 MDPI (Basel, Switzerland) unless otherwise stated