1. Introduction
Obesity is complex chronic relapsing disease linked with superfluous mortality and morbidity by being directly connected with a numeral metabolic, mechanical, and inflammatory disorders complications like non-alcoholic fatty liver, type 2 diabetes mellitus, dyslipidemia, autoimmune diseases, altered immune responses, sleep apnoea, cancer, renal and cardiovascular diseases [
1,
2]. It is characterized as a low-intensity inflammatory state in which there is parallel decrease in adiponectin and IL-10 (anti-inflammatory cytokines) and increased secretion of leptin, IL-8, IL-6, TNF-α and IL-1β [
3]. Multiple factors are involved in the obesity pathogenicity that include impaired neuroendocrine feedback, altered brain circuits and the disproportion between expenditure and intake of energy [
4]. Obesity prevalence has dramatically increased globally, become a main communal health problem and widening between socioeconomic groups due to industrialization of food production and increased sedentary lifestyles [
1]. T2DM is principal metabolic complications of obesity allied with insulin resistance characterized by insufficient secretion of insulin and peripheral insulin resistance in skeletal muscle, adipose tissue and liver. Insulin resistance and T2DM underlying abnormalities can be improved by decreasing the weight [
4]. The development of innovative and alternative anti-adipogenic, lipolytic and antidiabetic pharmaceuticals from natural sources is very desirable to lessen drawbacks associated with the use of synthetic antidiabetic medications, including drug resistance, side effects and toxicity [
5]. Human diet composed of vegetables and fruits are considered most imperative sources of phytochemicals. These phytochemicals have antiviral anti-inflammatory, antioxidants, antithrombotic, antibacterial, cholesterol lowering and antifungal properties [
6]. These plant based chemical compounds effects the human body through similar mechanisms that are already known for the chemical compounds [
7].
Ficus carica L. (family Moraceae) is oldest cultivated seasonal fruit bearing plant originated from the Middle East contain more than 800 species of epiphytes, shrubs and trees [
8]. Traditionally it is used for the treatment of diabetes, ulcer, cancer, inflammation, asthma, menstruation pain, paralysis, scabies and gonorrhea. It possesses antipyretic, purgative, aphrodisiac, antioxidant, antimicrobial, antifungal and hypotensive properties and used for cough and vomiting [
8,
9,
10]. Chemically it contains ceramides, cerebrosides, steroids, pentacyclic triterpenes, flavonoids, fibers, chlorogenic acid, rutin, luteolin, (+)-Catechin [
8], caffeoylmalic acid, psoralic acid-glucoside, psoralen [
10], minerals, vitamins, β-amyrins, arabinose, β-carotene, β-sitosterols, glycosides, carbohydrates, polyphenols, organic acids, sugars [
9], phenolic compounds, phytosterols, triterpenoids, coumarins and aliphatic alcohols [
6]. According to our best knowledge, there is no previous works about the phenolic and flavonoids compound estimation, antioxidant potential, biological activities and FTIR, HPLC and LCMS/MS of
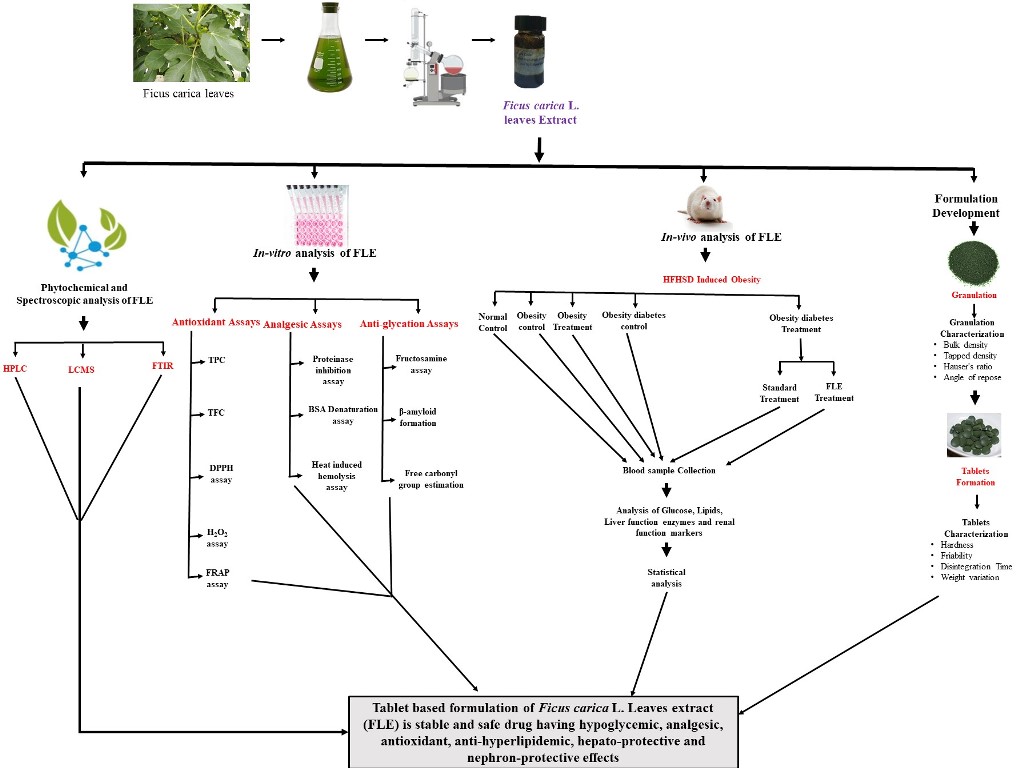
Ficus carica leaves. Hence, this work was planned with objectives to carry out the physicochemical and phytochemical analysis, profiling of phenolic compounds, biological evaluation, determine the antioxidant capacity, FTIR, HPLC, LCMS/MS and development of formulation.
2. Results
Table 1.
Physicochemical analysis of Ficus carica L. leaves.
Table 1.
Physicochemical analysis of Ficus carica L. leaves.
| Loss on drying |
Total Ash value |
Acid-insoluble ash |
Water-soluble ash |
| 6.2017(%) |
22.48(%) |
7.68(%) |
13.57(%) |
Table 2.
Phytochemical screening of Ficus carica L. ethanolic leaf extract.
Table 2.
Phytochemical screening of Ficus carica L. ethanolic leaf extract.
| Sr. No |
Phytochemical constituents |
Result |
| 1 |
Glycosides |
+ |
| 2 |
Terpenoids |
+++ |
| 3 |
Tannins |
+ |
| 4 |
Phenols |
+ |
| 5 |
Alkaloids |
+++ |
| 6 |
Resins |
+ |
| 7 |
Flavonoids |
++ |
| 8 |
Saponins |
- |
| 9 |
Sterol |
+ |
| 10 |
Steroids |
++ |
| 11 |
Proteins |
++ |
| 12 |
Fixed oils |
+ |
| 13 |
Gums |
+ |
| 14 |
Mucilage |
+ |
| 15 |
Carbohydrates |
++ |
Figure 1.
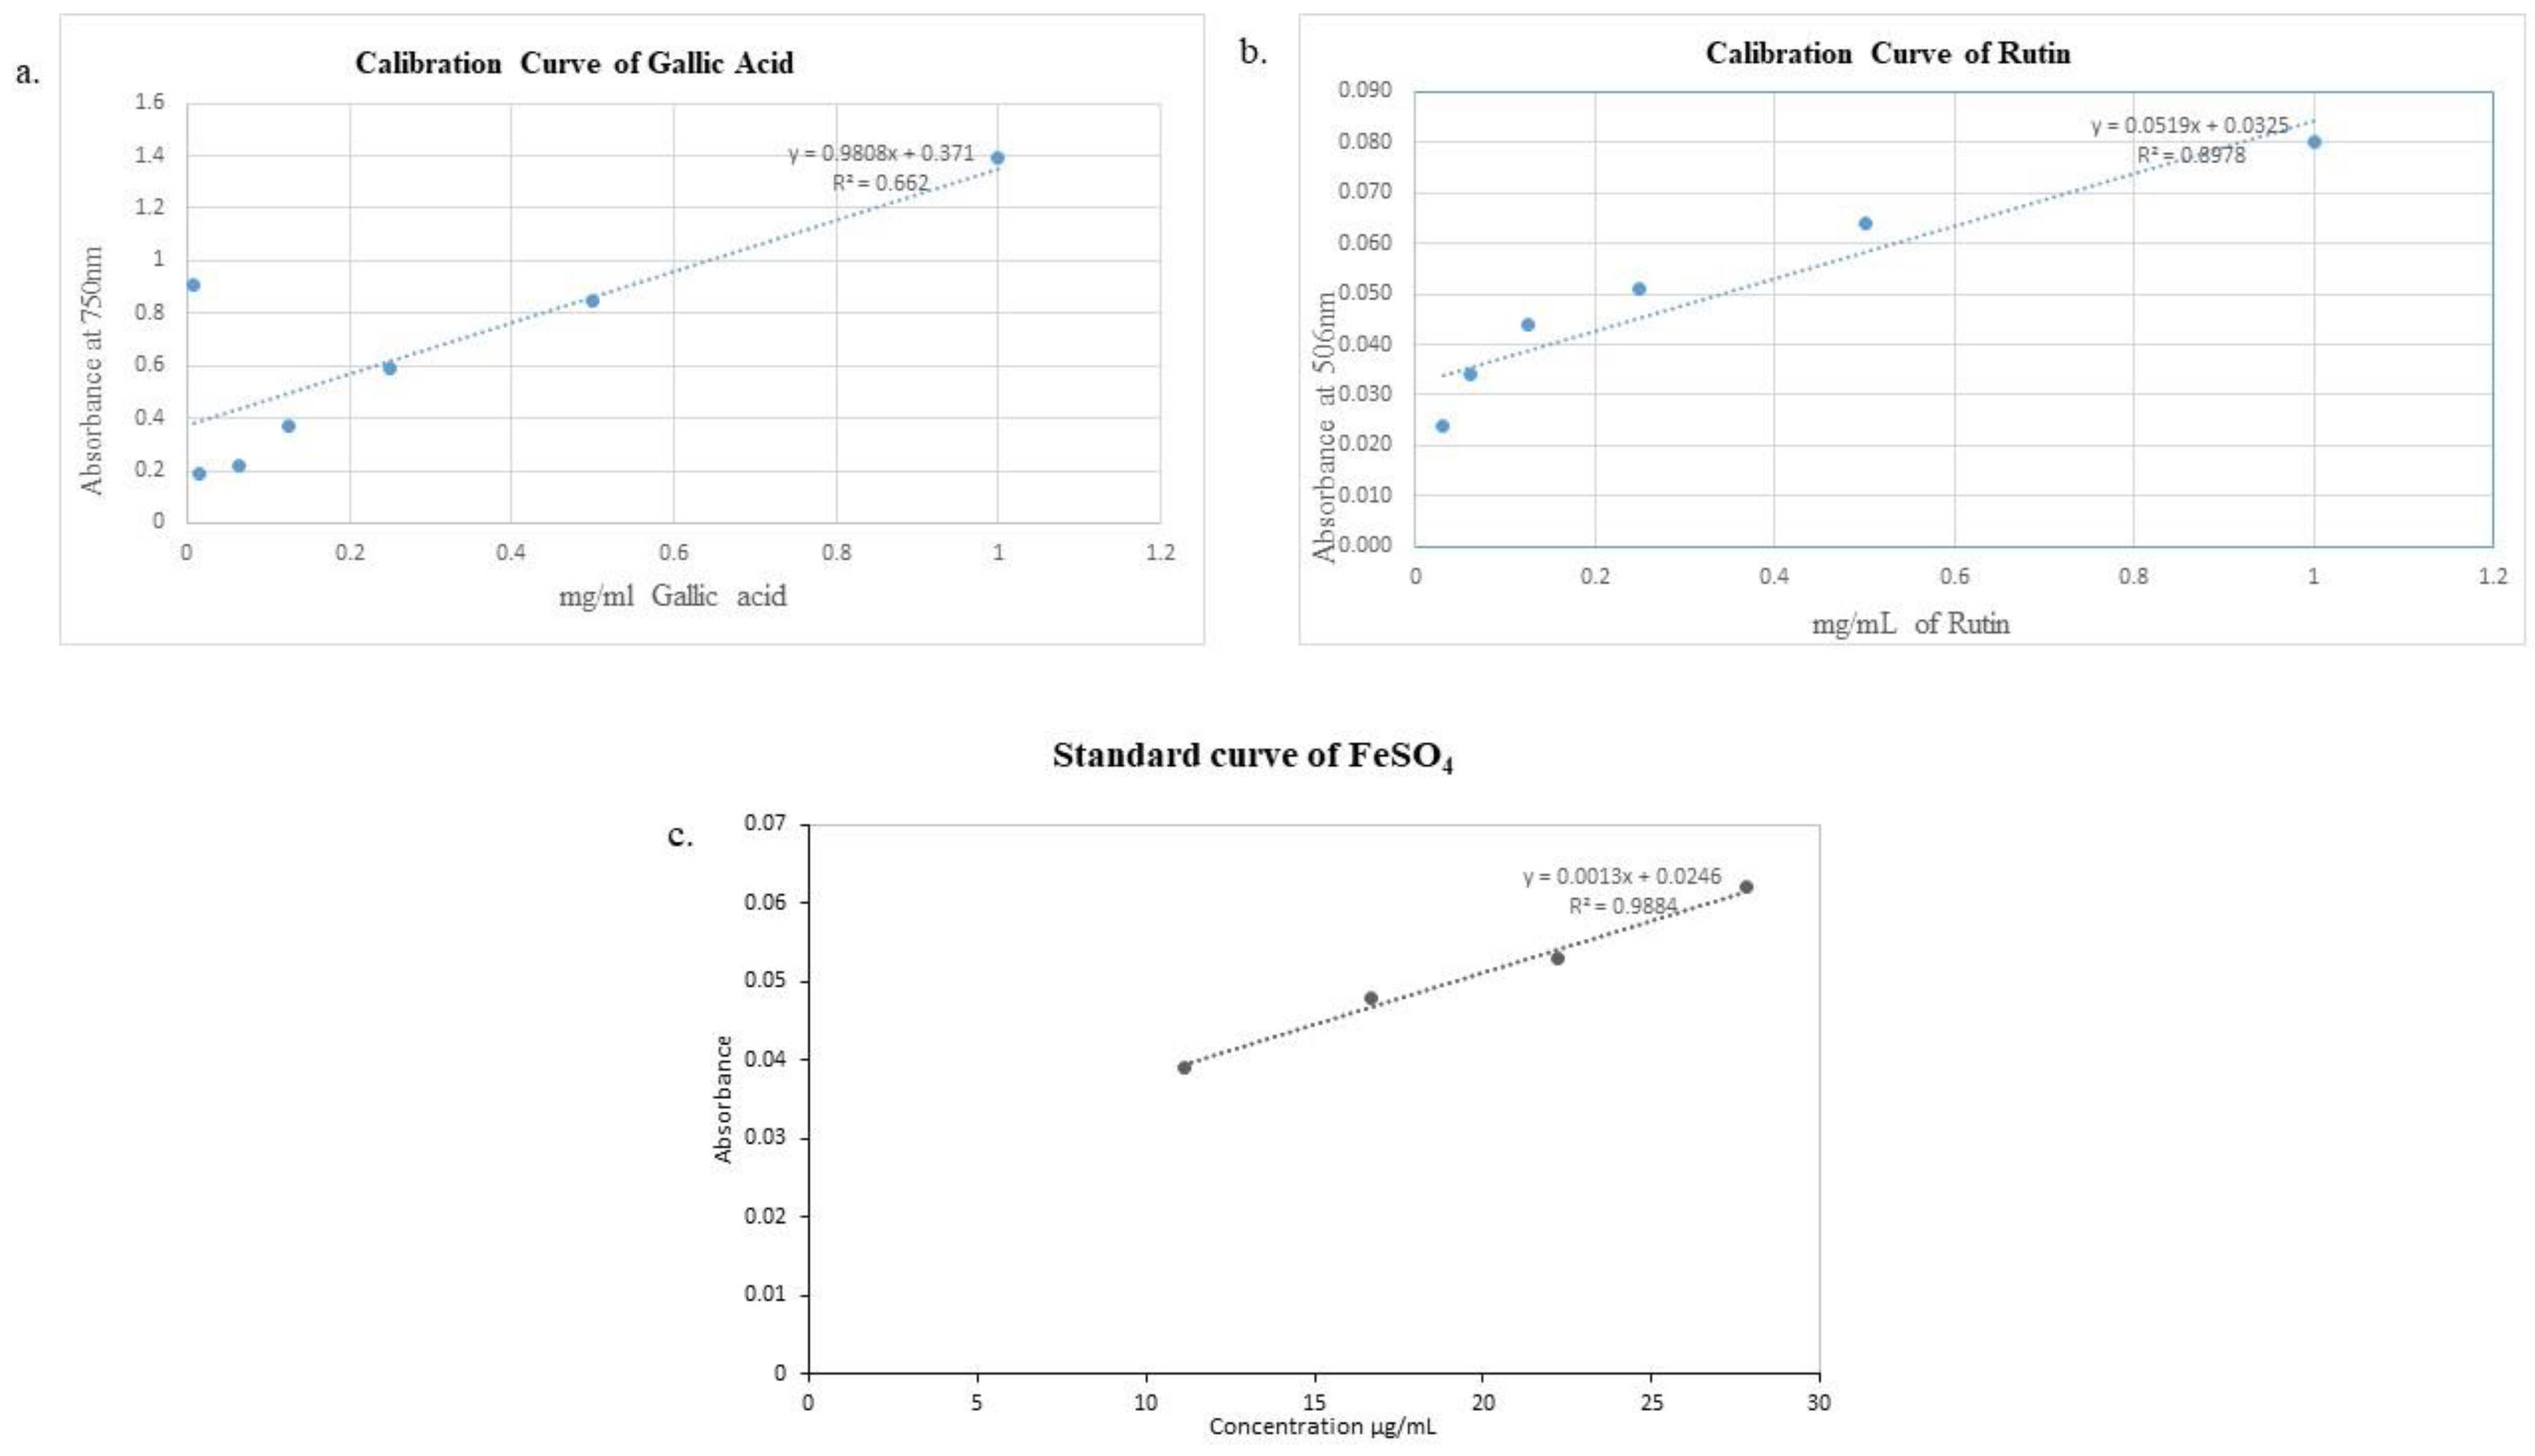
Calibration curve of a) Gallic acid, b) Rutin, c) Ferrous sulfate.
Figure 1.
Calibration curve of a) Gallic acid, b) Rutin, c) Ferrous sulfate.
Table 3.
Antioxidant analysis of ethanolic extract of Ficus carica L. Leaves (FLE).
Table 3.
Antioxidant analysis of ethanolic extract of Ficus carica L. Leaves (FLE).
| Sr. No |
Parameter |
Unit |
Plant extract |
Standard |
| 1 |
TPC |
Mg of GAE/g |
153±2.51 |
186±1.23 |
| 2 |
TFC |
Mg RE/g |
73±4.01 |
99± 0.43 |
| 3 |
H2O2 Assay |
% inhibition |
35.6±0.023 |
71.2±0.008 |
| 4 |
DPPH Assay |
IC50 (mg/mL) |
0.58 |
0.013 |
| 5 |
FRAP Assay |
µg/g of FeSO4
|
88.76 |
|
Table 4.
Analgesic and anti-inflammatory potential of Ficus carica L. Leaves extract (FLE).
Table 4.
Analgesic and anti-inflammatory potential of Ficus carica L. Leaves extract (FLE).
| Sr. No |
Parameter |
Unit |
Plant extract |
Sta0ndard |
| 1 |
Proteinase inhibition activity |
% inhibition |
28 ± 0.01 |
84 ± 0.05 |
| 2 |
Heat induced hemolysis |
% inhibition |
55 ± 0.03 |
86 ± 0.05 |
| 3 |
*BSA denaturation assay |
% inhibition |
51.2 ± 0.05 |
54.2 ± 0.05 |
Table 5.
Antiglycation potential of Ethanolic extract of Ficus carica L. Leaves (FLE).
Table 5.
Antiglycation potential of Ethanolic extract of Ficus carica L. Leaves (FLE).
| Sr. No |
Parameter |
Unit |
Plant extract |
Standard |
| 1 |
β-Amyloid Formation |
Absorbance |
0.017 |
0.12 |
| 2 |
Fructosamine assay |
% inhibition |
19.4±0.06 |
|
| 3 |
Free carbonyl group estimation |
% inhibition |
17.0±0.03 |
|
Table 6.
Effect of ethanolic extract of Ficus carica L. leaves (FLE) on body weight at different days.
Table 6.
Effect of ethanolic extract of Ficus carica L. leaves (FLE) on body weight at different days.
Treatment
Group |
|
Weight of Animals (g) |
| 1st Day |
8 Weeks |
8 Weeks 2 Days |
12 Weeks |
| NC |
103.7±3.65 |
145.2±2.21 |
145.8±2.56 |
171.7±2.74 |
| OC |
108.5±2.37 |
296.7±2.56 |
297.9±2.18 |
387.3±5.37#
|
| OT |
103.1±3.71 |
281.4±2.35 |
282.6±2.45 |
195.7±2.26***
|
| ODC |
101.9±2.62 |
296.8±3.40 |
280.3±2.98 |
320.8±2.12#
|
| ODT |
102.3±3.07 |
302.3±2.82 |
293.7±1.92 |
193.4±2.12***
|
| ODFLE1 |
102.4±3.13 |
291.7±2.74 |
278.5±3.14 |
265.7±2.86*
|
| ODFLE2 |
100.7±2.74 |
300.3±5.37 |
284.4±4.76 |
230.8±2.24**
|
| ODFLE3 |
101.3±5.37 |
296.7±2.26 |
281.5±2.06 |
199.6±1.98***
|
Figure 2.
Changes in glucose levels of Wistar albino rats STZ was administered via the intraperitoneal route after obesity induction in rats by feeding with HFHSD for 8 weeks followed by atorvastatin 60 mg/Kg, glibenclamide 10 mg/Kg and FLE doses at 100, 250 and 500 mg/Kg of body weight along with HFHSD for 4 weeks’ treatment period. (a) Glucose was measured with glucometer. Mean ± SEM of n=6. Every group was analyzed by using two-way ANOVA followed by Tukey’s test. At 1st day all the groups showed (ns) non-significant variations as compared to NC group. After 8 weeks’ period, all the groups showed very significant (###) with p < 0.001 as compared to NC group. After 8 weeks’ 2 days period, all the groups showed very significant (###) with p < 0.001 as compared to NC group. After 12 weeks, results of OC group were compared with OT and ODC group is compared to ODT, ODFLE1, ODFLE2 and ODFLE3 groups, results are considered (ns) non-significant if p > 0.05, significant (∗) if p < 0.05, more significant (∗∗) if p < 0.01, very significant (∗∗∗) if p < 0.001, and highly significant (∗∗∗∗) if p < 0.0001. When the NC group was compared with OC group and ODC group, results are expressed very significant (###) if p < 0.001.
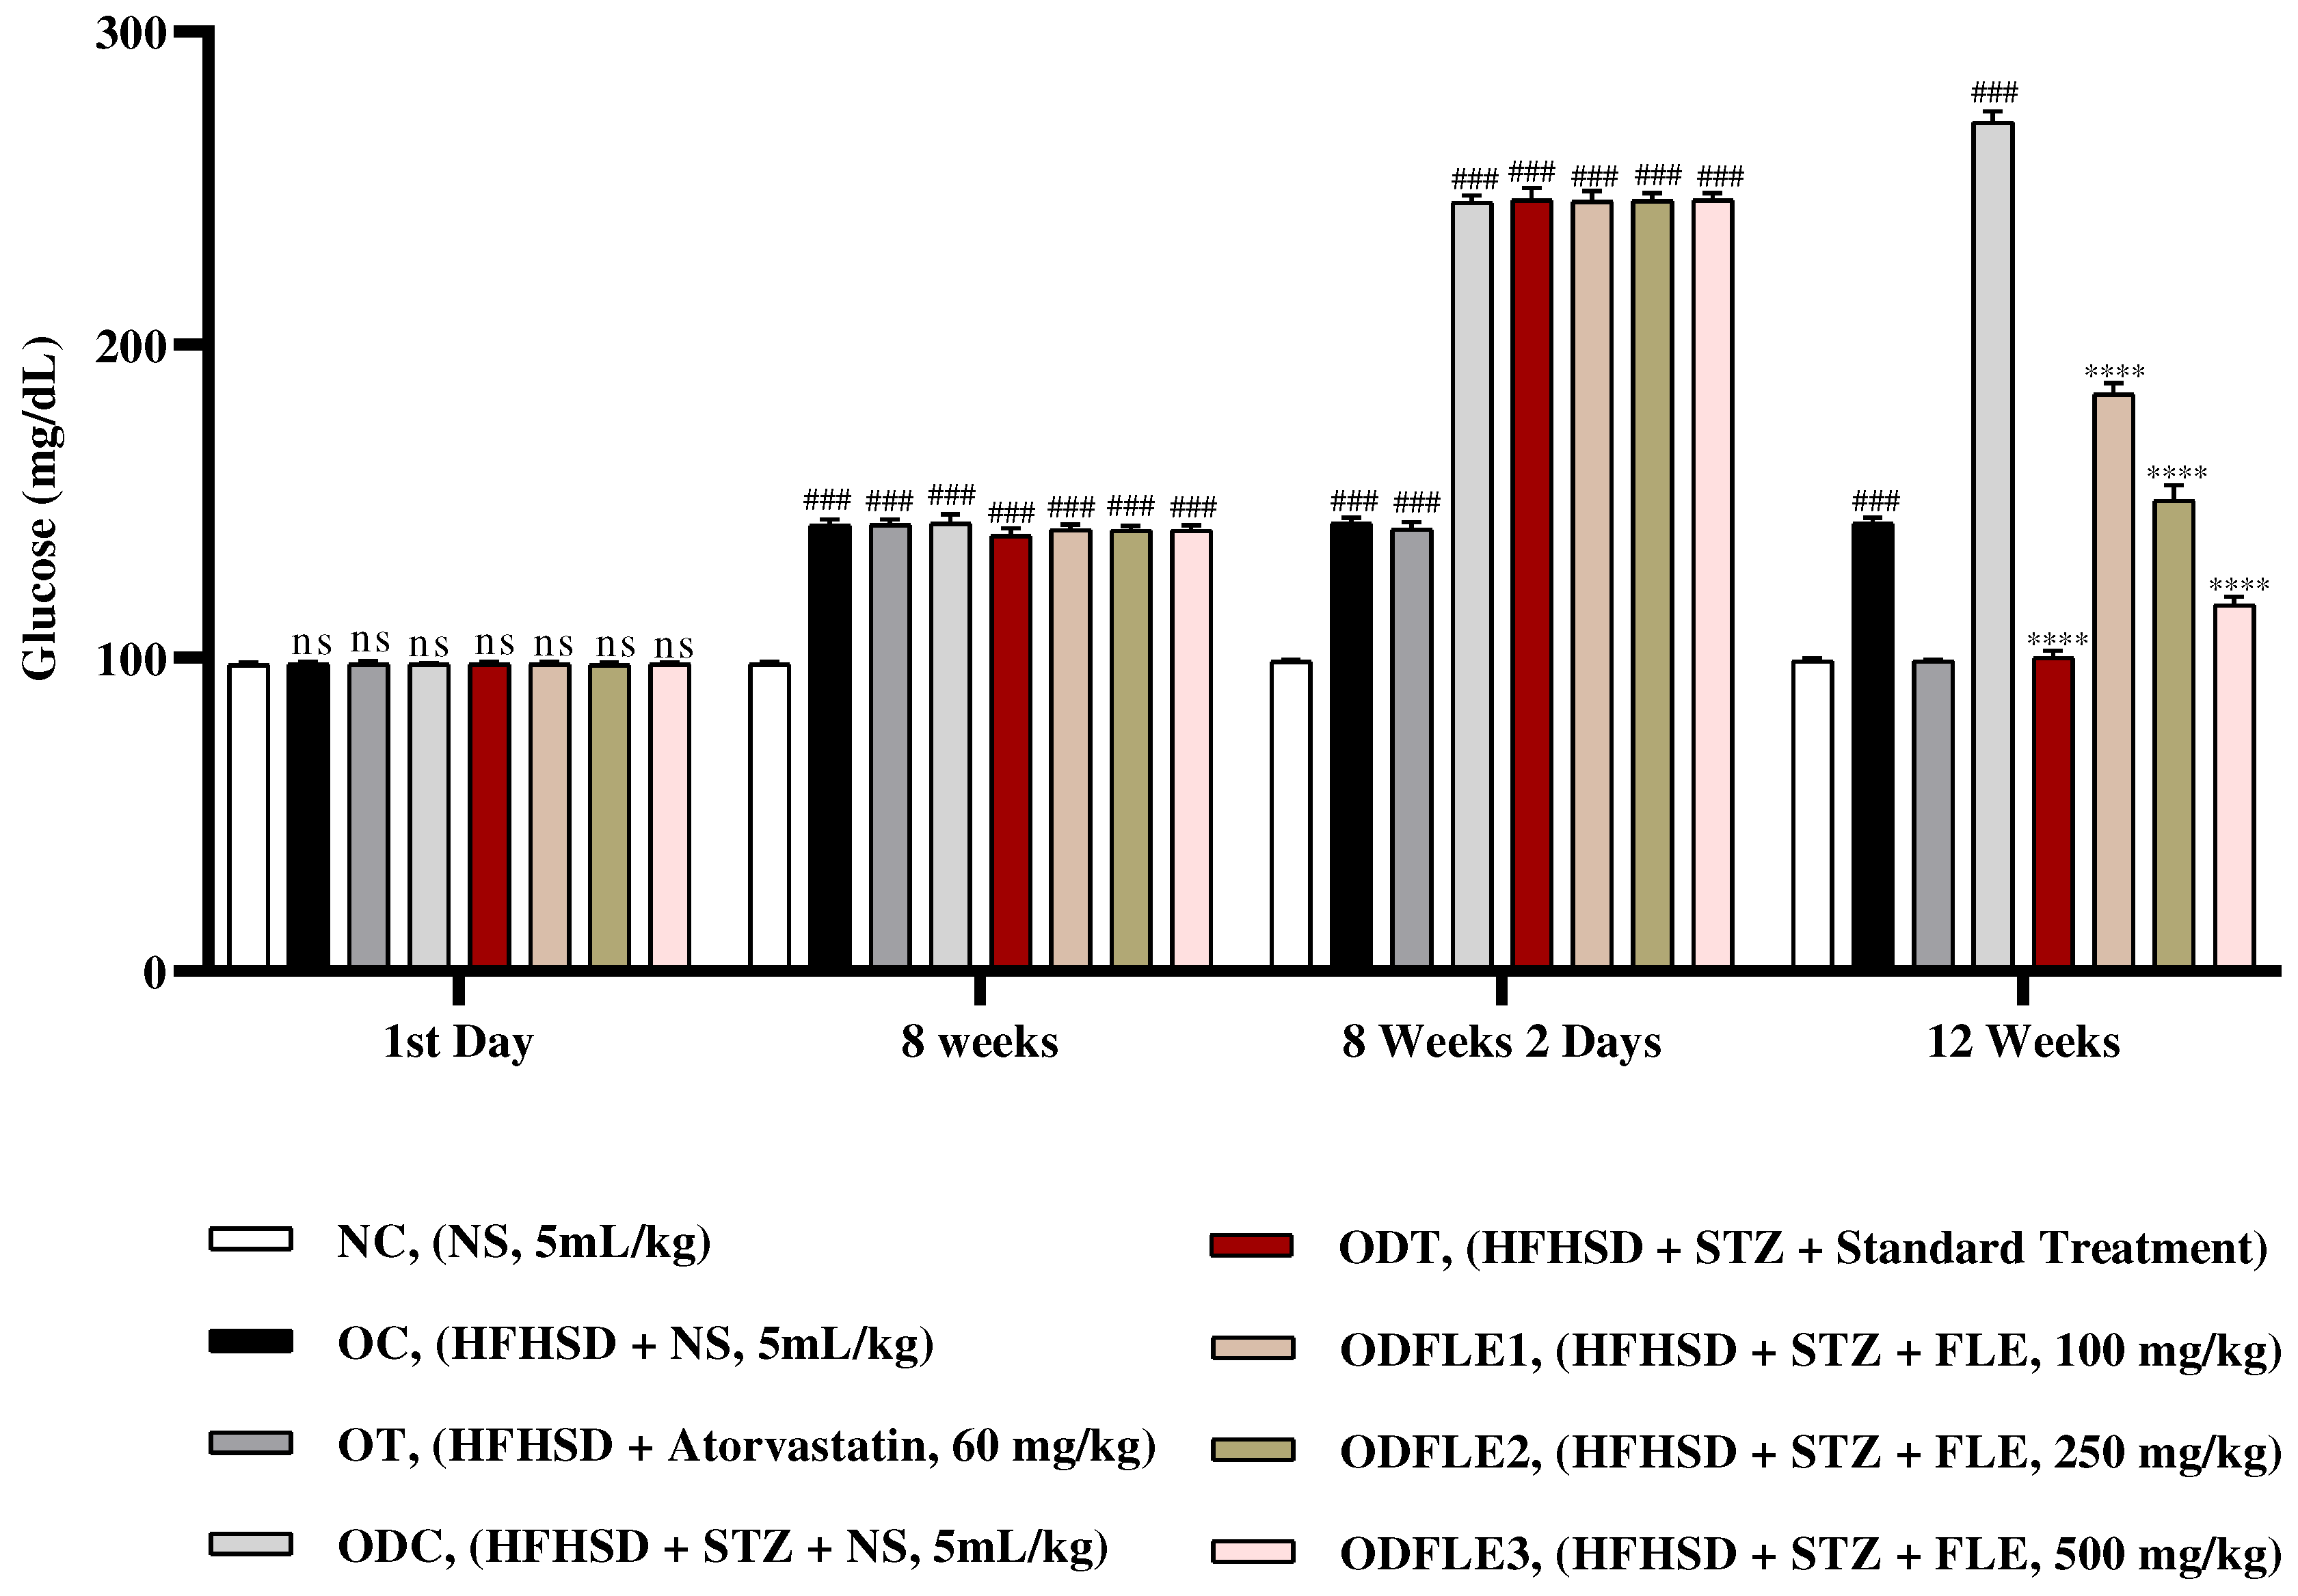
Figure 3.
Changes in total cholesterol (TC) levels of Wistar albino rats STZ was administered via the intraperitoneal route after obesity induction in rats by feeding with HFHSD for 8 weeks followed by atorvastatin 60 mg/Kg, glibenclamide 10 mg/Kg and FLE doses at 100, 250 and 500 mg/Kg along with HFHSD for 4 weeks’ treatment period. (a) Total cholesterol was measured by means of commercial kit. Mean ± SEM of n=6. Each group is analyzed using two-way ANOVA followed by Tukey’s test. At 1st day all the groups showed non-significant (ns) variations as compared to NC group. After 8 weeks’ period, all the groups showed very significant (###) with p < 0.001 as compared to NC group. After 12 weeks, results of OC group were compared with OT and ODC group is compared to ODT, ODFLE1, ODFLE2 and ODFLE3 groups, results are considered (ns) non-significant if p > 0.05, significant (∗) if p < 0.05, more significant (∗∗) if p < 0.01, very significant (∗∗∗) if p < 0.001, and highly significant (∗∗∗∗) if p < 0.0001. When the NC group was compared with OC group and ODC group, results are expressed very significant (###) if p < 0.001.
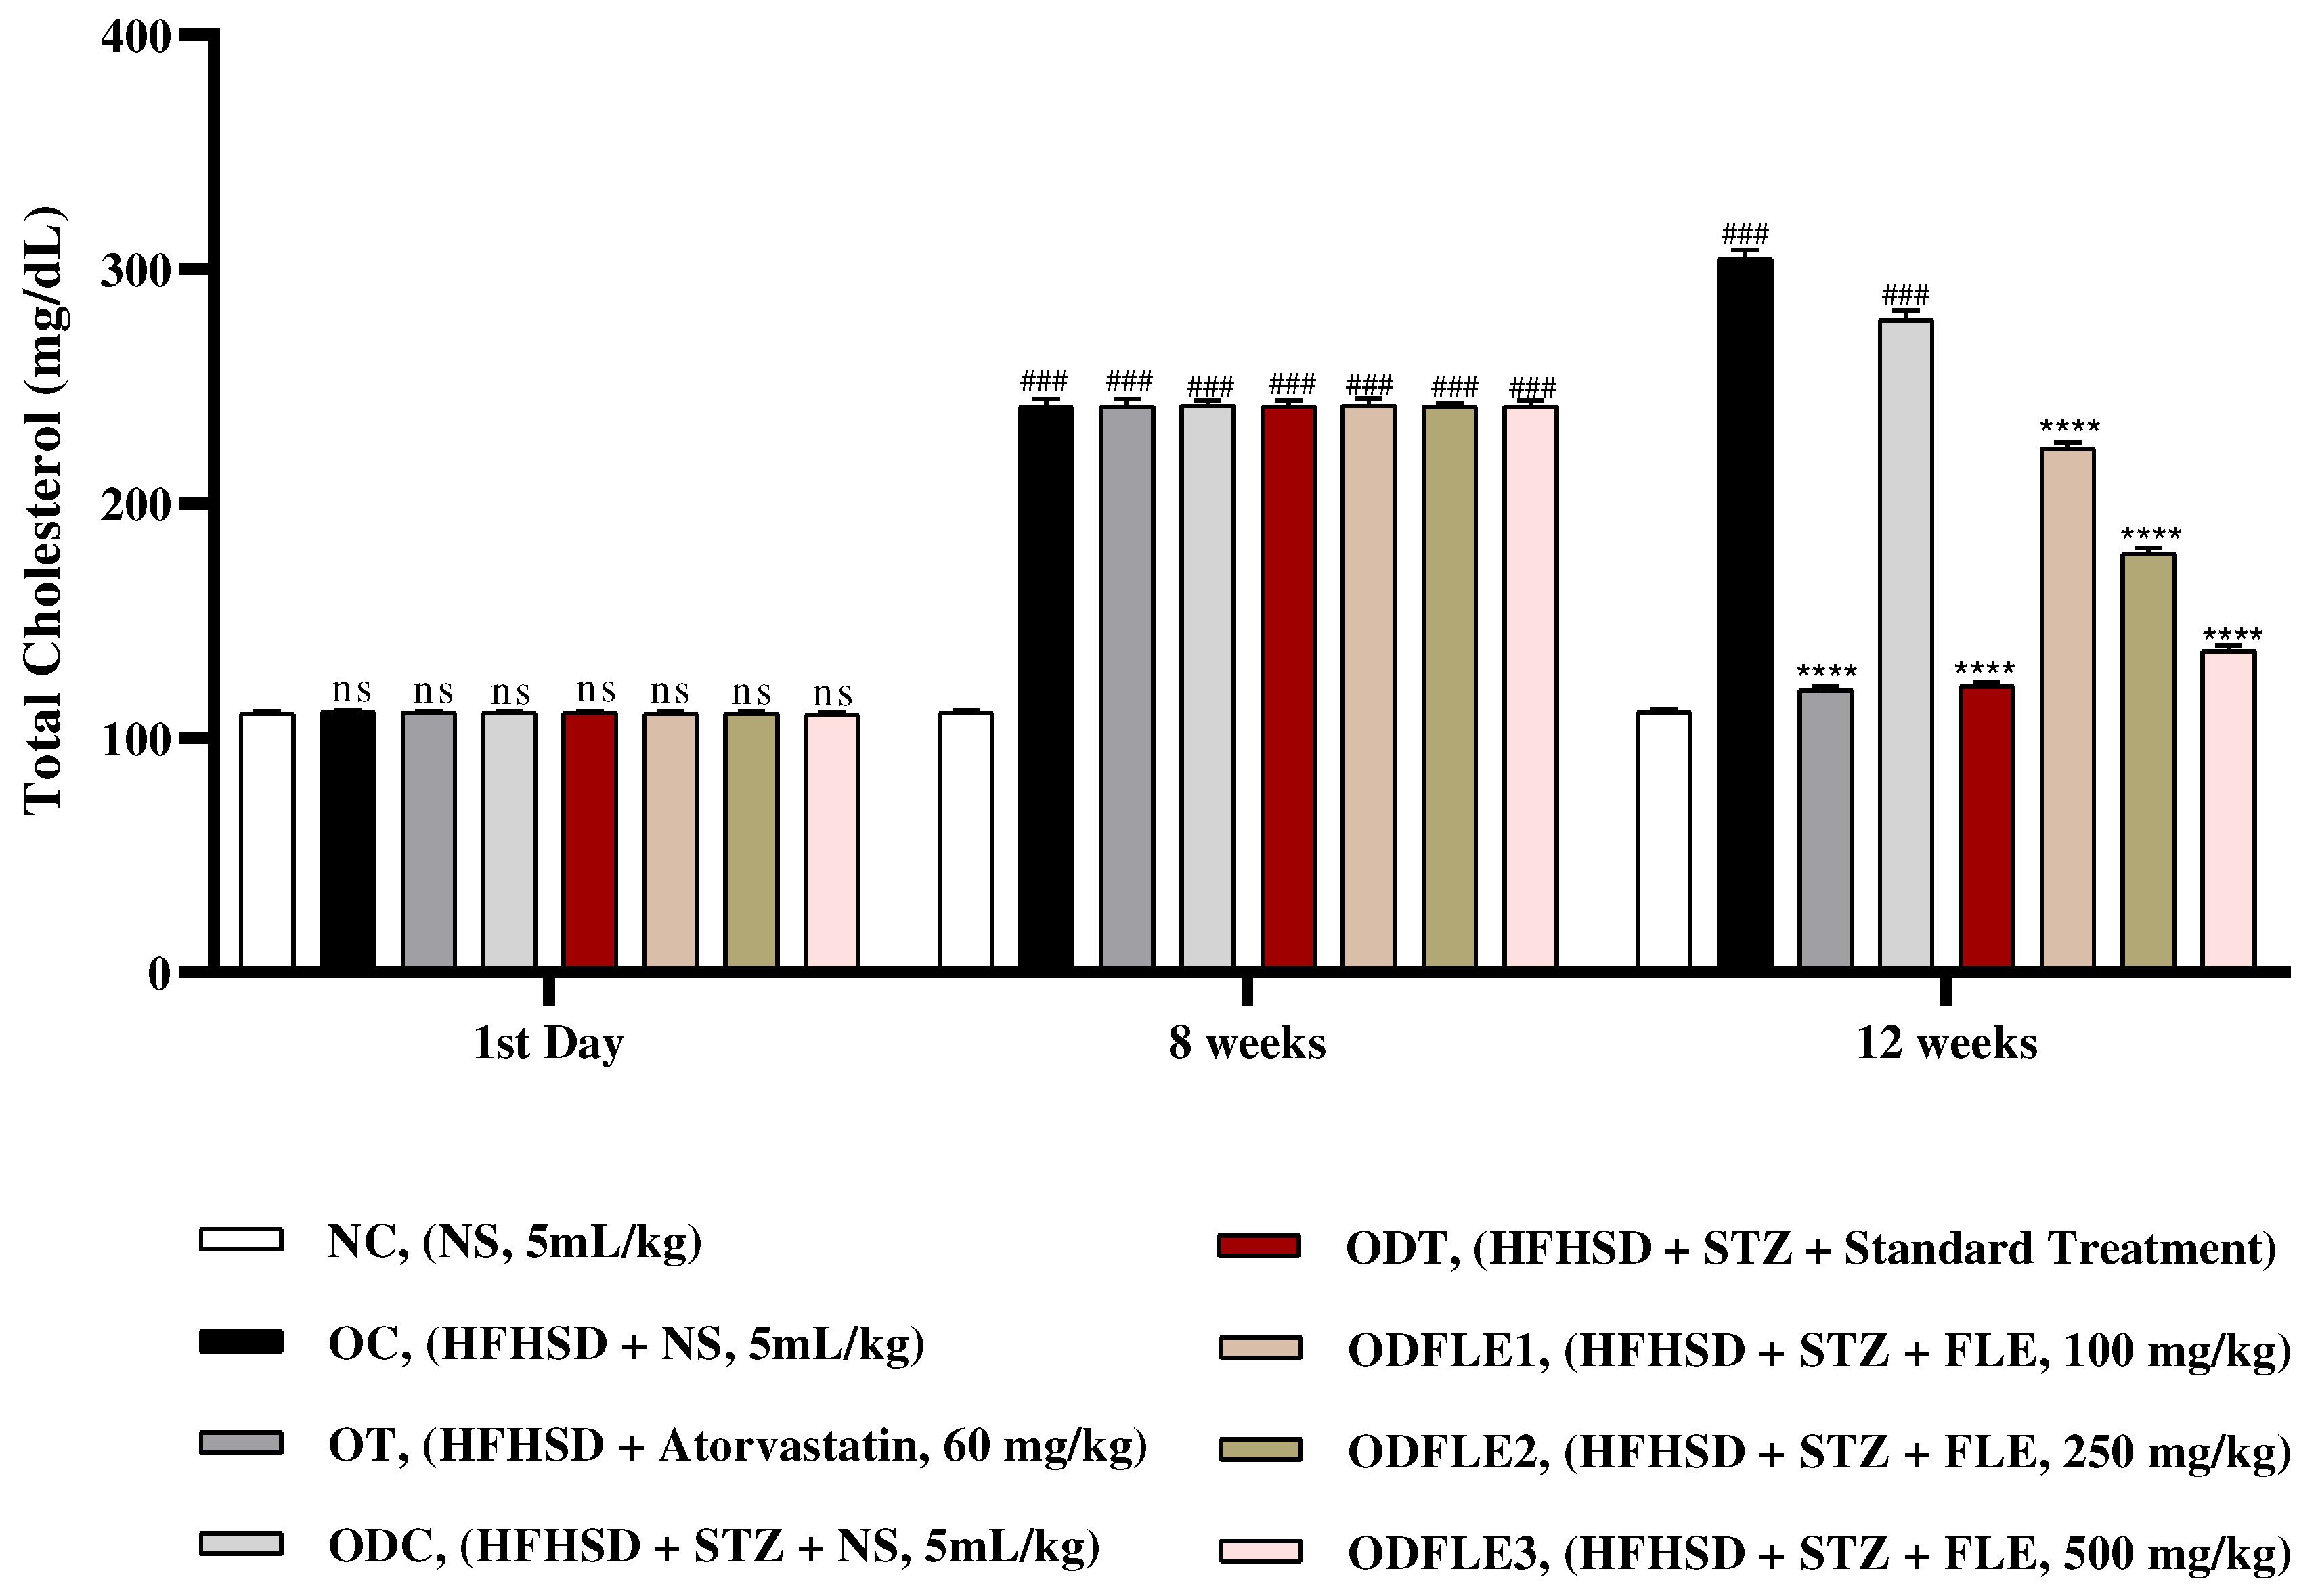
Figure 4.
Changes in triglycerides (TG) levels of Wistar albino rats STZ was administered via the intraperitoneal route after obesity induction in rats by feeding with HFHSD for 8 weeks followed by atorvastatin 60 mg/Kg, glibenclamide 10 mg/Kg and FLE doses at 100, 250 and 500 mg/Kg along with HFHSD for 4 weeks’ treatment period. (a) Commercial kits were used to measure triglycerides. Mean ± SEM of n=6. Each group is analyzed using two-way ANOVA followed by Tukey’s test. At 1st day all the groups showed non-significant (ns) variations (p < 0.05) as compared to NC group. After 8 weeks’ period, all the groups showed very significant (###) variations (p < 0.001) as compared to normal control group. After 12 weeks, results of OC group were compared with OT and ODC group is compared to ODT, ODFLE1, ODFLE2 and ODFLE3 groups, results are considered (ns) non-significant if p > 0.05, significant (∗) if p < 0.05, more significant (∗∗) if p < 0.01, very significant (∗∗∗) if p < 0.001, and highly significant (∗∗∗∗) if p < 0.0001. When the NC group was compared with OC group and ODC group, results are expressed very significant (###) if p < 0.001.
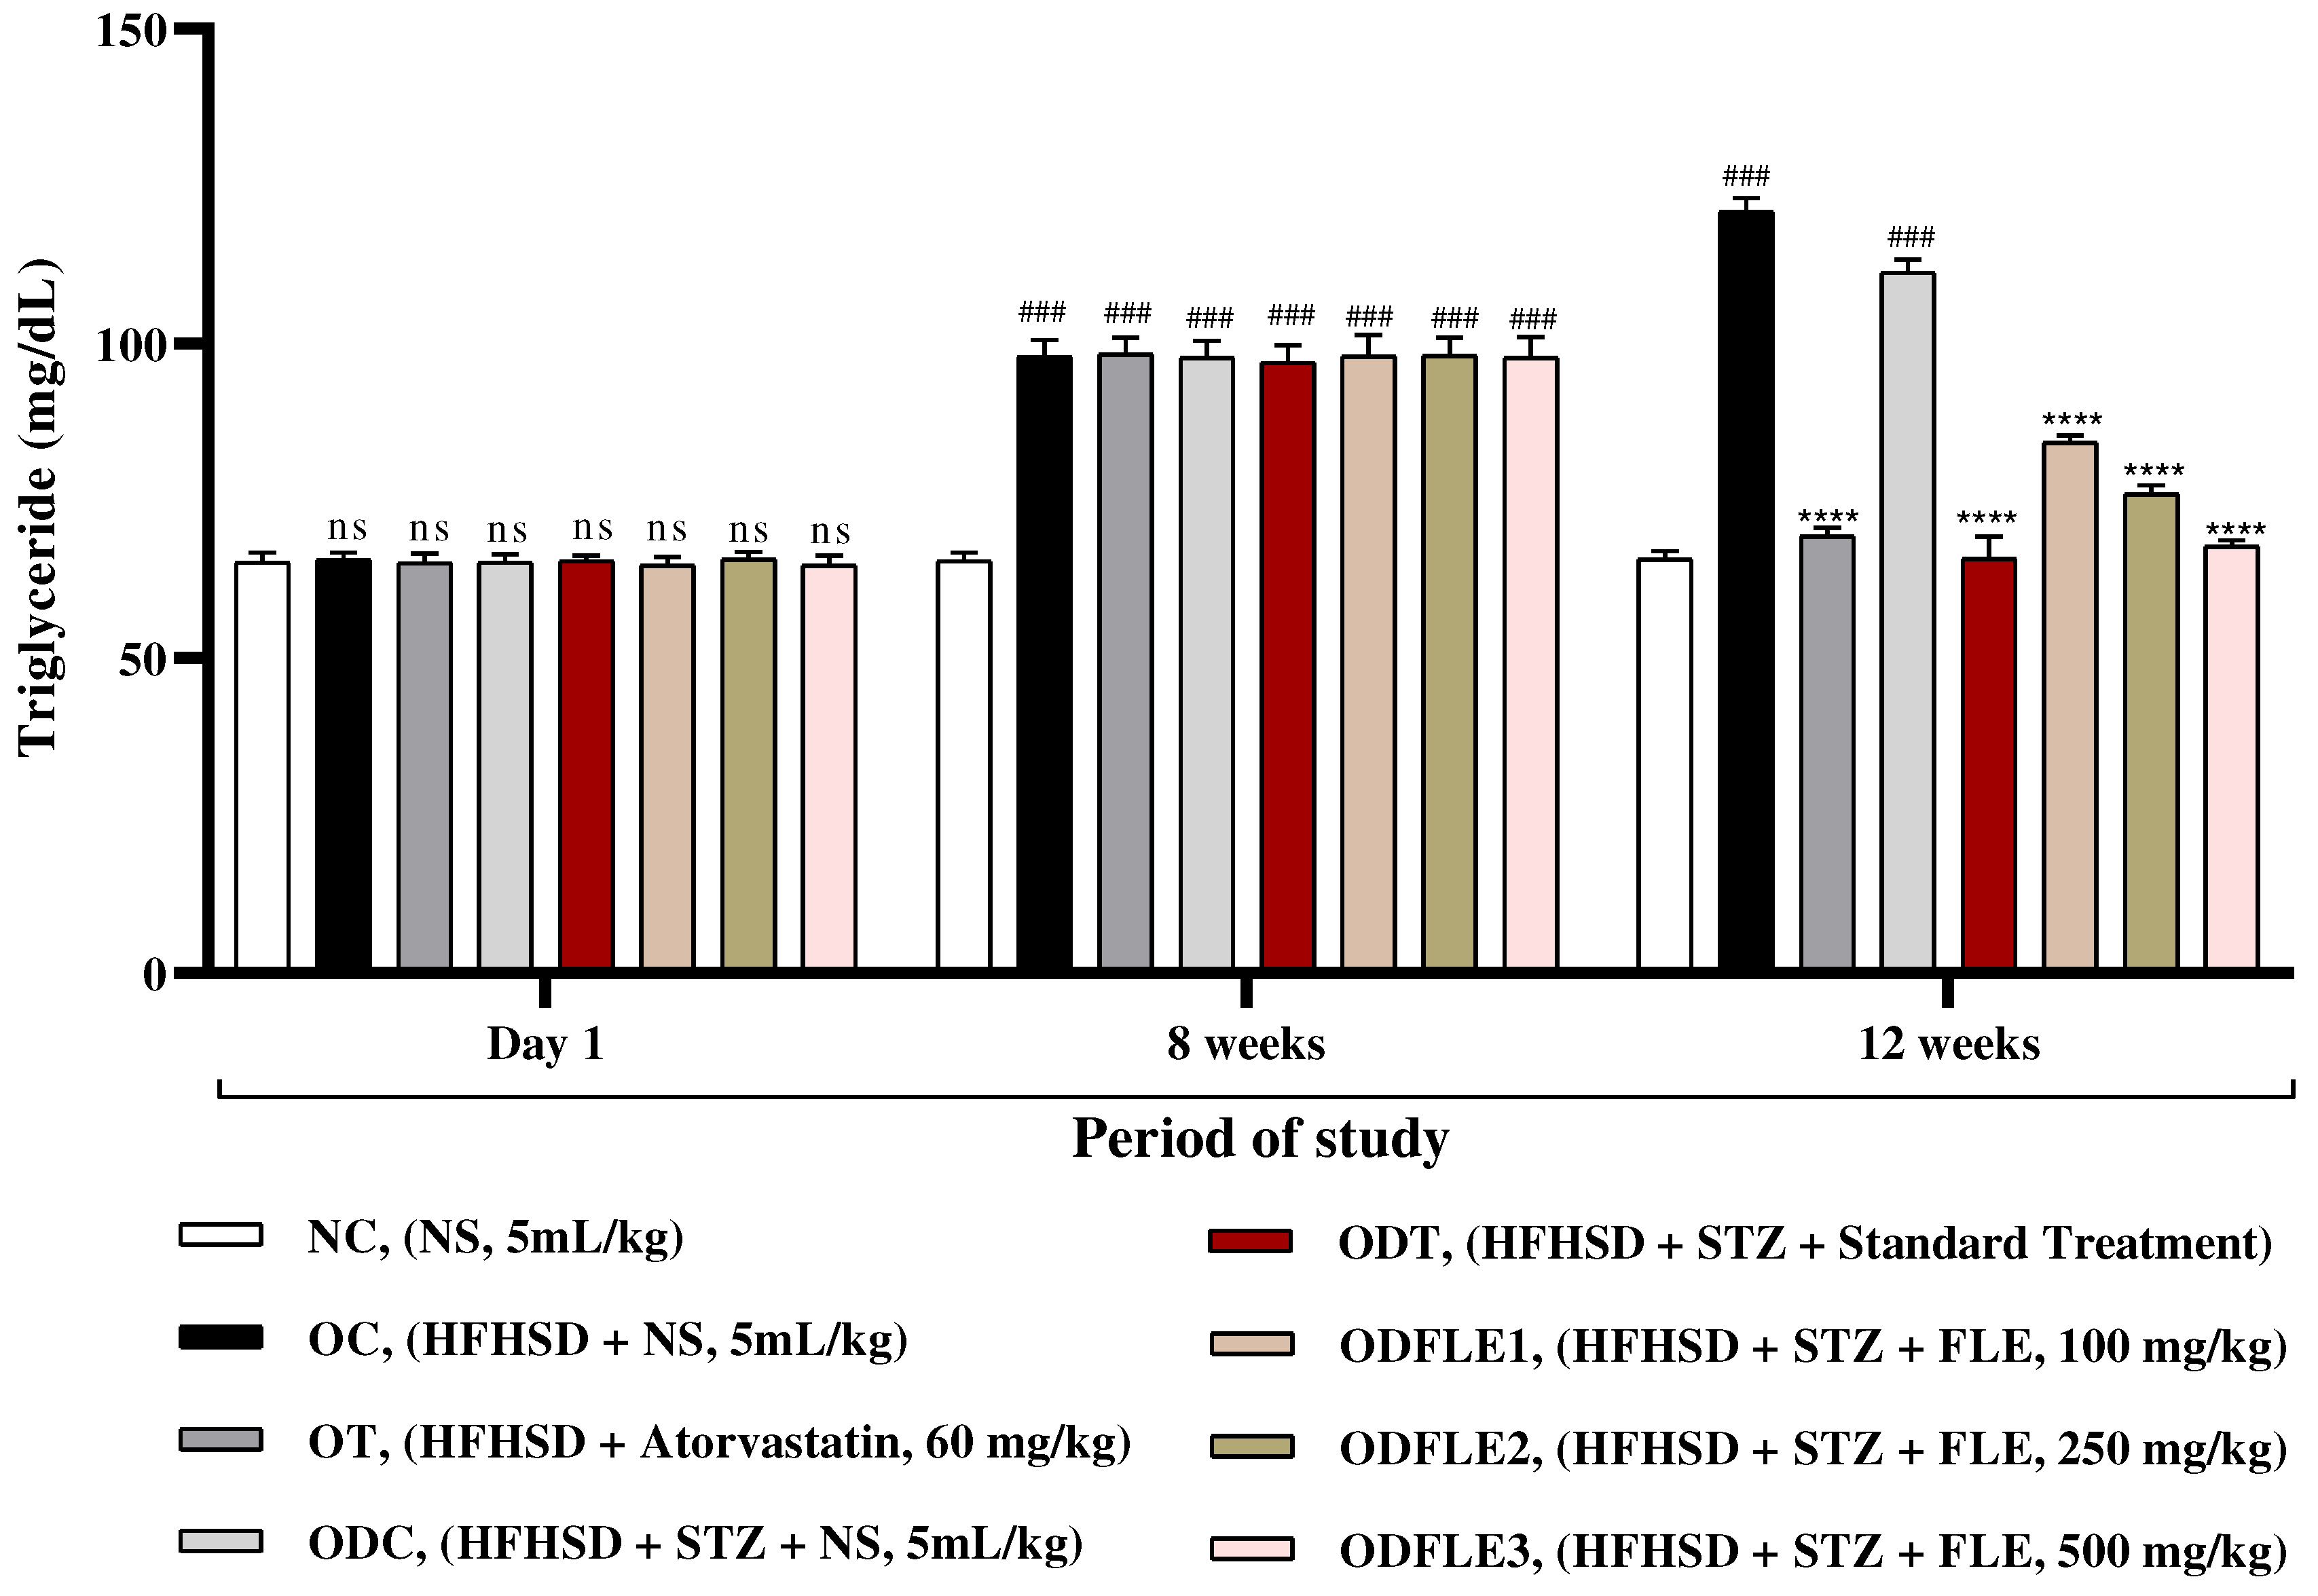
Figure 5.
Changes in High density lipoproteins (HDL) levels of Wistar albino rats STZ was administered via the intraperitoneal route after obesity induction in rats by feeding with HFHSD for 8 weeks followed by atorvastatin 60 mg/Kg, glibenclamide 10 mg/Kg and FLE doses at 100, 250 and 500 mg/Kg along with HFHSD for 4 weeks’ treatment period. (a) commercial kits were used to measure high density lipoproteins. Mean ± SEM of n=6. Each group is analyzed using two-way ANOVA followed by Tukey’s test. At 1st day all the groups showed non-significant (ns) variations (p < 0.05) in comparison to NC group. After 8 weeks’ period, all the groups showed very significant (###) variations (p < 0.001) as compared to normal control (NC) group. After 12 weeks, results of OC group were compared with OT and ODC group is compared to ODT, ODFLE1, ODFLE2 and ODFLE3 groups, results are considered (ns) non-significant if p > 0.05, significant (∗) if p < 0.05, more significant (∗∗) if p < 0.01, very significant (∗∗∗) if p < 0.001, and highly significant (∗∗∗∗) if p < 0.0001. When the NC group was compared with OC group and ODC group, results are expressed very significant (###) if p < 0.001.
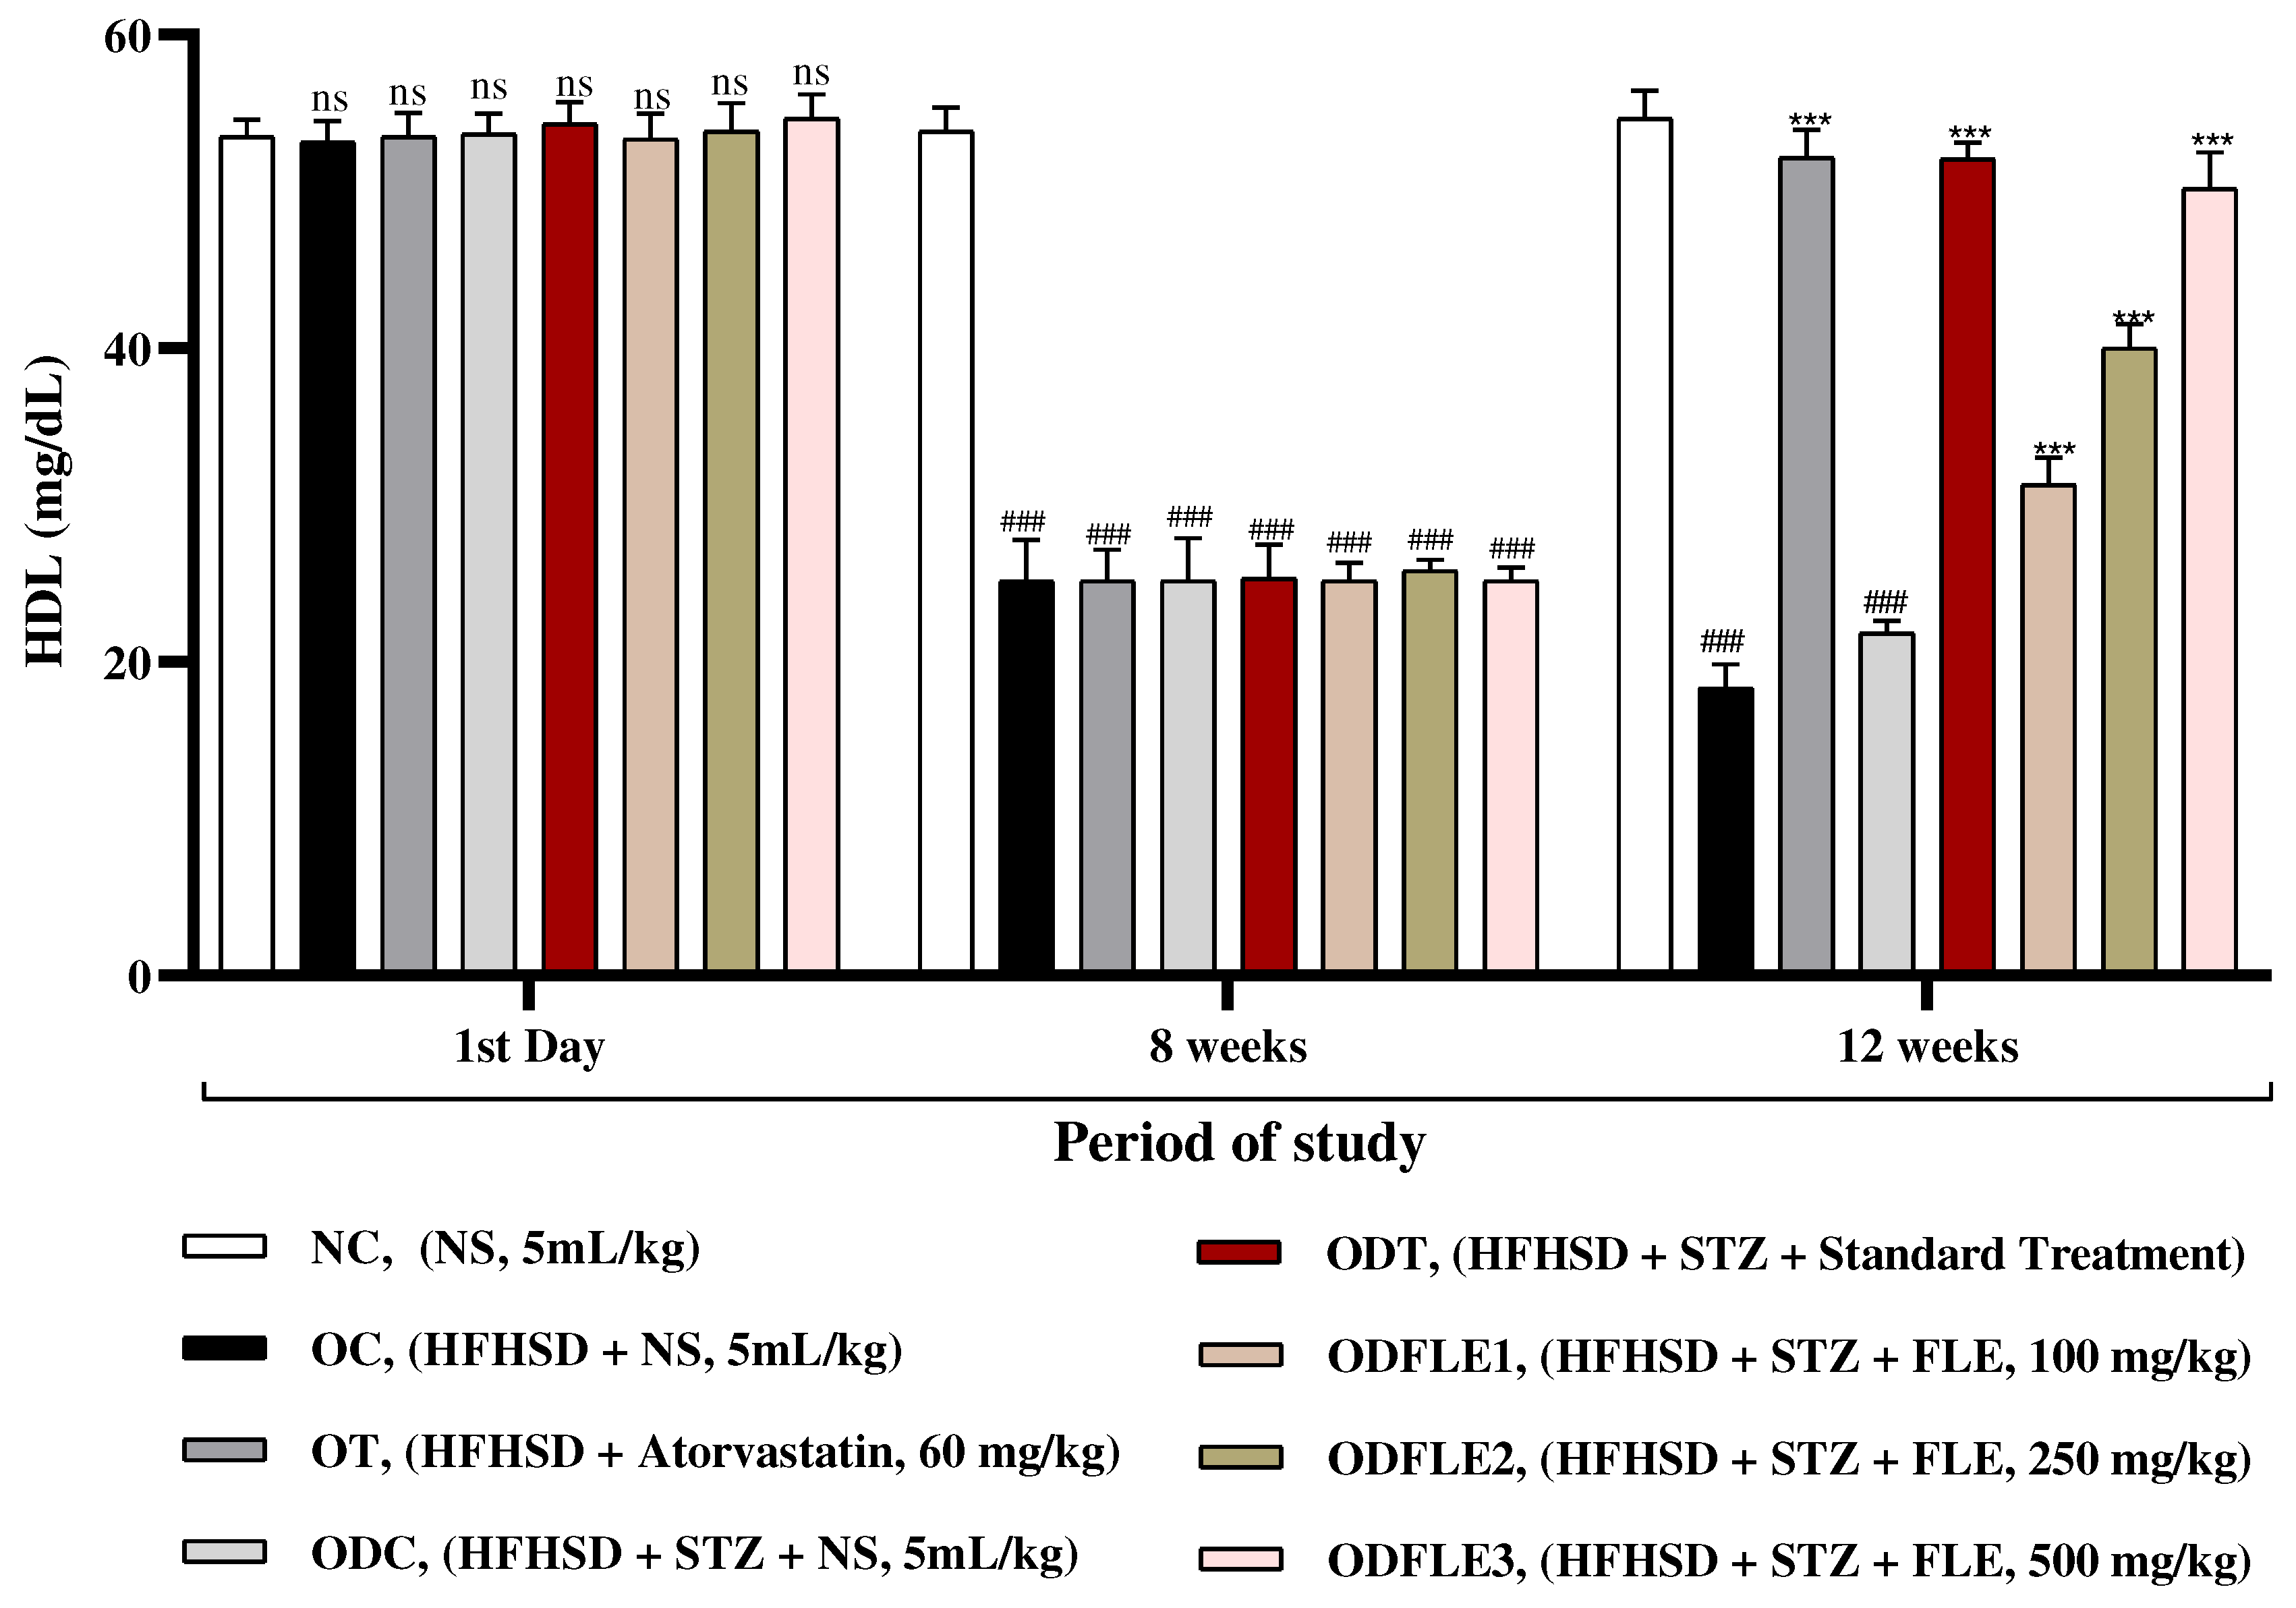
Figure 6.
Changes in Low density lipoproteins (LDL) levels of Wistar albino rats STZ was administered via the intraperitoneal route after obesity induction in rats by feeding with HFHSD for 8 weeks followed by atorvastatin 60 mg/Kg, glibenclamide 10 mg/Kg and FLE doses at 100, 250 and 500 mg/Kg along with HFHSD for 4 weeks’ treatment period. (a) Low density lipoproteins were measured by means of available commercial kit. Mean ± SEM of n=6. Each group is analyzed using two-way ANOVA followed by Tukey’s test. At 1st day all the groups showed non-significant (ns) variations (p < 0.05) as compared to NC group. After 8 weeks’ period, all the groups showed very significant (###) variations (p < 0.001) as compared to NC group. After 12 weeks, results of OC group were compared with OT and ODC group is compared to ODT, ODFLE1, ODFLE2 and ODFLE3 groups, results are considered (ns) non-significant if p > 0.05, significant (∗) if p < 0.05, more significant (∗∗) if p < 0.01, very significant (∗∗∗) if p < 0.001, and highly significant (∗∗∗∗) if p < 0.0001. When the NC group was compared with OC group and ODC group, results are expressed very significant (###) if p < 0.001.
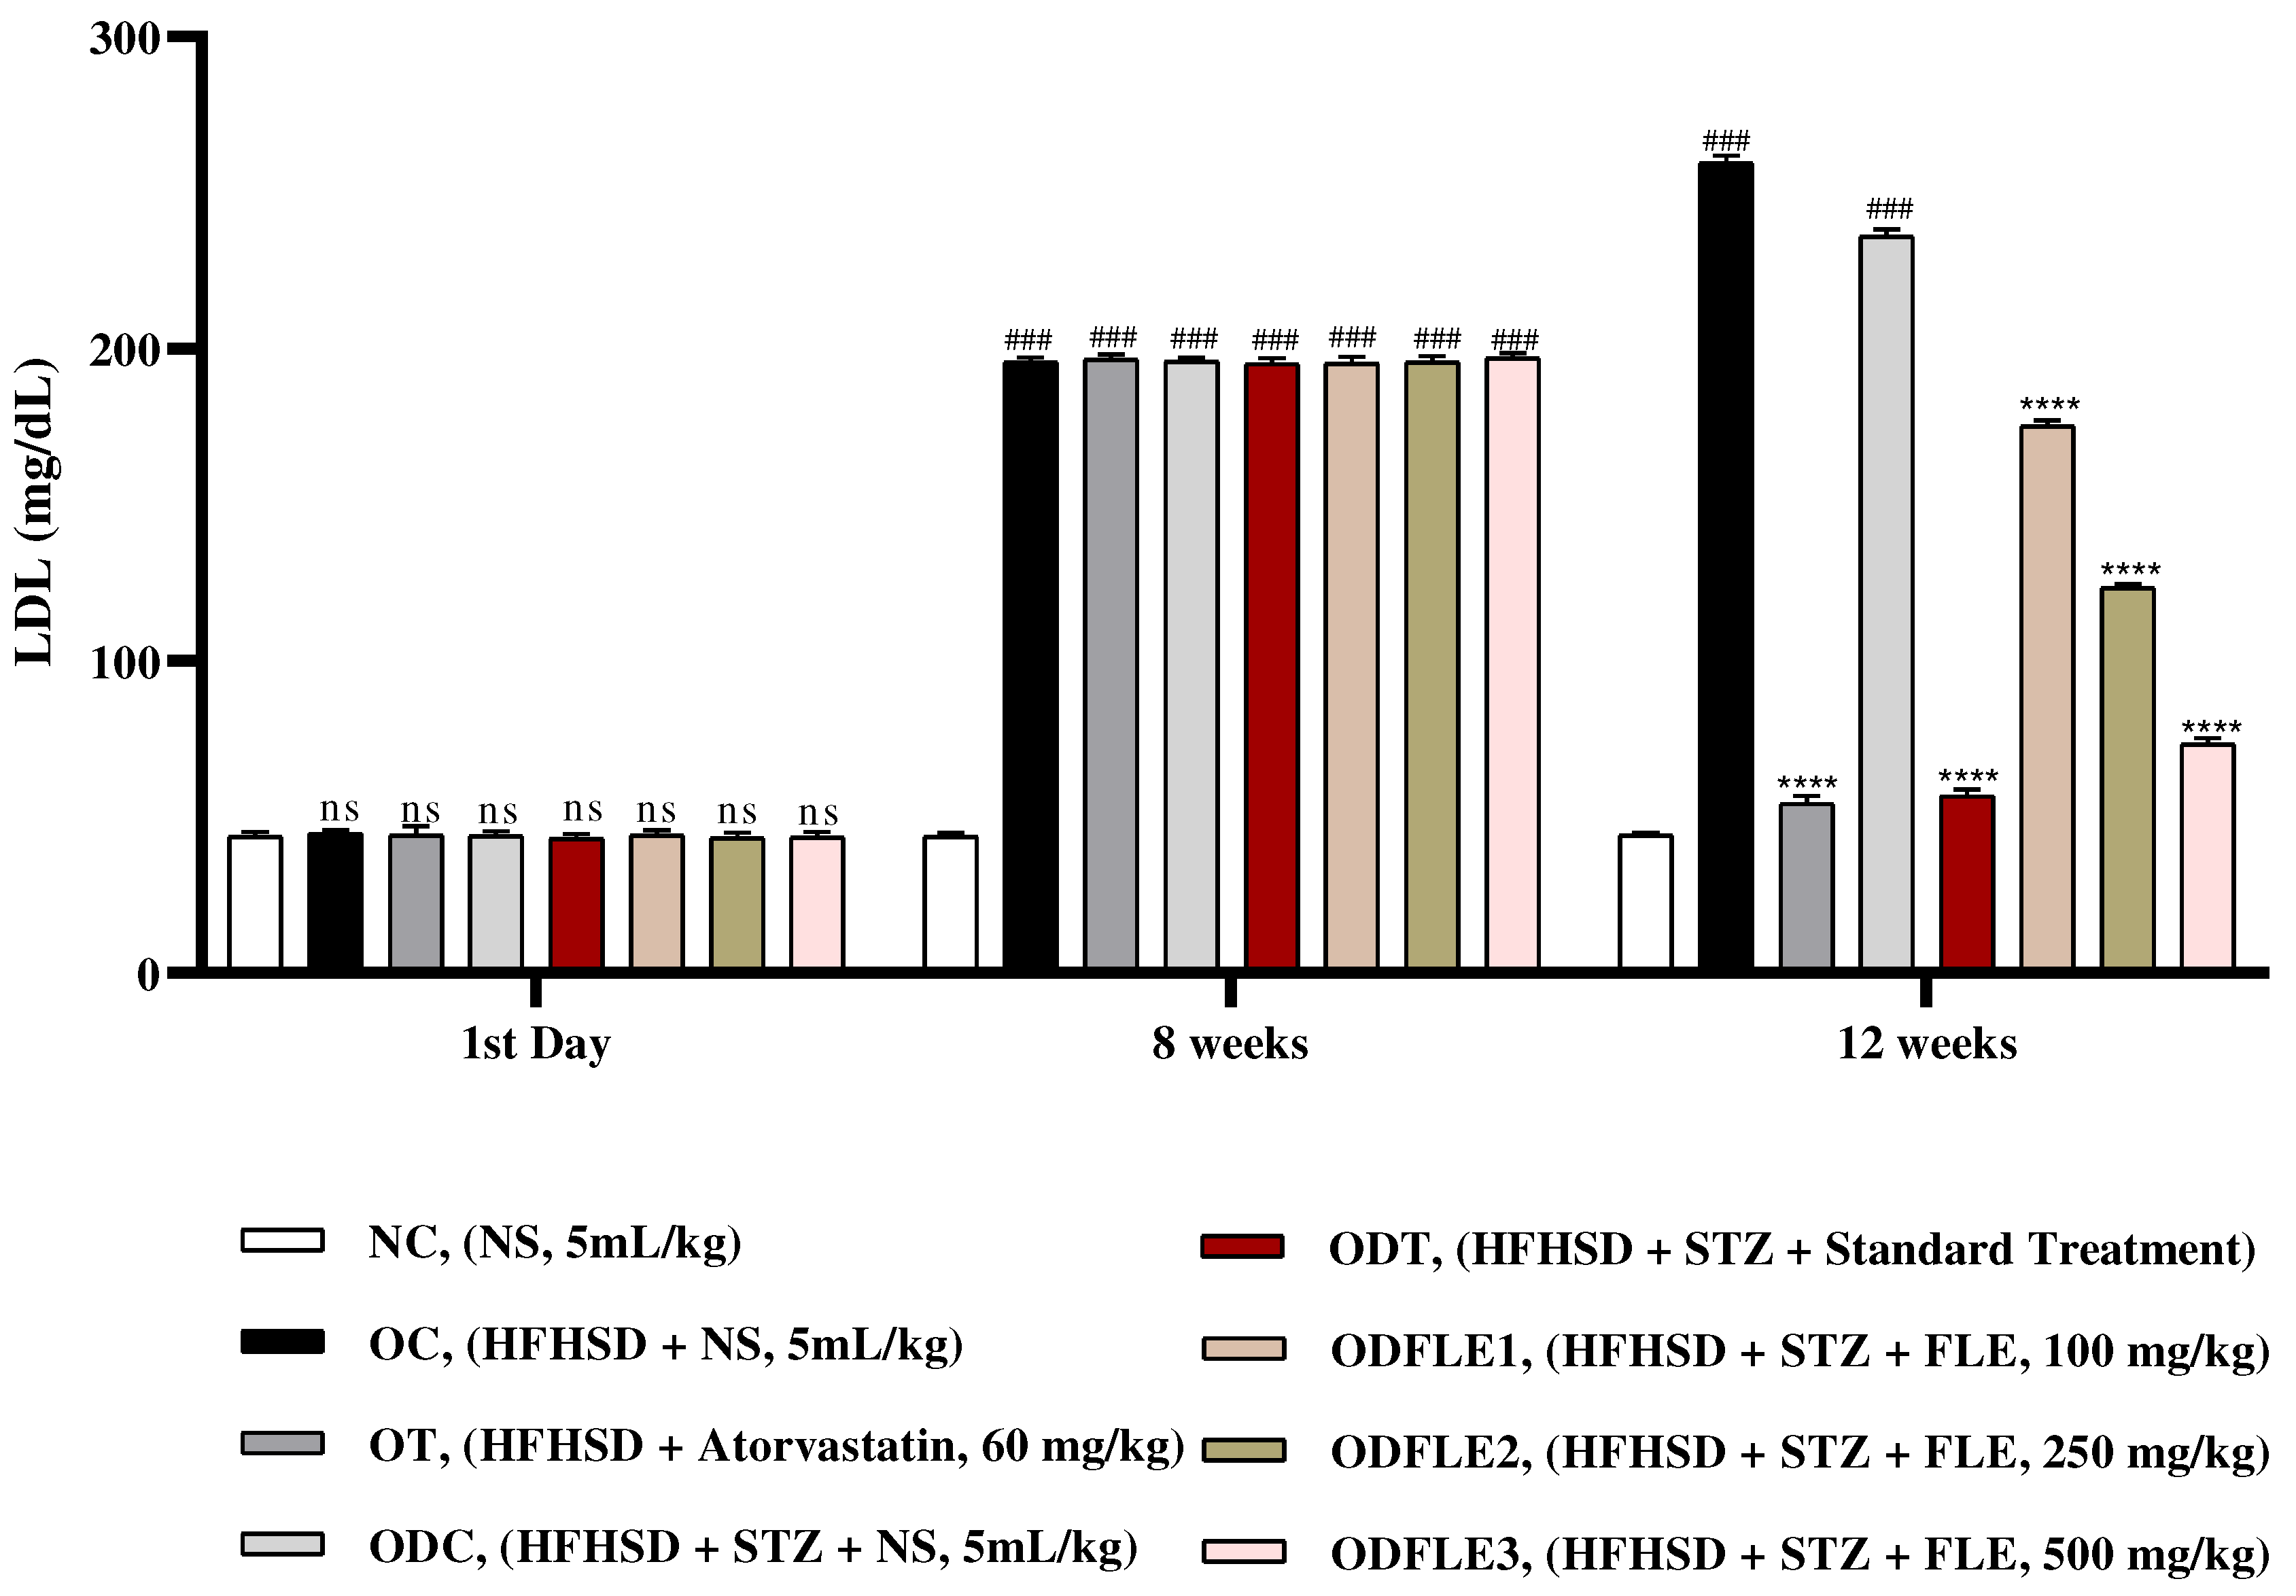
Figure 7.
Changes in Aspartate amino transferase (AST) levels of Wistar albino rats STZ was administered via the intraperitoneal route after obesity induction in rats by feeding with HFHSD for 8 weeks followed by atorvastatin 60 mg/Kg, glibenclamide 10 mg/Kg and FLE doses at 100, 250 and 500 mg/Kg along with HFHSD for 4 weeks’ treatment period. (a) Aspartate amino transferase was measured through the commercial kit. Mean ± SEM of n=6. Each group is analyzed using two-way ANOVA followed by Tukey’s test. At 1st day all the groups showed non-significant (ns) variations (p < 0.05) in comparison to NC group. After 8 weeks’ period, all the groups showed very significant (###) variations (p < 0.001) as compared to normal control (NC) group. After 12 weeks, results of OC group were compared with OT and ODC group is compared to ODT, ODFLE1, ODFLE2 and ODFLE3 groups, results are considered (ns) non-significant if p > 0.05, significant (∗) if p < 0.05, more significant (∗∗) if p < 0.01, very significant (∗∗∗) if p < 0.001, and highly significant (∗∗∗∗) if p < 0.0001. When the NC group was compared with OC group and ODC group, results are expressed very significant (###) if p < 0.001.
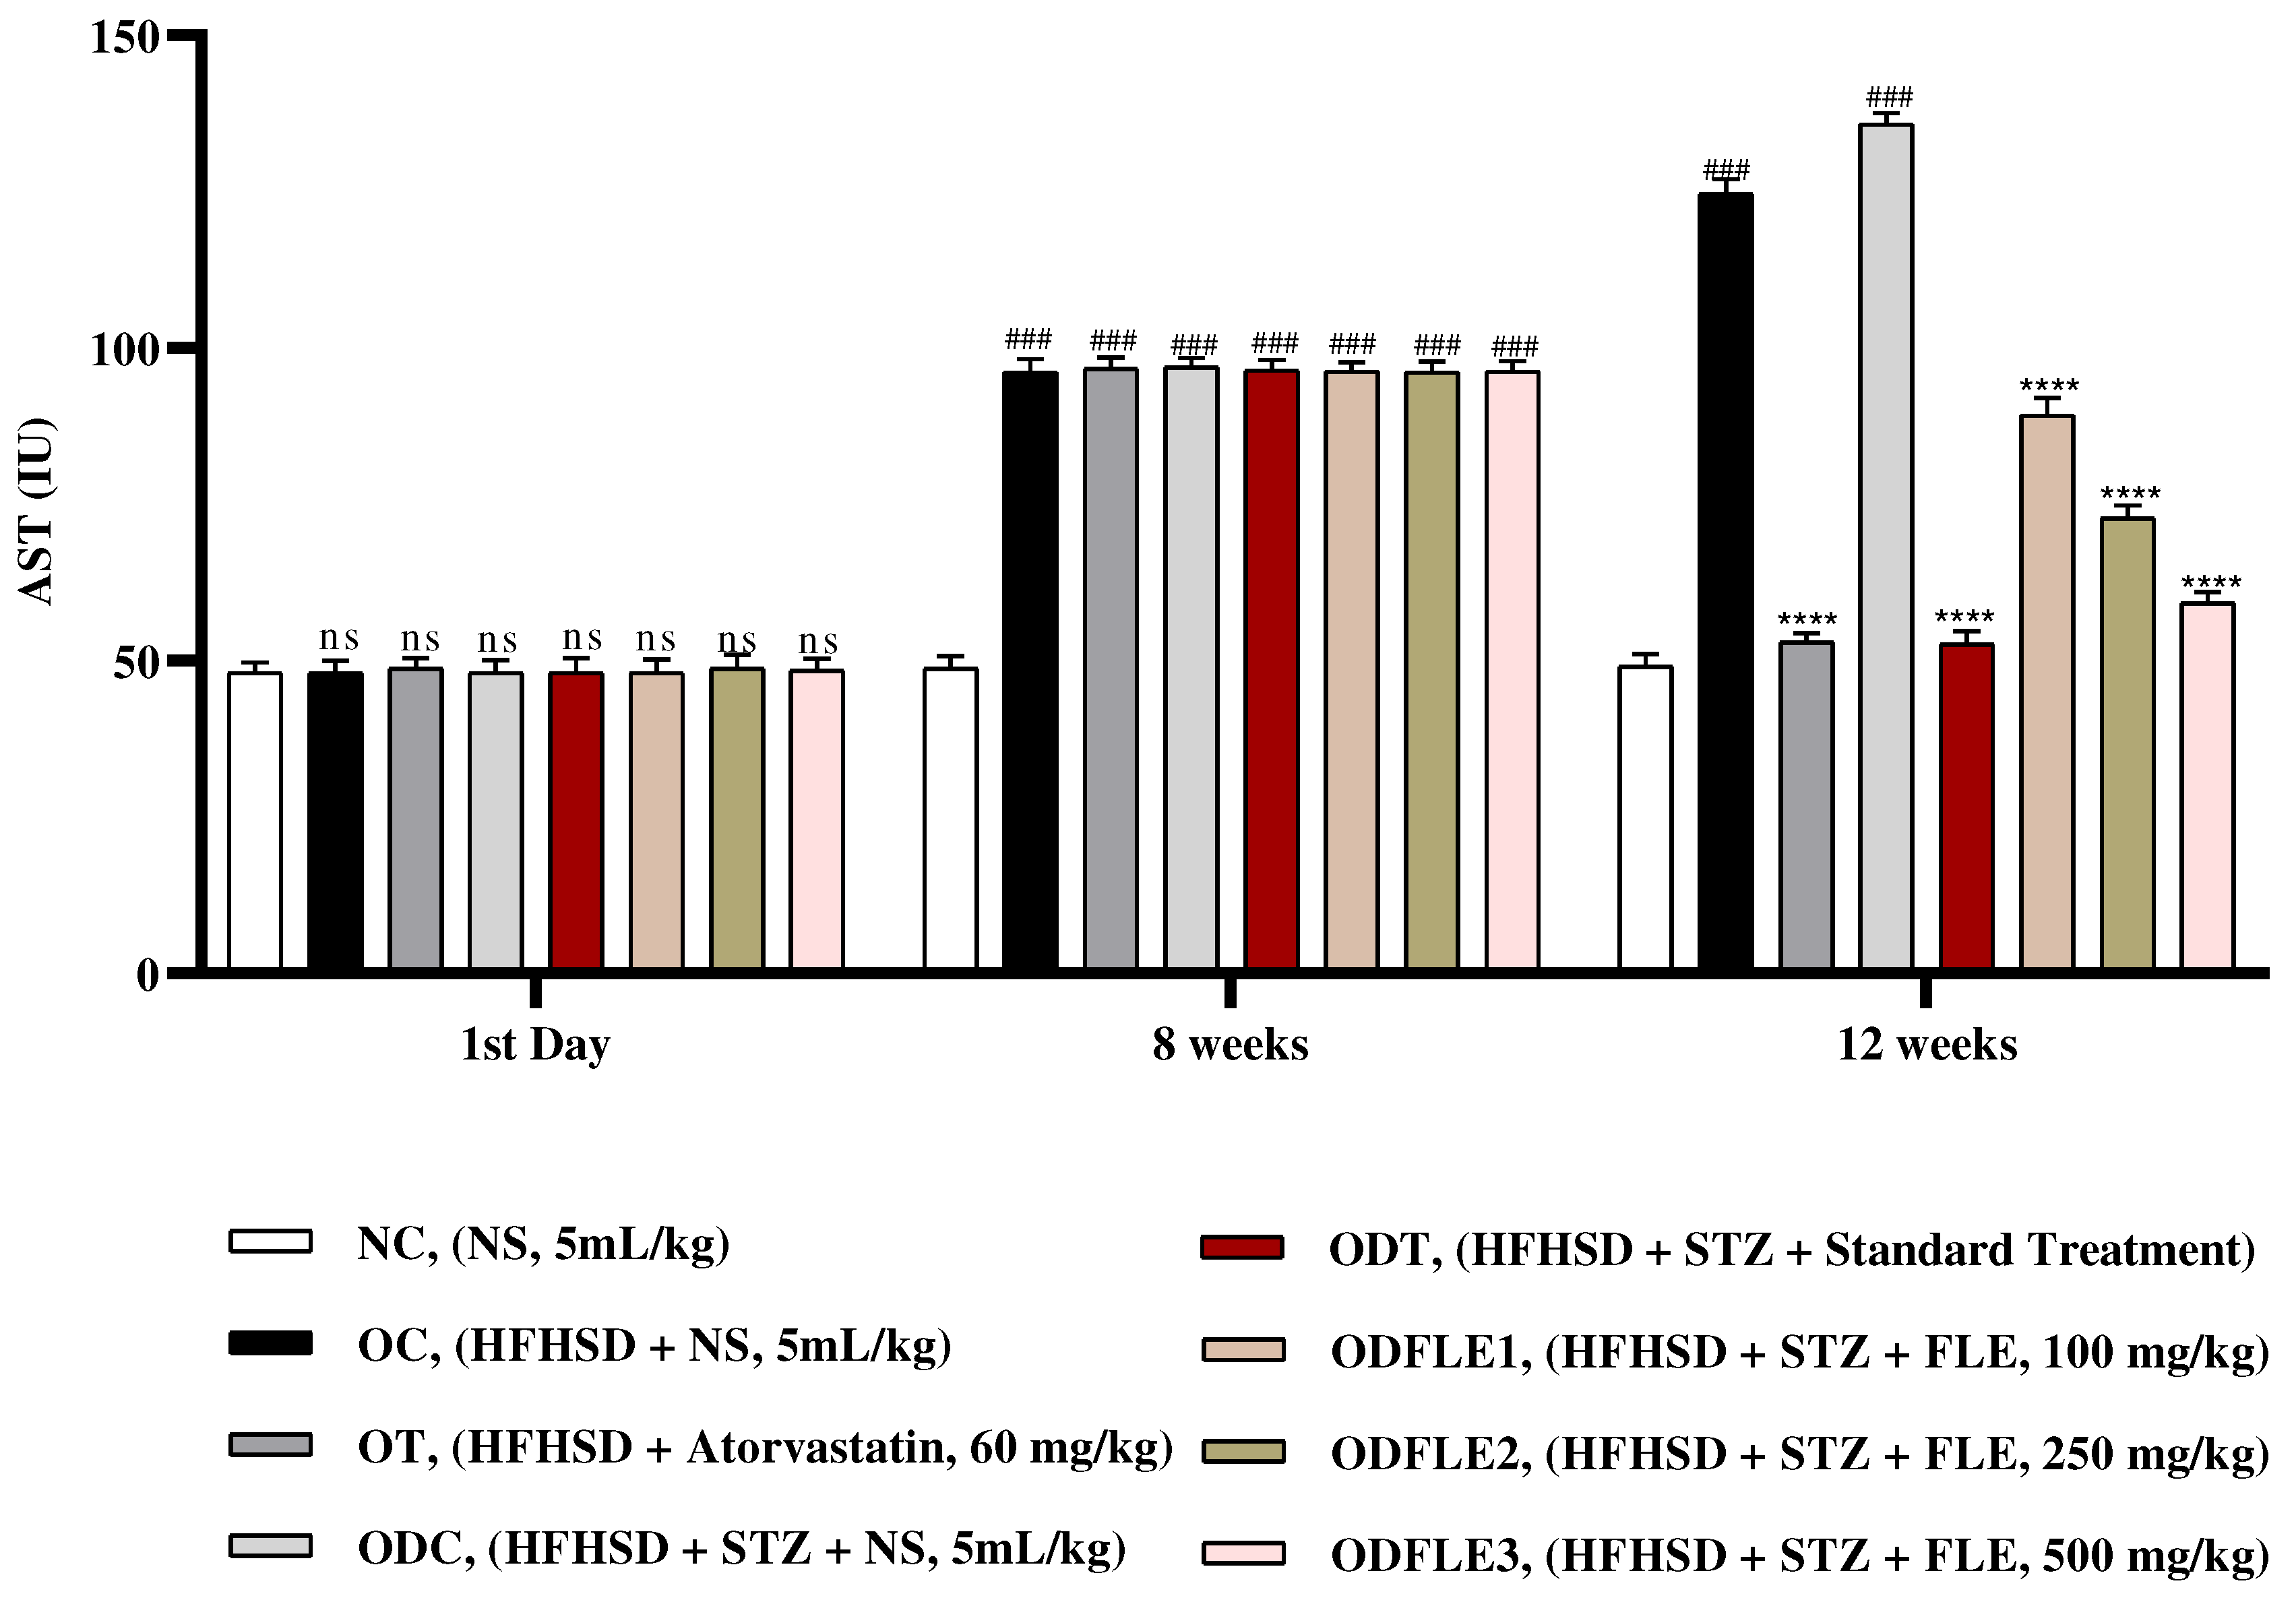
Figure 8.
Changes in Alanine amino transferase (ALT) levels of Wistar albino rats STZ was administered via the intraperitoneal route after obesity induction in rats by feeding with HFHSD for 8 weeks followed by atorvastatin 60 mg/Kg, glibenclamide 10 mg/Kg and FLE doses at 100, 250 and 500 mg/Kg along with HFHSD for 4 weeks’ treatment period. (a) Alanine amino transferase was measured through the commercial kit. Mean ± SEM of n=6. Each group is analyzed using two-way ANOVA followed by Tukey’s test. At 1st day all the groups showed non-significant (ns) variations (p < 0.05) in comparison to NC group. After 8 weeks’ period, all the groups showed very significant (###) variations (p < 0.001) as compared to normal control (NC) group. After 12 weeks, results of OC group were compared with OT and ODC group is compared to ODT, ODFLE1, ODFLE2 and ODFLE3 groups, results are considered (ns) non-significant if p > 0.05, significant (∗) if p < 0.05, more significant (∗∗) if p < 0.01, very significant (∗∗∗) if p < 0.001, and highly significant (∗∗∗∗) if p < 0.0001. When the NC group was compared with OC group and ODC group, results are expressed very significant (###) if p < 0.001.
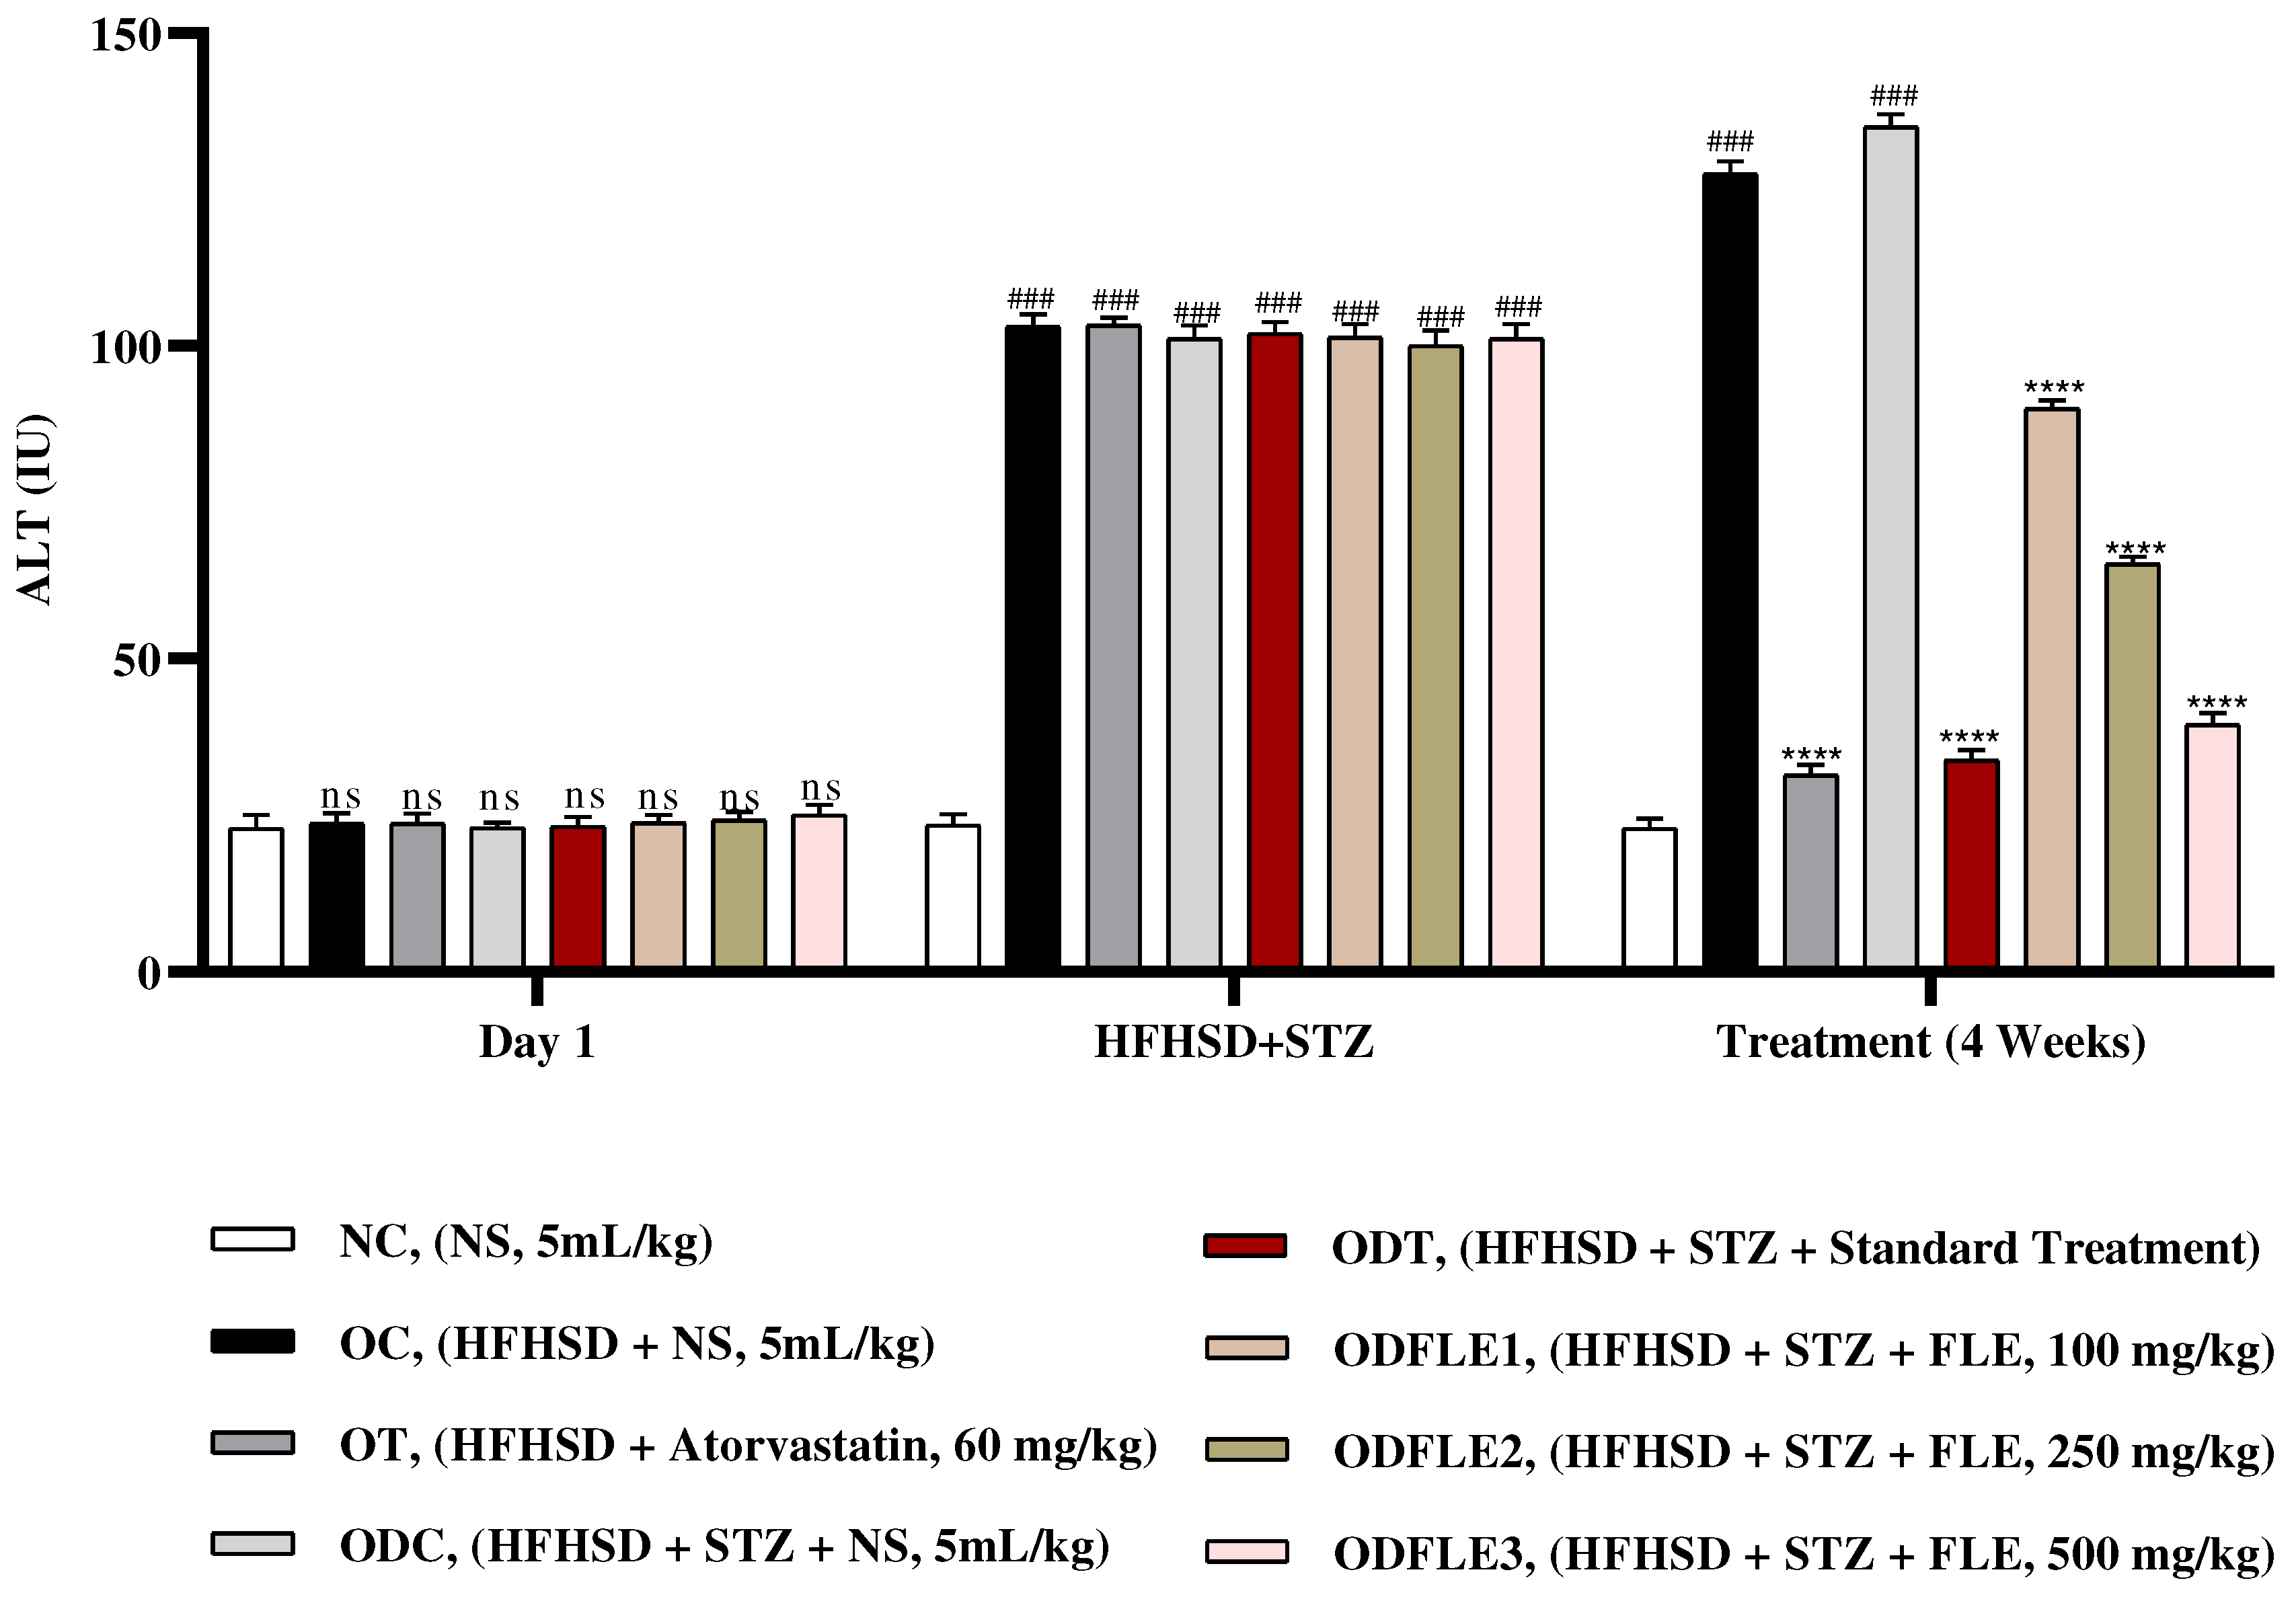
Figure 9.
Changes in Alkaline Phosphatase (ALP) levels of Wistar albino rats STZ was administered via the intraperitoneal route after obesity induction in rats by feeding with HFHSD for 8 weeks followed by atorvastatin 60 mg/Kg, glibenclamide 10 mg/Kg and FLE doses at 100, 250 and 500 mg/Kg along with HFHSD for 4 weeks’ treatment period. (a) Alkaline Phosphatase was measured through the commercial kit. Mean ± SEM of n=6. Each group is analyzed using two-way ANOVA followed by Tukey’s test. At 1st day all the groups showed non-significant (ns) variations (p < 0.05) as compared to NC group. After 8 weeks’ period, all the groups showed very significant (###) variations (p < 0.001) as compared to normal control (NC) group. After 12 weeks, results of OC group were compared with OT and ODC group is compared to ODT, ODFLE1, ODFLE2 and ODFLE3 groups, results are considered (ns) non-significant if p > 0.05, significant (∗) if p < 0.05, more significant (∗∗) if p < 0.01, very significant (∗∗∗) if p < 0.001, and highly significant (∗∗∗∗) if p < 0.0001. When the NC group was compared with OC group and ODC group, results are expressed very significant (###) if p < 0.001.
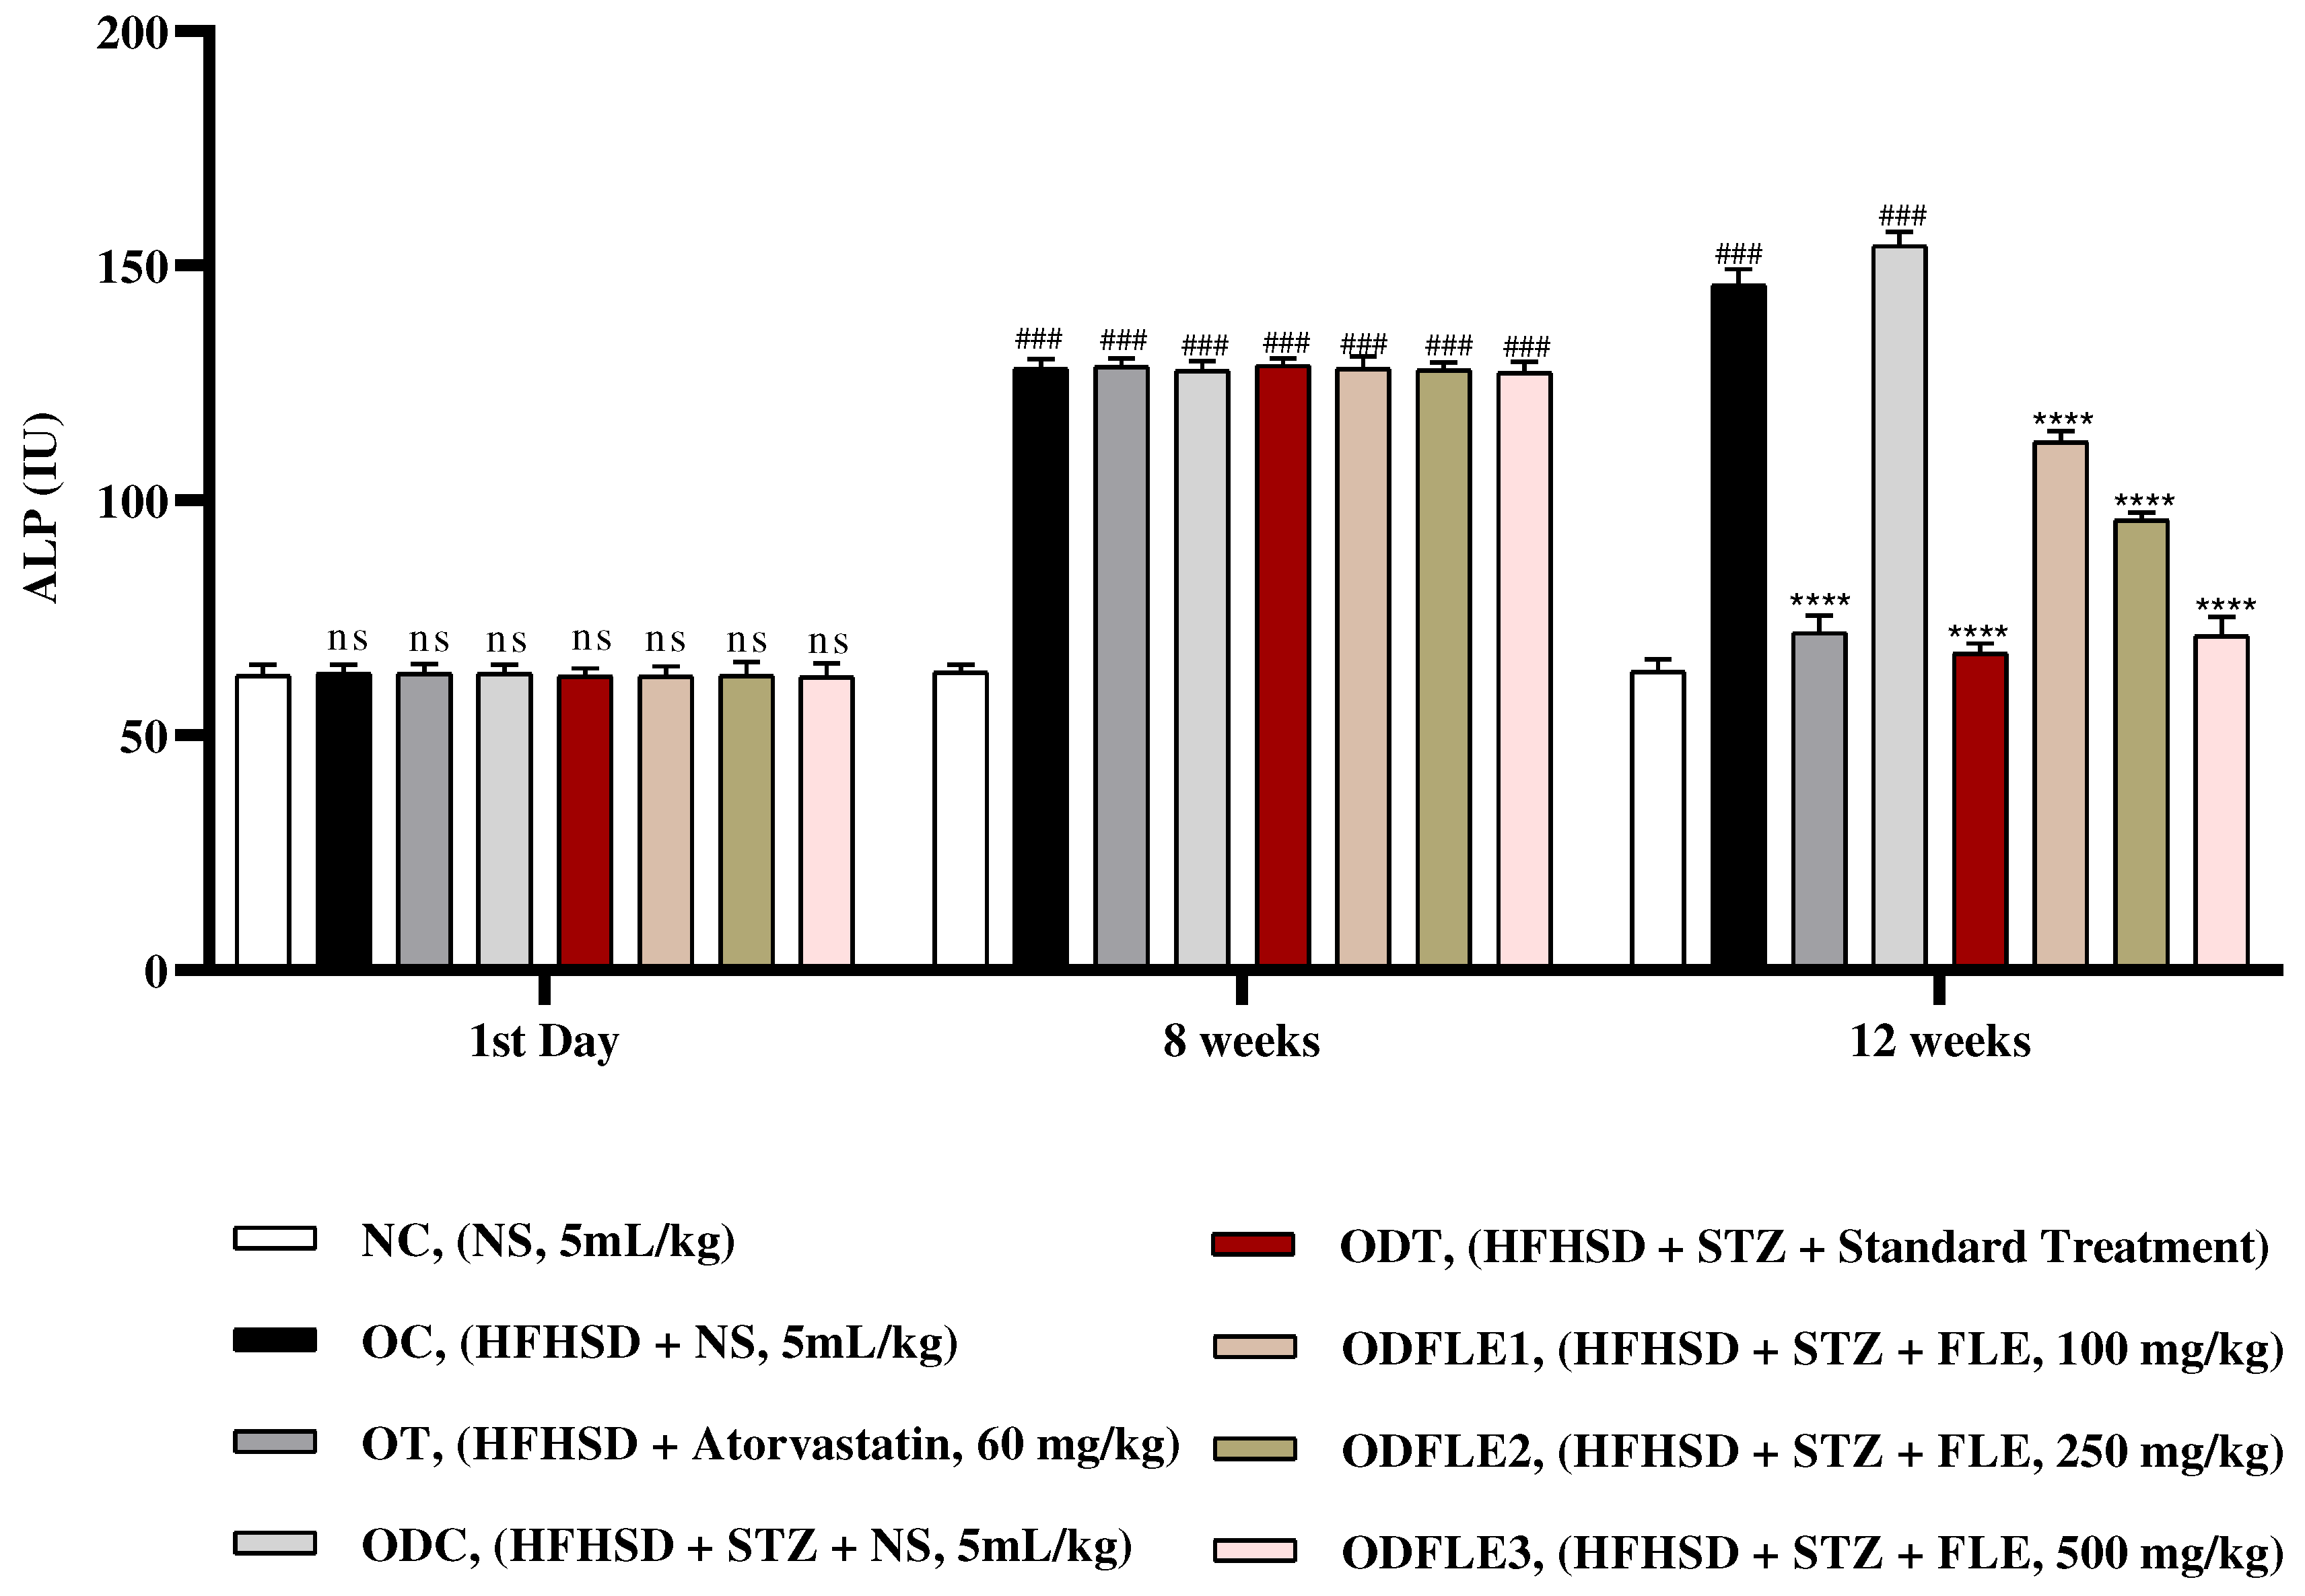
Figure 10.
Changes in creatinine levels of Wistar albino rats STZ was administered via the intraperitoneal route after obesity induction in rats by feeding with HFHSD for 8 weeks followed by atorvastatin 60 mg/Kg, glibenclamide 10 mg/Kg and FLE doses at 100, 250 and 500 mg/Kg along with HFHSD for 4 weeks’ treatment period. (a) Creatinine was measured by means of commercial kit. Mean ± SEM of n=6. Each group is analyzed using two-way ANOVA followed by Tukey’s test. At 1st day all the groups showed non-significant (ns) variations (p < 0.05) as compared to normal control (NC) group. After 8 weeks’ period, all the groups showed very significant (###) variations (p < 0.001) as compared to normal control (NC) group. After 12 weeks, results of OC group were compared with OT and ODC group is compared to ODT, ODFLE1, ODFLE2 and ODFLE3 groups, results are considered (ns) non-significant if p > 0.05, significant (∗) if p < 0.05, more significant (∗∗) if p < 0.01, very significant (∗∗∗) if p < 0.001, and highly significant (∗∗∗∗) if p < 0.0001. When the NC group was compared with OC group and ODC group, results are expressed very significant (###) if p < 0.001.
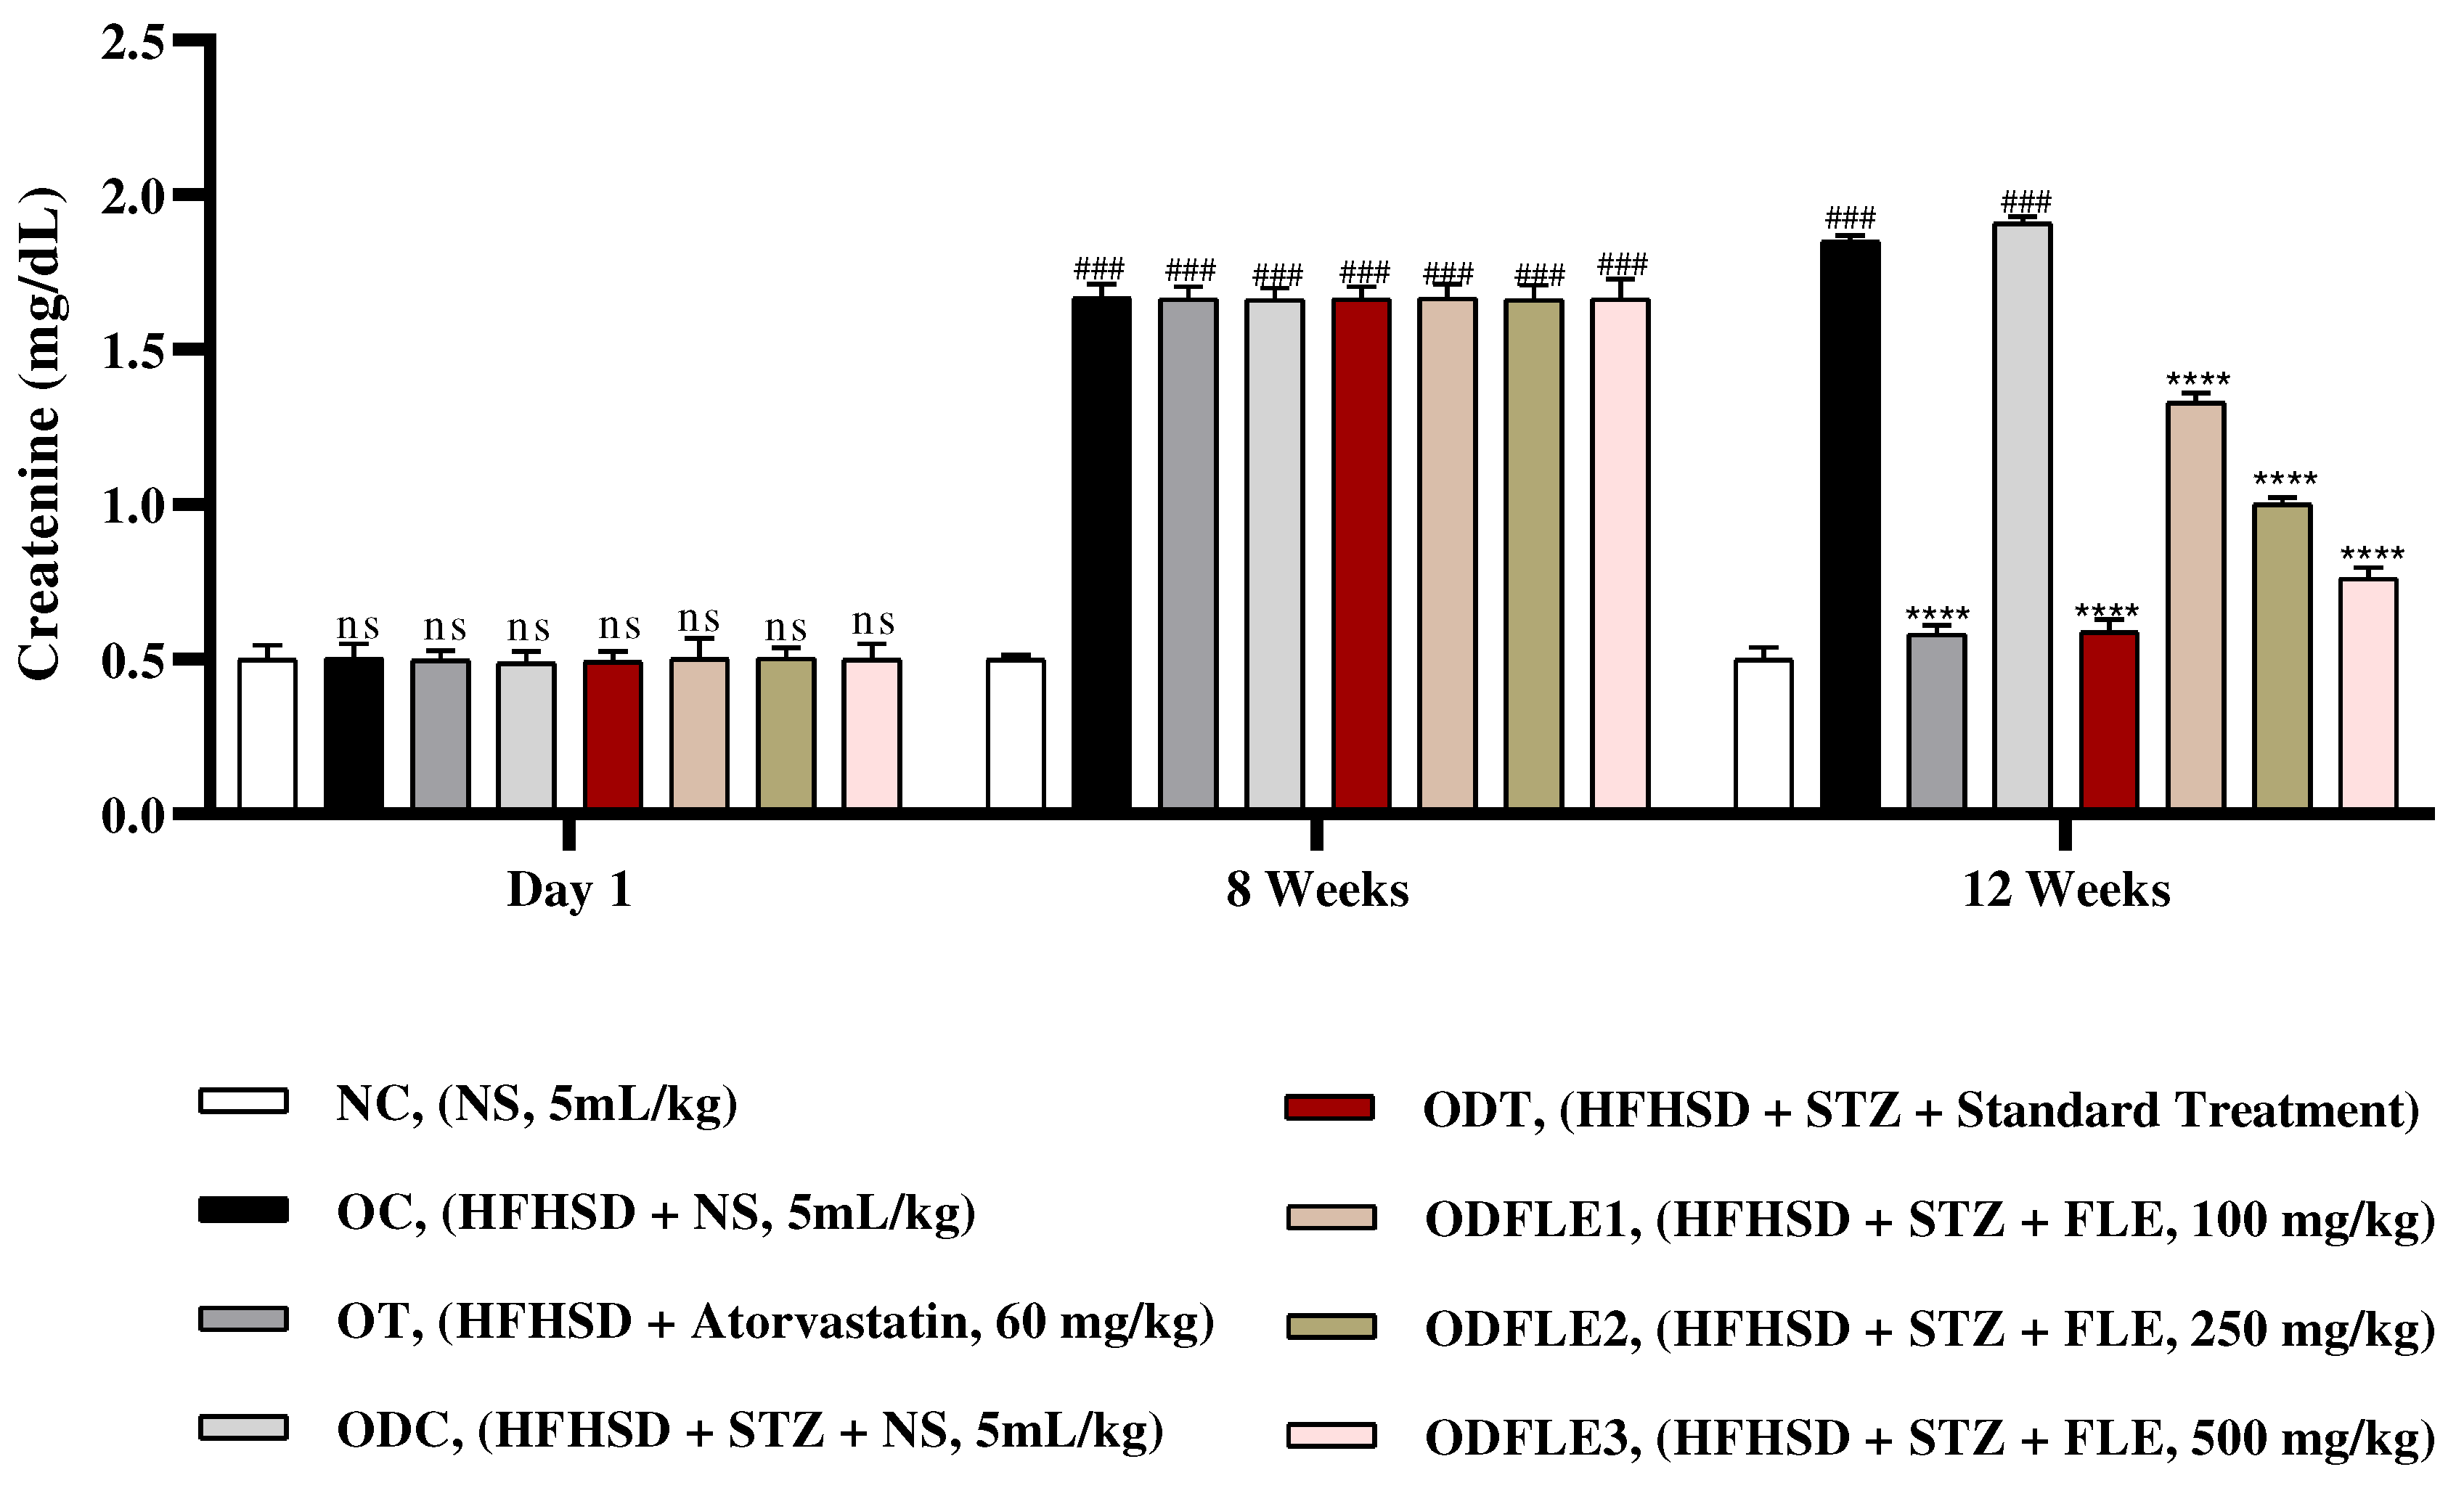
Figure 11.
Changes in blood urea nitrogen (BUN) levels of Wistar albino rats STZ was administered via the intraperitoneal route after obesity induction in rats by feeding with HFHSD for 8 weeks followed by atorvastatin 60 mg/Kg, glibenclamide 10 mg/Kg and FLE doses at 100, 250 and 500 mg/Kg along with HFHSD for 4 weeks’ treatment period. (a) blood urea nitrogen was found out by using commercial kit. Mean ± SEM of n=6. Each group is analyzed using two-way ANOVA followed by Tukey’s test. At 1st day all the groups showed non-significant (ns) variations (p < 0.05) as compared to normal control (NC) group. After 8 weeks’ period, all the groups showed very significant (###) variations (p < 0.001) as compared to normal control (NC) group. After 12 weeks’ period, when the obesity control (OC) group was compared with obesity treatment (OT) group and obesity diabetes control (ODC) group is compared to treatment groups (ODT, ODFLE1, ODFLE2 and ODFLE3), results are considered non-significant (ns) if p > 0.05, significant (∗) if p < 0.05, more significant (∗∗) if p < 0.01, very significant (∗∗∗) if p < 0.001, and highly significant (∗∗∗∗) if p < 0.0001. When the normal control group is compared with obesity control group and obesity diabetes control group, the significance of the results is denoted very significant (###) if p < 0.001.
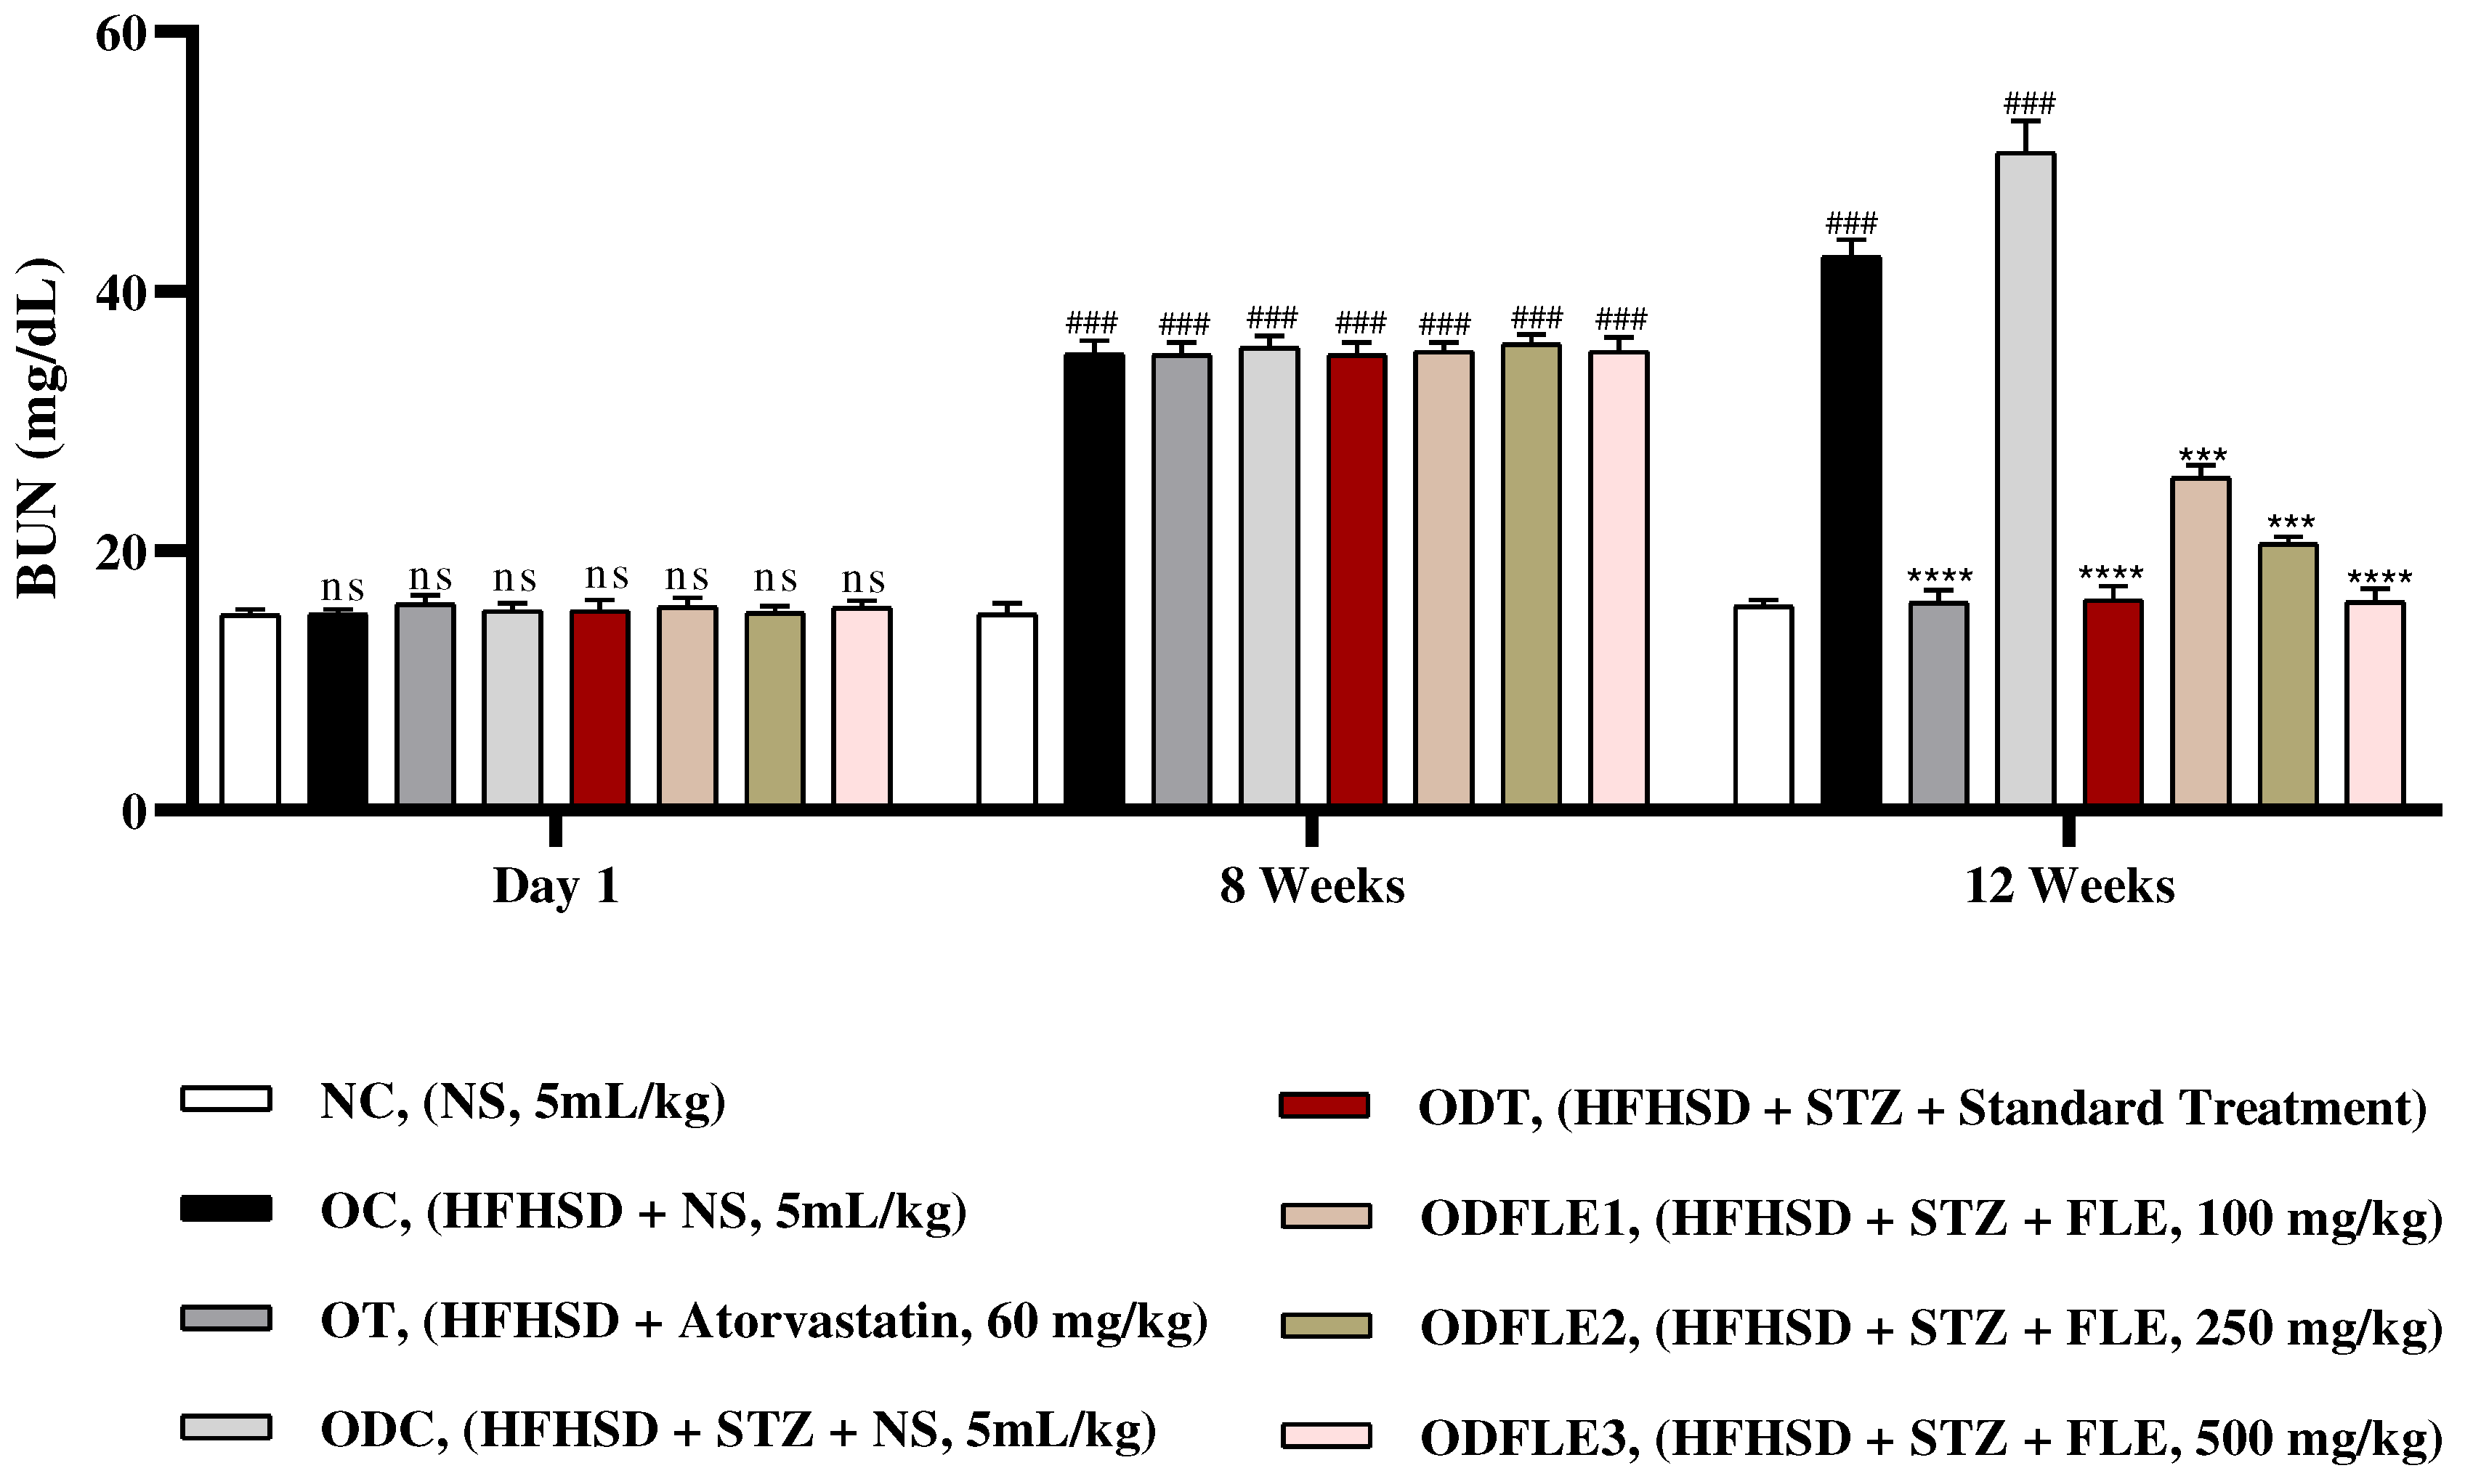
Figure 12.
FTIR Spectra of Ficus carica L ethanolic leaf extract.
Figure 12.
FTIR Spectra of Ficus carica L ethanolic leaf extract.
Figure 13.
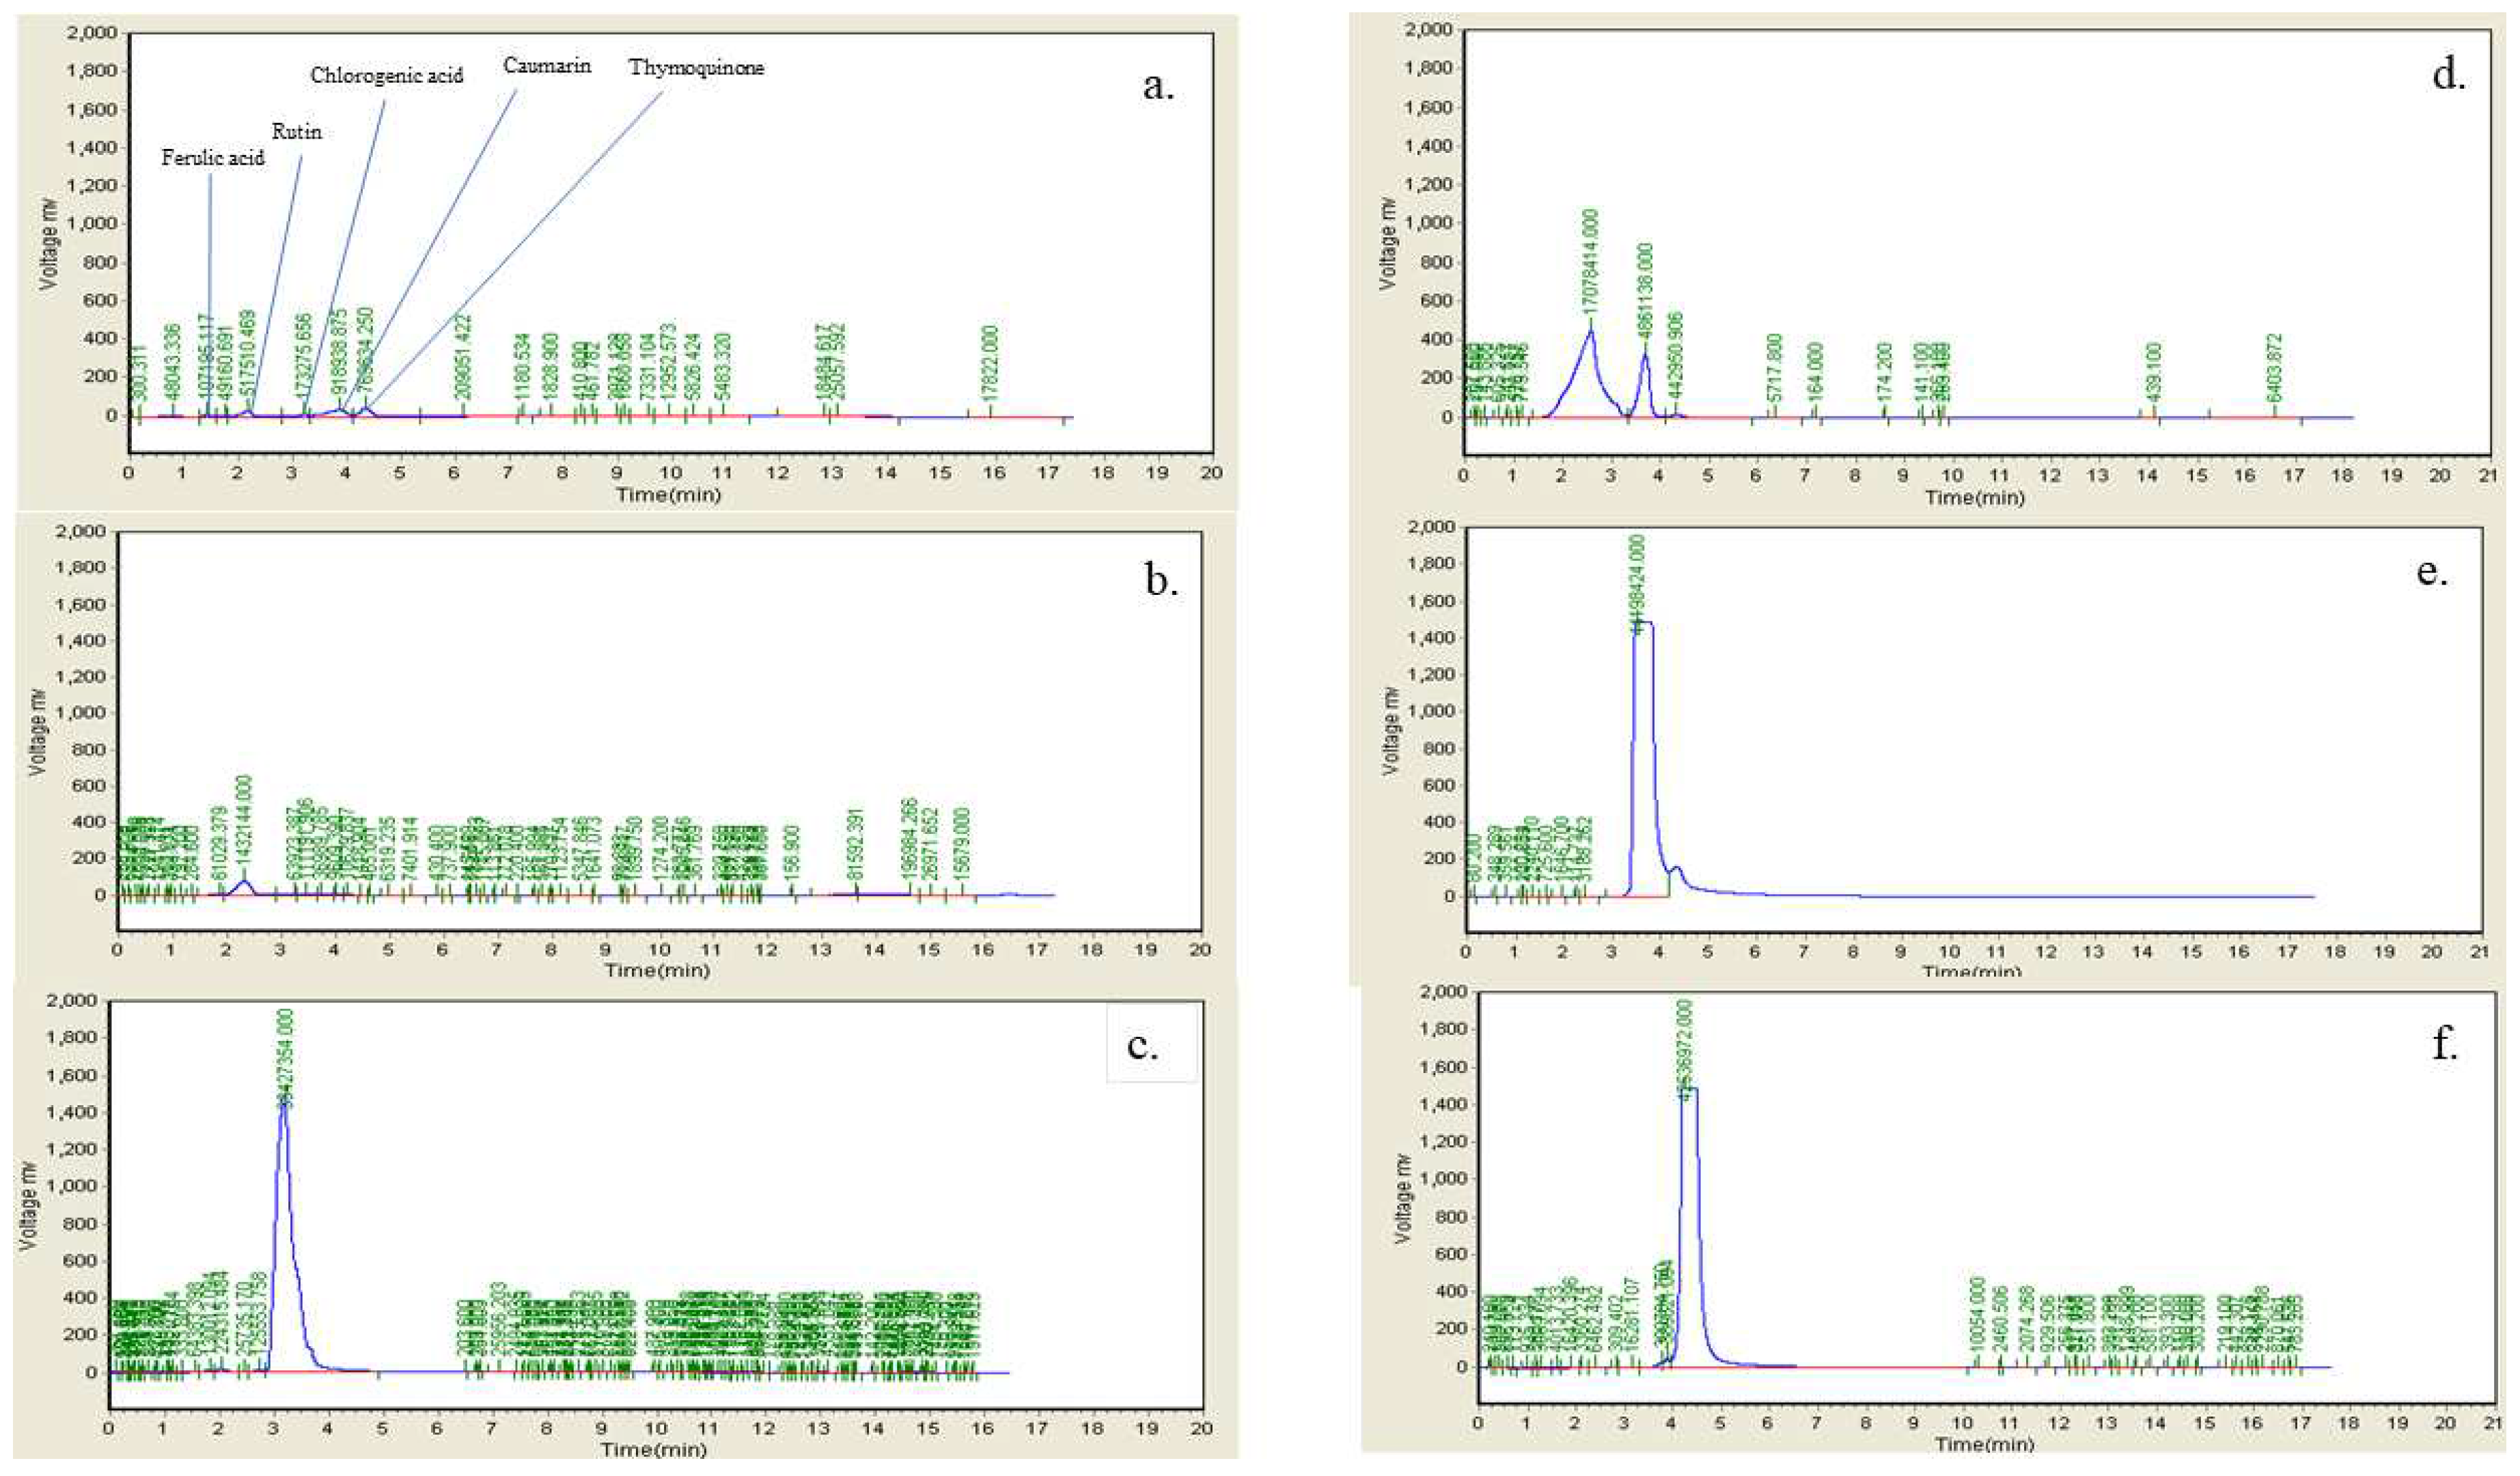
HPLC fingerprint chromatogram of Ficus carica L. Leaf extract a. FLE b. Ferulic Acid c. Rutin d. Chlorogenic acid e. Coumarin f. Thymoquinone.
Figure 13.
HPLC fingerprint chromatogram of Ficus carica L. Leaf extract a. FLE b. Ferulic Acid c. Rutin d. Chlorogenic acid e. Coumarin f. Thymoquinone.
Table 7.
LC-MS/MS Profile of ethanolic extract of Ficus carica L. Leaves (FLE).
Table 7.
LC-MS/MS Profile of ethanolic extract of Ficus carica L. Leaves (FLE).
| Sr. |
Compound |
Formula |
Molecular Mass
g/mol |
[M-H]-
m/z
|
Retention Time
(min) |
| 1 |
Piperine |
C17H19NO3
|
285.35 |
201 |
16.0-16.4 |
| 2 |
Myosmine |
C9H10N2
|
149.19 |
147 |
19.2-19.5 |
| 3 |
Dopamine |
C₈H₁₁NO₂ |
153.18 |
155.1 |
2.6-2.9 |
| 4 |
Oxindole |
C8H7NO |
133.15 |
134 |
6.9 |
| 5 |
Avenanthramide D |
C16H13NO4
|
283.28 |
282.2 |
19.0-19.3 |
| 6 |
Ethoxyquin |
C14H19NO |
217.31 |
218.2 |
12.7-13.1 |
| 7 |
Nalidixic acid |
C12H12N2O3
|
232.235 |
233.2 |
1.1-1.2 |
| 8 |
Flunixine |
C14H11F3N2O2
|
491.5 |
295 |
19.9-20.0 |
| 9 |
Tryptmanine |
C10H12N |
160.22 |
161.2 |
7.3 |
| 10 |
Xanthurenic acid |
C10H7NO |
205.167 |
206.9 |
7.9 |
| 11 |
Pheophorbide A |
C35H36N4O5
|
592.68 |
593.4 |
24.1-24.5 |
| 12 |
Piperyline |
C16H17NO3
|
271.3 |
273.1 |
14.8 |
| 13 |
Rizatriptan Benzoate |
C22H25N5O2
|
391.47 |
271.1 |
15.4-15.9 |
| 14 |
5 α-Androsterone |
C19H30O2
|
290.4 |
274.1 |
13.5-14.0 |
| 15 |
Reynosin |
C15H20O3
|
248.31 |
251 |
7.2 |
| 16 |
Baccatin III |
C31H38O11
|
586.6 |
609 |
26.4-26.8 |
| 17 |
Genipin 1-gentiobioside |
C23H34O15
|
550.51 |
549.4 |
27.2-27.7 |
| 18 |
Epiandrosterone |
C19H30O2
|
290.45 |
293 |
14.2 |
| 19 |
6-Methylcoumarin |
C10H8O2
|
160.17 |
162.8 |
6.9 |
| 20 |
Herniarin |
C10H8O3
|
176.16 |
178.1 |
6.6 |
| 21 |
Osthol |
C15H16O3
|
244.28 |
247 |
15.4-15.9 |
| 22 |
Isoshaftoside |
C26H28O14
|
564.5 |
565.3 |
9.2-9.7 |
| 23 |
Homoorientin |
C21H20O11
|
448.38 |
449.3 |
9.4-9.6 |
Table 8.
Pre-compression investigations of granules containing 500 mg FLE.
Table 8.
Pre-compression investigations of granules containing 500 mg FLE.
| Sr. No |
Bulk density (Vo) |
Tapped density (Vi) |
Hausner’s ratio |
Compressibility index |
Angle of repose |
| 1 |
0.54 |
0.73 |
1.35 |
35.179 |
33.04 |
Table 9.
Morphological characteristics of FLE prepared tablets.
Table 9.
Morphological characteristics of FLE prepared tablets.
| Sr. No |
Parameter |
Result |
| 1 |
Appearance |
Round tablets, Smooth surface |
| 2 |
Color |
Dark green |
| 3 |
Odour |
Characteristic odour |
| 4 |
Taste |
Grassy |
| 5 |
Moisture content (%) |
3.42 |
Table 10.
Quality control evaluation of prepared tablets.
Table 10.
Quality control evaluation of prepared tablets.
| Sr. No |
Weight variation (%) |
Thickness(mm) |
Diameter(mm) |
Hardness
(Kg/cm2) |
Friability
(%) |
Disintegration time (min) |
| 1 |
862±4.17 |
5.41±0.03 |
17.41±0.13 |
10.50±0.25 |
0.57 |
8.19 |
3. Discussion
Physicochemical evaluation of crude drug materials is considered very important parameter for development of standardized quality control profile of herbal medicine according to WHO (World health organization). These physicochemical standards have great significance in judging the
authenticity, purity, quality and efficacy of drug material. Decomposition of crude drugs either due to microbial contamination or by chemical change can be prevented by controlling or minimizing moisture contents. 10 - 20% moisture content range considered ideal to decrease the fungal and bacterial growth [
11]. In the current research work crude leaf powder of
Ficus carica L contained moister content 6.2017%. Identification and purity of crude drug can also be determined by a
sh value. In this work total ash value is 22.48 %, acid insoluble ash 7.68 % and water-soluble ash value is 13.57%. Secondary metabolites obtained from the plants are considered important as source for development of innovative therapeutic agents and researchers from all over the world are using medicinal plants for exploring new bioactive compounds [
12]. In the current research work, the exploration of phytochemicals in ethanolic extract of
Ficus carica L. leaves by means of chemical tests have shown the presence of many important metabolites that include tannins, phenols, glycosides, flavonoids, resins, alkaloids, steroids and terpenoids.
These compounds are biologically active and therefore, contribute to its pharmacological and physiological activities.
Phenolic compounds derived from tyrosine and phenylalanine considered as important secondary metabolites because of their scavenging ability. In the present research work the phenolic contents in the leaf of
Ficus carica were of 153±2.51. These phenolic compounds have different categories, among these flavonoids are largest and most important class. Flavonoids have valuable effect on human health because of their anticancer, antibacterial, anti-inflammatory, anti-allergic and antiviral activities are extremely effective scavenger of oxidizing molecules like singlet oxygen [
13]. In the present research work it was noted that
Ficus carica leaf contain total flavonoid contents 73±4.01(mg RE/g). Antioxidant capacity of extract cannot fully be determined by single antioxidant model. Therefore, different antioxidant assays were used to find out different mechanism of antioxidant action. In our study, different antioxidant activity assays like DPPH, hydrogen peroxide and ferric reducing antioxidant power were used to find out the antioxidant potential of
Ficus carica L. The DPPH radical scavenging assay extensively used for exploring the free radical scavenging potential of extracts/ compounds. Compounds with lower EC
50 value are considered to have higher antioxidant potential. In the present research work the EC
50 value of
Ficus carica L leaf extract was 0.58. This might be due to H-donating property of extract and forming the stable compounds from free radicals by inhibiting the oxidation process. Hydroxyl radicals (OH) produced by decomposition of hydrogen peroxide present naturally in microorganism, food, plants and human body initiate peroxidation of lipids and cause DNA damage. Ethanolic extract of
Ficus carica leaf proficiently scavenged hydrogen peroxide because of phenolic groups that neutralizes it into water by donating electrons [
13].
Several disease are linked with oxidative stress, that becomes elevated due to increased rates of metabolic pathways [
14] . Antioxidants play a significant role in decreasing the oxidative stress, thus are considered very helpful in treatment of several health concerns. The FRAP assay encompasses Ferrous reducing antioxidant power of a given sample and is considered as a powerful tool demonstration oxidative stress. This assay demonstrates the ability of antioxidants to scavenge free radicals and reduce Fe (III)/ tripyridyltriazine complex. In our case, the FRAP value of
F. carica ethanolic extract was moderate (88.76 µg/g of FeSO
4), that shows that this extract can participate in lowering oxidative stress. However, a comparably low FRAP value is an indication of low levels of phenolic contents in sample [
15]. Both obesity and diabetes are oxidative stress-associated diseases, therefore use of antioxidants may reduce diabetes and obesity induces complications.
Rheumatoid arthritis is a chronic autoimmune inflammatory ailment, that is associated with severe pain, and disability of patients. Several alternative strategies have been adopted for its effective management including medicinal plants [
16], due to severe side effects of existing medicine. Protein denaturation plays a key role in advancement and development of RA since these effects results in development auto antigens on a dissimilar manner. In protein denaturation, secondary and tertiary structural changes occur due to changes in strength of electrostatic forces [
17]. We investigate
F. carica extract for its protective effects against denaturation of BSA and a significant activity (51.2 ± 0.05 %) was recorded, that indicated a strong protective capacity of tested sample. Various reports have confirmed that tissue damage in body is mainly supported by proteinases during the inflammatory progressions. Thus, inhibition of proteinases can be helpful in management of inflammatory responses [
18] . In our case lower levels of inhibition (28 ± 0.01 %), was recorded, that is an indication of little contribution in this mechanism. Likewise, Inflammatory modulation is also explained by release of lysosomal contents due to breakage [
19]. Since cell membrane of RBCs resembles closely to lysosomes [
20], protective effect of tested samples on heat induced hemolysis was determined and a moderate protective effect (55 ± 0.03%) of tested sample was seen on RBCs.
Advanced glycation end products are important in progression of diabetic complications including both micro and macrovascular complications. There are several types of AGEs that play key role in progression of diabetic pathologies including β-Amyloid Formation, Fructosamine adduct formation and free carbonyl formation [
21]. We analyzed
F. carica extract and it was evident that tested sample has lower levels of absorbance compared to control (BSA + glucose), it was considered as having protective role on AGEs formation. However, in case of Fructosamine assay and free carbonyl estimation assay, lower inhibition levels were recorded. It was therefore concluded that
F. carica may have moderate levels of AGEs inhibition.
HFHSD/STZ-induced rodent diabetic models have become increasingly popular as they can mimic obesity along with diabetes by adjusting the duration of HFHSD administration [
22]. In our study, we successfully established a diabesity model using an 8-week HFHSD along with single dose of STZ-induced model in rats, with slight modifications. The diabesity model showed a significant elevation in fasting blood glucose levels compared to normal rats [
23]. During the course of the study, body weights were consistently monitored and found to significantly increase in the ODC group, indicating the development of obesity in the diabesity model due to metabolic abnormalities and increase in mass of adipose tissue such as hyperglycemia, hyperinsulinemia and hyperleptinemia [
24]. Interestingly, we observed that despite the significant increase in body weights of the ODC group, the actual weight gain in grams was lower compared to OC group that received HFHSD alone for a similar duration [
25].
Wistar albino rats showed significant increase (p < 0.005) in body weights of obesity control (OC) and obesity diabetes control (ODC) groups. After treatment with FLE (100, 250 and 500 mg/Kg), there was substantial (p< 0.001) reduction in body weight in treatment groups OT, ODT, ODFLE1, ODFLE2 and ODFLE3. The variation in body weight of animals during study period is summed up in
Table 6. This discrepancy may be attributed to the effect of STZ, which has been shown in previous studies to limit weight gain [
26]. FLE reduced the body weight and this reduction was more pronounced in ODFLE3 group comparing to lower doses of FLE.
Blood glucose level showed a significant increase (p < 0.001) in ODC groups. After treatment with FLE at the dose of (100, 250 and 500 mg/Kg of body weight) substantially (p< 0.001) lowers blood glucose level depending upon the dose in ODFLE1, ODFLE2 and ODFLE3 groups when compared with ODC group. FLE significantly reduced blood glucose levels at higher doses of 500 mg/Kg shown in
Figure 2.
Serum total cholesterol (TC) level showed a substantial increase (p < 0.001) in obesity control (OC) and obesity diabetes control (ODC) groups. After treatment with FLE (100, 250 and 500 mg/Kg), a momentous (p< 0.001) reduction in total cholesterol in ODFLE1, ODFLE2 and ODFLE3 group was noted depending upon the dose in comparison to ODC group in
Figure 3.
Substantial increase (p < 0.001) in triglycerides (TG) level was observed in OC and ODC groups. After treatment with FLE (100, 250 and 500 mg/Kg of body weight) there was momentous (p< 0.001) lessening of TG level in ODFLE1, ODFLE2 and ODFLE3 when compared with ODC group in
Figure 4. Serum high density lipoproteins (HDL) showed decrease (p < 0.001) in OC and ODC groups. After treatment with FLE (100, 250 and 500 mg/Kg bwt) a significant (p< 0.001) increase in HDL level was observed in ODFLE1, ODFLE2, and ODFLE3 in a dose dependent manner when compared with ODC group as in
Figure 5.
There was increase (p < 0.001) in serum low density lipoproteins (LDL) level in OC and ODC groups. After treatment of ODFLE1, ODFLE2, and ODFLE3 groups with FLE (100, 250 and 500 mg/Kg of body weight) respectively, there was a substantial decrease (p< 0.001) in LDL level was observed depending upon the dose in comparison to ODC group shown in
Figure 6.
Level of serum AST (Aspartate Aminotransferase) increased (p< 0.001) significantly in OC and ODC groups. After treatment with FLE (100, 250 and 500 mg/Kg), a significant (p< 0.001) reduction takes place depending on dose in AST level in different groups such as ODFLE1, ODFLE2, and ODFLE3 when compared with ODC group as shown in
Figure 7.
Serum Alanine aminotransferase (ALT) level was increased (p < 0.005) in OC and ODC groups. After treatment with different doses of FLE, there was significant (p< 0.005) decrease in ALT in dose dependent manner in ODFLE1, ODFLE2, and ODFLE3 when compared with ODC group
Figure 8. Serum Alkaline phosphatase (ALP) level showed a significant increase (p < 0.005) in OC and ODC groups. After treatment with FLE (100, 250 and 500 mg/kg) a substantial decrease (p< 0.005) in ALP level was observed in ODFLE1, ODFLE2, and ODFLE3 depending upon the dose when compared with ODC group as shown in
Figure 9.
Serum Creatinine level showed a significant increase (p < 0.005) in OC and ODC groups. After treatment with FLE (100, 250 and 500 mg/Kg) a noteworthy decrease (p< 0.005) in creatinine level was observed in ODFLE1, ODFLE2 and ODFLE3 depending upon the dose as shown in
Figure 10. Blood urea nitrogen (BUN) level showed a significant increase (p < 0.005) in OC and ODC groups. After treatment with FLE (100, 250 and 500 mg/kg) a substantial decrease in (p< 0.005) BUN level was observed in dose dependent manner in different groups (ODFLE1, ODFLE2, and ODFLE3) in comparison to ODC group as shown in
Figure 11.
In the current pharmaceutical landscape, many anti-obesity and anti-diabetic drugs have shown inconsistent efficacy and associated side effects. As a result, herbal or Ayurvedic formulations, which are traditional forms of medicine primarily practiced in Asia, are gaining global attention as an alternative approach. These formulations are known for their low toxicity and minimal side effects compared to synthetic drugs, making them increasingly popular for the treatment of metabolic disorders such as obesity and diabetes. The results of
in-vivo study suggested that FLE have potential anti-diabesity constituents that’s why tablet based formulation of FLE might be a substitute to allopathic anti-diabetic and anti-obesogenic formulations [
27].
On FTIR the difference between the spectra considered as proof of the transformation. The band observed in 3354 cm
-1 as alcohol (O—H stretching) or as aliphatic primary amines (N—H stretching), 2923 and 2858 cm
-1 as alkanes (C—H Stretching), s/cm as aldehyde (—CHO), 1723 cm
-1 as aldehyde (—C═O Stretching), 1629 cm
-1 as alkene (C═C), 1452 cm
-1 as alkane (C—H), 1374 cm
-1 as phenol or alcohol (Ph—OH/ O-H Bending), 1248 cm
-1 as amine (C—N Stretching), 1159 cm
-1 as tertiary alcohol (C—O), 1041 s/cm as anhydride (CO—O—CO) or sulfoxide (S═O), and 878 s/cm as trisubstituted or disubstituted alkanes (C—H bending) are labeled in the extracted spectrum. HPLC chromatogram depicts the presence of rutin, chlorogenic acid, coumarin, thymoquinone in which rutin and chlorogenic acid peaks in the chromatogram of FLE are previously identified in
Teixeira et al. 2009 [
28] and the presence of coumarin in
Innocenti et al. 1982 [
29]. FLE also revealed rich source of alkaloids, coumarin, terpenoids, steroids and carbohydrates showed in LC-MS/MS chromotragraphic results all the phytochemicals exhibit marked antioxidant potentials and previous studies enumerates the potential use of FLE for diabesity and other oxidative stress induced disease [
30].
The
F. carica L. standardized leaf extract was profiled and analyzed by using LC-MS/MS in negative and positive ionization modes for qualitative characterization of constituents. To our best knowledge, we are using LC-MS/MS for the first time for qualitative analysis to detect compounds in FLE extract. Characterization of compounds was carried out by absorption spectrum in the UV-visible region, retention times, spectrum obtained by fragmentation profile, MS-ESI, and with comparison with the aforementioned literature (
Table 7). LC-MS/MS analysis results allowed the tentative assignment of constituents with the help of negative ionization mode containing thirteen alkaloids: Piperine ([M-H]
- at
m/z 201), Myosmine ([M-H]
- at
m/z 147), Dopamine ([M-H]
- at
m/z 155.1), Oxindole ([M-H]
- at
m/z 134), Avenanthramide D ([M-H]
- at
m/z 134), Ethoxyquin ([M-H]
- at
m/z 218.2), Nalidixic acid ([M-H]
- at
m/z 233.2), Flunixine ([M-H]
- at
m/z 295), Tryptmanine ([M-H]
- at
m/z 161.2), Xanthurenic acid ([M-H]
- at
m/z 206.9), Pheophorbide A ([M-H]
- at
m/z 593.4), Piperyline ([M-H]
- at
m/z 273.1), and Rizatriptan Benzoate ([M-H]
- at
m/z 271.1), five Terpenoids: 5 α-Androsterone ([M-H]
- at
m/z 274.1), reynosin ([M-H]
- at
m/z 251.0), Baccatin III ([M-H]
- at
m/z 609.0), Genipin 1-gentiobioside ([M-H]
- at
m/z 549.4), Epiandrosterone ([M-H]
- at
m/z 293.0), three coumarins: 6-Methylcoumarin ([M-H]
- at
m/z 162.8), Herniarin ([M-H]
- at
m/z 178.1), and Osthol ([M-H]
- at
m/z 247.0), and two Flavonoids: Isoshaftoside ([M-H]
- at
m/z 565.3) and Homoorientin ([M-H]
- at
m/z 449.3). In the present research work, the negative mode ESI was more sensitive for the identification of alkaloids, flavonoids, terpenoids and coumarins in the extract.
On basis of in-vivo profile of FLE 500 mg per tablet was developed and analyzed the granules for parameters including compressibility index, hausner's ratio, tapped density, angle of repose and bulk density values were within standard acceptable range. Based on these results, further studies were conducted on compressed tablets including hardness, weight variation, disintegration time and friability. Total weight of compressed tablets was not maintained constant but within acceptable limit of ±5 %. The friability of the tablets was found to be less than 5%, which is considered satisfactory. The tablets exhibited uniform thickness. The tablets' hardness was analyzed and found to be within a good range. Furthermore, the disintegration testing of tablets also meets the required criteria.
4. Materials and Methods
All the kits and chemicals used in current research work were of analytical grade. Creatinine, Aspartate aminotransferase, Total bilirubin, Alanine transferase, Blood urea nitrogen and Alkaline phosphatase commercial kits were purchased from HUMAN diagnostics, Germany. Triglycerides kit was purchased from Clinical-Systems, India. Total cholesterol and HDL kits were purchased from Bio-Systems S.A, Barcelona, Spain.
4.1. Plant material Collection
Ficus carica L. leaves were collected from a tree grown in locality of Sahiwal in January, 2022 and were subjected to identification by the botanist Professor Dr Zafarullah Zafar Department of botany, Bahauddin Zakariya University, Multan and sample was retained in herbarium of Department of Pharmacognosy, Faculty of Pharmacy, Bahauddin Zakariya University, Multan, Pakistan under specimen voucher no (
www.theplantlist.org/tpl1.1/record/kew-2809827). The leaves (5.0 kg) deprived of stalks were shade dried, weighed and coarsely grinded to form the powder.
4.2. Physicochemical analysis4.3. Loss on drying
2.0 g leaf powdered of
Ficus carica L. was placed into a porcelain dish. Oven was used to dry the powdered drug at 105 ̊C to obtained the constant weight. The desiccator was used to cool the powdered drug. The weight loss was usually considered as moisture and was find out by applying the formula given below [
11].
4.4. Total ash
Leaf powder (2.5 g) was weighed and kept in crucible at a temperature of 550-600 °C for 2-3 hours in a muffler furnace. After that furnace was cooled and ash was weighed. This procedure was continuously repeated to obtained constant weight. The total ash content was quantified using Eq. 2[
11] and results are shown in
Table 1.
4.5. Acid-insoluble ash
10 % hydrochloric acid (25 ml) was mixed with the total ash present in an ash crucible, heated the crucible for 5 minutes at 500-600 ̊C, then filtered the mixture through filter paper. Dried and washing the residues with hot distilled water, %age acid-insoluble ash was find out by applying the Eq. 3 [
11] and results are shown in
Table 1.
4.6. Water-soluble ash
Total ash of powdered drug was placed in a beaker containing 20 ml water. The beaker was placed in water bath to boil the mixture. Then after boiling, filter paper was used to filter the mixture and residue was washed two times with hot water. Filter paper was placed an ash crucible, heated the crucible at the temperature of (500-600 ̊C) for 5 minutes. After that desiccator was used to cool the product. The ash content was calculated using Eq. 4 [
11] and results are shown in
Table 1.
4.7. Extract preparation
1000.g of coarsely ground powder of Ficus carica L. leaves was macerated in 1.5 L of 98% ethanol for 7 days. The soaked material was filtered using Watmann's filter paper. The solid residue was again macerated twice in 1.0 L and 0.8 L of 98% ethanol respectively to complete this extraction and filtrate was obtained. Then all three filtrates were combined and subjected to drying with rotary evaporator (Buchi Switzerland) at pressure 74.51 torr, 4 rpm and temperature conditions (between 30 and 40 °C). The thick, viscous paste was weighed to ascertain the % yield, placed in closed container, labelled and preserved at -20 °C in Biomedical Freezer (Haier Biomedical, DW-25L262, Japan) for further analysis.
4.8. Phytochemical analysis
Phytochemical screening of
Ficus carica L. leaves ethanolic extract (FLE) was performed to confirm the occurrence of secondary and primary metabolites like saponins, terpenes, resins, tannins, alkaloids, quinones, phenols, proteins and amino acids, carbohydrates, glycosides, flavonoids, coumarins, etc. using the methods described by
Soni et. al. 2022. Different chemical tests were carried out to detect the occurance of anthraquinone glycosides (Borntrager’s test), alkaloids (Hager’s, Mayer’s , Dragendrof’ and Wagner reagent), Phenols and tannins (Lead acetate, ferric chloride and gelatin test), carbohydrates (Barford’s, Benedict and Molisch’s test), cardiac glycosides (Keller Killiani test), amino acid and proteins (Ninhydrin test), terpenoids (Salkwoski’s test), flavonoids (lead acetate test and alkaline reagent), saponins and resins(froth test) [
31] and results are mentioned in
Table 2.
4.9. Total phenolic contents
Folin-Ciocalteu’s reagent method was used to estimate the FLE phenolic contents with modifications in method explained by
Aslam et al. 2022. FLE solution was prepared in various (0.2-1 mg/mL) and this sample (1 ml) was mixed with 1.0 ml Folin-Ciocalteu's reagent. After 5 minutes of incubation, 7% Na
2CO
3 solution (10ml) and distilled water (13 ml) were thoroughly mixed and added to mixture. The incubation of reaction mixture was done in dark for an hour, and absorbance was recorded at 750 nm by using UV/VIS spectrophotometer (Optima, SP-3000, Tokyo, Japan). The procedure was repeated three times. Gallic acid (standard) calibration curve was plotted by following the same procedure (
Figure 1 (a)) and the results are expressed as (mg GAE/g) of extract were calculated using Eq. 5 [
32] and are mentioned in
Table 3.
C = Concentration of gallic acid, DF = Dilution factor
V = Volume of extract, m = Weight of sample
4.10. Total flavonoids contents
Aslam et al. 2022 method with slight modifications was used to determined FLE total flavonoid contents. Rutin was utilized as a reference drug to calculate the total flavonoid contents. Combine 1 Ml of crude extract in a range of concentrations (0.2-1 mg/mL) with NaNO
2 0.5M (0.15 Ml ) and AlCl
3.6H
2O 0.3 M (0.15ml). The solutions were uniformly mixed with 1M NaOH (1ml). UV/VI’S spectrophotometer (Optima, SP-3000, Tokyo, Japan) was used to measure absorbance at 506 nm after5 minutes. The calibration curve for standard rutin was plotted by following the same procedure (
Figure 1 (b)) and results are presented as (mg RE/g) of extract were calculated using Eq. 6 [
32] and are mentioned in
Table 3.
C = Concentration of rutin calculated from standard curve, DF= Dilution factor
V =Volume extract, m = Weight of sample
4.11. Hydrogen peroxide scavenging assay
The technique reported by
Akhter et al. 2021 was somewhat modified in order to assess the H
2O
2 scavenging potential of FLE. The H
2O
2 scavenging activity of FLE was evaluated at doses ranging from (0.5-8 mg/mL). Sample solution (1 mL) was incubated with 40 mM H
2O
2 (0.6 ml). After 10 minutes UV/VIS spectrometer was used to measure the absorbance of hydrogen peroxide's at 230 nm in comparison to a blank solution (phosphate buffer solution). Gallic acid served as standard. The hydrogen peroxide scavenging potential of FLE was determined by using Eq. 7, and the entire procedure was repeated thrice [
33]. Results are mentioned in
Table 3.
4.12. Radical scavenging assay by DPPH
FLE scavenging activity by DPPH method was find out by applying the
Wintola et al. 2021 method with slight amendments. Five solutions ranging (0.2-1 mg/mL) of gallic acid and FLE was prepared by using methanol as solvent. 1mL of each dilution and 0.135 mM DPPH solution (1 ml) prepared in methanol were mixed by using vortex mixture and incubated in dark room for 30 minutes at 25°C. The absorption of each sample was determined spectrophotometrically at 517 nm wavelength with the help of UV/VIS spectrometer (Optima, SP-3000, Tokyo, Japan) [
34]. % inhibition was calculated using Eq. 8 and the results are mentioned in
Table 3.
4.13. FRAP assay
Ferric reducing antioxidant power assay (FRAP) was performed according to the protocol described by
Benzie et al. 1996. FRAP reagent was prepared at pH 3.6 by mixing FeCl
3 20 mmol/L (2.5 mL), acetate buffer 0.3 mol/L (25 ml) and TPTZ 10 mmol/L (2.5 mL) at temperature of 37 °C. Sample (40 μl) were diluted with 0.2 ml distilled water and mixed with 1.8 ml FRAP reagent. Reaction mixture was kept for 10 minutes at 37 °C and absorbance was taken with the help of UV/VIS spectrometer at 593 nm (Optima, SP-3000, Tokyo, Japan). FeSO
4 (1 mmol/L) was used as reference standard. Standard curve of FeSO
4 is plotted in
Figure 1(c). The final results of assay were presented as extract concentration having ferric reducing ability equivalent to that of 1 mmol/L FeSO
4 [
35] and are mentioned in
Table 3.
4.14. Proteinase Inhibition activity
Proteinase inhibition assay was carried out by using modified protocol described by of
Sakat et al. 2014. Trypsin (0.06 mg), Tris HCl 20 mM (1ml), buffer (pH 7.4), and FLE extract solution (1.0 ml) with different concentrations (100 - 500 g/mL) were mixed to form 2.0 ml mixture and incubated at 37 °C. for 5 minutes. Then 0.8 %w/v 1.0 ml of casein was added to reaction mixture and kept for 20 min. After that 70 % perchloric acid (2 ml) was added that results in cloudy solution formation. This solution was centrifuged and supernatant absorbance was measured at 210 nm with the help of UV/VIS spectrophotometer. Buffer solution was used as a reference standard [
36]. The experiment was performed in three times, % inhibition was calculated by using Eq. 9 and the results are mentioned in
Table 4.
4.15. Heat Induced Hemolysis
Heat induced hemolysis assay was performed by using a modified method of
Gunathilake et al. 2018. Briefly, suspension of blood cells (0.05 mL) and FLE (0.05 ml) solution prepared in distilled water were mixed with phosphate buffer (pH 7.4) 2.95 ml. The reaction mixture was placed in shaking water bath for 20 minutes at 54
◦C. Then mixture was centrifuged (for 3 min at 2500 rpm), and the supernatant absorbance at 540 nm was measure with the help of UV/VIS spectrometer (Optima, SP-3000, Tokyo, Japan). Solution of phosphate buffer was used as experimental control. The test was performed in triplicate manner [
37]. Hemolysis level was calculated using Eq. 10. Results are mentioned in
Table 4.
4.16. BSA-Denaturation assay
This assay was performed by applying the method of
Gunathilake et al. 2018 with slight modifications. Briefly, bovine albumin 1% 0.2 ml, saline phosphate buffered saline 4.780 mL (pH 6.4), and FLE 5 mg/mL (0.02 ml) was mixed gently and kept for 15 minutes in water bath at 37◦C. then heated the reaction mixture at 70
◦C for 5 minutes. Then this reaction mixture was cooled and absorbance at 660 nm was taken with the help of UV/VIS spectrophtometer. Buffer solution was taken as and the % inhibition of protein denaturation was find out with the help of Eq. 11 [
38] and the results are mentioned in
Table 4.
4.17. Antiglycation assays4.18. Detection of β-amyloid Formation (Congo-red Assay)
This assay was sed to measure the aggregation in FLE glycated sample according to protocol described by
Miroliaei et al. 2017. Briefly phosphate buffer solution (400 µl) of pH 7.4 and Congo red solution (100 µL) were mixed with 100 µl of FLE (0.25 mg/mL) or control (BSA+ Glucose). Incubation of reaction mixture was performed for 20 min in darkness and UV/VIS spectrometer was used to measure the absorbance at 530 nm [
39]. Results are mentioned in
Table 5.
4.19. Fructosamine Assay
The concentration of control and fructosamine (amadori product in glycated albumin samples) was determined by applying the
Tupe et al. 2017 method. NBT solution (0.75 mM) was prepared in a 0.1 M carbonate buffer (pH 10.35). NBT solution (0.8 ml) was incubated with glycated samples (40 µL) for 30 min at 37
°C. UV/VIS spectrophotometer was used to measure the absorbance at 530 nm., The fructosamine concentration was determined with the help of typical 1-deoxy-1-moepholinofructose curve and expressed in µM/mg of protein (r =0.981,Y = 0.00X + 0.017) [
40] and results are displayed in
Table 5.
4.20. Free Carbonyl Group estimation
Ashraf et al. 2015 method was used to accesses the carbonyl group in glycated test samples. HCl 2.5M was used to prepare 10mM DNPH. 500 µL Glycated sample and 500 µL DNPH solution were mixed and incubated for 60 minutes at 25 °C then precipitation was carried out by using 20% 1.0 ml TCA. Washing of precipitate was carried out with 1ml mixture composed of ethanol: ethyl acetate in 1:1 v/v and 1ml 6M urea was used to dissolve pellets. After that UV/VIS spectrometer was used to measure absorbance at 365 nm. Molar extinction coefficient (ε at 365 nm=21 mM
-1 cm
-1) was used to calculate the concentration of protein carbonyl group and was presented nM/mg of protein [
41]. Results are presented in
Table 5.
4.21. Preparation of animals
Wistar albino rats of both sex having the body weight of 120±20 g was housed in the animal house of the Faculty of Pharmacy, Bahauddin Zakariya University Multan, Pakistan. All rats were housed in polycarbonate cages of 18 x 34 x 7 cm3, with a maximum of six rats per cage, at typical temperature and humidity levels of 25±2 °C and 12–12 hours of light and dark, respectively. Animals were given a conventional animal food and unlimited access to water. The Institutional Animal Ethics Committee, Faculty of Pharmacy and Pharmaceutical Sciences, University of Karachi, approved the experiment's protocol, and the experiment was conducted in accordance with the committee's rules for the monitoring and administration of animal experiments under Institutional Bioethical Committee Approval No. IBC KU-289/2022.
4.22. In-vivo methodology
Animal study was performed according to standard protocol with slight modifications.
Wistar albino Rats (n=48) weighing (120±20 g) was acclimatized for 15 days before the start of experiment then the following treatments were given to rats of each group.
Group A: It was called as normal control (NC) and consists of 6 animals, receives normal saline at the rate of 5 mL/kg of body weight peroral for complete period of study.
Group B: Consists of 42 rats, receives 3 ml/kg body weight of High Fat High Sugar Diet (HFHSD) that composed of Vanaspati ghee and coconut oil (3:1) and 10 mL/kg 25% dextrose water P.O. for 8 weeks and then divided into following different groups.
Group B1: It was called as obesity control group and consists of six animals. All animals were fed with 3 ml/kg of body weight HFHSD for remaining four weeks of study.
Group B2: Obesity Treatment (OT) group, rats were feeded with high fat high sugar diet (HFHSD) continuously along with atorvastatin (standard drug) 60 mg/kg of body weight orally for a period of 4 weeks.
Group B3: Obesity-Diabetes Group, rats (n=30) were fed with high fat high sugar diet (HFHSD) along with streptozotocin (65 mg/kg) of body weight interperitoneally prepared in citrate buffer of pH 4.5. Blood glucose level was checked after 48 hours after injection. Animals showing blood glucose level ≥200 mg/mL were randomly divided into following 5 groups (n=6) and were fed with HFHSD for complete period of study (12 weeks)
Group C: It was called as Obesity-Diabetes Control (ODC) group and was administered normal saline orally 5 mL/kg of body weight for a period of 4 weeks.
Group D: It was called as Obesity-Diabetes Treatment (ODT) group, rats in this group were administered with glibenclamide (10 mg/kg of body weight) and atorvastatin (60 mg/kg of body weight for 4 weeks.
Group E: It was called as Obesity-Diabetes Treatment (ODFLE1) group in which rats were feeded with FLE (100 mg/kg of body weight) orally for 4 weeks.
Group F: Obesity-Diabetes Treatment (ODFLE2) group, in this group rats were treated with FLE (250 mg/kg body weight) for a period of 4 weeks.
Group G: Obesity-Diabetes Treatment (ODFLE3) group in which rats were administered with FLE (500 mg/kg) of body weight for 4 weeks [
42,
43]. Body weight and blood sugar level was measured at 1
st day, 8 week, 8week and two days and twelve weeks.
4.23. Biochemical Analysis
Blood samples for liver function test (total bilirubin, Aspartate transaminase, alkaline phosphatase and alanine transaminase), Lipid profile (Triglycerides, total cholesterol, , high density lipoproteins, and low-density lipoproteins), and RFTs (Creatinine, Urea, and Uric acid) were collected by closed cardiac puncture at start, after 8 weeks of HFHSD and at the end of study period and preserved at -20 °C. The bodyweight (bwt) of all animals was also measured at the start, after 8 weeks of HFHSD, after 8 weeks and two days and then at the end of study period. All animals were anesthetized by chloroform and pancreas, liver and kidney of all animals were obtained, kept them formalin solution 10% for histo-pathological examination.
4.24. Statistical analysis
Results obtained from the research work was presented as mean ± SEM of n=6 in each group and GraphPad Prism 9.0.1 (La Jolla, CA, USA) was used to plot the graph and was statistically evaluated by using two-way ANOVA followed by Tukey’s test to find the significance between different groups by setting P≤0.05.
4.25. Fourier transform infrared (FTIR) spectroscopy
Different functional group was identified by using the FTIR spectroscopy. Small amount of
Ficus carica L. extract was placed on the FTIR spectrophotometer (Bruker OPUS software). IR light was absorbed by the sample at different wavelengths and this absorbed energy converted into the vibrational energy which forms the signals and then detector is used to analyzed. The peaks obtained were interpreted on screen of computer and different functional groups were analyzed [
44].
4.26. High-performance liquid chromatography (HPLC) assay
HPLC analysis was performed on a Spectra-Physics SP 8800/8810LC pump coupled to a Varian 9065 polychrom diode-array detection system. Acetonitrile and distilled water in ratio of (ACN: H
2O; 60:40) was used as mobile phase. 1 ml/ min was flow rate and 500 µL of FLE solution (5 mg/mL) were injected on a Supelco
® HPLC column (12 ×260 mm, 5 µm) (Sigma Aldrich), with a 17 min linear gradient at 25 ̊C [
45].
The following phenolic compounds were used for analysis: chlorogenic acid, ferulic acid, rutin, coumarin, and thymoquinone and the peaks of sample were compared with standards.
4.27. Liquid Chromatography–Mass Spectrometry/Mass Spectrometry (LCMS/MS) Analysis
LC-MS/MS analysis was carried out on an ion trap (IT) tandem mass spectrometer (AmaZon speed, Bruker Daltonics, Bremen, Germany) hyphenated with a Thermo Fischer Scientific UHPLC system (Bremen, Germany). Extract 10 μL (1 mg/mL) was injected into the Agilent Technologies Zorbax SB-C18 column (50 mm x2.1 mm, 1.8m, CA, USA) via autosampler for a gradient separation. Separation was achieved using a flow rate of 0.2 mL/min of eluent A (0.1% formic acid in water) and eluent B (0.1% formic acid in methanol), changing from 5% B to 100% B in 20 minutes. 100% B was maintained for 5 minutes before returning to 5% B. Compounds were ionized using ESI ion source operation in positive ion mode at 4500 V. Other ion source parameters were as follows: dry gas pressure was 10 psi, dry gas flow was 4 L/min, and dry gas temperature was 180 °C. The mass scan range was 100 to 2000 amu. The top 10 precursor ions based on intensities were selected and fragmented in an automatic fashion. The MS/MS scan range was 50–2000 amu. MS/MS data was processed using Compass Data Analysis 4.4 (Bruker Daltonics). All MS/MS spectra were converted to mgf format. Mgf files were then searched in Global Natural Product Social Molecular Networking (GNPS) Libraries Search using default search parameters, i.e., MS tolerance of 02 amu, MS/MS tolerance of 0.5 amu with at least 3 peaks matching, and a score threshold of 0.8 MS/MS matching was then manually validated [
46].
4.28. Formulation Development
The extract was air dried for a period of time that commensurate with the rate of drying. Lactose is used as diluent, starch is used for its binding and disintegrating properties, magnesium stearate, and talc were used as lubricants. All the components and extract had been weighed in accordance with the formula mentioned in
Table 11, mixed, dried, granulated and lubricated. The granules of uniform particle size were then transferred to the polythene bags, labeled and placed for further study. Granules were examined for their characteristics like angle of repose, bulk density, compressibility index, tapped density and Hausner's ratio.
4.29. Pre-compression studies
The characteristics of the granules were studied carefully since they affect the dosage uniformity. It was evaluated using the criteria mentioned in
Kumar et. al. 2021 [
47];
4.30. Bulk density
Bulk density of granules was measured by pouring the already weight granules to graduated cylinder. Bulk density of formulated granules was calculated with the help of following Eq. 12:
4.31. Tapped density
The tapped density parameter is carried out by doing 100 taps from height approx. 14mm until a constant volume is detected, and then the tapped density is computed by Eq. 13:
4.32. Hausner’s ratio
The ratio of tapped density and bulk density is Hausner’s ratio. Ideal range is ought to be 1.2-1.5.
4.33. Compressibility index
Compressibility index of formulation granules was calculated using Eq. 15;
4.34. Angle of repose
Angle of repose (
) was find out by pouring the powdered mixture through walls of a funnel that was held in place so that its lower tip was precisely 2.0 cm above a hard floor. The mixture was dispensed until the upper tip of the pile floor reached the lowest tip of the funnel. Eq.17 is used to compute the repose angle.
4.35. Post Compression study of tablets
After measuring waft characteristics, the granules were subjected to compression using single punch tablet compression machine. Tablets were then subjected to physical evaluation tests i.e. appearance, diameter, weight variation, thickness, friability, hardness and disintegration time and result are mentioned in
Table 9 and
Table 10.
4.36. Appearance
Tablets were evaluated for look by examining 20 tablets and visually inspected the tablet's core surface for any discolorations and surface roughness according to
Modasiya et. al. 2009 [
49].
4.37. Weight variation
Weight variation test was performed according to protocol described by
Modasiya et. al. 2009 with slight modification. According to this method weight variation test of tablets was performed by measuring weight of 20 tablets individually and average weight was calculated. If two or more of the single tablet weights vary from the 7.5 percent percentile limit, the tablets are considered to pass the test [
49].
4.38. Hardness
Monsanto's hardness tester was used to test the hardness in kg/cm
2 units [
49].
4.39. Diameter and thickness
Vernier-calipers were used to measure the tablets' thickness and diameter, and their measurements in millimeters (mm) were recorded [
49].
4.40. Friability
Electro laboratory friability instruments have been used to measure the friability of tablets. The 20 pre-weighed tablets were evaluated using a 25 rpm plastic chamber that drops the tablets six inches away with each operation over the course of 100 revolutions, and they were timed in friction apparatus to test for the consequences of abrasion and shaking [
50]. Eq. 18 was used to compute friability of tablets.
4.41. Disintegration time
The disintegration instrument was used to evaluate six tablets. Six tablets were placed in a basket comprising of six glass tubes with six discs placed in 900 ml of water heated to 37 °C in a 1000 ml beaker. Disintegration time is the amount of time required for the tablet to properly disintegrate [
51].
