1. Introduction
1.1. Reference context
The counter action against climate change, characterizing the present direction of private investment and policy makers commitment, mainly focuses on a responsible use of energy resources, deploy of efficient machineries, and moves towards energy sources with lower carbon footprint.
We have been aware of climate change for quite sometimes already, in fact it is possible to find accounts on the subject dating back to 1940 or earlier (KINCER, 1933). However, only recently this topic has begun to attract public opinion and is now perceived as urgent and related problems can no longer be postponed; this is undoubtedly due to the impact of meteorological extreme phenomena that are now taking hold all over the globe.
Clear examples are the California wildfires (Daoping Wang, 2020) (Jon E. Keeley, 2021), or the violent flooding phenomena in Bangladesh (Babul Hossain, 2020), and in the small basins of the Mediterranean (Gerardo Benito, 2020).
Other more recent examples of these events are the floods in Italy, the Emilia-Romagna region on 3 May 2023 and 16 May 2023, or the fires in Canada in June 2023.
The significant increase in the frequency of extreme climatic events, like the recent collapse suffered by the Marmolada glacier (M. Chiarle, 2022) has even more raised the level of attention present on the issue, by the scientific community and governments; the latter have implemented countermeasures born out of the United Nations conferences on climate change, with specific reference to COP 26 and COP 27, held on November 13, 2021 and November 8, 2022, respectively.
Through the aforementioned international conferences, notable achievements have been made, such as the finalization of the Paris Code, based on the operational aspects of the Paris Agreement, the commitment given by developed countries to step up climate finance, the adoption of the global commitment to reduce methane emissions by 30 percent no later than 2030, as far as COP 26 is concerned, and the maintenance of Europe's commitment to achieving climate neutrality despite the energy crisis exacerbated by the Russian-Ukrainian conflict, as far as COP 27 is concerned (consilium.europa.eu, consilium.europa.eu, 2023).
Also, the most important actions taken by EU are shown below:
Next Generation EU: a financial tool created for the purpose of countering the socioeconomic consequences of the pandemic event from Covid-19 and preparing member states for the ecological and digital transition. The NextGenEU fund is the core of further economic package: the Green New Deal (GND) (next-generation-eu, 2023);
Green New Deal: a European strategy that provides guidelines to achieve decarbonization within a specific time frame, specifically in 2050. In order to achieve this challenging goal, other instruments, such as the Fit For 55 (commission.europa.eu, commission.europa.eu, 2023) have been derived from the GND;
Fit for 55: is a set of proposals with the aim of ensuring that EU policies are aligned with the strategic climate goals designated by the European Parliament; specifically, the package refers to the goal of regressing climate-altering gas emissions by at least 55 percent by 2030 from 1990 levels (consilium.europa.eu, 2023);
RePower EU: This plan was created to counter the global energy market difficulties and disruptions that have occurred because of the Russian-Ukrainian conflict. RePower EU includes legislative actions and financial measures to build the infrastructure in Europe to achieve significant energy savings, clean energy production, and diversification of energy supply (commission.europa.eu, 2023).
Contextually, in September 2015, the governments of 193 member countries of the United Nations signed the 2030 Agenda, and approved by the UN General Assembly, which has seventeen goals for sustainable development, which in turn group one hundred and sixty-nine targets to be achieved in the environmental, social, economic, and institutional spheres, by the year 2030 (Territoriale, 2023).
As mentioned before, one of the main actions to take for reducing the production impact on climate change is the sustainable management of energy sources and a careful treatment of waste.
Mechanical Biological Treatment (MBT) plants can be defined as cold treatment plants for waste, combining biological processes, such as anaerobic digestion, with mechanical processes.
Making MBT plants more efficient, which are among the most widely used in the national waste sector, can be a strategic maneuver.
Efficiency of this plant leads both to the reduction of consumption through a responsible use of energy, and to a better performance, which means more tons of waste treated with equal energy expenditure.
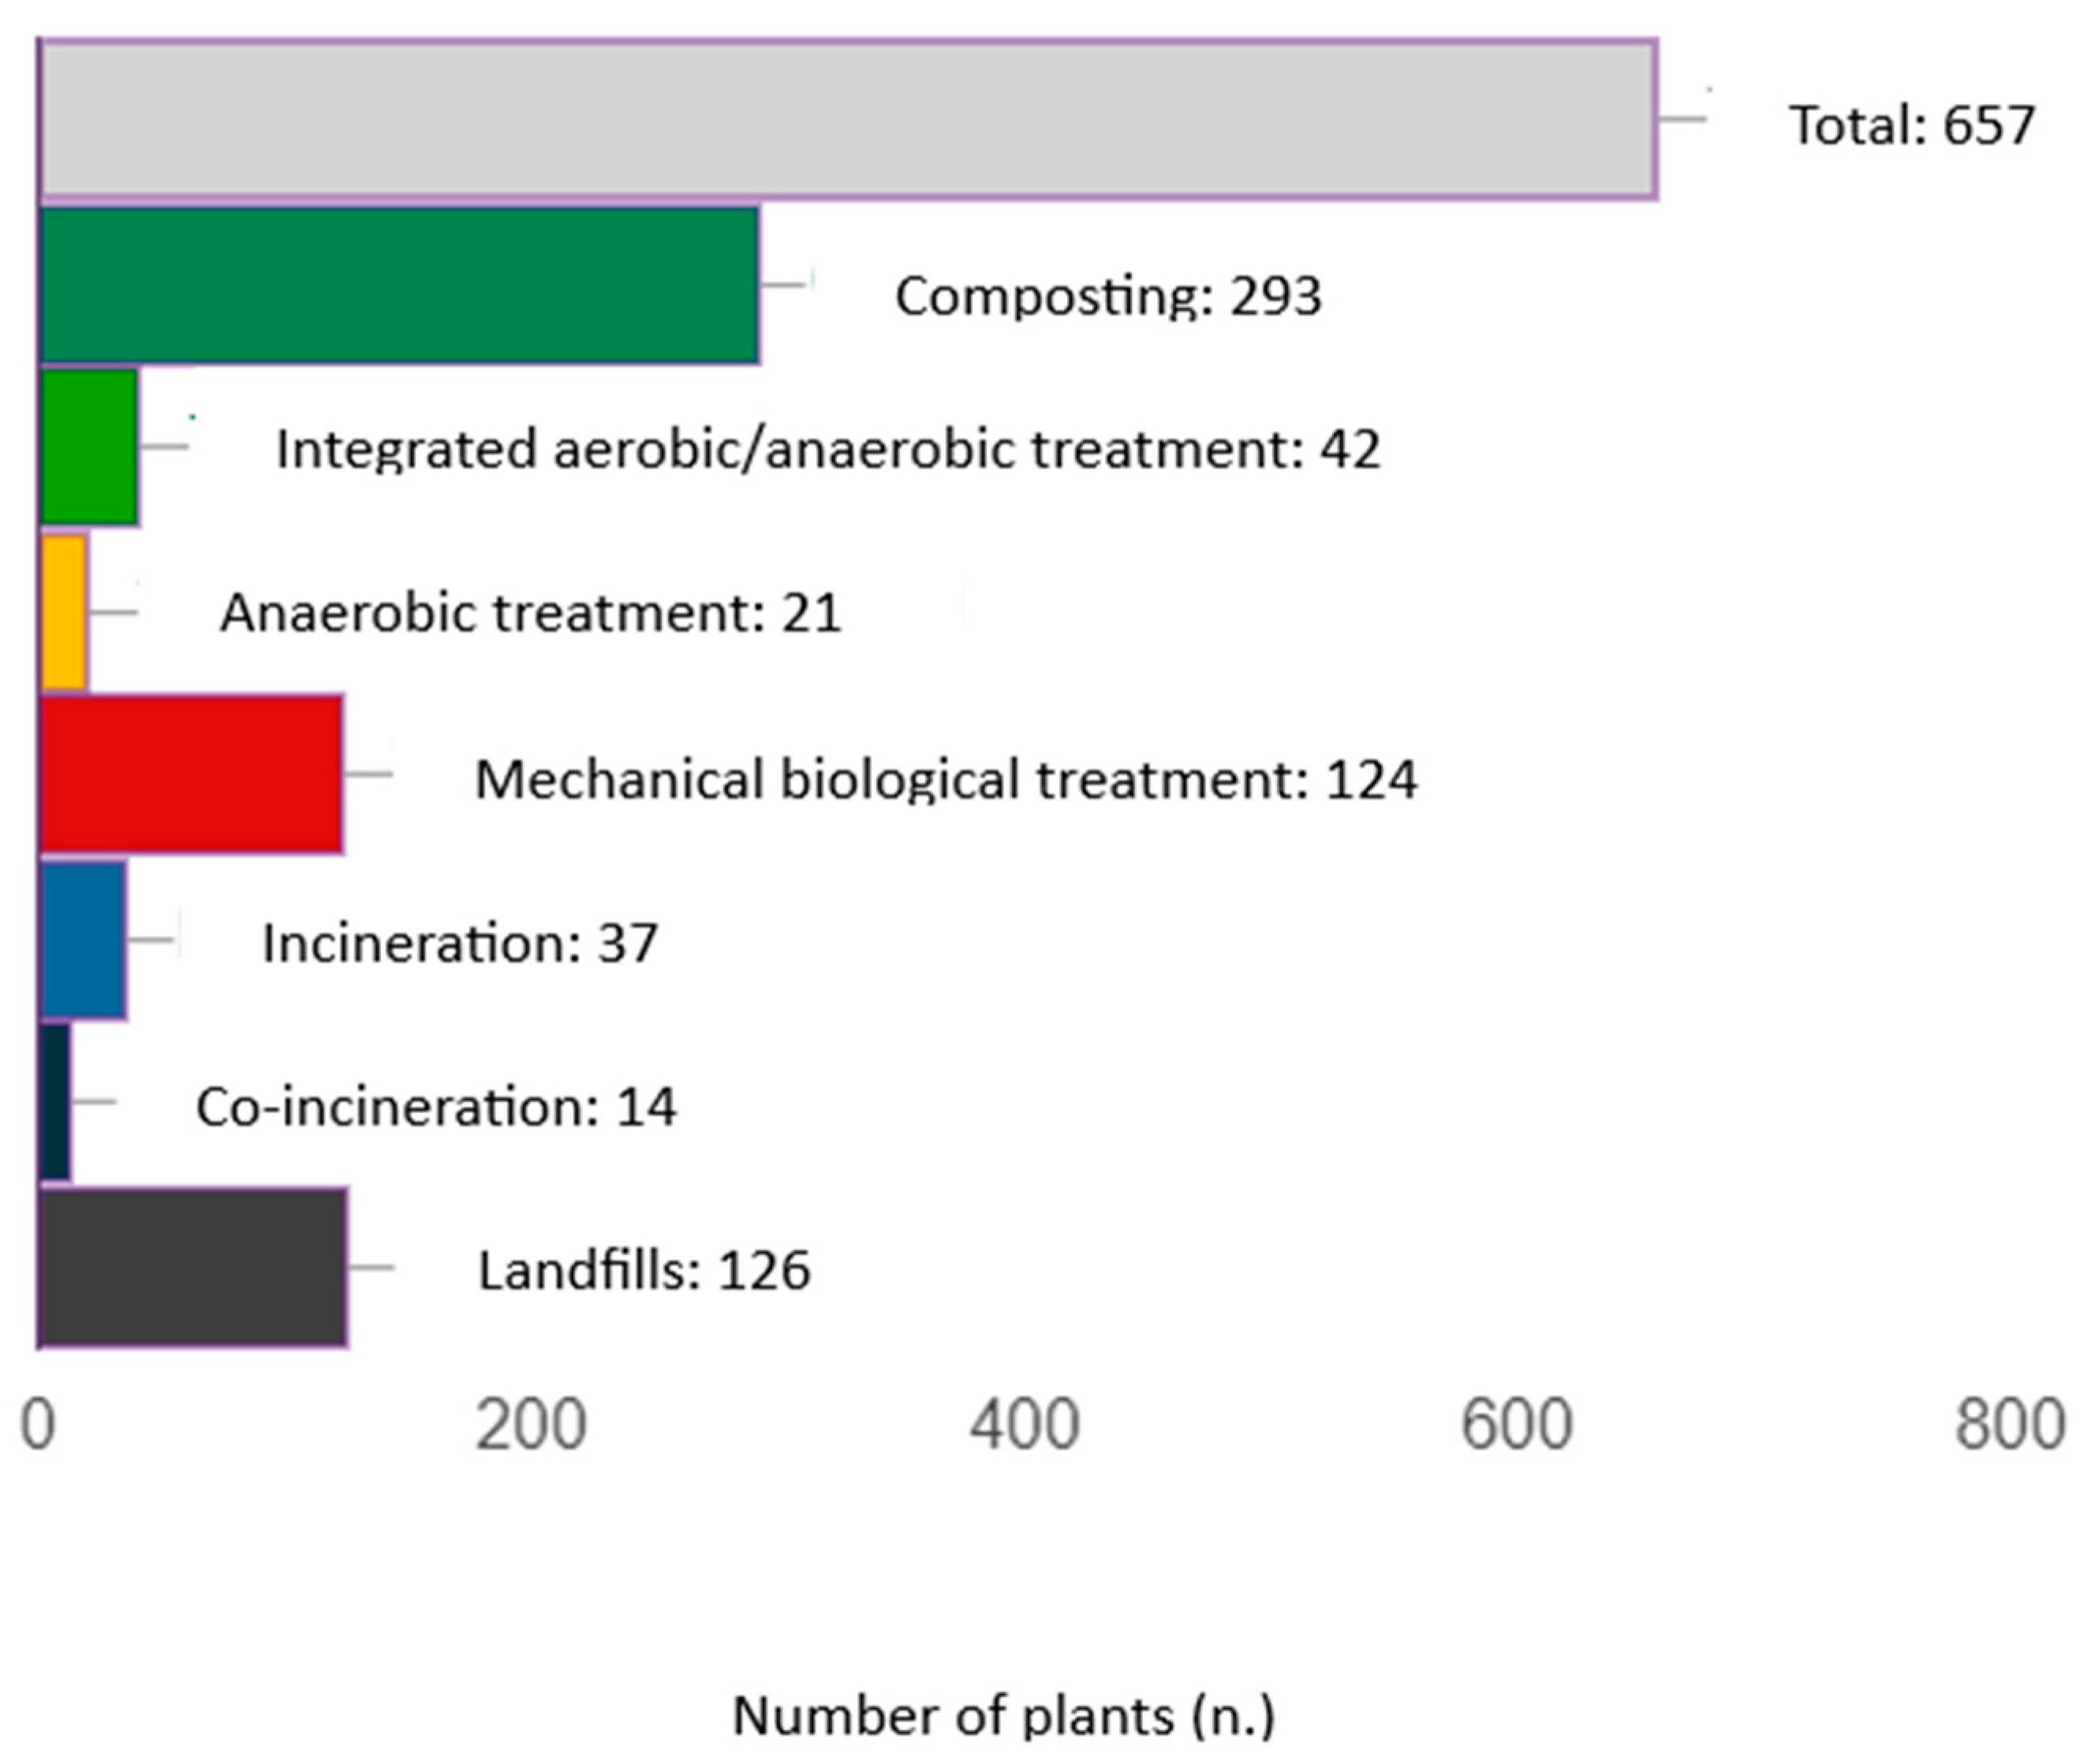
With specific reference to the Italian context, it is noted that there are a total of one hundred and twenty-four MBT plants in the territory and that this type of waste treatment is entrusted with the processing of a number of tons of municipal waste (MW) greater than other waste treatment systems in the country, such as composting, integrated aerobic/anaerobic treatment, anaerobic digestion, co-incineration and landfill. An overview of the above is given in
Figure 1, while
Table 1 gives a specific detail.
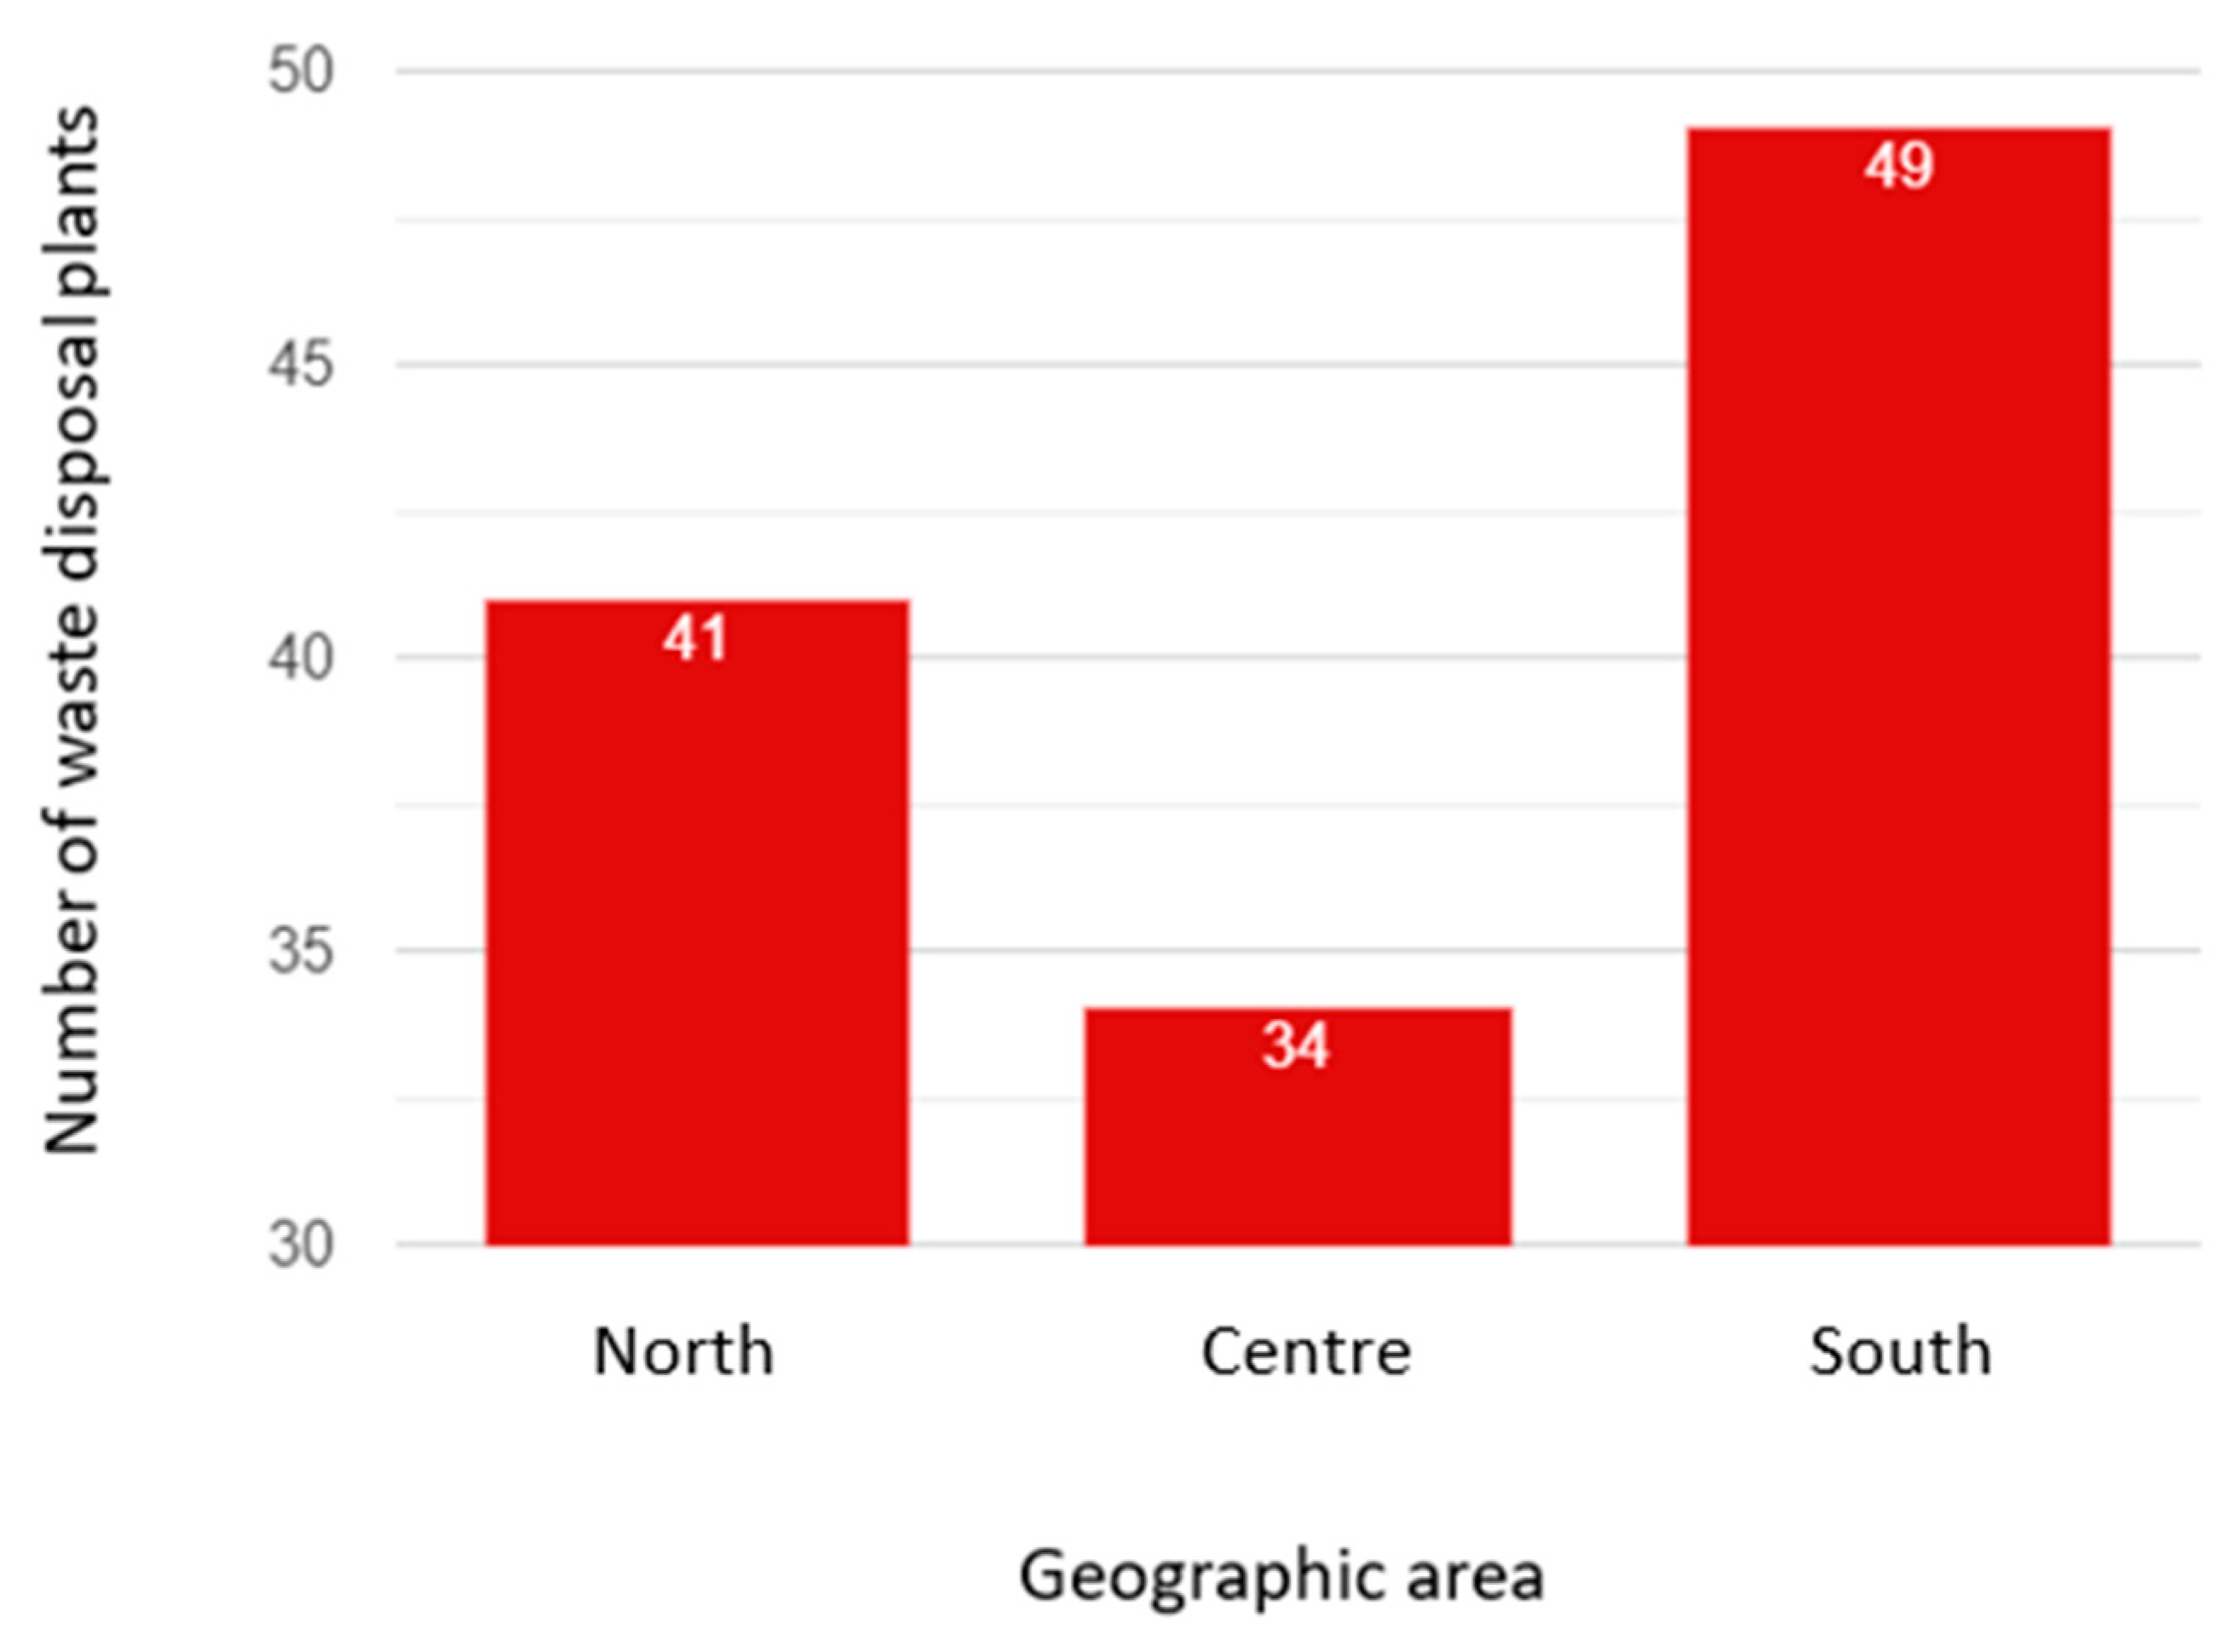
Figure 2 details the spatial distribution of mechanical biological waste treatment plants on the peninsula; as you can see, in southern Italy there is the greater share of TMB plants, while in the center there is the smaller share.
The waste industry, the recovery and reuse of these in a circular economy is a highly topical issue, to which the collective consciousness is particularly sensitive. Therefore, the possibility to undertake efficiency actions in this field represents an added value for research.
1.2. Research objectives
The purpose of the study is to build a model that can accurately predict the electricity consumption of a real mechanical biological waste treatment plant, starting from a set of predictive variables, coincident with the inputs and outputs of the plant. These variables will be explained in section 3.2, dedicated to predictive analysis.
This result could lead to the identification of energy-consuming processes and/or a mix of incoming waste particularly energy-consuming.
From this information could be set a reasonable management of energy needs capable of reducing the electricity consumption of the plant, and the value of the maximum power required, achieving savings in economic terms and at the carbon footprint level.
It is confirmed that the objectives of the work fit perfectly into the current context, not only in relation to the energy aspect, but also and above all in reference to the environmental aspects; the model is indeed a means to act on this thematic area not only by reducing greenhouse gas emissions, thanks to the lower consumption of electricity associated, and consequently reducing the share of gas input made to obtain the energy vector, but at the same time it is a useful tool to identify the internal processes to be efficient proper to the waste treatment plant studied.
2. Materials and methods
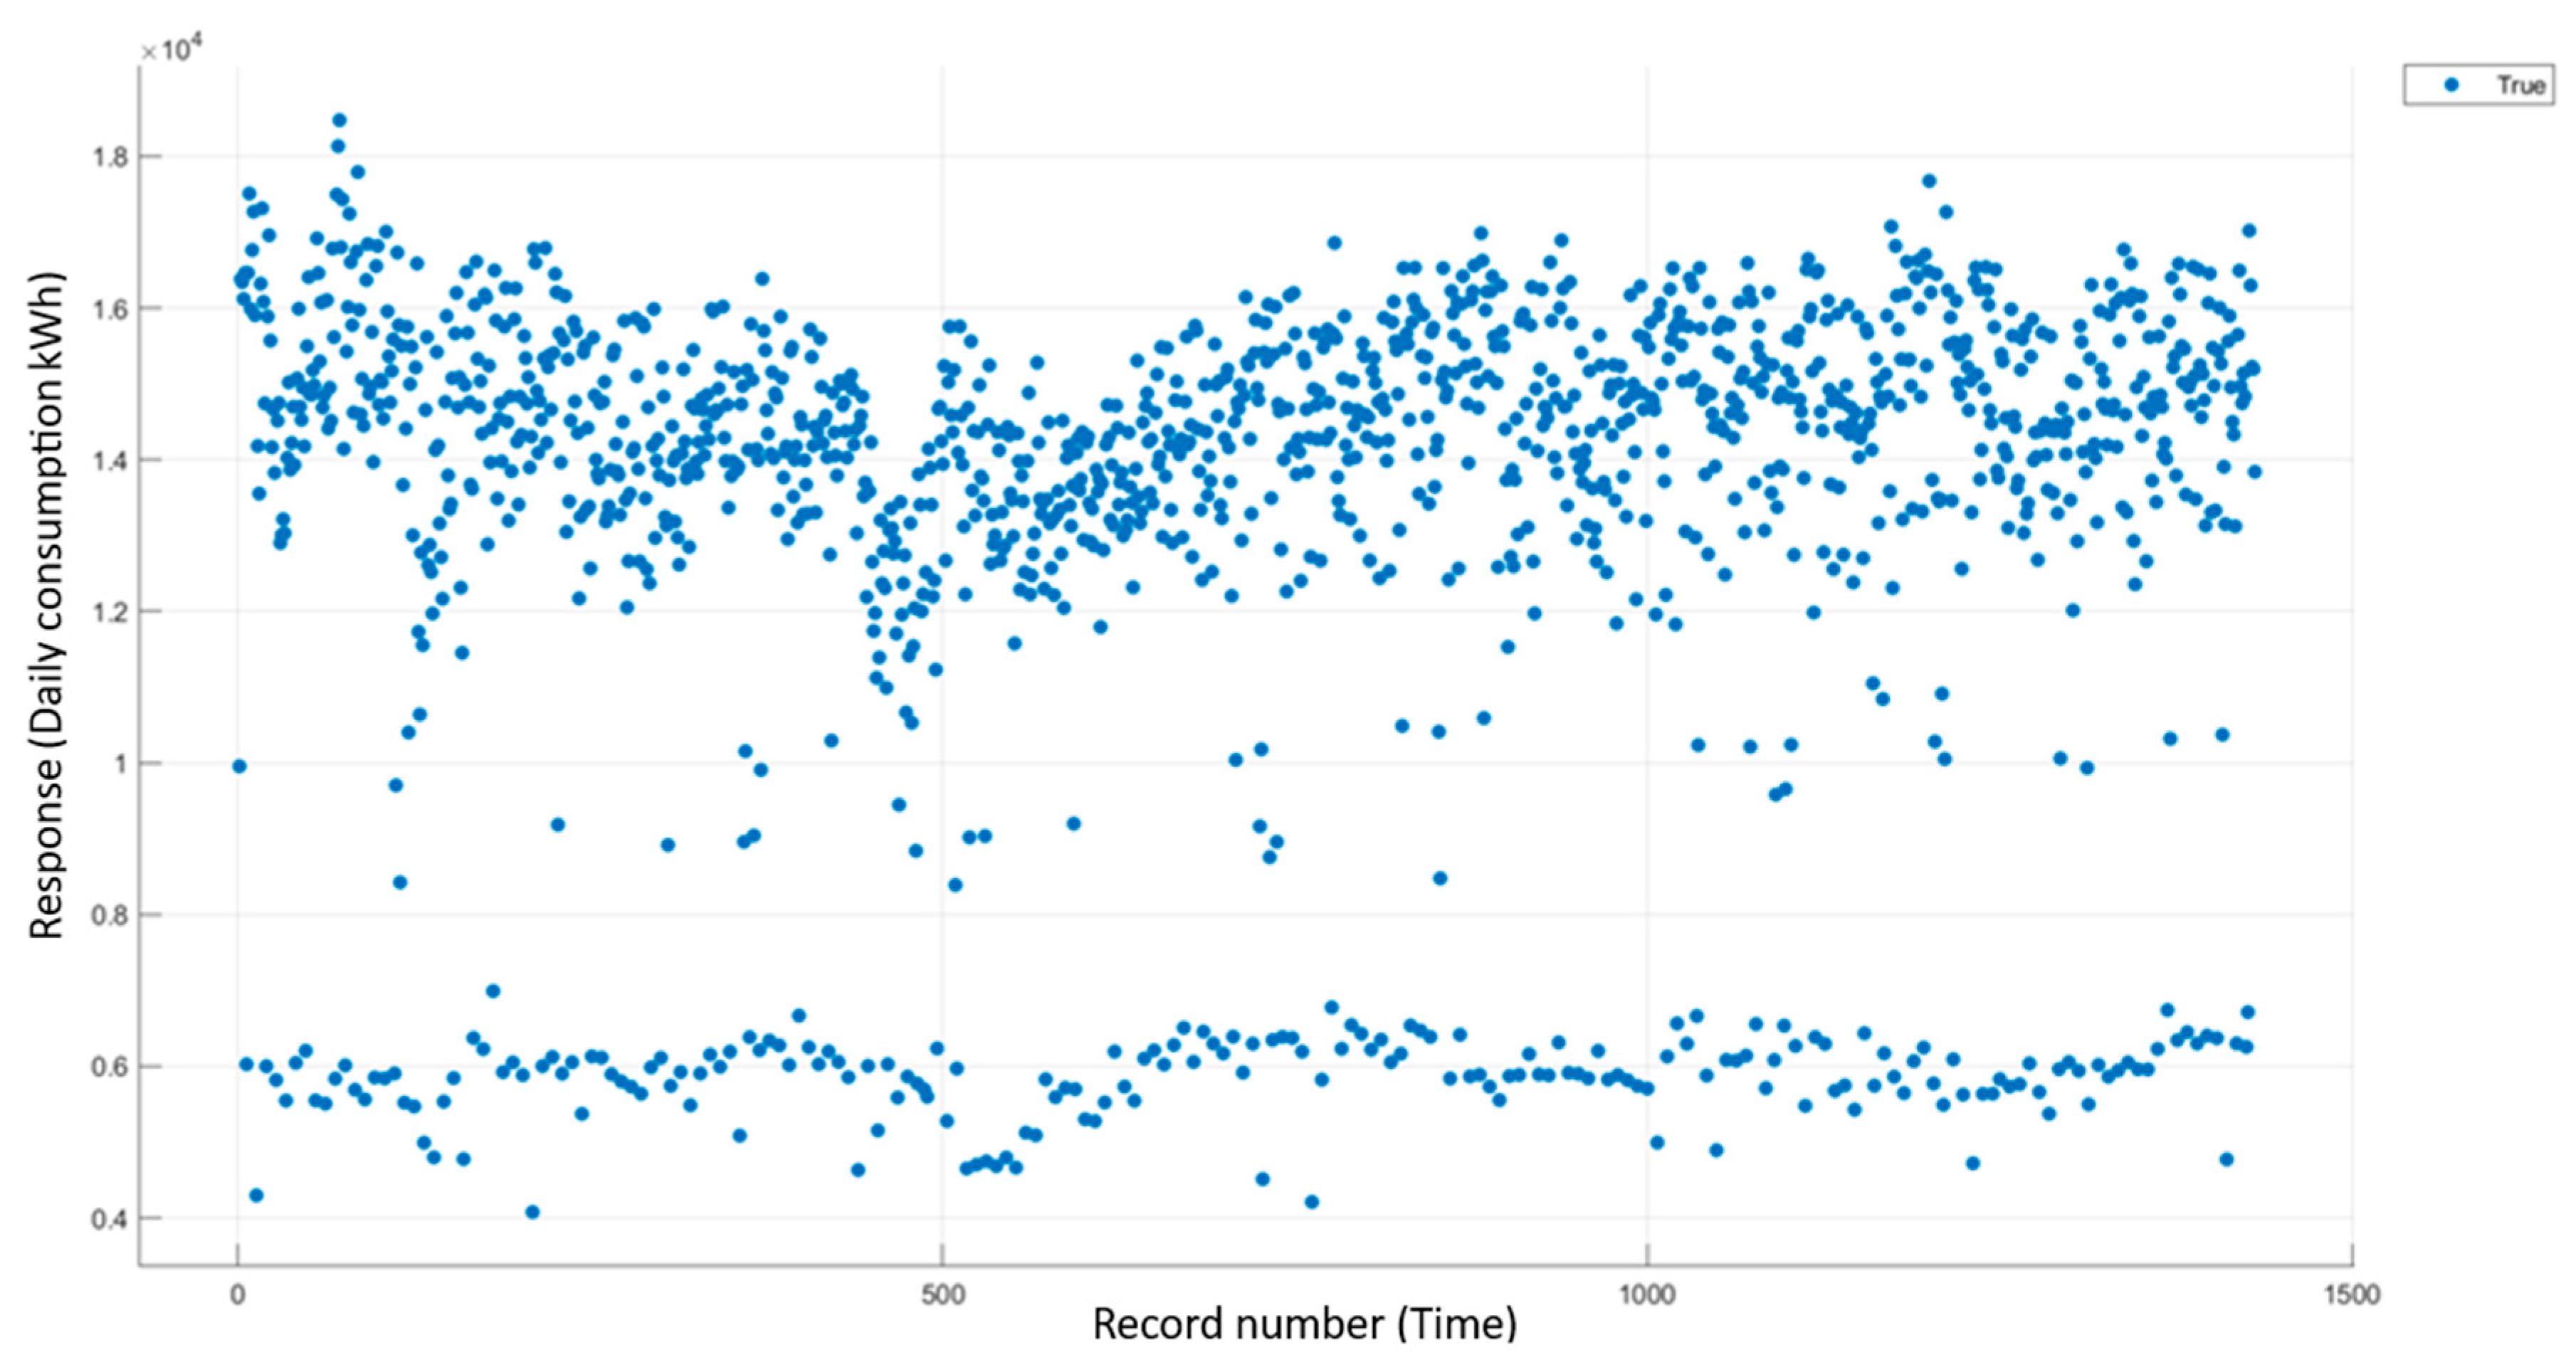
This work uses a large amount of real data, specifically is based on a four-year history with daily granularity, not only of the variable to be predicted, but of each input and output of the system considered.
Figure 3.
Electricity consumption in kWh relative to the entire period. Record number is a time axis with daily granularity.
Figure 3.
Electricity consumption in kWh relative to the entire period. Record number is a time axis with daily granularity.
The study was conducted according to the following procedure:
Preliminary study of the mechanical biological treatment plant starting from the production process and spatial contextualization of the same.
Data acquisition on energy vectors and plant-specific variables, divided into input and output, thanks to which it was possible to recreate the framework of the predictive model;
Realization of the overall database, then subdivided on the basis of the temporal criterion into annual, monthly, and seasonal, obtaining sixty-nine derived databases, for computational reasons and to check for possible emerging trends due to particular factors due to seasonality and the external environment, with specific reference to the years 2019 and 2020, influenced by the pandemic event due to Covid 19.
-
Preliminary data analysis, applied to each of the derived databases, consisting of:
- ∘
Data cleaning: verification of the goodness of the acquired data and possible correction of the data.
- ∘
Dispersion between each input and output variable from the considered system, referred to in the following as predictor variables, and the variable being predicted, i.e., electricity consumption.
- ∘
Linearity test performed for each variable in all databases.
- ∘
Verification of the existence of correlation between the predictor variables and energy consumption by using coefficient R, determination of coefficient t and R2.
- ∘
Cross correlation between power consumption and the input and output variables at the MBT plant.
- ∘
Choice of Machine Learning technique to be used following testing to verify the efficiency of the algorithms made available by MATLAB software.
-
Realization of the predictive model using MATLAB software.
- ∘
In order to make the most of the vast processed database, various supervised machine learning regression techniques were initially investigated, including the artificial neural network (ANN), a supervised regression learning technique having the desired characteristics.
For the sake of brevity, we do not report here the results obtained from these computations in their entirety, but show in the remainder of the paper only those values related to the model realized and identified as significant for the purposes of the study.
2.1. Case study
The present study was carried out based on data pertaining to the mechanical biological waste treatment plant owned by the company Ecologia Viterbo Srl
1, located in central Italy, specifically at Casale Bussi in Viterbo (VT).
The MBT plant, which treats waste arising from the provinces of Viterbo, Rieti and Rome through an external company, has a treatment potential of about 215,000 t/y of municipal solid waste (MSW).
The processes that waste undergoes within the said plant are multiple and are not limited to the treatment of MSW, but also count the production of the stabilized organic fraction (SOF), refuse
derived fuel (RDF) and secondary solid fuel (SSF), metal recovery, and volume reduction of stored waste.
Non-recoverable and processable waste is disposed of in landfills.
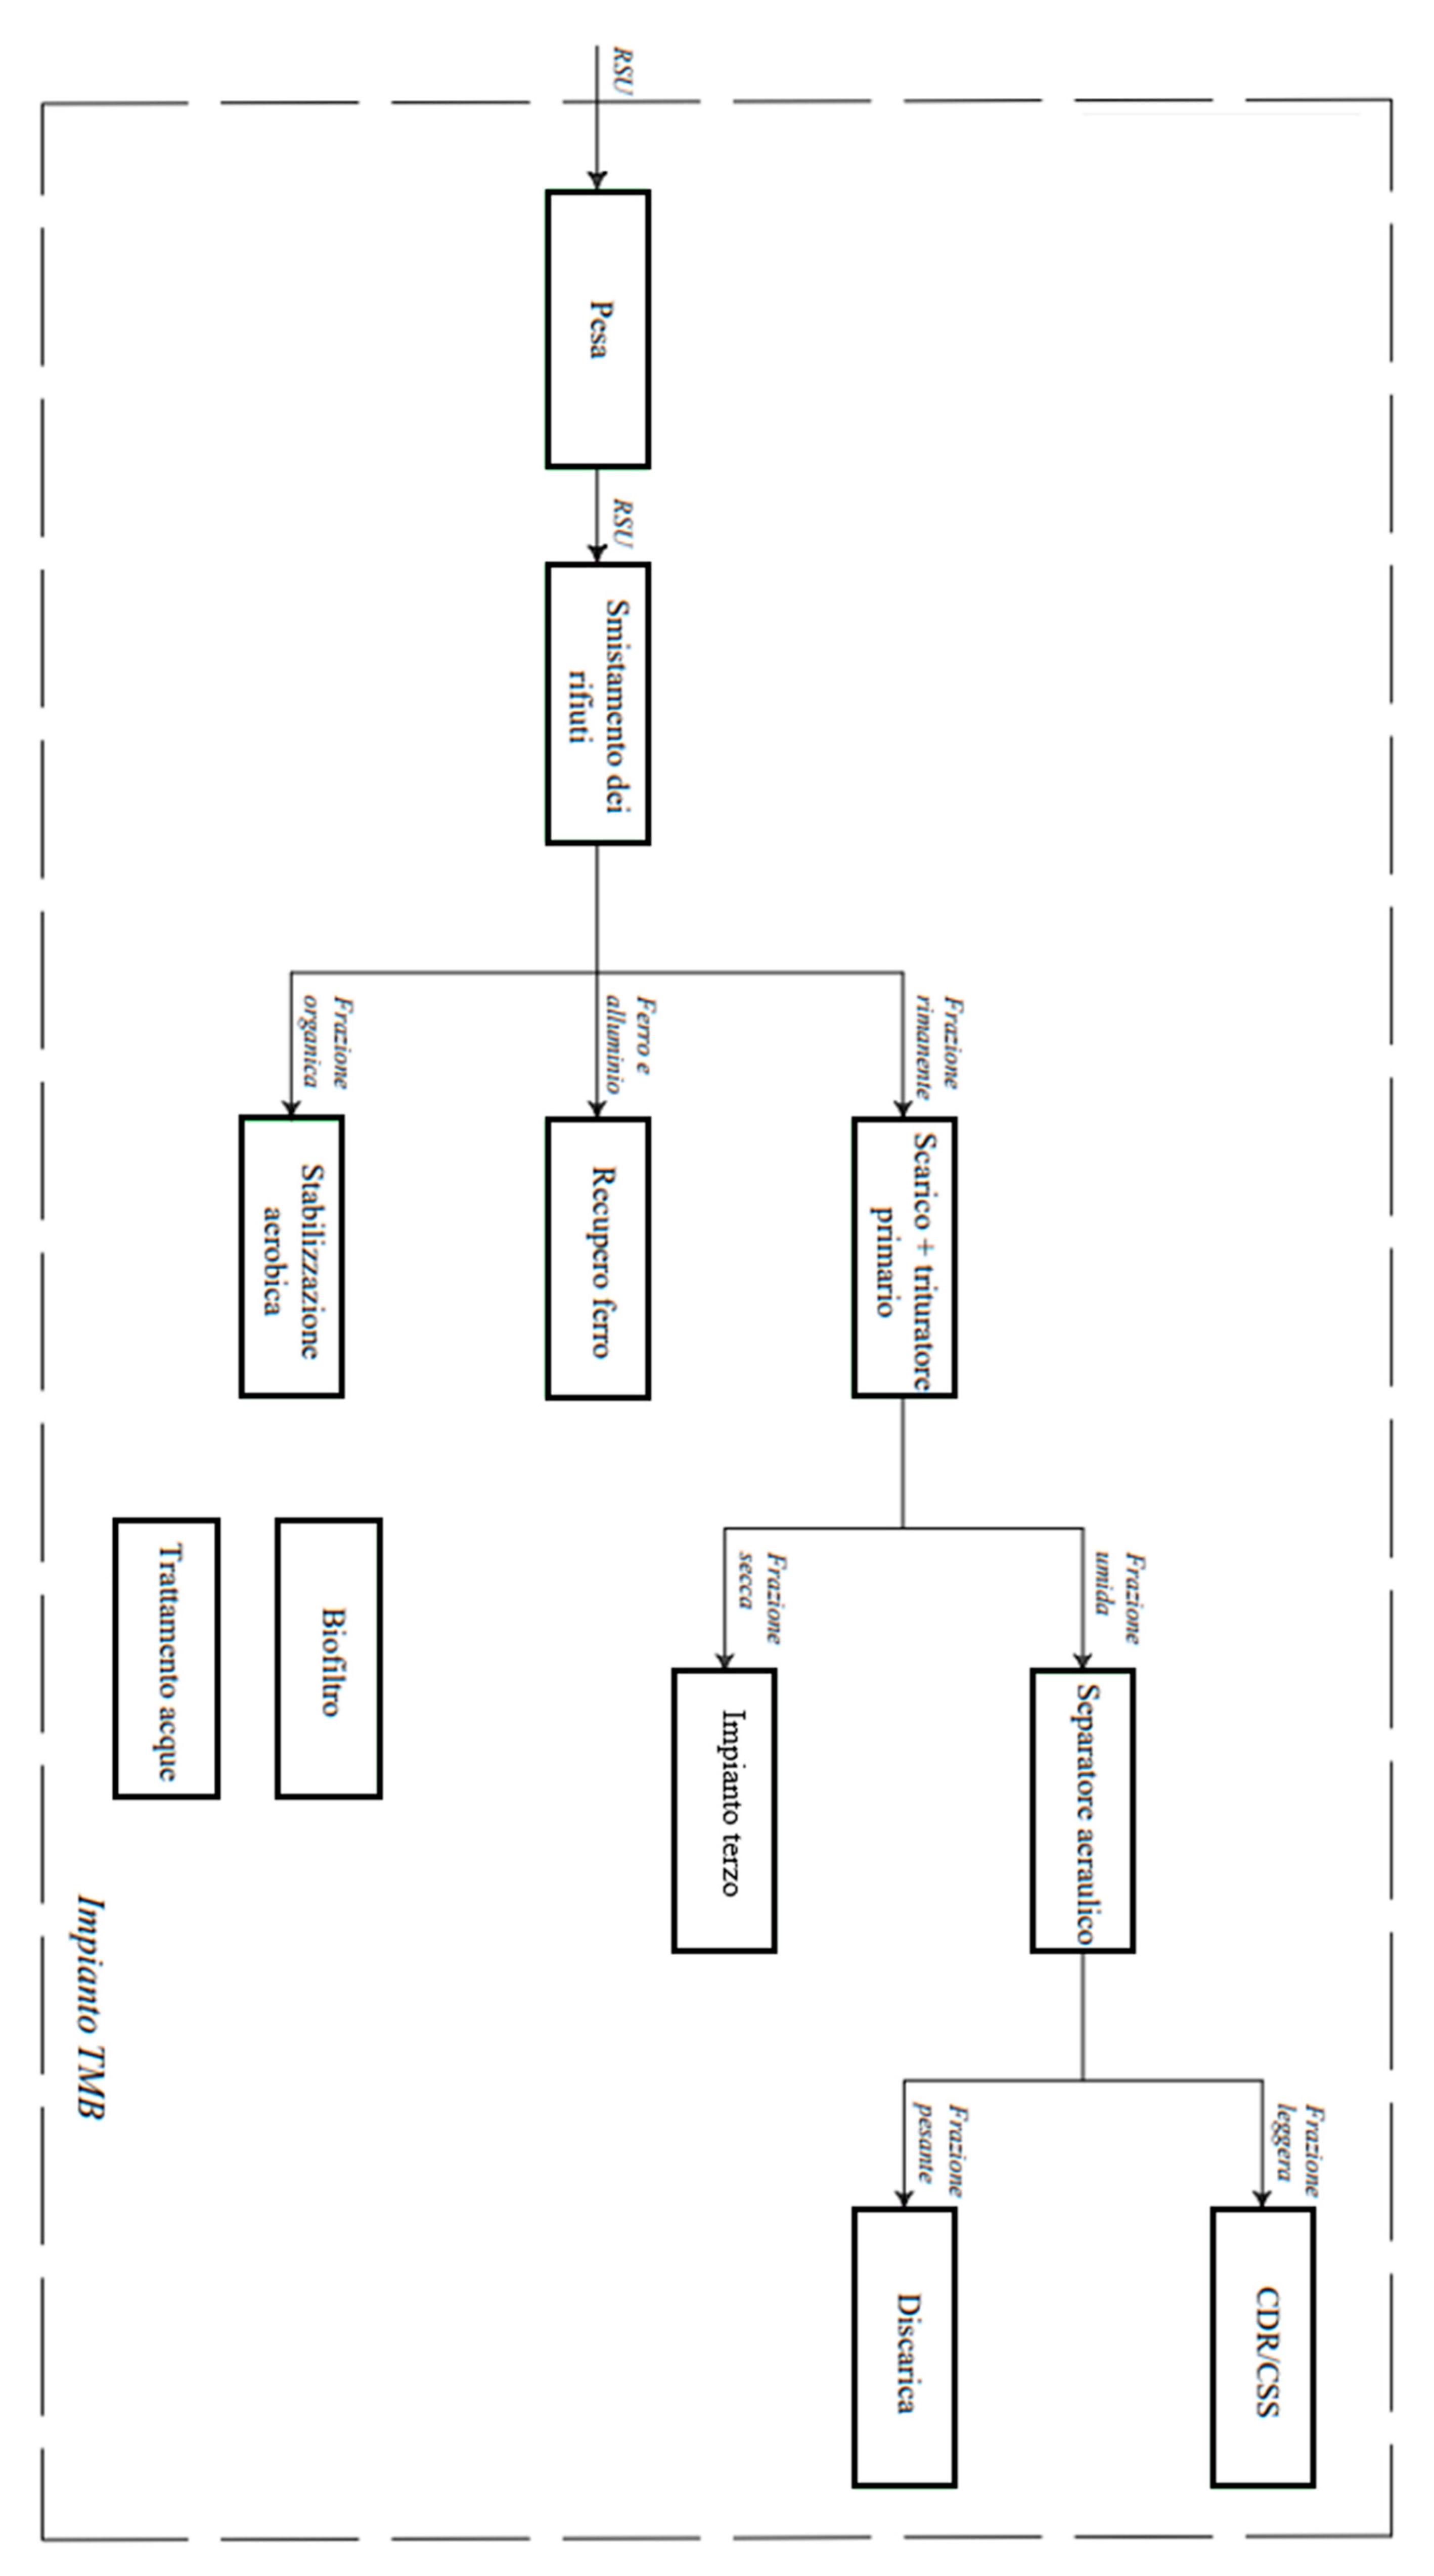
The plant consists of a weighing office, a waste sorting line, a ferrous material recovery line, a RDF/SSF production line, a line for oxidation of the wet fraction from municipal solid waste, a line for refining SOF, and an air treatment line.
The production process diagram of the plant is shown in
Figure 4.
2.2. The technique used to make the model
It is possible to define the powerful tool used in Machine Learning such as Artificial Neural Networks (ANN from English Artificial Neural Network) as a computational model inspired by the complex interconnected network of neurons present in the human brain. Such a model is aimed at simulating the relationships between inputs and outputs that can hardly be reproduced by other analytical functions.
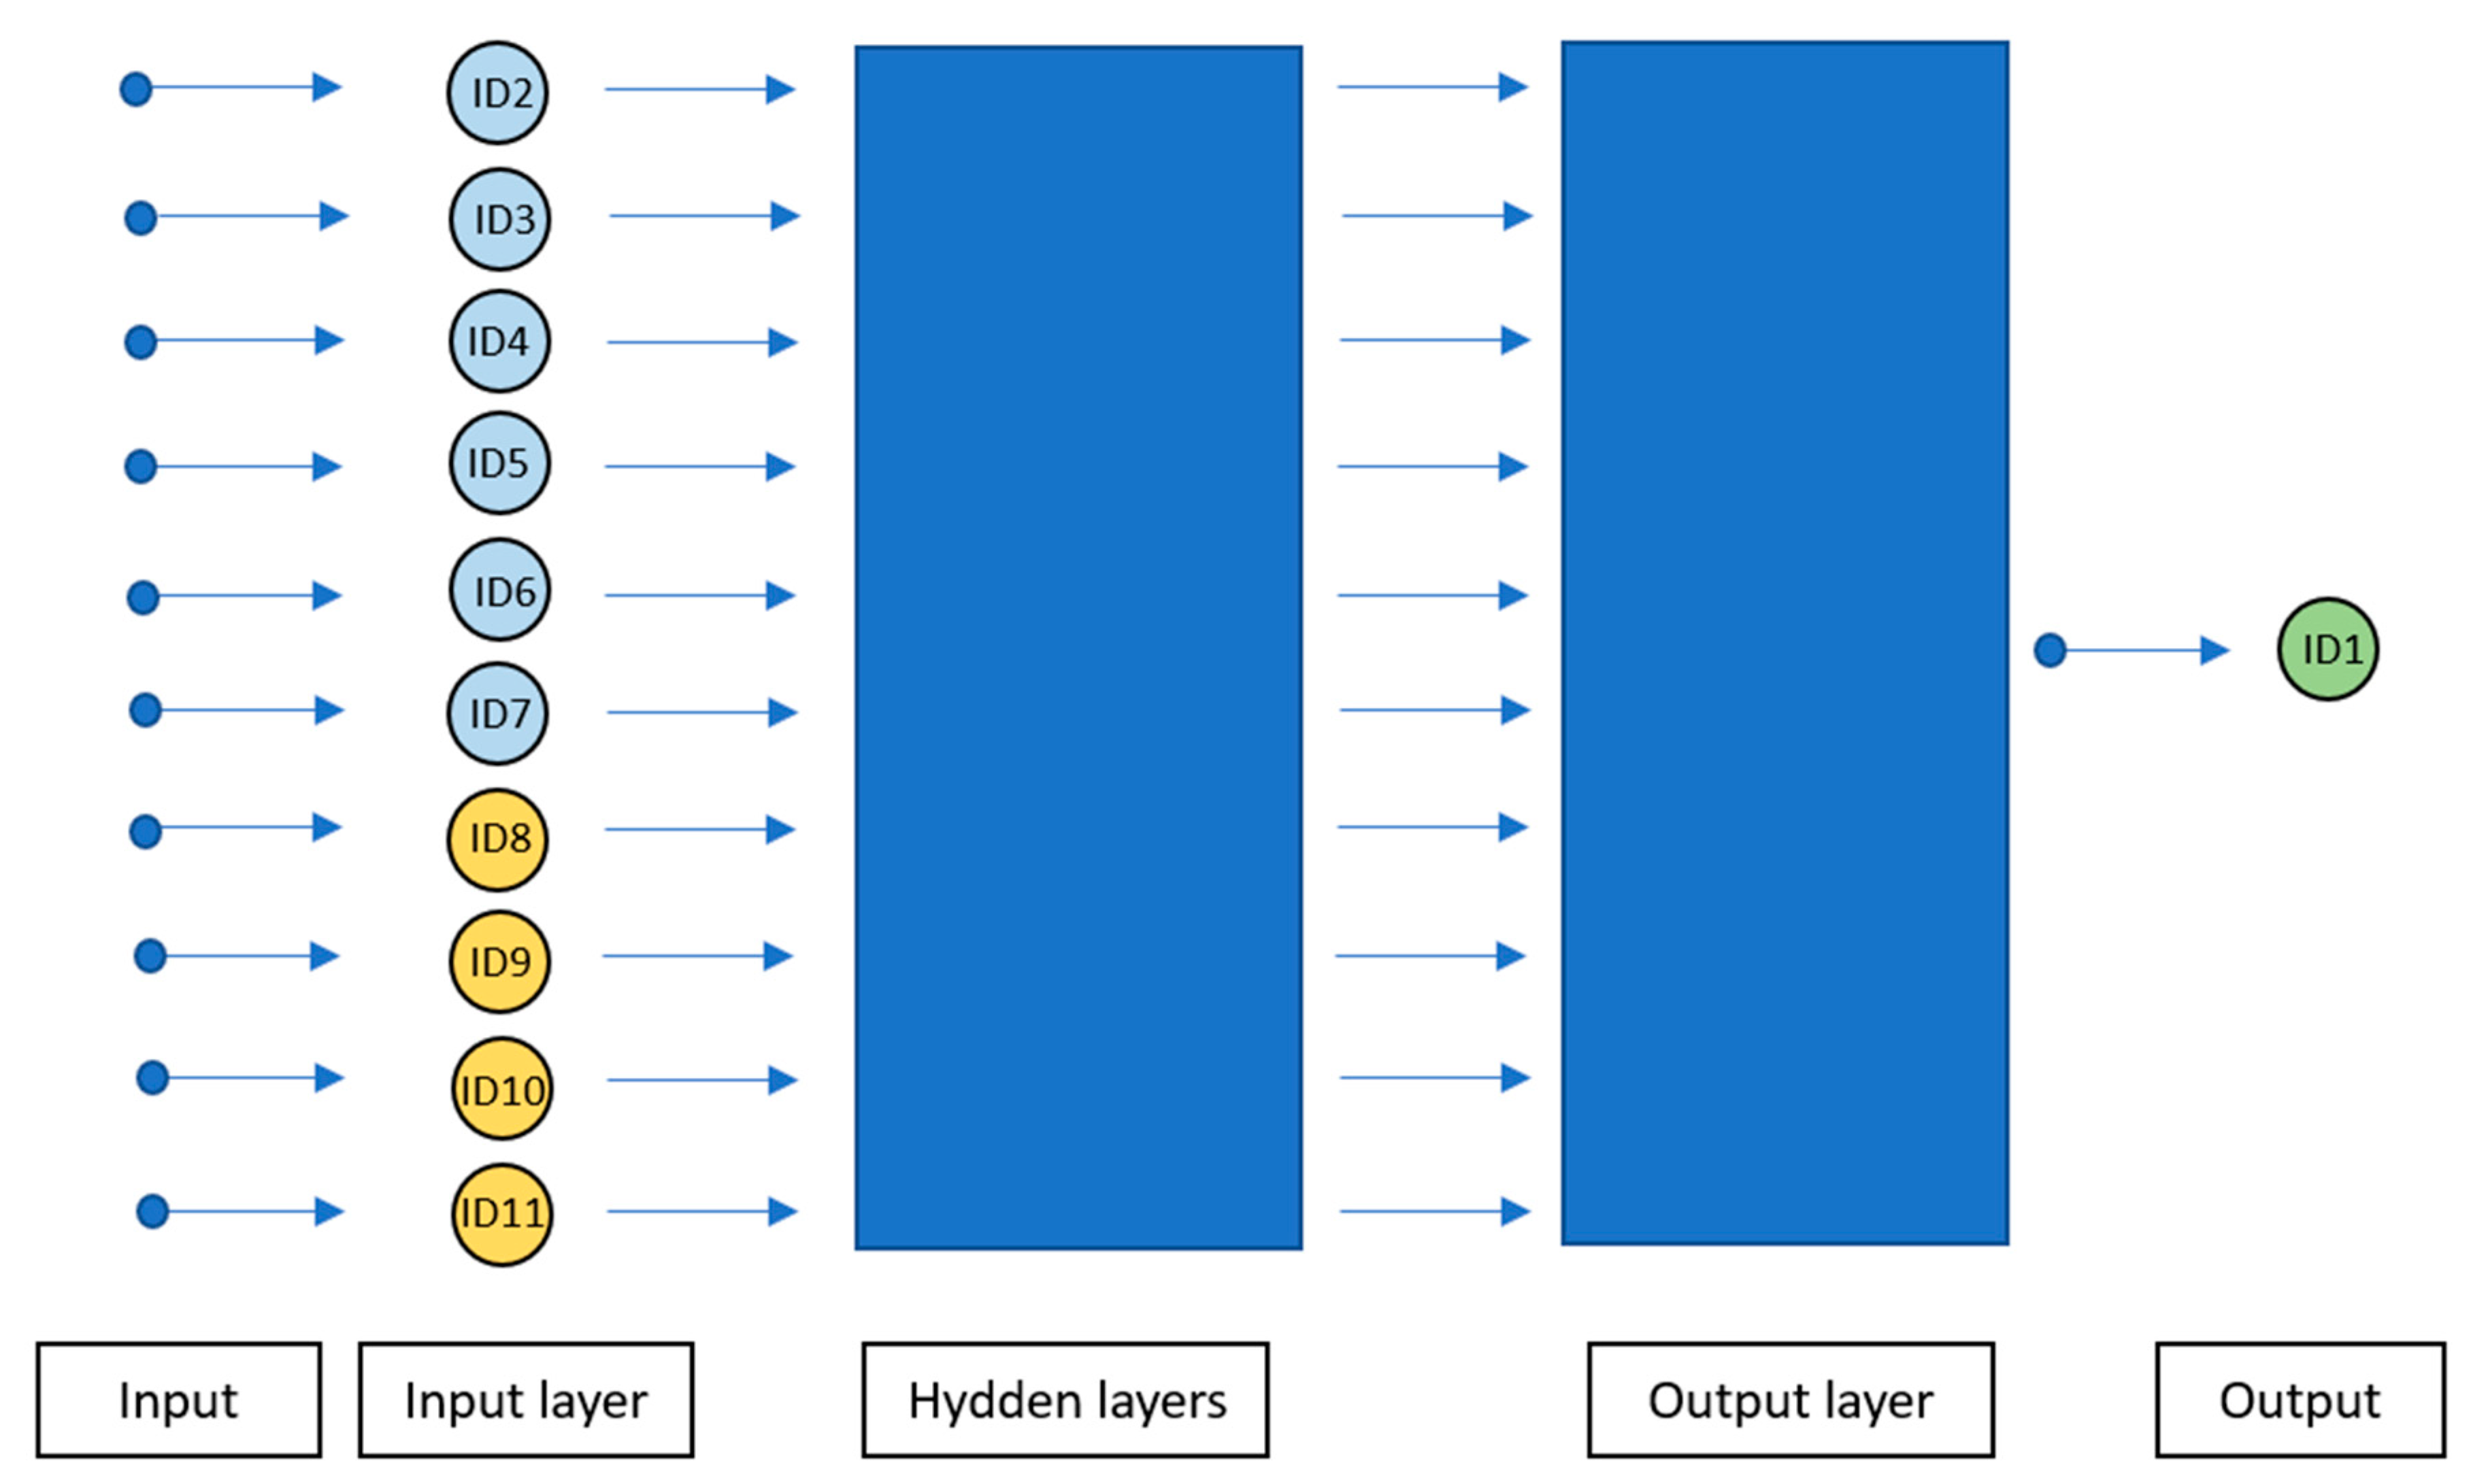
ANNs are particularly versatile in that they can be used both in supervised learning techniques aimed at classification and regression applications and in unsupervised learning techniques aimed at clustering applications. A schematization of the ANN implemented is proposed below (
Figure 5).
It is worth noting that within the input layer, both the inputs and outputs of the MBT plant fall as predictor variables.
3. Results and discussion
Prediction model
The analyzed data refer to a time interval of four years, that is between 01/01/2019 and 31/12/2022. The data relating to the predictive variables have been acquired through specific field instrumentation, while the data relating to the consumption of electricity are collected both through special dataloggers and through the plant meter. The electrical data provided by the energy distributor were used to conduct this study.
In the
Table 2 below it is brought back a useful overview of the data, in which the inputs are differentiated from the outputs of the plant, is assigned to every variable an ID, then resumed in
Figure 6 and the types of data come defined.
For the proper realization of the predictive model of electricity consumption (ID 1), we started from the conceptual schematization below, from which it can be seen that there are a total of ten predictor variables in the studied system, consisting of the six plant input variables (ID2, ID3, ID4, ID5, ID6, ID7) and the four output variables (ID8, ID9, ID10, ID11).
For greater clarity,
Figure 6 shows the conceptual scheme of the establishment, useful for the construction of the model.
The study conducted counts the following simplifications:
Outgoing waste at the MBT plant was neglected;
The daily data database created does not include the month of June 2022, due to an electrical data gap;
Data from the pandemic period were also considered because the plant's activity did not change dramatically;
The choice was made to build the model based on data for the entire 2019-2022 period, as the study of the data pertaining to the sub-databases created did not reveal consumption trends related to seasonal or monthly factors that would justify building different models to be used in combination.
The main parameters set to realize the model are:
choice of Gradient Descend as the computational algorithm implemented within the neural network;
learning rate setting equal to 1e-10;
minimum threshold of hls equal to 10 and maximum threshold equal to 80;
minimum threshold of epochs equal to 25000 and maximum threshold equal to 100000;
70% of the database was allocated to the training set, 15% to the test set and again 15% to the validation set;
As a limit for considering the result acceptable, a value of the correlation coefficient R greater than or equal to 0.95 is sought for each set.
The above parameters are the result of several iterations useful for achieving the desired result. Among the most significant changes, it should be noted that initially the thresholds of minimum and maximum periods were set respectively of 50000 and 200000, then reduced to those indicated above due to computational problems.
The model summary in
Table 3 contains information about the calculation algorithm and introduces the results obtained.
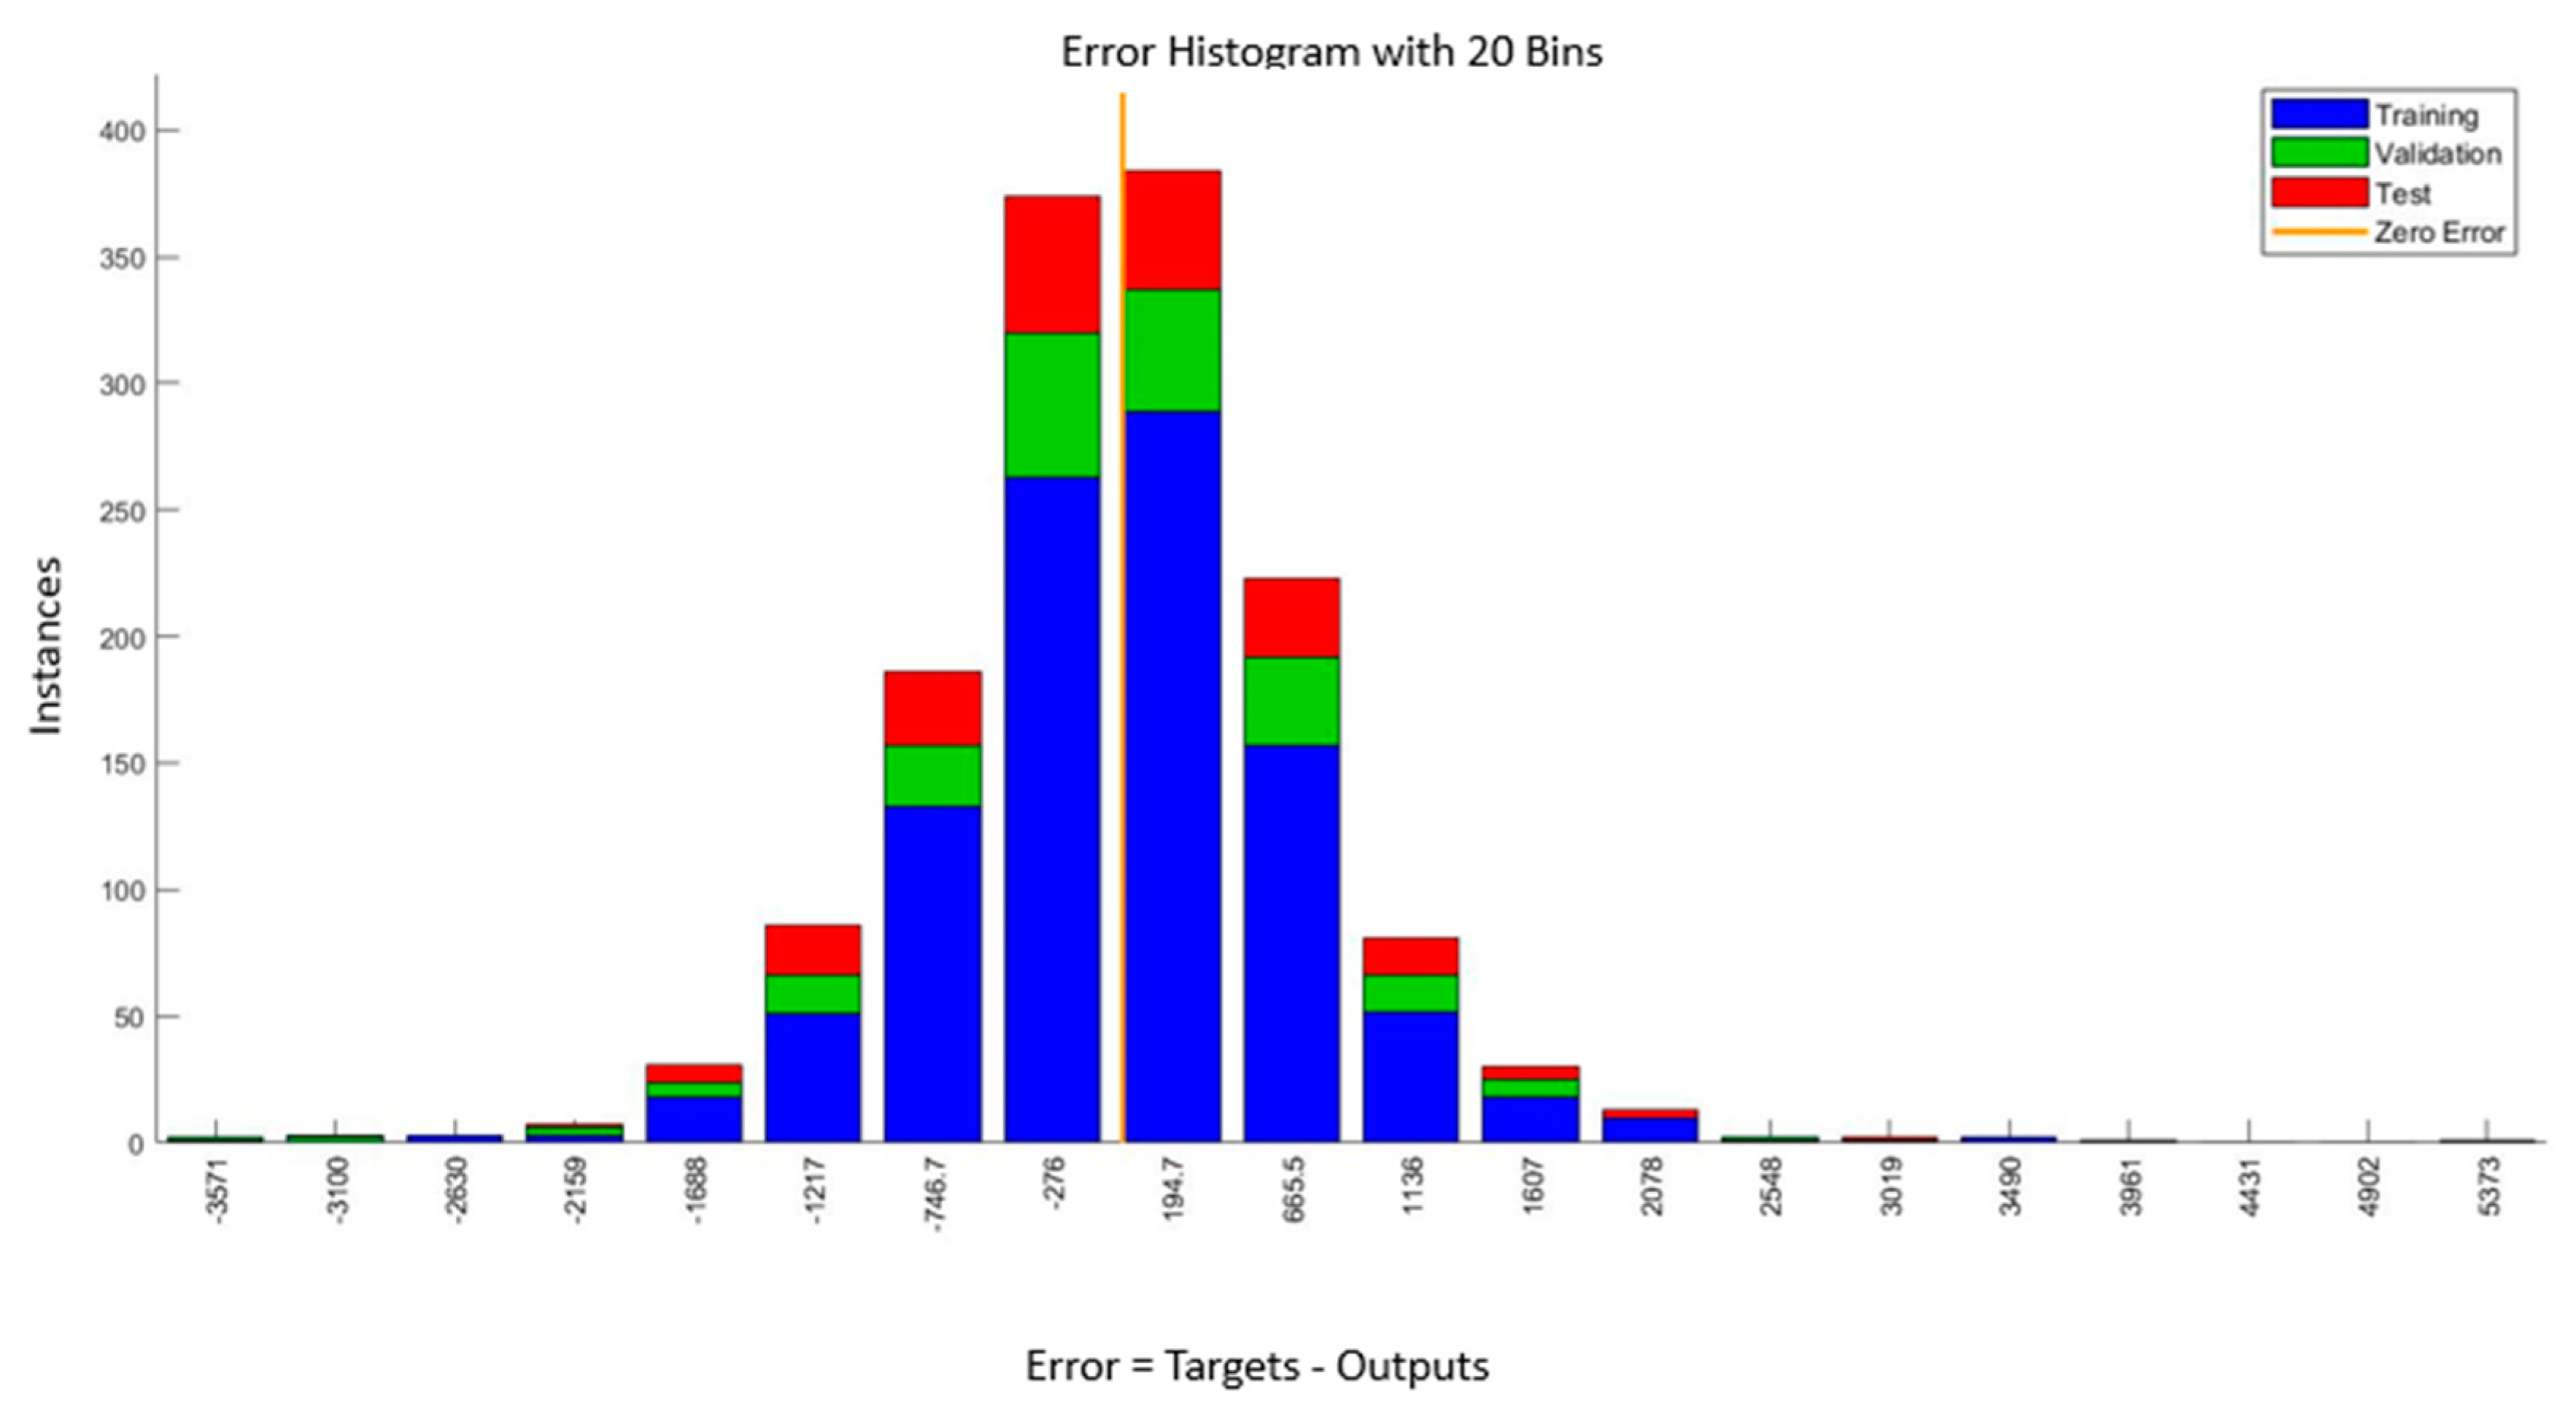
The histogram present in
Figure 7 is particularly useful in the evaluation of the model as it shows, if it exists, the presence of anomalous values. The result of the artificial neural network generated a perfect Gaussian distribution, in which the anomalous values are negligible.
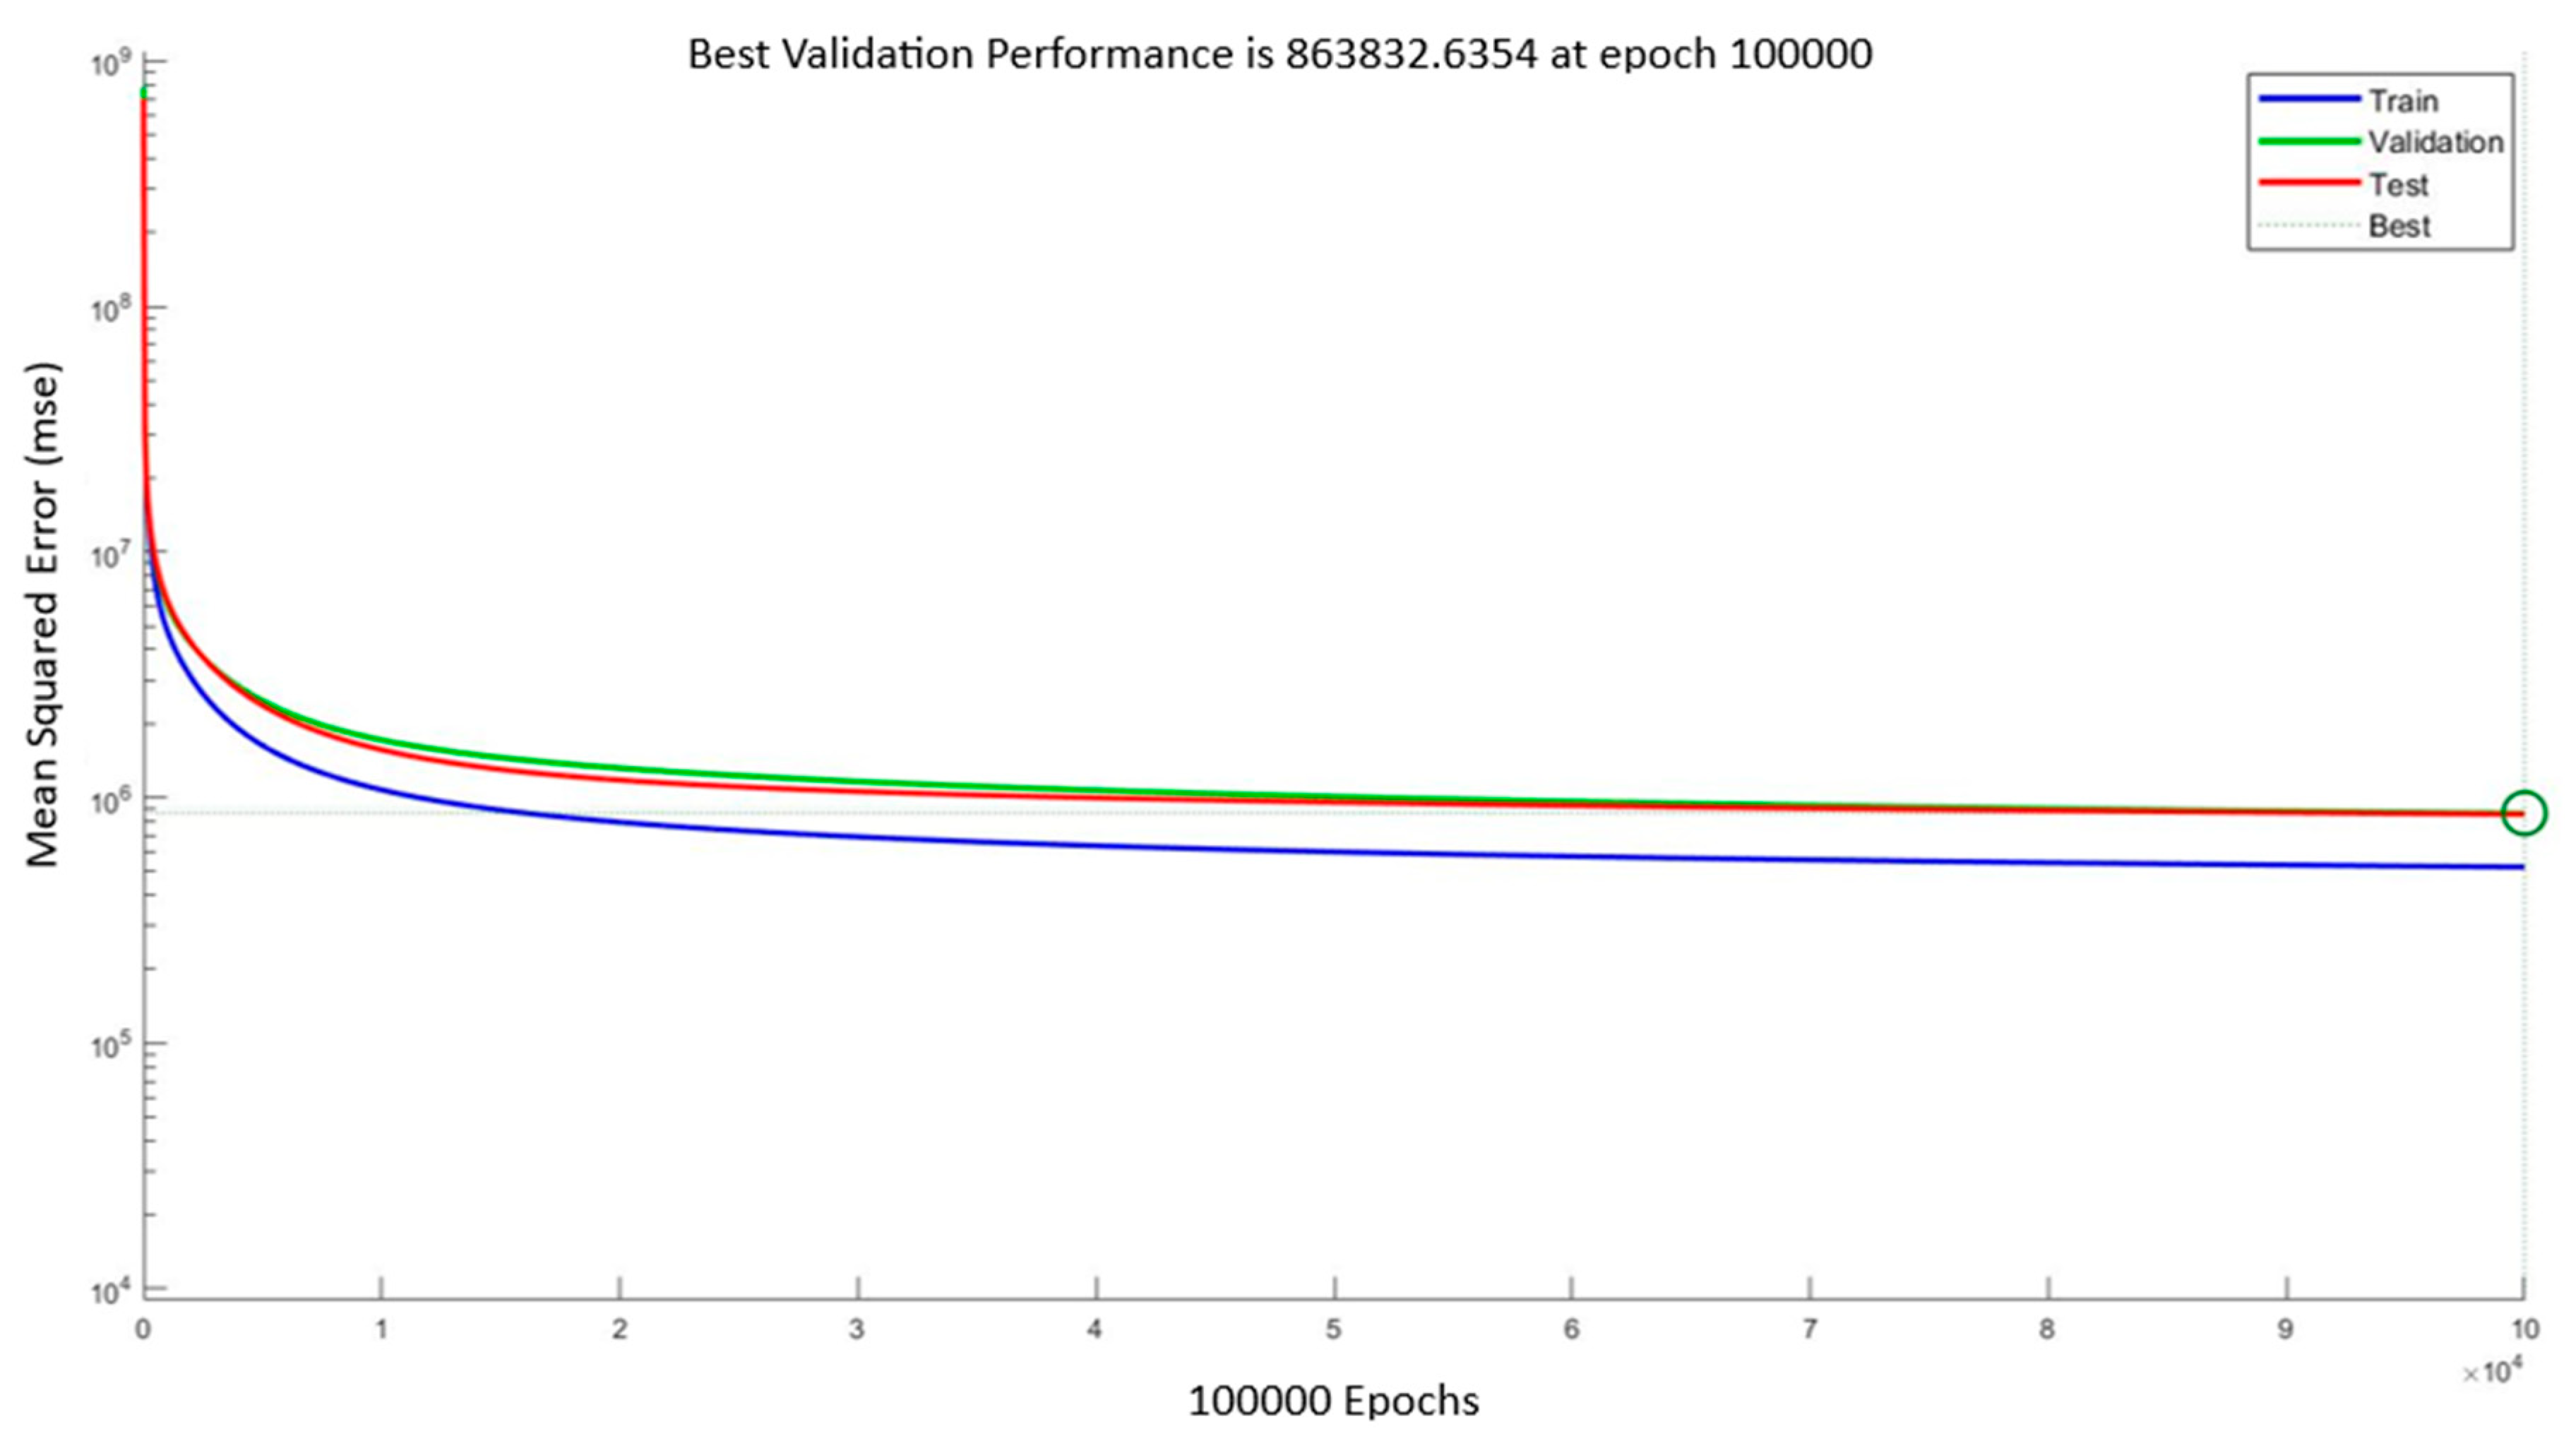
The trend of the curves shown in
Figure 8 indicates the performance of the model, evaluated through the parameter mse; as regards this analysis it can be said that the result obtained is reasonable because, although the value mse is not particularly small, the test set error and the validation set error are comparable; moreover, no data overfitting phenomenon occurred during the training period.
Table 4 shows the statistical parameters of the set.
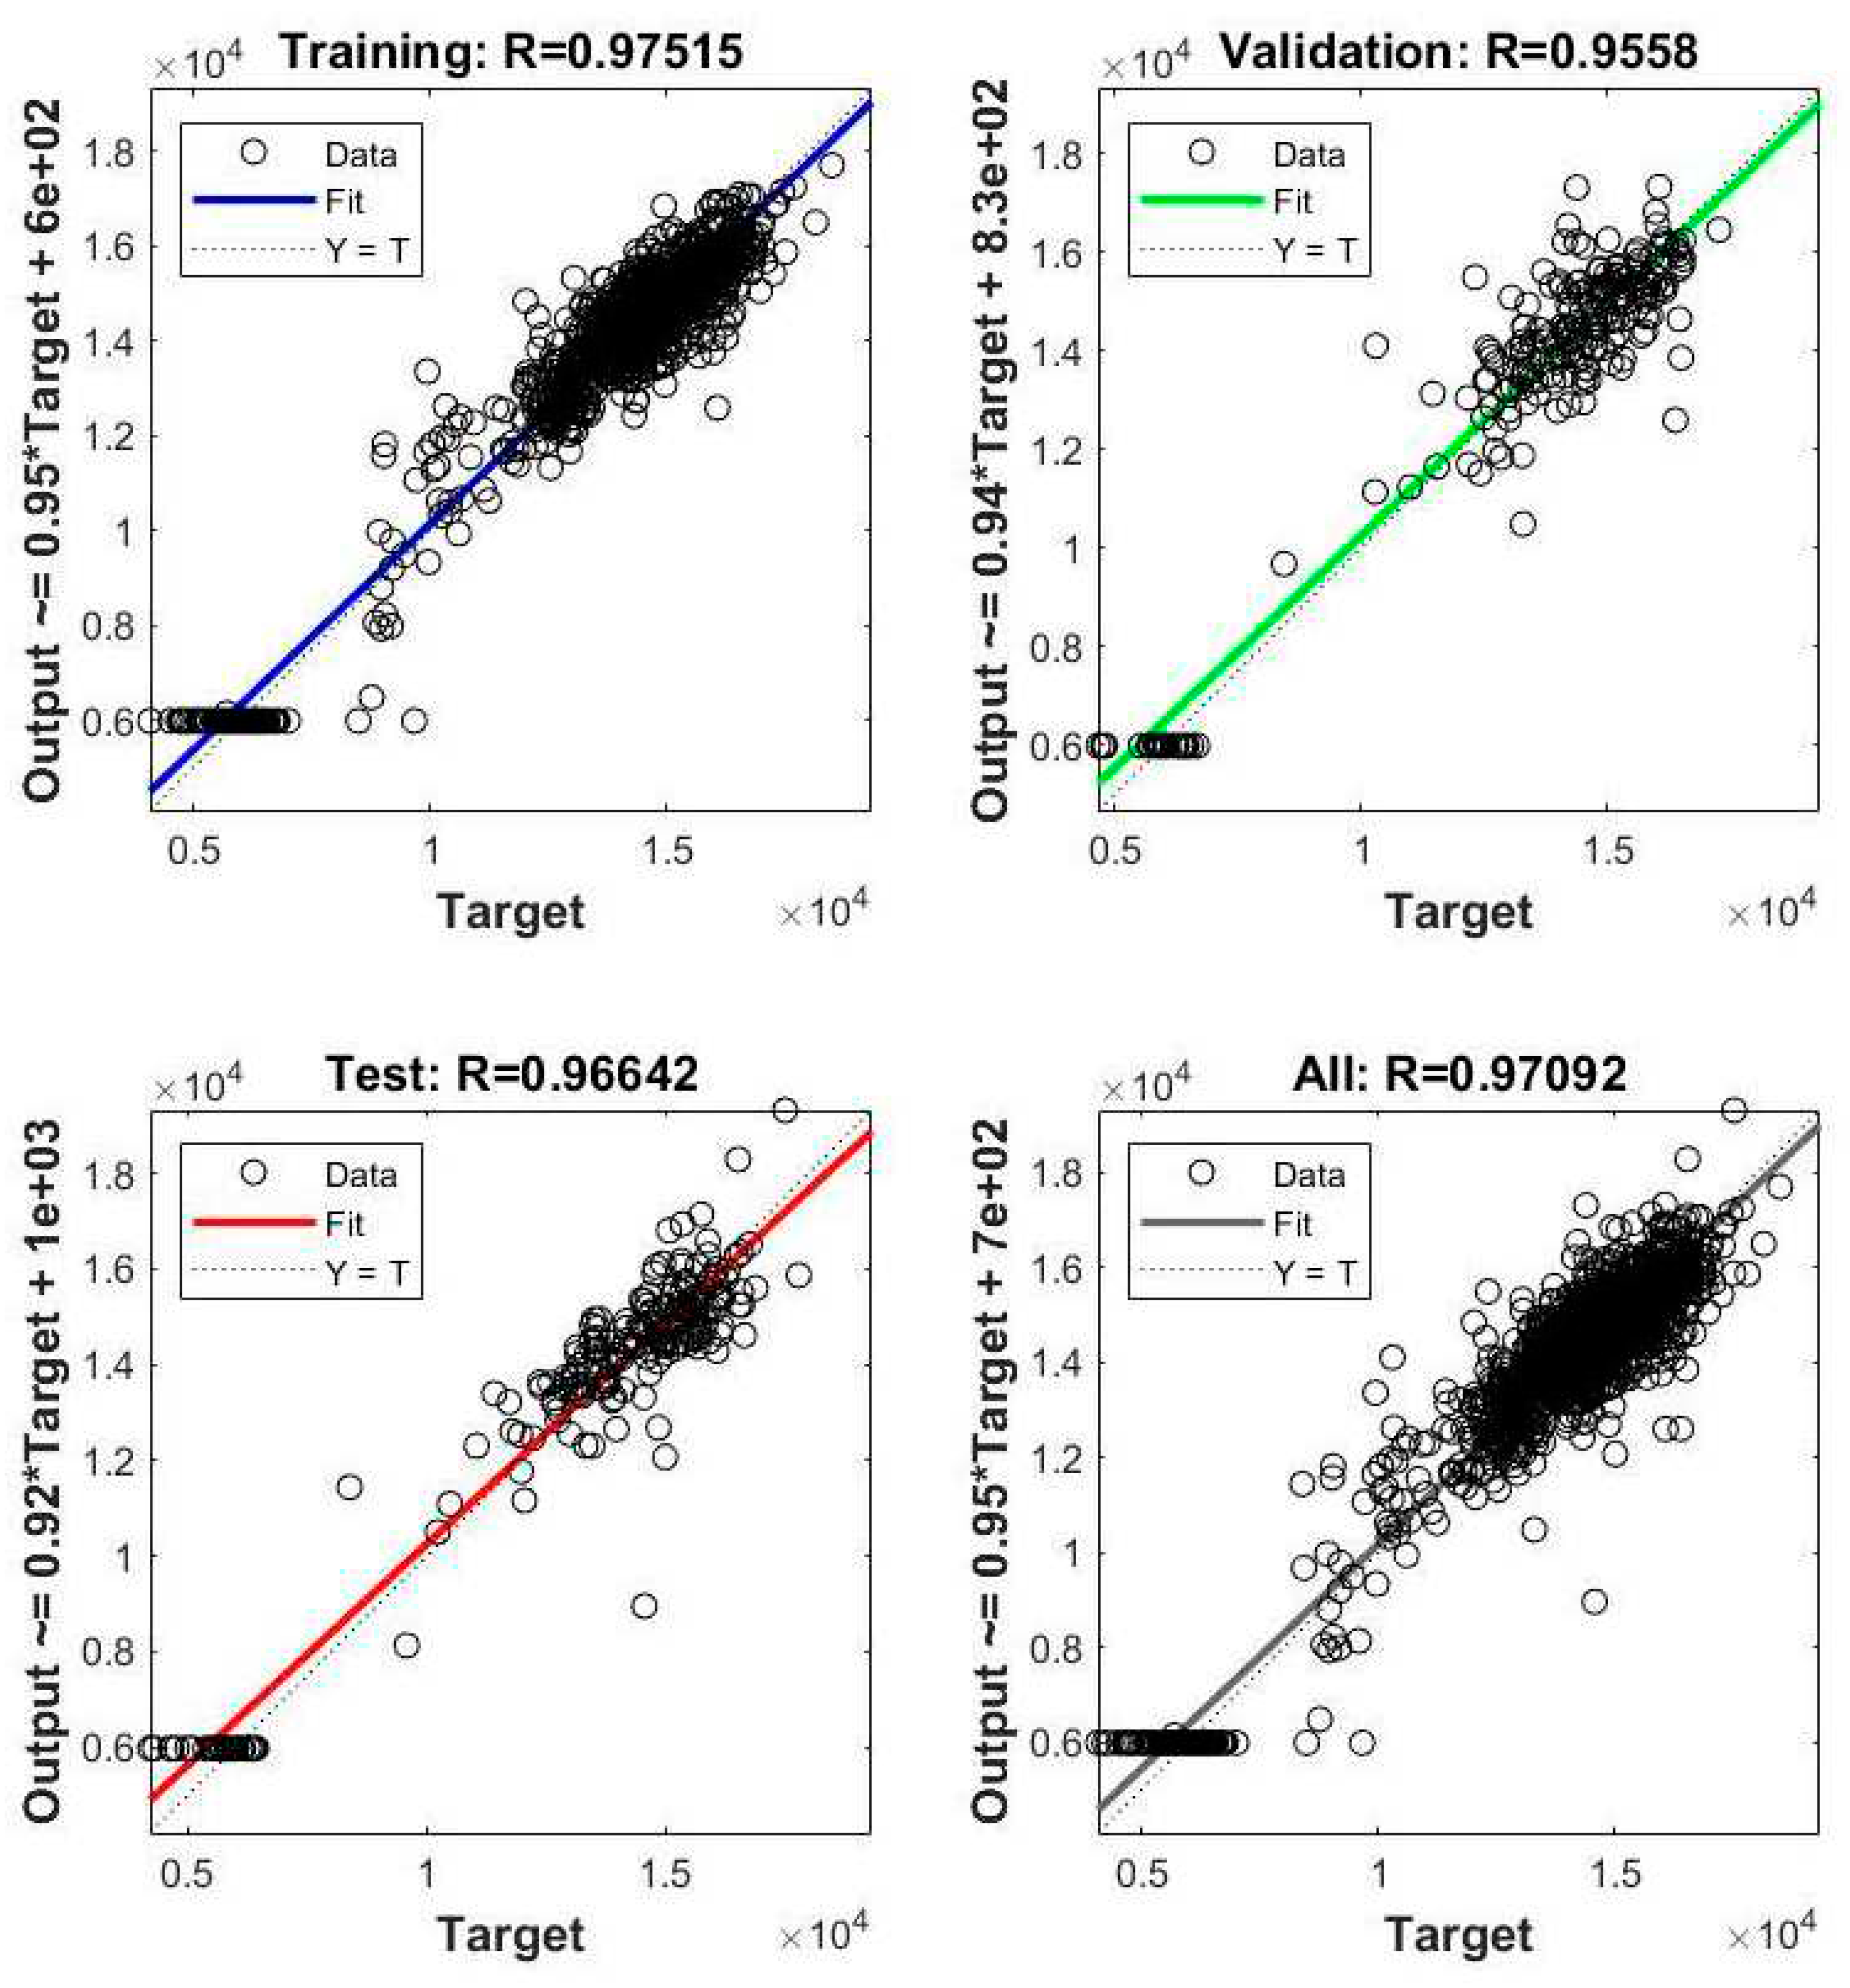
The correlation graphs shown in
Figure 9, differentiated for the training set, for the test set, for the validation set and for the set all, the latter consisting of the union of the above-mentioned sets, are the most important descriptors of the goodness of the model realized. The graphs relate the values of the data predicted by the artificial neural network built, identified in the outputs, compared to the responses, that is the monitored values, called in figure as "target". As it is possible to observe, in every case represented study there is an optimal fit of the forecast regarding the answers of the sets.
Thanks to the coefficient R, we obtain a measure of the correlation between the input of the model, constituted by the actual electricity consumption of the MBT plant, and the output of the same, realized starting from the values of the predictive variables.
As can be seen, the value of the coefficient R obtained for each set meets the exclusion criteria initially set for the validation of the model, namely R ≥ 0.95 for each set. This confirms the expected result of the existence of a strong positive correlation between variables (target and output).
A further consideration can be deduced through the study of the coefficient of determination R
2 reported in
Table 5; a percentage of consumption greater than 90 % can be explained through the predictive variables for each set.
Assuming a plant shutdown, therefore considering the cases in which the predictive variables are absent, there is still a share of electricity consumption, albeit very low.
This is also an expected result because the prediction of the value of the consumption of electricity comes from the variables in input and output to the TMB plant, while the data relating to the consumption of electricity used are those from distributor, therefore the latter take into account a share of electricity consumption attributable to the lighting of the building and the consumption of offices, which, although marginal, cannot be taken into account by the predictive variables.
In the graphs of
Figure 9 is always present a series of points arranged parallel to the x axis attributable to public holidays. This consumption is associated with plant lighting and biofilter (see
Figure 3).
By re-training the network, it would still be possible to achieve a better level of data fitting.
4. Conclusions
This work supports the achievement of the objectives introduced by Agenda 2030, meeting goals number 7, 12 and 13, called " affordable and clean energy", "responsible consumption and production" and "climate action" thanks to the many possible future uses of the predictive consumption model of a biological mechanical waste treatment plant realized.
The result of this work is satisfactory with respect to the goal set, as it has been achieved, through techniques of Artificial Intelligence (AI)a predictive model of electrical consumption associated with a real mechanical biological treatment plant for waste treatment located in central Italy, characterized by an accuracy of prediction deemed sufficient for the purposes of the elaborated (R ≥ 0.95).
As anticipated, with the help of this model, combined with subsequent simulations in which you act intelligently on predictive variables, you can go to identify corrective actions aimed at a responsible use of energy.
The model can be used as a baseline of plant consumption, useful for the implementation of strategic maneuvers aimed at energy and economic savings by the property.
This result is intended to be a starting point for subsequent applications of the model made, with the necessary adjustments, on other real plants, not only waste treatment, but also of different nature, to broaden research on applications of Artificial Intelligence on industrial plants and to stimulate energy efficiency actions and the achievement of decarbonisation objectives.
Table 6.
list of acronyms.
Table 6.
list of acronyms.
| Acronyms |
Extended form |
| AI |
Artificial intelligence |
| ANN |
Artificial Neural Network |
| FFR |
Fuel from waste |
| SSF |
Secondary solid fuel |
| SOF |
Stabilized Organic Fraction |
| MBT |
Mechanical Biological Treatment |
| PC |
Special waste |
| GND |
Green New Deal |
| MSW |
Municipal Solid Waste |
| SW |
Special waste |
Notes
| 1 |
For the use of the data and for the citation a special consent has been issued by the Property. |
Acknowledgments
Support by BIOSOIL IMPROVERS.
References
- Ambientale, I. -I. (2023, 04 21). ISPRA - Istituto Superiore per la Protezione e la Ricerca Ambientale. Tratto da ISPRA - Istituto Superiore per la Protezione e la Ricerca Ambientale: https://www.catasto-rifiuti.isprambiente.it/index.php?pg=gestregione&aa=2021®id=2&areaid=Centro&mappa=0&width=1536&height=864&advice=si.
- Babul Hossain, M. S. (2020). Climate change induced extreme flood disaster in Bangladesh: Implications on people's livelihoods in the Char Village and their coping mechanisms. Elsevier.
- commission.europa.eu. (2023, 04 26). commission.europa.eu. Tratto da commission.europa.eu: https://commission.europa.eu/strategy-and-policy/priorities-2019-2024/european-green-deal/repowereu-affordable-secure-and-sustainable-energy-europe_it#energia-pulita.
- commission.europa.eu. (2023, 04 26). commission.europa.eu. Tratto da commission.europa.eu: https://commission.europa.eu/strategy-and-policy/priorities-2019-2024/european-green-deal_it.
- consilium.europa.eu. (2023, 04 26). consilium.europa.eu. Tratto da consilium.europa.eu: https://www.consilium.europa.eu/it/policies/green-deal/fit-for-55-the-eu-plan-for-a-green-transition/.
- consilium.europa.eu. (2023, 04 26). consilium.europa.eu. Tratto da consilium.europa.eu: https://www.consilium.europa.eu/it/policies/climate-change/paris-agreement/timeline-paris-agreement/.
- Daoping Wang, D. G. (2020). Economic footprint of California wildfires in 2018. Nature sustainability.
- Gerardo Benito, Y. S.-M. (2020). Extreme Floods in Small Mediterranean Catchments: Long-Term Response to Climate Variability and Change. water.
- Jon E. Keeley, A. D. (2021). Large California wildfires: 2020 fires in historical context. Fire Ecology.
- KINCER, J. B. (1933). IS OUR CLIMATE CHANGING? A STUDY OF LONG-TIME TEMPERATURE TRENDS. MONTHLY WEATHER REVIEW.
- M. Chiarle, C. V. (2022, 04 26). Large glacier failures in the italian Alps. Geografia fisica e dinamica quaternaria. Tratto da lescienze.it: https://www.lescienze.it/news/2023/04/14/news/crollo_ghiacciaio_marmolada-11827925/.
- next-generation-eu. (2023, 04 26). next-generation-eu. Tratto da next-generation-eu: https://next-generation-eu.europa.eu/index_en.
- Territoriale, A. p. (2023, 04 26). Agenzia per la Coesione Territoriale. Tratto da Agenzia per la Coesione Territoriale: https://www.agenziacoesione.gov.it/comunicazione/agenda-2030-per-lo-sviluppo-sostenibile/.
|
Disclaimer/Publisher’s Note: The statements, opinions and data contained in all publications are solely those of the individual author(s) and contributor(s) and not of MDPI and/or the editor(s). MDPI and/or the editor(s) disclaim responsibility for any injury to people or property resulting from any ideas, methods, instructions or products referred to in the content. |
© 2023 by the authors. Licensee MDPI, Basel, Switzerland. This article is an open access article distributed under the terms and conditions of the Creative Commons Attribution (CC BY) license (http://creativecommons.org/licenses/by/4.0/).
