Introduction
The World Health Organization has reported Glioblastoma (GB) to be one of the most malignant tumors of the central nervous system. Glioblastoma are classified as grade IV tumors and account for more than 90% 5-year mortality [
1]. Based on genetics and histopathological parameters gliomas can be classified into four grades, the low-grade gliomas are the astrocytomas and oligodendrogliomas whereas the astrocytomas or glioblastoma (GBM) are the high-grade tumors [
2]. GBM, has been reported to impact males greater than females, and is more common in older individuals above the age of 45[
3]. GBMs late onset, tumor location as well as poor understanding of its pathophysiology limit its treatment options. The present standard of care for newly diagnosed GBM adult patients includes radiotherapy plus concomitant and adjuvant temozolomide (TMZ) chemotherapy [
4]. Studies have reported patients displaying O-6-methylguanine-DNA methyltransferase (MGMT) gene promoter methylation exhibit better response to therapy [
5]. The advancements in therapies currently used to treat GBM have been taking place slowly, however these improvements have not successfully been translated to marked increases in patient survival [
6]. Therefore, there is a need to further develop effective strategies to treat GBM [
7].
Several molecular subtypes of GBM tumors have been identified each with distinctive genetic profiles. These tumors have been studied to exhibit activated signal transduction pathways, including those mediated by the receptor tyrosine kinases (RTKs), capable of regulating the growth, survival, migration, invasion and angiogenesis of glioma cells [
8]. Angiogenesis drives the formation of new blood in both hypoxia-dependent and -independent manner by the secretion of angiopoietin (Ang)-1which works along with elevated vascular endothelial growth factor (VEGF)-A inducing angiogenesis in xenograft models and Ang-2 in astrocytomas
[9,10,11,]. The establishment of sufficient and suitable vasculature is a prerequisite for tumor cell growth and proliferation [
12]
. Abnormal tumor vasculature and glioma cell invasion account for the resistance of these tumors to treatment. Therefore, it is essential to investigate angiogenesis and invasion in glioblastoma for the development of a curative therapy [
13].
To our knowledge, SEC61G has been identified as a proto-oncogene in glioblastoma that stimulates the Endoplasmic Reticulum Stress pathway, which in turn stimulates the proliferation of tumour cells [
14]. The SEC61G-EGFR fusion gene's function in pediatric ependymomas was recently identified [
15,
16]. SEC61 is a heterotrimeric channel protein composed of the SEC61 α, β, and γ subunits of which the γ subunit is called SEC61G or the Sec61 translocon gamma subunit [
17]. The SEC61 complex mediates membrane protein degradation by forming a trans membrane pore and is involved in transport of the nascent polypeptides and proteins to the ER [
18]. The complete protein translocase includes ERj1, SEC62, and SEC63along with SEC61 and is involved in protein folding, modification, and translocation [
19]. Cancer cells have been found to contain mutations in the translocon and ER-resident chaperones, proving that ER proteins are crucial in the pathogenesis of tumours. In prostate, gastric and colorectal malignanciesSEC62 and SEC63 are among the most frequently altered and/or over expressed genes [
20]. Interestingly, SEC61G is up regulated in glioblastoma multiforme and gastric cancer [
21]. Previous studies show that SEC61G plays an important role in tumor cell survival as well as response to endoplasmic reticulum stress [
14]. Knockout studies on SEC61γ show it resulted in inhibited tumor growth via EGFR/AKT survival signaling pathway blockage and apoptosis. A recent study reported SEC61G over expression to been inferior prognostic factor in glioblastoma multiforme [
22]. We aim to better understand the significance of SEC61G up regulation in GBM through evaluating its mechanism of working
.
In this study the TCGA data available at the GDC portal was analyzed, to identify differential gene expression and copy number variation of SEC61G in tumor vs. normal phenotypes. The role of SEC61G in GBM development was elucidated using gene ontology functional enrichment and gene network analysis followed by the genes survival analysis.
Results
Copy number variation and Genomic alteration of SEC61G
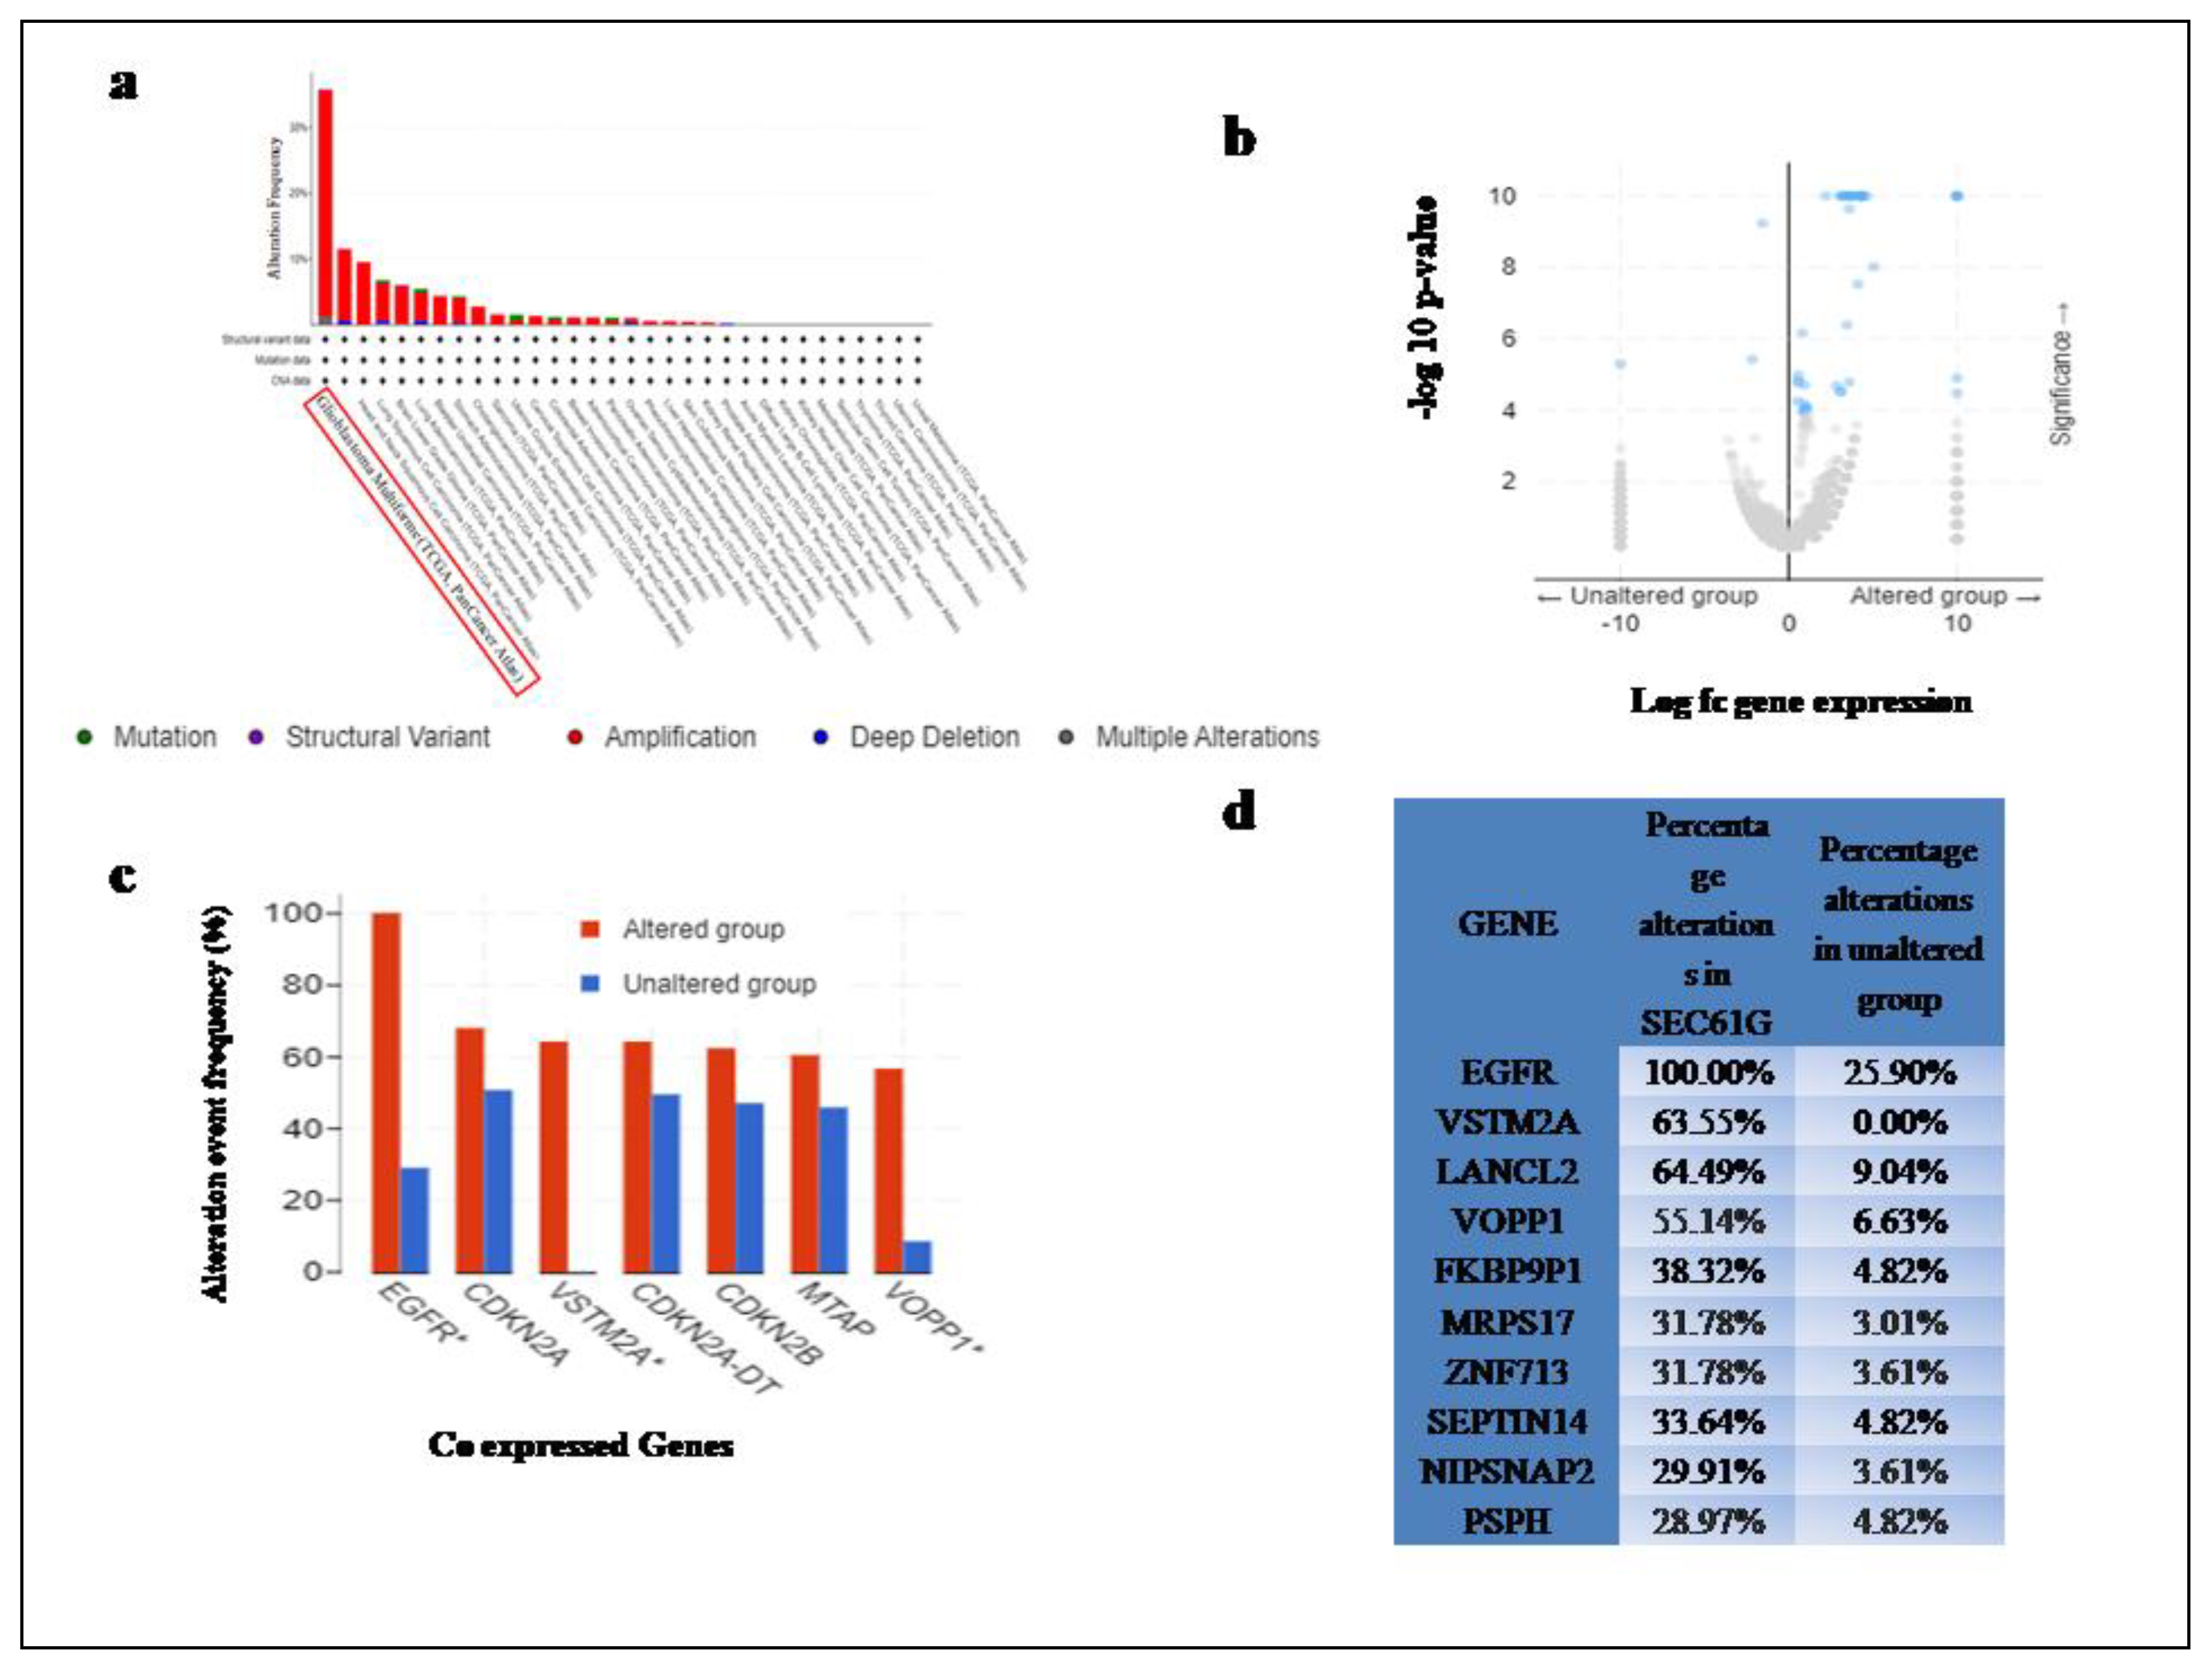
The results of the cBioportal demonstrate SEC61G to have a High-Frequency (36.7%) of Genetic alterations among all genes which are identified on the basis of typical alteration basically over expression depicted in Table 1. Glioblastoma Multiforme (GBM) showed the highest copy no. alteration (CAN) frequency of SEC61G among all cancer type (Figure 1a), which may be related to genomic instability. The result of RSEM (Batch normalized from Illumine Hisses RNASeqV2) analysis of the GBM patient's mRNA expression showed out of 136 Samples without alterations in the queried gene turned out to be 83 samples and 53 samples were found to have alterations in SEC61Ggene.A volcano plot indicates that the expression of several ontogenesis is correlated with the expression of SEC61G, indicating that SEC61G is involved in the advancement of oncogenic processes (Figure 1b). Several genes show the highest altered frequency in sec61G expression in comparison to unaltered group to highlight a few, EGFR showing 100% altered frequency in SEC61G and 28.92 in unaltered group, p -value=2.52e-19, q-value=2.98e-15, CDKN2A with alteration frequency in SEC61G= 67.92% and in unaltered group=50.60%, p-value=0.0342, q-value=0.664, VSTM2A with alteration frequency in SEC61G= 64.15% and in unaltered group=0%,p-value=9.23e-19,q-value=5.45e-15, CDKN2A-DT with alteration frequency in SEC61G= 64.15% and in unaltered group=49.40%, p-value=0.065, q-value=0.664 , CDKN2B with alteration frequency in SEC61G= 62.26% and in unaltered group=46.99%, p-value=0.0585, q-value=0.664, MTAP with alteration frequency in SEC61G= 60.38% and in unaltered group=45.78%, p-value=0.0656, q-value=0.664, VOPP1 with alteration frequency in SEC61G= 56.60% and in unaltered group=8.43%, p-value=9.73e-10, q-value=2.87e-6(Figure 1c). Comparison of genes with the highest alteration frequency in both altered and unaltered groups demonstrate a many fold enrichment with p and q value in tabular form (Figure 1d).
Figure 1.
Genomic alteration and copy number variation of SEC61G a Copy Number Variation of SEC61G among all 32 different cancers from cBioportal, Glioblastoma multiforme is highlighted in red box found to be highest CAN frequency across all cancer datasets from TCGA, b volcano plot showing TCGA GBM dataset with SEC61G alteration in comparison to unaltered patients, c &d alteration event frequency (%) of co expressed genes in SEC61G altered vs. unaltered.
Differential expression of SEC61G
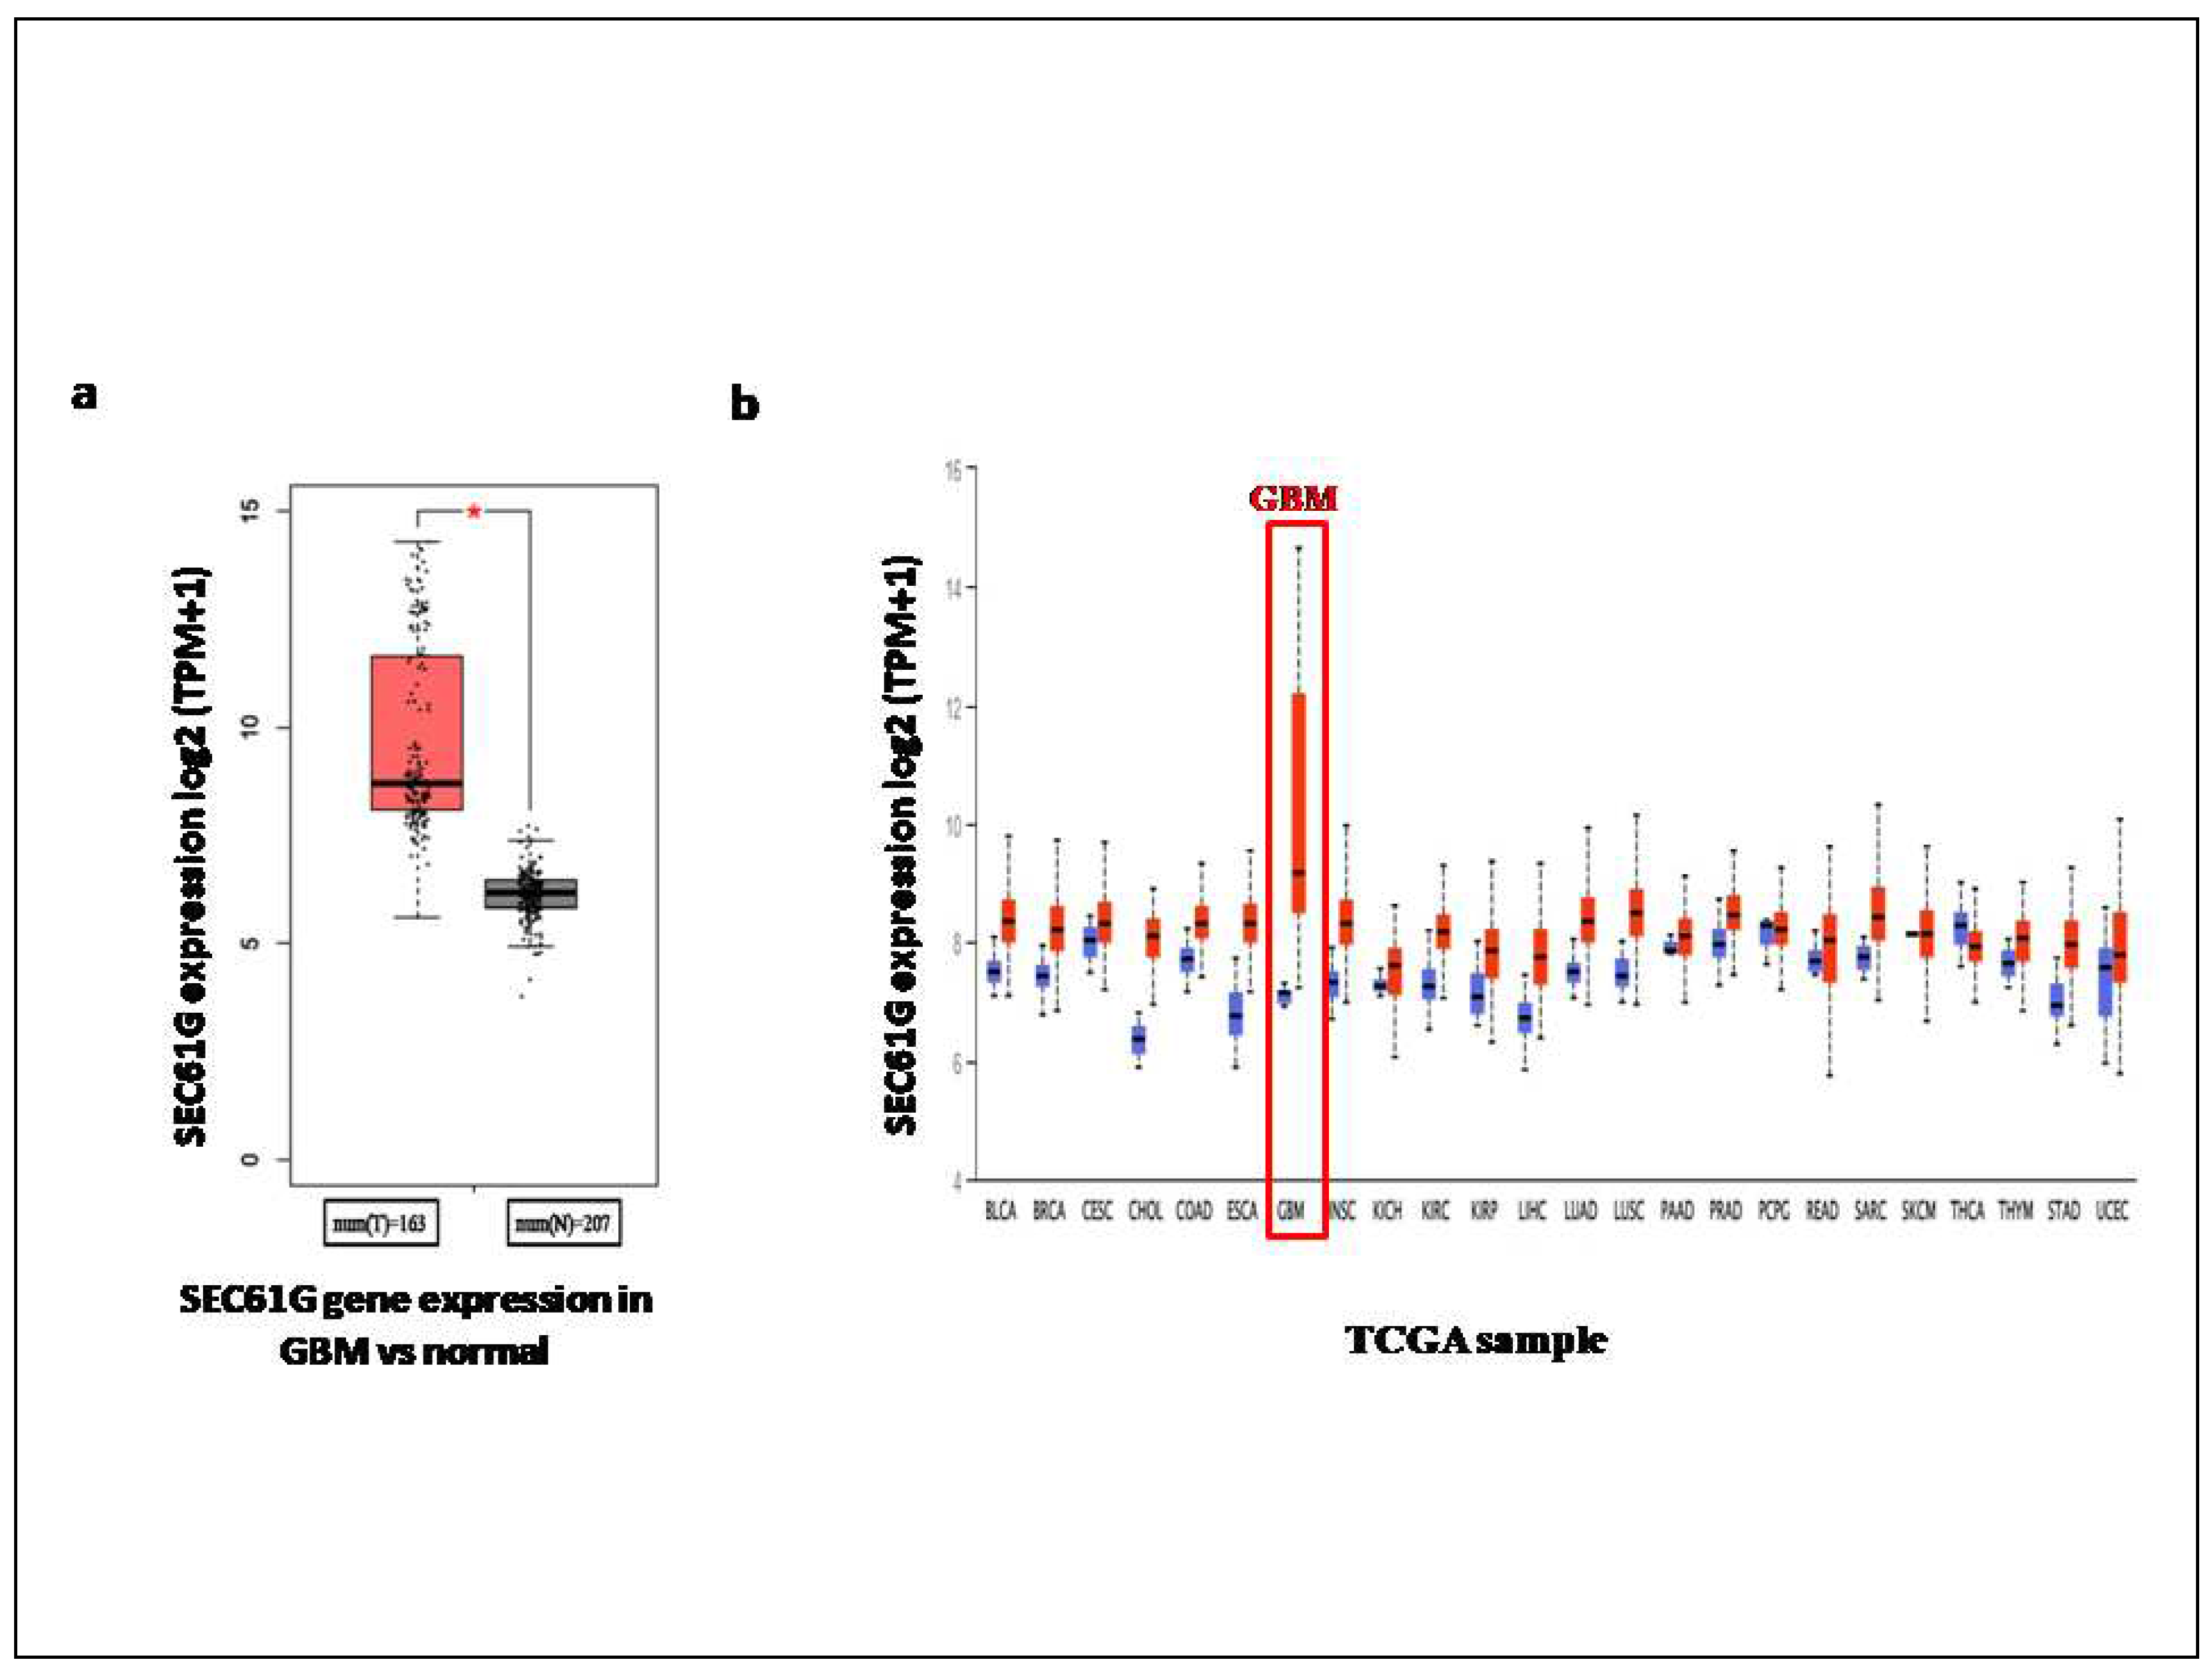
When comparing the Transcript per million (TPM) values of SEC61G in normal tissues and tumour tissues, we found that the expression of SEC61G was lower in the normal than the GBM tissues by using GEPIA2 online tool (Figure 2a). We verified the SEC61G gene expression using UALCAN database where plotting log2 expression values of SEC61G in normal and tumor tissues with p-value is 2.327e-12. From the UALCAN database we also found the expression of SEC61G across TCGA cancers with tumor and normal sample through pan cancer view (Figure 2b). From both pan cancers view we got the highest log2 expression of SEC61G in GBM among all the cancers.
Correlation analysis of SEC61G
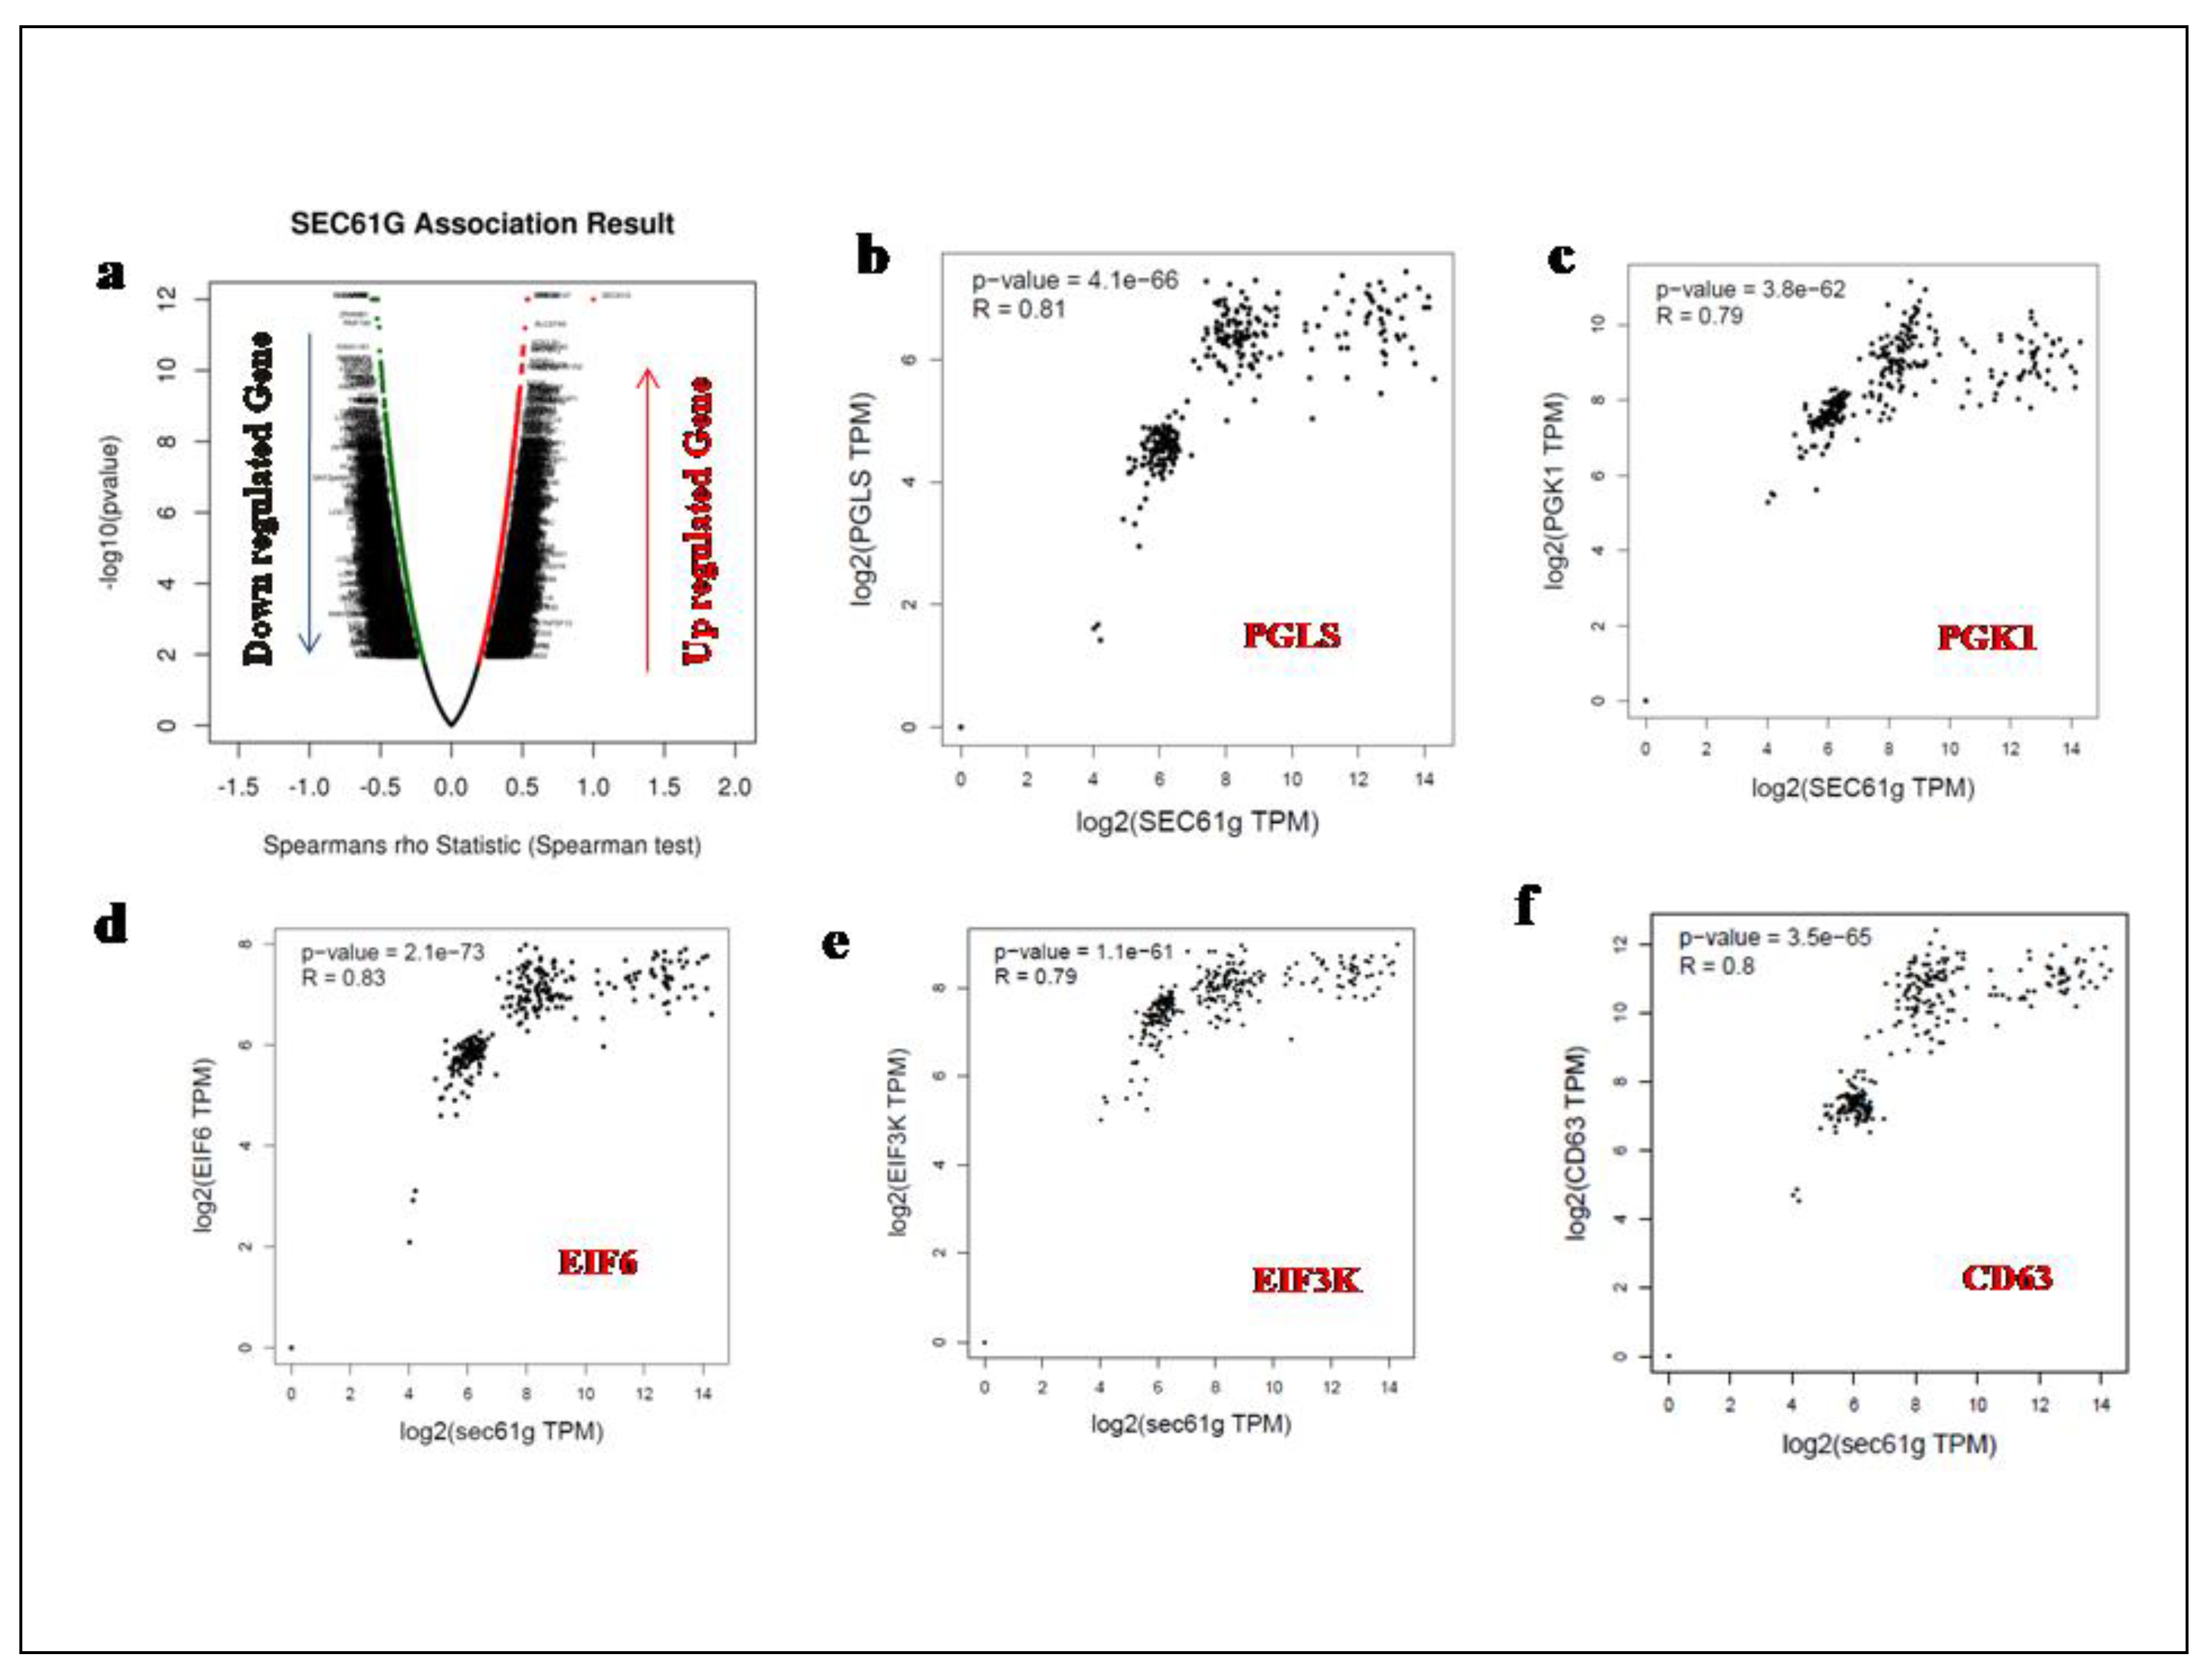
A Volcano Plot of the spearman's rank correlation of several genes (positive as well as negative correlated) with regard to the expression of SEC61G was derived using Linkedomics and is shown in (Figure 3a). With the help of GEPIA2 online tool we calculated the spearman Correlation Coefficient (R-value) of various genes positively correlated with the high expression of SEC61G. The expression of metabolic genes such as PGLS highly correlated with SEC61G having R-value=0.81 and p-value= 4.1e−66, PGK1 having R-value=0.79 and p-value= 4.1e−66, EIF6 having R-value=0.83 and p-value= 2.1e−73, EIF3K having R-value=0.79 and p-value= 1.1e−61and immunoregulatory gene CD63 having R-value=0.8 and p-value= 3.5e−65 have been shown in (Figure3b, c, d, e and f) has been verified by cBioportal. SEC61G expression has been observed to be correlated with the up regulation of numerous oncogenes, indicating a function for SEC61G in the development of oncogenic processes in Table2.
Immune cell infiltration of SEC61G in GBM patients
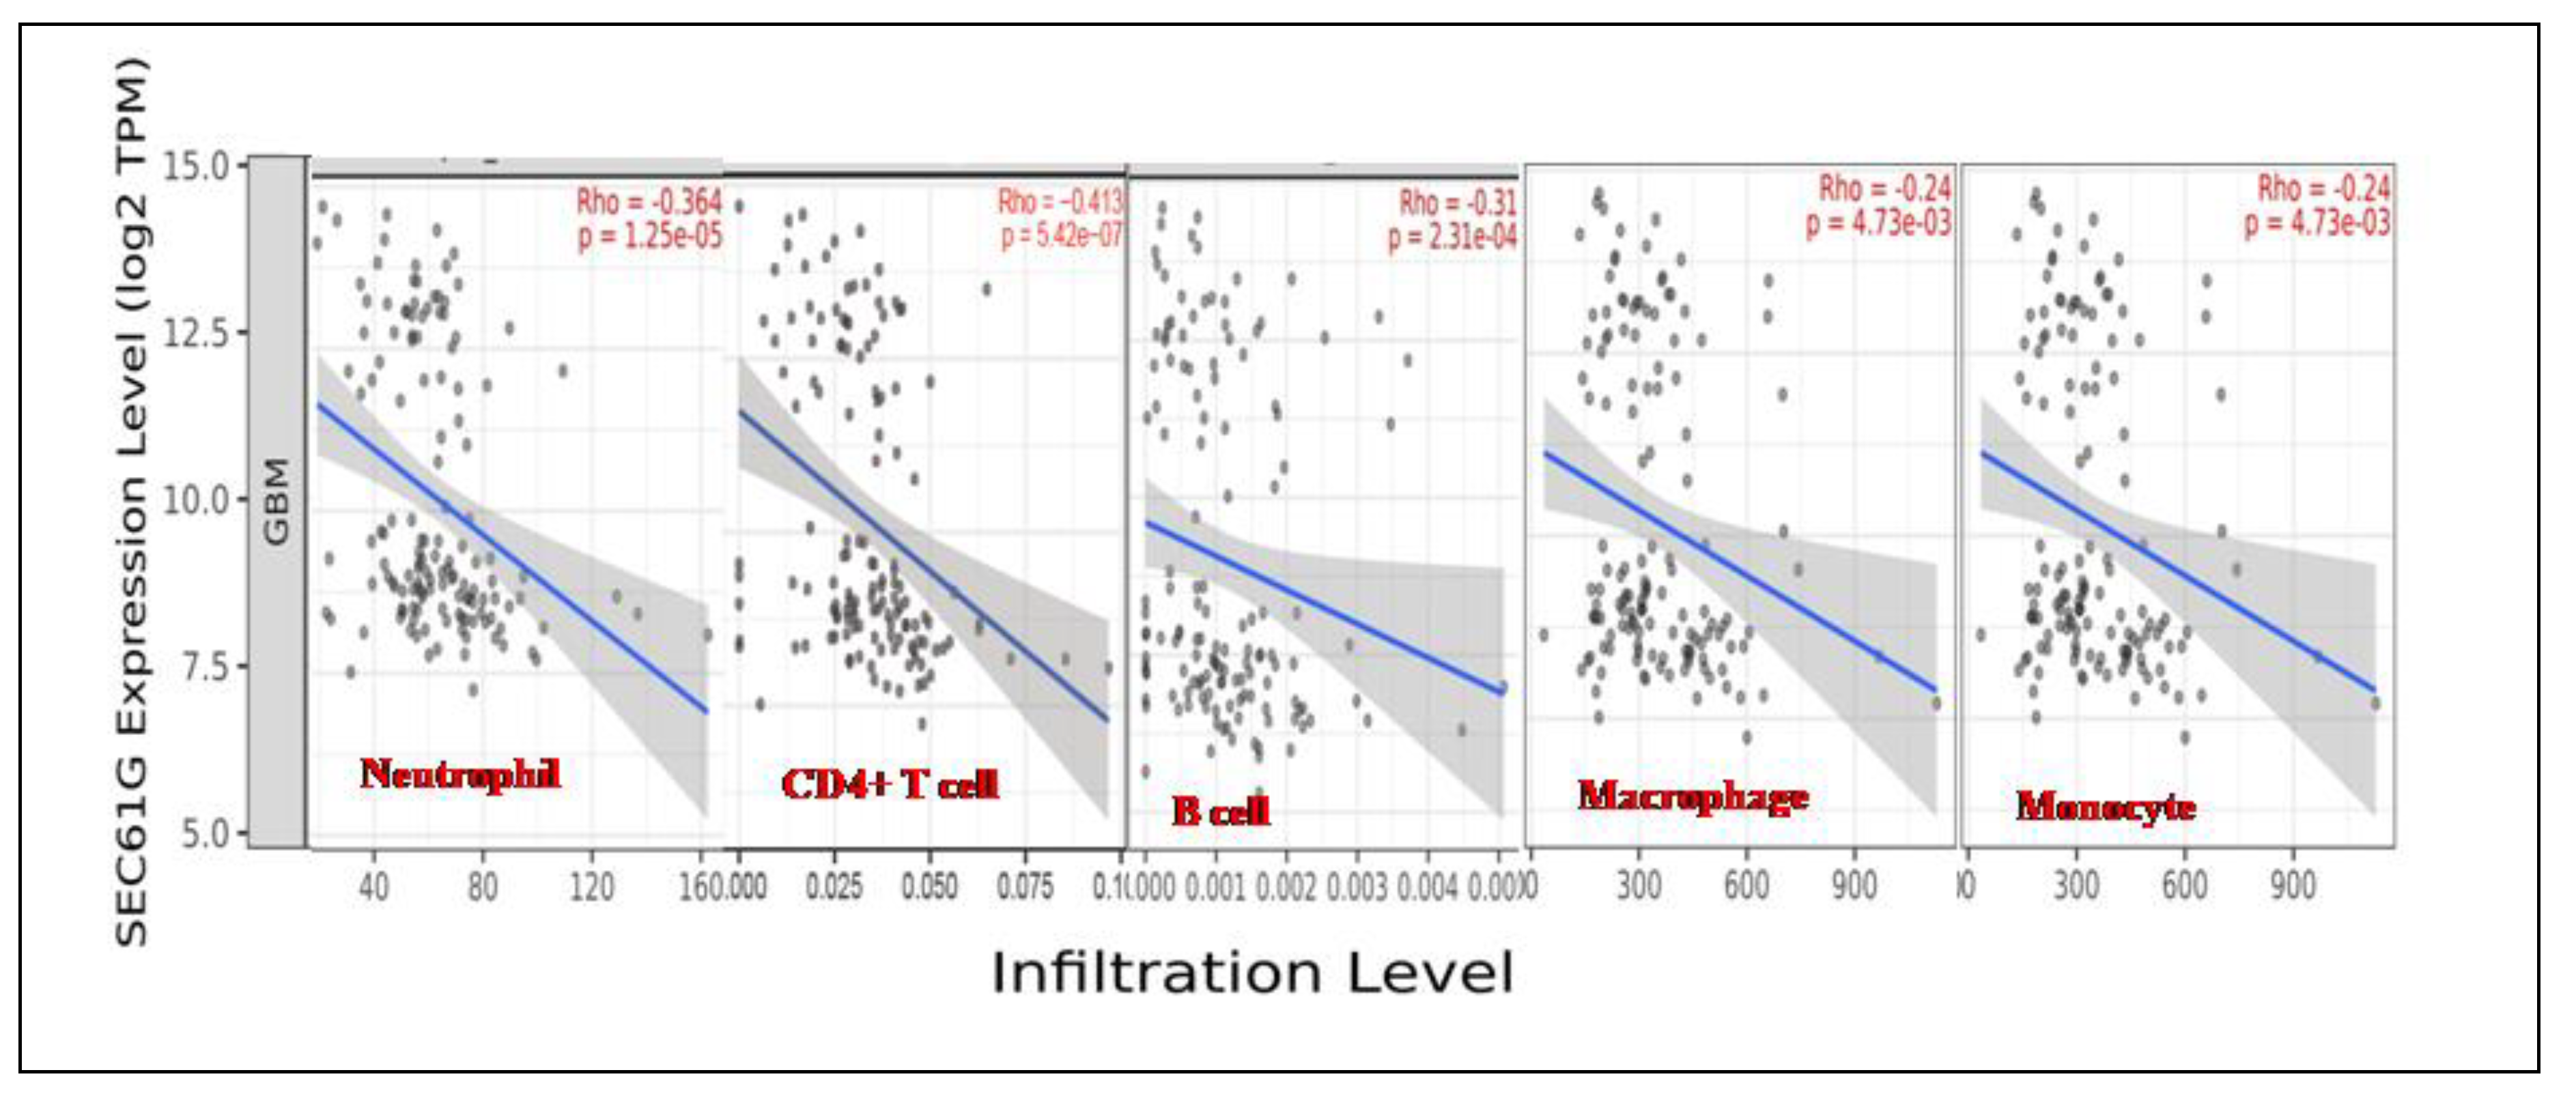
We evaluated the correlations of SEC61G with the infiltration of immune cells in GBM. SEC61G expression was associated with tumor purity and negatively correlated with the immune infiltration levels of the five major types of immune cells examined in the TIMER database (
Figure 4). High SEC61G expression corresponded to low Neutrophil, CD4+ T cell, B-cell, Macrophage as well as Monocyte levels.
Gene network analysis of SEC61G in GBM
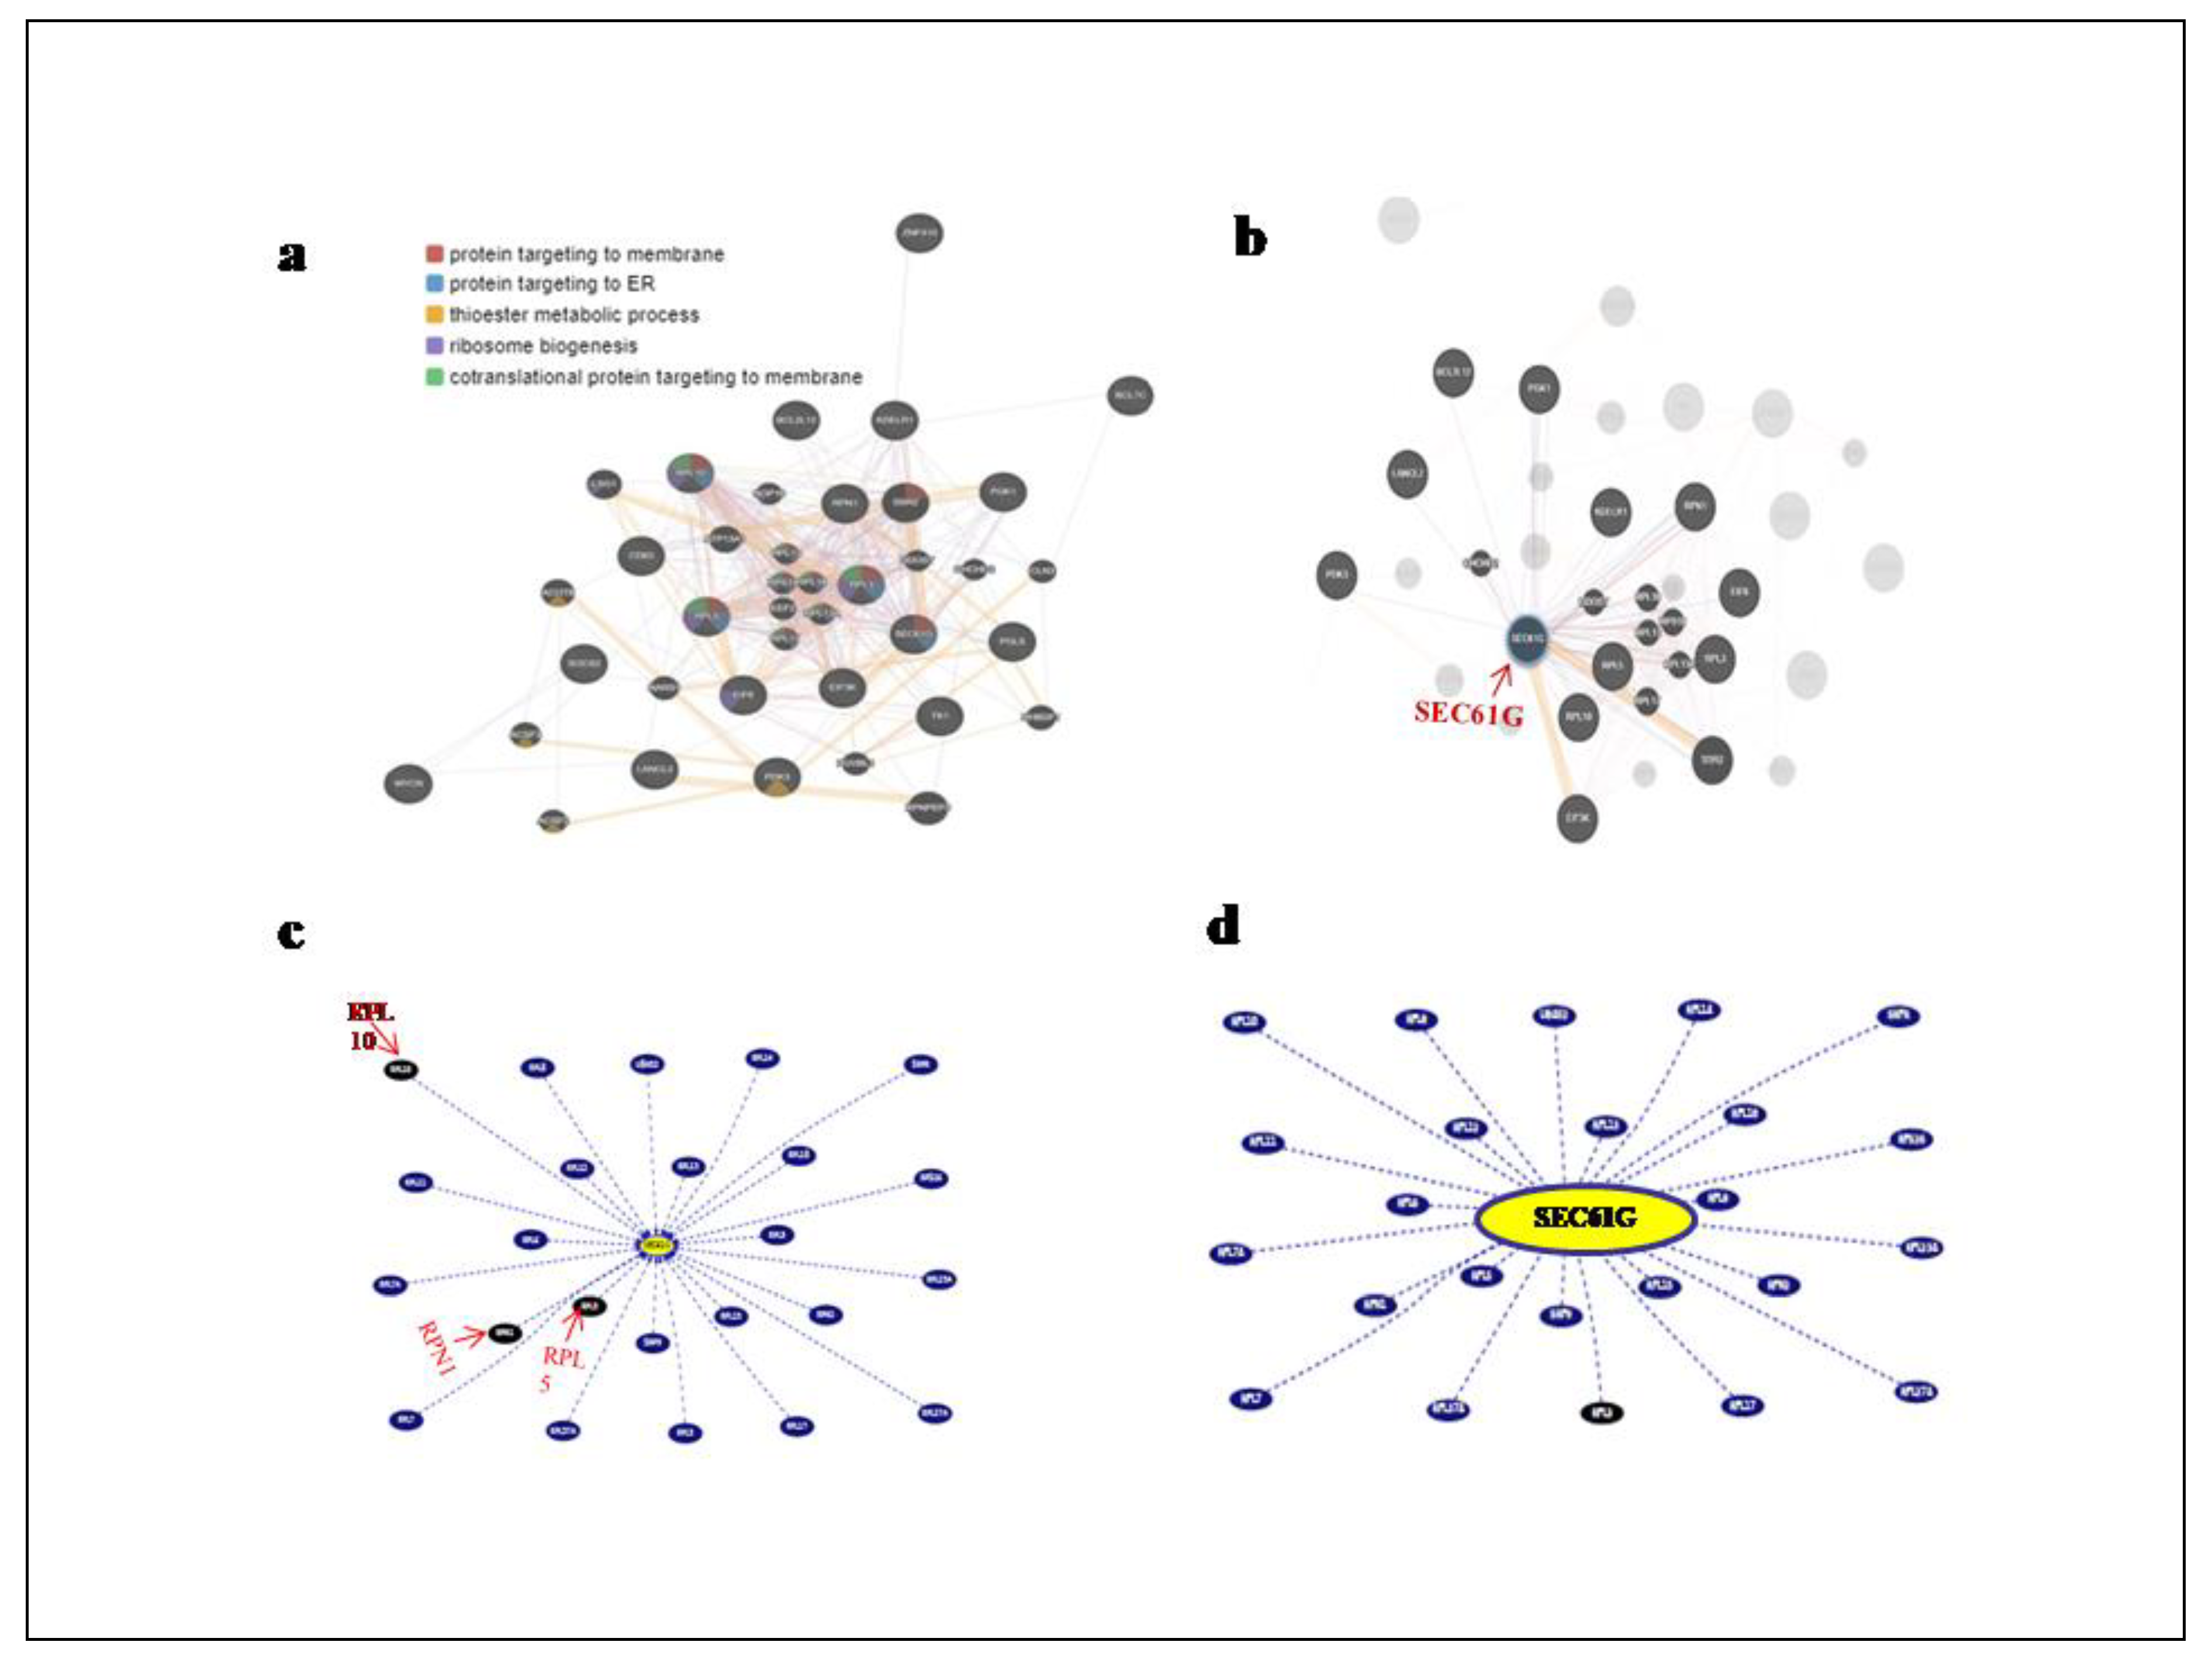
In order to investigate the networks and functions connected to the SEC61G gene, the online database Gene Mania was used to build the Gene-Gene Interaction network (
Figure 5a). The various network types are represented by colored lines, and the relevant gene functions are represented by the nodes. We found17 nearby genes that co-expressed with SEC61G out of the 50 genes we investigated which are metabolism related genes (PGLS, PGK1, EIF6, EIF3K, PDK3), angiogenesis related genes (BCL2L12, BCL7C, KDELR1 and LANCL2) and protein targeting to ER genes (RPL10, RPN1, RPL5, RPL3, RPL17, RPL13A, RPL18 and RPS19) (
Figure 5b). Gene interactions and pathways are displayed in
Figure 5c from text mining and curated databases using the UCSC Genome Browser. Light blue: interaction database, blue: pathway database, grey: only text mining. Interactions without text mining support are indicated by dashed lines. According to the cancer gene census, SEC61G interacts with the RPN1, RPL5 and RPL10 genes (
Figure 5d).
Enrichment analysis of SEC61G
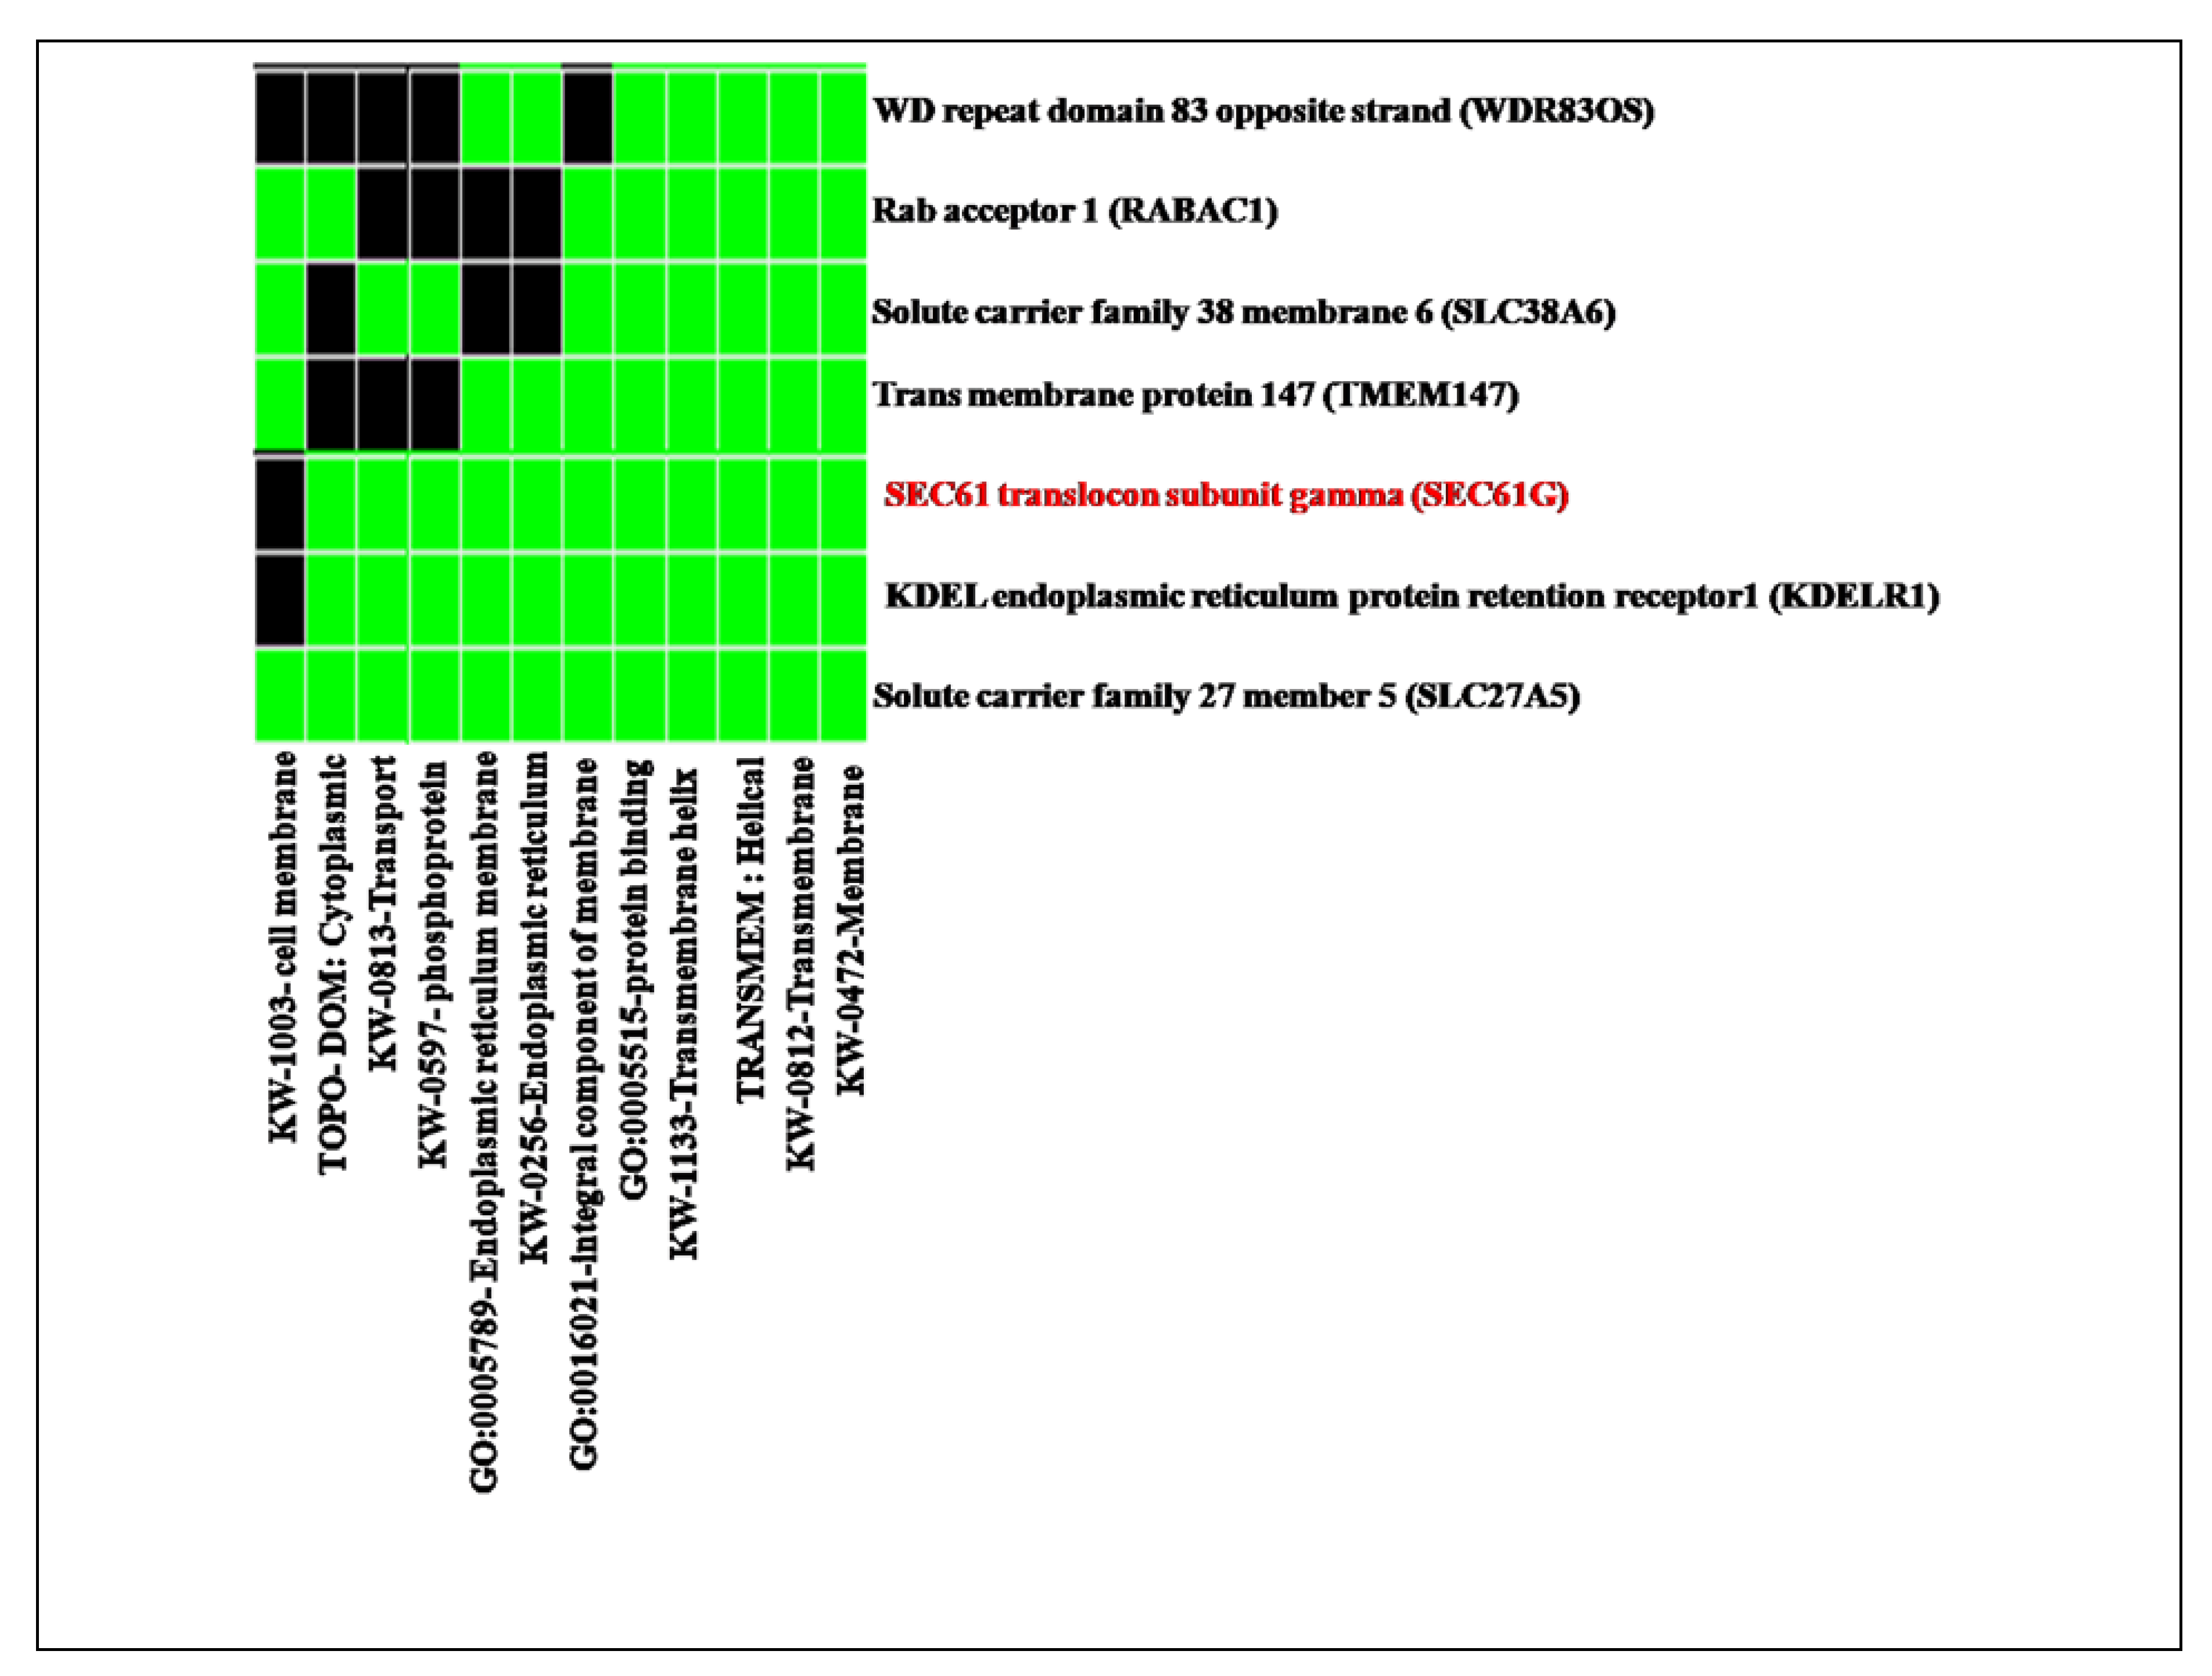
In addition, GO enrichment, Wiki Pathway, and GSEA profile were performed. Gene ontology of the functional clustering genes showing correlated expression with SEC61G and enriches dataset is shown in
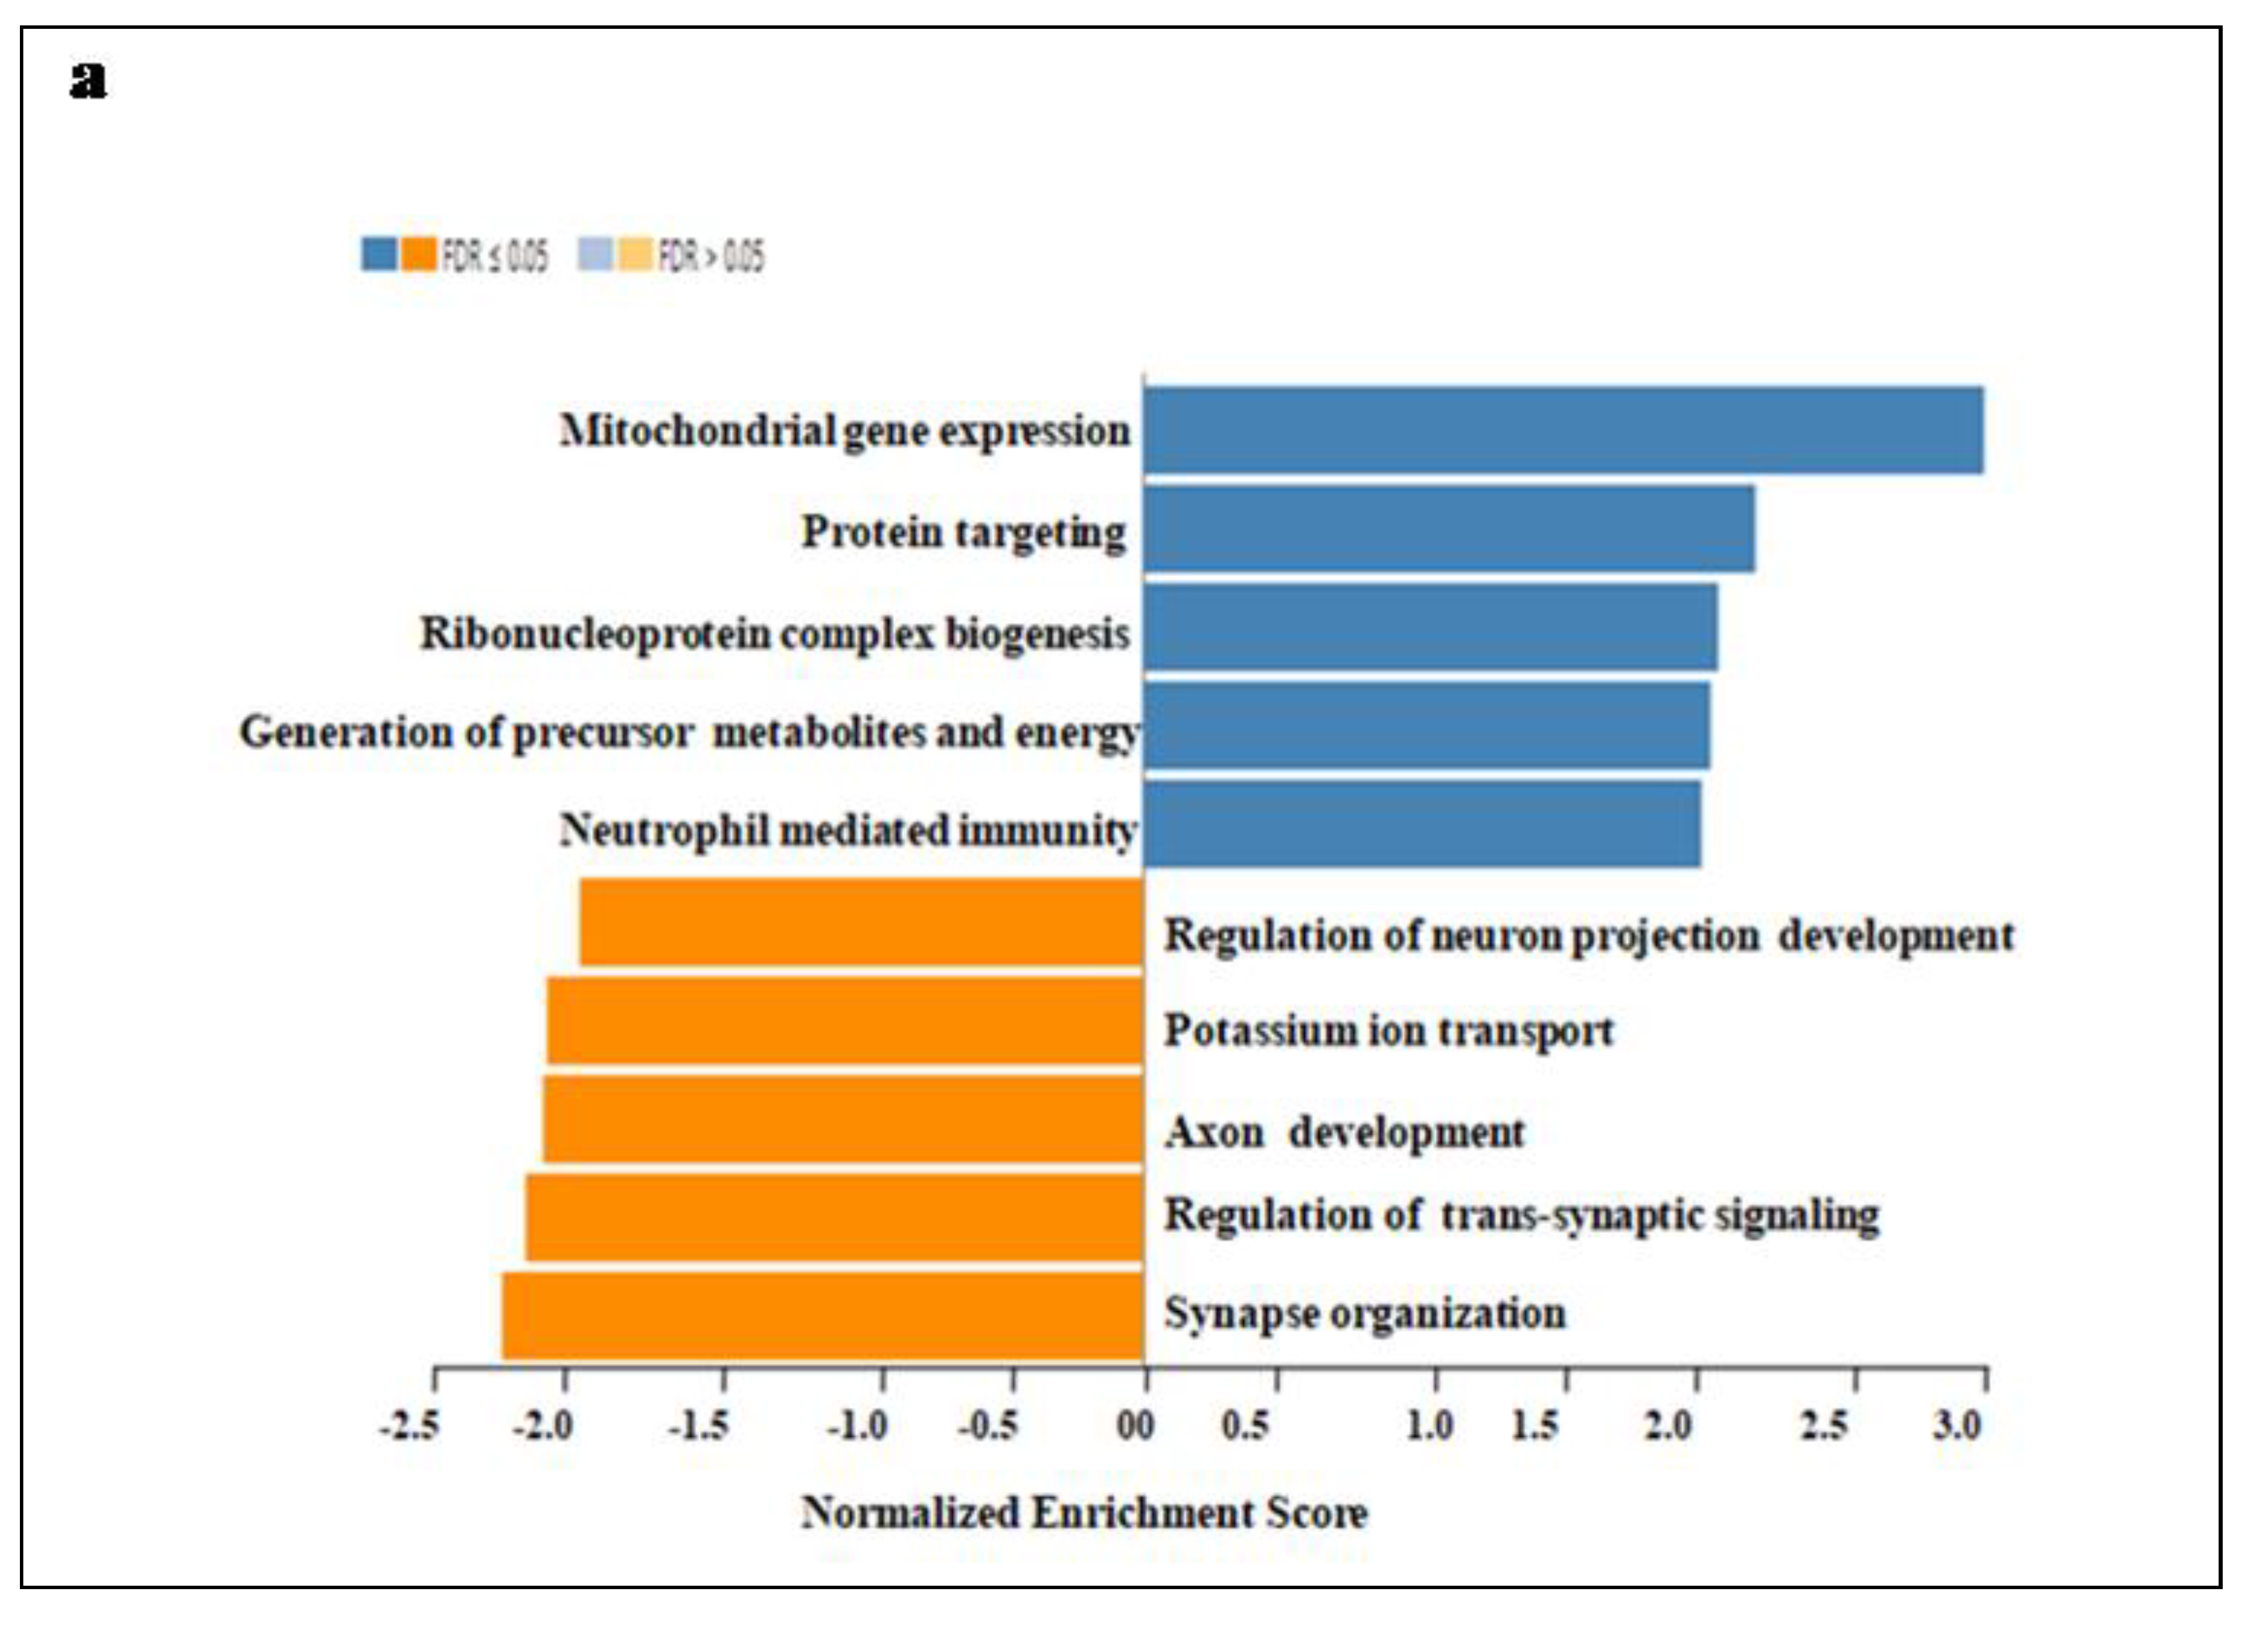
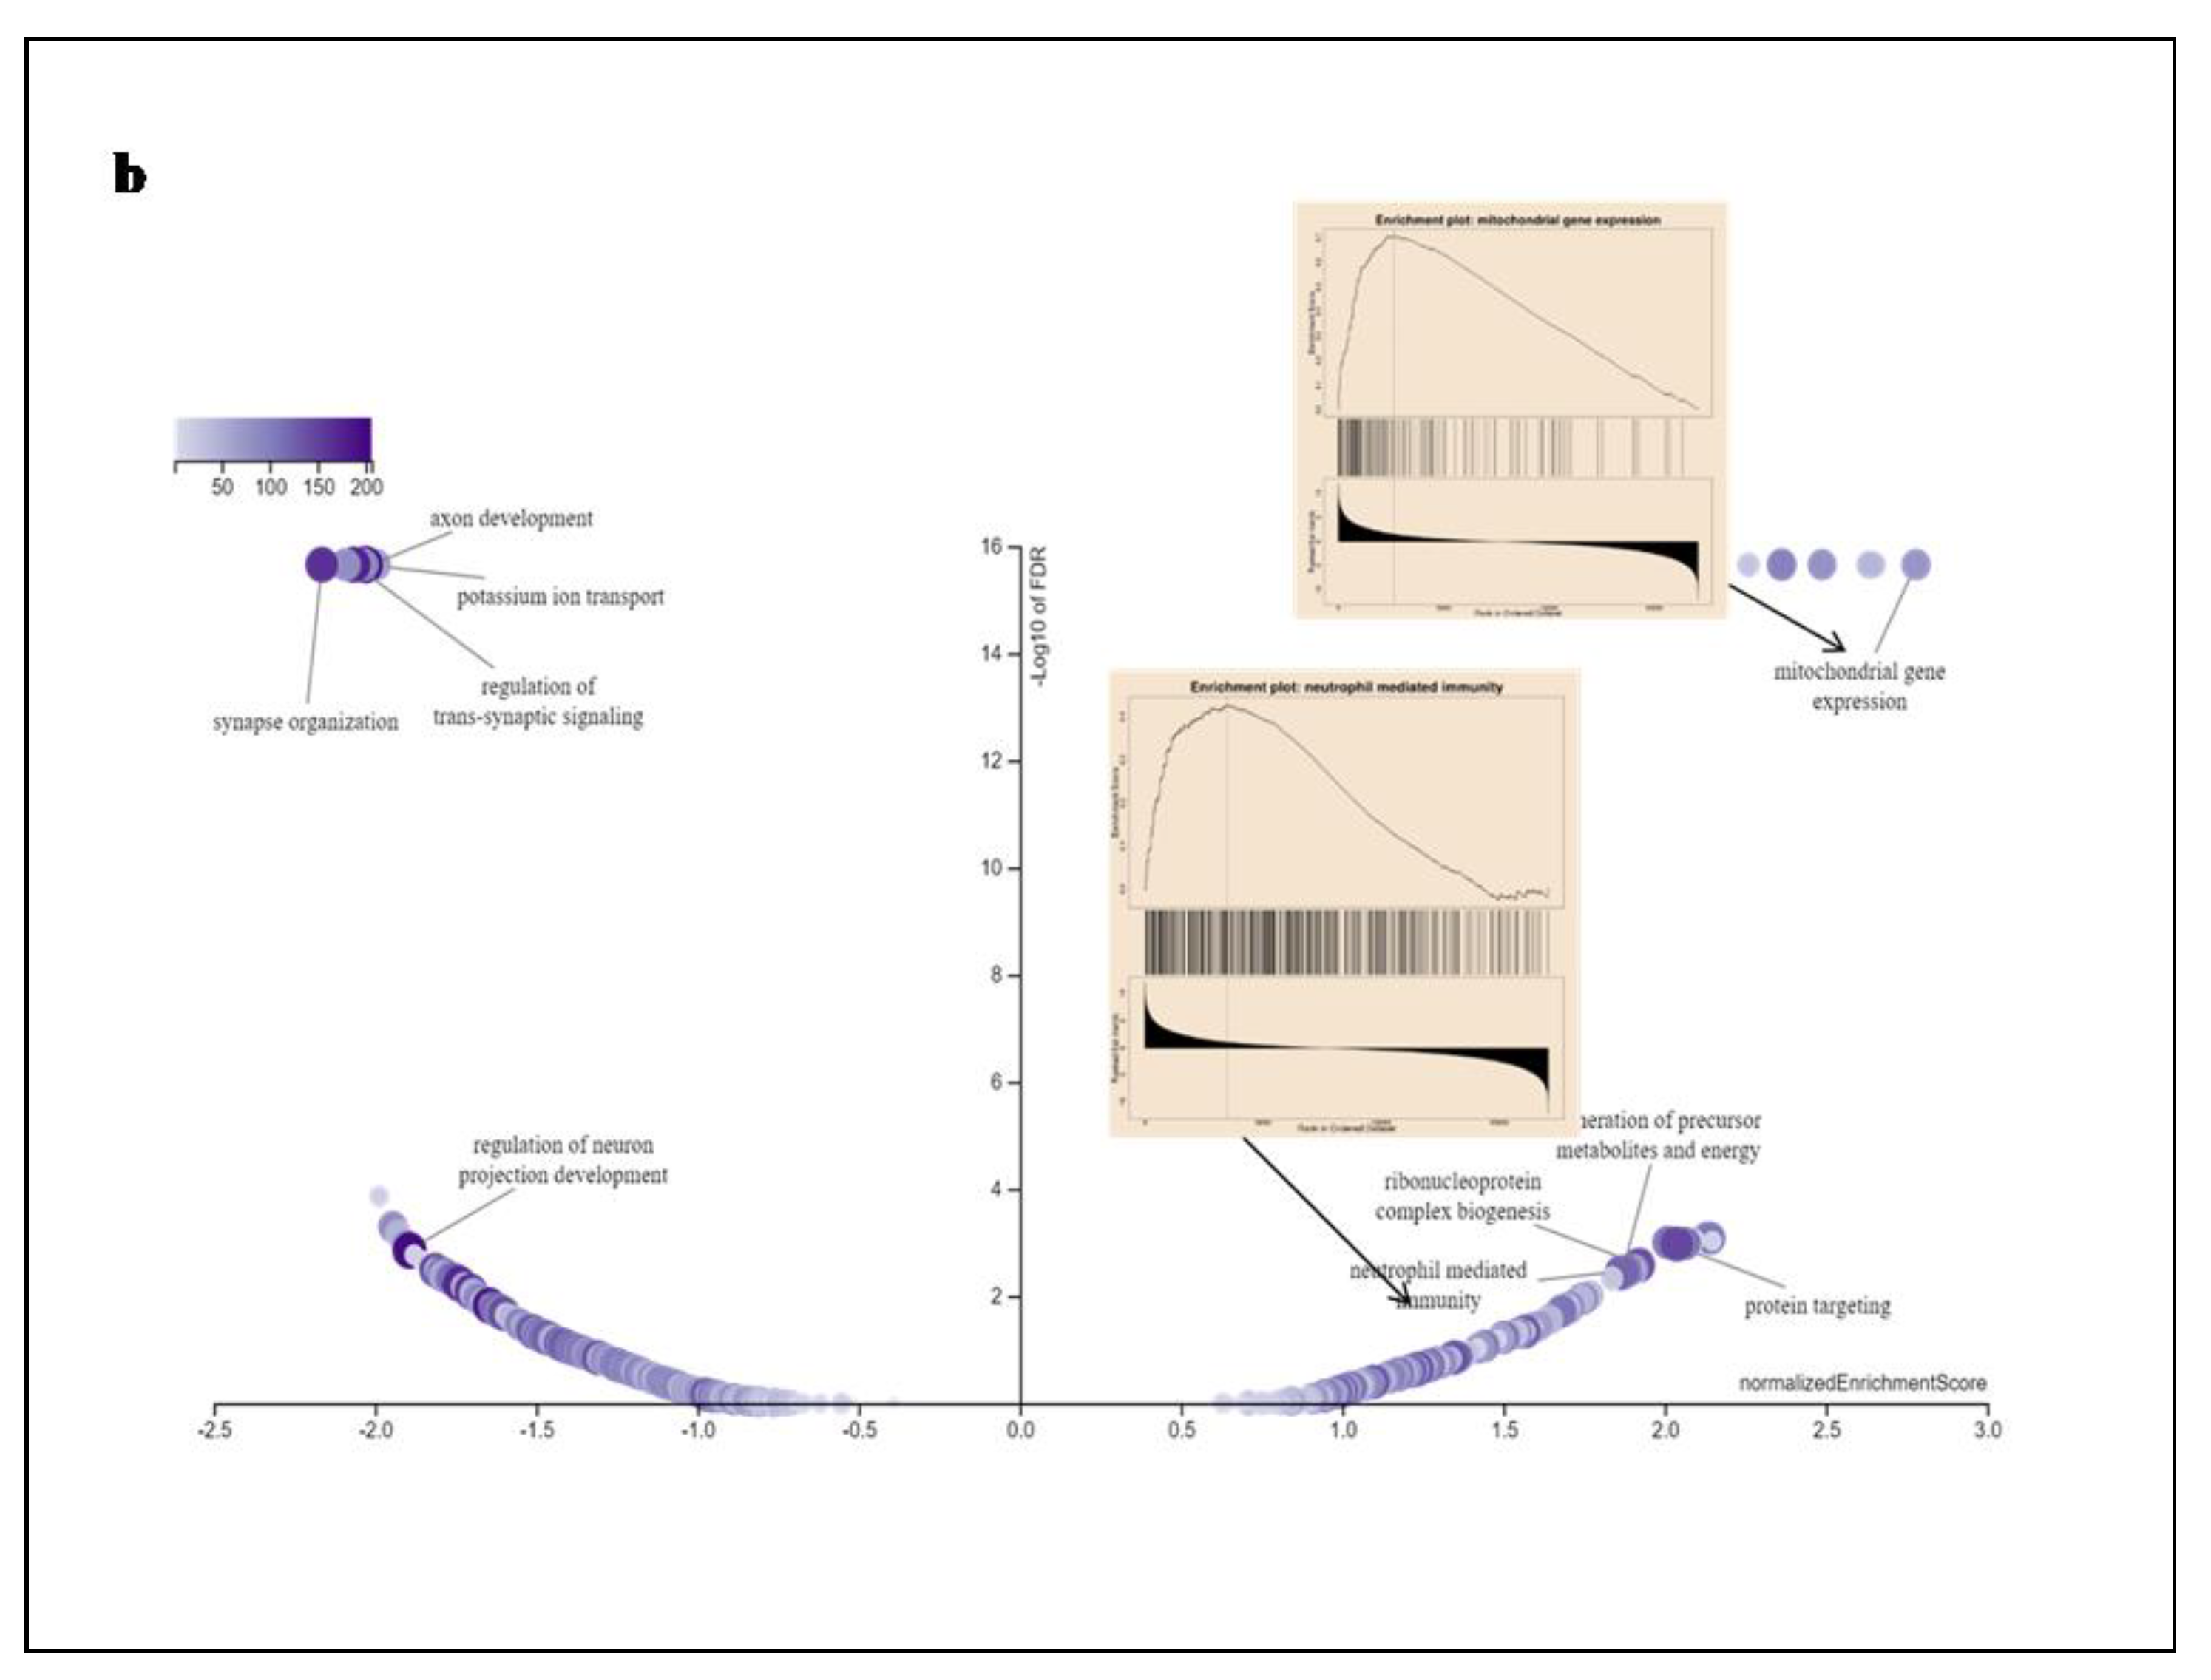
Figure 6. In Figure7a we found combined bar graph of biological, cellular and molecular role of SEC61G. The enrichment plots for the gene mitochondrial expression and neutrophil mediated immunity are also shown in
Figure 7b of the Wiki Pathway data. GO:0140053: mitochondrial gene expression immunity having enrichment score (ES)=0.70679, normalized enrichment score (NES)=2.7805, p-value=<2.2e-16and FDR value=<2.2e-16 and GO:0002446: neutrophil mediated immunity having enrichment score (ES)=0.42787, normalized enrichment score (NES)=1.8647, p-value=<2.2e-16 and FDR value=0.0036348. According to these findings, SEC61G may play regulatory functions in the mitochondrial gene expression, protein targeting, neutrophil mediated immunity; Ribonucleoprotein complex biogenesis which may contribute to its involvement in the pathogenesis of GBM.
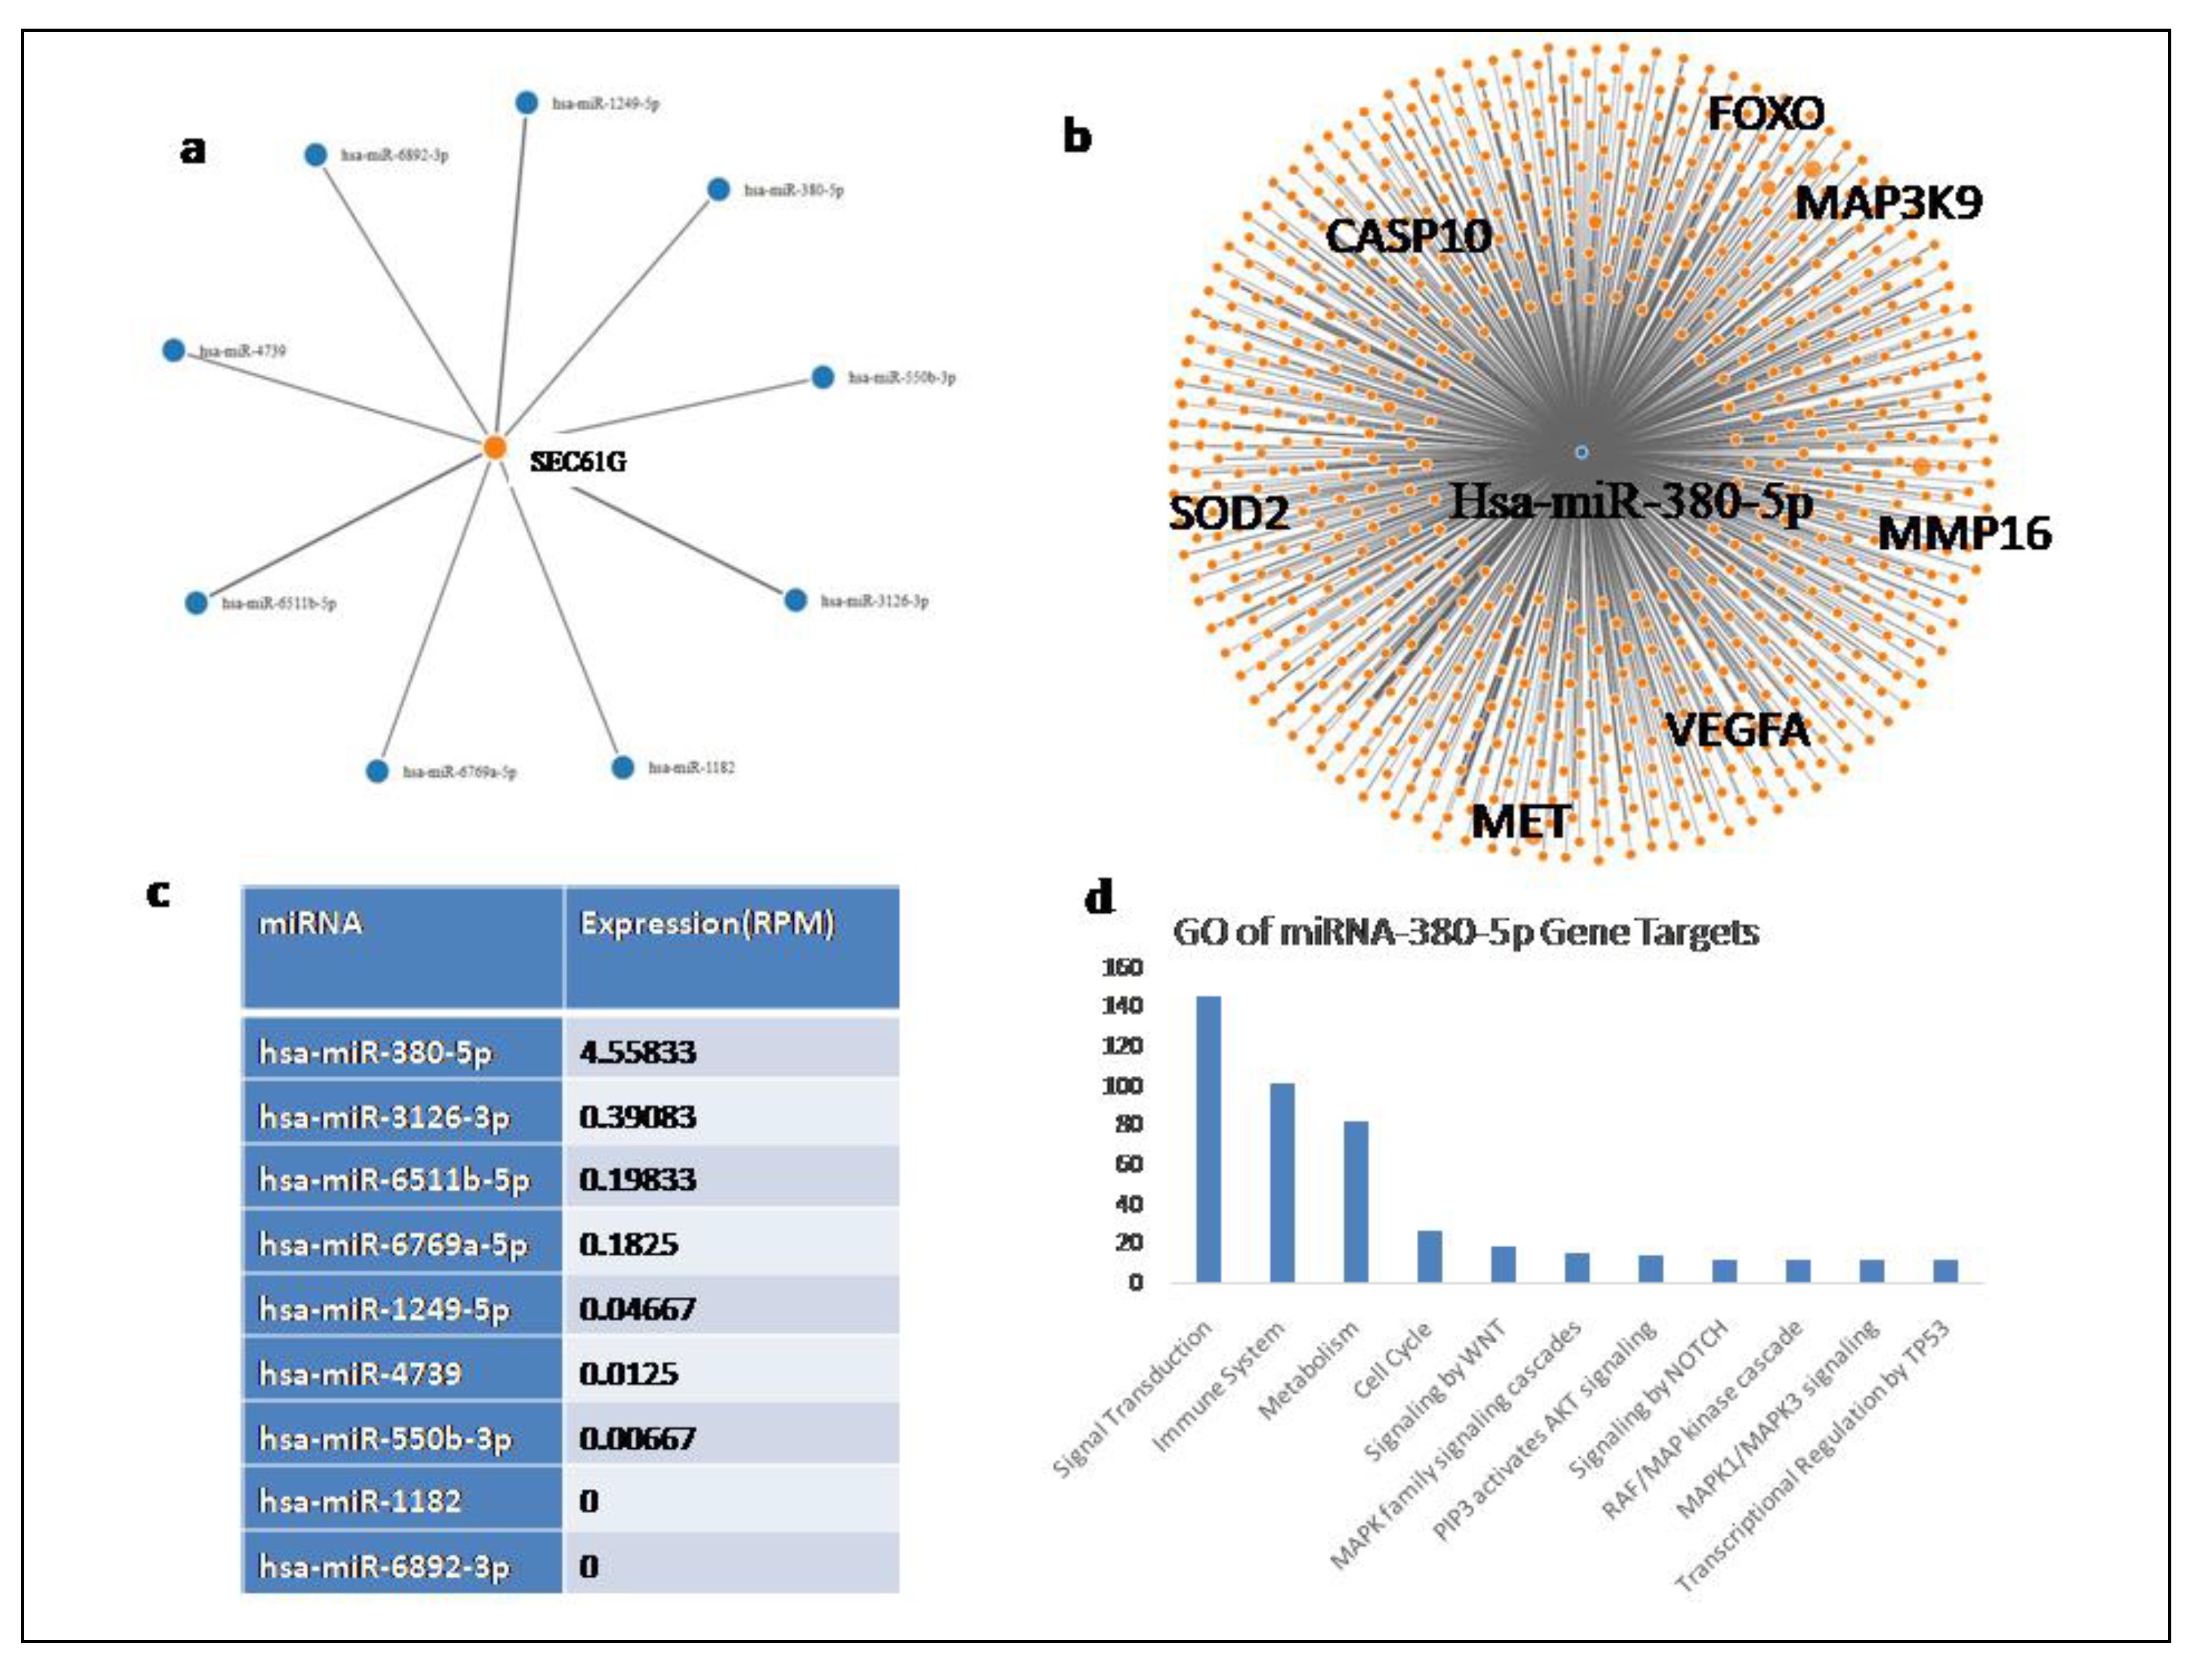
miRNA Analysis: On performing mirwalk analysis we found SEC61G gene to be a predicted target of eight miRNAs (Figure8) out of which using miTED we obtained the differential miRNA expression profile of TCGA glioblastoma patients. We found the expression of Sec61G targeting miRNA namely hsa-miR-380-5p, hsa-miR-3126-3p, hsa-miR-6511b-5p, hsa-miR-6769a-5p, hsa-miR-1249-5p, hsa-miR-4739, hsa-miR-550b-3p, hsa-miR-1182, hsa-miR-6892-3p.
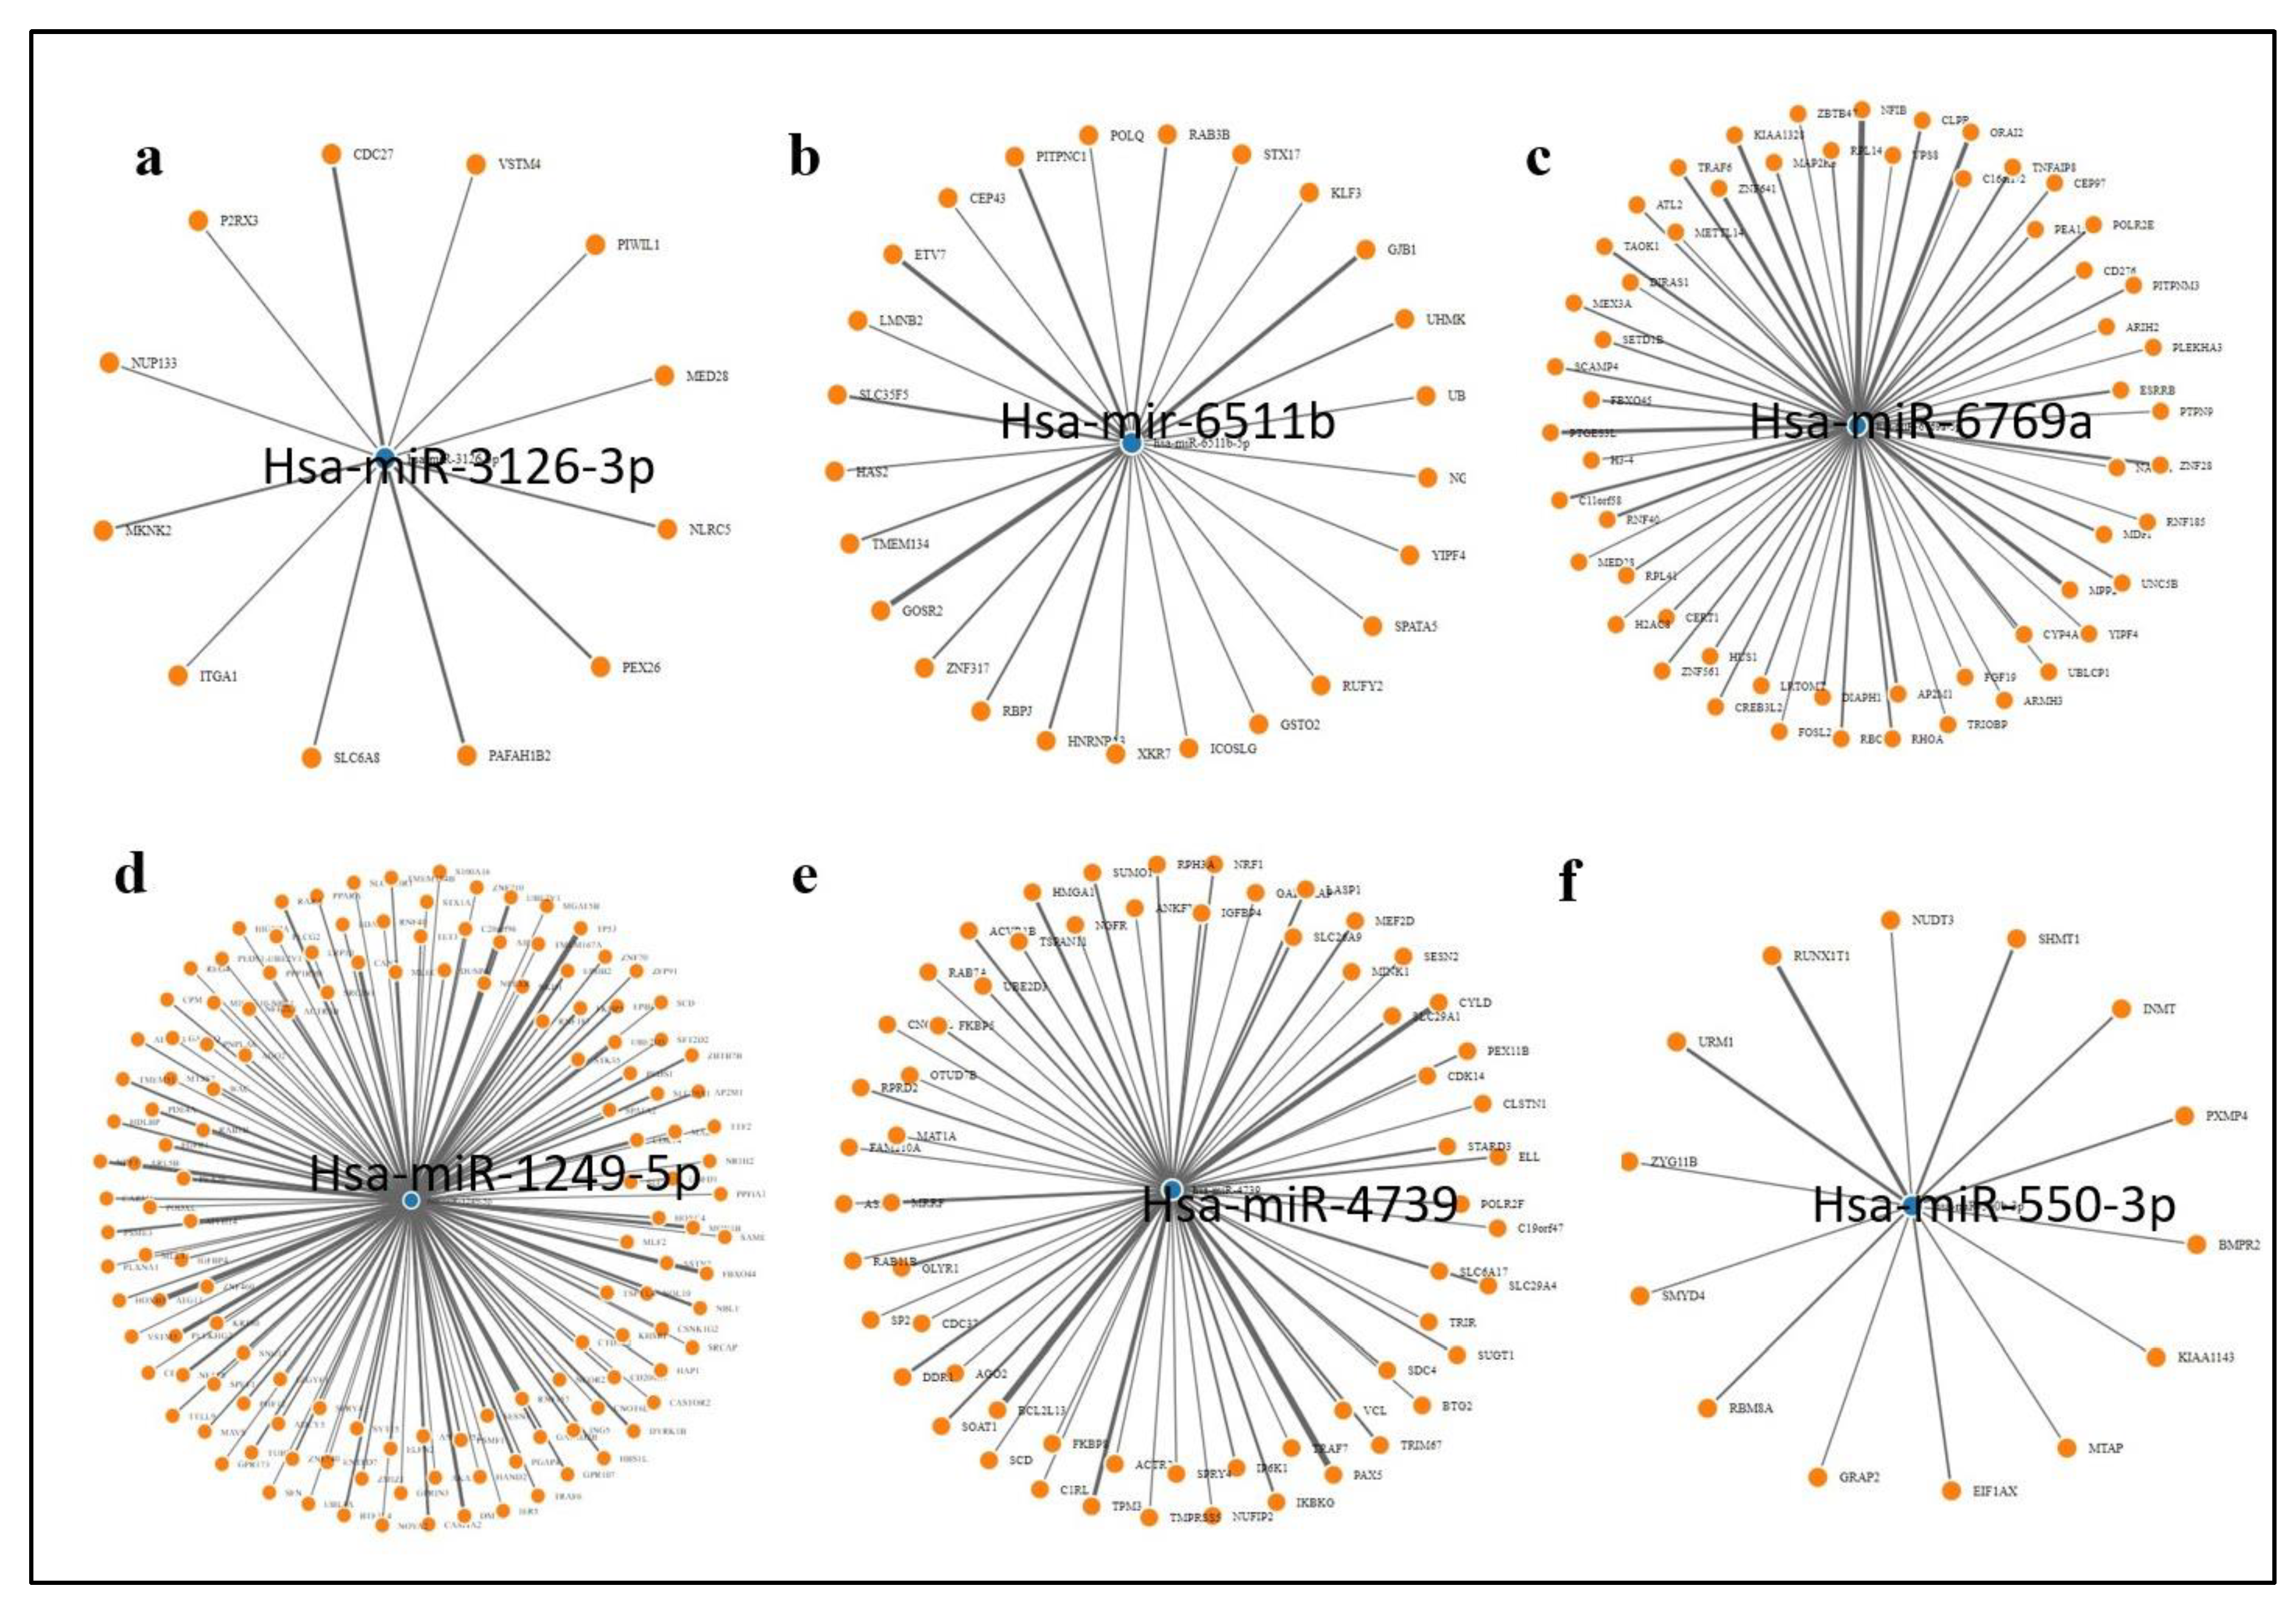
The up regulated expression of SEC61G in glioblastoma as seen earlier suggest the miRNA transcriptionally controlling its expression are down regulated in glioblastoma patients. We obtained a network of the experimentally validated gene targets for these miRNA using MirTarbase and performed the gene ontology of the targets. MMP16, VEGFA, Met, FOXO, CASP10 and SOD2 are amongst the important cancer related genes targeted these miRNAs. Since we do not have sufficient data to compare the expression of the miRNA in normal vs glioblastoma tumor samples we suggest hypothesize that the miRNA mentioned above are down regulated in glioblastoma in order to enhance tumor genesis. The gene ontology of miRNA-380-5p gene targets show these genes participate in cell cycle and immune regulation as well as WNT signaling and MAPK signaling suggesting the down regulation of the miRNA targeting them leads to their up regulation resulting in cancer promotion.
Figure 9 shows the experimentally validated genes target of all these miRNAs targeting SEC61G as mentioned in
Figure 8c.
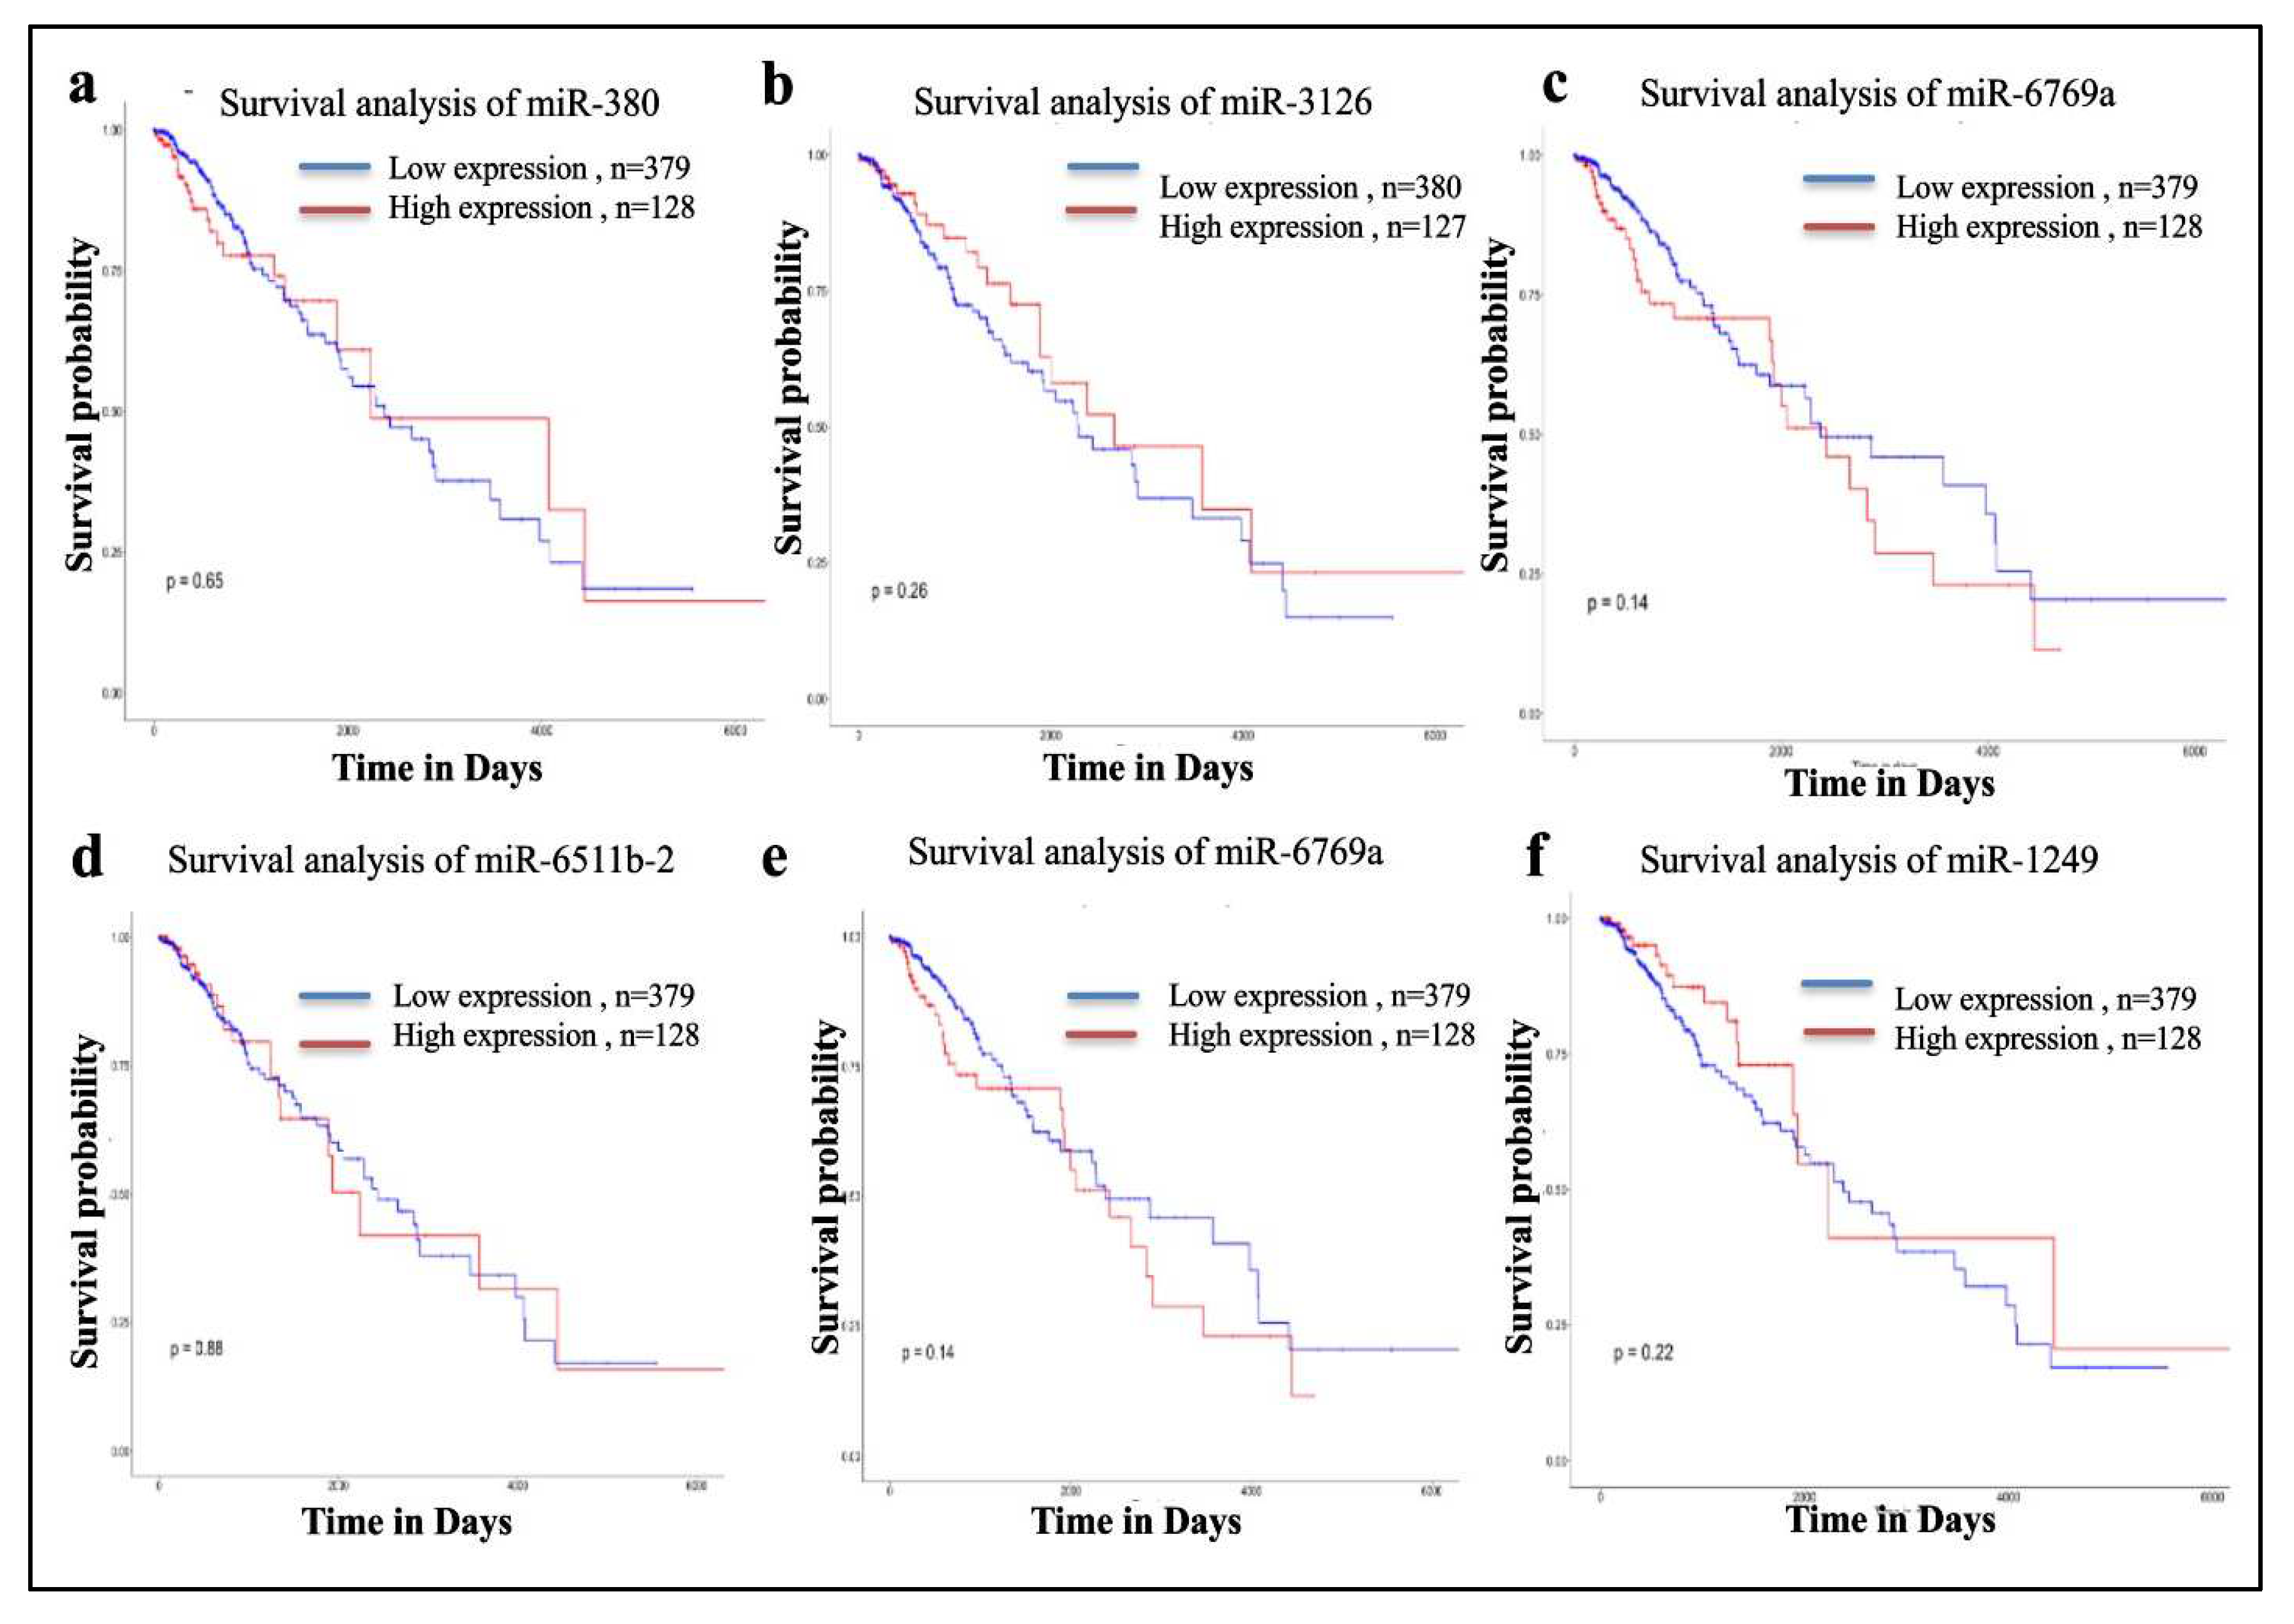
Figure 10 shows the survival analysis of the miRNA targeting SEC61G of which the down regulation of mir-3126-3p prominently shows the lower survival of GBM patients.
Survival Analysis:
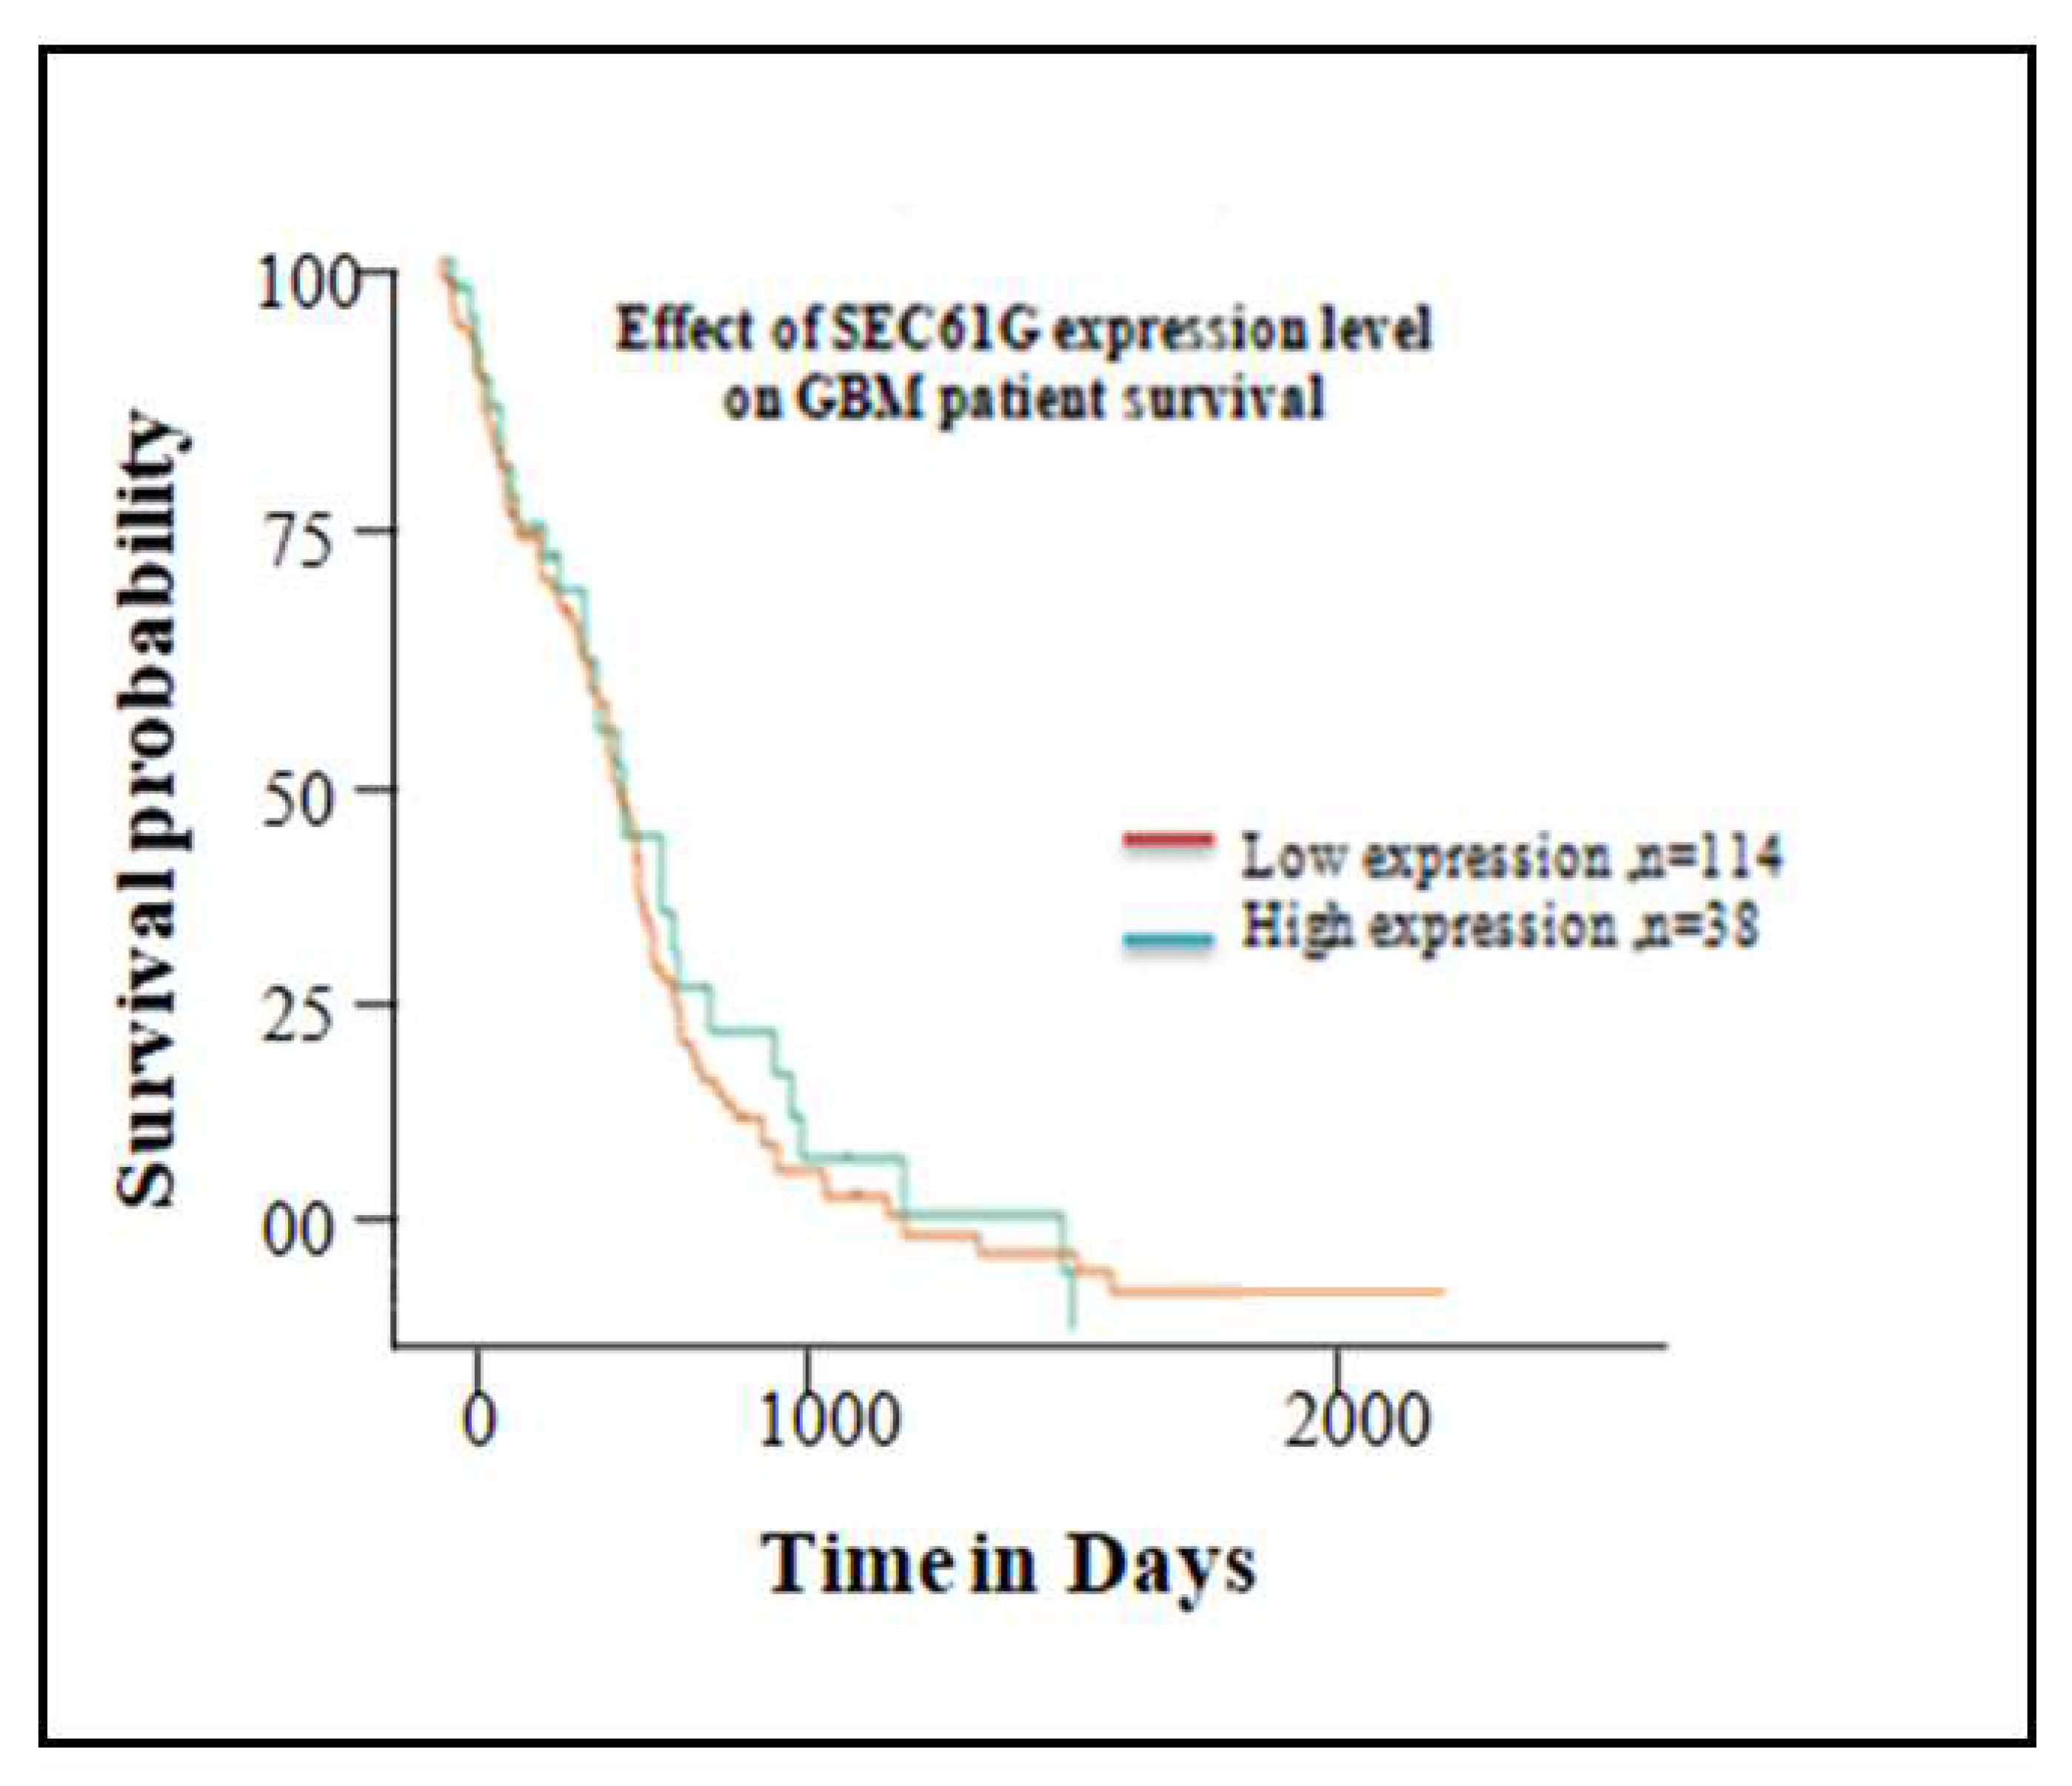
The probability of survival over time of the GBM patients with high SEC61G expression was analyzed. The survival maps in Figure11, demonstrated that the high expression of SEC61G related to poor overall survival rate. These findings suggest a relationship between increased SEC61G expression and a poor prognosis for survival in GBM patients.
Discussion
In this study, we found SEC61G, MYCN, METTL1, MBD6, MDM4, MDM2, MDM1, GLI1, and CDK6 to be over expressed genes in GBM. Out of 575 profiled glioblastoma samples, 211 patients had enhanced SEC61G expression and had the highest copy no. alteration (CAN) frequency of any amplified gene (36.7%) (Table1). In the current investigation, we found that SEC61G expression was highest in the brain or central nervous system (CNS) cancer tissues in GBM across thirty-two another cancer studies corresponding normal tissues. We examined the expression levels of SEC61G in normal and GBM tissues using the TCGA and UALCAN databases. Using bioinformatics analysis, we examined the expression patterns, copy number variation, gene interactions, survival analyses, and connections with immune infiltration in GBM patients.
On cBioportal analysis of the Glioblastoma multiform (GBM) TCGA, Firehose Legacy Dataset we observed SEC61G mRNA and protein expression to be up regulated (
Figure 2). Along with the overexpression of SEC61G genes, we also found that the expression of metabolism related genes like PGLS, PGK1, EIF6, EIF3K etc. are also up regulated. In cancer, including glioblastoma, the pentose phosphate pathway (PPP) is crucial for NADPH production and redox equilibrium. The second PPP enzyme, 6-phosphogluconolactonase (PGLS), converts 6-phosphogluconolactone to 6-phosphogluconate, and its specific function in redox metabolism and tumor growth [
23]
. Recent research revealed that PGLS was aberrantly expressed highly in a variety of cancers, including hepatic, cervical, breast, and glioblastoma
[24,25,26,27,28]. An important enzyme in the aerobic glycolysis process is phosphoglycerate kinase 1 (PGK1). PGK1 creates 3-phosphoglycerate and ATP by catalysing the reversible transfer of a phosphate group from 1, 3-bisphosphoglycerate to ADP. In addition to controlling cell metabolism, PGK1 is also involved in DNA repair, angiogenesis, and autophagy, among other biological processes [
29]. The significance of eukaryotic translation initiation factor 6 (eIF6), a regulator of protein translation initiation, and its likely molecular pathways in the development of gliomas are yet unknown, despite the fact that it is believed that eIF6 over expression favours tumour development. EIF6 is substantially expressed in gliomas and has a strong correlation to the degree of malignancy. Patients with high eIF6 levels have a poor prognosis. As a result, eIF6 has the potential to be both a diagnostic biomarker and a therapeutic target for the treatment of glioblastoma (GBM) [
30].
The expression of SEC61Ghas been found to be correlated to the expression of transcription factors such as TLX1, NFKB2, MYB, MLLT11, FOXP2, genes involved in tumor migration, tumor progression and invasion such as BCL7C, KDELR1, MYCN, RPL10 (
Table 2). Tan Xet al firstly discovered that glioma tissues and cell lines have significant levels of CREB expression. In addition to being crucial for gliomagenesis in vivo, CREB is also necessary for glioma cell growth and survival in vitro [
31]. In several cancers, such as acute myeloid leukaemia (AML), cAMP response element-binding protein (CREB), non-small-cell lung carcinoma (NSCLC), breast cancer, and hepatocellular carcinoma (HCC), promotes carcinogenesis [
32]. The protein targeting of ER genes such RPN1, RPL5, and RPL10 by SEC61G was also discovered to be related to cell proliferation and cancer. Wilmstumour and early ovarian failure are both caused by ribosomal protein L10 (RPL10), one of the major ribosomal proteins. RPL10 was up regulated, which led to an increase in cell viability, motility, invasion, and a reduction in cell death [
33]. In breast cancer cohort and glioblastoma, patients with low RPL5 expression had worse overall survival. In a xenograft mouse model, RPL5 knockdown in breast cancer cell lines promoted G2/M cell cycle progression and accelerated tumour growth [
34]. In breast cancer, RPN1 protein expression was likewise elevated. RPN1 expression levels were associated with worse clinical characteristics and a worse prognosis. Furthermore, RPN1 knockdown increased cell death brought on by endoplasmic reticulum stress and reduced the proliferation and invasion of breast cancer cells in vitro [
35].
Immune cells from the innate and adaptive immune systems enter the tumour microenvironment (TME) and help out to control the growth of tumours; therefore, the immune system is crucial to Immunosurveillance [
36,
37,
38]. Basophils, dendritic cells (DCs), eosinophils, mast cells, monocytes, macrophages, neutrophils and Natural killer (NK) cells are innate immune cells that play a role in tumour suppression by either directly destroying tumour cells or by inducing adaptive immune responses [
39,
40,
41]. B cells and T cells are lymphocytes that are part of the adaptive immune system. B cells play a significant role in humoral immune responses, whilst T cells are involved in cell-mediated immune responses [
42]. The high SEC61 expression corresponded to low Neutrophil, CD4+ T cell, B-cell, Macrophage, Monocyte levels suggests an immune suppressive role of SEC61. Here, we conducted a series of SEC61G-correlated gene enrichment analyses and discovered a group of biological structures or processes linked to SEC61G, including Mitochondrial gene expression, Protein targeting, Ribonucleoprotein complex biogenesis, Generation of precursor metabolites and energy, Neutrophil mediated immunity. Sec 61G is a validated target of the hsa-mir-380-5p, miR3126, miR6511b, miR6769a, miR1249-5p, miR-4739, miR550-3p which maybe down regulated in glioblastomas as their down regulation is related to lower survival in glioblastomas. These miRNAs control the transcription of genes taking part in tumor aggression and angiogenesis. Furthermore, the survival analysis of Sec61G shows the lower expression correlated to lower survival probability hsa-mir-380-5p has been studied to control some important cancer progression related gene targets such as MMP16, VEGFA, MET, FOXO, CASP10 and SOD2 which suggest hsa-miR-380-5p may be further explored for miRNA targeted cancer therapy.
Conclusion
Our study indicates that SEC61G expression in GBM patient’s favor tumour progression, which promotes an environment of oxidative stress, while preventing apoptosis. The expression of the mitochondrial metabolic genes PGLS, PGK1, EIF6, and EIF3K which are involved in redox metabolism and CD63 immunoregulation, as well as other genes that promote tumour progression and invasion, including EGFR, LANCL2, BCL2L12, SEC61G-DT, KDELR1, CDKN2A, IFNA16, IFNA10, and BCL7C were positively correlated with the increased/high expression of SEC61G. Our findings suggest that SEC61G associated redox metabolism, complement system as well as immunoregulation can be targeted to develop a potential therapeutic approach for GBM patients. Hence, drugs/ inhibitors that can be designed to inhibit SEC61G and can be modelled and administered to be better able to induce tumor cell death in GBM. This study can be further explored and validated in in vitro and in vivo settings. Future studies should concentrate on SEC61G transcriptional regulation and its clinically association.
Figure 2.
Expression analysis of SEC61G a Box plot shows the SEC61G differential gene expression in GBM VS normal patient dataset with the statically significance (p=2.327e-12) obtained from GEPIA2 tool (here * denote the p-value < 0.01), b Expression of SEC61G across TCGA cancers (with normal and tumor samples) as pan cancer view obtained from the ULCAN web. The expression level of SEC61G gene is represented as log2Transcript per Million (TPM).
Figure 3.
Correlation analysis of SEC61G a A volcano plot showing up regulated as well as down regulated Correlated genes of SEC61G, b, c, d, e, and f shows the spearman's rank correlation of SEC61G associated with metabolic, mitochondrial and immunoregulatory genes respectively were performed by GEPIA2 tool. PGLS and SEC61G were positively correlated (R=0.81), PGK1 and SEC61G were positively correlated (R=0.79), EIF6 and SEC61G were positively correlated (R=0.83), EIF3K and SEC61G were positively correlated (R=0.79) and CD63 and SEC61G were positively correlated (R=0.8) respectively.
Figure 4.
Tumour Immune Infiltration of immune cells (Neutrophil, CD4+ T cell, B-cell, Macrophage, Monocyte) association with SEC61G expression level. The major immune cells found to be negatively correlated with SEC61G obtained from TIMER 2.0.
Figure 4.
Tumour Immune Infiltration of immune cells (Neutrophil, CD4+ T cell, B-cell, Macrophage, Monocyte) association with SEC61G expression level. The major immune cells found to be negatively correlated with SEC61G obtained from TIMER 2.0.
Figure 5.
Network analysis of SEC61G a Gene interaction network of SEC61G with top 50 correlated genes with respect to their biological functions such as protein targeting to membrane, protein targeting to ER, thioester metabolic process, ribosome biogenesis, co-translational protein targeting to membrane, b 17 nearby genes that co-expressed with SEC61G c and d with and without text mining cancer gene census interacts with SEC61G. Circles signify genes, lines reflect the interactions of proteins between genes, and the colour of the lines indicates the strength of those interactions.
Figure 6.
Result of functional clustering from DAVID database shows the reported function of SEC61G and enriches dataset represented in green colour box and black colour denoted the corresponding gene term association is not reported yet.
Figure 6.
Result of functional clustering from DAVID database shows the reported function of SEC61G and enriches dataset represented in green colour box and black colour denoted the corresponding gene term association is not reported yet.
Figure 7.
Gene Ontology of SEC61G a Gene Ontology enrichment analysis of the differentially expressed genes according to biological process. Blue colour denoted high expression and orange colour denoted low expression, b Gene Set Enrichment Analysis (GSEA) Data of SEC61G correlation with mitochondrial gene expression and neutrophil mediated immunity have been shown in this wiki pathway. According to fold enrichment, the full gene set was ranked.
Figure 8.
miRNA targeting SEC61G a Network represented all the miRNA targeting SEC61G. Orange colour denoted the gene (SEC61G) and blue colour denoted corresponding miRNA, b The experimentally validated gene targets of SEC61G, c the RPM expression of the 8 miRNA targetingSEC61G in Glioblastoma patients, d gene ontology of the targets of hsa-miR-380-5p.
Figure 9.
The network of genes targeted by the miRNA targeting SEC61G a miR3126 b miR6511b c miR6769a d miR1249-5p e miR-4739 and f miR550-3p. Few genes targeted by these miRNA including tumor promoting genes such as MMP16, VEGFA, Met, FOXO, CASP10 and SOD2.
Figure 9.
The network of genes targeted by the miRNA targeting SEC61G a miR3126 b miR6511b c miR6769a d miR1249-5p e miR-4739 and f miR550-3p. Few genes targeted by these miRNA including tumor promoting genes such as MMP16, VEGFA, Met, FOXO, CASP10 and SOD2.
Figure 10.
Survival Analysis of miRNAs a miR-380, b miR-3126, c miR-6769a, d miR-6511b-2 e miR-6769a and f miR-1249. Lower expression of miR-3126 shows lower survival of glioblastoma patients among all targeted miRNAs. .
Figure 10.
Survival Analysis of miRNAs a miR-380, b miR-3126, c miR-6769a, d miR-6511b-2 e miR-6769a and f miR-1249. Lower expression of miR-3126 shows lower survival of glioblastoma patients among all targeted miRNAs. .
Figure 11.
Kaplan-Meier plot of Overall Survival analysis of differentially expressed SEC61G gene in GBM patient. Red colored line represents 114 patients having low expression of SEC61G shown good survival rate and green colored line represents 38 patients having high expression of SEC61G and poor survival rate in GBM patient.
Table 2.
SEC61G expression is associated with a variety of oncogenes.
Table 2.
SEC61G expression is associated with a variety of oncogenes.
| Genes |
Function |
Spearman Correlation |
P-value |
FDR (BH) |
Event SD |
| BCL7C |
cell proliferation and invasion |
4.39e-01 |
1.39e-08 |
2.15e-06 |
1.53e+02 |
| BCL2L12 |
anti-apoptotic protein |
4.37e-01 |
1.60e-08 |
2.29e-06 |
1.53e+02 |
| KDELR1 |
cell proliferation |
5.07e-01 |
2.17e-11 |
3.28e-08 |
1.53e+02 |
| CD63 |
tumor invasion and metastasis |
4.26e-01 |
4.20e-08 |
4.03e-06 |
1.53e+02 |
| MYCN |
Cell proliferation and DNA synthesis |
-1.09e-01 |
1.78e-01 |
3.16e-01 |
1.53e+02 |
| AKT2 |
Encodes a protein-serine/threonine kinase |
2.57e-01 |
1.37e-03 |
8.04e-03 |
1.53e+02 |
| AKT1 |
Cell growth, division, and invasion |
2.15e-01 |
7.49e-03 |
2.96e-02 |
1.53e+02 |
| BCL2 |
Block apoptosis (programmed cell death |
-1.28e-01 |
1.15e-01 |
2.30e-01 |
1.53e+02 |
| FOXP2 |
Transcription factor in neural development |
-3.55e-01 |
6.61e-06 |
1.48e-04 |
1.53e+02 |
| CREB1 |
Proto-oncogene |
-7.54e-02 |
3.54e-01 |
5.11e-01 |
1.53e+02 |
| BCL3 |
Block apoptosis (programmed cell death |
2.39e-01 |
3.02e-03 |
1.47e-02 |
1.53e+02 |
| SMO |
Proto-oncogene of neuroectodermal |
8.09e-02 |
3.20e-01 |
4.77e-01 |
1.53e+02 |
| MYB |
Transcription factor; Encodes fibroblast growth factor |
-2.42e-01 |
2.59e-03 |
1.31e-02 |
1.53e+02 |
| MLLT11 |
Transcription factor/methyltransferase |
-2.10e-01 |
9.38e-03 |
3.52e-02 |
1.53e+02 |
| EGFR |
Cell surface receptor, triggers cell growth through tyrosine kinase activity |
4.52e-01 |
6.49e-09 |
1.27e-06 |
1.53e+02 |
| NFKB2 |
Transcription factor |
-1.85e-01 |
2.21e-02 |
6.75e-02 |
1.53e+02 |
| TIAM1 |
Guanine nucleotide exchange factor |
-4.00e-01 |
3.95e-07 |
1.89e-05 |
1.53e+02 |
| MDM2 |
Inhibits and leads to the degradation of p53 |
1.98e-01 |
1.43e-02 |
4.86e-02 |
1.53e+02 |
| MDM4 |
Inhibits and leads to the degradation of p53 |
6.48e-02 |
4.26e-01 |
5.79e-01 |
1.53e+02 |
| TLX1 |
Transcription factor; aka HOX |
-1.87e-01 |
2.09e-02 |
6.47e-02 |
1.53e+02 |
| RPL10 |
cell proliferation and carcinogenesis |
3.54e-01 |
7.34e-06 |
1.58e-04 |
1.53e+02 |
