2. Materials and Experimental Procedures
Walsin Lihwa Corporation prepared the 316SS cast billet with a diameter of 250 mm. The chemical composition in wt% of the 316L cast billet was 0.020 C, 0.131 Co, 18.149 Cr, 0.115 Cu, 1.849 Mn, 2.622 Mo, 0.046 N, 11.376 Ni, 0.025 P, 0.013 S, 0.942 Si, 0.101 V and Fe balance. The cast billet was wire-cut and machined to obtain test pieces with a cross-section of approximately 10 mm × 10 mm and 5 mm thick. For comparison, three samples, i.e., near surface, 1/2 radius, and center, were machined from the cast billet.
To evaluate the effect of homogenization heat treatment on 316SS cast billet, three types, namely, no heat treatment, 2 hours heat treatment, and 6 hours heat treatment for comparison. The test piece was placed into a tubular high-temperature vacuum furnace to avoid oxidation during the heat treatment. The homogenization heat treatment was performed at 1240 °C at a vacuum of 5×10
-4 mbar. The heating rate of the high-temperature vacuum furnace was 20 °C/min, and the holding period was 2 and 6 hours, respectively. Different cooling rates were performed after the test pieces were homogenized at 1240 °C.
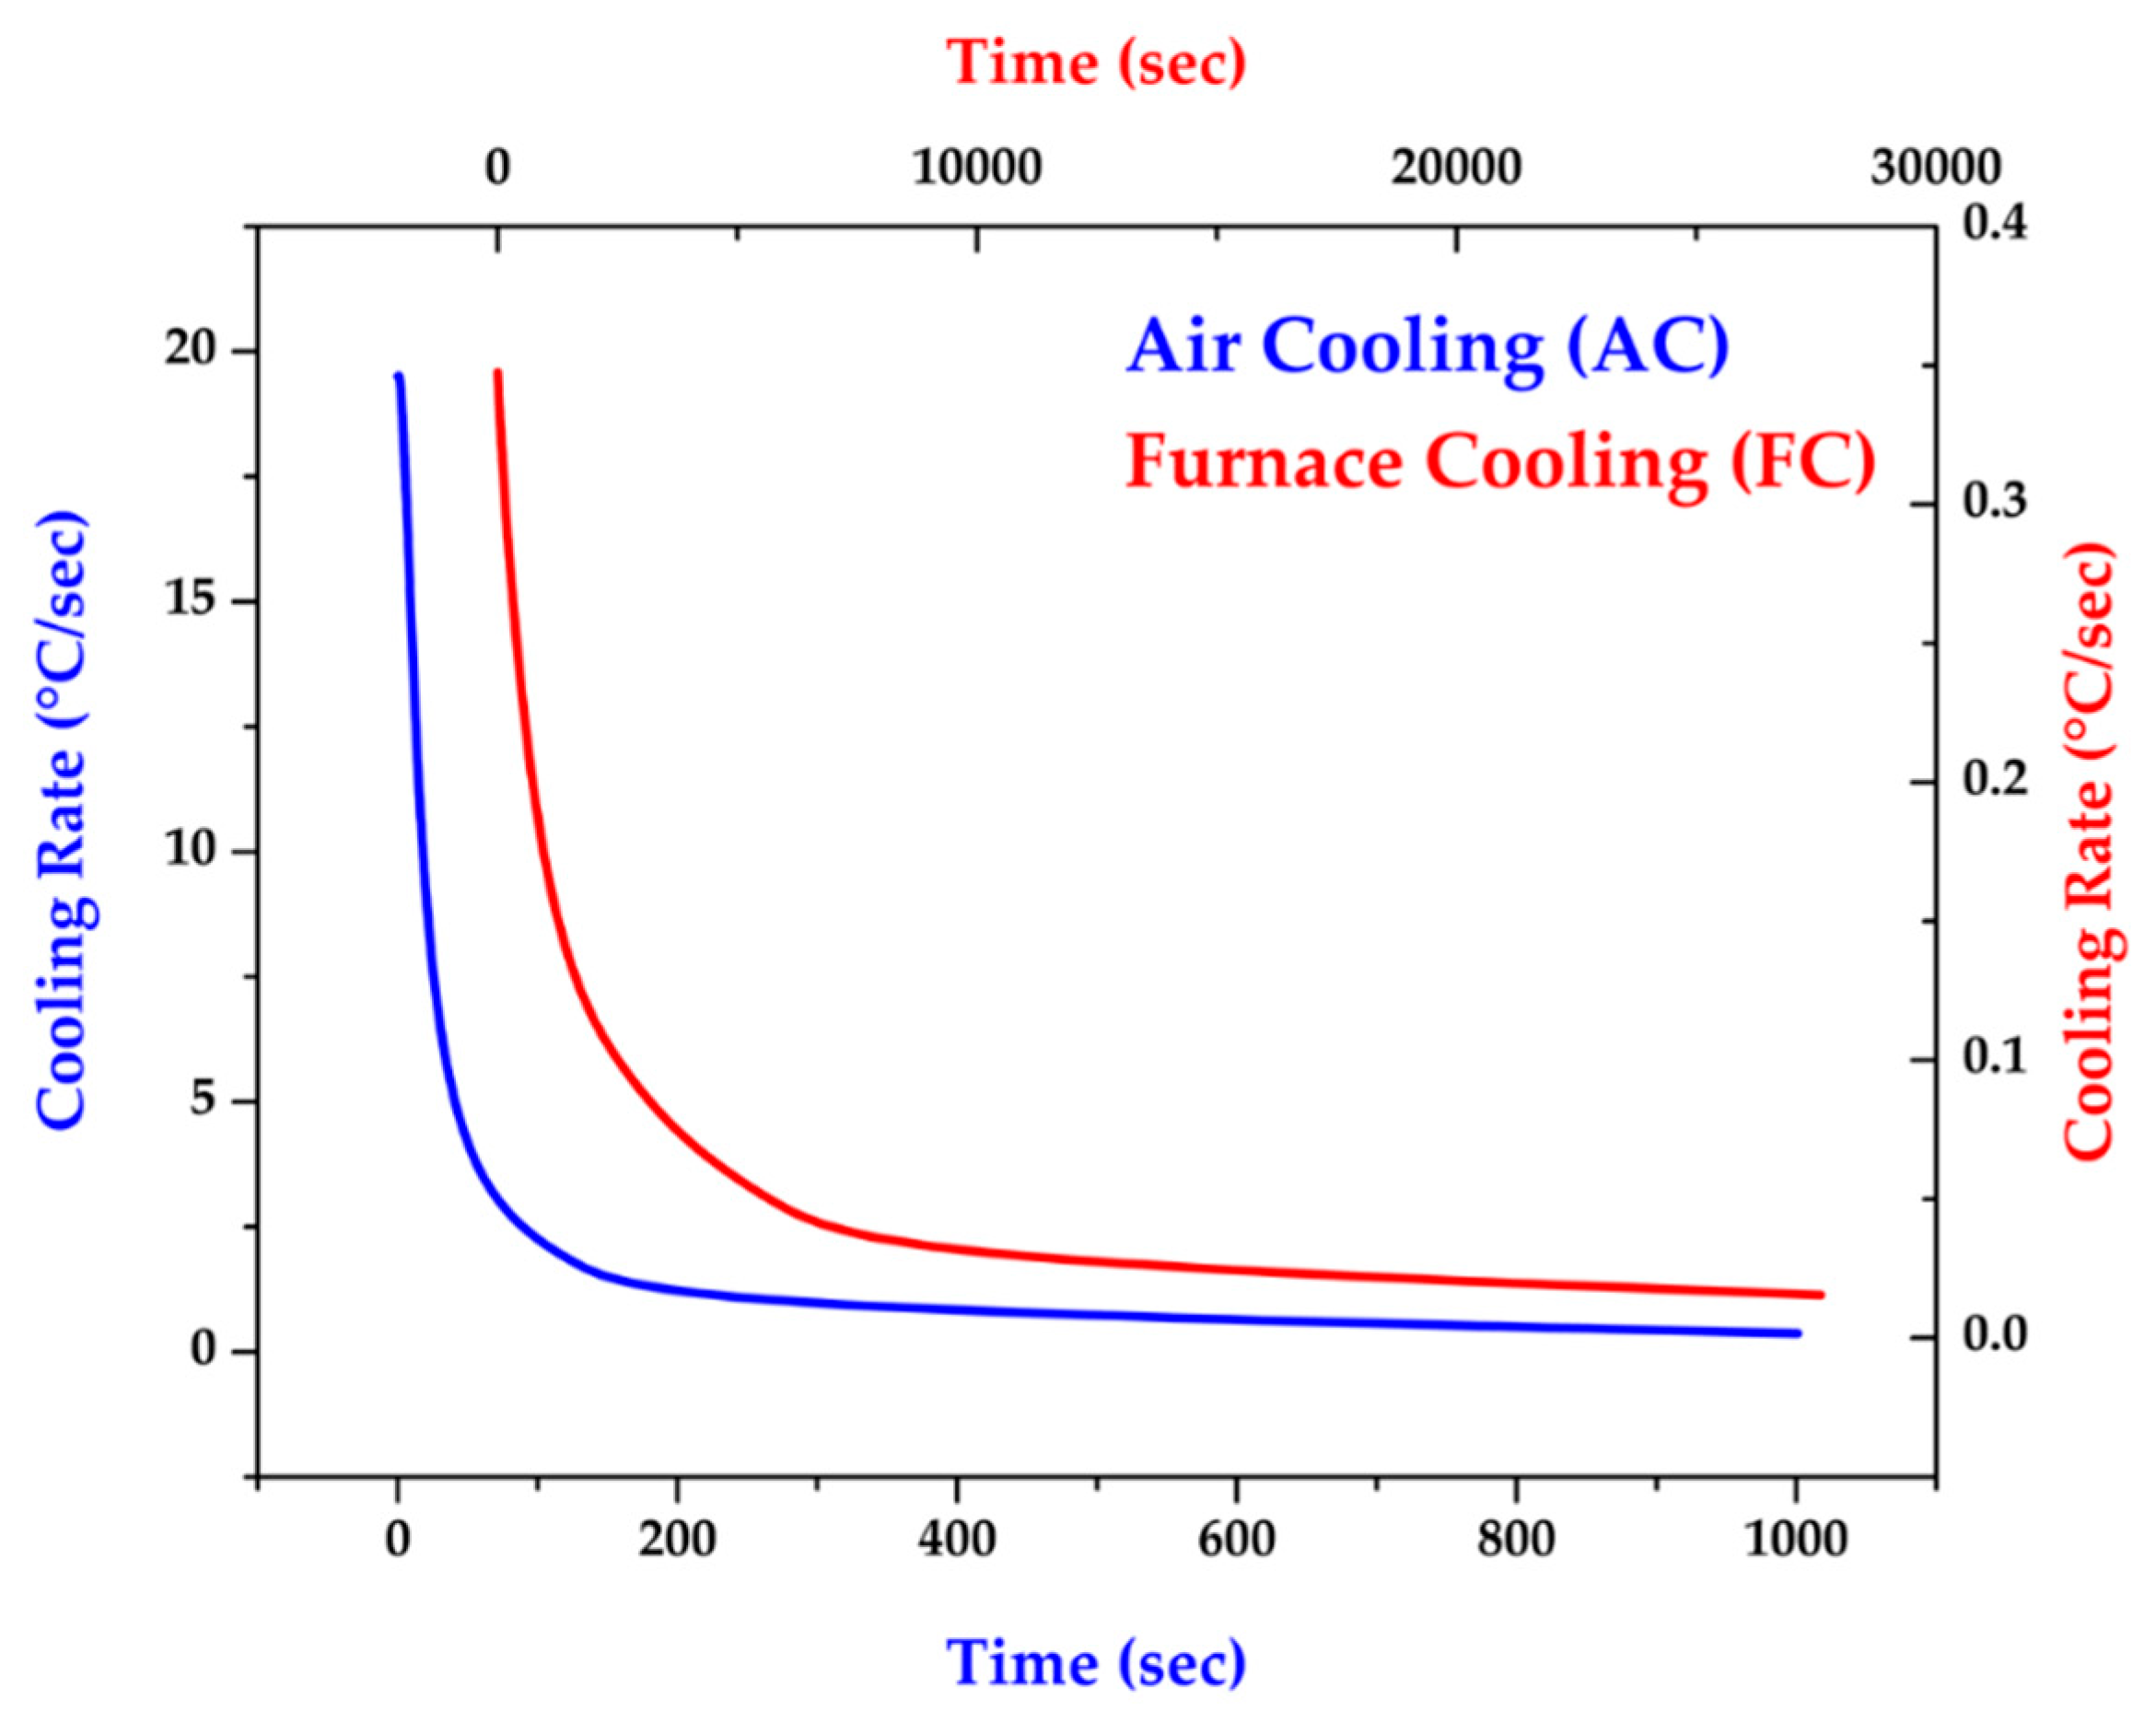
Figure 1 shows two different cooling rates used in the experiment: air cooling (AC) and furnace cooling (FC).
Table 1 shows all 316L specimen designations used in the study.
All test pieces were mounted and experienced a standard metallographic procedure before inspection. A field emission scanning electron microscope (FESEM) with an electron backscatter diffraction (EBSD) was applied to perform phase identification and crystallographic analyses. A field emission electron probe microanalyzer (FE-EPMA) combined with a wavelength dispersive spectrometer (WDS) was used to perform quantitative chemical analyses of selected positions and mappings of the test pieces. Finally, a Vickers microhardness tester with a load of 10 g and 15 s duration time was used to measure the difference in hardness for various phases.
3. Results and Discussion
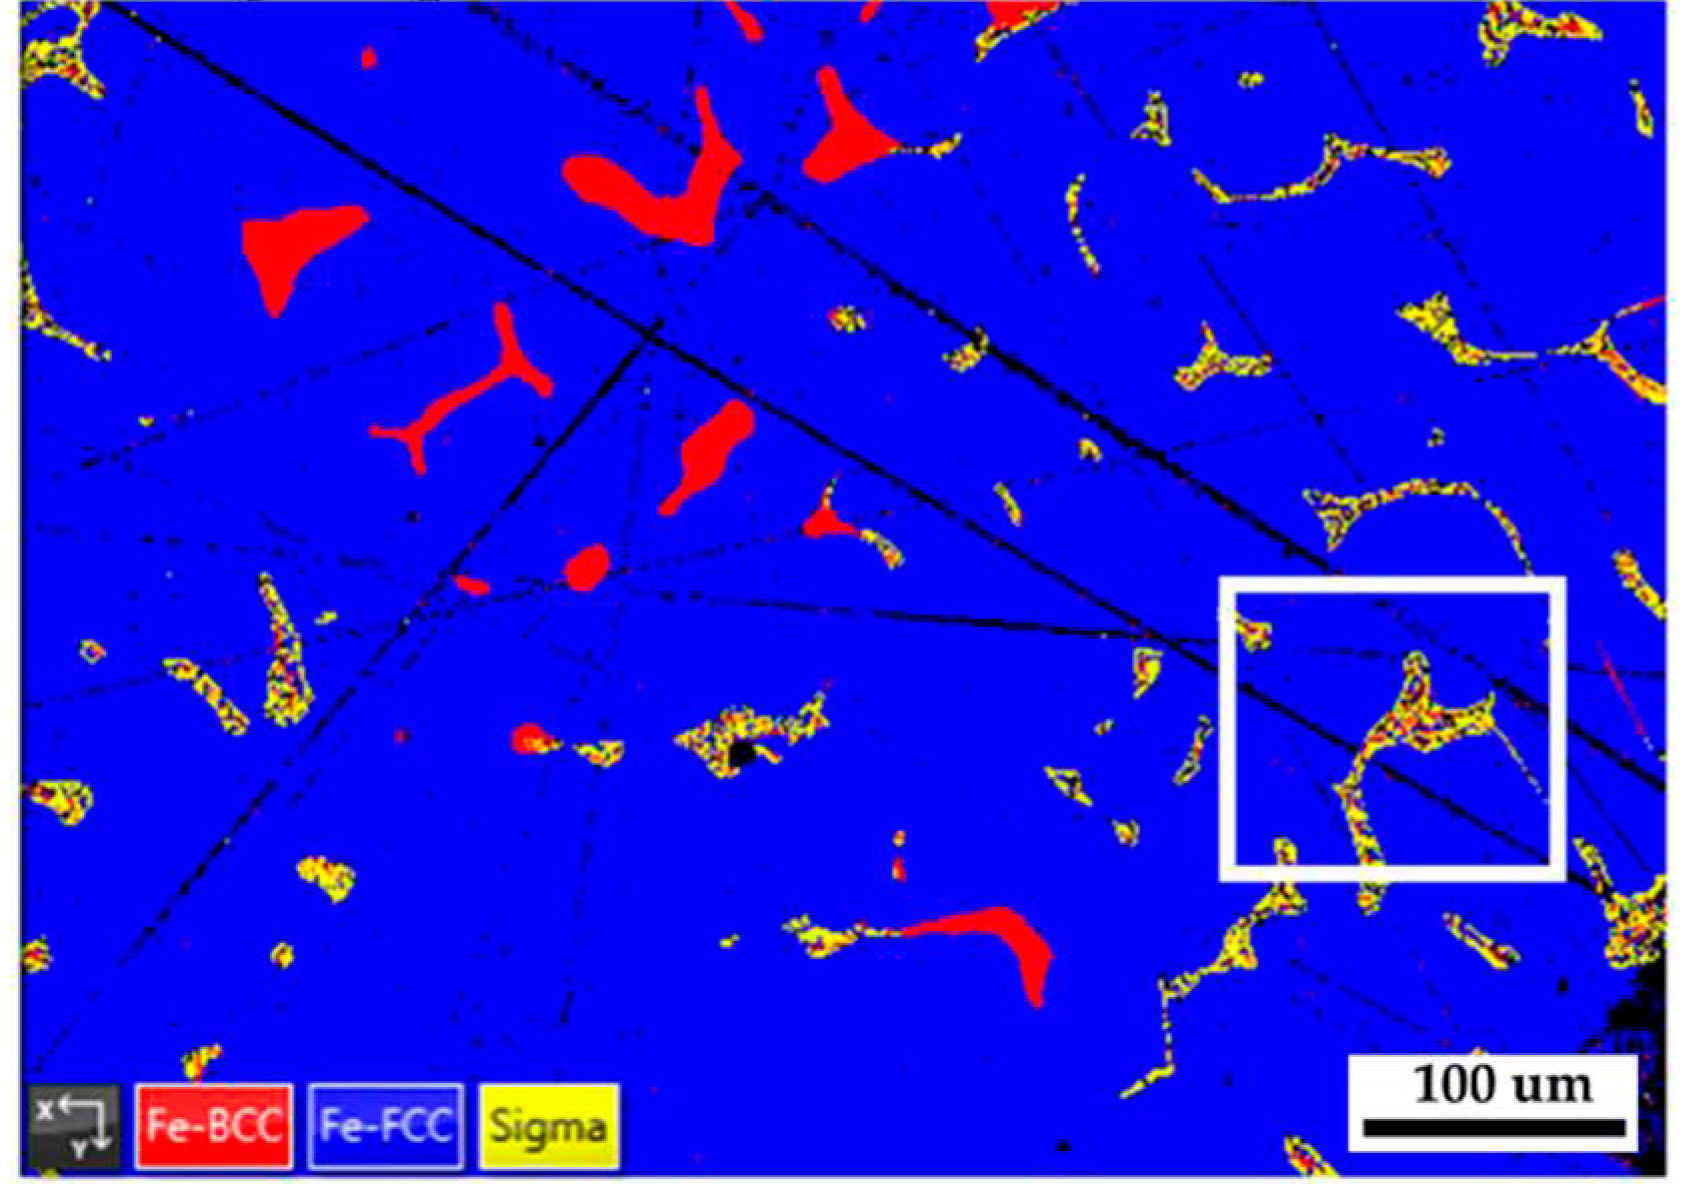
Figure 2 shows EBSD phase maps of the as-cast 316L stainless steel billet at different locations. The as-cast billet has three phases, including δ ferrite, sigma, and austenite. The microstructure of the three locations is quite different due to different cooling rates in casting. In
Figure 2a, fragmented δ ferrite (red) is observed in the austenite (blue) matrix in the center of the cast billet. In
Figure 2b, the flaky δ ferrite and sigma phase distribution is still quite uneven at 0.5 R. The distribution of flaky δ ferrite and sigma phases is improved at the location of R, as displayed in
Figure 2c. In
Figure 2c, the amount of sigma phase is significantly decreased, and the flaky δ ferrite becomes blunt at location R. Different microstructures of the cast billet at different locations are expected to result in different responses in the subsequent hot/cold rolling. It is required to perform a homogenization treatment of the cast billet before rolling.
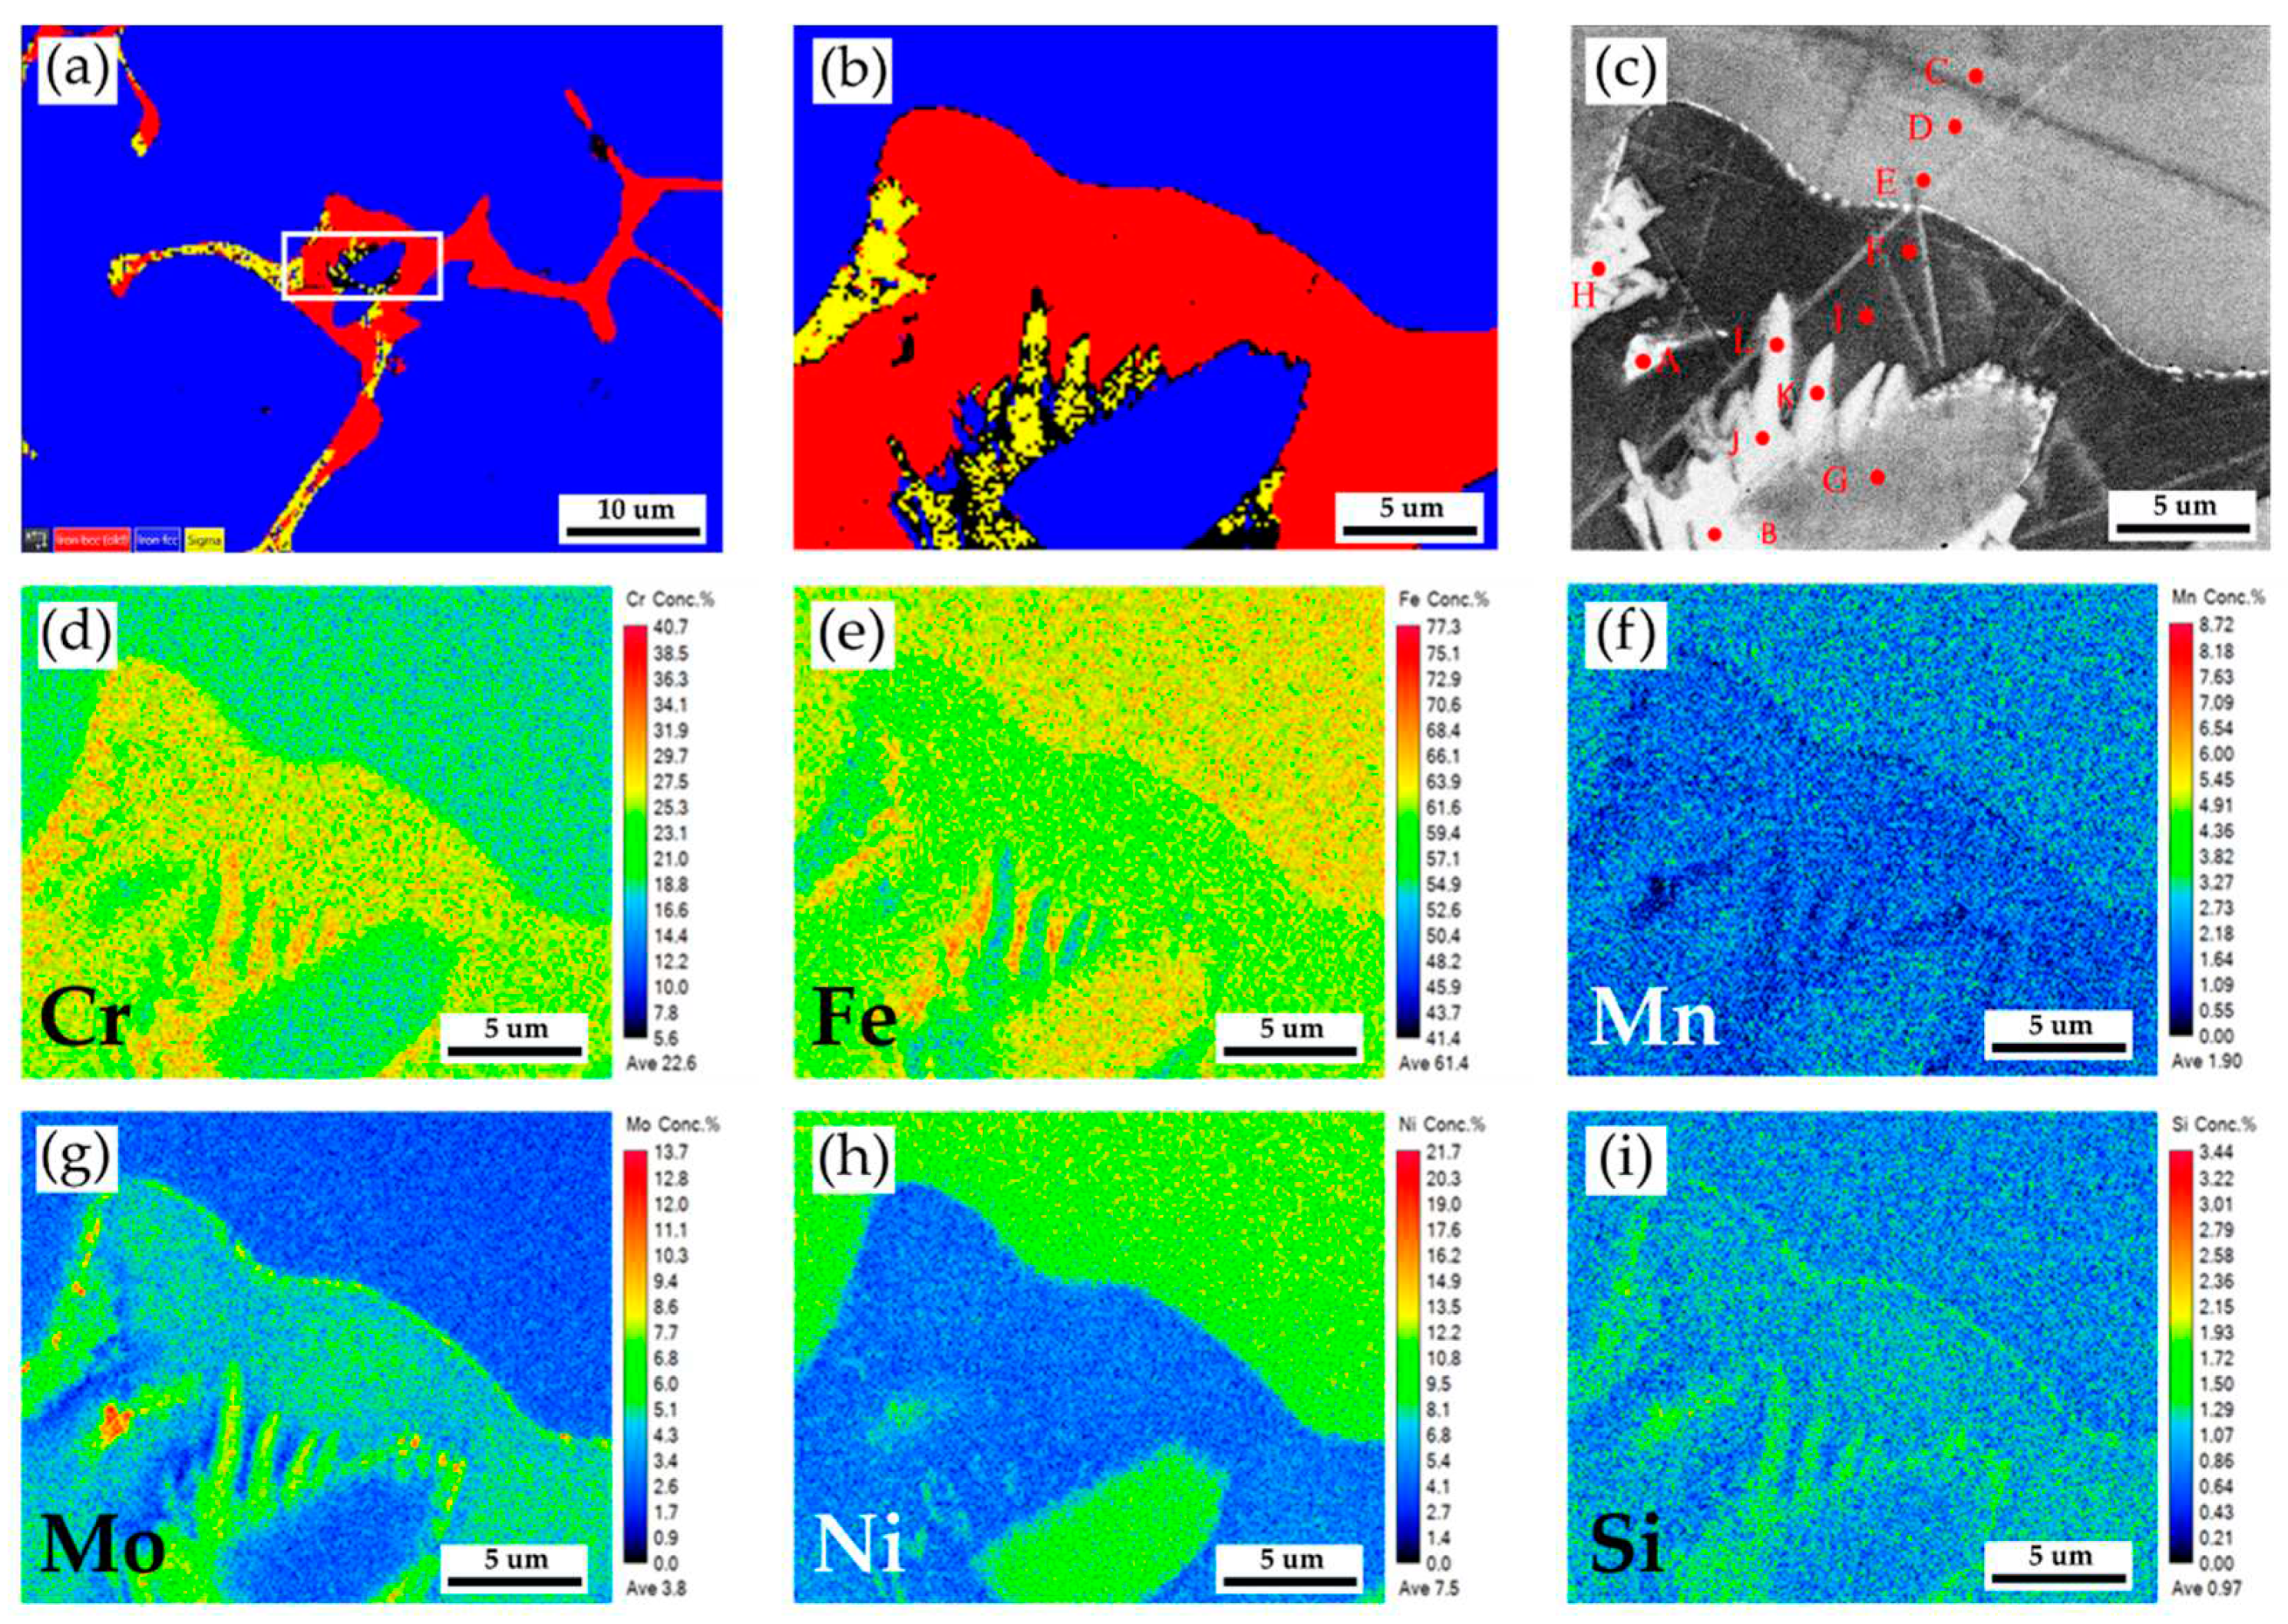
Figure 3a,b show EBSD phase maps of the as-cast 316L stainless steel billet at 0.5R at higher magnifications. The sigma phase (yellow) is mixed with the δ ferrite (red) in the austenite matrix (blue). The EBSD phase map in
Figure 3b corresponds to the EPMA BEI displayed in
Figure 3c. The EPMA WDS quantitative chemical analysis spots at different locations are shown in
Figure 3c and
Table 2. According to
Table 2, concentrations of Cr, Mo, and Ni are pretty different in the three phases of the cast billet. The austenite is alloyed with high Ni (> 10 at%), low Mo (< 3 at%) and Cr (< 20 at%) concentrations, as marked by C, D, E, and G in
Figure 3c. In contrast, the δ ferrite and sigma phases are alloyed with a low concentration of Ni (< 5 at%) and a high concentration of Cr (> 25 at%) as marked by B, F, H ~ L in
Figure 3c. The Cr concentrations of the δ ferrite and sigma phases are similar, approximately between 25 and 29 at%. However, Mo concentration in the sigma phase is higher than in the δ ferrite, as displayed in
Table 3. It has been reported that the presence of Mo is attributed to the formation of the sigma phase in the stainless [
29]. It is consistent with the experimental result.
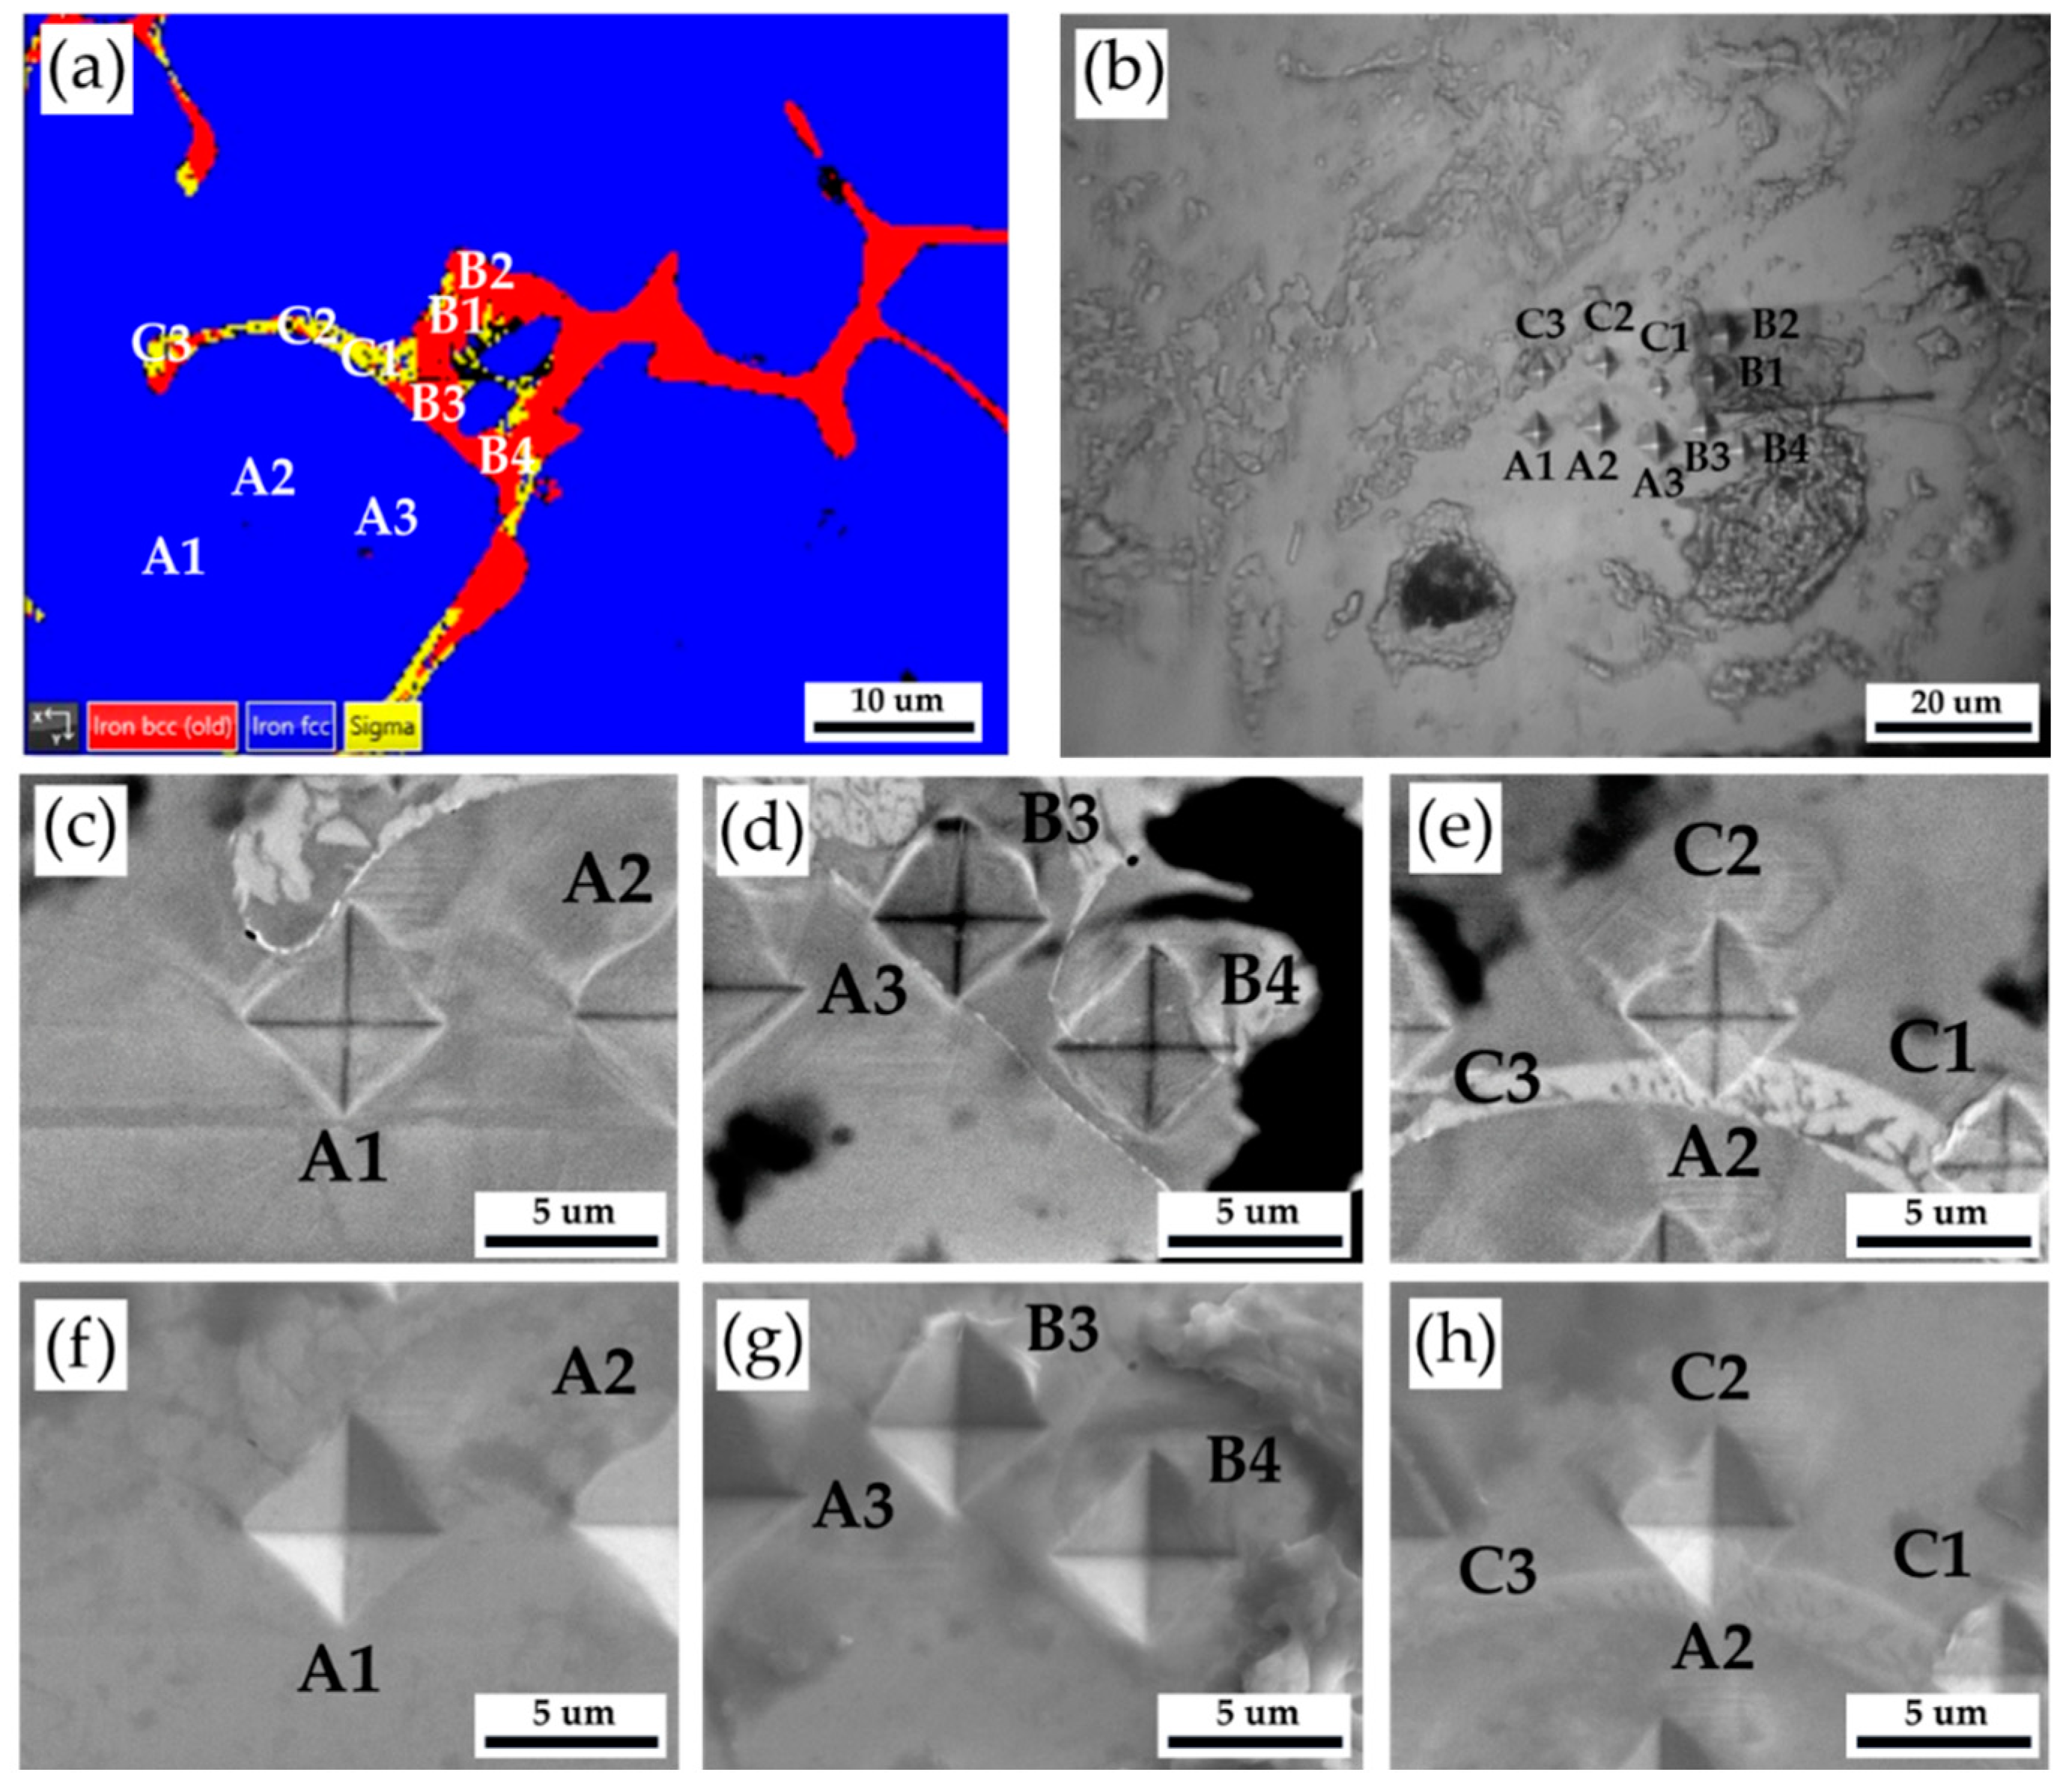
Figure 4 and
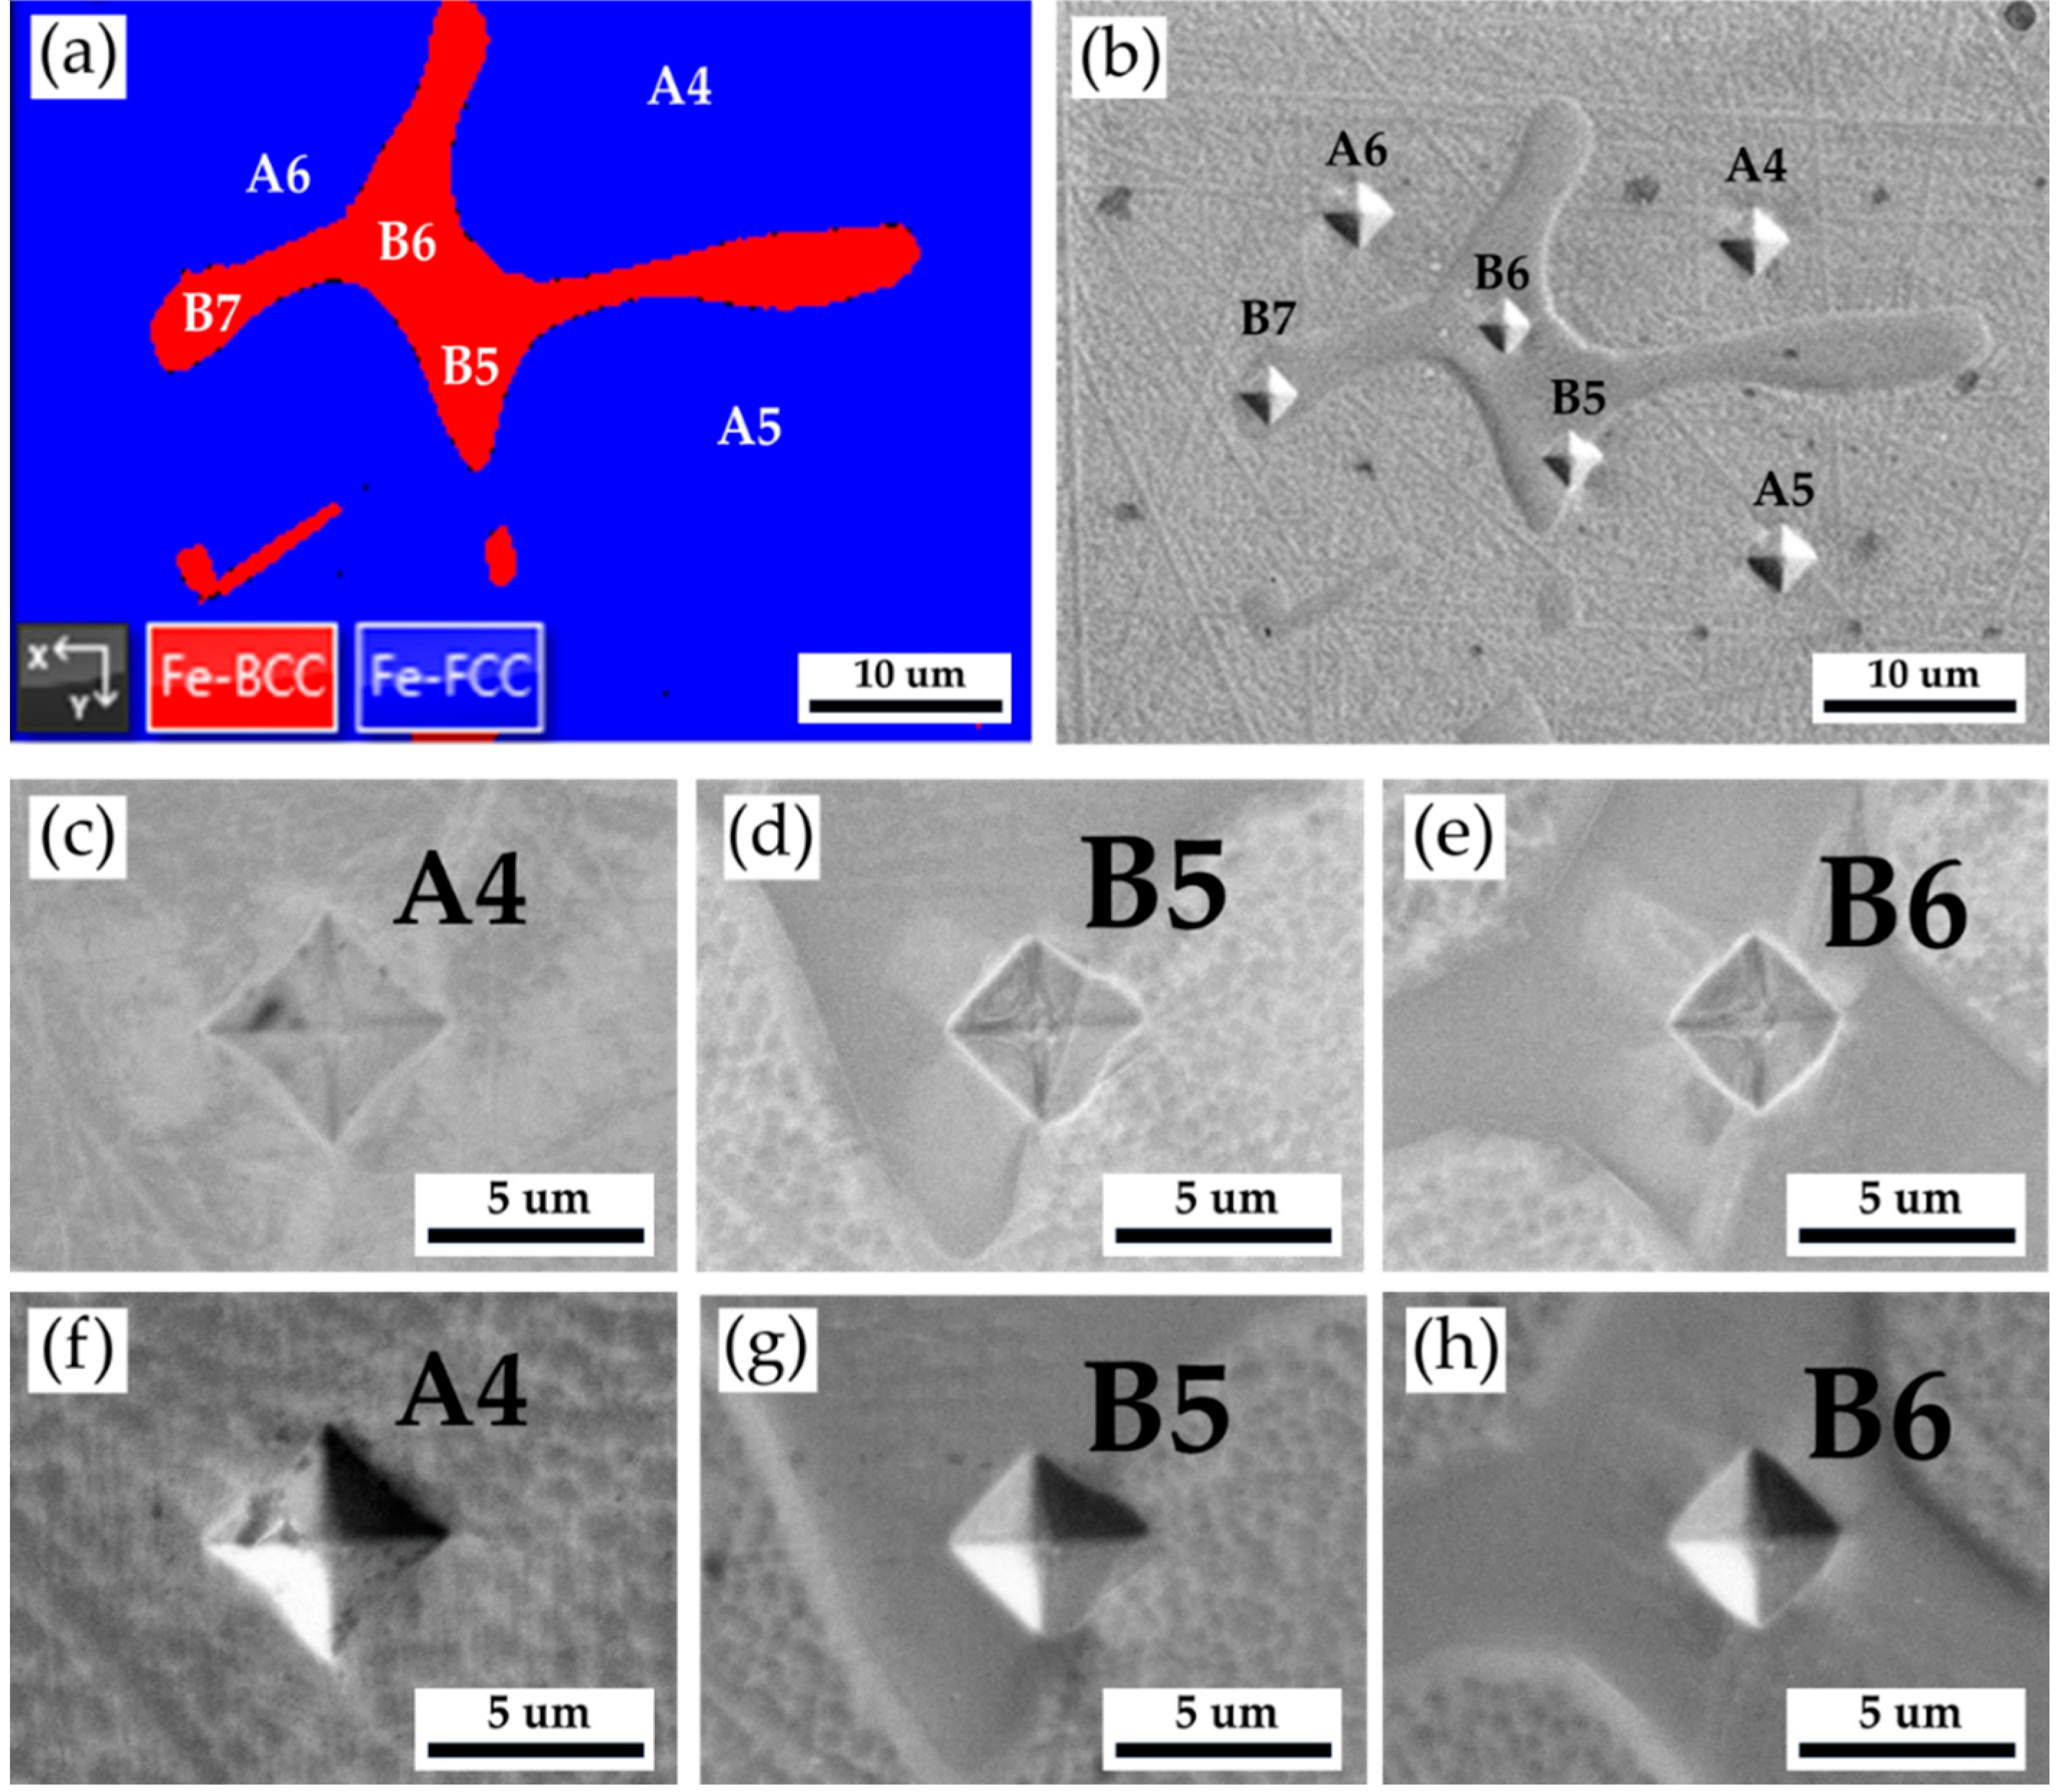
Table 3 show Vickers hardness measurement results of the as-cast 316L stainless steel billet at 0.5 R. The EBSD phase map in
Figure 4a corresponds to the optical microscope image with Vickers hardness dents in
Figure 4b. The austenite has the lowest hardness below 200 Hv, as illustrated by A1 ~ A3. The hardness of δ ferrite, above 200 Hv, is greater than that of austenite, as shown by B1 ~ B4. The sigma phase has the highest hardness among all phases. However, a considerable variation is observed in the hardness measurement of the sigma phase, as shown in C1 ~ C3. The hardness values of the sigma phase are between 314 and 487. Because the size of the sigma phase is less than that of Vickers hardness dent under the applied load of 10 g, both sigma and δ ferrite are covered by the hardness dent, as shown in
Figure 4e. In
Figure 4e, the hardness dent at location C1 covers the most significant fraction of the white sigma phase, and it has the highest Vickers hardness of 487. It is confirmed that the sigma phase has the highest hardness in the cast billet.
Figure 4.
The Vickers hardness measurements of the as-cast 316L stainless steel billet at 0.5 R: (a) EBSD phase map in the selected area in
Figure 3a, (b) the corresponding optical microscope image with Vickers hardness dents of
Figure 4a, Vickers hardness dents of EPMA (c ~ e) BEIs, (f ~ h) SEIs.
Figure 4.
The Vickers hardness measurements of the as-cast 316L stainless steel billet at 0.5 R: (a) EBSD phase map in the selected area in
Figure 3a, (b) the corresponding optical microscope image with Vickers hardness dents of
Figure 4a, Vickers hardness dents of EPMA (c ~ e) BEIs, (f ~ h) SEIs.
Table 3.
Vickers hardness measurements displayed in
Figure 4.
Table 3.
Vickers hardness measurements displayed in
Figure 4.
| Location |
A1 |
A2 |
A3 |
B1 |
B2 |
B3 |
B4 |
C1 |
C2 |
C3 |
| Hv (10 g) |
196 |
171 |
184 |
200 |
214 |
251 |
260 |
487 |
314 |
328 |
Figure 5 shows EBSD phase maps of the 316L stainless steel cast billet after homogenization at 1240
oC for 2 hours and air cooling at three locations: center, 0.5 R, and R. The sigma phase has almost disappeared from the entire cast billet. The blunting of the flaky δ ferrite is widely observed at three locations of the cast billet. However, the distribution of δ ferrite at the center and 0.5 R is still less uniform than that at R. The homogenization heat treatment effectively improves the flaky δ ferrite into a blunt one at all locations. The homogenization heat treatment shows the best effect of spheroidizing δ ferrite at the location R of the cast billet. It is worth mentioning that the fast air cooling of the cast billet after 1240
oC for 2h homogenization heat treatment is beneficial to avoid the formation of the sigma phase in the entire 316L cast billet.
Figure 5.
EBSD phase maps of the 316L stainless steel cast billet after homogenization at 1240 oC for 2 hours with air cooling at different locations: (a) C-2h-AC, (b) 0.5 R-2h-AC, (c) R-C-2h-AC.
Figure 5.
EBSD phase maps of the 316L stainless steel cast billet after homogenization at 1240 oC for 2 hours with air cooling at different locations: (a) C-2h-AC, (b) 0.5 R-2h-AC, (c) R-C-2h-AC.
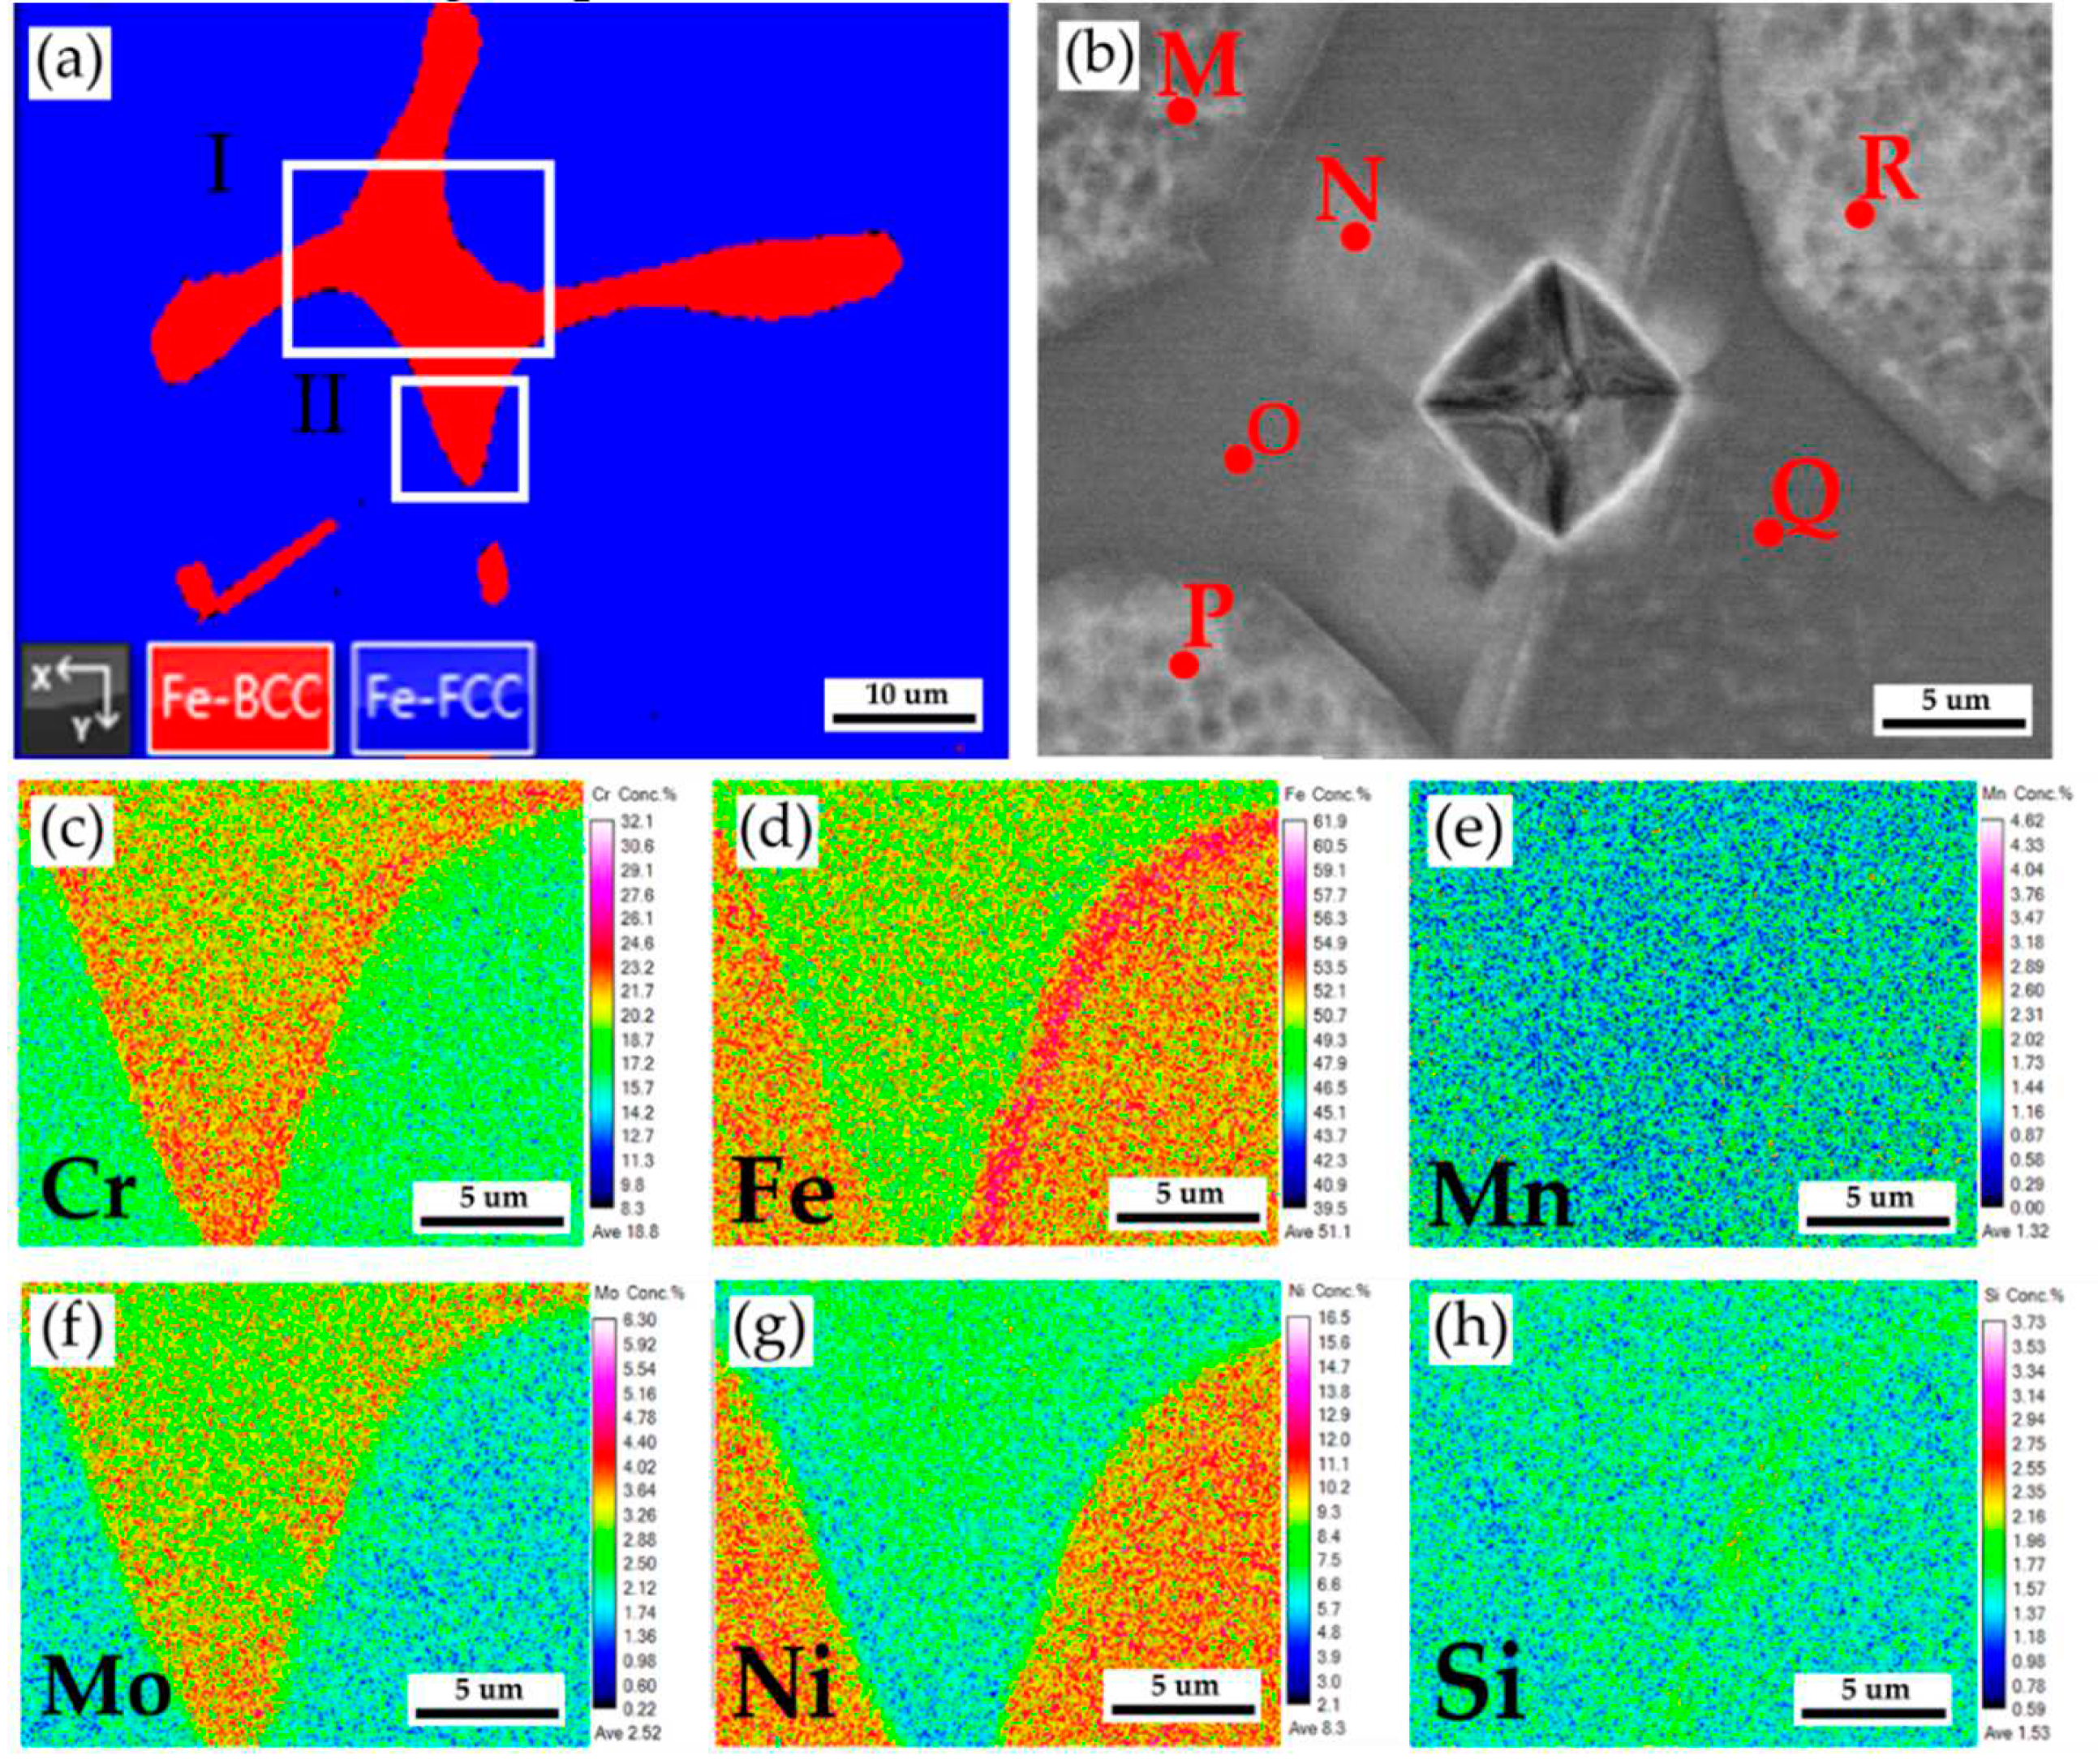
Figure 6a displays EBSD phase maps of the 316L stainless steel cast billet after homogenization at 1240
oC for 2 hours and air cooling at 0.5 R at higher magnifications. The sigma phase disappeared from the figure due to the fast air cooling after homogenization. The area I of the EBSD phase map in
Figure 6a corresponds to the EPMA BEI displayed in
Figure 6b. The EPMA WDS quantitative chemical analysis spots at different locations are shown in
Figure 6b and
Table 3. Similar to the results above, the austenite is alloyed with high Ni (> 10 at%), low Mo (< 3 at%) and Cr (< 20 at%) concentrations, as marked by M, P, and R in
Figure 6b. On the other hand, the δ ferrite is alloyed with a low concentration of Ni (< 7.4 at%) and a high concentration of Cr (> 21.9 at%) as marked by N, O, and Q in
Figure 6b. The Mo concentration in the δ ferrite is slightly higher than in the austenite, as shown in
Table 3.
Figure 6c–h are EPMA WDS quantitative element mappings of Cr, Fe, Mn, Mo, Ni, and Si, consistent with
Table 3. It is noted that the Cr and Mo are enriched in the δ ferrite close to the interface between the δ ferrite and austenite. The δ ferrite alloyed with high Cr and Mo concentrations favors the sigma phase formation and will be discussed later.
Figure 6.
The cast 316L stainless steel billet at 0.5 R after homogenization at 1240
oC for 2 hours with air cooling: (a) EBSD phase map in selected area of
Figure 5b, (b) EPMA BEI and quantitative chemical analyses of different locations in area I of
Figure 6a, (c~h) EPMA WDS quantitative element mappings of Cr, Fe, Mn, Mo, Ni, and Si in the area II of
Figure 6a.
Table 4.
EPMA WDS quantitative chemical analyses in at% of M~ R in
Figure 6b.
Table 4.
EPMA WDS quantitative chemical analyses in at% of M~ R in
Figure 6b.
| Element /at% |
C |
Cr |
Fe |
Mn |
Mo |
Ni |
O |
P |
Si |
Si |
Phase |
| M |
0.1 |
18.8 |
65.4 |
1.5 |
2.4 |
10.9 |
0.0 |
0.0 |
0.1 |
0.8 |
austenite |
| N |
0.2 |
23.7 |
62.6 |
1.2 |
4.1 |
7.1 |
0.0 |
0.1 |
0.1 |
0.9 |
δ ferrite |
| O |
0.2 |
23.6 |
62.6 |
1.4 |
4.1 |
6.9 |
0.0 |
0.1 |
0.1 |
1.0 |
δ ferrite |
| P |
0.1 |
18.3 |
65.8 |
1.4 |
2.4 |
11.1 |
0.0 |
0.0 |
0.1 |
0.8 |
austenite |
| Q |
0.2 |
21.9 |
64.1 |
1.3 |
3.9 |
7.4 |
0.0 |
0.1 |
0.1 |
1.0 |
δ ferrite |
| R |
0.2 |
18.1 |
65.6 |
1.5 |
2.5 |
11.1 |
0.0 |
0.0 |
0.1 |
0.9 |
austenite |
Figure 7 and
Table 5 display the Vickers hardness measurements of the as-cast 316L stainless steel billet at 0.5 R after homogenization at 1240
oC for 2 hours and air cooling. The EBSD phase map in
Figure 7a corresponds to the EPMA SEI with Vickers hardness dents in
Figure 7b. The hardness of austenite is below 200 Hv. The hardness of δ ferrite is higher than 200 Hv, i.e., between 200 and B7. The homogenization heat treatment does not significantly change the hardness of austenite and δ ferrite compared to
Table 3 and
Table 5.
Figure 8 shows the EBSD phase map of the 316L stainless steel cast billet after homogenization at 1240
oC for 2 hours and furnace cooling at location 0.5 R. The blunting of the flaky δ ferrite shown in
Figure 8 is not apparent in the slow furnace cooling condition compared to the fast air cooling one, as shown in
Figure 5b. A slow furnace cooling rate also forms a vast amount of sigma phase in the cast billet. According to
Figure 8, many δ ferrite islands are partially transformed into the sigma phase, and only a few blocky δ ferrites are left in the austenite matrix.
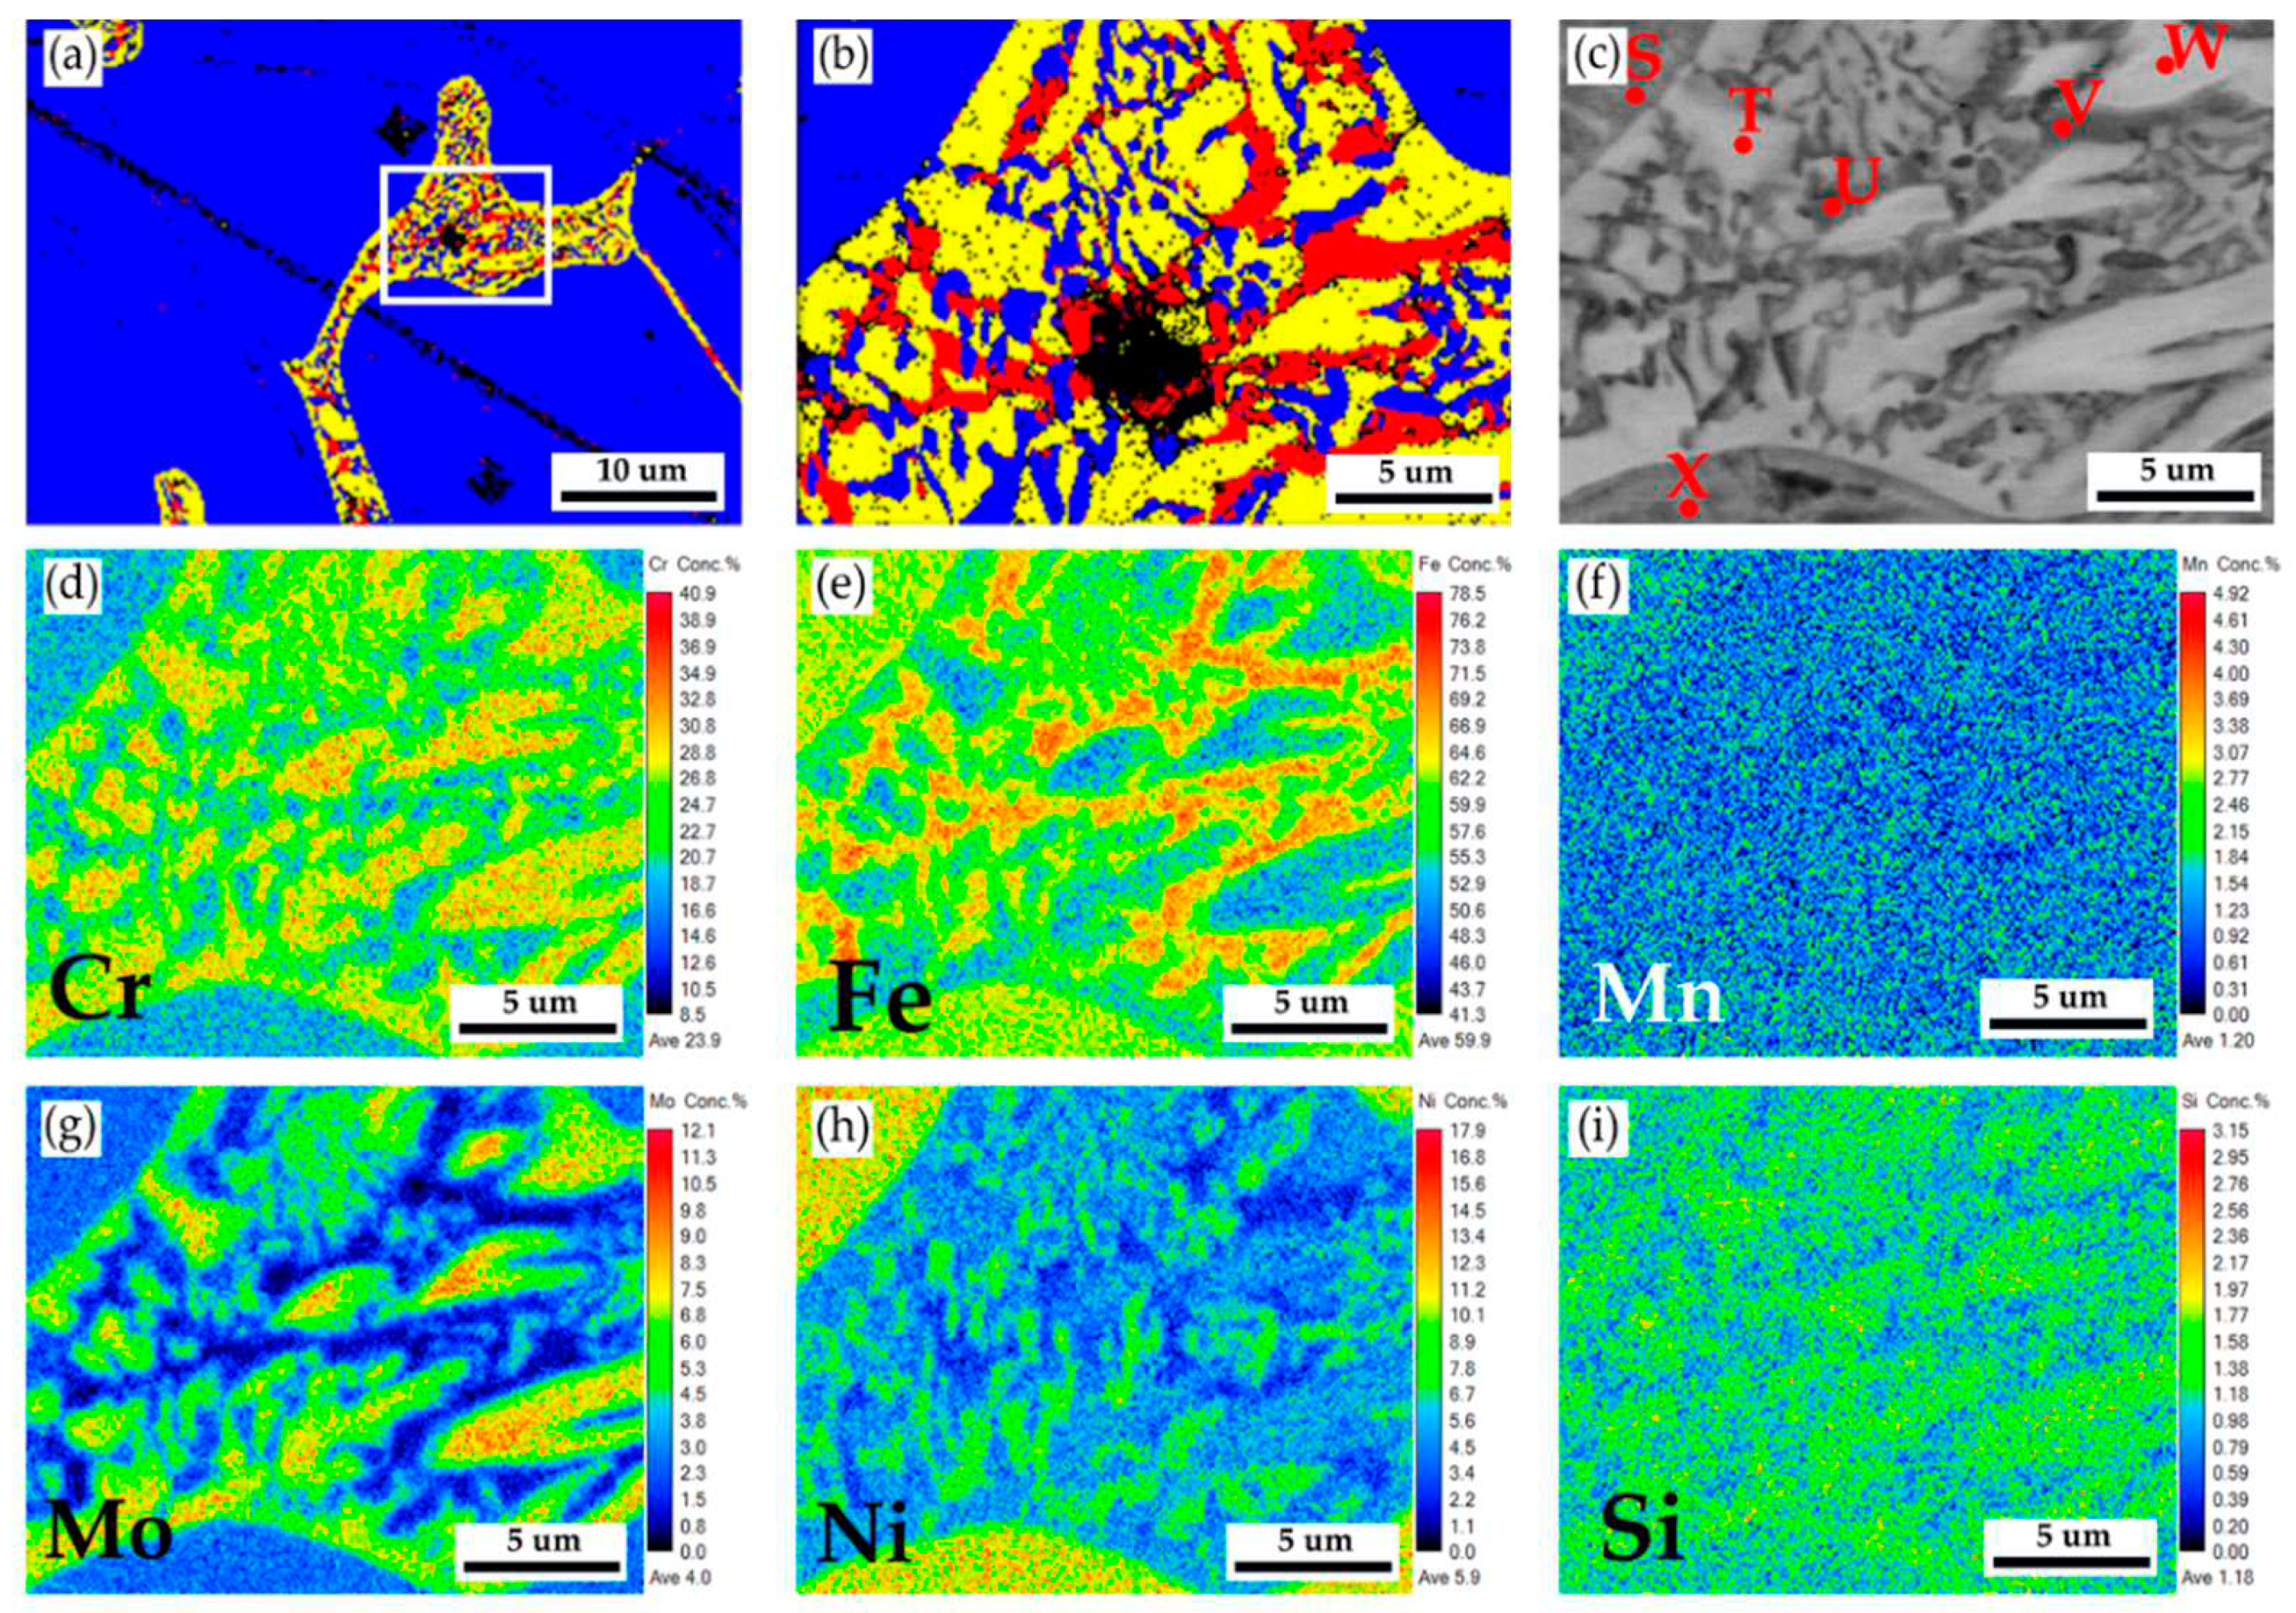
Figure 9a is the EBSD phase map of the selected area in
Figure 8, and
Figure 9b is the EBSD phase map at a higher magnification than
Figure 9a.
Figure 9b shows a mixture of blue austenite, red δ ferrite, and yellow sigma phases in the original δ ferrite island. The original δ ferrite has partially decomposed into an austenite and sigma phases.
Figure 9c and
Table 6 display EPMA BEI and quantitative chemical analyses of different locations. The austenite is alloyed with high Ni (> 10 at%), low Mo (< 3 at%) and Cr (< 19 at%) concentrations, as marked by S and X in
Figure 9c. Both δ ferrite and sigma phases have low Ni (< 5 at%) and high Cr (> 20 at%) concentrations, as observed by T, U, V, and W in
Figure 9c. However, the sigma phase is alloyed with the highest Cr (> 26 at%) and Mo (> 7 at%) concentrations, as displayed in
Table 6.
Figure 9d–i display EPMA WDS quantitative element mappings of Cr, Fe, Mn, Mo, Ni, and Si at the identical location of
Figure 9c. The white sigma phase shown in
Figure 9c coincides with the Cr and Mo mappings in
Figure 9d–g. The combination of high Cr/Mo concentrations and slow furnace cooling favors the sigma phase formation.
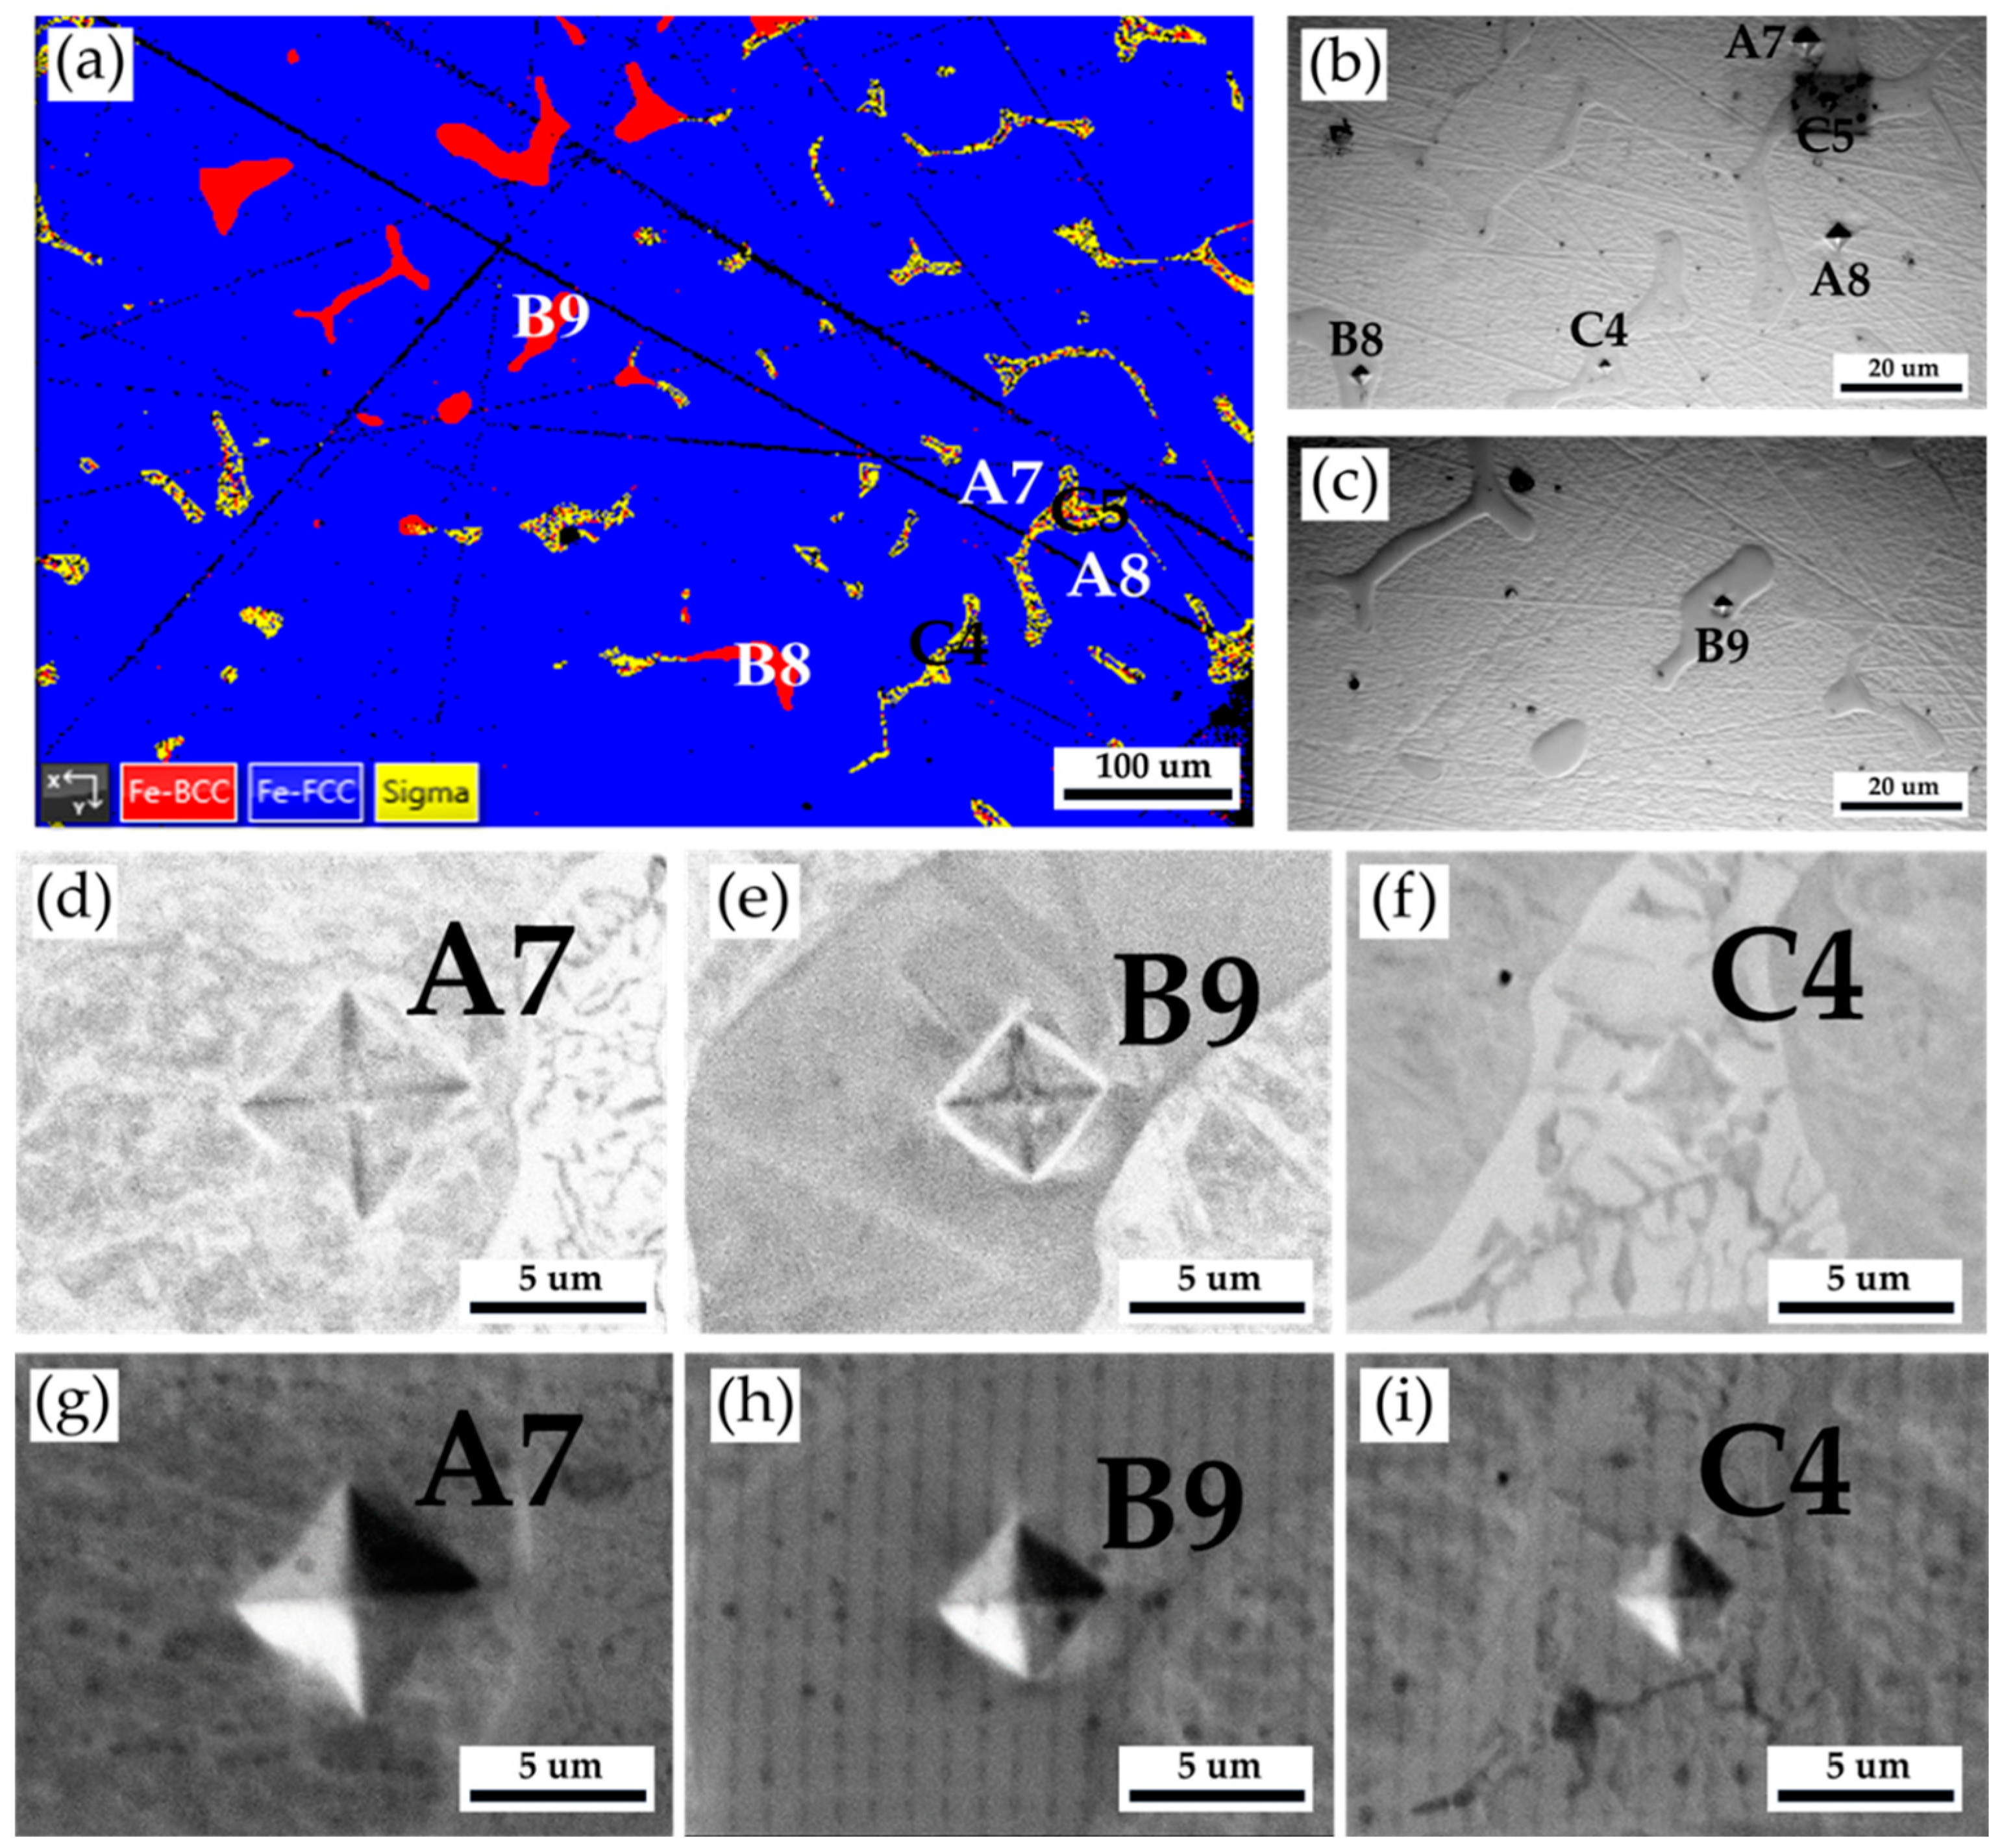
Figure 10 and
Table 7 show the Vickers hardness measurements of the as-cast 316L stainless steel billet at 0.5 R after homogenization at 1240
oC for 2 hours and slow furnace cooling. The corresponding EPMA SEIs/BEIs with Vickers hardness dents of
Figure 10a are also included to validate the locations of different phases in the hardness test. The hardness of austenite is quite soft, below 200 Hv, similar to the result above. In contrast, the hardness of δ ferrite is significantly increased up to 402 Hv, as compared with that in
Table 3 and
Table 5. Because the δ ferrite hardness is seldom above 300 Hv, the preliminary transformation could occur in the δ ferrite grains. The sigma phase has the highest Vickers hardness of 741. The high hardness of the sigma phase is detrimental to the subsequent hot/cold forging of the 316L cast billet. It has better be removed before the following forging process.
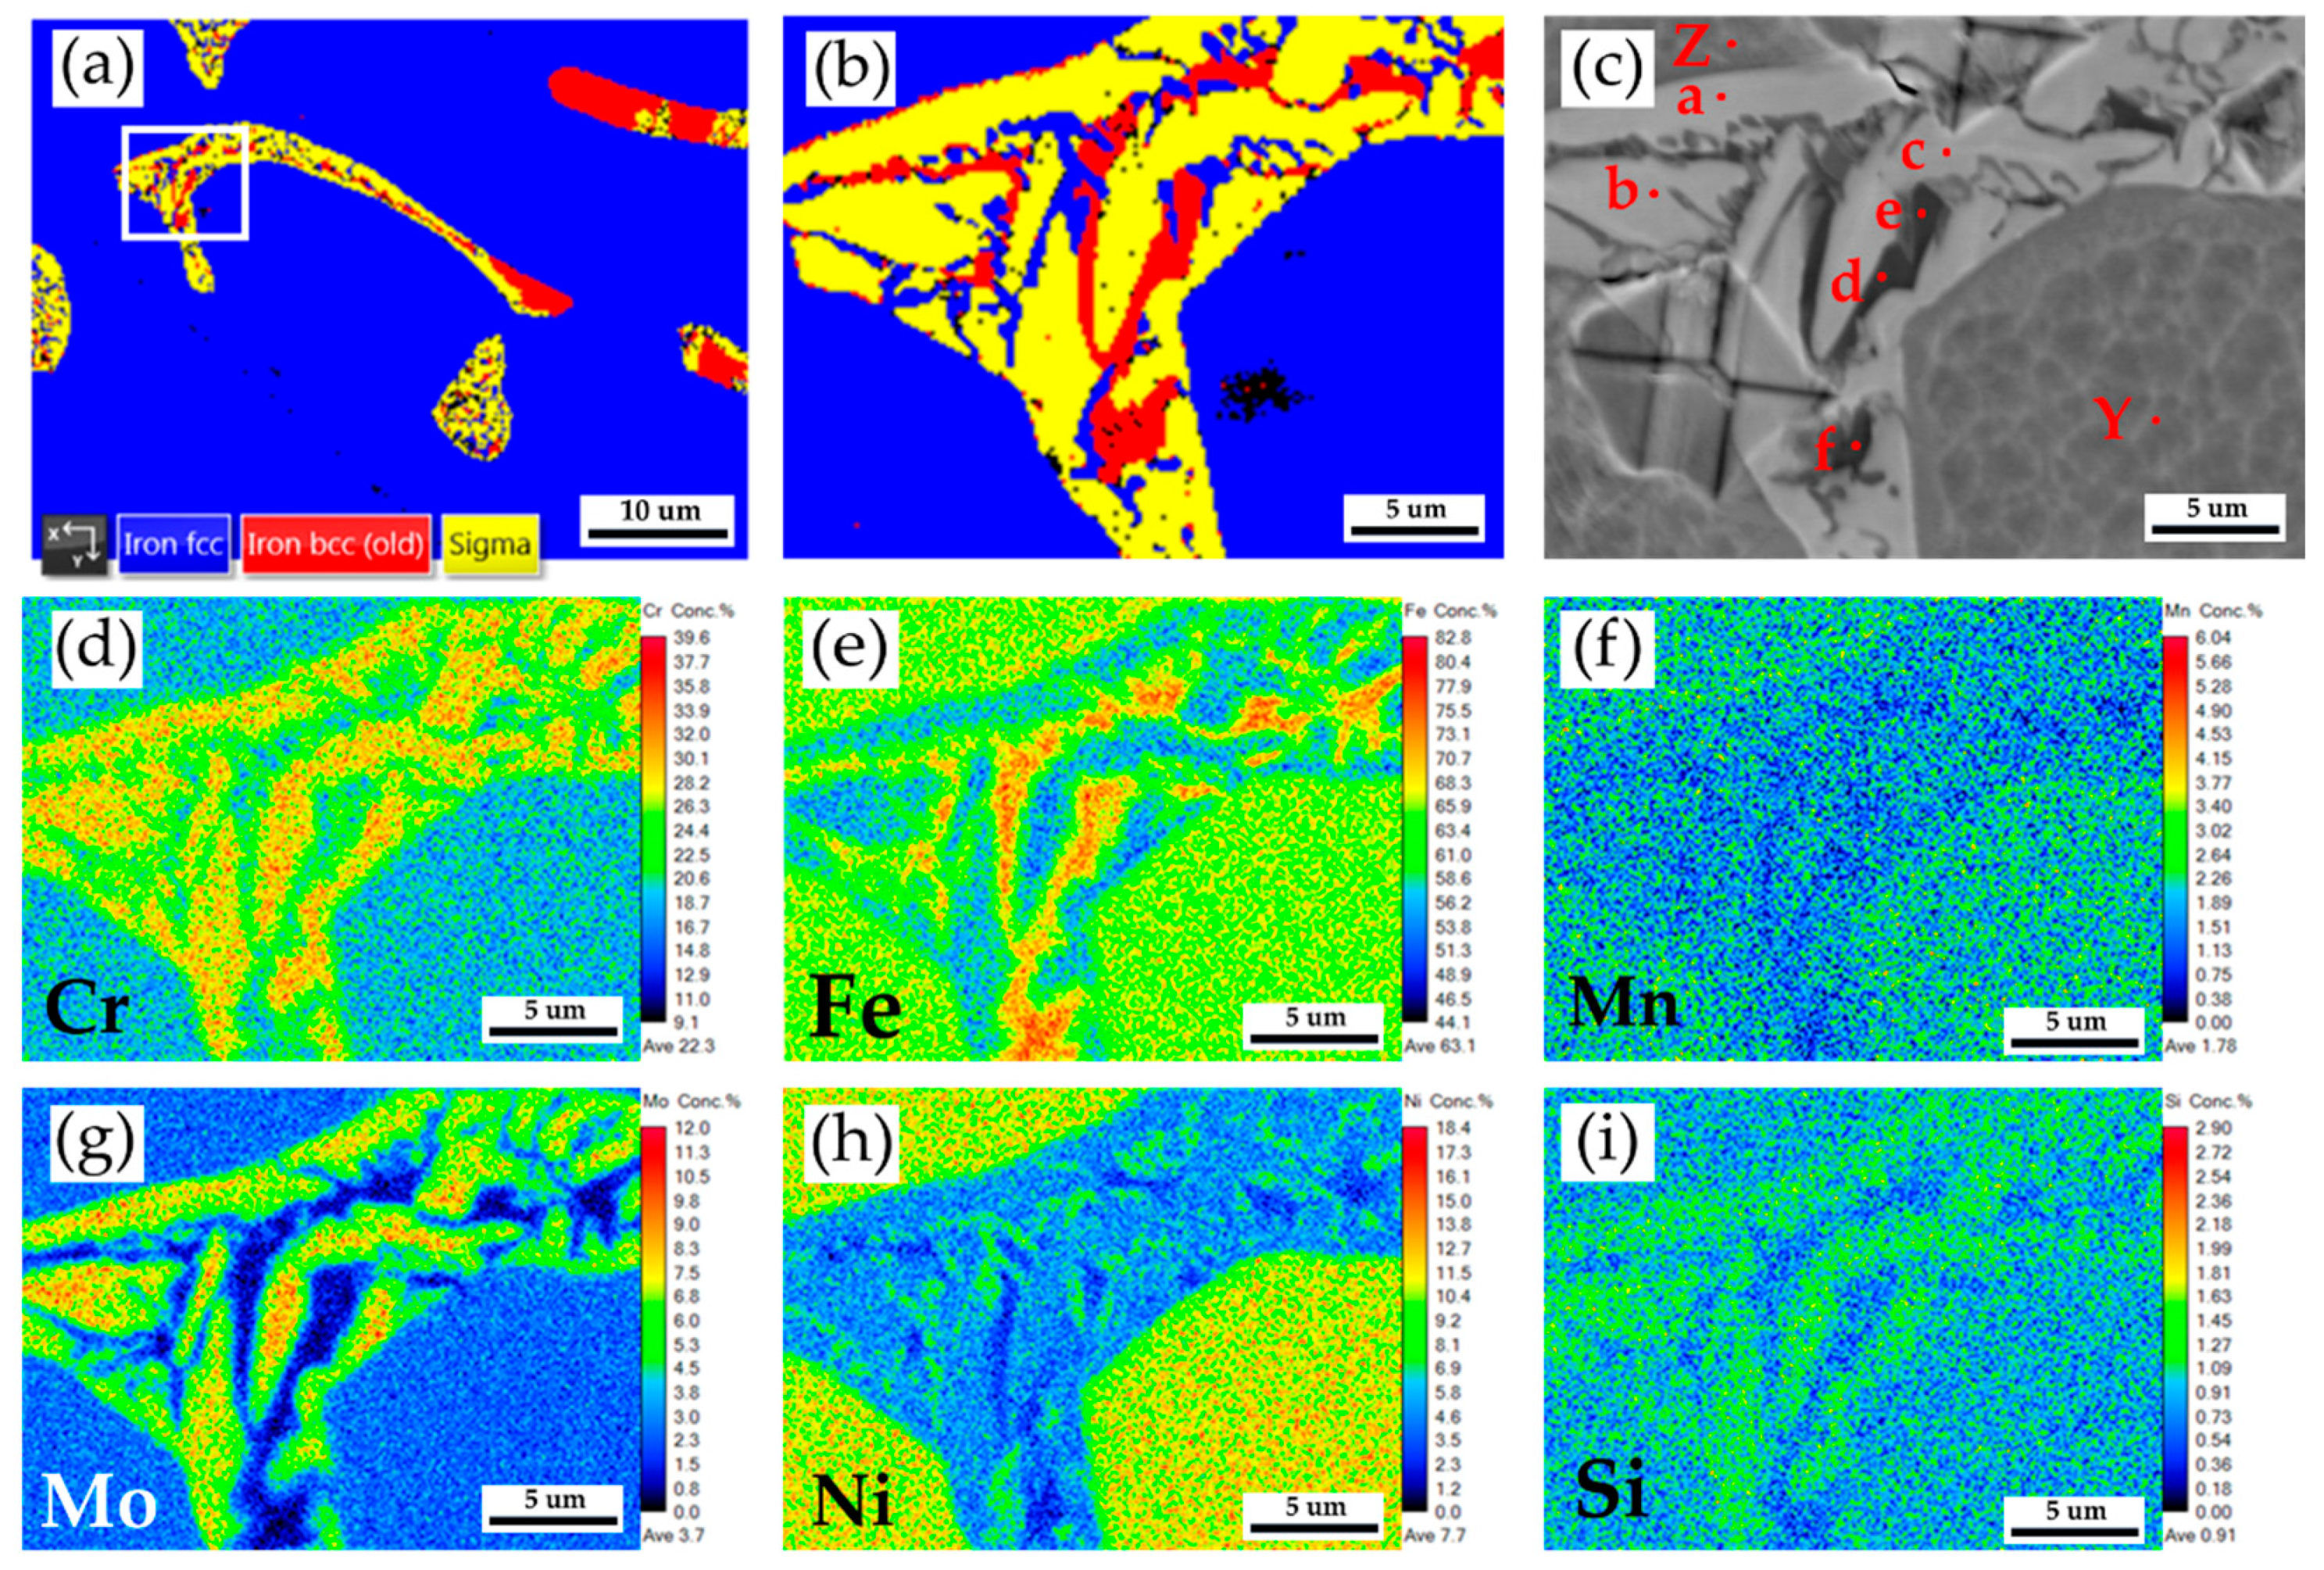
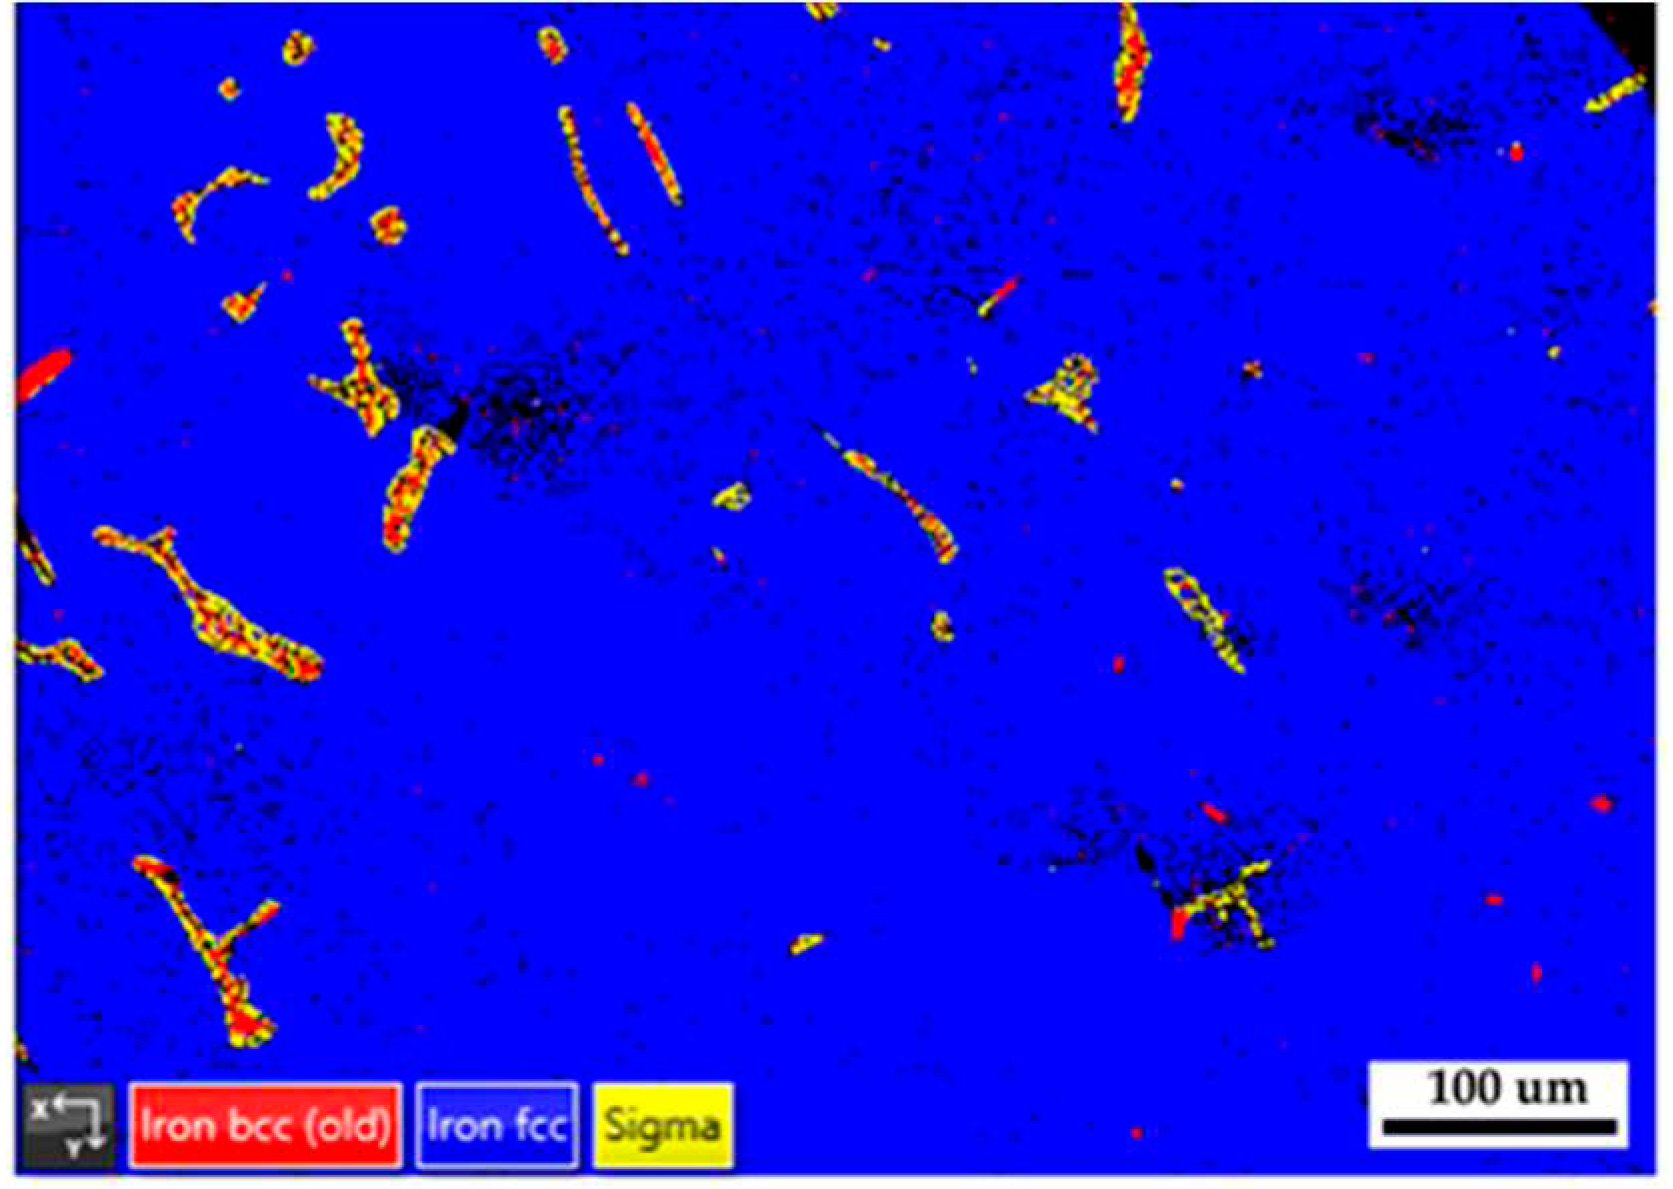
Figure 11 displays EBSD phase maps of the 316L stainless steel cast billet after homogenization at 1240
oC for 6 hours and furnace cooling at location 0.5 R. The microstructure with 6-hour homogenization illustrated in
Figure 11 is similar to that in
Figure 8 with 2-hour homogenization. The blunting of the flaky δ ferrite with slow furnace cooling conditions shown in
Figure 8 and
Figure 11 is inferior to that in
Figure 5b with the fast air cooling one. The extension of homogenization time at 1240
oC from 2 to 6 hours has little effect on the microstructure of the 316L cast billet.
Figure 12a–b show EBSD phase maps of selected areas in Fig. 11. The original flaky δ ferrite islands could transform into a mixture of austenite, sigma, and retained δ ferrite, as illustrated in
Figure 12b.
Figure 12c is the corresponding EPMA BEI of
Figure 12b, and quantitative chemical analyses of different locations in
Figure 12c are displayed in
Table 8. The sigma phase has high Cr and Mo concentrations marked by a, b, and c in
Figure 12c. The austenite is alloyed with low Cr and high Ni concentrations, as marked by Y and Z. It is important to note that the δ ferrite is alloyed with deficient Mo concentration below 1.0 at%, as denoted by d, e, and f in
Figure 12c. The transformation of δ ferrite into the sigma phase results from the enrichment of the Mo in the sigma phase. Migration of Mo in the original δ ferrite plays an important role in forming the sigma phase.
Figure 12d–i show EPMA WDS quantitative element mappings of Cr, Fe, Mn, Mo, Ni, and Si. The sigma phase is rich in Cr and Mo, as demonstrated in
Figure 12d–g. The austenite is rich in Ni, as displayed in
Figure 12h. They are all consistent with the EPMA analysis results.
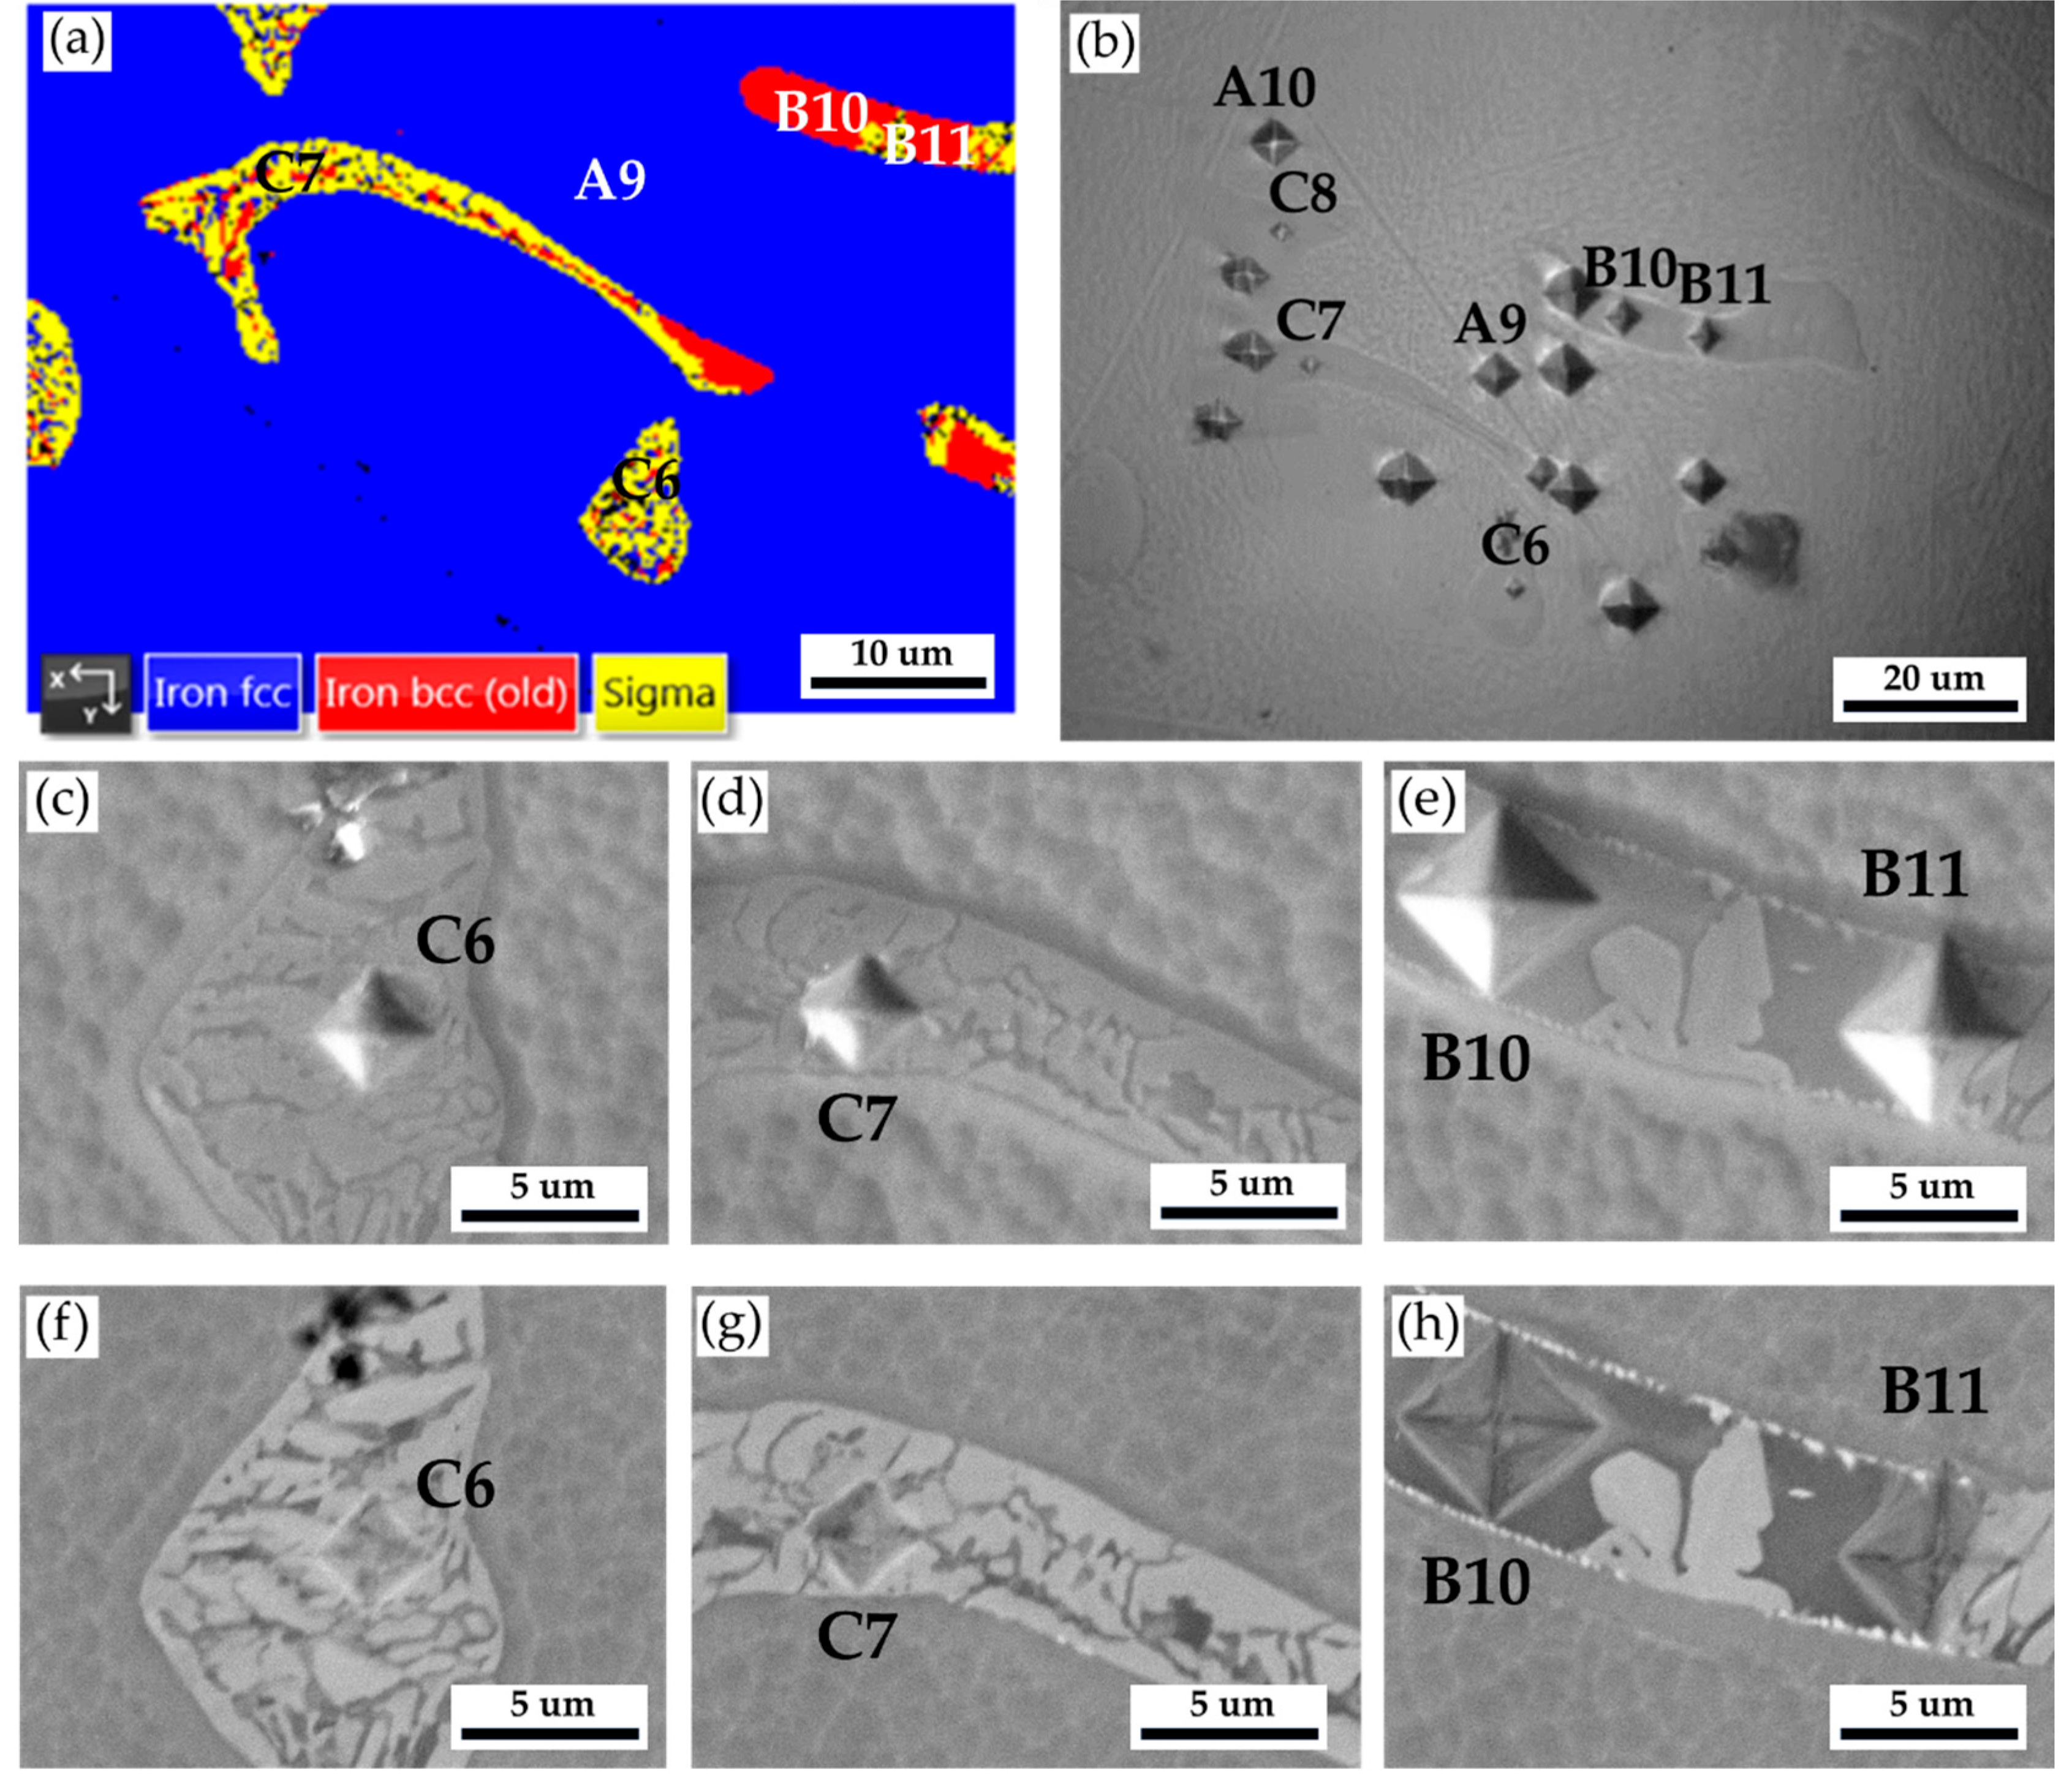
Figure 13 and
Table 9 are Vickers microhardness test results of the cast 316L stainless steel billet at 0.5 R after homogenization at 1240
oC for 6 hours with slow furnace cooling.
Figure 13a shows the EBSD phase map at the selected area in
Figure 11a, and
Figure 13b displays the corresponding optical metallograph with Vickers hardness dents of
Figure 13a. Vickers hardness dents of EPMA SEIs (
Figure 13c
–e) and BEIs (
Figure 13f–h) SEIs are also included in the figure. The hardness of austenite is the softest phase below 200 Hv. The hardness of δ ferrite is higher than that of austenite. The sigma phase has the highest hardness value of 860 Hv. The presence of high-hardness sigma intermetallics is detrimental to the subsequent forging of the 316L cast billet.
Figure 14 shows the isothermal sections of the 316L stainless steel at 1240 and 850
oC simulated by Thermo-Calc, respectively. In
Figure 14a, the chemical composition of the 316L cast billet is in the two-phase region, δ ferrite (BCC) and austenite (FCC), consistent with the experimental observation. According to
Figure 14b, the equilibrium phases at 850
oC in the 316L stainless steel are FCC austenite, M
23C
6 carbide, and the sigma phase. The 316L cast billet is alloyed with a low carbon concentration of 0.02 wt%, so it is reasonable that the M
23C
6 carbide is not observed in the experiment. However, the δ ferrite is not in an equilibrium phase at 850
oC in the isothermal section (
Figure 14b). It is not consistent with the experimental observation. The Thermo-Calc simulation deviates from the practical result. Because the formation of the sigma phase is a kinetic issue, i.e., a rate-dependent process, the simulation based on thermodynamics is not suitable. The Thermo-Calc simulation application is unsuitable for all temperatures, especially for the case of solid-state transformation due to slow diffusion to reach the final equilibrium state.
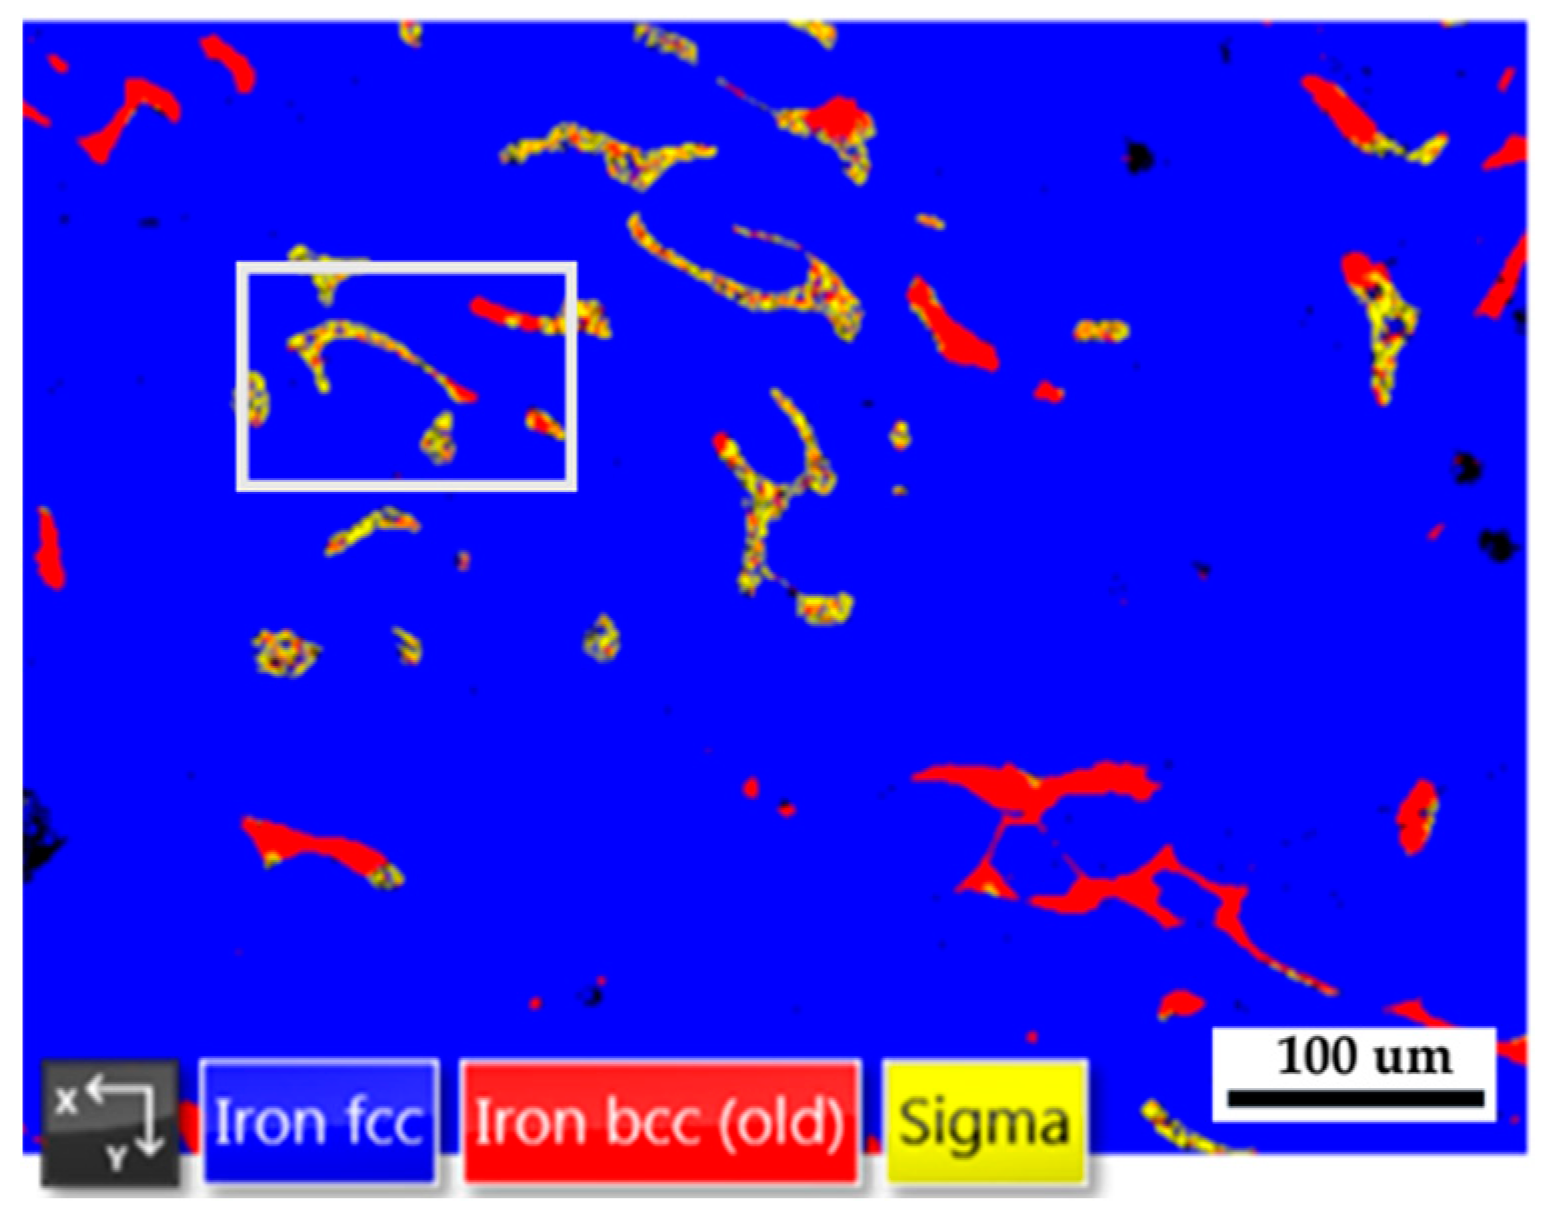
Figure 15 shows the EBSD phase map of the 316L stainless steel cast billet after homogenization at 1240
oC for 2 hours with a slow furnace cooled to 850
oC and followed by a fast air cooling to room temperature. The original δ ferrite islands have partially transformed into the sigma phase, a few austenite particles, and retained δ ferrite. The microstructure of
Figure 15 is similar to those of
Figure 8 and
Figure 11. Fast air cooling from 850
oC to room temperature after homogenization heat treatment cannot prohibit the sigma phase formation. In contrast, the sigma phase has almost disappeared from the entire cast billet for fast air cooling after the homogenization heat treatment at 1240
oC, as demonstrated in
Figure 5. It is deduced that rapid cooling is required between 850 and 1240
oC after homogenization treatment to avoid the sigma phase formation in the 316L cast billet.
Figure 1.
AC and FC cooling rates after homogenization at 1240 °C for 2 and 6 hours.
Figure 1.
AC and FC cooling rates after homogenization at 1240 °C for 2 and 6 hours.
Figure 2.
EBSD phase maps of the as-cast 316L stainless steel billet at different locations: (a) center, (b) 0.5 R, (c) R.
Figure 2.
EBSD phase maps of the as-cast 316L stainless steel billet at different locations: (a) center, (b) 0.5 R, (c) R.
Figure 3.
The as-cast 316L stainless steel billet at 0.5R: (a, b) EBSD phase maps in selected areas in Fig. 2b, (c) EPMA BEI and quantitative chemical analyses of different locations, (d~i) EPMA WDS quantitative element mappings of Cr, Fe, Mn, Mo, Ni, and Si.
Figure 3.
The as-cast 316L stainless steel billet at 0.5R: (a, b) EBSD phase maps in selected areas in Fig. 2b, (c) EPMA BEI and quantitative chemical analyses of different locations, (d~i) EPMA WDS quantitative element mappings of Cr, Fe, Mn, Mo, Ni, and Si.
Figure 7.
The Vickers hardness measurements of the as-cast 316L stainless steel billet at 0.5 R after homogenization at 1240
oC for 2 hours with air cooling: (a) EBSD phase map in the selected area in
Figure 6a, (b) the corresponding EPMA SEI with Vickers hardness dents of
Figure 7a, Vickers hardness dents of EPMA (c ~ e) BEIs, (f ~ h) SEIs.
Figure 8.
The EBSD phase map of the 316L stainless steel cast billet after homogenization at 1240 oC for 2 hours with furnace cooling at location 0.5 R.
Figure 8.
The EBSD phase map of the 316L stainless steel cast billet after homogenization at 1240 oC for 2 hours with furnace cooling at location 0.5 R.
Figure 9.
The cast 316L stainless steel billet at 0.5 R after homogenization at 1240 oC for 2 hours with furnace cooling: (a, b) EBSD phase maps in selected areas in Fig. 8, (c) EPMA BEI and quantitative chemical analyses of different locations, (d~i) EPMA WDS quantitative element mappings of Cr, Fe, Mn, Mo, Ni, and Si.
Figure 10.
The Vickers hardness measurements of the as-cast 316L stainless steel billet at 0.5 R after homogenization at 1240
oC for 2 hours with furnace cooling: (a) EBSD phase map in
Figure 8, (b, c) the corresponding optical metallographs with Vickers hardness dents of
Figure 10a, Vickers hardness dents of EPMA (d ~ f) BEIs, (g ~ i) SEIs.
Figure 11.
The EBSD phase map of the 316L stainless steel cast billet after homogenization at 1240 oC for 6 hours with furnace cooling at location 0.5 R.
Figure 11.
The EBSD phase map of the 316L stainless steel cast billet after homogenization at 1240 oC for 6 hours with furnace cooling at location 0.5 R.
Figure 12.
The cast 316L stainless steel billet at 0.5 R after homogenization at 1240 oC for 6 hours with furnace cooling: (a, b) EBSD phase maps in selected areas in Fig. 8, (c) EPMA BEI and quantitative chemical analyses of different locations, (d~i) EPMA WDS quantitative element mappings of Cr, Fe, Mn, Mo, Ni, and Si.
Figure 13.
The Vickers hardness measurements of the as-cast 316L stainless steel billet at 0.5 R after homogenization at 1240
oC for 6 hours with furnace cooling: (a) EBSD phase map, (b) the corresponding optical metallograph with Vickers hardness dents of
Figure 13a, Vickers hardness dents of EPMA (c ~ e) SEIs, (f ~ h) BEIs.
Figure 14.
The isothermal sections of the 316L stainless steel at (a) 1240 and (b) 850 oC simulated by Thermo-Calc.
Figure 14.
The isothermal sections of the 316L stainless steel at (a) 1240 and (b) 850 oC simulated by Thermo-Calc.
Figure 15.
The EBSD phase map of the 316L stainless steel cast billet after homogenization at 1240 oC for 2 hours with a slow furnace cooled to 850 oC, followed by a fast air cooling to room temperature.
Figure 15.
The EBSD phase map of the 316L stainless steel cast billet after homogenization at 1240 oC for 2 hours with a slow furnace cooled to 850 oC, followed by a fast air cooling to room temperature.
Table 1.
316L specimen designation used in the study.
Table 1.
316L specimen designation used in the study.
| Symbol |
Heat Treatment |
Location |
| C |
as cast |
Center |
| 0.5R |
as cast |
0.5 R |
| R |
as cast |
R |
| C-2h-AC |
1240oC for 2h, air cooling |
Center |
| 0.5R-2h-AC |
1240oC for 2h, air cooling |
0.5 R |
| R-2h-AC |
1240oC for 2h, air cooling |
R |
| C-2h-FC |
1240oC for 2h, furnace cooling |
Center |
| 0.5R-2h-FC |
1240oC for 2h, furnace cooling |
0.5 R |
| R-2h-FC |
1240oC for 2h, furnace cooling |
R |
| 0.5R-2h-850C-AC |
1240oC for 2h, furnace cooled to 850oC, and fast air cooling |
0.5 R |
| 0.5R-6h-FC |
1240oC for 6h, furnace cooling |
0.5 R |
Table 2.
EPMA WDS quantitative chemical analyses in at% of A~-L in
Figure 3c.
Table 2.
EPMA WDS quantitative chemical analyses in at% of A~-L in
Figure 3c.
| Element /wt% |
C |
Cr |
Fe |
Mn |
Mo |
Ni |
O |
P |
Si |
Si |
Phase |
| A |
0.9 |
21.1 |
56.7 |
1.9 |
10.4 |
7.3 |
0.0 |
0.3 |
0.1 |
1.3 |
--- |
| B |
0.8 |
28.2 |
56.1 |
1.5 |
7.5 |
4.6 |
0.0 |
0.1 |
0.0 |
1.2 |
sigma |
| C |
0.2 |
17.7 |
65.4 |
1.9 |
2.2 |
11.8 |
0.0 |
0.0 |
0.0 |
0.8 |
austenite |
| D |
1.2 |
18.1 |
64.2 |
2.0 |
2.4 |
11.2 |
0.0 |
0.0 |
0.0 |
0.9 |
austenite |
| E |
1.1 |
18.7 |
64.2 |
2.0 |
2.6 |
10.5 |
0.0 |
0.0 |
0.0 |
0.9 |
austenite |
| F |
0.9 |
25.8 |
60.6 |
1.6 |
5.1 |
4.8 |
0.0 |
0.1 |
0.0 |
1.1 |
δ ferrite |
| G |
0.8 |
19.1 |
64.4 |
1.9 |
2.7 |
10.2 |
0.0 |
0.0 |
0.0 |
0.9 |
austenite |
| H |
1.1 |
27.7 |
57.7 |
1.7 |
6.2 |
4.3 |
0.0 |
0.1 |
0.0 |
1.2 |
sigma |
| I |
0.8 |
26.2 |
61.2 |
1.6 |
4.5 |
4.6 |
0.0 |
0.1 |
0.0 |
1.0 |
δ ferrite |
| J |
2.1 |
28.2 |
54.9 |
1.6 |
7.1 |
4.6 |
0.0 |
0.1 |
0.2 |
1.2 |
sigma |
| K |
2.1 |
26.7 |
56.9 |
1.6 |
6.4 |
4.9 |
0.0 |
0.1 |
0.1 |
1.2 |
sigma |
| L |
2.1 |
27.9 |
54.7 |
1.6 |
7.5 |
4.5 |
0.0 |
0.2 |
0.2 |
1.3 |
sigma |
Table 5.
Vickers hardness measurements displayed in
Figure 7.
Table 5.
Vickers hardness measurements displayed in
Figure 7.
| Location |
A4 |
A5 |
A6 |
B5 |
B6 |
B7 |
| Hv (10 g) |
196 |
171 |
184 |
200 |
214 |
251 |
Table 6.
EPMA WDS quantitative chemical analyses in at% of S~X in
Figure 9c.
Table 6.
EPMA WDS quantitative chemical analyses in at% of S~X in
Figure 9c.
| Element /at% |
C |
Cr |
Fe |
Mn |
Mo |
Ni |
O |
P |
Si |
Si |
Phase |
| S |
0.1 |
18.6 |
65.2 |
1.3 |
2.6 |
11.2 |
0.0 |
0.0 |
0.1 |
0.9 |
austenite |
| T |
0.1 |
28.2 |
56.7 |
1.2 |
7.6 |
4.7 |
0.0 |
0.1 |
0.2 |
1.2 |
sigma |
| U |
0.1 |
21.1 |
73.7 |
0.8 |
1.0 |
2.6 |
0.0 |
0.0 |
0.0 |
0.7 |
δ ferrite |
| V |
0.2 |
20.9 |
74.1 |
0.8 |
0.8 |
2.5 |
0.0 |
0.0 |
0.0 |
0.7 |
δ ferrite |
| W |
0.1 |
26.2 |
58.8 |
1.2 |
7.7 |
4.5 |
0.0 |
0.1 |
0.2 |
1.2 |
sigma |
| X |
0.1 |
17.3 |
67 |
1.3 |
2.6 |
10.7 |
0.0 |
0.0 |
0.1 |
0.9 |
austenite |
Table 7.
Vickers hardness measurements displayed in
Figure 10.
Table 7.
Vickers hardness measurements displayed in
Figure 10.
| Location |
A7 |
A8 |
B8 |
B9 |
C4 |
C5 |
| Hv (10 g) |
173 |
179 |
363 |
402 |
691 |
741 |
Table 8.
EPMA WDS quantitative chemical analyses in at% of Y~f in
Figure 12c.
Table 8.
EPMA WDS quantitative chemical analyses in at% of Y~f in
Figure 12c.
| Element /at% |
C |
Cr |
Fe |
Mn |
Mo |
Ni |
O |
P |
Si |
Si |
Phase |
| Y |
0.5 |
18.3 |
64.5 |
1.9 |
2.4 |
11.3 |
0.0 |
0.0 |
0.1 |
1.0 |
austenite |
| Z |
0.5 |
18.6 |
64.4 |
1.9 |
2.5 |
11.0 |
0.0 |
0.0 |
0.1 |
1.0 |
austenite |
| a |
0.5 |
29.0 |
55.6 |
1.6 |
7.4 |
4.5 |
0.0 |
0.1 |
0.2 |
1.1 |
sigma |
| b |
0.5 |
28.6 |
55.2 |
1.7 |
7.6 |
4.9 |
0.0 |
0.1 |
0.2 |
1.2 |
sigma |
| c |
0.6 |
28.6 |
55.9 |
1.7 |
6.8 |
5.0 |
0.0 |
0.1 |
0.1 |
1.2 |
sigma |
| d |
0.5 |
20.9 |
71.7 |
1.2 |
0.8 |
4.2 |
0.0 |
0.0 |
0.0 |
0.7 |
δ ferrite |
| e |
0.5 |
23.6 |
69.6 |
1.1 |
1.0 |
3.2 |
0.0 |
0.0 |
0.0 |
1.0 |
δ ferrite |
| f |
0.6 |
21.2 |
73.5 |
1.0 |
0.5 |
2.6 |
0.0 |
0.0 |
0.0 |
0.6 |
δ ferrite |
Table 9.
Vickers hardness measurements displayed in
Figure 10.
Table 9.
Vickers hardness measurements displayed in
Figure 10.
| Location |
A9 |
A10 |
B10 |
B11 |
C6 |
C7 |
C8 |
| Hv (10 g) |
173 |
142 |
223 |
287 |
646 |
860 |
605 |
