Preprint
Article

Genome-Wide Identification and Expression Analysis of Gs and Gogat Gene Family in Pecan (Carya illinoinensis) under Different Nitrogen Forms

Altmetrics

Downloads

124

Views

63

Comments

0

Submitted:

29 October 2023

Posted:

30 October 2023

You are already at the latest version

Alerts
Abstract
Nitrogen (N) is an important mineral nutrient for plant growth, as well as a limiting factor for crop yield, and how to improve the utilization efficiency of N fertilizer by plants is currently a research hotspot. This article uses bioinformatics methods to identify and analyze members of the glutamine synthetase (GS) and glutamate synthase (GOGAT) gene families in pecan. A total of 6 GS genes and 4 GOGAT genes were identified, and their physicochemical properties, gene structures, and homologous evolutionary relationships were analyzed. Analysis of tissue-specific expression of GS and GOGAT genes based on transcriptome data from pecan. The enzyme activities of GS and GOGAT and the gene expression were quantitatively analyzed under different N form ratios in pecan. According to the results, the promoter cis-acting elements of GS and GOGAT genes can be roughly divided into three types: light-responsive elements, hormone-responsive elements, and stress-responsive elements. The results of homologous evolution showed that there was no tandem duplication event for the two gene families, and GS and GOGAT have undergone purification during the evolutionary process. CiGS2s and CiFd-GOGATs were expressed mainly in leaves, and CiNADH-GOGATs were expressed mainly in fruits. The qPCR analysis results showed that T4 treatment significantly increased the expression levels of CiGS and CiGOGAT genes in the leaves. The enzyme activities of GS and GOGAT in pecan were significantly increased under T3, T4, and T5 treatments. In summary, a higher proportion of ammonium nitrogen (NH4+) in the nutrient solution was profit to pecan NH4+ assimilation. This study determined the appropriate nitrogen ratio for pecan, promoting a theoretical basis for reducing environmental pollution caused by nitrogen fertilizer and improving the nitrogen utilization efficiency of pecan. In summary, both CiGSs and CiGOGATs exhibit tissue specificity, and an ammonium-nitrate mixture with a higher proportion of NH4+ is more favorable for NH4+ assimilation in pecan. This study provides a reference basis for further understanding the functions of CiGSs and CiGOGATs in pecan, and offers a theoretical foundation for improving N use efficiency in pecan.
Keywords: 
Subject: Biology and Life Sciences  -   Forestry

1. Introduction

Nitrogen (N) is one of the essential nutrients for plant growth, and N fertilizer plays a significant role in promoting crop yield. However, in recent years, it has been found that nearly 81% of N fertilizer is applied in the form of urea, which causes a large amount of N loss due to volatilization and leaching, leading to environmental pollution [1]. Therefore, the appropriate use of N fertilizer can not only increase plant yield, but also reduce environmental pollution. Ammonium nitrogen (NH4+) and nitrate nitrogen (NO3-) are the two main forms of N that plants absorb and utilize [2]. Different plants also have different preferences for these two forms. Research has shown that Douglas-fir (Pseudotsuga menziesii (Mirb.) Franco) seedlings have a higher potential for absorbing NO3- than NH4+ [3], and pecan also tends to prefer NH4+ [2]. For higher plants, when inorganic N sources enter the plant, they must be converted into NH4+ and then transformed into organic N through N assimilation for use by the plant itself [4]. In this process, glutamine synthetase (GS) and glutamate synthase (GOGAT) play important roles, forming the "GS-GOGAT cycle" [5].
Pecan (Carya illinoensis (Wangenh.) K. Koch), a member of the genus Carya in the family Juglandaceae, native to eastern North America. Its nuts are rich in crude fat and protein, with a high content of unsaturated fatty acids of up to 97% [6], It is one of the world’s famous dry fruit and oilseed trees. Considering that pecan kernel is rich in Unsaturated fat acids, long-term consumption can reduce the risk of coronary heart disease [7]. Pecan can not only be consumed as a dried fruit or processed food, but also because it has straight trunks, making their timber suitable for furniture, flooring, and landscaping. [8]. Pecan contains various phytochemicals, which have medicinal value in various diseases [9]. The kernel contains multiple phenolic compounds, giving pecan strong antioxidant properties It is reported that pecan phenolic compounds, which have antioxidant activity can reduce the risk of cancer, Alzheimer, Parkinson and the other degenerative diseases [10]. Due to its nutritional value, economic value, and medicinal value, pecan is widely popular both domestically and internationally [11].
GS is a key enzyme involved in NH4+, which can convert inorganic ammonium salts in plant into organic N [12]. Studies have shown that the role of GS activity in response to fertilization has been widely investigated, and its relationship with stresses such as drought and high temperature has also been explored [13]. In most plants, GS exists in two forms, including cytoplasmic GS1 and chloroplasts GS2 [14]. In addition, members of the GS gene family have been identified in many plants, such as Arabidopsis (Arabidopsis thaliana (L.) Heynh.) [15], wheat (Triticum aestivum L.) [16], rice (Oryza sativa L.) [17], etc. Members of the plant GS gene family are differentially expressed, and each GS gene encodes a distinct GS polypeptides chains, which results in an organ-specific distribution [18]. The cytosolic GS1 is more abundant in the companion cells of vascular tissues in plant leaves, especially in aging leaves, and it participates in the activation of nitrogen during the aging period of plant leaves, which is most significant in small grain crops [19]. GS2 is mainly involved in assimilation of NH4+ produced by photorespiration and nitrate reduction [20]. The expression of GS is regulated by multiple levels including genes, transcription factors, and proteins [21]. Experimental data showed that the NLP7 transcription factor can induce the expression of the GS2 gene [22].
GOGAT is the rate-limiting enzyme in the GS-GOGAT cycle [23]. GS catalyzes the formation of glutamine from NH4+, and then GOGAT converts L-glutamine and oxoglutarate into molecules of L-glutamate [24]. In higher plants, GOGAT mainly includes two types: Fd-GOGAT and NADH-GOGAT. The former is mainly located in the plastids and chloroplasts, while the latter is mainly located in roots, stems, and the cytoplasm [25]. Different forms of GOGAT are expressed in different plant tissues, and they also play different roles at various stages of plant growth and development [26]. Fd-GOGAT mainly assimilates NH4+ formed by photorespiration in photosynthetic tissues, while NADH-GOGAT conversely. There have been few studies on GOGAT genes in woody plants, but Cao et al. [27] used bioinformatics methods for the first time to study members of the GOGAT family in poplar (Populus trichocarpa Torr. & Gray), and analyzed the expression patterns of GOGAT in response to C-N treatment, which provides important clues for exploring the mechanism of regulating C-N balance in poplar.
GS and GOGAT play important roles in plant nitrogen assimilation. Therefore, molecular-level research on them can help us understand their functions and structures, and lay the theoretical foundation for improving plant nitrogen utilization. The GS and GOGAT gene families have been widely studied in many plants, but research on them in pecan is relatively limited. In this study, six members of the GS gene family and four members of the GOGAT gene family were identified in pecan and the physical and chemical properties, gene structure, gene duplication, and expression patterns under different nitrogen form ratios were analyzed. This study provides a theoretical basis for formulating the optimal nitrogen utilization strategy for pecan, reducing the pollution of nitrogen to the environment, and improving the nitrogen utilization efficiency of pecan.

2. Results

2.1. Identification and Sequence Analysis of GS and GOGAT Gene Family Members in Pecan

Based on bioinformatics methods, 6 GS and 4 GOGAT genes were identified from the whole genome of pecan. Then, we verified the GS and GOGAT domains through Pfam and NCBI CD searches.
We analyzed the basic information and physicochemical properties of predicted members of the GS and GOGAT gene families in pecan (Table 2). The results indicated that CiGSs had 12 to 14 exons, while the CiGOGATs had 23 to 33 exons. The CDS length of the CiGS gene ranged from 1071 to 1299 bp and the AA length from 356 to 432 aa. The CDS length of the CiGOGAT gene ranged from 4473 to 6669 bp and the AA length from 1490 to 2305 aa. The pIs of the CiGS genes ranged from 5.49 to 8.07, while the pI of the CiGOGAT gene ranged from 5.94 to 6.75. Most CiGS (4/6) genes and all CiGOGAT (4/4) genes were stable proteins (instability index < 40). GRAVY analysis showed that these proteins are hydrophilic (GRAVY < 0). Subcellular localization prediction showed that CiGS1.1a and CiGS1.1b were located in the cytoplasm, CiGS1.1c and CiGS1.2 were located in chloroplast and the cytoplasm, CiGS2a and CiGS2b were located in mitochondrion and the cytoplasm, and all CiGOGATs are located in chloroplast.
Table 1. Physiochemical properties of CiGS and CiGOGAT genes.
Gene Name Gene ID Exon No. AA CDS (bp) MW (kDa) pI Instability Index GRAVY Subcellular Localization
CiGS1.1a CiPaw.03G073300.1 12 356 1071 39.31 6.68 39.29 -0.48 Cytoplasm
CiGS1.1b CiPaw.04G048000.1 12 356 1071 39.02 5.49 36.56 -0.40 Cytoplasm
CiGS1.1c CiPaw.05G168500.1 13 356 1071 39.21 5.79 39.24 -0.42 Chloroplast
Cytoplasm
CiGS1.2 CiPaw.16G097000.1 13 356 1071 39.28 5.82 39.61 -0.46 Chloroplast
Cytoplasm
CiGS2a CiPaw.01G157900.1 14 432 1299 47.59 8.07 45.71 -0.48 Chloroplast
Mitochondrion
CiGS2b CiPaw.02G090300.1 14 432 1299 47.78 6.48 44.12 -0.50 Chloroplas
Mitochondrion
CiNADH-GOGATa CiPaw.05G252100.1 23 2222 6669 244.32 6.75 36.48 -0.30 Chloroplast
CiNADH-GOGATb CiPaw.06G009900.1 23 2305 6918 254.99 6.46 36.66 -0.28 Chloroplast
CiFd-GOGATa CiPaw.09G047200.1 33 1490 4473 162.42 5.94 34.55 -0.15 Chloroplast
CiFd-GOGATb CiPaw.10G039900.1 33 1637 4914 178.25 6.23 37.12 -0.15 Chloroplast
Notes: GS: glutamine synthetase; GOGAT: glutamate synthase; Exon No.: number of exon; AA: amino acid length; CDS: coding sequence length; MW: molecular weight; pI: isoelectric point; GRAVY: grand average of hydropathy.

2.2. Phylogenetic Analysis of the GS and GOGAT in Different Species

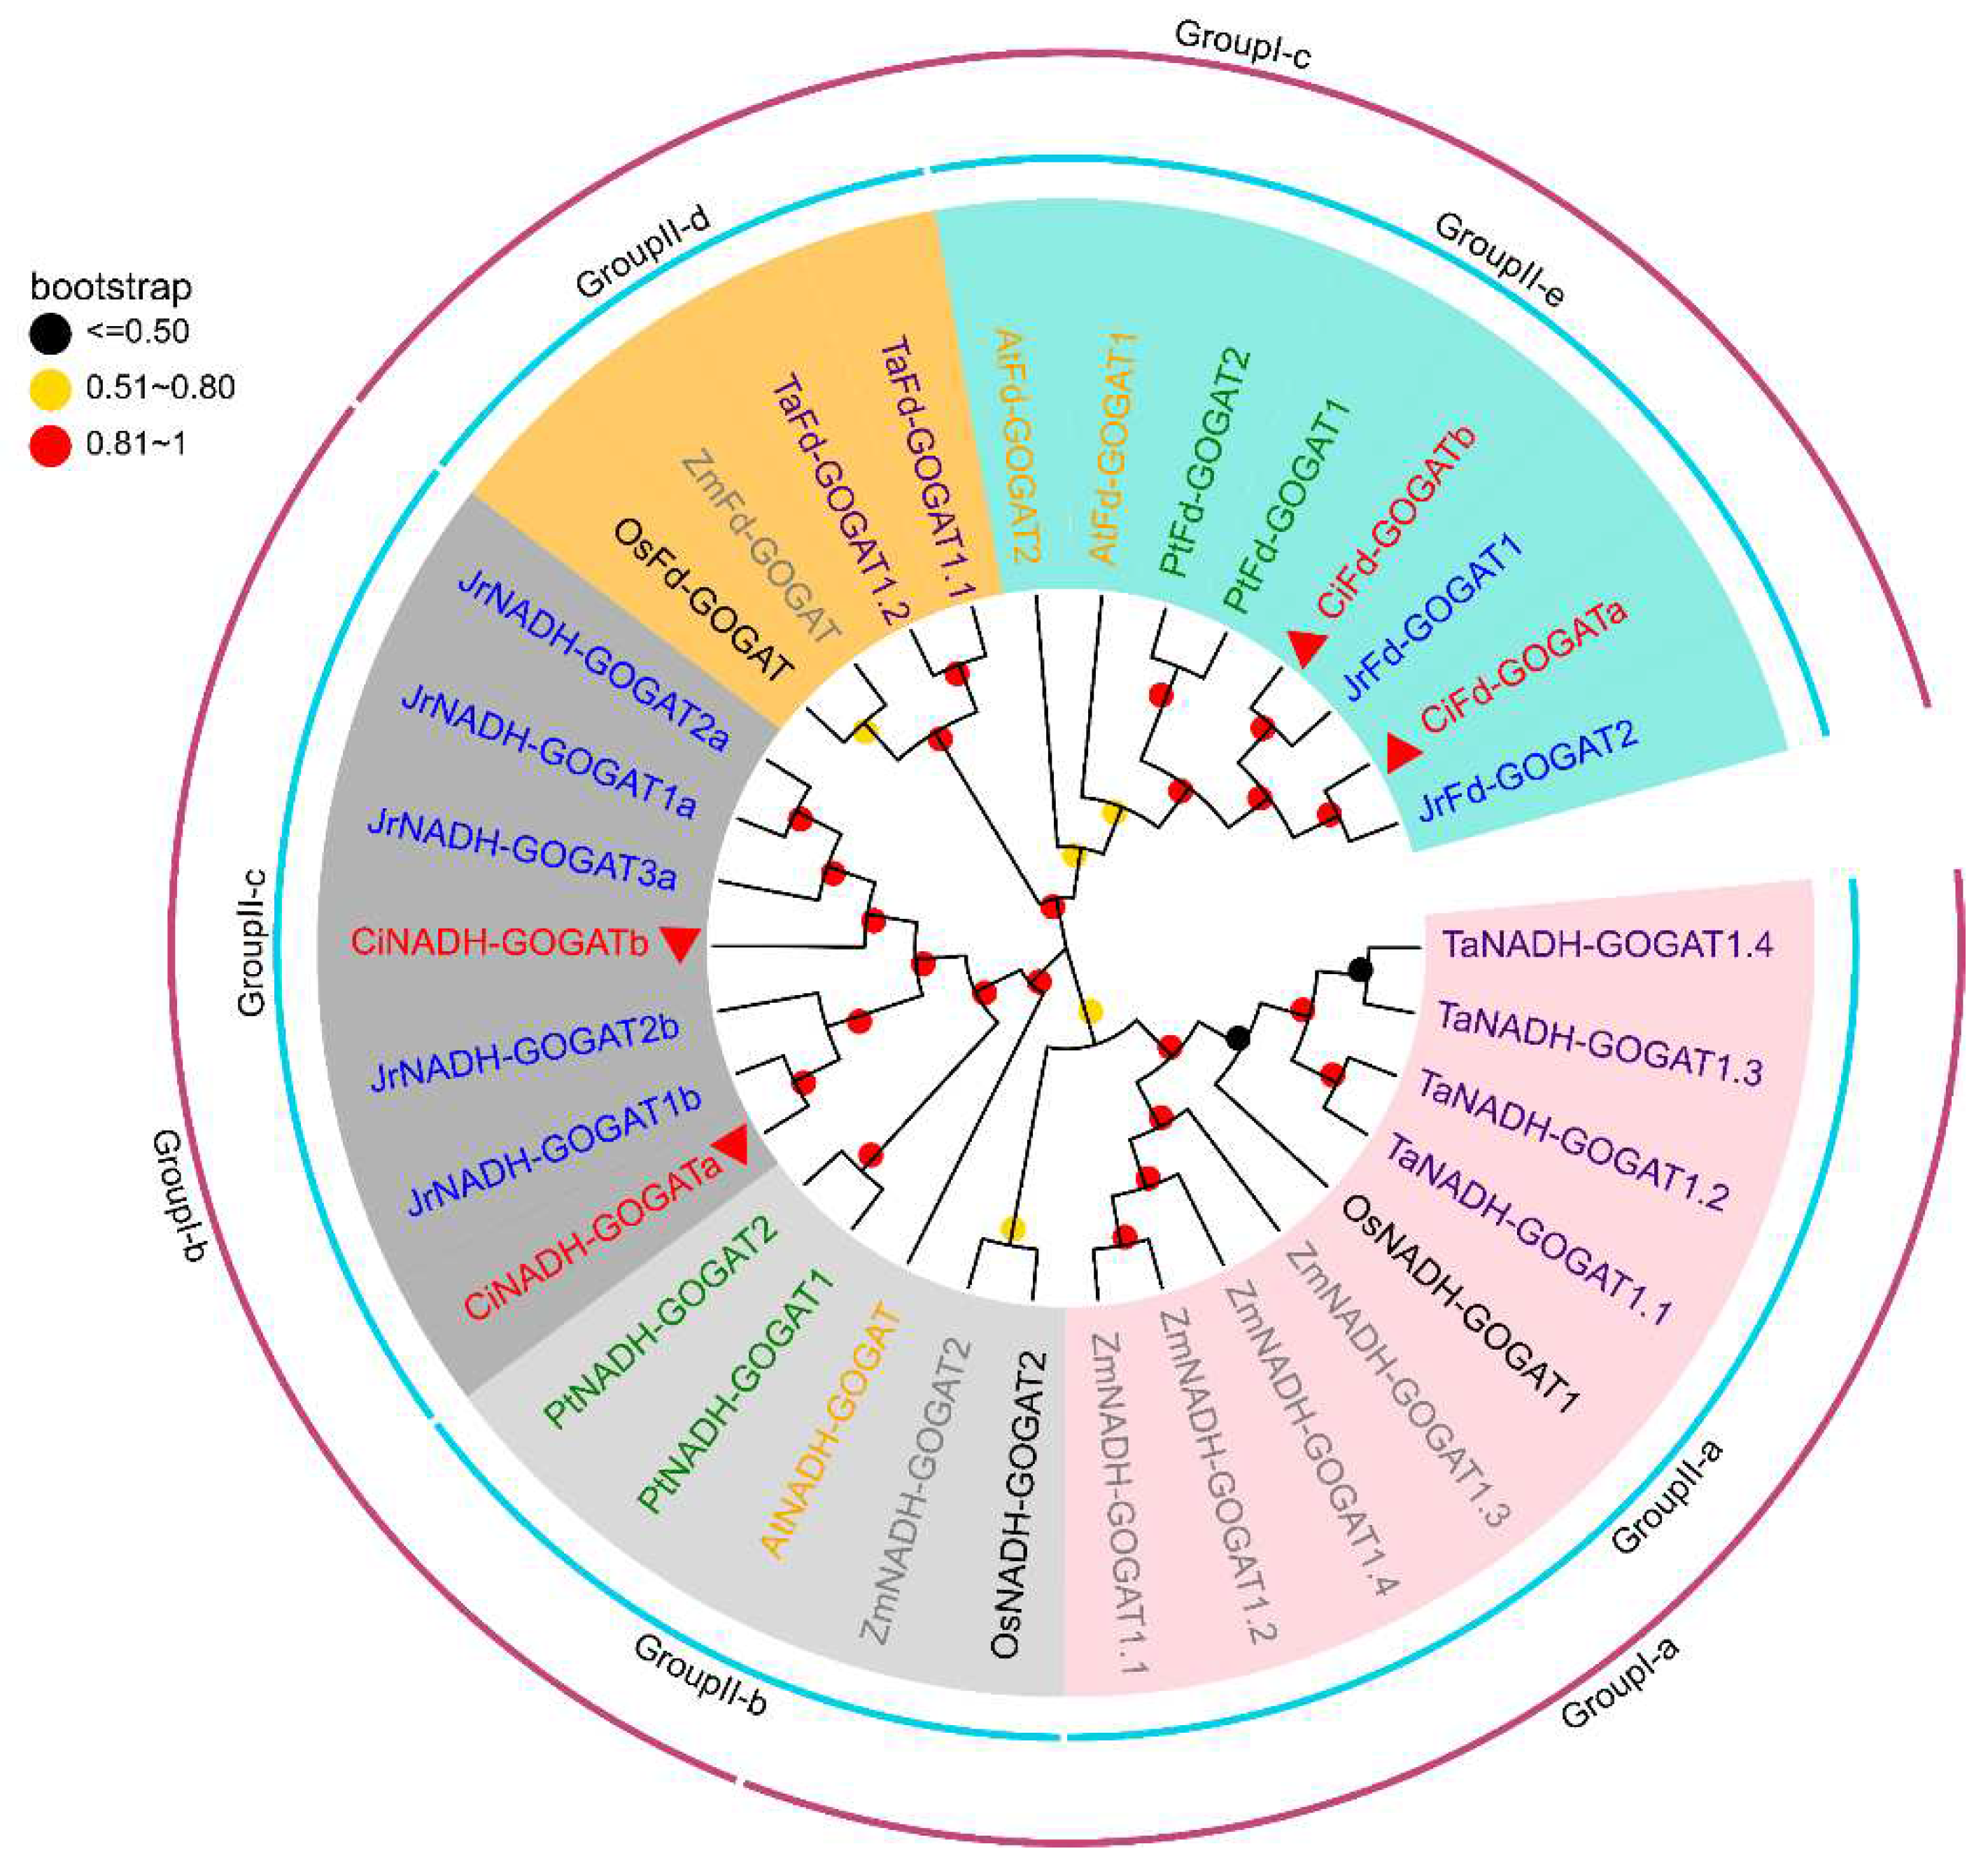
According to the phylogenetic tree (Figure 1 and Figure 2), the GS and GOGAT gene families were classified into three different evolutionary branches (GroupI-a~GroupI-c), which could then be classified into five subgroups (GroupII-a~GroupII-e) according to the distances of the branch clusters. From the GS phylogenetic tree, it can be seen that the GS gene family can be divided into GS1 and GS2 subfamilies, of which the CiGS1 subfamily includes CiGS1.1a, CiGS1.1b, CiGS1.1c, and CiGS1.2. and the CiGS2 subfamily includes CiGS2a and CiGS2b. The CiGS1 subfamily is located entirely in GroupI-a, and the CiGS2 subfamily is located entirely in GroupI-c. GroupII-a contains three members of the CiGS family, GroupII-b contains one member of the CiGS family, and GroupII-e contains two members of the CiGS family. the phylogenetic tree of GOGAT shows that the GOGAT gene family can be classified into the NADH-GOGAT and the Fd-GOGAT subfamilies, with each containing two GOGAT genes in pecan. The GOGAT phylogenetic tree showed that the GOGAT gene family can be divided into NADH-GOGAT and Fd-GOGAT subfamilies, each of which contains two hickory GOGAT genes. CiNADH-GOGAT is located in GroupI-b and GroupII-c, whereas CiFd-GOGAT is located in GroupI-c and GroupII-e.

2.3. Conserved Motif, Conserved Domain and Gene Structural Analysis of GS and GOGAT

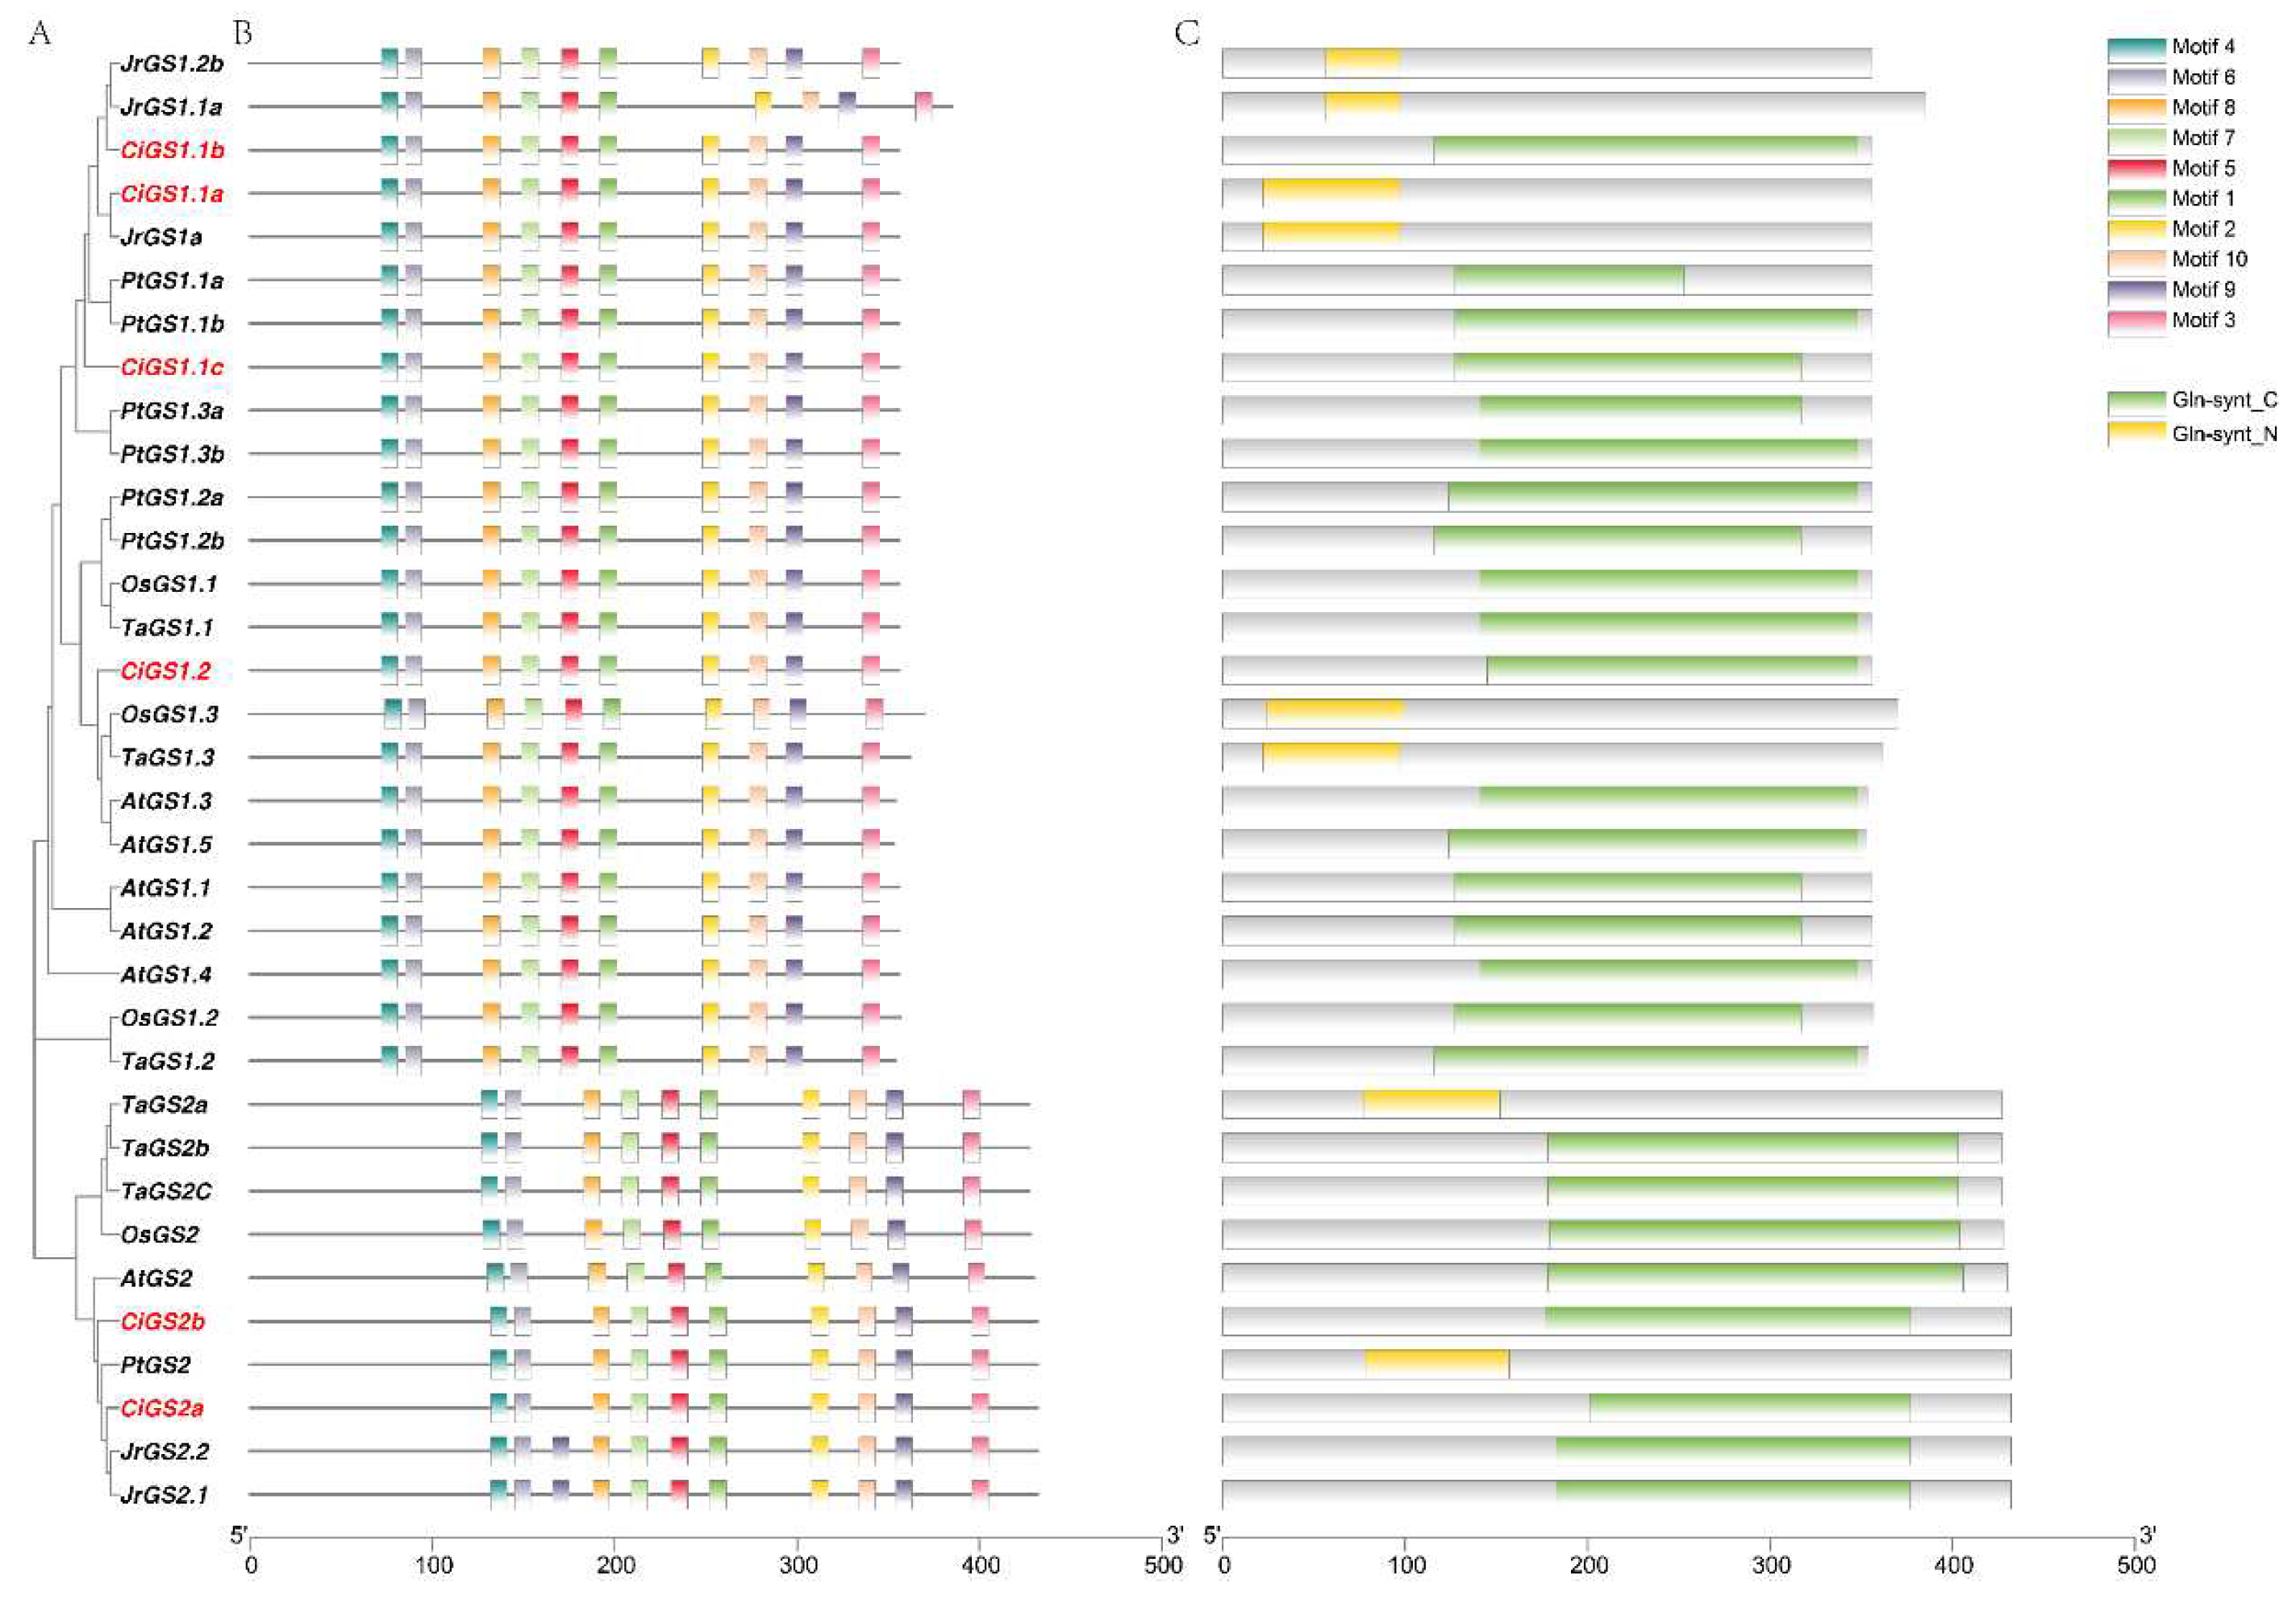
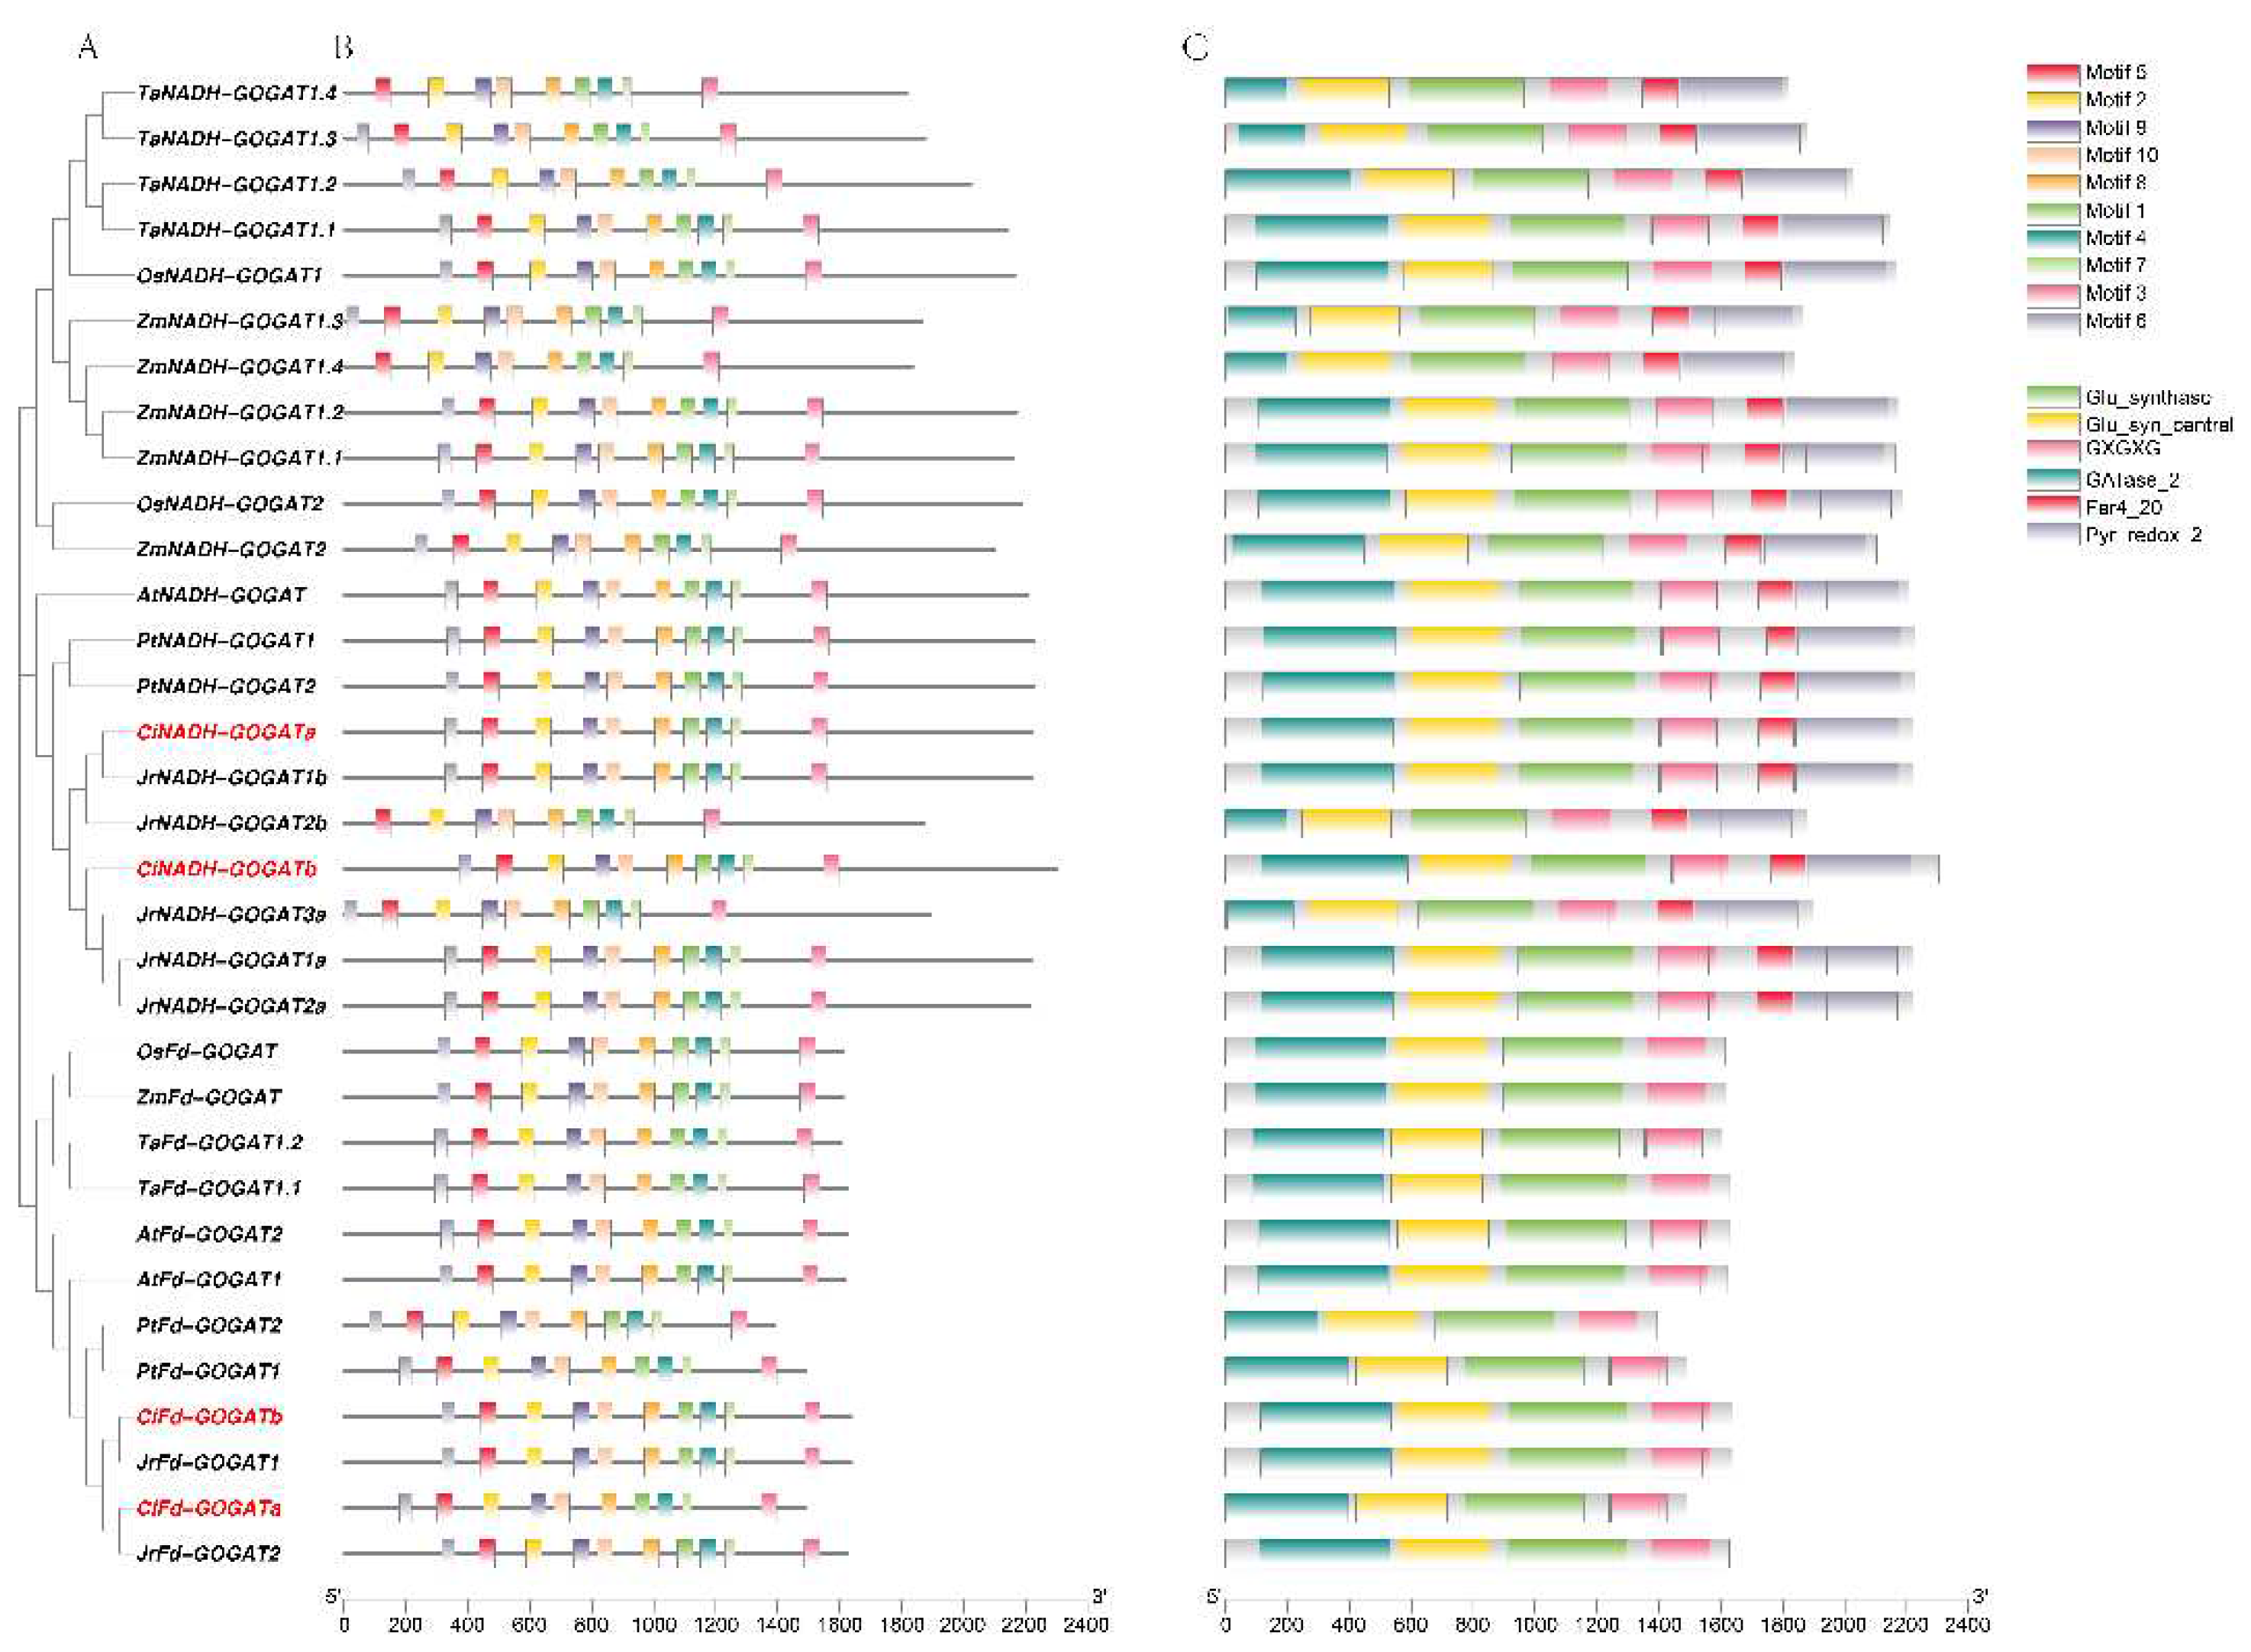
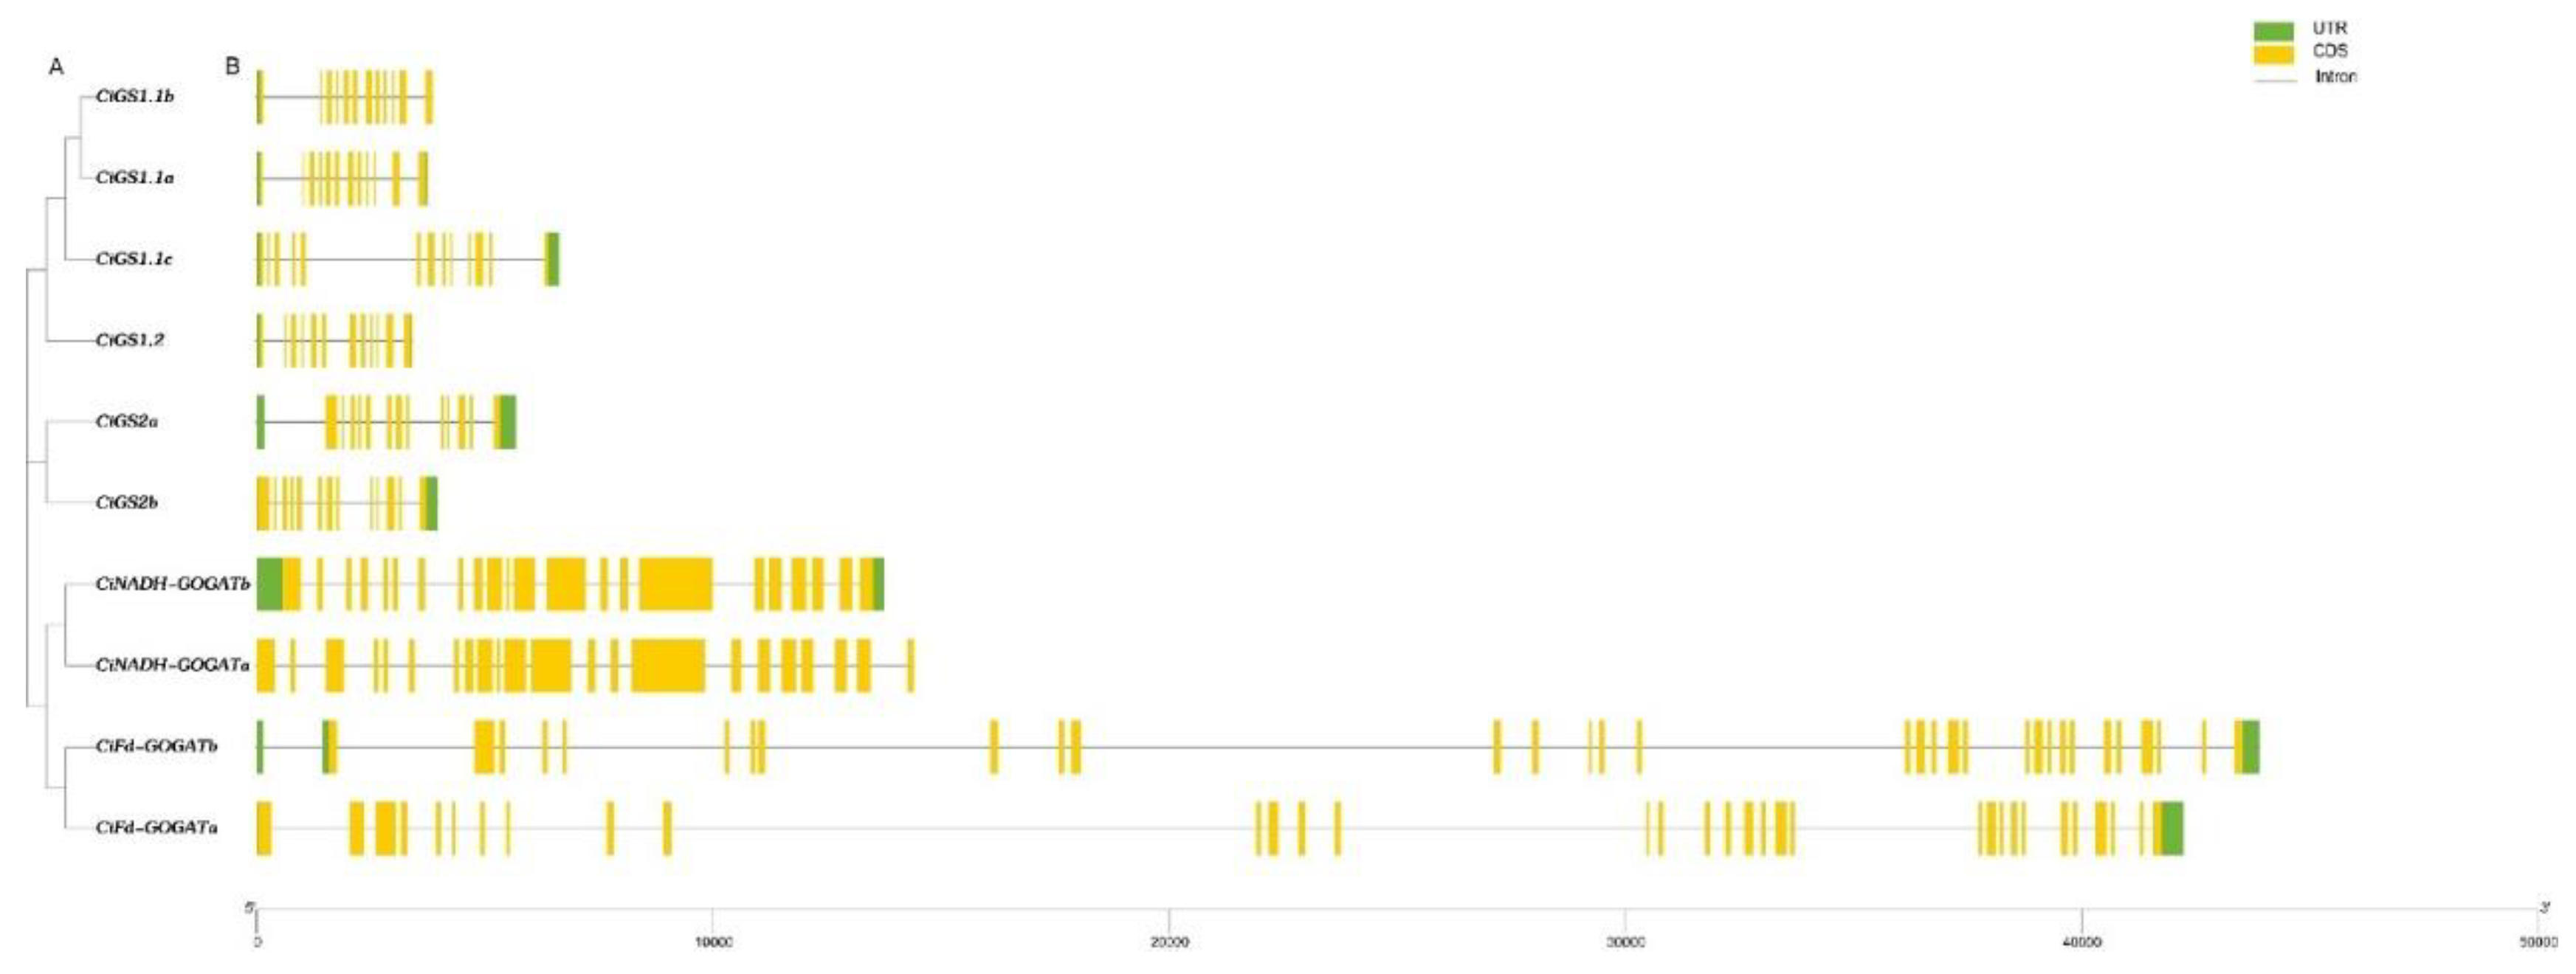
To better understand the sequence and structural features of the GS and GOGAT genes in hickory, their conserved motifs and conserved structural domains were analysed. (Figure 3 and Figure 4). Ten motifs were identified using MEME to illustrate the protein structures of the CiGS and CiGOGAT families. The results showed that 6 CiGS and 4 CiGOGAT contain all the motifs. Conserved structural domain analysis showed that CiGS had two conserved structural domains, Gln-synt_C and Gln-synt_N, but most CiGS1s (3/4) had Gln-synt_C and all CiGS2s contained Gln-synt_N. The conserved structural domains of CiFd-GOGAT and CiNADH-GOGAT proteins were analysed and the results showed that CiFd-GOGAT has two less conserved structural domains than CiNADH-GOGAT, namely Pyr_redox_2 and Fer4_20. To further understand the structural features of the CiGS and CiGOGAT genes, we analysed their exon-intron structures (Figure 5). Structural analysis of the genes showed that members of the CiGS gene family generally contain 12-13 exons. In the pecan GOGAT gene family, CiNADH-GOGAT contains 20 exons and CiFd-GOGAT contains 28-33 exons. This suggests that CiNADH-GOGAT and CiFd-GOGAT may have different functions.

2.4. Analysis of Cis-Acting Elements in the Promoter Regions of GS and GOGAT Genes in Pecan

We conducted online analysis of the cis-acting elements contained in the 2 kb upstream promoter regions of all CiGS and CiGOGAT gene (Figure 6). The results showed that cis-acting elements in the promoter regions of CiGS and CiGOGAT genes can be roughly divided into light-responsive elements, hormone-responsive elements, and stress-responsive elements. The most abundant elements in the promoter regions of CiGS and CiGOGAT genes were found to be light-responsive elements, suggesting that these two proteins may be regulated by light. Five types of hormone-responsive elements were detected, including gibberellin-responsive elements, abscisic acid-responsive elements, auxin-responsive elements, and salicylic acid and jasmonic acid-responsive elements. The functional elements related to stress include low-temperature responsive elements and defense stress-responsive elements. These results suggested that CiGSs and CiGOGATs might be involved in many complex physiological activities in plants such as plant growth and development as well as various stresses responses.

2.5. Duplication Events and Syntenic Analysis of CiGS and CiGOGAT Genes

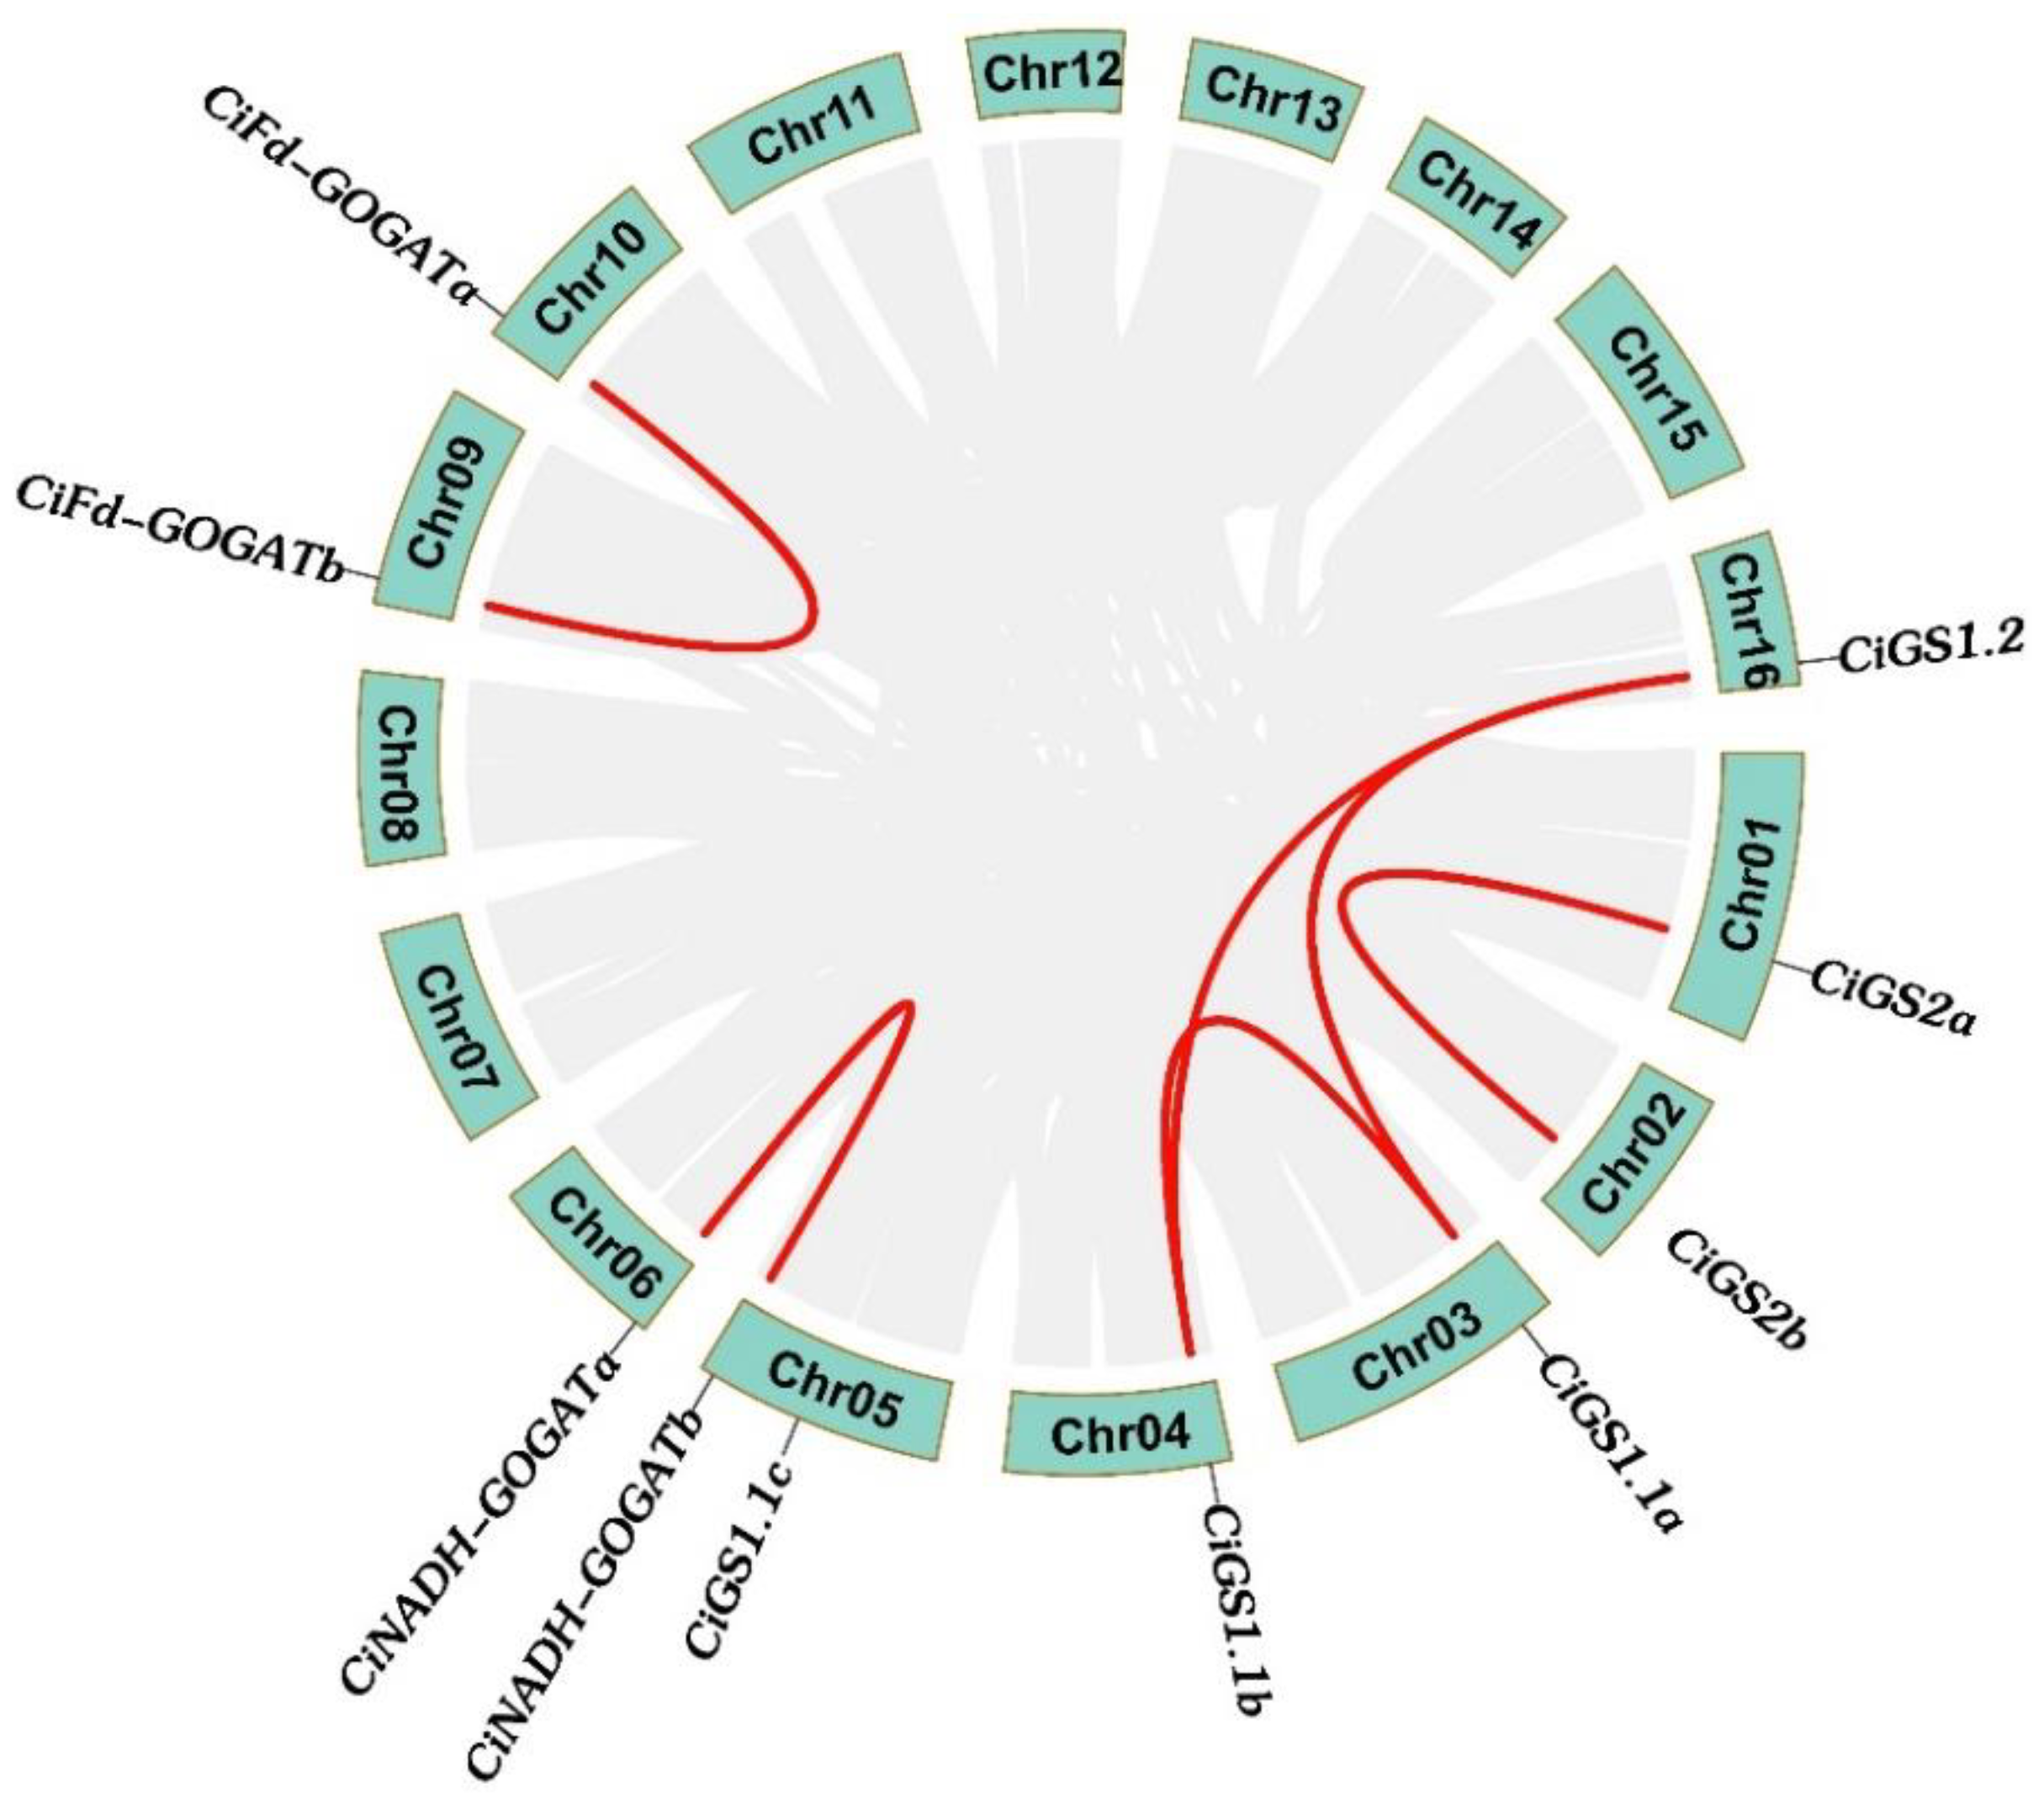
In order to study the evolution process of GS and GOGAT genes between species, we conducted a genome-wide collinearity analysis of pecan, walnut and Arabidopsis (Figure 7). The 6 CiGS genes were collinear with 14 JrGS genes and 10 AtGS genes, and 4 CiGOGAT genes are collinear with 7 JRGS genes and 3 AtGS genes, showing that multiple collinear gene pairs between three species were inferred to be genetic copies with lineage-specific amplification. In addition, an intra-species collinearity analysis was also conducted (Figure 6), which revealed four pairs and two pairs of collinear genes in the GS and GOGAT gene families of pecan, respectively. These collinear gene pairs were CiGS1.1a and CiGS1.1b, CiGS1.1a and CiGS1.2, CiGS1.1b and CiGS1.2, CiGS2a and CiGS2b, CiFd-GOGATa and CiFd-GOGATb, and CiNADH-GOGATa and CiNADH-GOGATb. In evolutionary analysis (Table 2), the ratio of Ka to Ks is usually used to determine whether a gene is subjected to natural selection, where Ka/Ks > 1 indicates positive selection, Ka/Ks = 1 indicates neutral selection, and Ka/Ks < 1 indicates negative selection. The results showed that the members of the GS and GOGAT gene families were subjected to relatively weak selection pressure, ranging from 0.03 to 0.59, indicating purification of GS and GOGAT during the evolutionary process.

2.6. Tissue-Specific Expression Analysis of the CiGS and CiGOGAT Genes

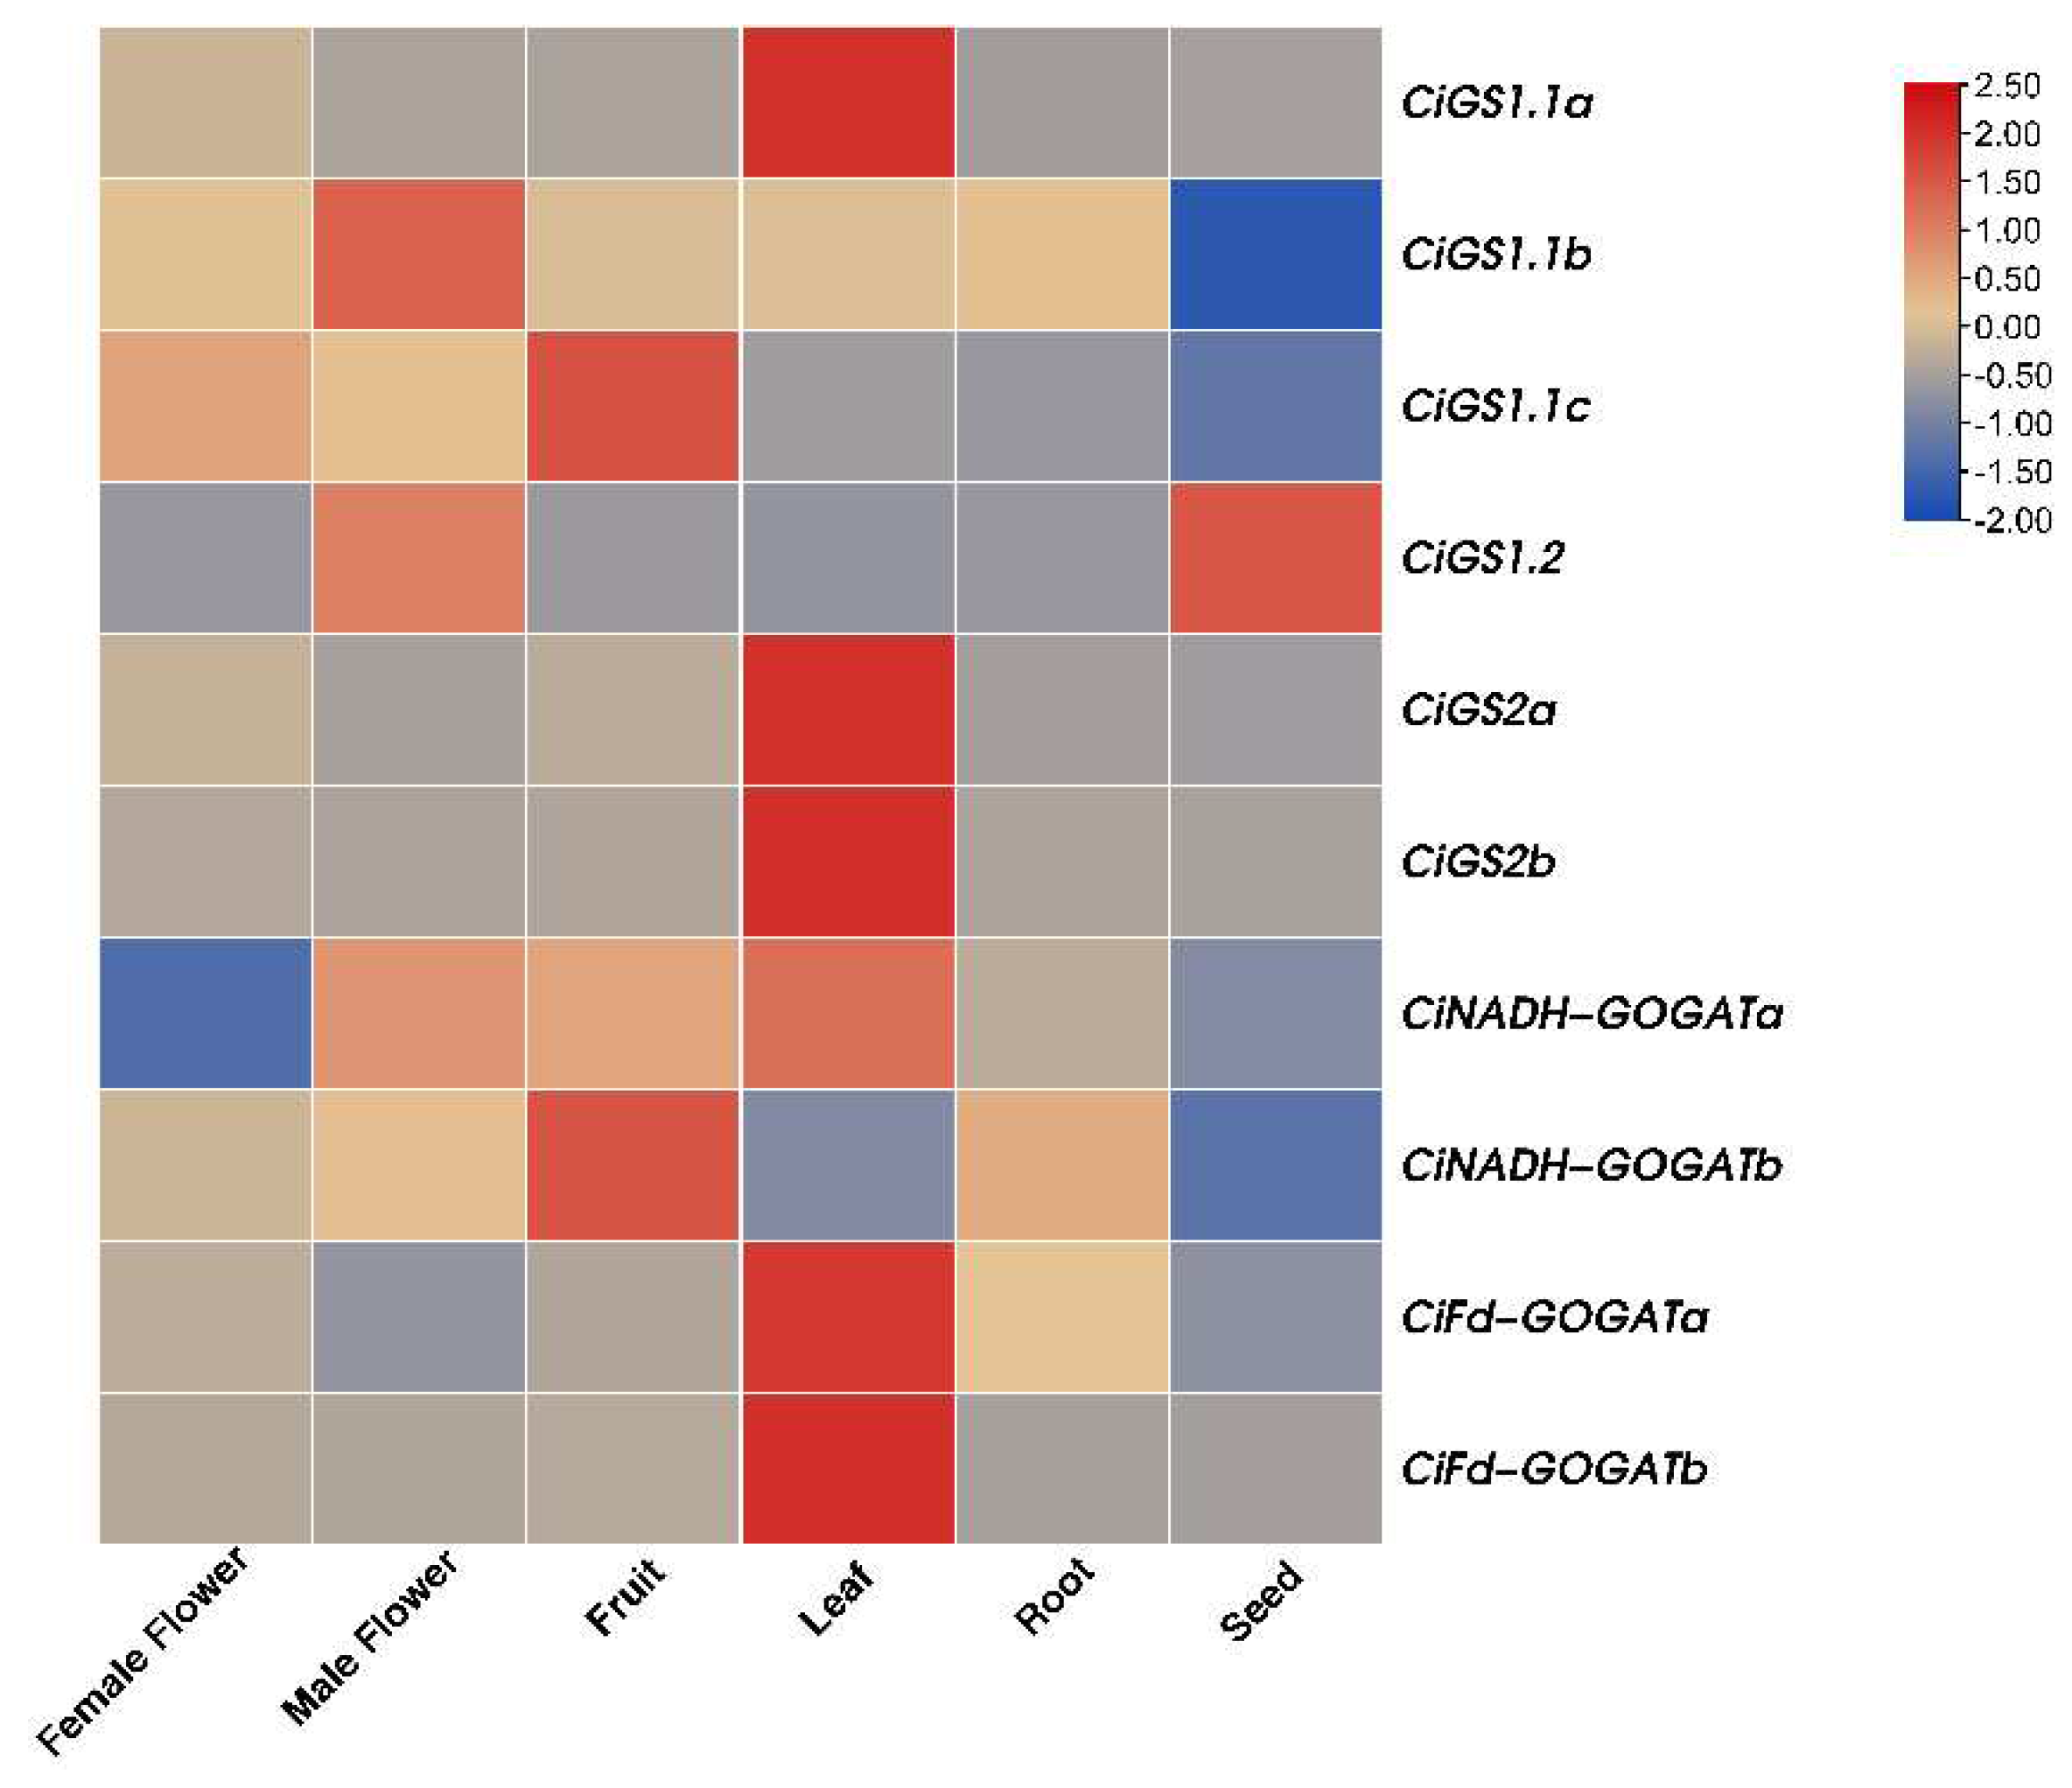
In order to reveal the potential role of the CiGS and CiGOGAT gene families in pecan developmental biology, we conducted tissue-specific analysis of these genes. Analysis of transcriptome data of GS and GOGAT in different tissues of pecan (Figure 9) showed that CiGS1.1a was expressed at high levels in leaves, while CiGS1.1b and CiGS1.1c were expressed at high levels in male flowers and fruits, respectively; CiGS1.2 wrere highly expressed in male flowers and seeds; CiGS2s were expressed at a high level in leaves; For CiGOGAT, we can find that CiNADH-GOGATa had a higher expression level in leaves, fruits, and male flowers; CiNADH-GOGATb was highly expressed in fruits; CiFd GOGATbs were expressed at high levels in leaves.

2.7. Effects of N Forms on GS and GOGAT Enzyme Activity of Pecan

The analysis of GS and GOGAT enzyme activities in different N forms of pecan leaves (Figure 10) showed that all N form treatments increased the GS and GOGAT enzyme activity in the leaves (p < 0.05). GS enzyme activity analysis showed that GS enzyme activity was significantly increased under T2, T3, T4, and T5 treatments, but under T3, T4, and T5 treatments, GS enzyme activity was higher than T2 treatment (p < 0.05). GOGAT enzyme activity analysis showed that except for T2 treatment, all other treatments significantly increased Fd-GOGAT activity in leaves (p<0.05), with T5 being the most significant. Except for T1 treatment, all other treatments significantly increased the activity of NADH-GOGAT in leaves (p<0.05), but T3, T4, and T5 treatments were more significant (p < 0.05).

2.8. Effect of N Forms on GS and GOGAT Gene Expression Levels in Pecan

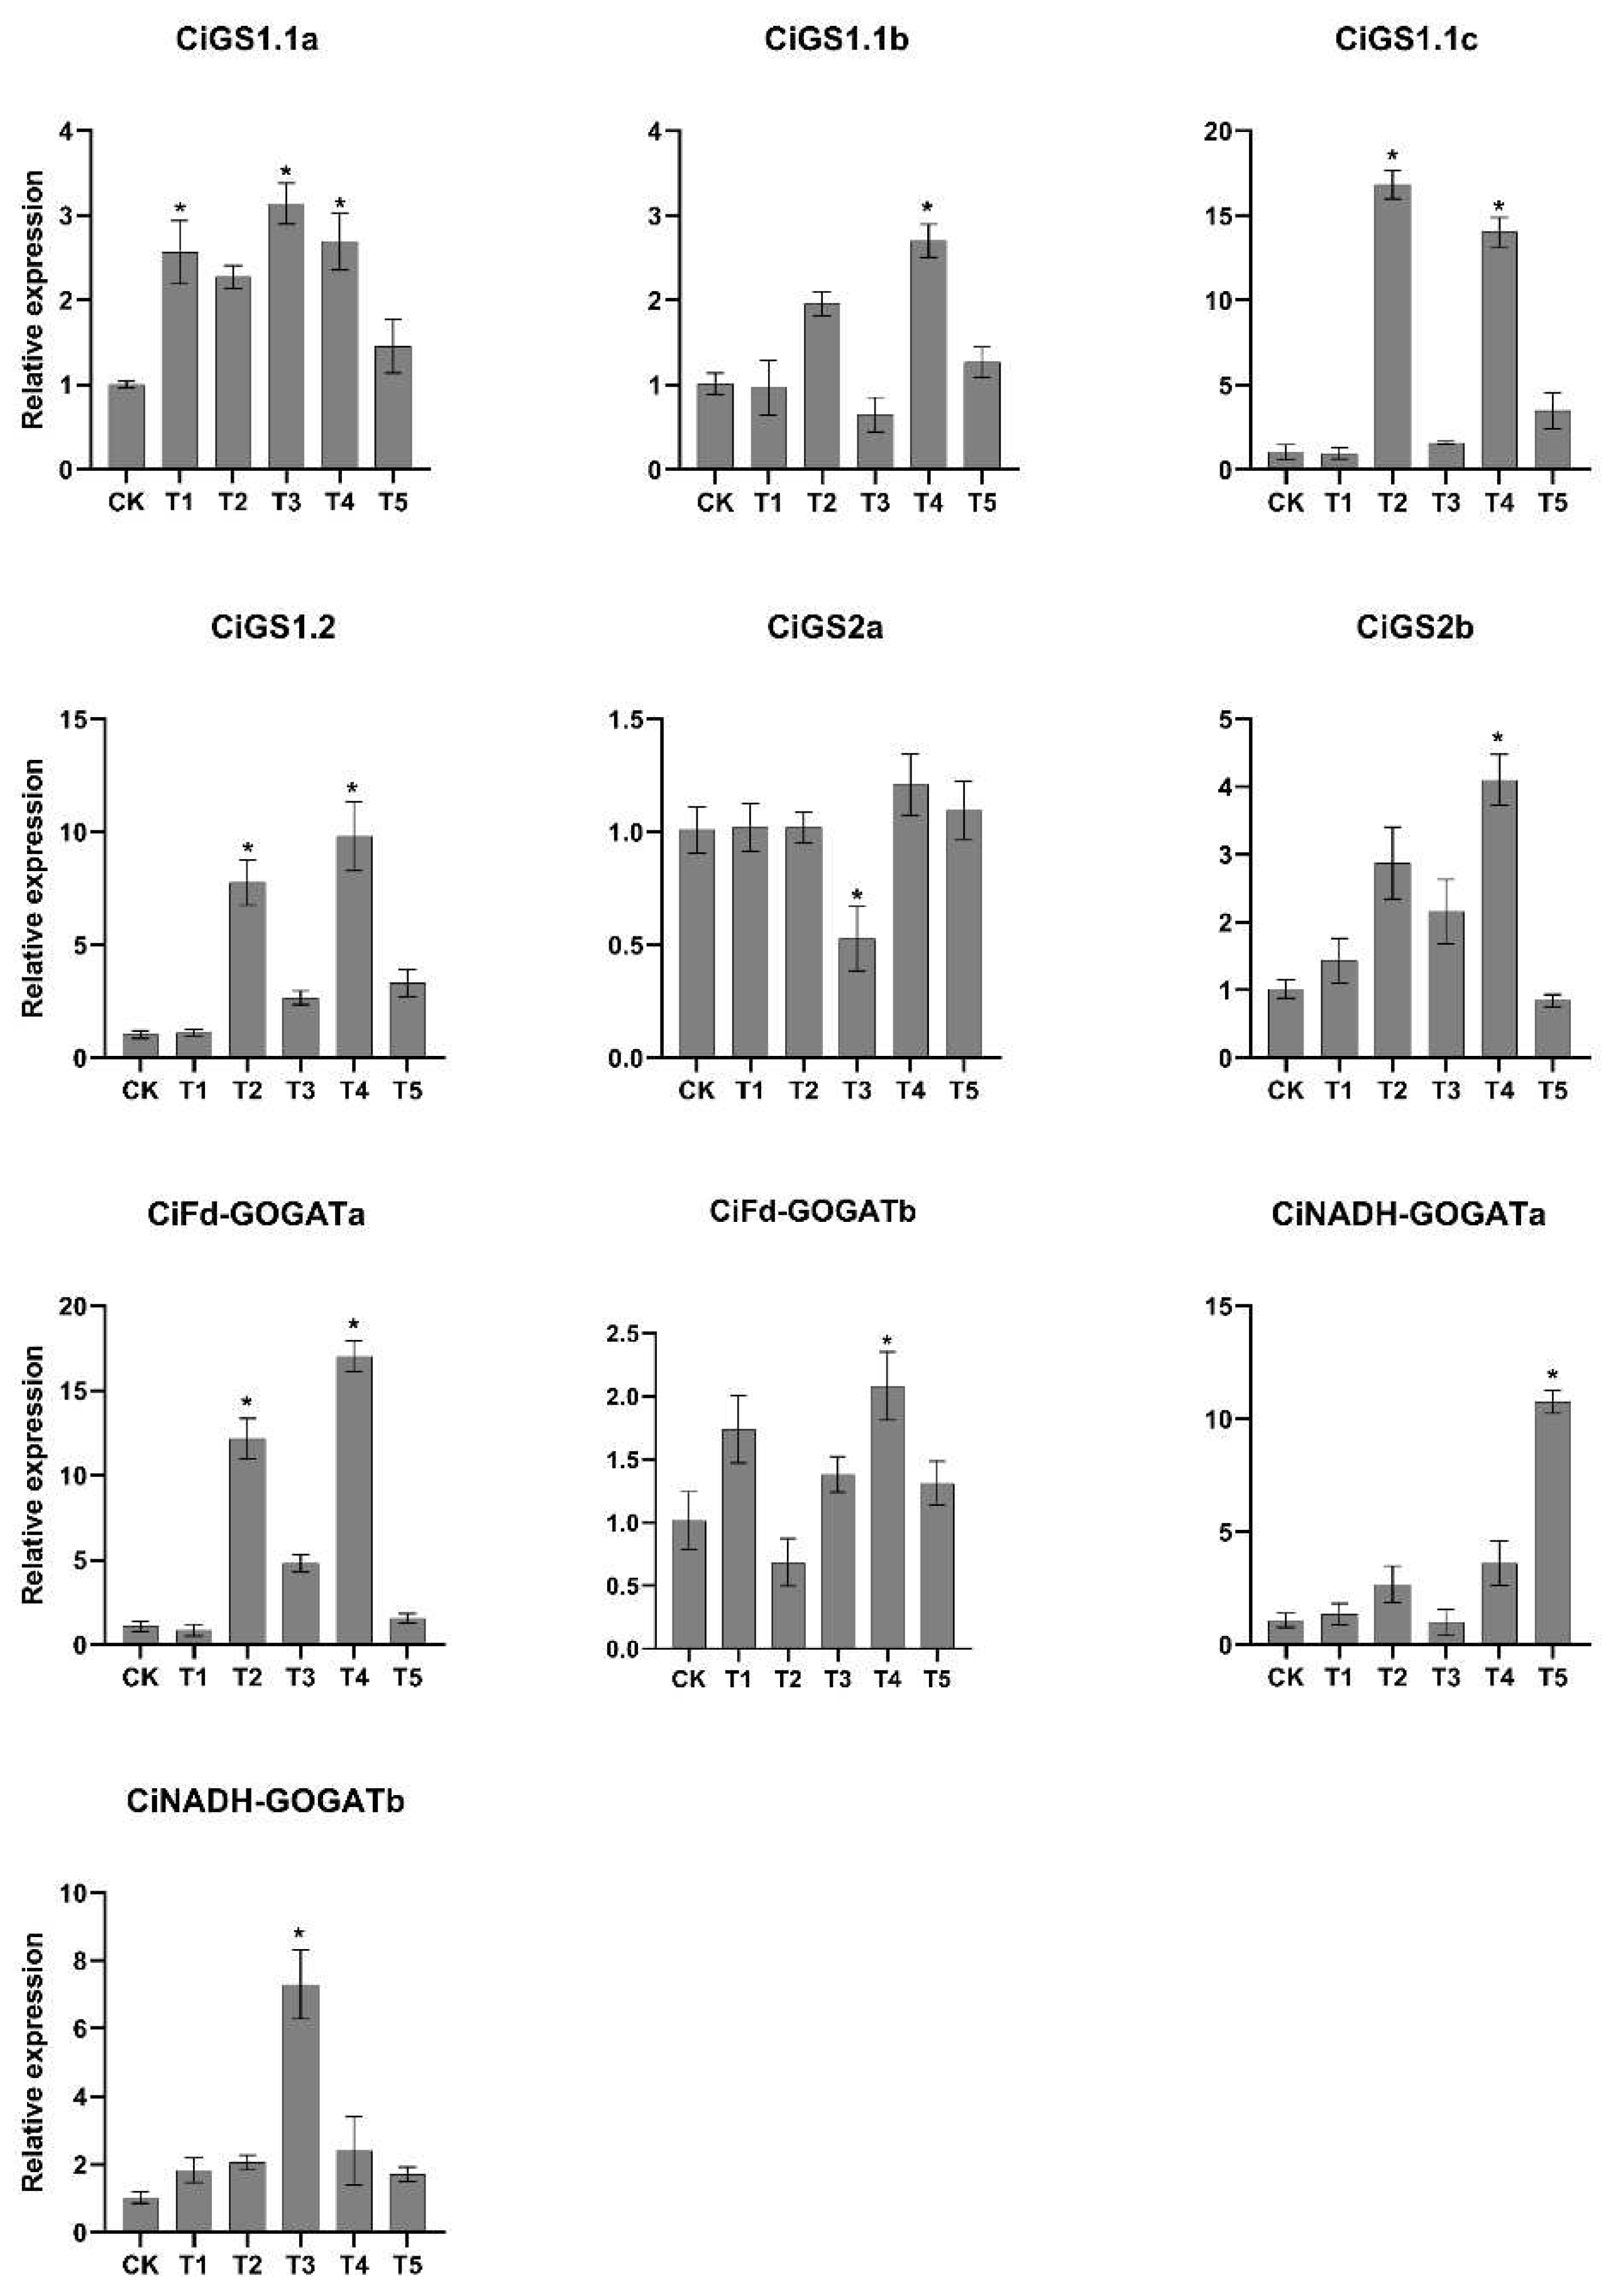
To further explore the expression changes in the CiGS and CiGOGAT genes under different nitrogen treatments, we conducted qRT-PCR analysis. The analysis of qRT-PCR results (Figure 11) showed that the expression level of CiGS1.1a was upregulated under all treatments, except for T5 treatment, all other treatments were significantly upregulated, and T3 treatment was the most significant (p < 0.05). The expression levels of CiGS1.1b, CiGS1.1c, and CiGS1.2 were significantly upregulated under T2 and T4 treatments, and CiGS1.1b and CiGS1.2 were more significantly upregulated under T4 treatment (p < 0.05). The expression level of CiGS2a was significantly downregulated in T3 treatment, while the expression level of CiGS2b was significantly upregulated in T1 and T4 treatment. The expression level of CiFd-GOGATa was significantly upregulated in T2, T3 and T4 treatment, and the expression level of T4 treatment was significantly higher than that of T2 and T3 treatment (p < 0.05). The expression level of CiFd-GOGATb was significantly higher in T4 treatment than in T1 treatment (p < 0.05). The expression level of CiFd-GOGATb was upregulated in all treatments except T2 treatment, and the upregulation was more significant in T4 treatment. The expression levels of CiNADH-GOGATa and CiNADH-GOGATb were significantly upregulated under T5 and T3 treatments (p < 0.05), respectively. The different expression patterns under different nitrogen treatments indicate that CiGS and CiGOGAT exhibit different reactions and regulatory mechanisms under different nitrogen treatment conditions.

3. Discussion

N is an important nutrient in the growth and development of plants. However, the metabolism of N requires the participation of multiple enzymes, among which the GS/GOGAT cycle is crucial [28]. Cytoplasmic GS1 and chloroplast GS2 have different molecular weights, GS1 are 38–40 kDa and are encoded by three to five gene, GS2 are 44–45 kDa, and usually encoded by only one gene [15]. A similar identification result was obtained for the GS gene family members in pecan. Motifs are conserved sequences in proteins that form an important part of protein structure. Studying conserved motifs to identify the conserved domains of unknown proteins can further analyze the characteristics and functions of proteins [29]. It is found that the conserved functional motif of GS isozymes that may facilitate compartmentalized NH4+ metabolism as well as may associate with additional physiological processes in the plant system [30]. CiGS2 and CiNADH-GOGAT contain more structural domains and have a higher number of introns and exons, indicating that these two genes have complex structures [31], which ultimately result in their diverse biological functions. Plant promoter is one of the important cis-elements for regulating functional gene expression in plants. The analysis of promoters can help to elucidate the regulatory and responsive mechanisms of gene expression [32]. In our analysis of the cis-acting elements of the GS and GOGAT genes in pecan, we found that the promoter sequences of these two genes contain multiple cis-elements related to hormone responses and stress tolerance, indicating that the GS and GOGAT genes in pecan are involved in hormone response and stress tolerance regulation. These results are similar to those of studies on poplar [27] and wheat [33]. The number of GS and GOGAT genes varies among different species, indicating that they may have undergone genome-wide replication [34]. Collinearity analysis revealed that compared with AtGS and AtGOGAT, there were a higher number of GS and GOGAT replicates in both CiGS, CiGOGAT and JrGS, JrGOGAT (Figure 7), presumably due to a higher number of orthologs from the same genus, thus retaining corresponding similar functions. At the same time, the divergence rate of CiGS and CiGOGAT genes were calculated (Table 3), and a Ka/Ks value of less than 1 was found, which indicated that the genes of CiGS and CiGOGAT were subjected to purification selection.
The initial assimilation of nitrogen in plants is completed by the cycling of GS-GOGAT into glutamate and glutamine, which are then used for the synthesis of other nitrogenous compounds, a process that reduces the accumulation of ammonia and thus reduces plant damage [5]. Our analysis of transcriptome heat maps (Figure 9) shows that GS2 and Fd-GOGAT are expressed at high levels mainly in the leaves of pecan, which may be related to their primary location. Numerous studies on GS and GOGAT isoenzymes have shown that GS2 and Fd-GOGAT are mainly present in the chloroplasts of green leaves and it is suggested that together they are responsible for the assimilation of photorespiratory NH4+ and nitrite-reduced NH4+ in the chloroplasts [25]. NADH-GOGAT is mainly expressed at high levels in non-photosynthetic tissues, and in non-leguminous plants it may be responsible for the reassimilation of amino acid catabolism to release NH4+ [35]. NADH-GOGATb and GS1.1c have similar levels of expression, suggesting that the two isozymes may together be responsible for ammonia assimilation in non-photosynthetic tissues, and that GS1.2 may be involved in the recycling of stored nitrogen in germinating seeds.
GS not only participates in N assimilation but also serves as a key enzyme for N transfer and utilization. Its activity is closely related to plant growth stages, as well as plant tissue and organs [34]. During senescence, total leaf GS activity decreases. However, it was possible to detect an increased accumulation of GS1-related mRNAs and polypeptides since the onset of leaf development until the final stages of leaf senescence [36]. Our study found that different ratios of N forms could promote the activity of GS and GOGAT in pecan, and when the proportion of NH4+ was higher than that of NO3-, the promotion of enzyme activity was more significant. This may be due to NH4+ being a major substrate for GS. However, research in soybean (Glycine max (L.) Merr.) has found that this phenomenon may be related to the presence of NR, which can indirectly promote GS activity [37]. The activity of NADH-GOGAT was higher than that of Fd-GOGAT, which may be related to the affinity of the two isozymes to the reaction substrate. It has also been shown that the activity of GOGAT is determined by the amount of electron donor [38]. For different nitrogen forms of treatment, most plants show a strong preference for NO3- over NH4+ [39]. In pecan, we found that the activity of two isoenzymes also increased at higher NH4+ ratios, indicating that pecan may prefer NH4+, and the effect was more pronounced when NO3- and NH4+ were mixed. The enzyme activity of GS and GOGAT is affected by various factors, and the ratio of different N forms is one of the important influencing factors. Inappropriate method of N application also results in substantial N losses via NH3 emission, nitrate leaching and N2O emissions which are both leading to severe environmental contamination [40]. Therefore, an appropriate nitrogen ratio can not only reduce environmental pollution, but also have an important impact on plant growth.
Nitrate (NO3) and ammonium (NH4+) ions are the two main forms of nitrogen absorption by plants, but nitrogen metabolism regulation is a complex process involving the synergistic completion of many enzymes and genes [41]. The application of different forms of nitrogen significantly affects the absorption, assimilation, and utilization of nitrogen by plants [42]. Different nitrogen forms have a certain impact on the activity and expression level of nitrogen assimilation enzymes. We studied the activity and expression levels of GS and GOGAT enzymes in pecan under different nitrogen forms, and found that compared to a single nitrogen form, the mixed application of NO3-N and NH4+-N significantly improved the activity and expression levels of these two enzymes. This is similar to the research results of Xu, G et al. on improving nitrogen utilization efficiency in wheat [43]. Different species have different preferences for the N form, with some plants preferring NH4+, while others prefer NO3 and urea [44]. Research has shown that blackberry plants prefer to absorb NH4+-N [45], while sugarcane crops prefer nitrate [46]. P. australis from Australia is a typical species that exhibits NH4+ preference [47]. However, we found that in NO3-N: NH4+-N=50: 50 and NO3-N: NH4+-N=25: 75, the activity and expression levels of pecan GS and GOGAT enzymes were higher, indicating that pecan may prefer NH4+-N. We also found a positive correlation between GS and GOGAT enzyme activities under different nitrogen treatments, which may be related to their production of glutamine/glutamate for carbon metabolism. At high ammonium levels, enzymes and their expression decrease, which may be due to the toxicity of ammonium. Symptoms of plant poisoning caused by high ammonium concentration include reduced plant growth, interference with photosynthetic activity, and imbalance in C-N metabolism [48]. The GS/GOGAT cycle is the main pathway for ammonium assimilation and detoxification in plant tissues [49]. Therefore, studying the effects of different nitrogen forms on pecan GS and GOGAT is of great significance for improving walnut nitrogen utilization efficiency.

4. Materials and Methods

4.1. Plant Materials and Experimental Design

The experiment was conducted from 15 May 2022 to 30 September 2022 at the Pecan Experimental Base of Nanjing Forestry University (32°52’N, 119°18’E). The experimental material was 14-year-old ’Pawnee’ pecan varieties, and the experiment was replicated three times for each treatment. The experiment consisted of CK (no nitrogen application) and five treatments, namely T1 (NH4+:NO3- =0:100), T2 (NH4+:NO3- =25:75), T3 (NH4+:NO3- =50:50), T4 (NH4+:NO3- =75:25), and T5 (NH4+:NO3- =100:0). The fertilisers used in the experiment were NH4HCO3 (17.1% N content) and Ca(NO3)2 (11% N content) at an annual rate of 700 g N per plant.
The experiment was carried out in three stages. The first fertilization in mid-May accounted for 50% of the total fertilizer applied in the whole year. The second fertilization in early June accounted for 30% of the total fertilizer applied in the year. The third fertilization in mid to late June accounted for 20% of the total annual fertilizer application. 150 g/plant potassium sulfate (K2O 50%) and 625 g/plant potassium perphosphate (P2O5 12%) were applied simultaneously in the second and third fertilization. Before the first fertilization and fruit ripening, 5-8 leaves of ’Pawnee’ should be taken from four different directions of each tree. The samples were kept temporarily in liquid nitrogen and stored in a -80°C laboratory refrigerator.

4.2. Identification of GS and GOGAT Gene Family Members of Pecan

To identify the GS and GOGAT genes of pecan, we downloaded all protein sequences of pecan from the Phytozome database (Phytozome (doe.gov)). First, we downloaded the hidden Markov model (HMM) files of the structural domains Gln-synt_C (PF00120), Gln-synt_N (PF03951), GATase_2 (PF00310), Glu_synthase (PF01645), Glu_syn_centra (PF04898), GXGXG (PF01493), Pyr_redox_2 (PF07992), and Fer4_20 (PF14691) from the Pfam database (Pfam is now hosted by InterPro (xfam.org)) [50]. Then, we used the hmmsearch program in the HMMER3.0 software to search all protein sequences of pecan (E-Value<0.001) and obtained candidate members of the gene families [51]. Next, we downloaded the protein sequences of Arabidopsis GS and GOGAT family members from the TAIR database (TAIR - Home Page (arabidopsis.org)) and compared them with the pecan sequence file (E-Value<0.001). After comparing the two results, we used the NCBI-CDD (Welcome to NCBI Batch CD-search (nih.gov)) to validate the protein sequences again for structural domains. Finally, we determined the members of the GS and GOGAT gene families in pecan. The relative amino acid length (AA), molecular weights (MWs), and theoretical isoelectric points (pIs), etc. of the predicted GS and GOGAT proteins were calculated by ExPASy (https://www.expasy.org/) [52]. Additionally, we used the Cell-PLoc 2.0 (Cell-PLoc 2.0 package (sjtu.edu.cn)) to predict the subcellular localization information of the GS and GOGAT proteins.

4.3. Phylogenetic Analysis

The protein sequences of GS and GOGAT in wheat, maize (Zea mays L.), poplar, walnut (Juglans regia L.), and rice were downloaded from the Phytozome database (https://phytozome-next.jgi.doe.gov). Constructing phylogenetic relationships between wheat, maize, poplar, walnut, rice, Arabidopsis and pecan using the NJ method in MEGA-X software, with the bootstrap value set to 1000 and other parameters default.

4.4. Conserved Structural Domains, Conserved Motifs, and Gene Structural Analysis

The Pfam was used to identify conserved structural domains of GS and GOGAT in pecan. The conserved motifs of GS and GOGAT protein sequences were analyzed using the online tool MEME (MEME - Submission form (meme-suite.org)), with the number of motifs set to 10. Visualize the results using TBtools software [53].

4.5. Analysis of Promoter Cis-Acting Elements

TBtools software was used to extract the 2000 bp upstream sequence of the start codon of GS and GOGAT genes as the promoter sequence. The cis-acting elements in the promoters of GS and GOGAT genes were detected using PlantCARE online software (PlantCARE, a database of plant promoters and their cis-acting regulatory elements (ugent.be)), and the results were visualized using TBtools software [54].

4.6. Gene Duplication Analysis and Ka/Ks Value Calculation

The co-linearity analysis between pecan, walnut and Arabidopsis was performed using the built-in plugin One Step MCScanX in TBtools (Chengjie et al., 2020). The internal members of the GS and GOGAT gene families of pecan were analyzed for co-linearity using the built-in plugin Advanced Circos in TBtools [55]. The coding sequences (CDS) of the GS and GOGAT gene families in pecan were aligned using multiple sequence alignment in MEGA7.0. Non-synonymous (Ka), synonymous (Ks), and the Ka/Ks ratio were calculated for the aligned sequence [56].

4.7. Tissue-Specific Expression Analysis of the CiGS and CiGOGAT Genes

To detect the expression patterns of the CiGS and CiGOGAT gene families, transcriptome data was downloaded from login numbers GSE179336 and PRJNA799663. The cluster heat map of the expression levels of the CiGS and CiGOGAT gene in the root, leaf, flower, and seed using TBtools software.

4.8. RNA Extraction and qRT-PCR Analysis

Total RNA was extracted from the leaves of pecan using a Plant Total RNA Extraction Kit (BioTeke, Beijing, China), and the cDNA was generated using the reverse transcription PCR kit (Vazyme, Nanjing, China) from the total RNA. Real time PCR was performed using Taq Pro Universal SYBR qPCR Master Mix (Vazyme, Nanjing, China) on the 7500 real-time PCR system (Applied BiosystemsTM, Foster City, CA, USA). Specific primers were synthesized by Tsingke Biotechnology Ltd. (Nanjing, China), and their detailed information is shown in the Table 3. The Actin gene (CiPaw.03G124400) was used as an internal reference gene, and the PCR parameters applied here were as follows: 95 °C for 30 s, followed by 40 cycles of 5 s at 95 °C, and 15 s at 60 °C. The relative expression levels of the GS and GOGAT genes in pecan were determined using the 2-∆∆Ct method [57]. Values represent mean calculated from three biological replicates and three technological repeats.

4.9. Determination of GS and GOGAT enzyme activity

The enzyme activities of GS and GOGAT were measured using GS, Fd-GOGAT, and NADH-GOGAT assay kits (Keming Biotechnology Co., Ltd. Suzhou, China).

4.10. Data analysis

Before performing the analysis of variance (ANOVA), the normality and homogeneity of variance of the data were checked. One-way ANOVA was used to test the effects of different nitrogen forms on the GS and GOGAT enzyme activities and the relative expression levels of genes in pecan. According to LSD’s multiple range test, differences were considered significant at p<0.05. All statistical analyses were conducted using SPSS software version 23.0 (Chicago, IL, USA). All figures were generated using GraphPad Prism 8 software. The results are presented as means with standard deviation (SD).

5. Conclusions

The GS/GOGAT cycle serves as the primary pathway for NH4+ assimilation in plant, yet its regulatory mechanism within pecan remains incompletely elucidated. This study identified 6 GS genes and 4 GOGAT genes in pecan. Subsequently, these genes underwent bioinformatics analysis, tissue-specific analysis, and assessment of expression levels under varying N forms. The response of these genes varied across different tissues and N forms. This establishes a foundational framework for future investigations into the functions and roles of CiGS and CiGOGAT genes, while also providing a theoretical basis for enhancing N use efficiency in pecan.

Author Contributions

Experimental design, Z.Q., M.C., and F.P.; sample collection. Z.Q. and M.C.; data analysis and writing—original draft preparation, Z.Q., K.Z., J.Z.; writing—review and editing, M.C., and P.T.; project administration and funding acquisition, F.P. All authors have read and agreed to the published version of the manuscript.

Funding

The research was supported by the Central Financial Resources for Forestry Science and Technology Promotion and Demonstration Fund Project of China (Su [2022] TG04) and the National Key R&D Program Project, China (2021YFD1000403).

Informed Consent Statement

The experimental material in this study was plant-based and did not involve human or animal studies; therefore, ethical review and approval was waived for this study.

Conflicts of Interest

The authors declare no competing interests.

References

  1. Guha, T.; Gopal, G.; Mukherjee, A.; Kundu, R. Fe3O4-Urea Nanocomposites as a Novel Nitrogen Fertilizer for Improving Nutrient Utilization Efficiency and Reducing Environmental Pollution. Environ Pollut 2022, 292 (Pt A), 118301. [Google Scholar] [CrossRef]
  2. Chen, M.; Zhu, K.; Tan, P.; Liu, J.; Xie, J.; Yao, X.; Chu, G.; Peng, F. Ammonia–Nitrate Mixture Dominated by NH4+–N Promoted Growth, Photosynthesis and Nutrient Accumulation in Pecan (Carya Illinoinensis). Forests 2021, 12, 1808. [Google Scholar] [CrossRef]
  3. Boczulak, S. A.; Hawkins, B. J.; Roy, R. Temperature Effects on Nitrogen Form Uptake by Seedling Roots of Three Contrasting Conifers. Tree Physiology 2014, 34, 513–523. [Google Scholar] [CrossRef] [PubMed]
  4. De Carvalho Fernandes, G.; Turchetto-Zolet, A. C.; Pereira Passaglia, L. M. Glutamine Synthetase Evolutionary History Revisited: Tracing Back beyond the Last Universal Common Ancestor. Evolution 2022, 76, 605–622. [Google Scholar] [CrossRef]
  5. Bernard, S. M.; Habash, D. Z. The Importance of Cytosolic Glutamine Synthetase in Nitrogen Assimilation and Recycling. New Phytologist 2009, 182, 608–620. [Google Scholar] [CrossRef] [PubMed]
  6. Clermont, K.; Graham, C. J.; Lloyd, S. W.; Grimm, C. C.; Randall, J. J.; Mattison, C. P. Proteomic Analysis of Pecan (Carya Illinoinensis) Nut Development. Foods 2023, 12, 866. [Google Scholar] [CrossRef]
  7. Wang, L.; Chen, F.; Lan, Y.; Liu, H.; Wu, M.; Yan, H.; Xiang, Y. Genome-Wide Identification of B3 Superfamily in Pecan (Carya Illinoensis): In Silico and Experimental Analyses. Scientia Horticulturae 2023, 307, 111533. [Google Scholar] [CrossRef]
  8. Liu, J.; Tang, Y.; Bao, J.; Wang, H.; Peng, F.; Chen, M.; Tan, P. Pecan Plantation Age Influences the Structures, Ecological Networks, and Functions of Soil Microbial Communities. Land Degradation & Development 2022, 33, 3294–3309. [Google Scholar] [CrossRef]
  9. Reyes-Vázquez, N. del C.; Rosa, L. A. de la; Morales-Landa, J. L.; García-Fajardo, J. A.; García-Cruz, M. Á. Phytochemical Content and Potential Health Applications of Pecan [Carya Illinoinensis (Wangenh) K. Koch] Nutshell. Current Topics in Medicinal Chemistry 22, 150–167.
  10. Juhaimi, F. A.; Özcan, M. M.; Uslu, N.; Doğu, S. Pecan Walnut (Carya Illinoinensis (Wangenh.) K. Koch) Oil Quality and Phenolic Compounds as Affected by Microwave and Conventional Roasting. J Food Sci Technol 2017, 54, 4436–4441. [Google Scholar] [CrossRef]
  11. Zhu, K.; Fan, P.; Liu, H.; Tan, P.; Ma, W.; Mo, Z.; Zhao, J.; Chu, G.; Peng, F. Insight into the CBL and CIPK Gene Families in Pecan (Carya Illinoinensis): Identification, Evolution and Expression Patterns in Drought Response. BMC Plant Biol 2022, 22, 221. [Google Scholar] [CrossRef]
  12. Lebedev, V. G.; Korobova, A. V.; Shendel, G. V.; Kudoyarova, G. R.; Shestibratov, K. A. Effect of Glutamine Synthetase Gene Overexpression in Birch (Betula Pubescens) Plants on Auxin Content and Rooting in Vitro. Dokl Biochem Biophys 2018, 480, 143–145. [Google Scholar] [CrossRef] [PubMed]
  13. Pascual, L.; Solé-Medina, A.; Faci, I.; Giraldo, P.; Ruiz, M.; Benavente, E. Development and Marker-Trait Relationships of Functional Markers for Glutamine Synthetase GS1 and GS2 Homoeogenes in Bread Wheat. Mol Breeding 2023, 43, 8. [Google Scholar] [CrossRef] [PubMed]
  14. Yin, H.; Sun, Q.; Lu, X.; Zhang, L.; Yuan, Y.; Gong, C.; He, X.; Ma, W.; Mu, P. Identification of the Glutamine Synthetase (GS) Gene Family in Four Wheat Species and Functional Analysis of Ta4D. GSe in Arabidopsis Thaliana. Plant Mol Biol 2022, 110, 93–106. [Google Scholar] [CrossRef] [PubMed]
  15. Moreira, E.; Coimbra, S.; Melo, P. Glutamine Synthetase: An Unlikely Case of Functional Redundancy in Arabidopsis Thaliana. Plant Biol (Stuttg) 2022, 24, 713–720. [Google Scholar] [CrossRef] [PubMed]
  16. Gene expression, cellular localisation and function of glutamine synthetase isozymes in wheat (Triticum aestivum L.) - PubMed. https://pubmed.ncbi.nlm.nih.gov/18288574/.
  17. Fujita, T.; Beier, M. P.; Tabuchi-Kobayashi, M.; Hayatsu, Y.; Nakamura, H.; Umetsu-Ohashi, T.; Sasaki, K.; Ishiyama, K.; Murozuka, E.; Kojima, M.; Sakakibara, H.; Sawa, Y.; Miyao, A.; Hayakawa, T.; Yamaya, T.; Kojima, S. Cytosolic Glutamine Synthetase GS1;3 Is Involved in Rice Grain Ripening and Germination. Front. Plant Sci. 2022, 13, 835835. [Google Scholar] [CrossRef] [PubMed]
  18. Chloroplast and cytosolic glutamine synthetase are encoded by homologous nuclear genes which are differentially expressed in vivo - PubMed. https://pubmed.ncbi.nlm.nih.gov/2898472/.
  19. Swarbreck, S. M.; Defoin-Platel, M.; Hindle, M.; Saqi, M.; Habash, D. Z. New Perspectives on Glutamine Synthetase in Grasses. Journal of Experimental Botany 2011, 62, 1511–1522. [Google Scholar] [CrossRef] [PubMed]
  20. Nigro, D.; Blanco, A.; Anderson, O. D.; Gadaleta, A. Characterization of Ferredoxin-Dependent Glutamine-Oxoglutarate Amidotransferase (Fd-GOGAT) Genes and Their Relationship with Grain Protein Content QTL in Wheat. PLoS One 2014, 9, e103869. [Google Scholar] [CrossRef] [PubMed]
  21. Peterman, T. K.; Goodman, H. M. The Glutamine Synthetase Gene Family of Arabidopsis Thaliana: Light-Regulation and Differential Expression in Leaves, Roots and Seeds. Mol Gen Genet 1991, 230, 145–154. [Google Scholar] [CrossRef] [PubMed]
  22. Marchive, C.; Roudier, F.; Castaings, L.; Bréhaut, V.; Blondet, E.; Colot, V.; Meyer, C.; Krapp, A. Nuclear Retention of the Transcription Factor NLP7 Orchestrates the Early Response to Nitrate in Plants. Nat Commun 2013, 4, 1713. [Google Scholar] [CrossRef]
  23. Jor, K. W.; Blackwell, R. D.; Lea, P. J. Assimilation of Nitrogen in Mutants Lacking Enzymes of the Glutamate Synthase Cycle. Journal of Experimental Botany 1992, 43, 139–145. [Google Scholar] [CrossRef]
  24. García-Gutiérrez, Á.; Cánovas, F. M.; Ávila, C. Glutamate Synthases from Conifers: Gene Structure and Phylogenetic Studies. BMC Genomics 2018, 19, 65. [Google Scholar] [CrossRef] [PubMed]
  25. Teh, C.-Y.; Shaharuddin, N. A.; Ho, C.-L.; Mahmood, M. Exogenous Proline Significantly Affects the Plant Growth and Nitrogen Assimilation Enzymes Activities in Rice (Oryza Sativa) under Salt Stress. Acta Physiol Plant 2016, 38, 151. [Google Scholar] [CrossRef]
  26. Lu, Y.; Luo, F.; Yang, M.; Li, X.; Lian, X. Suppression of Glutamate Synthase Genes Significantly Affects Carbon and Nitrogen Metabolism in Rice (Oryza Sativa L.). Sci. China Life Sci. 2011, 54, 651–663. [Google Scholar] [CrossRef]
  27. Cao, L.; Xu, C.; Sun, Y.; Niu, C.; Leng, X.; Hao, B.; Ma, J.; Liu, Z.; Xu, Z.; Yang, C.; Liu, G. Genome-Wide Identification of Glutamate Synthase Gene Family and Expression Patterns Analysis in Response to Carbon and Nitrogen Treatment in Populus. Gene 2023, 851, 146996. [Google Scholar] [CrossRef]
  28. Banerjee, S.; Subramanian, A.; Chattopadhyay, J.; Rup Sarkar, R. Exploring the Role of GS–GOGAT Cycle in Microcystin Synthesis and Regulation – a Model Based Analysis. Molecular BioSystems 2017, 13, 2603–2614. [Google Scholar] [CrossRef]
  29. Moons, A. Transcriptional Profiling of the PDR Gene Family in Rice Roots in Response to Plant Growth Regulators, Redox Perturbations and Weak Organic Acid Stresses. Planta 2008, 229, 53–71. [Google Scholar] [CrossRef]
  30. Mondal, R.; Kumar, A.; Chattopadhyay, S. K. Structural Property, Molecular Regulation, and Functional Diversity of Glutamine Synthetase in Higher Plants: A Data-Mining Bioinformatics Approach. The Plant Journal 2021, 108, 1565–1584. [Google Scholar] [CrossRef]
  31. Role of the SPS Gene Families in the Regulation of Sucrose Accumulation in Sugarcane | SpringerLink. https://link.springer.com/article/10.1007/s12355-016-0454-x. 1007.
  32. Zhao, Y.; Cai, M.; Zhang, X.; Li, Y.; Zhang, J.; Zhao, H.; Kong, F.; Zheng, Y.; Qiu, F. Genome-Wide Identification, Evolution and Expression Analysis of MTERF Gene Family in Maize. PLoS One 2014, 9, e94126. [Google Scholar] [CrossRef] [PubMed]
  33. Parveen, R.; Vaish, S.; Gupta, D.; Basantani, M. K. Bioinformatics Characterization of Patatin-Related Phospholipase A (PPLA) Gene Family in Agriculturally Important Crops Viz Vigna Radiata, Vigna Angularis, and Glycine Max. Biologia 2022, 77, 1429–1446. [Google Scholar] [CrossRef]
  34. Wang, H.; He, T.; Huang, C.; Wang, K.; Shi, D.; Si, X.; Xu, Y.; Lyu, S.; Huang, J.; Li, Y. Genome-Wide Identification of KCS Gene Family in Carya Illinoinensis and Their Roles under Abiotic Stress Conditions. Scientia Horticulturae 2023, 321, 112343. [Google Scholar] [CrossRef]
  35. García-Gutiérrez, Á.; Cánovas, F. M.; Ávila, C. Glutamate Synthases from Conifers: Gene Structure and Phylogenetic Studies. BMC Genomics 2018, 19, 65. [Google Scholar] [CrossRef] [PubMed]
  36. Teixeira, J.; Pereira, S.; Cánovas, F.; Salema, R. Glutamine Synthetase of Potato (Solanum Tuberosum L. Cv. Désirée) Plants: Cell- and Organ-Specific Expression and Differential Developmental Regulation Reveal Specific Roles in Nitrogen Assimilation and Mobilization. Journal of Experimental Botany 2005, 56, 663–671. [Google Scholar] [CrossRef] [PubMed]
  37. Suzuki, A. Glutamate Synthase and Amino Acid Synthesis in Higher Plants. In Advances in Botanical Research; Elsevier, 2021; Vol. 100, pp 129–144. [CrossRef]
  38. Anderson, M. P.; Vance, C. P.; Heichel, G. H.; Miller, S. S. Purification and Characterization of NADH-Glutamate Synthase from Alfalfa Root Nodules. Plant Physiol. 1989, 90, 351–358. [Google Scholar] [CrossRef] [PubMed]
  39. del Amor, F. M.; Piñero, M. C.; Otálora-Alcón, G.; Pérez-Jimenez, M.; Marín-Miñano, M. Effect of Different Nitrogen Forms and CO2 Enrichment on the Nutrient Uptake and Water Relations of Pepper Plants (Capsicum Annuun L.). Procedia Environmental Sciences 2015, 29, 203–204. [Google Scholar] [CrossRef]
  40. Wan, X.; Wu, W.; Shah, F. Nitrogen Fertilizer Management for Mitigating Ammonia Emission and Increasing Nitrogen Use Efficiencies by 15N Stable Isotopes in Winter Wheat. Sci Total Environ 2021, 790, 147587. [Google Scholar] [CrossRef] [PubMed]
  41. Chen, H.; Huang, X.; Shi, W.; Kronzucker, H. J.; Hou, L.; Yang, H.; Song, Q.; Liu, J.; Shi, J.; Yang, Q.; Zou, N. Coordination of Nitrogen Uptake and Assimilation Favours the Growth and Competitiveness of Moso Bamboo over Native Tree Species in High-NH4+ Environments. Journal of Plant Physiology 2021, 266, 153508. [Google Scholar] [CrossRef] [PubMed]
  42. Cui, H.; Luo, Y.; Li, C.; Chang, Y.; Jin, M.; Li, Y.; Wang, Z. Effects of Nitrogen Forms on Nitrogen Utilization, Yield, and Quality of Two Wheat Varieties with Different Gluten Characteristics. European Journal of Agronomy 2023, 149, 126919. [Google Scholar] [CrossRef]
  43. Xu, G.; Jiang, M.; Lu, D.; Wang, H.; Chen, M. Nitrogen Forms Affect the Root Characteristic, Photosynthesis, Grain Yield, and Nitrogen Use Efficiency of Rice under Different Irrigation Regimes. Crop Sci. 2020, 60, 2594–2610. [Google Scholar] [CrossRef]
  44. Schulz, H.; Härtling, S.; Stange, C. F. Species-specific Differences in Nitrogen Uptake and Utilization by Six European Tree Species. Z. Pflanzenernähr. Bodenk. 2011, 174, 28–37. [Google Scholar] [CrossRef]
  45. Duan, Y.; Yang, H.; Yang, H.; Wu, Y.; Fan, S.; Wu, W.; Lyu, L.; Li, W. Integrative Physiological, Metabolomic and Transcriptomic Analysis Reveals Nitrogen Preference and Carbon and Nitrogen Metabolism in Blackberry Plants. Journal of Plant Physiology 2023, 280, 153888. [Google Scholar] [CrossRef]
  46. Iqbal, A.; Dong, Q.; Wang, X.; Gui, H.-P.; Zhang, H.; Pang, N.; Zhang, X.; Song, M. Nitrogen Preference and Genetic Variation of Cotton Genotypes for Nitrogen Use Efficiency. Journal of the Science of Food and Agriculture 2020, 100, 2761–2773. [Google Scholar] [CrossRef] [PubMed]
  47. Nakamura, M.; Nakamura, T.; Tsuchiya, T. Advantages of NH4+ on Growth, Nitrogen Uptake and Root Respiration of Phragmites Australis. Plant Soil 2010, 331, 463–470. [Google Scholar] [CrossRef]
  48. Liu, Y.; Von Wirén, N. Ammonium as a Signal for Physiological and Morphological Responses in Plants. Journal of Experimental Botany 2017, 68, 2581–2592. [Google Scholar] [CrossRef] [PubMed]
  49. Gao, J.; Liu, L.; Ma, N.; Yang, J.; Dong, Z.; Zhang, J.; Zhang, J.; Cai, M. Effect of Ammonia Stress on Carbon Metabolism in Tolerant Aquatic Plant—Myriophyllum Aquaticum. Environmental Pollution 2020, 263, 114412. [Google Scholar] [CrossRef] [PubMed]
  50. El-Gebali, S.; Mistry, J.; Bateman, A.; Eddy, S. R.; Luciani, A.; Potter, S. C.; Qureshi, M.; Richardson, L. J.; Salazar, G. A.; Smart, A.; Sonnhammer, E. L. L.; Hirsh, L.; Paladin, L.; Piovesan, D.; Tosatto, S. C. E.; Finn, R. D. The Pfam Protein Families Database in 2019. Nucleic Acids Res 2019, 47, D427–D432. [Google Scholar] [CrossRef] [PubMed]
  51. Finn, R. D.; Clements, J.; Eddy, S. R. HMMER Web Server: Interactive Sequence Similarity Searching. Nucleic Acids Res 2011, 39 (Web Server issue), W29–37. [Google Scholar] [CrossRef]
  52. Wang, Y.; Fan, Z.; Zhai, Y.; Huang, H.; Vainstein, A.; Ma, H. Polygalacturonase Gene Family Analysis Identifies FcPG12 as a Key Player in Fig (Ficus Carica L.) Fruit Softening. BMC Plant Biology 2023, 23, 320. [Google Scholar] [CrossRef] [PubMed]
  53. Chen, C.; Chen, H.; Zhang, Y.; Thomas, H. R.; Frank, M. H.; He, Y.; Xia, R. TBtools: An Integrative Toolkit Developed for Interactive Analyses of Big Biological Data. Mol Plant 2020, 13, 1194–1202. [Google Scholar] [CrossRef] [PubMed]
  54. Tao, Y.-T.; Chen, L.-X.; Jin, J.; Du, Z.-K.; Li, J.-M. Genome-Wide Identification and Analysis of BZIP Gene Family Reveal Their Roles during Development and Drought Stress in Wheel Wingnut (Cyclocarya Paliurus). BMC Genomics 2022, 23, 743. [Google Scholar] [CrossRef]
  55. Ren, C.; Wang, H.; Zhou, Z.; Jia, J.; Zhang, Q.; Liang, C.; Li, W.; Zhang, Y.; Yu, G. Genome-Wide Identification of the B3 Gene Family in Soybean and the Response to Melatonin under Cold Stress. Front Plant Sci 2022, 13, 1091907. [Google Scholar] [CrossRef]
  56. Chen, M.; Zhu, K.; Xie, J.; Liu, J.; Tan, P.; Peng, F. Genome-Wide Identification and Expression Analysis of AMT and NRT Gene Family in Pecan (Carya Illinoinensis) Seedlings Revealed a Preference for NH4+-N. Int J Mol Sci 2022, 23, 13314. [Google Scholar] [CrossRef] [PubMed]
  57. Vandesompele, J.; De Preter, K.; Pattyn, F.; Poppe, B.; Van Roy, N.; De Paepe, A.; Speleman, F. Accurate Normalization of Real-Time Quantitative RT-PCR Data by Geometric Averaging of Multiple Internal Control Genes. Genome Biol 2002, 3, RESEARCH0034. [Google Scholar] [CrossRef] [PubMed]
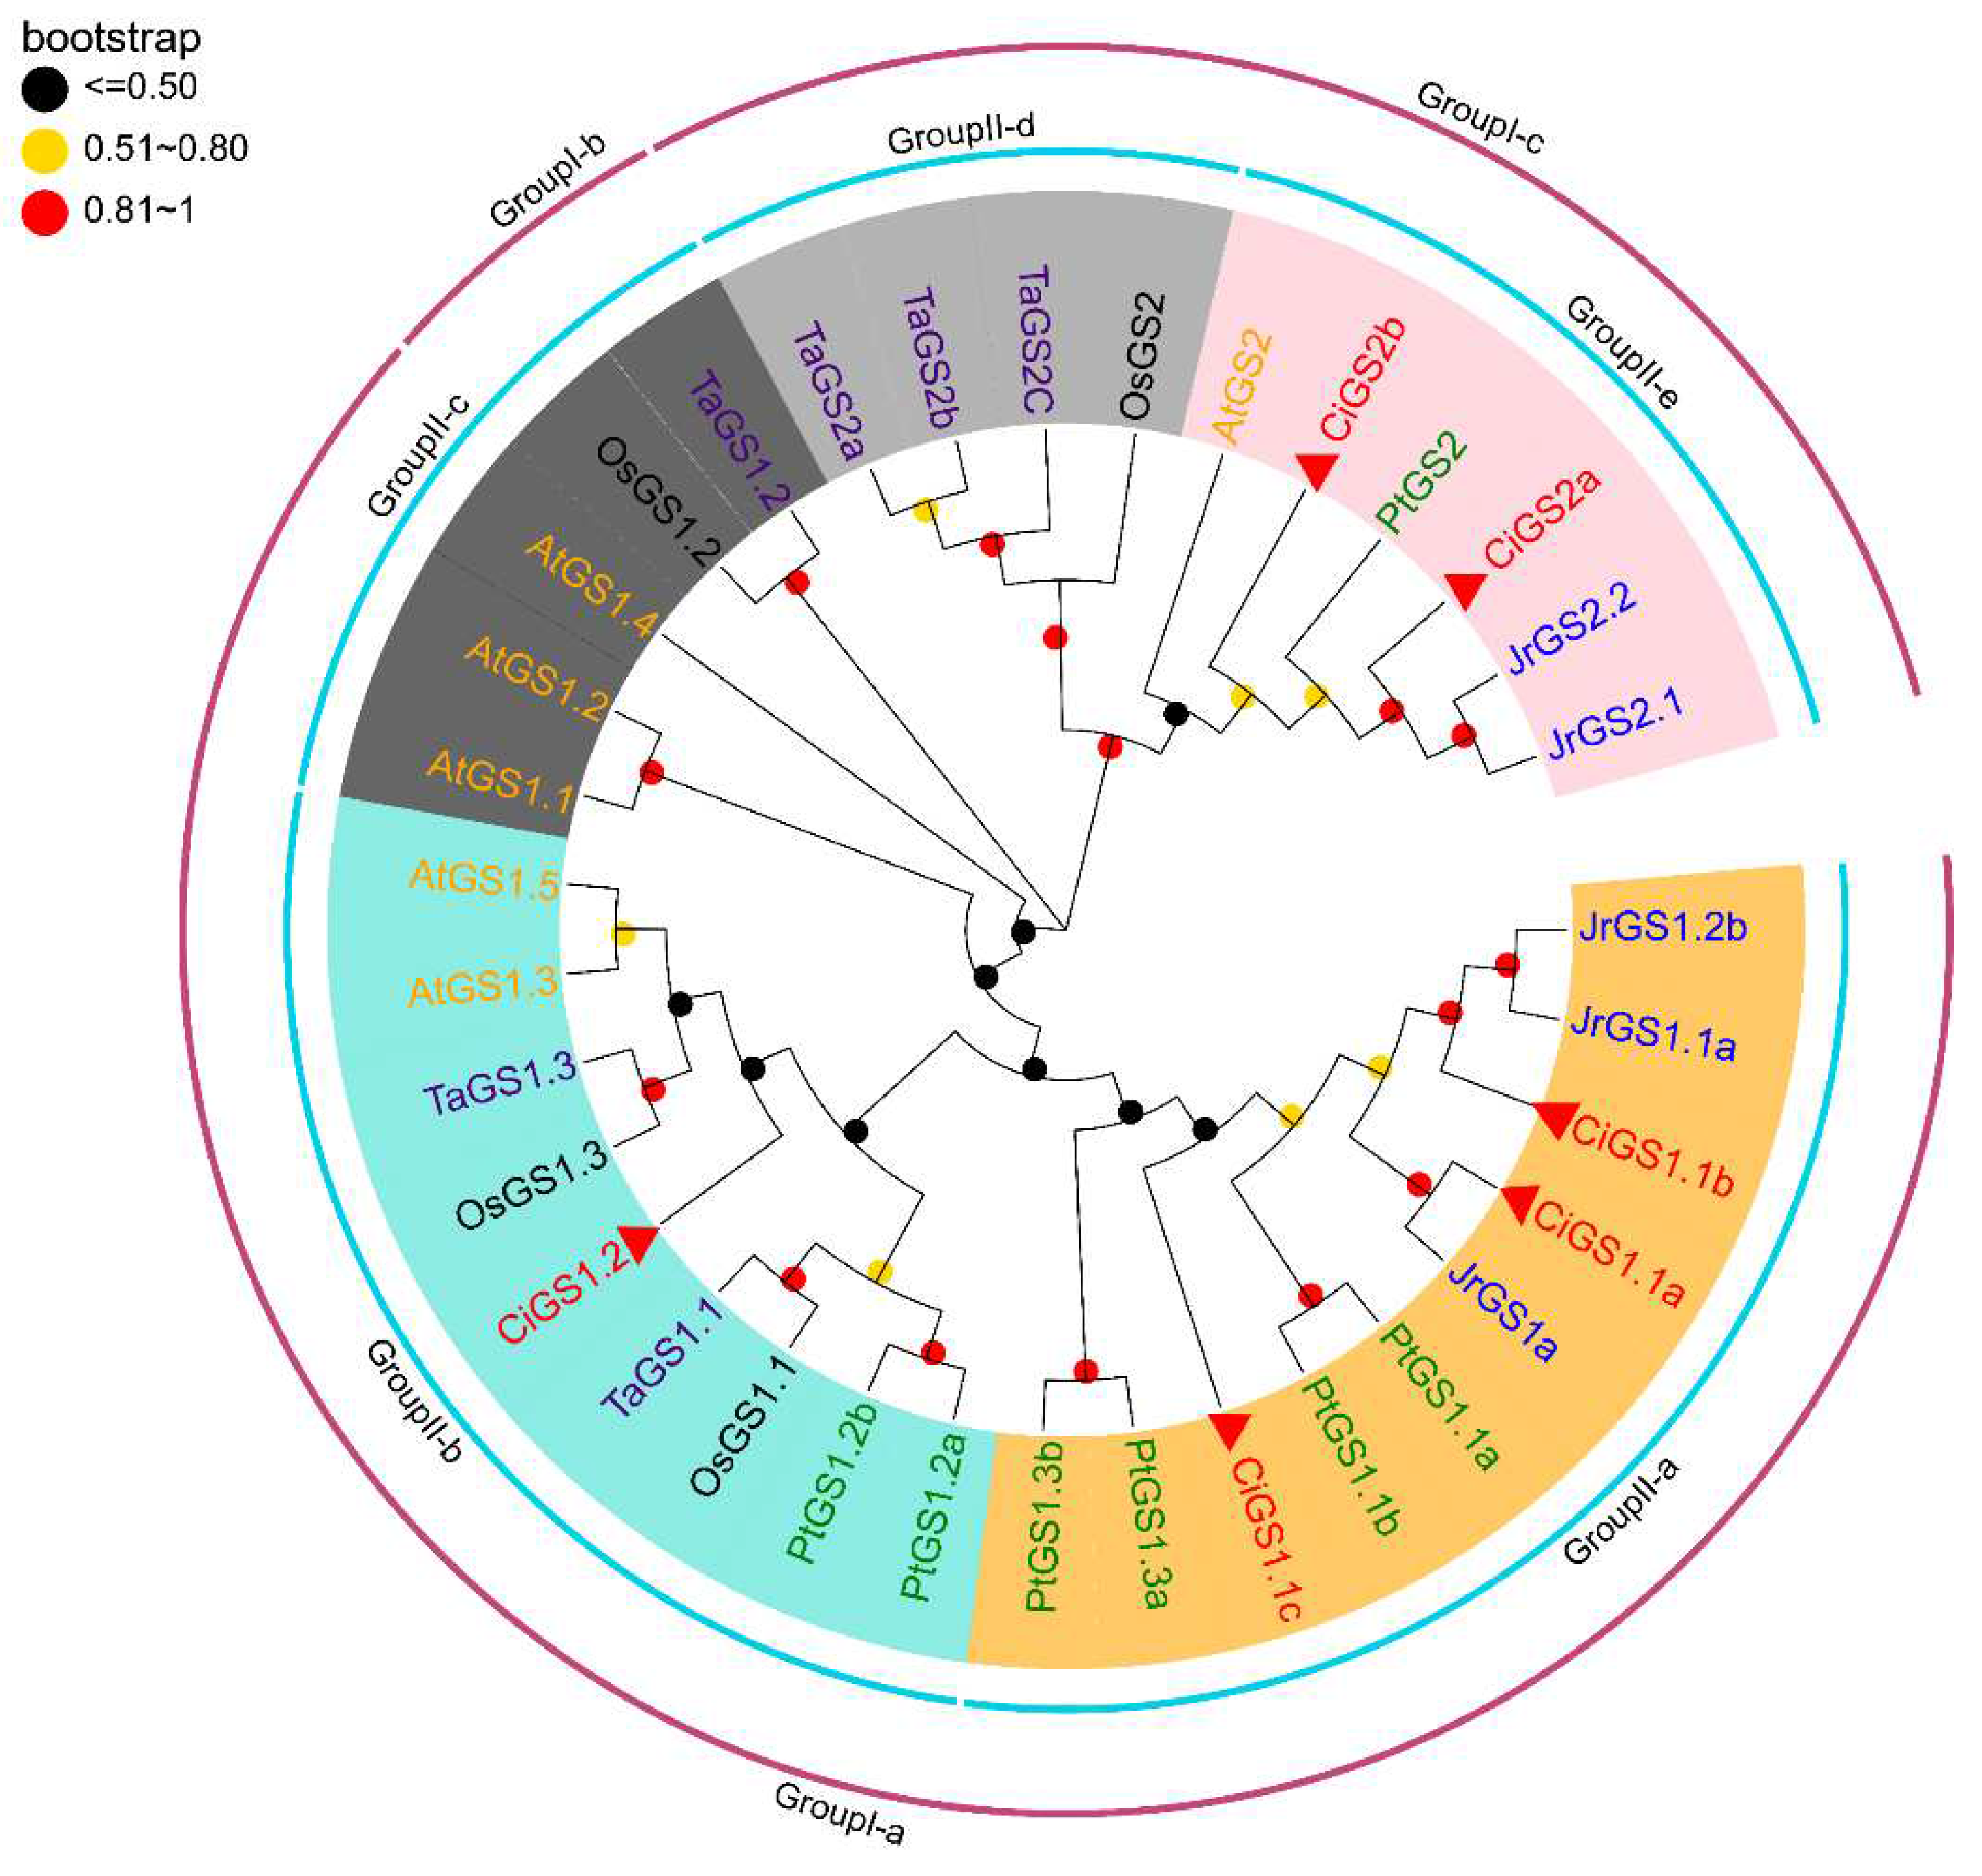
Figure 1. An unrooted neighbor-joining (NJ) phylogenetic tree based on the GS amino acid sequences alignment among C. illinoinensis, J. regia, P. trichocarpa, T. aestivum, Z. mays, O. sativa and A. thaliana with 1000 bootstraps. All the GS members were divided into 5 groups and presented in different colors. The range of Bootstrap values is displayed with circles of different colors. GS: glutamine synthetase.
Preprints 89020 g001
Figure 2. An unrooted neighbor-joining (NJ) phylogenetic tree based on the GOGAT amino acid sequences alignment among C. illinoinensis, J. regia, P. trichocarpa, T. aestivum, Z. mays, O. sativa and A. thaliana with 1000 bootstraps. All the GOGAT members were divided into 5 groups and presented in different colors. The range of Bootstrap values is displayed with circles of different colors. GOGAT: glutamate synthase.
Preprints 89020 g002
Figure 3. Conserved motif and conserved domain of GS genes. (A) The neighbor-joining tree were constructed based on GS proteins from different species. (B) Ten conserved motifs were identified by MEME. Different color boxes indicate different motifs. (C) The conserved domain of the GS genes in different species.
Preprints 89020 g003
Figure 4. Conserved motif and conserved domain of GOGAT genes. (A) The neighbor-joining tree were constructed based on GOGAT proteins from different species. (B) Ten conserved motifs were identified by MEME. Different color boxes indicate different motifs. (C) The conserved domain of the GOGAT genes in different species.
Preprints 89020 g004
Figure 5. (A) The neighbor-joining tree were constructed based on GS and GOGAT proteins from pecan. (B) Plotted CiGS and CiGOGAT genes structures. Yellow color indicated the exons, the green color indicated the UTR, and gray color indicated the introns.
Preprints 89020 g005
Figure 6. (A) The neighbor-joining tree were constructed based on GS and GOGAT proteins from pecan. (B) Cis-acting elements of GS and GOGAT genes in pecan. Different colors indicate different Cis-regulatory element. The CAREs analysis was performed with a 2 kb upstream region using PlantCARE online server. GS: glutamine synthetase; GOGAT: glutamate synthase.
Preprints 89020 g006
Figure 7. Multiple collinearity analysis of GS and GOGAT genes between C. illinoinensis, J. regia and A. thaliana. The blue lines represented the C. illinoinensis genes orthologous with J. regia and A. thaliana, the gray lines in the background denoted the collinear blocks within Carya illinoinensis and other two species genomes. GS: glutamine synthetase; GOGAT: glutamate synthase.
Preprints 89020 g007
Figure 8. Collinearity analysis of the pecan GS and GOGAT gene family. The gray lines showed the syntenic blocks in the pecan genome, the red lines showed the segmental or tandem duplication link regions among CiGS and CiGOGAT genes. The approximately location of CiGS and CiGOGAT genes were labeled with a short black line outside gene names. GS: glutamine synthetase; GOGAT: glutamate synthase.
Preprints 89020 g008
Figure 9. Expression abundance of CiGS and CiGOGAT genes in different tissues. The colors indicate expression intensity (red, high expression; blue, low expression).
Preprints 89020 g009
Figure 10. GS and GOGAT enzyme activity under varying NH4+:NO3 ratios in Pecan leaves. GS: glutamine synthetase; GOGAT: glutamate synthase. Bars represent standard error, (*) represent statistical difference between treatments and CK with p < 0,05.
Preprints 89020 g010
Figure 11. Relative expression levels of pecan leaves GS and GOGAT genes under varying NH4+:NO3 ratios. Actin as the reference gene. GS: glutamine synthetase; GOGAT: glutamate synthase. Bars represent standard error, (*) represent statistical difference between treatments and CK with p < 0,05.
Preprints 89020 g011
Table 2. Estimated Ka/Ks ratios of the duplicated CiGS and CiGOGAT genes.
Gene Pairs Ka Ks Ka/Ks
CiGS1.1a/CiGS1.1b 0.0346 0.3328 0.1039
CiGS1.1a/CiGS1.1c 0.0702 2.1672 0.0323
CiGS1.1b/CiGS1.1c 0.0628 1.6209 0.0387
CiGS1.2/CiGS1.1a 0.0678 1.0862 0.0624
CiGS1.2/CiGS1.1b 0.0689 1.0739 0.0641
CiGS1.2/CiGS1.1c 0.0905 —— ——
CiGS2a/CiGS2b 0.0288 0.2568 0.1123
CiNADH-GOGATb/CiNADH-GOGATa 0.0462 0.3583 0.1291
CiFd-GOGATa/CiFd-GOGATb 0.0310 0.2917 0.1064
Notes: GS: glutamine synthetase; GOGAT: glutamate synthase. Ka. Nonsynonymous substitution rate; Ks. Synonymous substitution rate.
Table 3. Primers for qRT-PCR.
Gene name Forward primer (5’-3’) Reverse primer (5’-3’)
CiGS1.1a AATTGACAAGCTTGGCCGGA CGATTGGCGACACCCCATAA
CiGS1.1b CCCAAGCCAATTCAGGGTGAT CCTCAGCCCAAGCTTTCCAA
CiGS1.1c TTGCCGAGGAACCCTGGTAT AATGCCTTGTCTGCCCCTAC
CiGS1.2 CGCTAAAATCGCCTGTTGGG ACCCGATCCACCGATCCATA
CiGS2a CATCCGCCATTCCTGATCTGA CCCCACATCTTTGCTGTCGT
CiGS2b TATTGTAAGGGCTTCCCCCAC CTGTGCCATTTTCACCTCGG
CiFd-GOGATa GACGTGCAAGTACCGCCTT CCAACTTTGCAACCTTCGGT
CiFd-GOGATb GAGGAGCTTCCCGCATTTTC CAAGTTTGCAACCCTCGGTC
CiNADH-GOGATa TGAGCAGAAAGTTGAGGCAGA GATTCACCCTCTTCTACCTTATTGG
CiNADH-GOGATb GGGAATTCTAATCAGAAGGCAGA CCTGTATTGAACACCCTCACGA
Actin GCTGAACGGGAAATTGTC AGAGATGGCTGGAAGAGG
Disclaimer/Publisher’s Note: The statements, opinions and data contained in all publications are solely those of the individual author(s) and contributor(s) and not of MDPI and/or the editor(s). MDPI and/or the editor(s) disclaim responsibility for any injury to people or property resulting from any ideas, methods, instructions or products referred to in the content.
Copyright: This open access article is published under a Creative Commons CC BY 4.0 license, which permit the free download, distribution, and reuse, provided that the author and preprint are cited in any reuse.
Prerpints.org logo

Preprints.org is a free preprint server supported by MDPI in Basel, Switzerland.

Subscribe

© 2024 MDPI (Basel, Switzerland) unless otherwise stated