Preprint
Article

Consistent Greenhouse Accounting Identifies Forests and Land Use as Crucial Determinants of Climate

Altmetrics

Downloads

167

Views

230

Comments

0

This version is not peer-reviewed

Submitted:

27 October 2023

Posted:

30 October 2023

Read the latest preprint version here

Alerts
Abstract
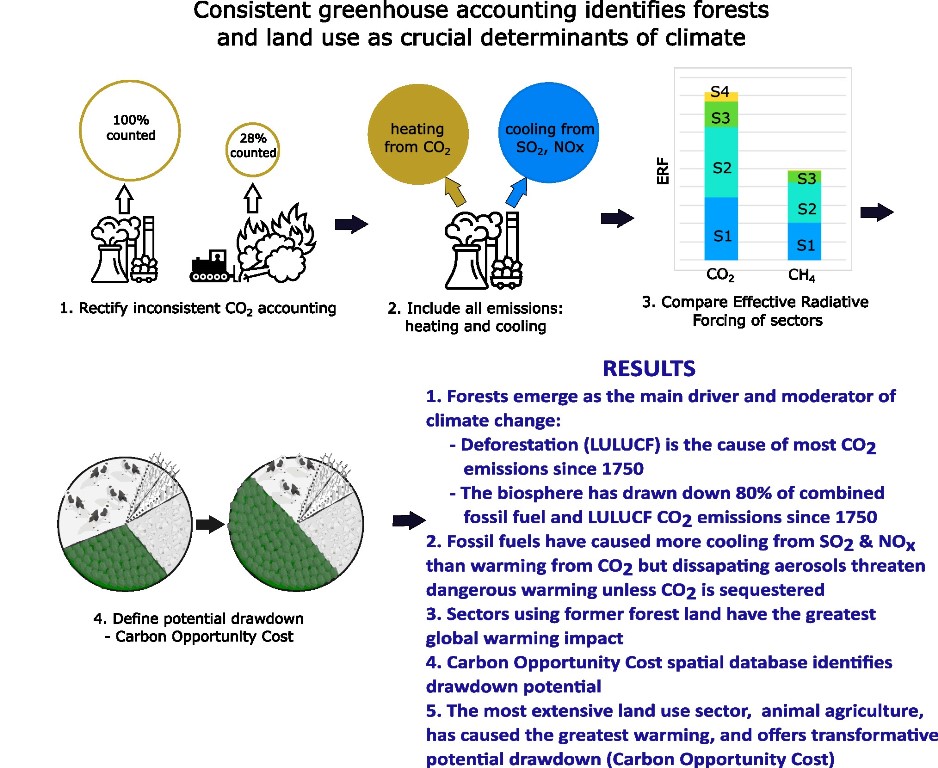
Conventional greenhouse accounting inadequately describes land use/land use change and forestry (LULUCF) emissions, cooling emissions, and sequestration potential. As we enter the age of drawdown, we propose an accounting framework that offers greater consistency and transparency. By unfolding net accounting of LULUCF CO2 emissions; aggregating biosphere sinks; accounting for all emissions (heating and cooling); com-paring sectors with emissions-based Effective Radiative Forcing (ERF) rather than global warming potential; and including drawdown potential of land use carbon opportunity cost (COC), this reveals fresh insight into sector contributions and mitigation potential. Consistent gross emissions reporting of LULUCF CO2 emissions finds these to be at least 3.5 times greater than conventionally understood. Consolidating natural sequestration on ‘managed’ and ‘intact’ land, we find that since 1750 vegetation and the oceans have removed from the atmosphere an amount equivalent to 2.4 times cumulative fossil fuel CO2 emissions, demonstrating the immense drawdown potential of the biosphere. This accounting places deforestation (responsible for 77% of LULUCF emissions) as the main source of historic CO2 emissions, and attributes drawdown potential COC to sectors. The most extensive land use sector, animal agriculture, was found to have contributed the greatest warming (52% of net ERF since 1750) and to offer the greatest drawdown potential COC.
Keywords: 
Subject: Environmental and Earth Sciences  -   Other

1. Introduction

A habitable planet for future generations will rely on our ability to rapidly draw down legacy emissions, as well as reducing current emissions. Many drawdown programs are working to do just that [1,2,3], but a rational response to this crisis demands greater clarity on effectiveness of mitigation options [4]. Terrestrial vegetation is a well-known large and increasing carbon sink, but accounting conventions have obscured our understanding of biosphere carbon flows. Large differences exist between national greenhouse inventories, bookkeeping models (as used in the Global Carbon Budget) and Dynamic Global Vegetation Models (DGVMs), these differences working to confuse, rather than clarify understanding [5]. While there are efforts to improve reporting transparency [6,7], this is within the existing convention framework. Our understanding of the climate impact of land and agriculture has suffered as a result [8,9].
The aim of this study is to offer a consistent, comprehensive, and transparent approach to greenhouse gas accounting suitable for evaluating sector contributions and accommodating drawdown. Proposed changes to Intergovernmental Panel on Climate Change (IPCC) conventions to achieve this aim are summarised in Table 1 and addressed below. Some of these have been proposed by other authors, but none have combined them as here. Two topics have been quantified by others: 5. (Compare sectors using ERF), by Dreyfus et al., 2022 [8], who quantified one sector only (fossil fuels), and 6. (Carbon Opportunity Cost) by several authors. It appears that no other study has quantified all topics, looked at their combined effects, and related them to sectors, as done here.

1.1. Consistent CO2 Emissions Accounting

IPCC inventory category Land Use/Land Use Change and Forestry (LULUCF) CO2 emissions come from deforestation (77%), degradation, including timber harvest and wood fuel (10%) and fire (13%) [10]. LULUCF emissions are reported as the net of emissions minus drawdown on all ‘managed’ land [11]. This is the only net assessment of any greenhouse emission, CO2 or otherwise, an apparent inconsistency. The IPCC’s reasoning for applying net accounting to LULUCF CO2 was that CO2 flux between the land surface and the atmosphere was viewed as a change in C stocks, and that only the net change affected climate [11]. This category was therefore treated differently to all other emissions. Conventional accounting of LULUCF and fossil fuel CO2 emissions is shown schematically in Figure 1.
Since this IPCC convention was agreed, there has been considerable reluctance to accept LULUCF CO2 as equivalent to fossil fuel emissions. Other than the net stocks rationale above, the main supporting argument is that fossil fuel carbon is seen as ‘truly new carbon’, additional to the biosphere carbon cycle [12]. A further factor that may be an important barrier to questioning LULUCF emissions conventions is that these emissions are obscure to those not technically involved due to their complexity [13].
In defence of consistent accounting, we would argue that the three trillion trees removed through deforestation [14] to be no different to ‘truly new’ fossil carbon, and that all carbon, once emitted, becomes part of biosphere and ocean stocks. Also, biosphere carbon cannot be considered separate to fossil fuel carbon because biosphere sequestration has almost doubled due to CO2 fertilisation [15], hence the two stocks are intermingled. The fate of emitted CO2, no matter what the source, is exactly the same - most is taken up by the biosphere and oceans in the first year it is emitted [16], and atmospheric CO2 is rapidly mixed, cycling through vegetation every 1.5 years [17], creating a new, growing ‘stock’. Deforestation is certainly anthropogenic, but regrowth occurs despite human intervention; it takes place on other land; and would continue if deforestation were to cease. Houghton & Castanho, 2023 [18] argue that a reduction in deforestation would result in a rapid reduction in (gross) emissions, whereas the (gross) removals (by regrowing forests) would continue independently for decades. Hence, they argue that gross fluxes are more indicative of mitigation potential than net fluxes. Keith et al., 2021 also argue the benefit of gross accounting of ecosystem carbon stocks and flows to more completely describe impacts on both climate and biodiversity [19], and Mackey et al., 2022 argue that net accounting distorts mitigation strategies [20]. Both advocate gross accounting to fully describe carbon stocks and flows, which they see as critical to meeting Paris Agreement temperature goals.
We believe that no arguments presented offer a strong reason to deny consistent gross CO2 accounting, and that emissions and sequestration are more completely and transparently described with gross accounting. In practice, this seemingly obscure accounting inconsistency has substantial implications, overturning entrenched ‘framing’ that sees fossil fuel CO2 as the major emissions source, with LULUCF emissions as far less important.
Gross accounting, as proposed here, increases total CO2 emissions from all sources by about 25% and LULUCF increases to about 30% of total emissions, rather than the conventionally accepted 14% [10,21]. Net accounting understates LULUCF emissions by a factor of 3 or 4 [22]. The corollary of under-reported land emissions is that the enormity of biosphere sinks is seriously under-appreciated [23]. This inconsistency could be resolved by discounting fossil fuel CO2 emissions to the ‘airborne fraction’ amount – the CO2 remaining in the atmosphere, or, as we propose here, by transparently exposing gross emissions and sinks consistent with all other emissions.
In the three decades since IPCC greenhouse accounting conventions were first agreed, knowledge of biosphere carbon flows has improved dramatically. Although biosphere carbon flux uncertainties are large, in the order of +/-20% [22,24,25], they are improving due to recent advances in remote sensing with sophisticated DGVMs and book-keeping models [5]. We believe that the new, more reliable biosphere fluxes allow a full greenhouse accounting of CO2, and that net biosphere CO2 accounting is no longer defensible. Reporting 100% of fossil fuel CO2 (gross) emissions but only 28% of LULUCF CO2 emissions (net) implies that when emitted these behave differently, which is disingenuous.
Human activities not only cause deforestation, forest degradation and associated fire, they also cause fast-cycling of biosphere carbon to and from the atmosphere through the plant and animal biomass we use for food, fibre and biofuel [26]. The bulk of this biomass is agricultural production (20Gt CO2/yr, a similar amount to other gross LULUCF emissions) [27]. In some cases crop biosequestration is just as high as the native vegetation it replaced, due to fertilisation and irrigation, but it is not clear how much crops add to the atmospheric burden other than deforestation to make way for cropland [26]. Arguments have been made that this carbon should also be included in emissions accounting (particularly animal respiration) [28], but since there is no agreed estimate of the climate impact of this crop-feed-food-waste cycle, it has been excluded from this study.

1.2. Consolidating ‘Intact’ and ‘Managed’ Land Sinks and Emissions

By IPCC convention, drawdown on ‘intact’ and ‘managed’ land is accounted separately [11]. While this distinction may have been justified for early national inventories, Nature does not discriminate between plants growing in each, therefore combining these sinks more correctly represents biosphere sink potential. Removing this artificial distinction will facilitate biosphere modelling with the new generation of DGVMs that benefit from rich remote sensing data, but struggle to relate to conventional inventories [5].

1.3. Rectifying IPCC Partial Accounting

Sectoral contributions are also obscured due to partial reporting. This is most obvious in the case of fossil fuels, where co-emitted aerosols, whose cooling has until now balanced out warming from CO2, are rarely reported. This may be due to the short-lived nature of aerosols, even though their cooling has had a long term impact [8,29]. This difference in atmospheric lifetime has implications for future warming, and there is evidence that this cooling impact is already abating as skies clear [30], so that by the 2060s warming from fossil fuel CO2 will dominate cooling from co-emitted aerosols [8].

1.4. Less Contentious Comparison of Greenhouse Gases and Sectors

Debate on how to compare the various greenhouse emission species has been robust, particularly comparing CO2 to CH4 [31,32], hindering mitigation efforts and sector comparisons [33]. 100-year Global Warming Potentials (GWPs) are the IPCC convention choice for comparison, but recent advances in determining emissions-based Effective Radiative Forcing (ERF) and derived Global Surface Air Temperature (GSAT), as defined in the IPCC’s AR6 Supplementary Material 6.SM.1 [29], present a less contested means of comparing sector contributions. ERF is also believed to produce more accurate estimates of agriculture’s climate impact than other commonly used climate metrics [34]. This does require, however, accurate proportioning of emission species to each sector, but once the proportion is defined, the ERF and GSAT attribution to sectors is trivial. Matthews et al., 2009, validate the use of sector cumulative emissions; finding that climate response is not sensitive to background concentrations or timing of those emissions [35]. One benefit of climate metrics such as GWPs is that their time periods can be chosen for future climate target epochs [33]. In comparison, studies such as ours are backward-looking, however we believe that using ERFs to determine the cause of present-day warming brings fresh insights.

1.5. Transparent Agriculture Emissions

Agricultural emissions are particularly difficult to define, due to convention [36]. Although this sector dominates land use, the components that make up a complete picture of agricultural emissions are fragmented in various LULUCF categories and sub-categories, as well as the Agriculture category. Greater clarity in LULUCF subsection definitions is required both for emissions sector breakdown and for defining drawdown [5]. Opaque land and agriculture emission attribution stands in stark contrast to the fine detail on fossil fuel emissions readily available from national inventories.
Many researchers tend to treat agricultural and land emissions as an afterthought, accounting for the ‘minor’ emission sources. This demonstrates the power of framing fossil fuels as the principal cause of global warming: early work defining the causes of climate change has framed the problem but at the same time unintentionally pointed to explicit solutions that may be less effective in mitigating climate change [37].

1.6. Carbon Opportunity Cost and Accounting Framework

Incorporating foregone sequestration, or land use carbon opportunity cost (COC) in emissions accounting has been proposed by several authors [38,39,40], and attributing COC to particular land uses has been the subject of several studies in the past decade [40,41,42,43,44]. Nature is actively prevented from returning land to its original carbon storage due to human use of that land, therefore restoration potential (the carbon potential of restoring vegetation and soil) can be considered a valid anthropogenic climate cost equal to the sequestration potential of restoring soil and growing vegetation, estimated to be 1,710 Gt CO2 globally [45].
This framework fits well with stocks and flows accounting, a more comprehensive system where all carbon sinks and emissions (intact and depleted carbon stocks) are valued [19]. Categorising yearly COC as an unrealised asset or unrealised income in this accounting framework would give it due acknowledgement, rather than it being invisible as it is in IPCC accounting. We suggest that yearly COC be part of the ‘flows’ (current account as a yearly drawdown rate) as well as the ‘stock’ (capital account as the total drawdown potential). This is analogous to an asset such as a rental property, but with no tenants, no rental income, a tangible cost to the owner. In this analogy, for the asset to realise its ‘income’ or sequestration potential requires a change of land use. For these reasons the stocks and flows approach is considered appropriate for both greenhouse and biodiversity accounting [19]. Note however that our study does not include COC as a yearly emission, because we do not look at yearly emissions, we investigate combined ERF since 1750, however we do include total COC to describe potential drawdown by sectors.
Including yearly COC in national inventories would also help to level the global north/south divide, in that developed countries deforested long ago can be compared with those experiencing active deforestation [39]. At present, Brazil is being pressured to reduce deforestation, principally by the developed world, and as beneficial as that would be, COC accounting would refocus this critical attention on previously deforested nations as well as those experiencing current deforestation.
Forest restoration potential is an order of magnitude greater than any other climate mitigation solution [2], therefore COC explicitly values this factor that has transformative climate potential.

1.7. Accounting for Drawdown

Although half the trees on Earth have been lost to deforestation [46], forests are still estimated to hold 90% of the world’s standing plant biomass carbon [26], and forests are still a large and increasing carbon sink [47,48]. CO2 and nitrogen fertilisation is increasing, perhaps even doubling, the biosphere sink [15,49]. Forest carbon storage is therefore increasing, and the loss of additional sink capacity (LASC) from deforestation is estimated to be 2.5Gt CO2 /year for the period 2008-2019 [48].
Indeed, Nature’s power to balance our emissions is immense. Until about 1750CE, the net 1100Gt of CO2 emitted by historic deforestation [50] was re-absorbed by vegetation, particularly peat [51]. Since then, emissions began to overcome this natural balance, leading to increased atmospheric concentrations. But the appearance of balance hid large scale carbon flows between the biosphere and the atmosphere, as deforestation has been gaining pace for 10,000 years.
Drawdown urgently requires a comprehensive reporting and accounting system [52,53]. The race to ‘net zero’ is challenging businesses to better measure their climate impact and placing great pressure on the fast-developing sequestration industry [54], often facing ‘greenwashing’ criticism due to sequestration permanence or additionality [52,55,56]. The effectiveness of these carbon offsets, their permanence, as well as accounting transparency affects the credibility of this new but critical industry. A more appropriate accounting framework for drawdown would help to resolve this.
A suitable accounting framework would include spatially explicit data (maps of COC potential) together with a verifiable register. Presently there are tree planting programs at all scales: international, continental, national, regional, and local; government carbon farming and biodiversity enhancement programs; a fast-growing carbon offset industry and carbon markets that would benefit from such a dataset. Additionally, there already exist multiple spatial datasets of sequestration potential and ecological function at a range of scales. These could be harmonised and enhanced to register data on ideal plantings for specific purposes – sequestration, biodiversity, forestry, agroforestry, flood mitigation, firewood, biofuel and others. National sequestration spatial data repositories such as those in USA/Canada [57] and Australia [58] could be brought together under a UN-led initiative.

2. Materials and Methods

This study provides a top-level sector attribution of ERF and GSAT to illustrate those sectors with the greatest land use impact and COC: ‘Fossil Fuel and Industry’ (shortened to ‘fossil fuel’ in the text below); ‘Animal Agriculture’; ‘Other Agriculture’; ’Forestry’; ‘Built-up Land’ and ‘Waste’. Animal Agriculture is identified separately due to its disproportionately high emissions and land use. These sector groupings require dissecting to a finer detail, but for the purpose of this study, they demonstrate the concepts. The agriculture categories include land and production emissions only, and do not include on-farm fossil fuel use, processing, or distribution of agricultural products.

2.1. Errors and Accuracy

Biosphere carbon flows are still highly uncertain, in the order of +/-20%, although knowledge is rapidly improving [5]. This study is intended to give an indicative example. It is not exhaustive, in that mean values are given without error bars or ranges and not all emission sources are included. Emissions are limited to carbon dioxide (CO2), methane (CH4), nitrous oxide (N2O), halocarbons, nitrogen oxides (NOx), non-methane volatile organic compounds (NMVOC), carbon monoxide (CO), sulphur dioxide (SO2), organic carbon (OC), black carbon (BC) and ammonia (NH3). A useful comparison of methods, models and accuracies used to determine biosphere carbon flows is given in Grassi et al., 2023 [5], and the IPCC special report on Climate Change and Land, Section 2.3, 2019 [59].
LULUCF emissions used here are considered very conservative because: a) deforestation emissions are based on FAO Forest Resource Assessment net in-country data [59]; b) gross forest loss from finer-grained remote sensing studies indicate that forest loss far exceeds current estimates [24,60], perhaps four times greater in extent than previous assessments [61]; c) DGVMs use coarse resolution, that understates flux [22]; d) agricultural land soil carbon loss is not included in LULUCF emissions [22]; e) uncounted crop harvest and grazed pasture carbon released rapidly as CO2 [22] (which, if included, would double these land emissions); f) human activities may be altering natural biosphere CO2 flux (Gross Primary Productivity), which is more than 20 times greater than these land emissions, at 520Gt CO2/year, as seen in Figure 5.12 of AR6 [62]. The final and perhaps most significant reason why the LULUCF emissions used in this study are conservative is due to the choice of start date – this study is limited to emissions from 1750-2021, therefore the pre-1750 emissions are ignored. The impact of this last point can be seen by comparing Figure 2 and Figure 4 below.
Using cumulative emissions to relate warming to sectors is validated by Matthews et al., 2009, who found that the climate response to cumulative emissions is not sensitive to background concentrations or timing of those emissions [35]. A sensitivity analysis was carried out using the same dataset, but with recent emissions data (from 2000 to 2021). This approach is a test on sensitivity to emission sector proportions such as fossil fuels becoming the dominant CO2 emission source circa 1970 (using the unfolded LUC emissions as derived in this study), and the dramatic rise in all emission species, particularly the 250% rise in airborne methane. Sensitivity analyses were also carried out on the conversion factor from net to gross land use emissions, as described in Supplementary Information.

2.2. Data Sources

See Supplementary Information table S1 for a full description of data sources. Cumulative emissions are used (where available) from 1750.
This study has not applied time-discounted carbon costs, as used in models by Searchinger et al 2018 [40] and Peng et al 2023 [63] to account for forest regrowth in order to value the carbon cost of forest products or alternative land use back to the year of harvest or deforestation. We believe that no discount rate is warranted when using gross accounting for all sources and sinks of CO2 as we do here, where cumulative ERF is calculated for the entire period from 1750, and any discounting could be equally applied to fossil fuel and LULUCF emissions, because emissions from both enjoy the same fate: biosequestration with part airborne fraction. Warming early in the post-1750 era is no different to more recent warming, both are cumulative, directly relating to emissions.

2.3. Attribution of radiative forcing and warming to sectors

Emissions-based effective radiative forcing (ERF) and global surface air temperature (GSAT) are derived from the atmospheric concentrations for each emission species over time, as defined and discussed in IPCC AR6 Section 7 [64]. ERF and warming can be attributed to sectors based on proportions of each emission species. This allows for transparent attribution of warming, such that temperature increase due to any chosen human endeavour will be readily available to policymakers, but its accuracy is dependent on accuracy of proportioning. For attribution of land use emissions, including deforestation and fires, see Supplementary Material.

3. Results

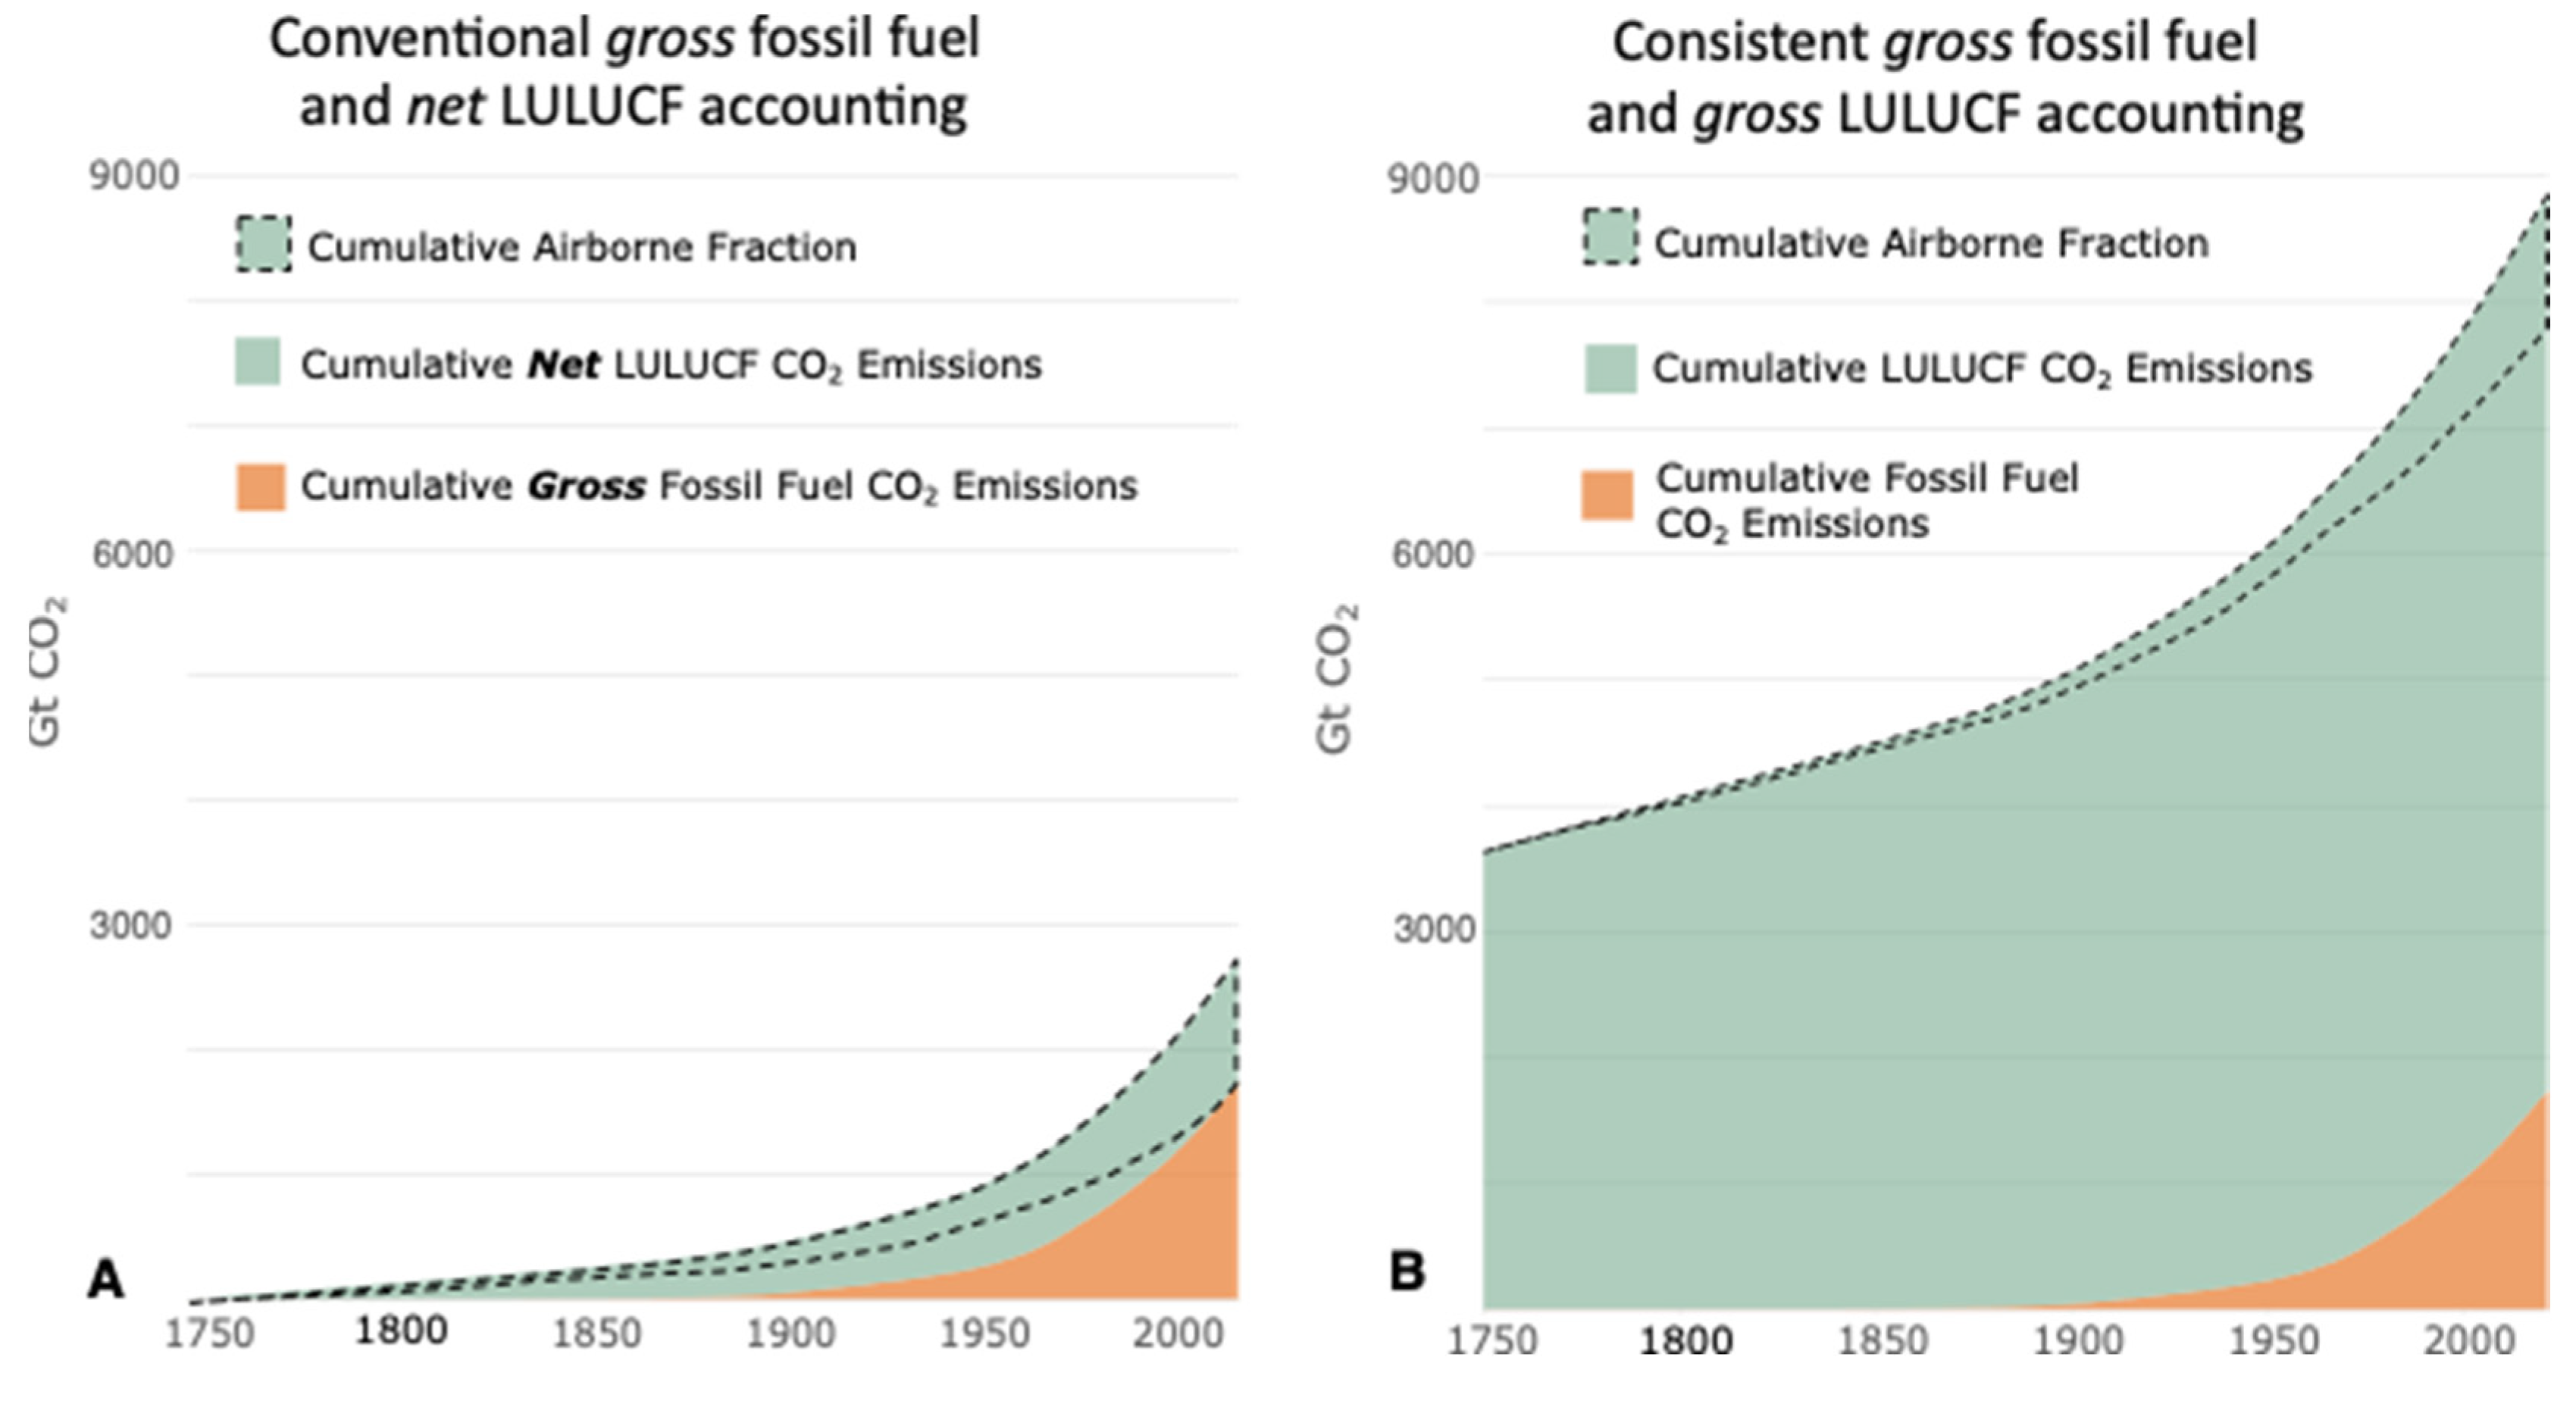
Figure 2 (a) shows the inconsistent but conventional cumulative gross fossil fuel/net land use CO2 emissions accounting as used in IPCC and Global Carbon Budgets. In contrast, Figure 2(b) applies consistent gross accounting to both, showing that cumulative gross LULUCF CO2 emissions since 8,000BCE are four times greater than those of fossil fuel/industry. Derivation of the LULUCF CO2 net to gross conversion factor of 3.5 is given in Supplementary Information table S2.
Figure 2(b) establishes that LULUCF emissions have been the main driver of CO2 emitted since the beginning of agriculture, circa 8,000BCE, continuing onward as shown from 1750 to the present. In the late 1700’s, CO2 emissions outpaced drawdown, leading to increased atmospheric concentrations and the airborne fraction (the dotted line in fig. 2B) rising to 35% of current gross CO2 emissions. CO2 fertilization has increased the biosphere sink, but has been unable to keep pace with emissions [16]. Growth in CO2 atmospheric concentration coincided with the rise of fossil fuel emissions, but rather than being the main driver, it was the combination of growing LULUCF and steeply growing fossil fuel emissions that contributed. LULUCF emission estimates in Fig.2(b) are considered highly conservative for reasons given under Errors and Accuracy above.
The ratio of carbon-14 to carbon-12 has been used to determine the origin of atmospheric CO2. C14 has a half-life of about 6,000 years, so fossil fuel/cement CO2 does not contain this isotope, whereas other atmospheric or organic CO2 does [67]. This work shows that the present-day atmosphere contains about 70% fossil fuel/cement CO2, which is consistent with CO2 emission proportions over the decade 2012-2021 [65] corrected for gross LULUCF. The similarity is to be expected due to the rapid (1.5 year) cycling of CO2 between the atmosphere and the biosphere/oceans [17], whereby historic emissions would be sequestered in increasingly long-lived woody material, soil and the ocean and recently emitted CO2 would dominate the rapid cycle. Yearly atmospheric growth and total emissions over this same decade show an airborne fraction of 35%, demonstrating the large scale of this CO2 cycling through the biosphere, as well as rapid intermixing of LULUCF and fossil fuel emissions.
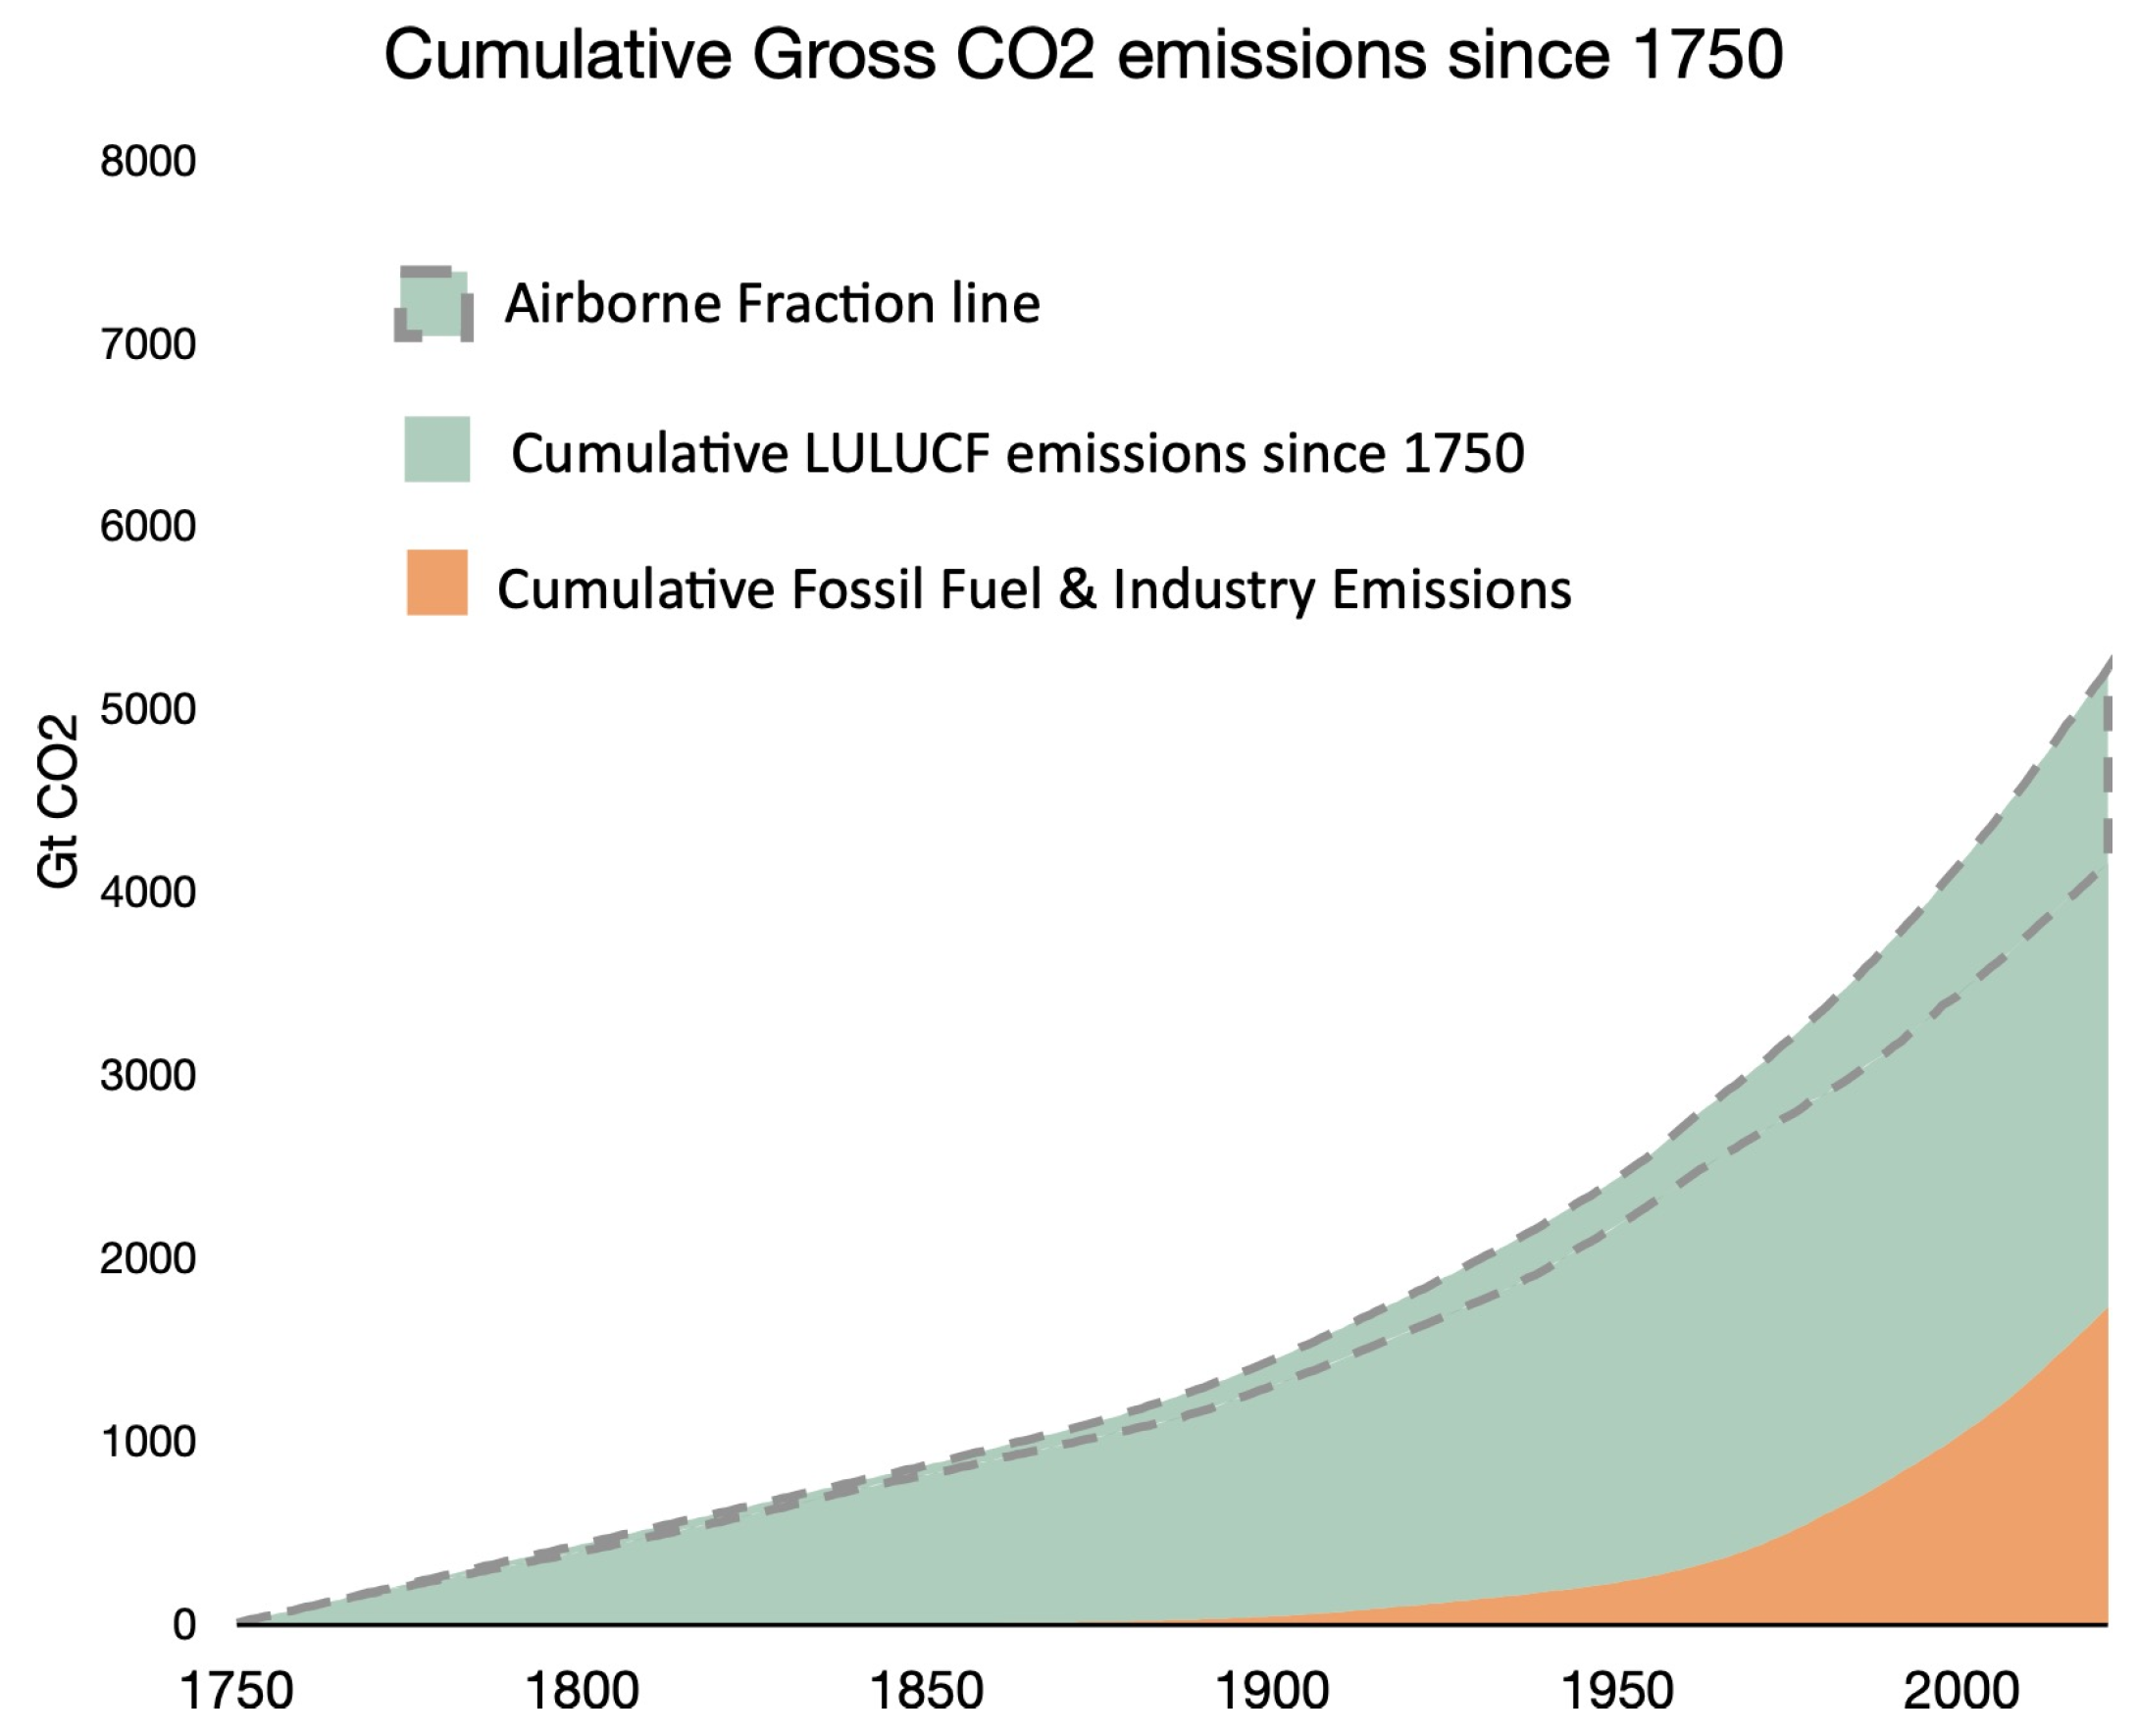
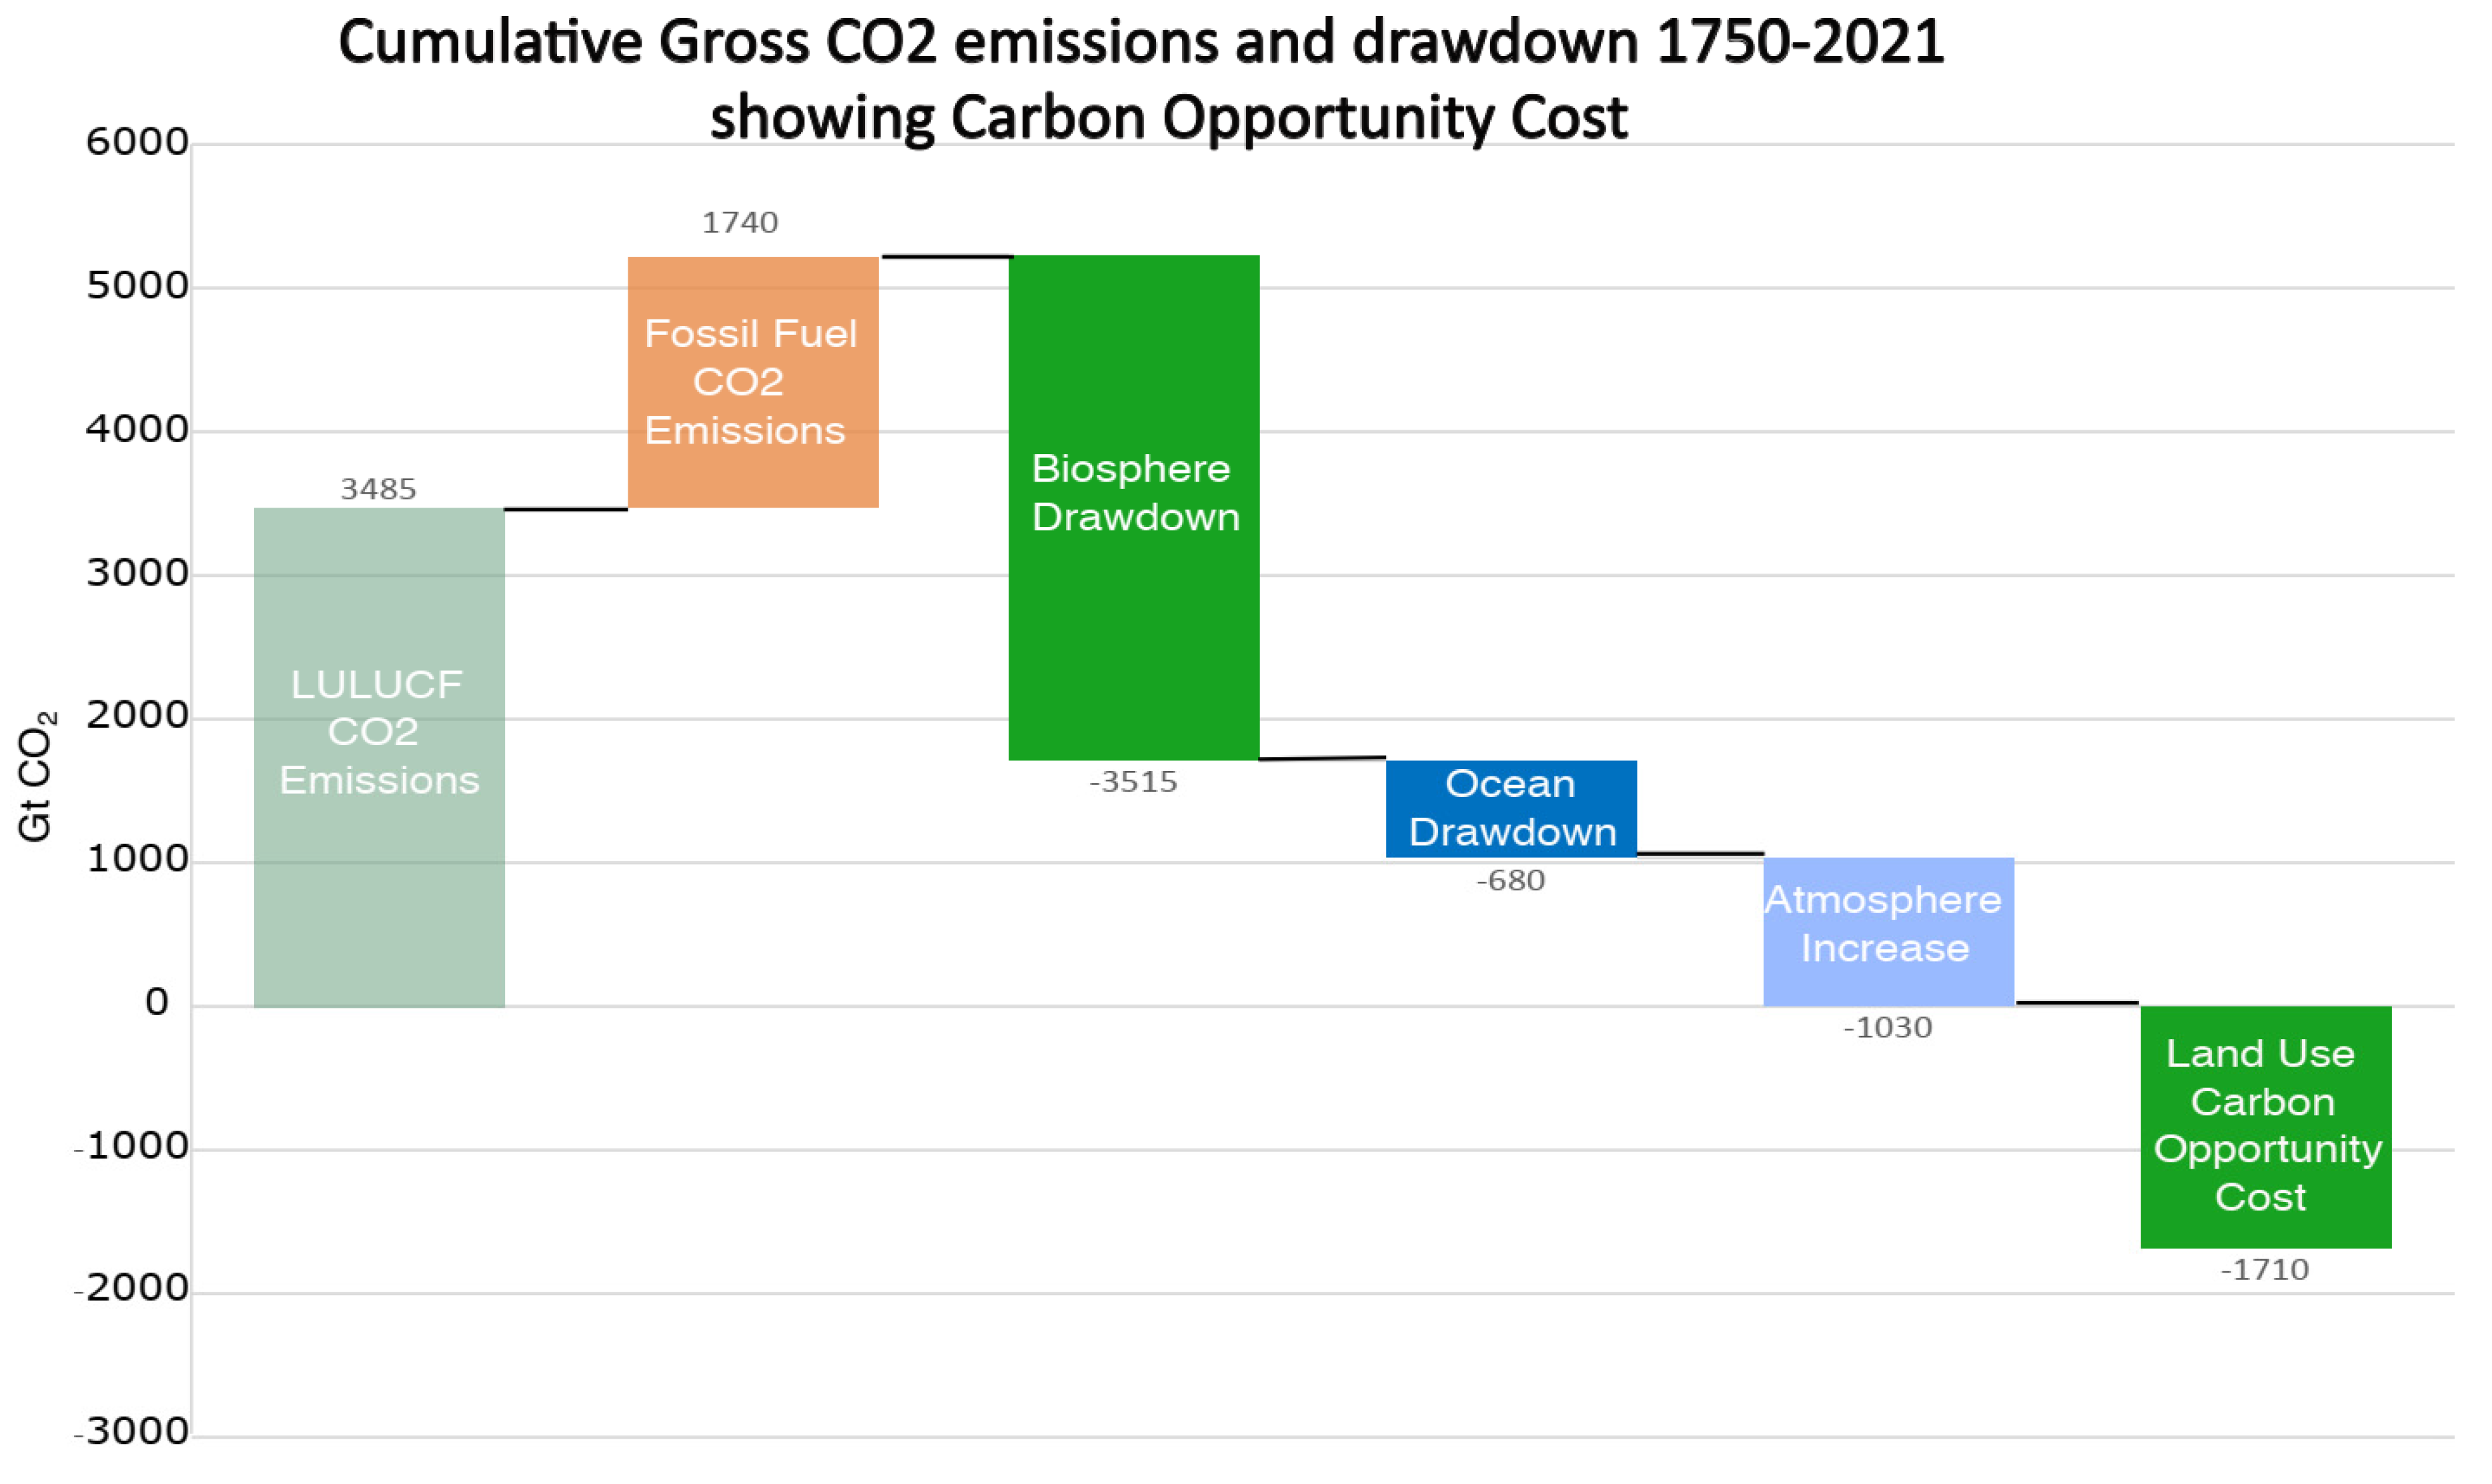
Figures 2(b) and 3 highlight the unexpectedly large scale of biosphere drawdown, indicating that the cumulative CO2 airborne fraction (of an increased total due to gross accounting) is 20% for the period since 1750. Figure 3 depicts the cumulative CO2 flux, showing COC potential for drawdown is approximately equal to total fossil fuel emissions.
It is likely that COC as depicted in Figure 3 could be an underestimate. Forests are estimated to hold 90% of the world’s standing plant biomass carbon [26], and Crowther et al., 2017, found that three trillion (half the world’s) trees, have been lost due to deforestation [46], which explains this 1690Gt CO2 value, but does not account for sequestration potential of soil carbon, particularly from the world’s cropland soils [69]. Perhaps of more significance is that CO2 and nitrogen fertilisation is increasing the biosphere sink, by a factor of two, even as deforestation increases [15,70]. For clarity, Figure 4 graphs cumulative CO2 emissions since 1750 as used in this study for sector comparisons.
Figure 4. Cumulative gross fossil fuel and LULUCF emissions since 1750, as used in this study.
Preprints 88922 g004
Note that limiting our emissions analysis to post-1750 significantly understates both LULUCF emissions and drawdown before 1750 (more accurately depicted in Figure 2(B)), but for this study 1750 has been adopted for consistency with the ERF data.
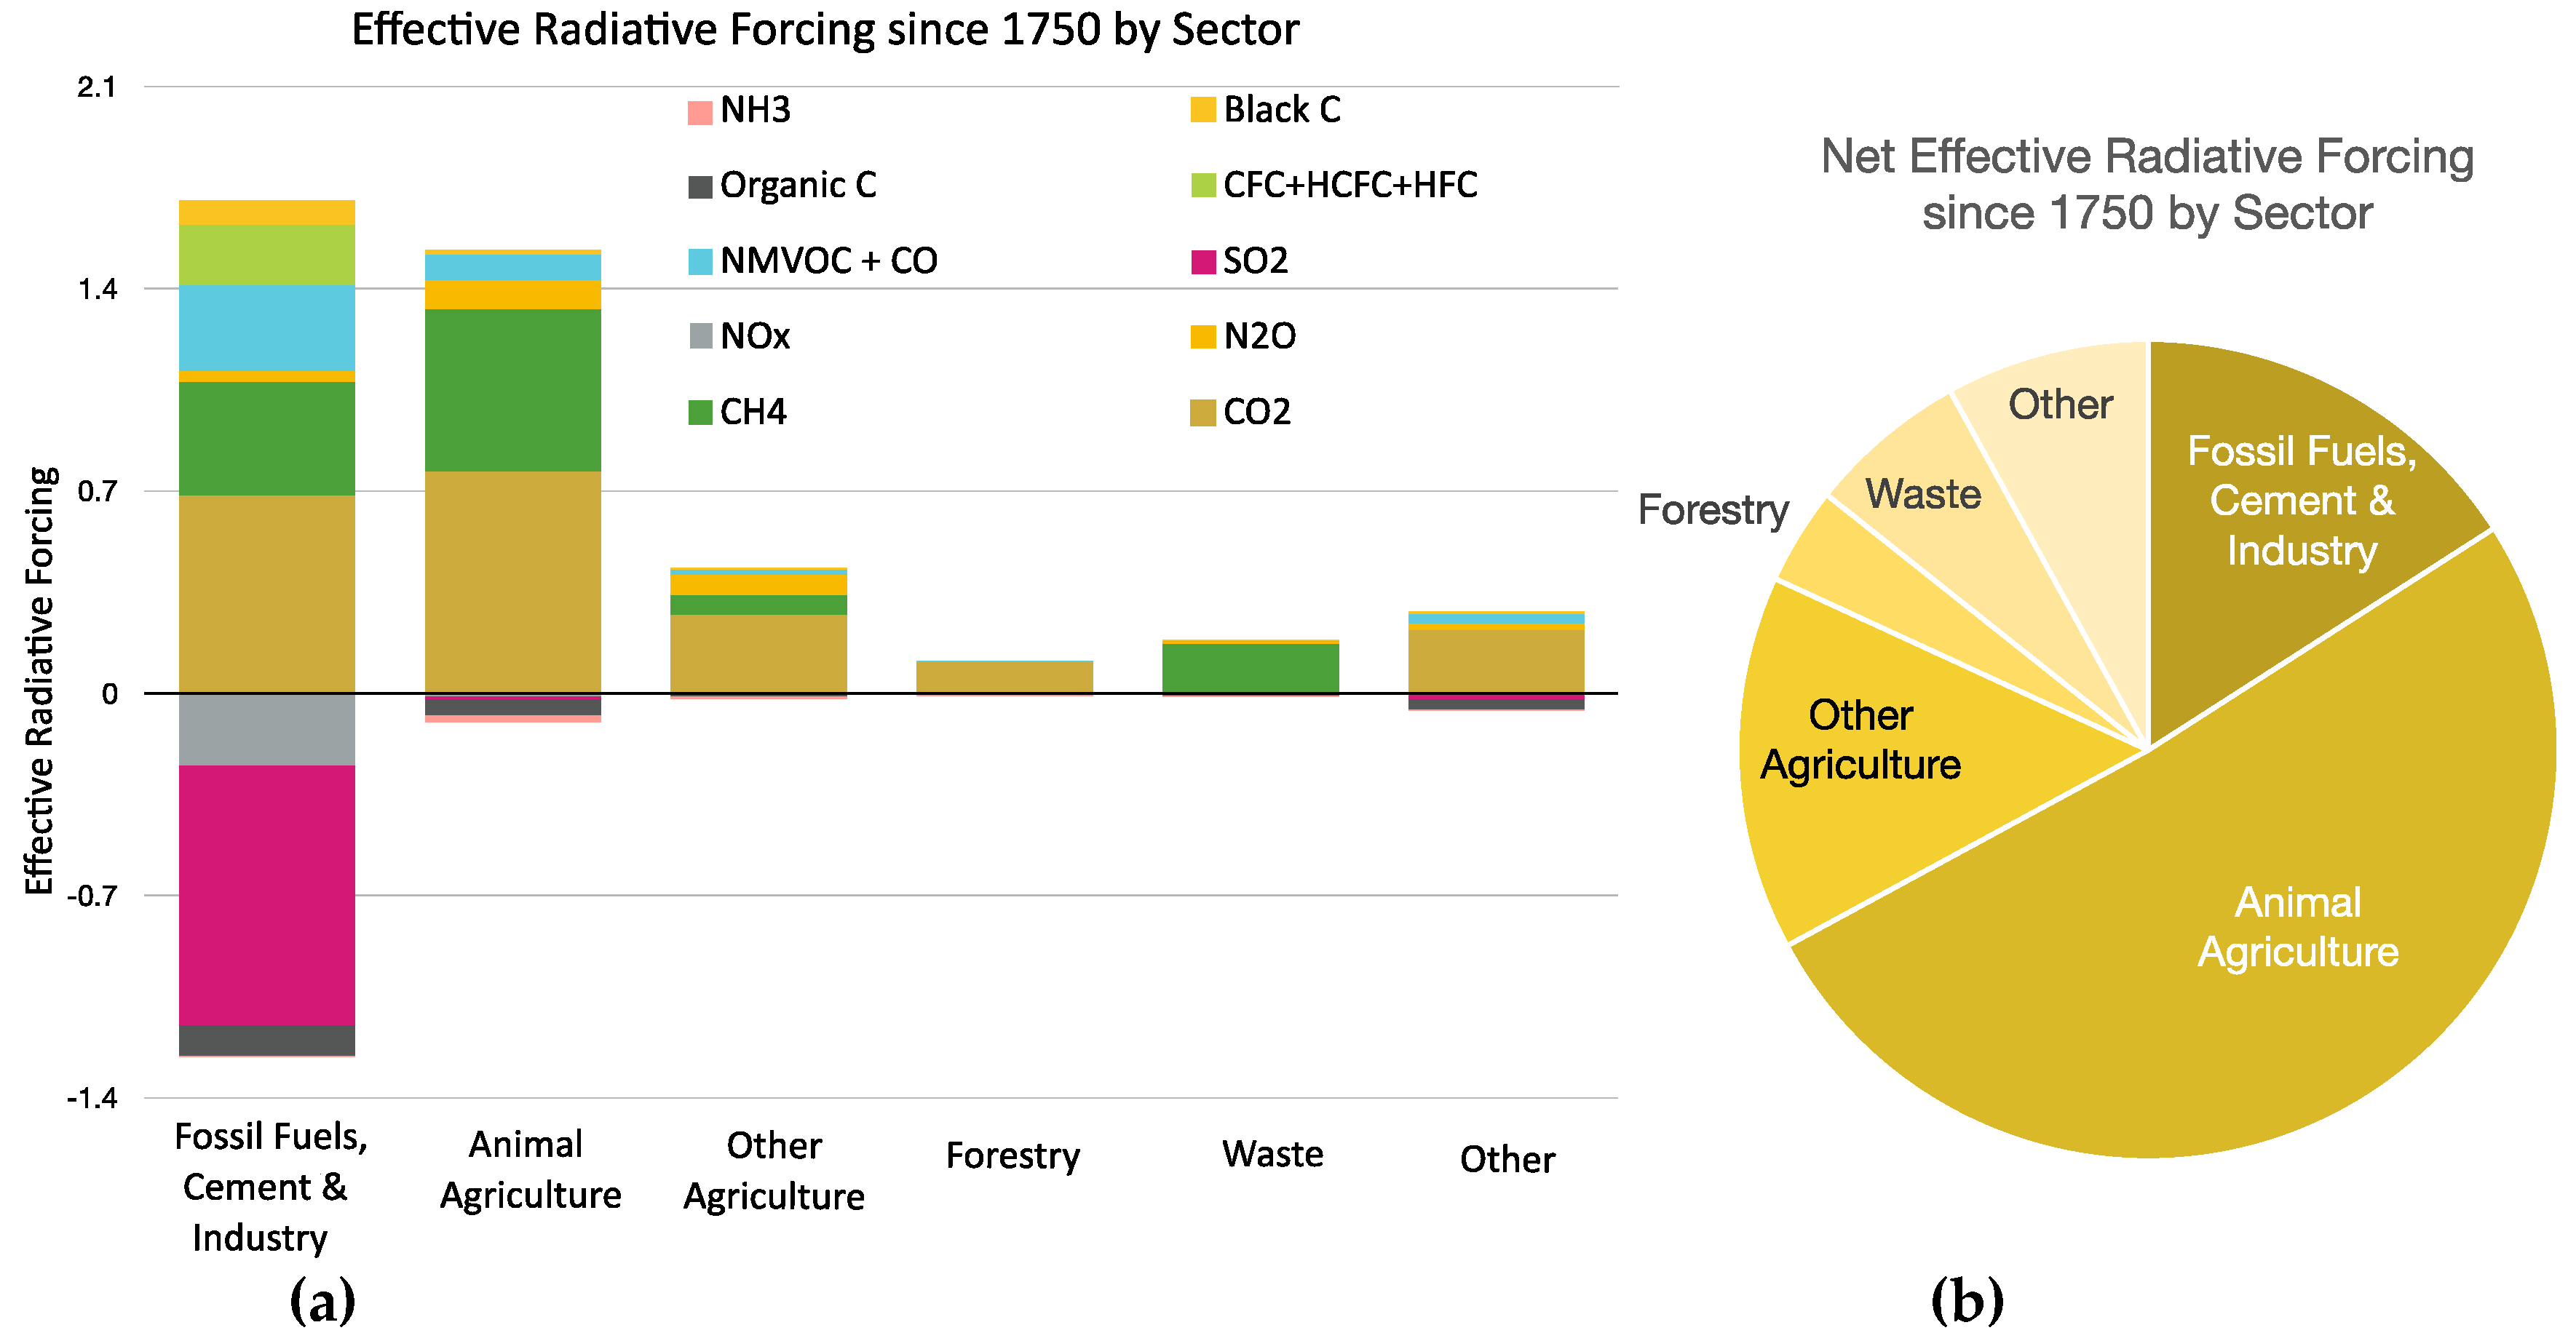
Cumulative emissions have been broken down into sector contribution proportions to assign ERF and GSAT to sectors, a valid approach because climate response to cumulative emissions is not sensitive to background concentrations or timing of those emissions [35]. Figure 5 presents the results of applying the proposed accounting framework changes as summarised in Table 1 to emissions data from 1750 to the present, excluding COC. The data presented should be taken as indicative, rather than definitive, due to the uncertainties described in Errors and Accuracy above, and conservative, for reasons given in section 2.1. More information on ERF and GSAT is given in Supplementary Information. Relative ERF contributions of each sector are given in Figure 5(b).
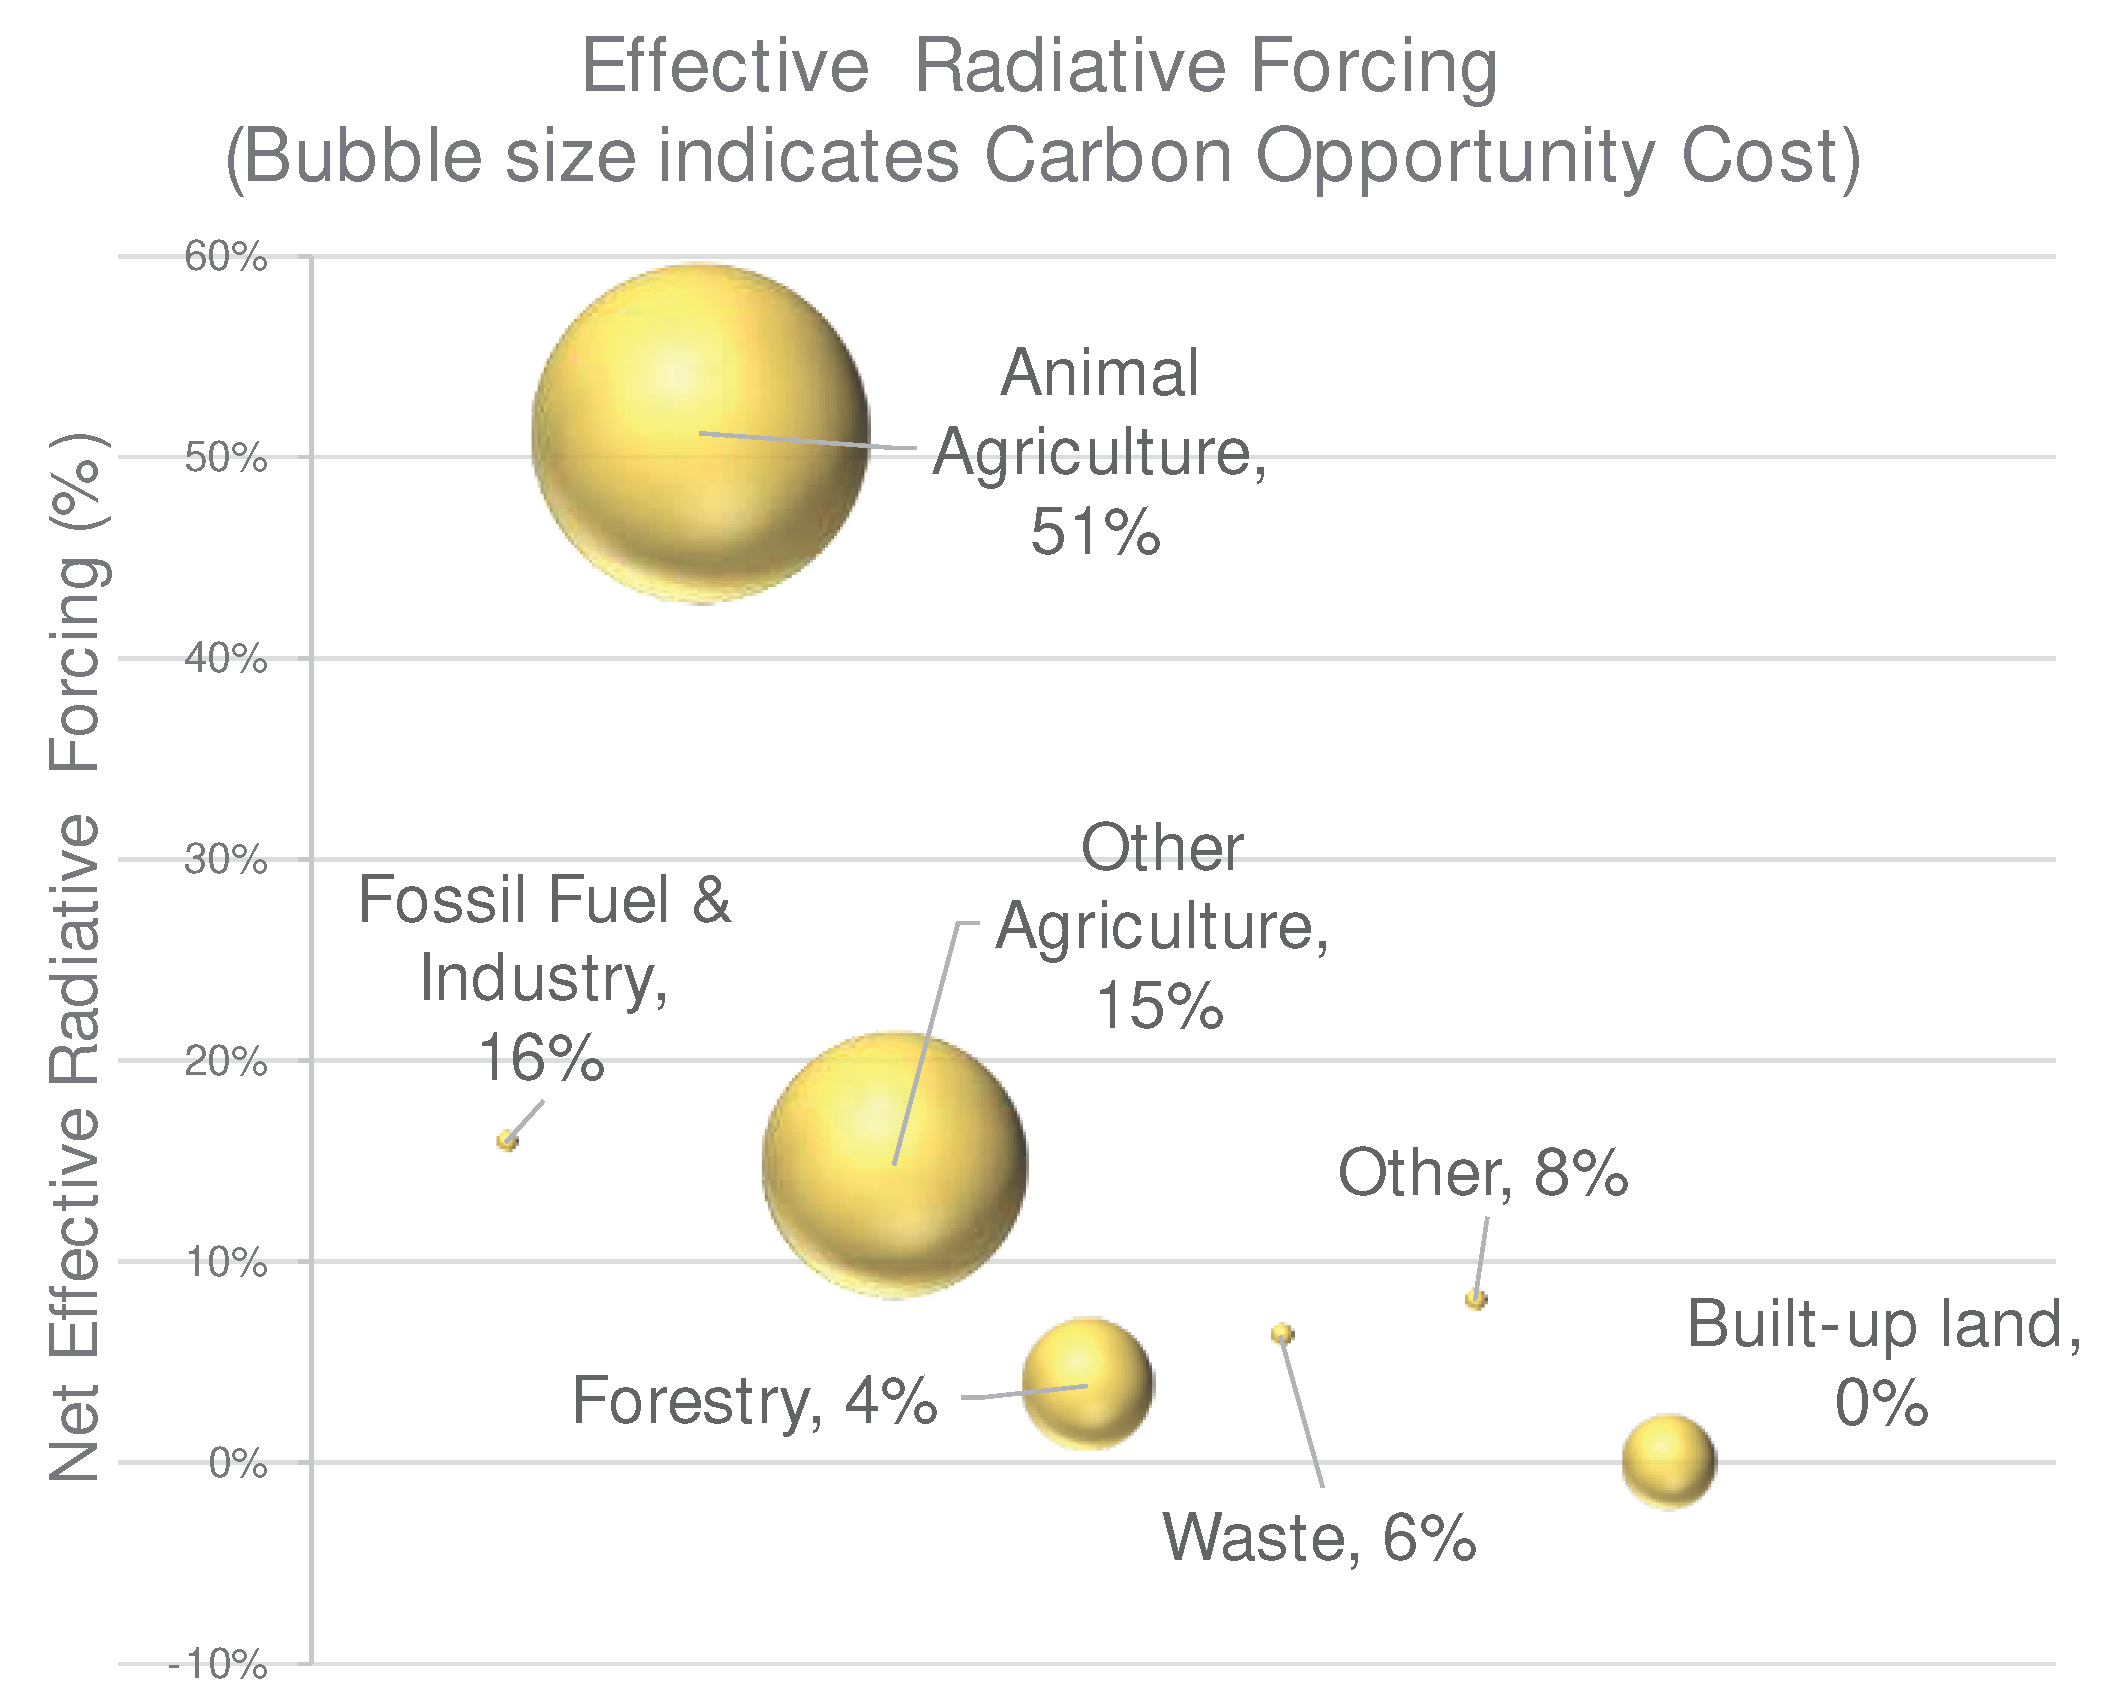
Figure 5. a): Effective Radiative Forcing by sector and emission species not including carbon opportunity cost. Note that warming from fossil fuel warming is offset by aerosol cooling. Data are provided in Table S6. (b): Net Effective Radiative Forcing by sector not including carbon opportunity cost.
Preprints 88922 g005
Dreyfus et al., 2022 [8] used ERF in a similar way looking at fossil fuel and short-lived climate forcer contributions to warming, except they used conventional net LULUCF emissions, where they found fossil fuels had caused 20% of cumulative global warming to 2015. Here we find net warming from fossil fuels to be 16% of warming since 1750 (Figure 5 and Figure 6), and the leading sector, animal agriculture, to be responsible for 51% of ERF, corresponding to 0.690C warming (see also Table S6). In addition, Dreyfus et al. found methane to be responsible for 50% of GSAT change, whereas we find it to have caused 43% of total GSAT. These differences may be partially explained by the data: 1750 to 2021 in this study, whereas theirs was up to 2014.
Drawdown potentials (COC) for each sector are given in Table S7, but the scale of each can be related to land area used by each sector. The 2014 IPCC AR5 report, chapter 11 [27] provides a breakdown of land use and biomass appropriation, finding that the top three human land uses are: animal grazing pastures (37% of the ice-free land); managed forests (22%); and cropland (12%).

4. Discussion & Conclusions

This study highlights the defining role that the biosphere and forests in particular play in both disturbing and moderating Earth’s climate. Nature has been balancing atmospheric greenhouse gases for 10,000 years, re-absorbing all carbon emitted until just 270 years ago. This is well known, as is the fact that current deforestation and fossil fuel carbon is mostly reabsorbed by the biosphere. This we have taken for granted, seeing the biosphere as a self-correcting system, but the appearance of balance conceals substantial carbon flows. While the biosphere flux figures given here are still uncertain, there are some important conclusions to be drawn.
Firstly, to give it due credit, Nature has drawn down 80% of combined fossil fuel and LULUCF CO2 emissions since 1750, as shown in Figure 3. Secondly, LULUCF CO2 emissions are 3.5 times greater than conventionally represented. Thirdly, cumulative historic fossil fuel CO2 emissions are secondary to LULUCF, even though yearly fossil fuel CO2 emissions overtook LULUCF circa 1970 (using gross accounting as we do here). Note that reforestation and afforestation sequestration potential are not altered by gross accounting as used here, other than the increase due to CO2 and nitrogen fertilisation. However, consistent accounting reveals that the current airborne fraction of CO2 from all sources is 35%, therefore Nature is already drawing down 65% of yearly CO2 emissions, performing a major mitigation role.
These results lead to a new mitigation emphasis. Deforestation and avoided deforestation’s climate impact increase by a factor of 3.5 (see Table S2 for derivation of this factor), substantially increasing the climate payoff for preserving forest. Likewise, industries that drive deforestation or prevent forest regeneration through their land use deserve closer scrutiny. Indeed, any endeavours that enhance biosphere sequestration or preservation will be seen as far more potent, bringing new emphasis to the value of every tree and every hectare of forest.
Removing the artificial distinction between ‘managed’ and ‘intact’ land facilitates modelling with DGVMs and remote sensing data, circumventing the difficult task of discriminating between these two land uses. This is particularly important for national inventories, to account for all vegetation within national borders as one.
Regarding drawdown accounting, we suggest that spatially explicit data (maps of COC potential and other values such as biodiversity) together with a verifiable register of carbon ownership, would offer valuable tools. Interpretation and decisions on reforestation/afforestation/revegetation is also a large and costly undertaking that would ideally involve all levels of government, community groups, landholders, and traditional owners. Such a harmonised database could inform all those concerned with drawdown, and we suggest this could be the basis of a defined drawdown pathway, critical to a concrete climate action plan.
Our results present a substantial reordering of sectors responsible for global warming, due to three major factors: the boosted impact of industries that are causing deforestation or occupy formerly deforested land; cooling aerosols; and the warming impact of methane, since it has no cooling aerosols co-emitted. Cooling aerosols, as shown in Figure 5(a), although they are short-lived, have masked 74% of ERF from fossil fuel warming, but if cooling were to diminish, this would result in future warming. This is the ‘Faustian bargain’ [71] that may cause additional near term warming by as much as 0.5-1.0oC if cooling emissions are reduced [72]. Efforts to reduce aerosols due to their health impacts are effectively removing this cooling [73], so that we may experience additional warming in the near term [30]. This emphasises the urgency for decarbonising and drawing down legacy carbon, a task that could be facilitated with this proposed COC data and accounting framework.
As a cautionary note, as Figure 3 shows, even with the greatest ambition, the maximum biosphere drawdown potential is about equal to the already-released fossil fuel CO2 and also equal to the additional CO2 loading in the atmosphere plus the oceans, therefore with ongoing emissions natural climate solutions will have no further sequestration capacity. Table S7 lists the COC of selected sectors, showing that regeneration of forests and soil on abandoned and grazing land (not including animal feed crop land) would sequester 825Gt CO2, or 80% of current atmosphere loading [68]. This offers considerable mitigation potential and suggests further forward-looking research is needed with the accounting framework presented here to better illuminate mitigation solutions. It also argues for a greater sense of urgency to take advantage of the greatest, and growing, mitigation measure: restoring forests.
A significant finding here is ‘the cow in the room’: animal agriculture is clearly identified as the leading cause of current global warming. Unlike fossil fuels, this sector has caused far more warming than cooling, as seen in Figure 5(a). Surprisingly, animal agriculture’s greatest ERF impact has been from CO2, not methane (Figure 5 (a)). However, methane has been responsible for 39% of ERF from this sector, and a substantial 43% of total net ERF. Other studies have shown that methane has caused 0.51oC, or almost half the global warming to date [8]. Methane therefore presents itself as a prime target for mitigation, particularly since it is the only means available to slow warming in the near term [8,74]. Animal agriculture also offers the greatest COC, the greatest CO2 sequestration potential, bringing cause for optimism that if we were willing to change enough land use, this could have a major impact on future warming. This necessitates difficult decisions on land use and the task of reducing animal production and demand.
The accounting framework presented here disrupts conventions that appear to be overdue for challenge. We believe that these findings could facilitate a breakthrough in understanding and mitigating the climate crisis, and that consistent accounting would lead to more competent engineering solutions, enhancing credibility of the many dedicated climate scientists working towards this goal. This emission accounting framework is not prescriptive or detailed but is offered to provoke discussion and further development of this approach, which we believe will illuminate several opaque aspects and inconsistencies of current climate accounting and assist our transition to the age of drawdown.

Supplementary Materials

The following supporting information can be downloaded at the website of this paper posted on Preprints.org. Table S1: Historic emissions data sources. Table S2: Derivation of LULUCF net to gross conversion ratio. Table S3: Attribution of LULUCF CO2 Emission to Sources. Table S4: Attribution of Emission Species to sectors. Table S5: Attribution of Sector Proportions to Emission Species. Table S6: Attribution of Effective Radiative Forcing (ERF) and Global Surface Air Temperature (GSAT) to Sectors. Table S7: Carbon Opportunity Cost (COC) Attribution. Video 1: Consistent LULUCF CO2 accounting. References [5,10,18,21,22,27,29,40,42,45,47,48,59,62,65,66,68,70,75,76,77,78,79,80,81] are cited in the Supplementary Materials.

Author Contributions

Conceptualization, methodology, writing—original draft preparation and editing, G.W.-B.; internal review.

Funding

This research received no external funding. Early concepts were developed when co-authoring the Beyond Zero Emissions (Australia) Land Use Discussion Paper, funded by Beyond Zero Emissions.

Data Availability Statement

All data sources are publicly available as referenced. Data deposited with Zenodo, https://doi.org/10.5281/zenodo.10020269

Acknowledgments

The idea to use effective radiative forcing to compare sectors came from Geoff Russell. I am also indebted to the many hundreds of dedicated climate scientists who have contributed to the body of science that has enabled the current level of informed debate.

Conflicts of Interest

The author is biased against industrial scale deforestation, having witnessed first-hand the destruction of 10 square km of forest and woodland each day for grazing industries while monitoring deforestation for the Queensland government. This did influence the study topic, however every effort was made to make sure my personal judgement was unbiased.

References

  1. Hawken, P. Drawdown: The Most Comprehensive Plan Ever Proposed to Reverse Global Warming; New York, NY, 2017;
  2. Griscom, B.W.; Adams, J.; Ellis, P.W.; Houghton, R.A.; Lomax, G.; Miteva, D.A.; Schlesinger, W.H.; Shoch, D.; Siikamäki, J.V.; Smith, P.; et al. Natural Climate Solutions. PNAS 2017, 114, 11645–11650. [Google Scholar] [CrossRef] [PubMed]
  3. Girardin, C.A.J.; Jenkins, S.; Seddon, N.; Allen, M.; Lewis, S.L.; Wheeler, C.E.; Griscom, B.W.; Malhi, Y. Nature-Based Solutions Can Help Cool the Planet — If We Act Now. Nature 2021, 593, 191–194. [Google Scholar] [CrossRef] [PubMed]
  4. Beck, S.; Mahony, M. The Politics of Anticipation: The IPCC and the Negative Emissions Technologies Experience. Global Sustainability 2018, 1, e8. [Google Scholar] [CrossRef]
  5. Grassi, G.; Schwingshackl, C.; Gasser, T.; Houghton, R.A.; Sitch, S.; Canadell, J.G.; Cescatti, A.; Ciais, P.; Federici, S.; Friedlingstein, P.; et al. Harmonising the Land-Use Flux Estimates of Global Models and National Inventories for 2000–2020. Earth System Science Data 2023, 15, 1093–1114. [Google Scholar] [CrossRef]
  6. UNFCCC Moving Towards the Enhanced Transparency Framework | UNFCCC. Available online: https://unfccc.int/enhanced-transparency-framework (accessed on 16 June 2023).
  7. McGlynn, E.; Li, S.; F. Berger, M.; Amend, M.; L. Harper, K. Addressing Uncertainty and Bias in Land Use, Land Use Change, and Forestry Greenhouse Gas Inventories. Climatic Change 2022, 170, 5. [CrossRef]
  8. Dreyfus, G.B.; Xu, Y.; Shindell, D.T.; Zaelke, D.; Ramanathan, V. Mitigating Climate Disruption in Time: A Self-Consistent Approach for Avoiding Both near-Term and Long-Term Global Warming. Proceedings of the National Academy of Sciences 2022, 119, e2123536119. [Google Scholar] [CrossRef] [PubMed]
  9. Wedderburn-Bisshop, G.; Rickards, L. Livestock’s Near-Term Climate Impact and Mitigation Policy Implications. Handbook of Research on Social Marketing and Its Influence on Animal Origin Food Product Consumption 2018, 37–57. [CrossRef]
  10. Houghton, R.A.; Nassikas, A.A. Negative Emissions from Stopping Deforestation and Forest Degradation, Globally. Global Change Biology 2018, 24, 350–359. [Google Scholar] [CrossRef] [PubMed]
  11. IPCC. 2006 IPCC Guidelines for National Greenhouse Gas Inventories; The Intergovernmental Panel on Climate Change: Hayama, Japan, 2006. [Google Scholar]
  12. Ballantyne, A.P.; Alden, C.B.; Miller, J.B.; Tans, P.P.; White, J.W.C. Increase in Observed Net Carbon Dioxide Uptake by Land and Oceans during the Past 50 Years. Nature 2012, 488, 70–72. [Google Scholar] [CrossRef] [PubMed]
  13. Dooley, K.; Gupta, A. Governing by Expertise: The Contested Politics of (Accounting for) Land-Based Mitigation in a New Climate Agreement. Int Environ Agreements 2017, 17, 483–500. [Google Scholar] [CrossRef]
  14. Crowther, T.W.; Glick, H.B.; Covey, K.R.; Bettigole, C.; Maynard, D.S.; Thomas, S.M.; Smith, J.R.; Hintler, G.; Duguid, M.C.; Amatulli, G.; et al. Mapping Tree Density at a Global Scale. Nature 2015, 525, 201–205. [Google Scholar] [CrossRef]
  15. Haverd, V.; Smith, B.; Canadell, J.G.; Cuntz, M.; Mikaloff-Fletcher, S.; Farquhar, G.; Woodgate, W.; Briggs, P.R.; Trudinger, C.M. Higher than Expected CO2 Fertilization Inferred from Leaf to Global Observations. Glob Chang Biol 2020, 26, 2390–2402. [Google Scholar] [CrossRef] [PubMed]
  16. van Marle, M.J.E.; van Wees, D.; Houghton, R.A.; Field, R.D.; Verbesselt, J.; van der Werf, G.R. New Land-Use-Change Emissions Indicate a Declining CO2 Airborne Fraction. Nature 2022, 603, 450–454. [Google Scholar] [CrossRef] [PubMed]
  17. Liang, M.-C.; Mahata, S.; Laskar, A.H.; Thiemens, M.H.; Newman, S. Oxygen Isotope Anomaly in Tropospheric CO2 and Implications for CO2 Residence Time in the Atmosphere and Gross Primary Productivity. Sci Rep 2017, 7, 13180. [Google Scholar] [CrossRef] [PubMed]
  18. Houghton, R.A.; Castanho, A. Annual Emissions of Carbon from Land Use, Land-Use Change, and Forestry from 1850 to 2020. Earth System Science Data 2023, 15, 2025–2054. [Google Scholar] [CrossRef]
  19. Keith, H.; Vardon, M.; Obst, C.; Young, V.; Houghton, R.; Mackey, B. Evaluating Nature-Based Solutions for Climate Mitigation and Conservation Requires Comprehensive Carbon Accounting. Science of The Total Environment 2021, 769, 144341. [Google Scholar] [CrossRef] [PubMed]
  20. Mackey, B.; Moomaw, W.; Lindenmayer, D.; Keith, H. Net Carbon Accounting and Reporting Are a Barrier to Understanding the Mitigation Value of Forest Protection in Developed Countries. Environ. Res. Lett. 2022, 17, 054028. [Google Scholar] [CrossRef]
  21. Houghton, R.A.; Nassikas, A.A. Global and Regional Fluxes of Carbon from Land Use and Land Cover Change 1850–2015. Global Biogeochemical Cycles 2017, 31, 456–472. [Google Scholar] [CrossRef]
  22. Arneth, A.; Sitch, S.; Pongratz, J.; Stocker, B.D.; Ciais, P.; Poulter, B.; Bayer, A.D.; Bondeau, A.; Calle, L.; Chini, L.P.; et al. Historical Carbon Dioxide Emissions Caused by Land-Use Changes Are Possibly Larger than Assumed. Nature Geosci 2017, 10, 79–84. [Google Scholar] [CrossRef]
  23. Rao, S.K. Animal Agriculture Is the Leading Cause of Climate Change - A Position Paper. Journal of the Ecological Society 2021, 32–33, 155–167, https://www.scienceopen.com/hosted-document?doi=10.54081/JES.027/13. [Google Scholar] [CrossRef]
  24. Bayer, A.D.; Lindeskog, M.; Pugh, T.A.M.; Anthoni, P.M.; Fuchs, R.; Arneth, A. Uncertainties in the Land-Use Flux Resulting from Land-Use Change Reconstructions and Gross Land Transitions. Earth System Dynamics 2017, 8, 91–111. [Google Scholar] [CrossRef]
  25. Hansis, E.; Davis, S.J.; Pongratz, J. Relevance of Methodological Choices for Accounting of Land Use Change Carbon Fluxes. Global Biogeochemical Cycles 2015, 29, 1230–1246. [Google Scholar] [CrossRef]
  26. Smil, V. Harvesting the Biosphere: What We Have Taken from Nature; MIT Press, 2013; ISBN 978-0-262-01856-2.
  27. Smith, P.; Bustamante, M.; Ahammad, H.; Clark, H.; Dong, H.; Elsiddig, E.; Haberl, H.; Harper, R.; House, oanna; Jafari, M.; et al. Agriculture, Forestry and Other Land Use (AFOLU). In IPCC AR5 WG3 Chapter 11 Agriculture, Forestry and Other Land Use (AFOLU); Cambridge University Press,: Cambridge UK and NY, 2014.
  28. Goodland, R.; Anhang, J. Livestock and Climate Change: What If the Key Actors in Climate Change Are Cows, Pigs and Chickens? World Watch Magazine 2009, 10–19. [Google Scholar]
  29. Szopa, S.; Naik, V.; Adhikary, B.; Artaxo, P.; Berntsen, T.; Collins, S.; Fuzzi, S.; Gallardo, L.; Kiendler-Scharr, A.; Klimont, Z.; et al. Short-Lived Climate Forcers. In Climate Change 2021: The Physical Science Basis. Contribution of Working Group I to the Sixth Assessment Report of the Intergovernmental Panel on Climate Change; Cambridge University Press: Cambridge, UK and New York, 2021; pp. 817–922.
  30. Quaas, J.; Jia, H.; Smith, C.; Albright, A.L.; Aas, W.; Bellouin, N.; Boucher, O.; Doutriaux-Boucher, M.; Forster, P.M.; Grosvenor, D.; et al. Robust Evidence for Reversal of the Trend in Aerosol Effective Climate Forcing. Atmospheric Chemistry and Physics 2022, 22, 12221–12239. [Google Scholar] [CrossRef]
  31. Allen, M.R.; Fuglestvedt, J.S.; Shine, K.P.; Reisinger, A.; Pierrehumbert, R.T.; Forster, P.M. New Use of Global Warming Potentials to Compare Cumulative and Short-Lived Climate Pollutants. Nature Climate Change 2016, 6, 773–776. [Google Scholar] [CrossRef]
  32. Allen, M.; Lynch, J.; Cain, M.; Frame, D.J. Climate Metrics for Ruminant Livestock. 2022.
  33. Abernethy, S.; Jackson, R.B. Global Temperature Goals Should Determine the Time Horizons for Greenhouse Gas Emission Metrics. Environ. Res. Lett. 2022, 17, 024019. [Google Scholar] [CrossRef]
  34. Brazzola, N.; Wohland, J.; Patt, A. Offsetting Unabated Agricultural Emissions with CO2 Removal to Achieve Ambitious Climate Targets. PLoS ONE 2021, 16, e0247887. [Google Scholar] [CrossRef] [PubMed]
  35. Matthews, H.D.; Gillett, N.P.; Stott, P.A.; Zickfeld, K. The Proportionality of Global Warming to Cumulative Carbon Emissions. Nature 2009, 459, 829–832. [Google Scholar] [CrossRef] [PubMed]
  36. Longmire, A.; Taylor, C.; Wedderburn-Bisshop, G. Land Use: Agriculture and Forestry Discussion Paper; Beyond Zero Emissions; Melbourne Sustainable Society Institute: Melbourne, Vic, 2014;
  37. Ascui, F.; Lovell, H. As Frames Collide. Accounting, Auditing and Accountability 2011, 24, 978–999. [Google Scholar] [CrossRef]
  38. Bryngelsson, D.; Wirsenius, S.; Hedenus, F.; Sonesson, U. How Can the EU Climate Targets Be Met? A Combined Analysis of Technological and Demand-Side Changes in Food and Agriculture. Food Policy 2016, 59, 152–164. [Google Scholar] [CrossRef]
  39. Bhan, M.; Gingrich, S.; Nicolas, R.; Le Noe, J.; Kastner, T.; Matej, S.; Schwarzmüller, F.; Erb, K.-H. Quantifying and Attributing Land Use-Induced Carbon Emissions to Biomass Consumption: A Critical Assessment of Existing Approaches. Journal of Environmental Management 2021, 112228. [Google Scholar] [CrossRef]
  40. Searchinger, T.D.; Wirsenius, S.; Beringer, T.; Dumas, P. Assessing the Efficiency of Changes in Land Use for Mitigating Climate Change. Nature 2018, 564, 249–253. [Google Scholar] [CrossRef] [PubMed]
  41. Yang, X.; Tan, M. Attributing Global Land Carbon Loss to Regional Agricultural and Forestry Commodity Consumption. Environ. Sci. Technol. 2021, 55, 823–831. [Google Scholar] [CrossRef] [PubMed]
  42. Hayek, M.N.; Harwatt, H.; Ripple, W.J.; Mueller, N.D. The Carbon Opportunity Cost of Animal-Sourced Food Production on Land. Nature Sustainability 2021, 1–4. [Google Scholar] [CrossRef]
  43. Eisen, M.B.; Brown, P.O. Rapid Global Phaseout of Animal Agriculture Has the Potential to Stabilize Greenhouse Gas Levels for 30 Years and Offset 68 Percent of CO2 Emissions This Century. PLOS Climate 2022, 1, e0000010. [Google Scholar] [CrossRef]
  44. Sun, Z.; Scherer, L.; Tukker, A.; Spawn-Lee, S.A.; Bruckner, M.; Gibbs, H.K.; Behrens, P. Dietary Change in High-Income Nations Alone Can Lead to Substantial Double Climate Dividend. Nat Food 2022, 3, 29–37. [Google Scholar] [CrossRef] [PubMed]
  45. Erb, K.-H.; Kastner, T.; Plutzar, C.; Bais, A.L.S.; Carvalhais, N.; Fetzel, T.; Gingrich, S.; Haberl, H.; Lauk, C.; Niedertscheider, M.; et al. Unexpectedly Large Impact of Forest Management and Grazing on Global Vegetation Biomass. Nature 2018, 553, 73–76. [Google Scholar] [CrossRef] [PubMed]
  46. Crowther, T.W.; Glick, H.; Maynard, D.; Ashley-Cantello, W.; Evans, T.; Routh, D. Predicting Global Forest Reforestation Potential. bioRxiv 2017, 210062. [Google Scholar] [CrossRef]
  47. Obermeier, W.A.; Nabel, J.E.M.S.; Loughran, T.; Hartung, K.; Bastos, A.; Havermann, F.; Anthoni, P.; Arneth, A.; Goll, D.S.; Lienert, S.; et al. Modelled Land Use and Land Cover Change Emissions – a Spatio-Temporal Comparison of Different Approaches. Earth System Dynamics 2021, 12, 635–670. [Google Scholar] [CrossRef]
  48. Gasser, T.; Crepin, L.; Quilcaille, Y.; Houghton, R.A.; Ciais, P.; Obersteiner, M. Historical CO Emissions from Land Use and Land Cover Change and Their Uncertainty. Biogeosciences 2020, 17, 4075–4101. [Google Scholar] [CrossRef]
  49. Chen, C.; Riley, W.J.; Prentice, I.C.; Keenan, T.F. CO2 Fertilization of Terrestrial Photosynthesis Inferred from Site to Global Scales. Proceedings of the National Academy of Sciences 2022, 119, e2115627119. [Google Scholar] [CrossRef]
  50. Kaplan, J.O.; Krumhardt, K.M.; Ellis, E.C.; Ruddiman, W.F.; Lemmen, C.; Goldewijk, K.K. Holocene Carbon Emissions as a Result of Anthropogenic Land Cover Change. The Holocene 2011, 21, 775–791. [Google Scholar] [CrossRef]
  51. Yu, Z. Holocene Carbon Flux Histories of the World’s Peatlands: Global Carbon-Cycle Implications. The Holocene 2011, 21, 761–774. [Google Scholar] [CrossRef]
  52. Shrestha, A.; Eshpeter, S.; Li, N.; Li, J.; Nile, J.O.; Wang, G. Inclusion of Forestry Offsets in Emission Trading Schemes: Insights from Global Experts. J. For. Res. 2022, 33, 279–287. [Google Scholar] [CrossRef]
  53. Schenuit, F.; Gidden, M.J.; Boettcher, M.; Brutschin, E.; Fyson, C.; Gasser, T.; Geden, O.; Lamb, W.F.; Mace, M.J.; Minx, J.; et al. Secure Robust Carbon Dioxide Removal Policy through Credible Certification. Commun Earth Environ 2023, 4, 1–4. [Google Scholar] [CrossRef]
  54. Newman, P.W.G. Net Zero in the Maelstrom: Professional Practice for Net Zero in a Time of Turbulent Change. Sustainability 2023, 15, 4810. [Google Scholar] [CrossRef]
  55. Harvey, F.; editor, F.H.E. Greenwashing or a Net Zero Necessity? Climate Scientists on Carbon Offsetting. The Guardian 2023.
  56. Greenfield, P. Revealed: More than 90% of Rainforest Carbon Offsets by Biggest Certifier Are Worthless, Analysis Shows. The Guardian 2023.
  57. NATCARB National Carbon Sequestration Database and Geographic Information System (NATCARB) Sources Spatial Database of Stationary Sources of Atmospheric Carbon Dioxide (CO2) Emissions | Data Basin. Available online: https://databasin.org/datasets/8f9de65926ab4e32bbe763df100a1398/ (accessed on 24 October 2023).
  58. CER Emissions Reduction Fund Project Register. Available online: https://www.cleanenergyregulator.gov.au/ERF/project-and-contracts-registers/project-register (accessed on 24 October 2023).
  59. Jia, G.; Shevliakova, E.; Artaxo, P.; Noblet-Ducoudre, N.; Houghton, R.; House, J.; Kitajima, K.; Lennard, C.; Popp, A.; Sirin, A.; et al. Land–Climate Interactions. In Climate Change and Land: An IPCC special report on climate change, desertification, land degradation, sustainable land management, food security, and greenhouse gas fluxes in terrestrial ecosystems; Shukla, P., Skea, J., Calvo Buendia, E., Masson-Delmotte, V., Portner, H., Roberts, D., Zhai, P., Slade, R., Connors, S., van Diemen, R., Haughey, E., Luz, S., Pathak, M., Petzold, J., Portugal Pereira, J., Vyas, P., Huntley, E., Kissick, K., Belkacemi, M., Malley, J., Eds.; Intergovernmental Panel on Climate Change, 2019.
  60. Qin, Y.; Xiao, X.; Wigneron, J.-P.; Ciais, P.; Brandt, M.; Fan, L.; Li, X.; Crowell, S.; Wu, X.; Doughty, R.; et al. Carbon Loss from Forest Degradation Exceeds That from Deforestation in the Brazilian Amazon. Nat. Clim. Chang. 2021, 11, 442–448. [Google Scholar] [CrossRef]
  61. Winkler, K.; Fuchs, R.; Rounsevell, M.; Herold, M. Global Land Use Changes Are Four Times Greater than Previously Estimated. Nat Commun 2021, 12, 2501. [Google Scholar] [CrossRef]
  62. Global Carbon and Other Biogeochemical Cycles and Feedbacks. In Climate Change 2021 – The Physical Science Basis: Working Group I Contribution to the Sixth Assessment Report of the Intergovernmental Panel on Climate Change; Canadell, Monterio, P., Costa, M., Cotrim da Cunha, L., Cox, P., Eliseev, A., Henson, S., Ishii, M., Jaccard, S., Koven, C., Lohila, A., Patra, P., Piao, S., Rogelj, J., Syampungani, S., Zaehle, S., Zickfeld, K., Eds.; Cambridge University Press: Cambridge, 2021; pp. 673–816 ISBN 978-1-00-915788-9.
  63. Peng, L.; Searchinger, T.D.; Zionts, J.; Waite, R. The Carbon Costs of Global Wood Harvests. Nature 2023, 1–6. [Google Scholar] [CrossRef] [PubMed]
  64. Forster, P.; Storelvmo, T.; Armour, K.; Collins, W.; Dufresne, J.-L.; Frame, D.; Lunt, D.; Mauritsen, T.; Palmer, M.; Watanabe, M.; et al. The Earth’s Energy Budget, Climate Feedbacks, and Climate Sensitivity. In Climate Change 2021: The Physical Science Basis. Contribution of Working Group I to the Sixth Assessment Report of the Intergovernmental Panel on Climate Change; Cambridge University Press, Cambridge, United Kingdom and New York, USA, 2021 ISBN. [CrossRef]
  65. Friedlingstein, P.; O’Sullivan, M.; Jones, M.W.; Andrew, R.M.; Gregor, L.; Hauck, J.; Le Quéré, C.; Luijkx, I.T.; Olsen, A.; Peters, G.P.; et al. Global Carbon Budget 2022. Earth System Science Data 2022, 14, 4811–4900. [Google Scholar] [CrossRef]
  66. Hoesly, R.M.; Smith, S.J.; Feng, L.; Klimont, Z.; Janssens-Maenhout, G.; Pitkanen, T.; Seibert, J.J.; Vu, L.; Andres, R.J.; Bolt, R.M.; et al. Historical (1750–2014) Anthropogenic Emissions of Reactive Gases and Aerosols from the Community Emissions Data System (CEDS). Geoscientific Model Development 2018, 11, 369–408. [Google Scholar] [CrossRef]
  67. Graven, H.; Keeling, R.F.; Rogelj, J. Changes to Carbon Isotopes in Atmospheric CO2 Over the Industrial Era and Into the Future. Global Biogeochemical Cycles 2020, 34, e2019GB006170. [Google Scholar] [CrossRef]
  68. Walker, W.S.; Gorelik, S.R.; Cook-Patton, S.C.; Baccini, A.; Farina, M.K.; Solvik, K.K.; Ellis, P.W.; Sanderman, J.; Houghton, R.A.; Leavitt, S.M.; et al. The Global Potential for Increased Storage of Carbon on Land. Proceedings of the National Academy of Sciences 2022, 119, e2111312119. [Google Scholar] [CrossRef] [PubMed]
  69. Padarian, J.; Minasny, B.; McBratney, A.; Smith, P. Soil Carbon Sequestration Potential in Global Croplands. PeerJ 2022, 10, e13740. [Google Scholar] [CrossRef] [PubMed]
  70. Xu, L.; Saatchi, S.S.; Yang, Y.; Yu, Y.; Pongratz, J.; Bloom, A.A.; Bowman, K.; Worden, J.; Liu, J.; Yin, Y.; et al. Changes in Global Terrestrial Live Biomass over the 21st Century. Science Advances 2021, 7, eabe9829. [Google Scholar] [CrossRef] [PubMed]
  71. Hansen, J.; Kharecha, P.; Sato, M. Climate Forcing Growth Rates: Doubling down on Our Faustian Bargain. Environ. Res. Lett. 2013, 8, 011006. [Google Scholar] [CrossRef]
  72. Samset, B.H.; Sand, M.; Smith, C.J.; Bauer, S.E.; Forster, P.M.; Fuglestvedt, J.S.; Osprey, S.; Schleussner, C.-F. Climate Impacts From a Removal of Anthropogenic Aerosol Emissions. Geophysical Research Letters 2018, 45, 1020–1029. [Google Scholar] [CrossRef] [PubMed]
  73. Chowdhury, S.; Pozzer, A.; Haines, A.; Klingmüller, K.; Münzel, T.; Paasonen, P.; Sharma, A.; Venkataraman, C.; Lelieveld, J. Global Health Burden of Ambient PM2.5 and the Contribution of Anthropogenic Black Carbon and Organic Aerosols. Environment International 2022, 159, 107020. [Google Scholar] [CrossRef]
  74. Lelieveld, J.; Klingmüller, K.; Pozzer, A.; Burnett, R.T.; Haines, A.; Ramanathan, V. Effects of Fossil Fuel and Total Anthropogenic Emission Removal on Public Health and Climate. PNAS 2019, 116, 7192–7197. [Google Scholar] [CrossRef]
  75. van der Werf, G.R.; Randerson, J.T.; Giglio, L.; van Leeuwen, T.T.; Chen, Y.; Rogers, B.M.; Mu, M.; van Marle, M.J.E.; Morton, D.C.; Collatz, G.J.; et al. Global Fire Emissions Estimates during 1997–2016. Earth System Science Data 2017, 9, 697–720. [Google Scholar] [CrossRef]
  76. Millington, J.D.A.; Perkins, O.; Smith, C. Human Fire Use and Management: A Global Database of Anthropogenic Fire Impacts for Modelling. Fire 2022, 5, 87. [Google Scholar] [CrossRef]
  77. Lauk, C.; Erb, K.-H. Biomass Consumed in Anthropogenic Vegetation Fires: Global Patterns and Processes. Ecological Economics 2009, 69, 301–309. [Google Scholar] [CrossRef]
  78. Pendrill, F.; Gardner, T.A.; Meyfroidt, P.; Persson, U.M.; Adams, J.; Azevedo, T.; Bastos Lima, M.G.; Baumann, M.; Curtis, P.G.; De Sy, V.; et al. Disentangling the Numbers behind Agriculture-Driven Tropical Deforestation. Science 2022, 377, eabm9267. [Google Scholar] [CrossRef] [PubMed]
  79. FAO.Forest Resource Assessment 2020 Remote Sensing Survey; FAO: Rome, 2022; ISBN 978-92-5-136147-4.
  80. Gulev, S.; Thorne, P.; Ahn, J.; Dentener, F.; Domingues, C.; Gerland, S.; Gong, D.; Kaufman, D.; Nnamchi, H.; Quaas, J.; et al. Changing State of the Climate System. In Climate Change 2021: The Physical Science Basis. Contribution of Working Group I to the Sixth Assessment Report of the Intergovernmental Panel on Climate Change; Cambridge University Press, Cambridge, United Kingdom and New York, USA, 2021.
  81. Thornhill, G.D.; Collins, W.J.; Kramer, R.J.; Olivié, D.; Skeie, R.B.; O’Connor, F.M.; Abraham, N.L.; Checa-Garcia, R.; Bauer, S.E.; Deushi, M.; et al. Effective Radiative Forcing from Emissions of Reactive Gases and Aerosols – a Multi-Model Comparison. Atmospheric Chemistry and Physics 2021, 21, 853–874. [Google Scholar] [CrossRef]
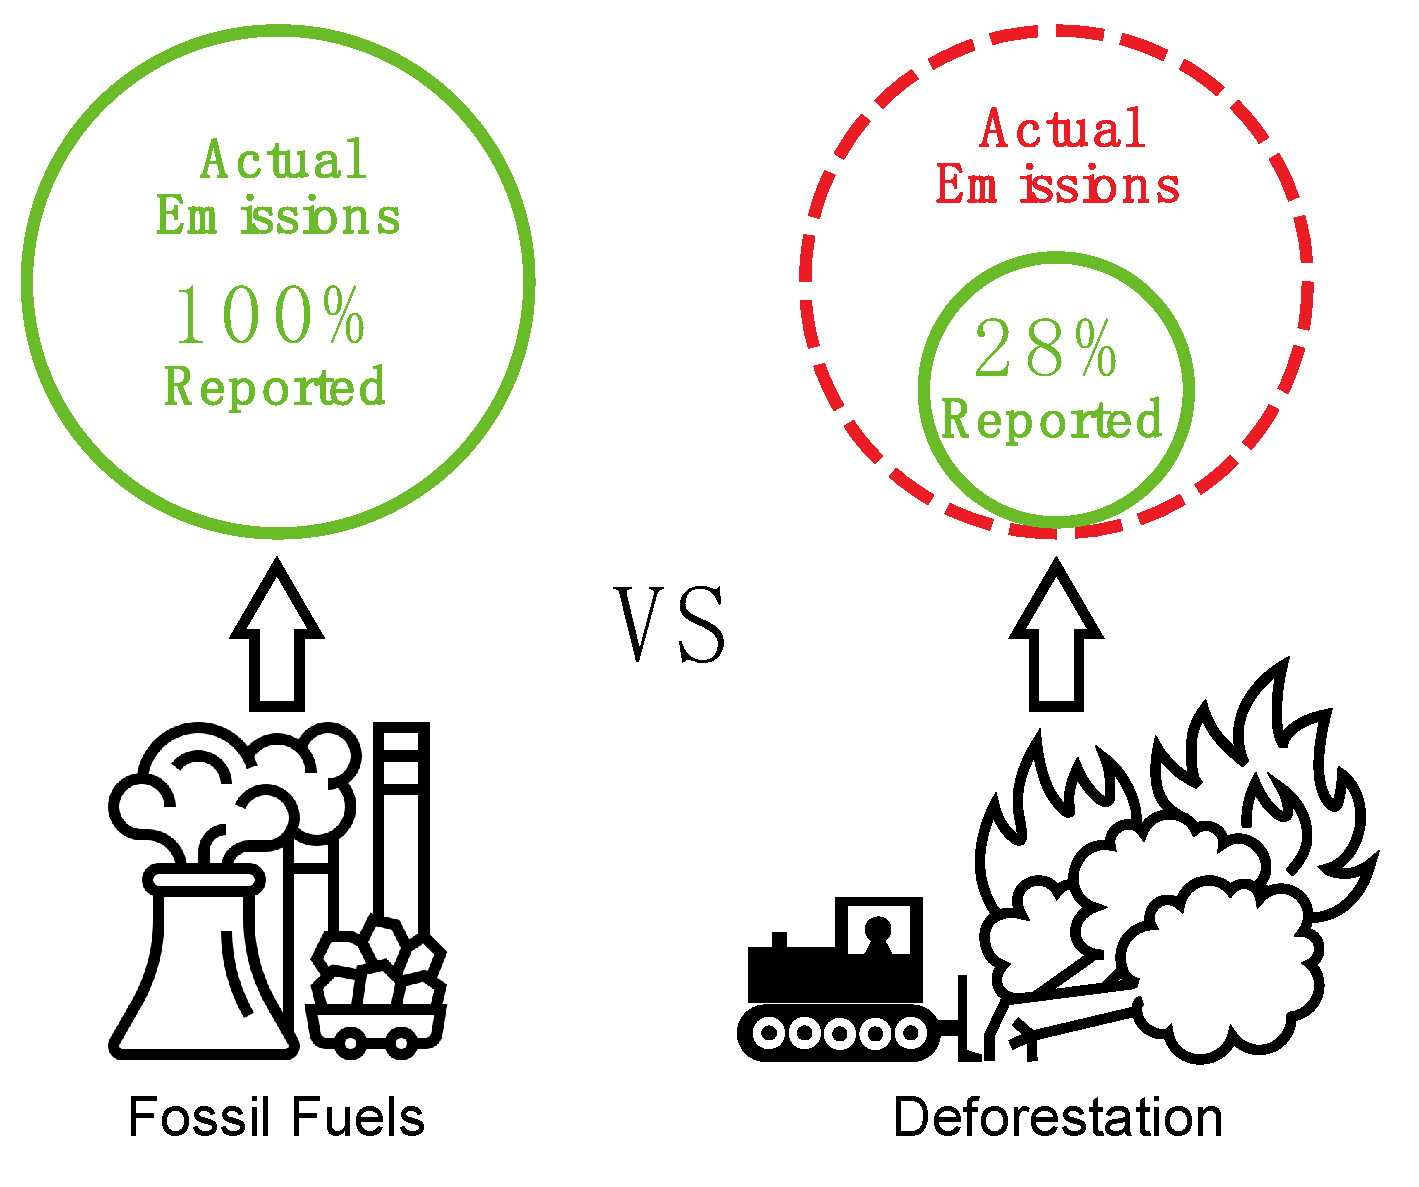
Figure 1. Conventional but inconsistent IPCC accounting of CO2 emissions from fossil fuels (gross accounting) and LULUCF (net accounting), (77% from deforestation). Note that this refers to CO2 emissions only, all other emission types are accounted consistently.
Preprints 88922 g001
Figure 2. (A) Conventional but inconsistent accounting of cumulative CO2 emissions from fossil fuels (gross accounting) and land use (net accounting) from 1750-2021 [65]; (B) Consistent gross accounting of cumulative fossil fuel and land use CO2 emissions, with deforestation emissions extended to when deforestation began, about 8,000BC [45,65,66]. Cumulative pre-1850 LULUCF CO2 emissions from Kaplan (2011) [50].
Preprints 88922 g002
Figure 3. Cumulative Gross CO2 emissions and drawdown since 1750 (GtCO2) with COC [45,65,68].
Preprints 88922 g003
Figure 6. Net Effective Radiative Forcing by sector with carbon opportunity cost (drawdown potential). Data are provided in Table SM6.
Preprints 88922 g006
Table 1. Proposed changes to conventional IPCC greenhouse emission accounting .
Proposed Accounting Change Description
1. Consistent accounting of CO2 sources Correcting inconsistent Gross accounting as applied to CO2 emissions from fossil fuels and Net accounting applied to CO2 from land use/land use change and forestry (LULUCF).
2. Aggregate biosphere sinks Removing the artificial distinction between drawdown on ‘intact’ and ‘managed’ land
3. Sector accounting to include all emissions: heating and cooling Correcting partial accounting: cooling emissions are rarely associated with sectors
4. Clearly attribute land use emissions to industries/sectors responsible Introducing new LULUCF categories to allow transparent attribution to sectors
5. Compare sectors using emissions-based Effective Radiative Forcing (ERF) of individual gases, rather than conventional GWP100 Major advances have been made in modelling ERF (IPCC AR6, 2021), making sector contributions more transparent and avoiding contentious emission comparison metrics
6. Include Carbon Opportunity Cost (COC) Explicitly placing the major drawdown mechanism (biosphere sequestration) into carbon accounting
7. Accounting for Drawdown Devising a new accounting framework that allows for COC and drawdown, with explicit spatial data
Disclaimer/Publisher’s Note: The statements, opinions and data contained in all publications are solely those of the individual author(s) and contributor(s) and not of MDPI and/or the editor(s). MDPI and/or the editor(s) disclaim responsibility for any injury to people or property resulting from any ideas, methods, instructions or products referred to in the content.
Copyright: This open access article is published under a Creative Commons CC BY 4.0 license, which permit the free download, distribution, and reuse, provided that the author and preprint are cited in any reuse.
Prerpints.org logo

Preprints.org is a free preprint server supported by MDPI in Basel, Switzerland.

Subscribe

© 2024 MDPI (Basel, Switzerland) unless otherwise stated