Submitted:
27 October 2023
Posted:
01 November 2023
You are already at the latest version
Abstract
Keywords:
1. Introduction
2. Materials and Methods
Data and sources
2018. Nigeria Demographic and Health Survey (DHS)
2021. Nigeria Multiple Indicator Cluster Survey-National Immunization Coverage Survey (MICS-NICS)
Outcome indicators of zero dose included in the study
Independent variables and geospatial covariate data
Population data
Statistical analysis
Descriptive and bivariate analysis
Multilevel model
Geostatistical model
3. Results
3.1.1. Outcome indicators of vaccination coverage
3.1.2. 1 km x 1 km modelled estimates of coverage and associated uncertainties before and during the pandemic
3.1.2. District-level estimates of numbers of zero-dose children before and during the pandemic
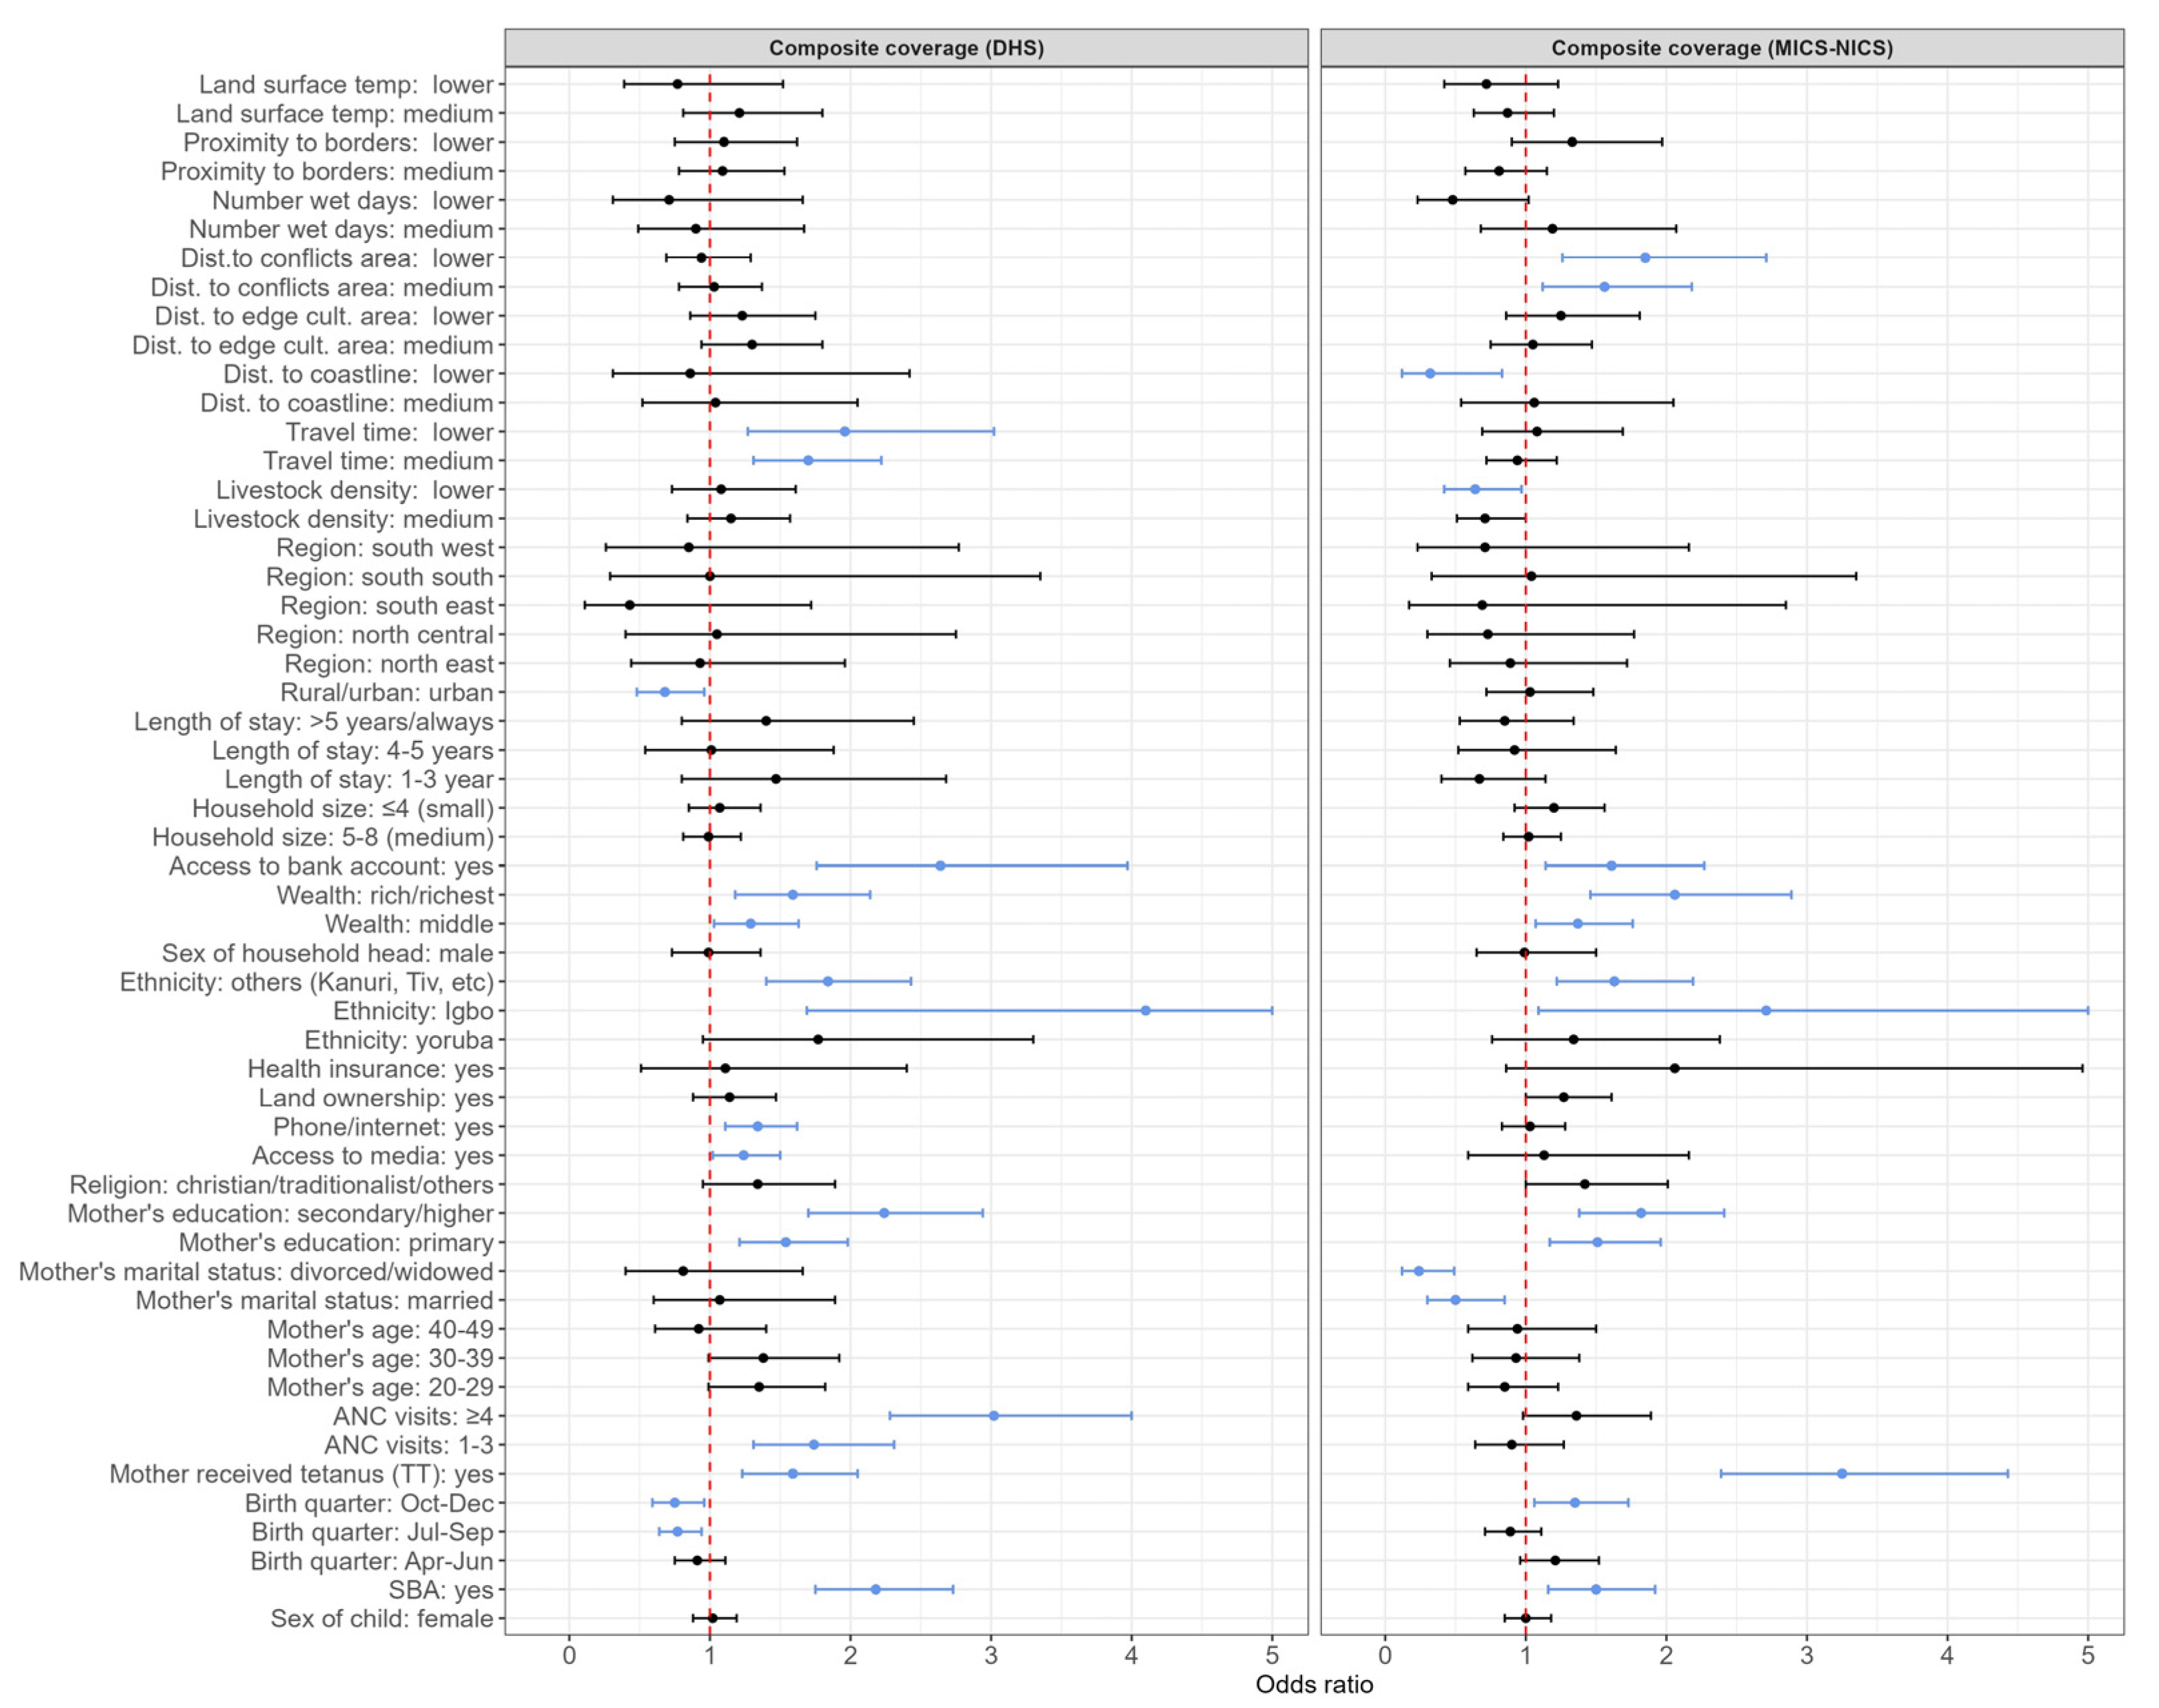
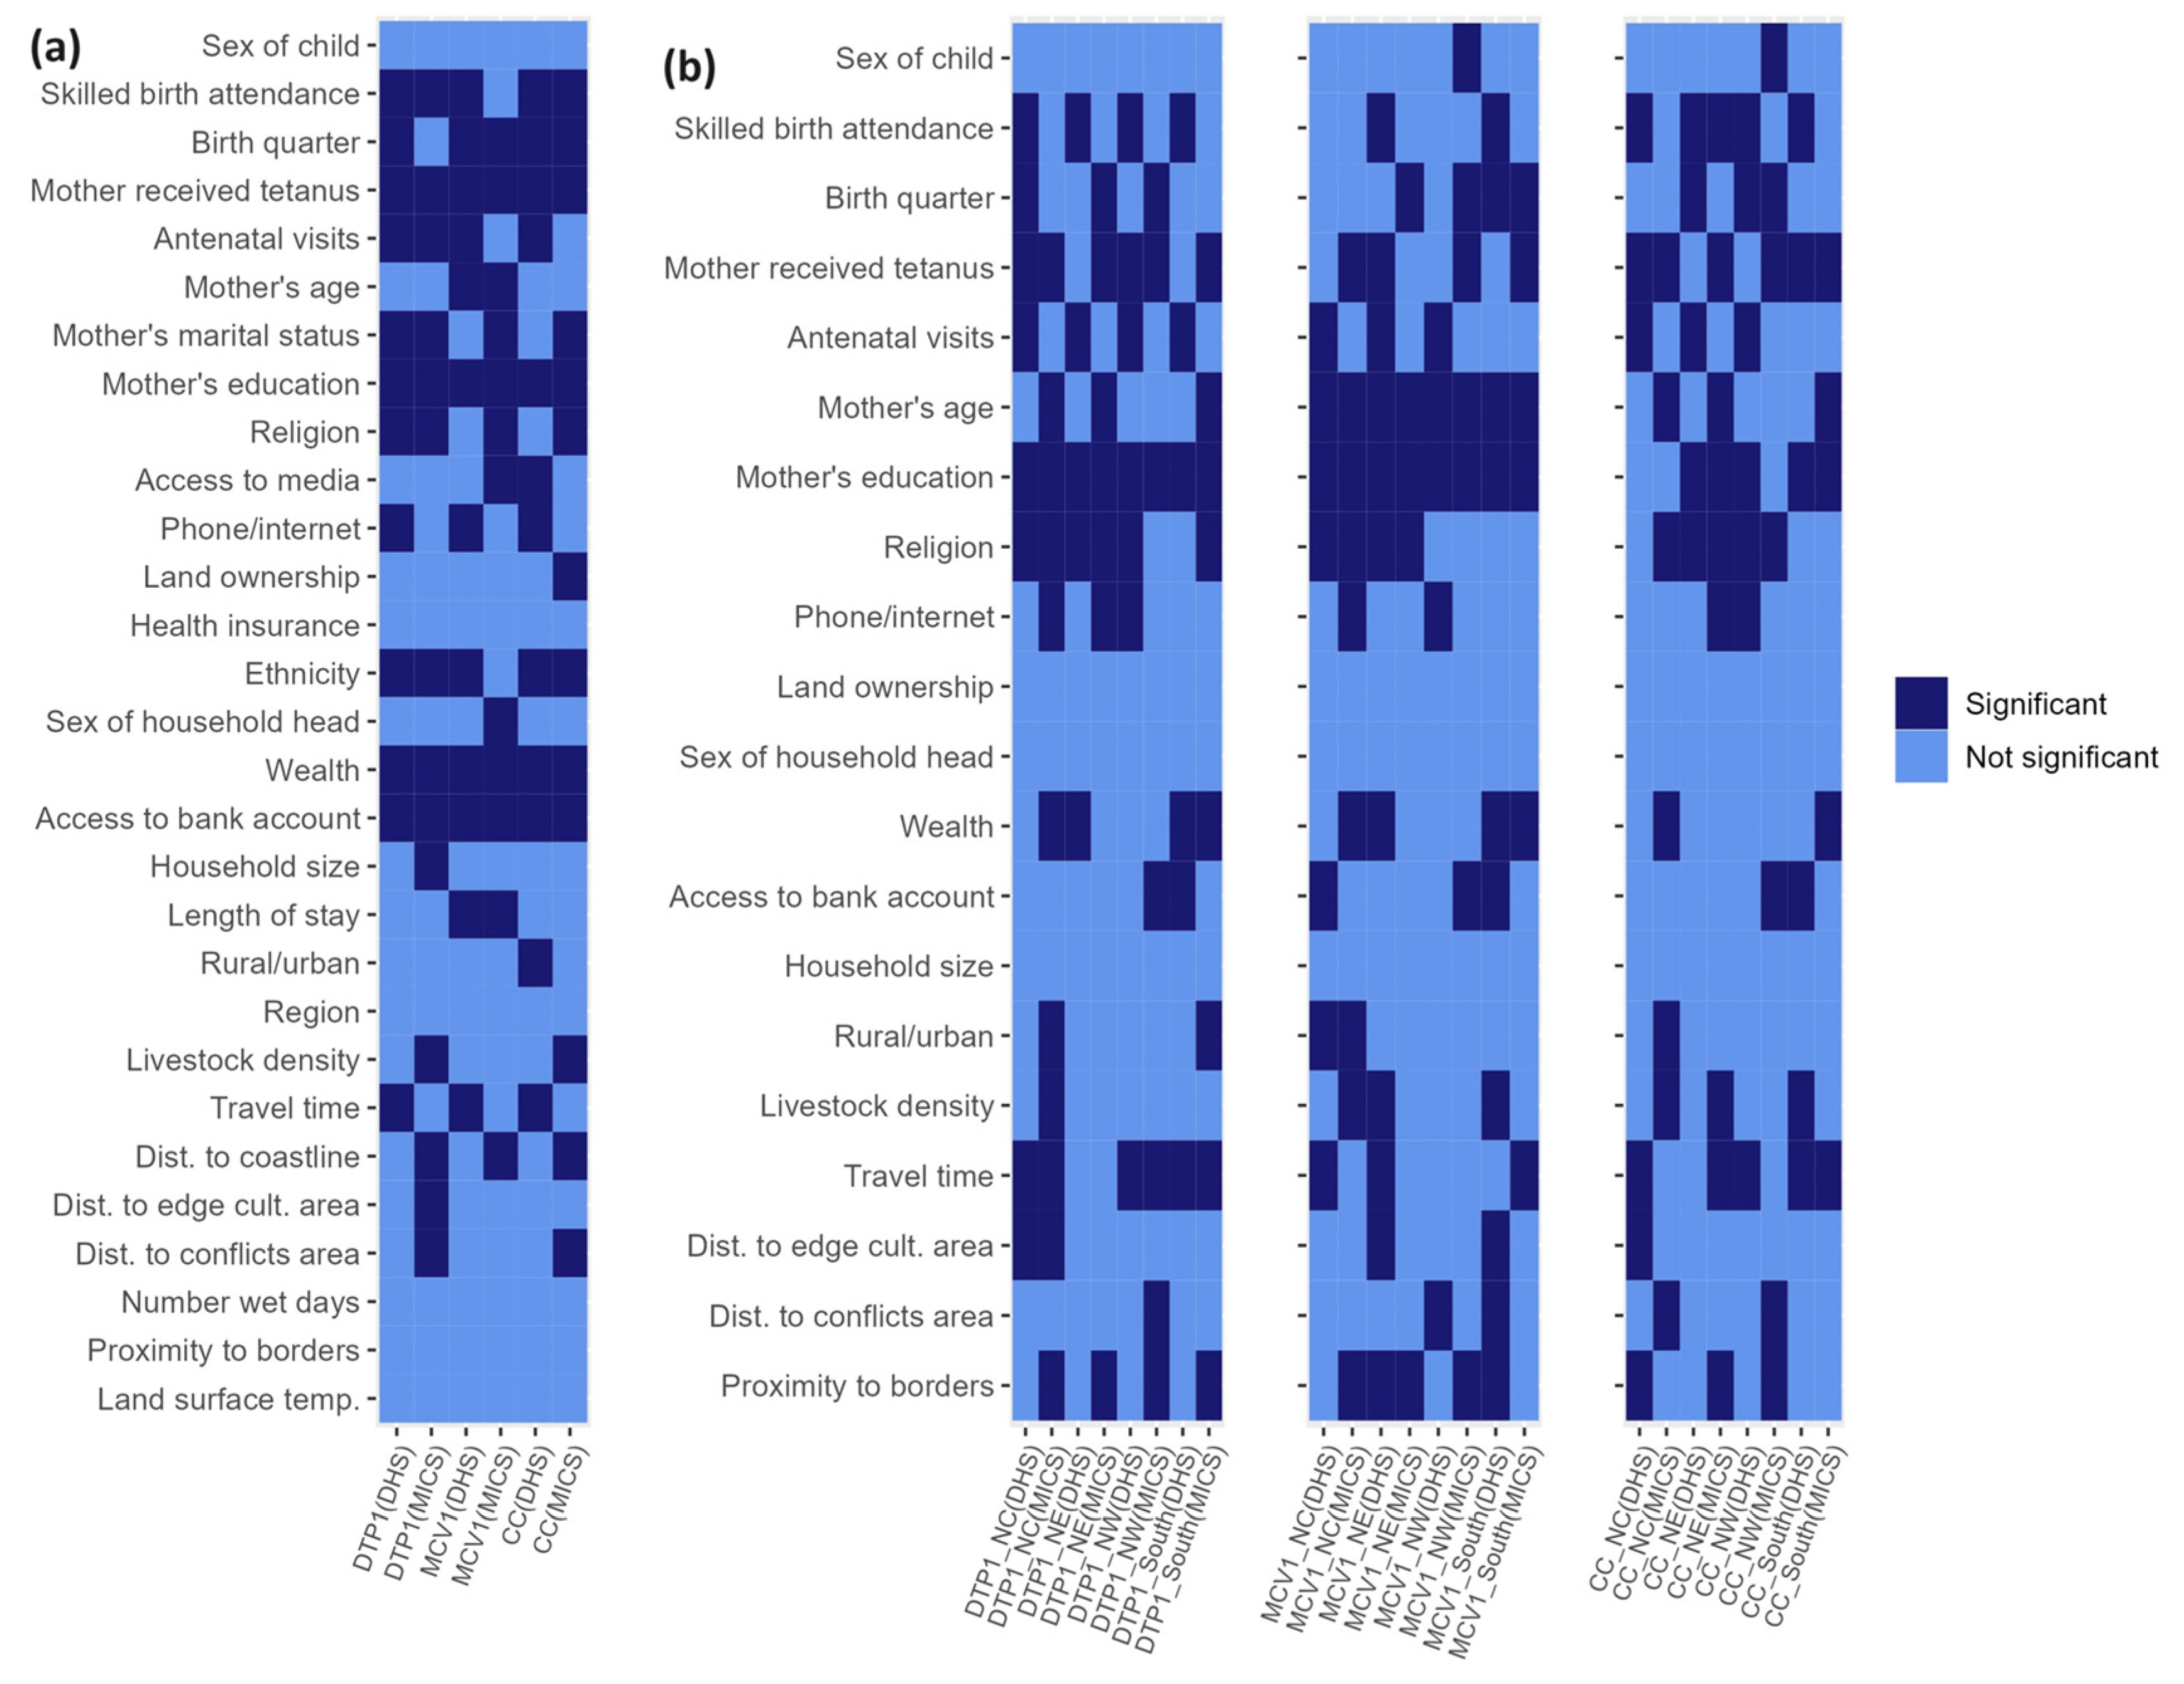
3.1.3. Risk factors associated with zero dose at the national and regional levels before and during the pandemic
4. Discussion
Supplementary Materials
Author Contributions
Funding
Institutional Review Board Statement
Informed Consent Statement
Data Availability Statement
Conflicts of Interest
References
- World Health Organization (WHO). Global Immunization Coverage 2021 [Internet]; WHO Estimates of National Immunization Coverage (data as of July 2022). Available from https://www.who.int/news-room/fact-sheets/detail/immunization-coverage (accessed on March 20 2023). Geneva, Switzerland2021.
- World Health Organization (WHO), UNICEF. 2022 WHO/UNICEF Estimates of National Immunization Coverage (WUENIC). Available from: https://cdn.who.int/media/docs/default-source/immunization/wuenic-progress-and-challenges.pdf?sfvrsn=b5eb9141_12&download=true. [Accessed on 21 August 2023] WHO and UNICEF; 2023.
- Causey K, Fullman N, Sorensen RJD, Galles NC, Zheng P, Aravkin A, et al. Estimating global and regional disruptions to routine childhood vaccine coverage during the COVID-19 pandemic in 2020: a modelling study. Lancet. 2021;398:522-34. [CrossRef]
- Ho LL, Gurung S, Mirza I, Nicolas HD, Steulet C, Burman AL, et al. Impact of the SARS-CoV-2 pandemic on vaccine-preventable disease campaigns. International Journal of Infectious Diseases. 2022;119:201-9. [CrossRef]
- World Health Organization (WHO), UNICEF. 2021 WHO/UNICEF Estimates of National Immunization Coverage (WUENIC). Available from: https://www.who.int/teams/immunization-vaccines-and-biologicals/immunization-analysis-and-insights/global-monitoring/immunization-coverage/who-unicef-estimates-of-national-immunization-coverage. [Accessed on 20 February 2023]. 2022.
- Hogan D, Gupta A. Why Reaching Zero-Dose Children Holds the Key to Achieving the Sustainable Development Goals. Vaccines2023. [CrossRef]
- Utazi CE, Pannell O, Aheto JMK, Wigley A, Tejedor-Garavito N, Wunderlich J, et al. Assessing the characteristics of un- and under-vaccinated children in low- and middle-income countries: A multi-level cross-sectional study. PLOS Global Public Health. 2022;2:e0000244. [CrossRef]
- Wigley A, Lorin J, Hogan D, Utazi CE, Hagedorn B, Dansereau E, et al. Estimates of the number and distribution of zero-dose and under-immunised children across remote-rural, urban, and conflict-affected settings in low and middle-income countries. PLOS Global Public Health. 2022;2:e0001126. [CrossRef]
- Chopra M, Bhutta Z, Chang Blanc D, Checchi F, Gupta A, Lemango ET, et al. Addressing the persistent inequities in immunization coverage. Bull World Health Organ. 2020;98:146-8. [CrossRef]
- WHO. Immunization Agenda 2030: A Global Strategy To Leave No One Behind. [https://www.who.int/immunization/immunization_agenda_2030/en/. Accessed: June 25, 2021]. Geneva, Switzerland: World Health Organization; 2020.
- O’Brien KL, Lemango E. The big catch-up in immunisation coverage after the COVID-19 pandemic: progress and challenges to achieving equitable recovery. Lancet. 2023;402:510-2. [CrossRef]
- Shuaib F, Garba AB, Meribole E, Obasi S, Sule A, Nnadi C, et al. Implementing the routine immunisation data module and dashboard of DHIS2 in Nigeria, 2014–2019. BMJ Global Health. 2020;5:e002203. [CrossRef]
- District health information system, version 2, 2019. Available: https://www.dhis2.org/.
- Sbarra AN, Rolfe S, Nguyen JQ, Earl L, Galles NC, Marks A, et al. Mapping routine measles vaccination in low- and middle-income countries. Nature. 2021;589:415-9. [CrossRef]
- Utazi CE, Thorley J, Alegana VA, Ferrari MJ, Takahashi S, Metcalf CJE, et al. Mapping vaccination coverage to explore the effects of delivery mechanisms and inform vaccination strategies. Nature Communications. 2019;10:1633. [CrossRef]
- Utazi CE, Nilsen K, Pannell O, Dotse-Gborgbortsi W, Tatem AJ. District-level estimation of vaccination coverage: Discrete vs continuous spatial models. Statistics in Medicine. 2021;40:2197-211. [CrossRef]
- United Nations (UN). Transforming our world: The 2030 agenda for sustainable development; 2015. Available from: https://sustainabledevelopment.un.org/post2015/transformingourworld/publication. [Accessed on 20 August 2023]. UN; 2015.
- Gavi The Vaccine Alliance (GAVI). Gavi Strategy 5.0, 2021–2025; 2020. Available from: https://www.gavi.org/our-alliance/strategy/phase-5-2021-2025. [Accessed on 20 June 2023]. GAVI2020.
- Nigeria Centre for Disease Control and Prevention (NCDC). An Update of Measles Outbreak in Nigeria. Available at https://ncdc.gov.ng/diseases/sitreps (Accessed on 20th February 2023). 2023.
- Nigeria Centre for Disease Control and Prevention (NCDC). An Update of Diphtheria Outbreak in Nigeria. Available at https://ncdc.gov.ng/diseases/sitreps (Accessed on 20th February 2023). 2023.
- Utazi CE, Aheto JMK, Wigley A, Tejedor-Garavito N, Bonnie A, Nnanatu CC, et al. Mapping the distribution of zero-dose children to assess the performance of vaccine delivery strategies and their relationships with measles incidence in Nigeria. Vaccine. 2022. [CrossRef]
- Jean Baptiste AE, Masresha B, Wagai J, Luce R, Oteri J, Dieng B, et al. Trends in measles incidence and measles vaccination coverage in Nigeria, 2008–2018. Vaccine. 2021;39:C89-C95. [CrossRef]
- Akwataghibe NN, Ogunsola EA, Broerse JEW, Popoola OA, Agbo AI, Dieleman MA. Exploring Factors Influencing Immunization Utilization in Nigeria-A Mixed Methods Study. Front Public Health. 2019;7:392. [CrossRef]
- Aheto JMK, Pannell O, Dotse-Gborgbortsi W, Trimner MK, Tatem AJ, Rhoda DA, et al. Multilevel analysis of predictors of multiple indicators of childhood vaccination in Nigeria. PLoS ONE. 2022;17:e0269066. [CrossRef]
- Oku A, Oyo-Ita A, Glenton C, Fretheim A, Eteng G, Ames H, et al. Factors affecting the implementation of childhood vaccination communication strategies in Nigeria: a qualitative study. BMC Public Health. 2017;17:200. [CrossRef]
- International Vaccine Access Center (IVAC). Landscape Analysis of Routine Immunization in Nigeria. Available from https://www.jhsph.edu/ivac/wp-content/uploads/2018/05/IVAC-Landscape-Analysis-Routine-Immunization-Nigeria-Brief.pdf. IVAC; 2012.
- Nigeria Centre for Disease Control (NCDC). First Case of Corona Virus Disease Confirmed in Nigeria. Available from https://ncdc.gov.ng/news/227/first-case-of-corona-virus-disease-confirmed-in-nigeria (Accessed on 24th March 2023). 2020.
- Presidential Task Force on COVID-19—Nigeria. Presidential Task Force on COVID-19: Mid-Term Report. Available from https://statehouse.gov.ng/covid19/2020/10/02/presidential-task-force-on-covid-19-mid-term-report/ (Accessed on 30th April 2023). Nigeria2020.
- Mathieu E, Ritchie H, Rodés-Guirao L, Appel C, Giattino C, Hasell J, et al. Coronavirus pandemic (COVID-19), vaccinations by Country; Nigeria. Our World in Data. Available from https://ourworldindata.org/covid-vaccinations (Accessed on 21 February 2023). 2020.
- Essoh TA, Adeyanju GC, Adamu AA, Ahawo AK, Aka D, Tall H, et al. Early Impact of SARS-CoV-2 Pandemic on Immunization Services in Nigeria. Vaccines (Basel). 2022;10. [CrossRef]
- Ibrahim D, Alyssa S, Ismael H, Ricardo I. Analysis of the impact of COVID-19 pandemic and response on routine childhood vaccination coverage and equity in Northern Nigeria: a mixed methods study. BMJ Open. 2023;13:e076154. [CrossRef]
- Adelekan B, Goldson E, Abubakar Z, Mueller U, Alayande A, Ojogun T, et al. Effect of COVID-19 pandemic on provision of sexual and reproductive health services in primary health facilities in Nigeria: a cross-sectional study. Reproductive Health. 2021;18:166. [CrossRef]
- National Population Commission (NPC) [Nigeria], ICF. Nigeria Demographic and Health Survey 2018—Final Report. [https://dhsprogram.com/publications/publication-fr359-dhs-final-reports.cfm. Accessed: 16/03/2021]. Abuja, Nigeria, and Rockville, Maryland, USA: NPC and ICF; 2019.
- National Bureau of Statistics (NBS), United Nations Children’s Fund (UNICEF). Multiple Indicator Cluster Survey 2021—Survey Findings Report. Abuja, Nigeria: NBS and UNICEF; 2022.
- World Health Organization (WHO). Vaccination schedule for Nigeria. Available from https://immunizationdata.who.int/pages/schedule-by-country/nga.html?DISEASECODE=&TARGETPOP_GENERAL= (Accessed on 19 February 2023). WHO; 2023.
- Utazi CE, Wagai J, Pannell O, Cutts FT, Rhoda DA, Ferrari MJ, et al. Geospatial variation in measles vaccine coverage through routine and campaign strategies in Nigeria: Analysis of recent household surveys. Vaccine. 2020;38:3062-71. [CrossRef]
- Utazi CE, Thorley J, Alegana VA, Ferrari MJ, Takahashi S, Metcalf CJE, et al. High resolution age-structured mapping of childhood vaccination coverage in low and middle income countries. Vaccine. 2018;36:1583-91. [CrossRef]
- WorldPop. Open Spatial Demographic Data and Research. Available at https://www.worldpop.org/ (accessed on 20 February 2023). WorldPop; 2021.
- United Nations, Department of Economic and Social Affairs, Population Division. World Population Prospects 2022: Release note. Available at https://population.un.org/wpp/ (accessed on 19 October 2023). 2022.
- Leckie G, Charlton C. runmlwin—A Program to Run the MLwiN Multilevel Modelling Software from within Stata. Journal of Statistical Software. 2013;52:1-40.
- Hedeker D, Gibbons RD. MIXOR: a computer program for mixed-effects ordinal regression analysis. Comput Methods Programs Biomed. 1996;49:157-76. [CrossRef]
- Lindgren F, Rue H. Bayesian Spatial Modelling with R-INLA. Journal of Statistical Software; Vol 1, Issue 19 (2015). 2015. [CrossRef]
- Diggle P, Ribeiro PJ, MyiLibrary. Model-based geostatistics. Springer series in statistics. New York, NY: Springer; 2007.
- Matérn, B. Spatial Variation. 2nd ed. Berlin: Springer-Verlag; 1986.
- Lindgren F, Rue H, Lindström J. An explicit link between Gaussian fields and Gaussian Markov random fields: the stochastic partial differential equation approach. Journal of the Royal Statistical Society: Series B (Statistical Methodology). 2011;73:423-98. [CrossRef]
- Rue H, Martino S, Lindgren F, Simpson D, Riebler A. INLA: Functions which allow to perform full Bayesian analysis of latent Gaussian models using Integrated Nested2013.
- Mosser JF, Gagne-Maynard W, Rao PC, Osgood-Zimmerman A, Fullman N, Graetz N, et al. Mapping diphtheria-pertussis-tetanus vaccine coverage in Africa, 2000-2016: a spatial and temporal modelling study. Lancet. 2019;393:1843-55. [CrossRef]
- Ludlow L, Klein K. Suppressor Variables: The Difference Between ‘is’ Versus ‘Acting As’. Journal of Statistics Education. 2014;22:null-null.
- Nigeria Centre for Disease Control and Prevention (NCDC). COVID-19 NIGERIA. Available from https://covid19.ncdc.gov.ng/ (Accessed on 20th 23). Nigeria.
- Sato, R. Pattern of vaccination delivery around COVID-19 lockdown in Nigeria. Human Vaccines & Immunotherapeutics. 2021;17:2951-3. [CrossRef]
- Utazi CE, Aheto JMK, Chan HMT, Tatem AJ, Sahu SK. Conditional probability and ratio-based approaches for mapping the coverage of multi-dose vaccines. Stat Med. 2022;41:5662-78. [CrossRef]
- World Health Organization (WHO). States adopt integrated vaccination strategy to reach unimmunized children, Nigeria. Available from https://www.afro.who.int/countries/nigeria/news/states-adopt-integrated-vaccination-strategy-reach-unimmunized-children (Accessed on 19 February 2023). 2022.
- Burgert CR, Colston J, Roy T, Zachary B. Geographic displacement procedure and georeferenced data release policy for the Demographic and Health Surveys. DHS Spatial Analysis Reports No 7. Calverton, Maryland, USA: ICF International; 2013.
- Nilsen K, Tejedor-Garavito N, Leasure DR, Utazi CE, Ruktanonchai CW, Wigley AS, et al. A review of geospatial methods for population estimation and their use in constructing reproductive, maternal, newborn, child and adolescent health service indicators. BMC Health Services Research. 2021;21:370. [CrossRef]
- Leasure DR, Jochem WC, Weber EM, Tatem AJ. National population mapping from sparse survey data: A hierarchical Bayesian modeling framework to account for uncertainty. PNAS. 2020;117. [CrossRef]
Disclaimer/Publisher’s Note: The statements, opinions and data contained in all publications are solely those of the individual author(s) and contributor(s) and not of MDPI and/or the editor(s). MDPI and/or the editor(s) disclaim responsibility for any injury to people or property resulting from any ideas, methods, instructions or products referred to in the content. |
© 2023 by the authors. Licensee MDPI, Basel, Switzerland. This article is an open access article distributed under the terms and conditions of the Creative Commons Attribution (CC BY) license (http://creativecommons.org/licenses/by/4.0/).


