1. Introduction
Currently, a person's workload has significantly increased as a result of more work. There is a great likelihood that the person would get heart disease as a result of this terrible situation, which cannot be avoided [
1,
2,
3]. Heart diseases are brought on by a reduction in the amount of blood circulating to the brain, heart, lungs, and other vital organs. The most prevalent and least serious kind of cardiovascular illness is congestive heart failure. Blood is transported to the heart by blood veins in the human anatomy. Defective heart valves, which can cause heart failure, are one of the additional causes of heart disease. Anaesthesia may also be present together with upper abdominal muscle pain, which is a characteristic indication of heart illness. It is advised to reduce blood pressure, lower cholesterol, and exercise frequently to reduce the risk of heart disease. Angina pectoris, dilated cardiomyopathy, stroke, and congestive heart failure are among the conditions most closely associated with heart disease. As a result, it is important to keep an eye on indicators for cardiovascular disease and speak with medical professionals [
4,
5,
6].
Cardiovascular diseases stand as one of the most prevalent causes of global mortality, and their diagnosis and prediction have consistently posed substantial challenges due to their dynamic nature. Risk factors contributing to the elevated risk of heart disease encompass age, gender, smoking habits, family medical history, cholesterol levels, poor dietary choices, high blood pressure, obesity, physical inactivity, and alcohol consumption. Additionally, hereditary factors like high blood pressure and diabetes heighten the susceptibility to heart disease. Certain risk factors can be influenced by individual choices. In conjunction with the aforementioned risk factors, lifestyle decisions, such as dietary patterns, sedentary behavior, and obesity, are recognized as significant contributors [
7,
8,
9]. Heart conditions manifest in various forms, including myocarditis, angina pectoris, congestive heart failure, cardiomyopathy, congenital heart disease, and coronary heart disease. Manual calculations to assess the likelihood of heart disease based on these risk factors are intricate, necessitating the adoption of computer-assisted techniques for efficient and accurate evaluation [
10].
Machine learning is effective for a wide range of problems. Utilizing the values of independent variables to predict the value of a dependent variable is one use for this technique. Since the healthcare industry has huge data resources that are challenging to manage manually, it is an application area for data mining. Even in wealthy nations, heart disease has been found to be one of the leading causes of death. The hazards are either not recognized or are recognized until much later, which is one of the causes of fatalities from heart disease. Machine learning techniques, on the other hand, can be helpful in overcoming this issue and early risk prediction [
11].
In this study, we introduce an advanced method for detecting and predicting heart patients using ensemble learning, feature selection, and heuristic-metaheuristic optimization. The presented method has two stages. In the first stage, we utilize a combined heuristic-metaheuristic feature selection algorithm based on Pearson correlation coefficient (PCC) and grey wolf optimizer (GWO), called PCC-GWO, to increase the accuracy and performance of each machine learning model. In the second stage, a heterogeneous ensemble learning model is applied to generate the final outputs based on the aggregation of the opinion of the different base learners. As a result, the following significantly contributes to this evolved diagnosis model of heart disease:
Introducing an advanced ensemble heuristic-metaheuristic feature fusion learning (EHMFFL) algorithm as a robust model in predicting heart diseases.
Constructing a heterogeneous ensemble learning model for heart disease diagnosis comprising seven base learners: support vector machine (SVM), K-nearest neighbors (KNN), logistic regression (LR), random forest (RF), naive bayes (NB), decision tree (DT), and XGBoost.
Presenting a combined heuristic-metaheuristic algorithm (called PCC-GWO) to select an optimal feature subset for each machine learning model, separately. In the PCC-GWO model, at first, PCC is used to calculate an importance score for each feature. Then, these scores are used as heuristic knowledge to guide the search process of GWO for obtaining the best achievable feature subset.
In addition to typical performance metrics, we apply advanced statistical tools to evaluate the performance of the EHMFFL algorithm. These tools include the receiver operating characteristic (ROC) curve and correlation heat map (CHM), which allow us to statistically compare the system's accuracy and performance.
Successfully developing the EHMFFL algorithm in MATLAB R2022b for the heart disease prediction on Cleveland and Statlog datasets, respectively.
The rest of the paper is organized as follows. In the second section, we examine related works. The third section provides the details of the two datasets used in this paper. The proposed EHMFFL algorithm is introduced in the fourth section. The results are provided and assessed in the fifth section, and finally, concluding remarks are presented in the sixth section.
2. Literature Review
In this section, we delve into the realm of machine learning, ensemble learning, and deep learning techniques. Machine learning methods for classification are widely adopted across various industries, and researchers continually work on advancing their categorization capabilities. One such approach is ensemble learning, which can be either homogeneous or heterogeneous. Early techniques, such as bootstrap aggregating (bagging) [
12] and boosting [
13], exemplify the power of ensemble learning, often leading to improved classification performance when implemented. In addition to these, various strategies have been explored by researchers, including methods like majority voting, to effectively combine multiple classifiers or partitions for enhanced results.
2.1. Machine Learning Approaches
Miao et al. [
14] underscored the critical significance of early detection and diagnosis of coronary heart disease (CHD), a leading global cause of mortality. To facilitate the training and evaluation of diverse deep neural network (DNN) architectures including convolutional neural networks and recurrent neural networks, they curated a comprehensive dataset comprising 303 patients and 14 clinical attributes, encompassing factors like age, gender, and cholesterol levels. Their results demonstrated that the proposed DNN models outperformed established methods like logistic regression and decision trees, showcasing high accuracy in CHD detection. Furthermore, a feature importance analysis revealed that age, maximum heart rate, and ST segment depression were the three most critical variables for predicting CHD.
Vijayashree et al. [
15] introduced a machine learning framework designed for feature selection in heart disease classification, leveraging an enhanced particle swarm optimization (PSO) algorithm in conjunction with a SVM classifier. The innovative PSO algorithm, crafted with a unique blend of a hybrid mutation operator, velocity clamping, and adaptive inertia weight, aimed to overcome the limitations of conventional PSO methods. Evaluating the framework using the Cleveland heart disease dataset, the results showcased its superiority over alternative feature selection techniques. Notably, the framework exhibited a high degree of accuracy in classifying heart disease, underscoring its potential for improving the accuracy and effectiveness of heart disease diagnosis.
Waigi et al. [
16] presented a study focused on predicting the risk of heart disease by employing advanced machine learning techniques. The research explores innovative approaches to risk assessment in cardiovascular health, utilizing a diverse range of machine learning algorithms. By leveraging extensive data and applying advanced analytics, the study aims to enhance the accuracy and effectiveness of heart disease risk prediction. This work contributes to the field of cardiovascular medicine and underscores the potential of machine learning in improving heart disease risk assessment and patient care.
Tuli et al. [
17] presented HealthFog, a smart healthcare system that used ensemble deep learning techniques for the autonomous diagnosis of cardiac illnesses in an integrated Internet of Things (IoT) and fog computing environment. The system was able to effectively diagnose heart illnesses by processing real-time data from numerous sensors and devices, including blood pressure monitors and electrocardiogram (ECG) devices. The HealthFog system's patient monitoring module, data preprocessing module, feature extraction and selection module, and classification module were all covered in the authors' full architecture presentation. The findings demonstrated that the HealthFog system performed better than other current systems in terms of precision and timeliness.
Jindal et al. [
18] focused on heart disease prediction through the application of numerous algorithms including KNN, LR, and RF. Their research explores the utilization of these algorithms to enhance the accuracy of heart disease risk assessment and prediction. By leveraging advanced data analytics and machine learning techniques, the study aims to contribute to the field of cardiovascular medicine and improve the effectiveness of heart disease prediction, potentially leading to better patient care.
Sarra et al. [
19] reported a study that used machine learning and statistical analysis to increase the precision of heart disease prediction. They chose the most important candidate features from a list of candidate features using the two statistical models. On the basis of the chosen features, they then applied Support Vector Machine to create prediction models. According to the findings, the 2 statistical model and SVM combination had the highest level of success in predicting heart disease.
Aliyar Vellameeran et al. [
20] introduced a new type of deep belief network (DBN) for diagnosing heart disease utilizing IoT wearable medical devices that was supported with optimal feature selection. The main objective of the study was to train the DBN model by analyzing and selecting the most important features from a big dataset. The proposed method was evaluated using actual data gathered from wearable medical devices connected to the Internet of Things, and it has shown promising results in correctly identifying heart disease.
2.2. Ensemble Learning Approaches
In the case of ensemble learning models, Latha et al. [
21] examined the effectiveness of several machine learning techniques, including support vector machines, decision trees, and random forests. They contrasted the distinct methods with an ensemble method that brought together these models. The results showed that the ensemble method outperformed the individual algorithms in terms of prediction accuracy, sensitivity, and specificity. The study also emphasized the importance of feature selection in raising the model's accuracy.
Ali et al. [
22] have innovated a smart healthcare monitoring system designed to integrate multiple clinical data sources for accurate heart disease prediction. This system employs a combination of deep learning models, outperforming traditional methods in accuracy. A standout feature of this system is its real-time patient data monitoring capability, facilitating timely intervention and heart disease prevention. By incorporating ECG readings, blood pressure, body temperature, and other pertinent clinical factors, the system provides precise cardiac illness prognosis.
Shorewala et al. [
23] delved into the realm of coronary heart disease early detection, with a specific focus on harnessing the potential of ensemble methods. They pinpointed the most effective approach for early disease detection by rigorously analyzing a spectrum of models and algorithms, including DT, RF, SVM, KNN, and artificial neural networks. The results underscored the superiority of ensemble approaches, which seamlessly integrated multiple algorithms, yielding the highest accuracy in disease prediction. This research highlights the significance of ensemble techniques in enhancing early detection capabilities for coronary heart disease.
Ghasemi Darehnaei et al. [
24] introduced an approach known as Swarm Intelligence Ensemble Deep Transfer Learning (SI-EDTL), designed for the task of multiple vehicle detection in images captured by Unmanned Aerial Vehicles (UAVs). This method combines the power of swarm intelligence algorithms and deep transfer learning to enhance the accuracy of vehicle detection in UAV imagery. The research demonstrated the effectiveness of SI-EDTL, offering a solution for the challenging task of detecting multiple vehicles in aerial images, which has significant applications in fields such as surveillance and autonomous navigation.
Shokouhifar et al. [
25] have presented a novel approach for accurately measuring arm volume in patients with lymphedema. This method utilized a three-stage ensemble deep learning framework empowered by swarm intelligence techniques. By combining the power of deep learning and swarm intelligence, the research aimed to enhance the precision of arm volume measurement, which is crucial in the diagnosis and management of lymphedema. The proposed model demonstrated promising results, showcasing its potential to improve healthcare outcomes for individuals with lymphedema by providing more accurate and reliable measurements of arm volume.
2.3. Feature Selection Algorithms
There are also various feature selection techniques applied for the enhancement of prediction accuracy in heart diseases. For example, Nagarajan et al. [
26] introduces a feature selection and classification model tailored for the prediction of heart disease. The research explores advanced techniques for selecting relevant features and enhancing the accuracy of heart disease prediction. Their results showed that this technique can efficiently improve the effectiveness of early detection and risk assessment for heart disease, potentially benefiting both patients and healthcare providers.
Al-Yarimi et al. [
27] presented a heart disease prediction model using supervised learning techniques. The focus of their study was on feature optimization, where they employ discrete weights to enhance the accuracy of heart disease prediction models. By selecting and assigning weights to relevant features, the research aims to improve the efficiency and precision of predictive models in diagnosing heart disease.
Ahmad et al. [
28] conducted a comparative investigation on the optimal medical diagnosis of human heart disease using machine learning techniques. They specifically examined the impact of sequential feature selection, comparing its inclusion with conventional machine learning approaches that do not employ this feature selection method. The research aimed to enhance the efficiency and accuracy of heart disease diagnosis through the identification of the most relevant features. They provided some insights into the utility of sequential feature selection in improving the performance of machine learning-based heart disease diagnostic models.
Pathan et al. [
29] proposed an analysis to assess the influence of feature selection on the accuracy of heart disease prediction. The study specifically focused on understanding how different feature selection techniques could enhance or affect the accuracy of predictive models for heart disease. By investigating the impact of feature selection, the research aimed to optimize the heart disease prediction model.
Zhang et al. [
30] developed a heart disease prediction model that combines feature selection methods with deep neural networks. The research focused on optimizing the feature selection process to enhance the accuracy of heart disease prediction. By utilizing deep neural networks, they achieved more efficient results for diagnosing heart disease, resulted in development of a diagnostic tools for heart disease diagnosis.
2.4. Our Contributions Compared with Literature
This paper addresses a significant gap in the existing literature by introducing an innovative EHMFFL algorithm for heart disease diagnosis. While previous studies have often focused on individual techniques such as machine learning, ensemble learning, or feature selection in isolation, our approach stands out by seamlessly integrating all of these methods into a comprehensive framework. The EHMFFL algorithm not only leverages a diverse ensemble of base learners, including SVM, KNN, LR, RF, NB, DT, and XGBoost, but it also combines the advantages of heuristic-metaheuristic approaches for the selection of effective features for each base learner within the ensemble learning model. This integration of PCC as a heuristic knowledge source with the metaheuristic-driven GWO sets our PCC-GWO feature selection algorithm apart. The proposed method has the potential to significantly advance the field of heart disease diagnosis by capitalizing on the strengths of each technique and offering a more accurate and reliable solution by combining different innovative techniques.
3. Data Gathering
In our analysis, we utilize two well-established datasets on cardiac illnesses sourced from the University of California at Irvine machine-learning repository, specifically the Cleveland and Statlog datasets [
31,
32].
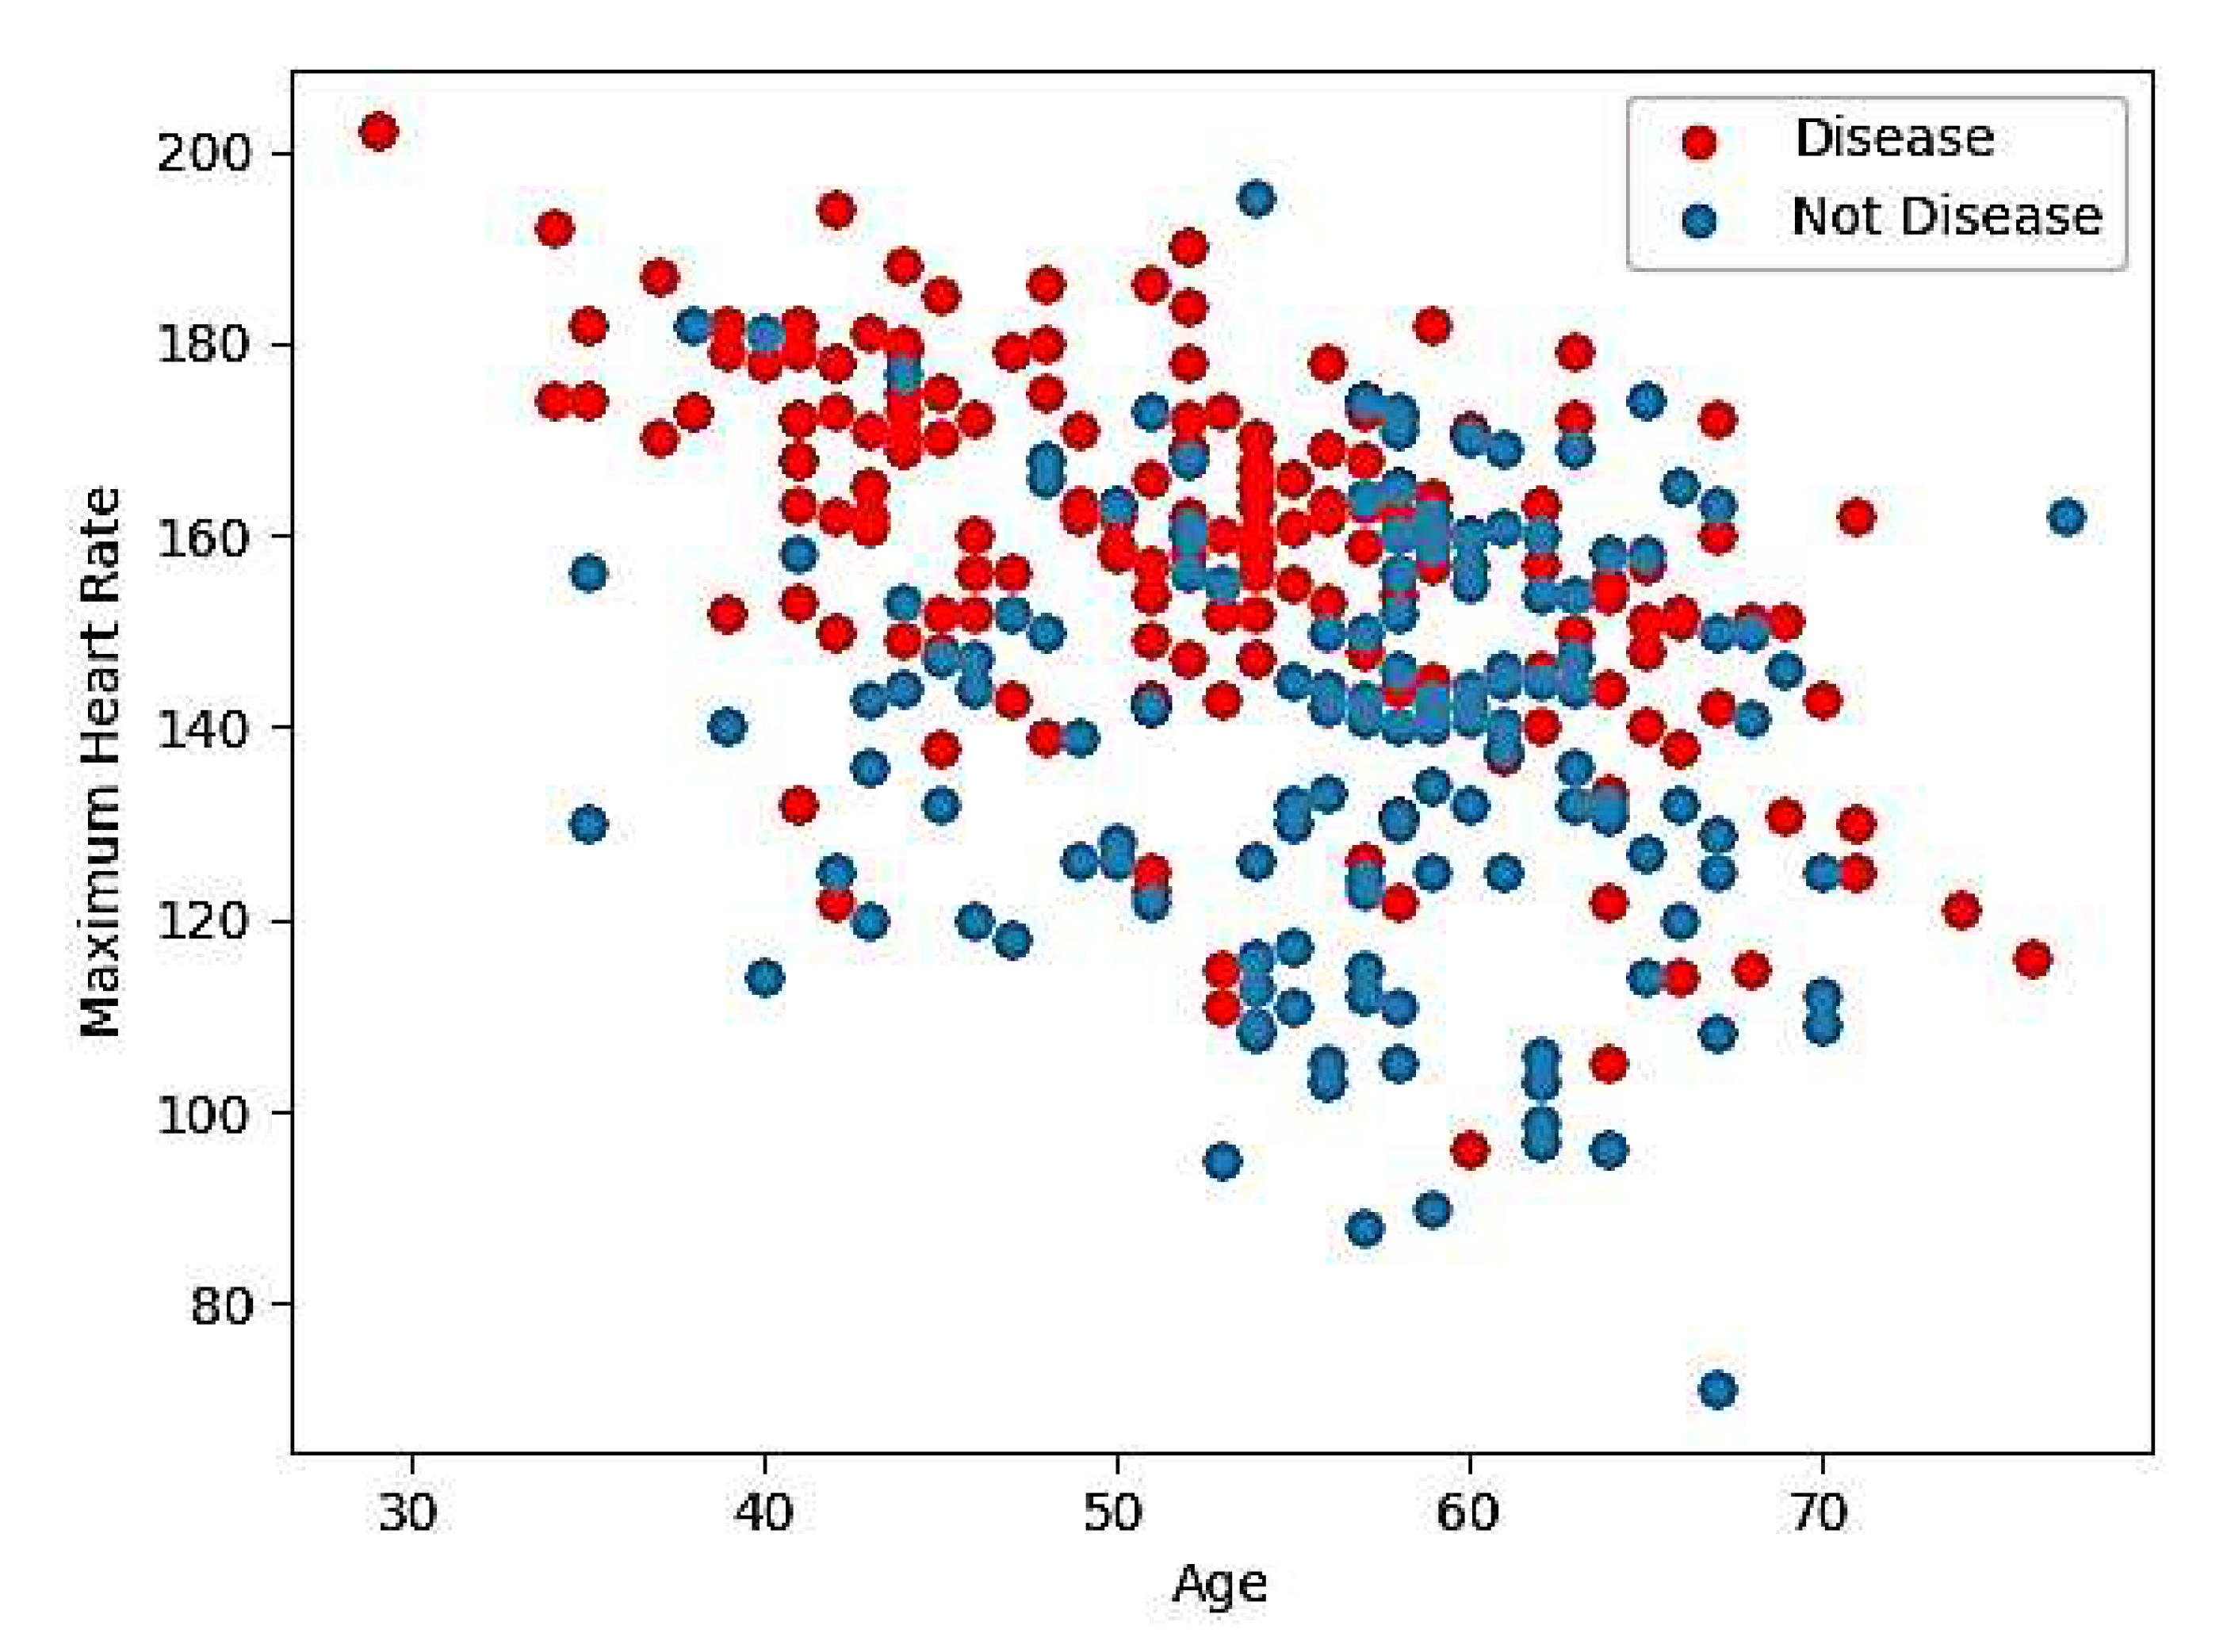
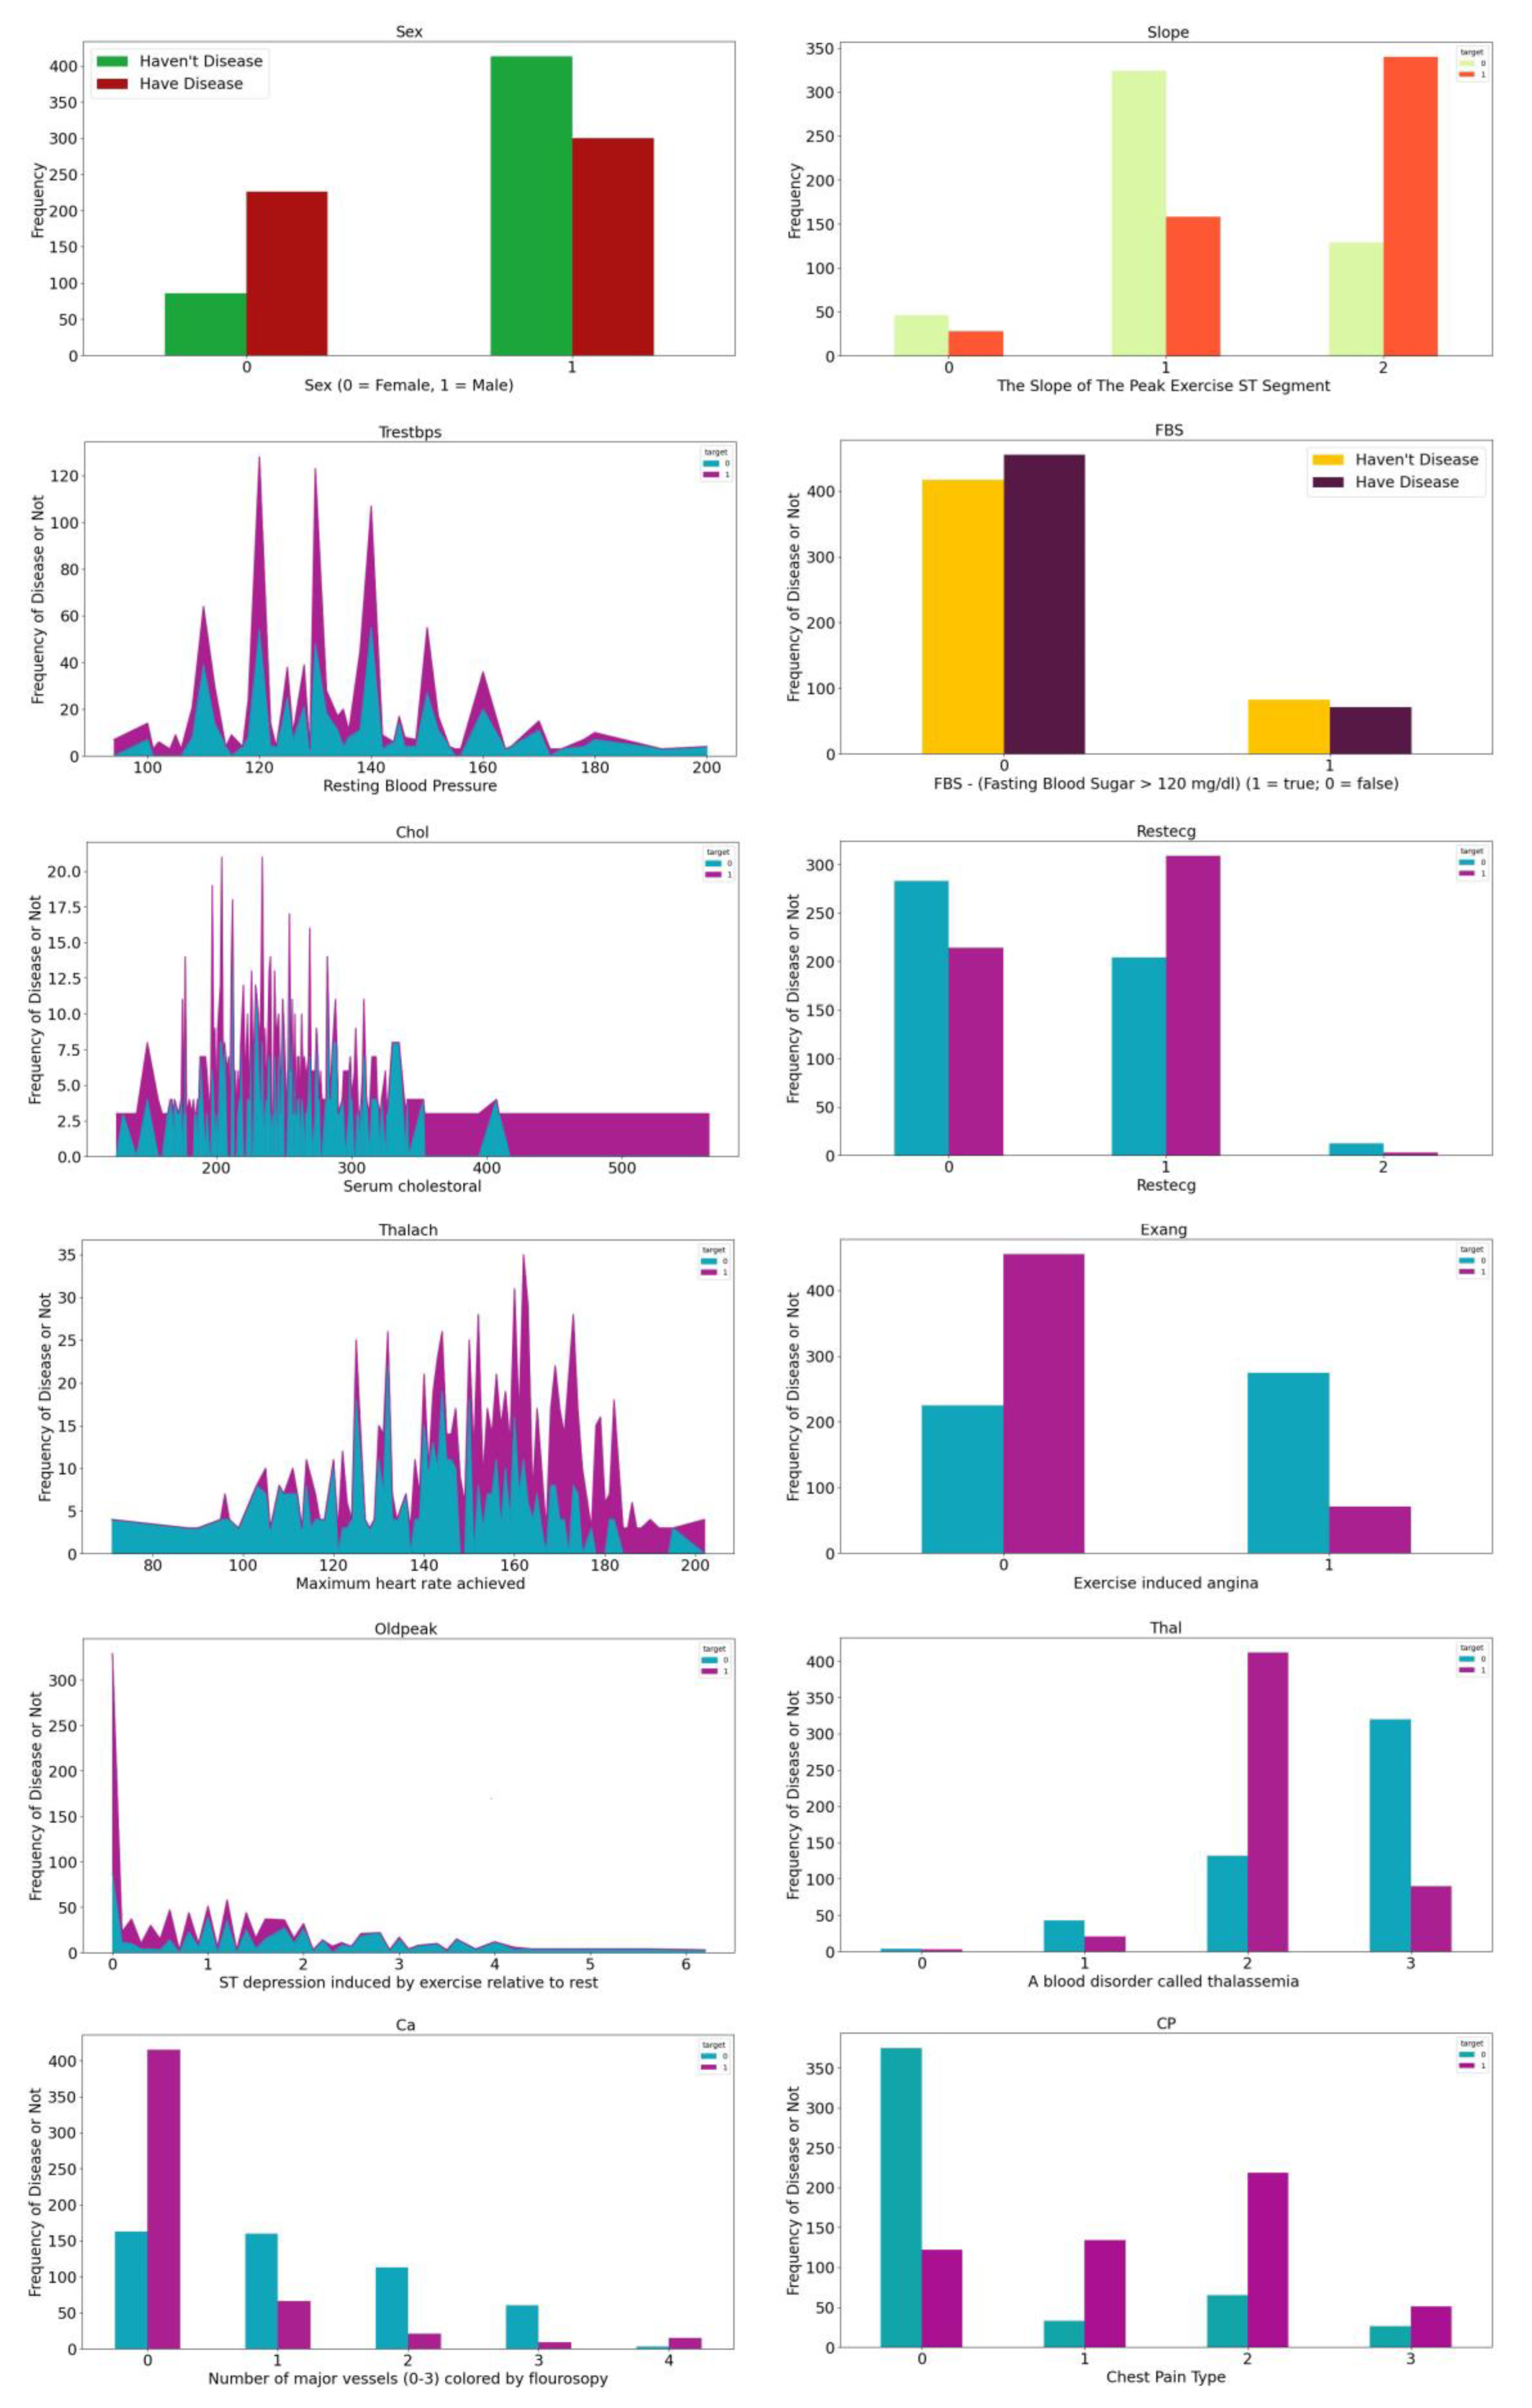
Table 1 details the attributes common to both datasets, with the final attribute serving as an indicator of a person's heart disease status. To gain deeper insights into the feature distribution, we present
Figure 1 and
Figure 2, which illustrate the relationship between maximum heart rate and age, as well as the distribution of the remaining 12 features, respectively.
The Cleveland dataset comprises medical records from individuals who underwent heart disease evaluations at the Cleveland Clinic Foundation in the late 1980s, containing 303 instances, each representing a patient, and encompassing 13 features including critical factors like age, gender, blood pressure, cholesterol levels, chest pain presence, and results from various medical tests. This dataset has played a pivotal role in the development and testing of machine learning algorithms aimed at predicting cardiac disease.
The Statlog dataset, part of a dataset collection, consists of 270 instances (patients) with 13 attributes, including age, gender, blood pressure, cholesterol, fasting blood sugar, and various electrocardiography (ECG) and exercise stress test readings. Originally sourced from the Cleveland Clinic Foundation, this dataset has been widely employed in studies related to machine learning algorithms for medical diagnosis. The primary objective is to enable physicians to make more informed treatment decisions by accurately identifying patients based on their feature values.
4. Proposed EHMFFL Algorithm
The proposed EHMFFL algorithm represents a heterogeneous ensemble learning framework, featuring seven base learners including SVM, KNN, LR, RF, NB, DT, and XGBoost. To optimize the performance of each machine learning model, a combined heuristic-metaheuristic algorithm known as PCC-GWO is performed on each base learner, separately. Initially, the PCC method is employed to calculate feature importance scores, serving as critical heuristic knowledge for guiding the GWO in selecting the most effective features for the heart disease diagnosis. Subsequently, the tuned machine learning models (SVM, KNN, LR, RF, NB, DT, and XGBoost) are employed to create the final ensemble learning model. The subsequent sections provide a detailed account of the feature selection process using the PCC-GWO algorithm and the comprehensive classification process with the tuned EHMFFL model.
4.1. Feature Selection using PCC-GWO
Feature selection is a crucial step in machine learning, particularly when dealing with datasets with a high dimensionality. Its primary objective is to streamline the dataset by reducing its dimensionality, thereby identifying the most relevant features that contribute significantly to predictive accuracy, while discarding irrelevant or noisy attributes. This process not only enhances computational efficiency but also minimizes redundancy among the selected features. Feature selection is essential in various domains, including text categorization, data mining, pattern recognition, and signal processing [
33], where it aids in improving model performance by focusing on the most informative attributes and discarding superfluous ones.
Feature selection poses a challenging problem, acknowledged as non-deterministic polynomial hard (NP-hard) [
34], making exact (exhaustive) search methods impractical due to their computational complexity and time requirements. Therefore, heuristic and metaheuristic algorithms become essential in this context [
35]. When crafting a metaheuristic algorithm for an NP-hard problem, a delicate balance between exploration and exploitation must be maintained [
36,
37,
38]. Achieving this balance is crucial to optimize search algorithms [
39]. The GWO is recognized in the literature for its adeptness in striking the right equilibrium between exploration and exploitation [
25]. Simultaneously, the PCC stands out as a swift heuristic method for identifying and eliminating highly correlated features [
40]. Hence, we have chosen to employ PCC and GWO as the heuristic and metaheuristic components of our integrated PCC-GWO feature selection algorithm. This strategy aims to harness the advantages of both methods concurrently, combining the speed of heuristic-based PCC with the precision of metaheuristic-driven GWO to enhance the feature selection process.
The provided Algorithm 1 outlines the PCC-GWO feature selection approach, offering a hybrid method for selecting an optimal feature subset for each base learner within the ensemble learning model. Initially, the algorithm employs the PCC method to compute an importance score for each feature. Subsequently, these scores serve as heuristic knowledge to guide the GWO during the search process. To achieve this, the importance scores are normalized within the range of [0, 1], and a Roulette Wheel Selection method is utilized to choose features for each grey wolf within the initial population generation procedure. The subsequent sections delve into the specifics of the PCC-GWO algorithm, encompassing both the PCC and GWO phases, facilitating a comprehensive understanding of the feature selection process.
|
Algorithm 1. Feature Selection using PCC-GWO algorithm. |
| Input: |
| Full heart disease dataset |
| Output: |
| Optimal Feature Subset for Machine Learning Model |
| Heuristic Feature Selection: Calculation of Importance Scores using PCC: |
- 1.
For (i =1 : Number of Features) |
- 2.
Calculation of the correlation of feature i with the class: CCi
|
- 3.
Calculation of the correlation of feature i in relation to the other features: CFi
|
- 4.
Calculation of the PCC importance score of feature i: ISi=CCi/CFi
|
- 5.
End For |
| Metaheuristic Feature Selection: Final Feature Subset Selection using GWO: |
- 1.
t = 0 % Initial Population
|
- 2.
For (s = 1 : PopSize) - 3.
for (i = 1 : Number of Features) |
- 4.
Calculation of the probability of feature i in solution s using Equation (3) |
- 5.
Deciding to select or decline feature i using Roulette Wheel Selection - 6.
end for
- 7.
Calculation of the fitness of each grey wolf s using Equation (4) - 8.
End For - 9.
Considering the best solution as alpha wolf: Xα
- 10.
Considering the second best solution as beta wolf: Xβ
- 11.
Considering the third best solution as delta wolf: Xδ
- 12.
For (t = 1 : MaxIter)
% Population Updating
- 13.
for each grey wolf s
- 14.
Updating a, Ai, and Ci, rAi, and rCi. - 15.
Calculation of updating factor towards alpha grey wolf using Equation (13) - 16.
Calculation of updating factor towards beta grey wolf using Equation (14) - 17.
Calculation of updating factor towards delta grey wolf using Equation (15)
|
- 18.
if (|Ai| ≥ 1) |
- 19.
Updating the wolf s using search for prey by Equation (16) - 20.
elseif (|Ai| < 1) |
- 21.
Updating the wolf s using attacking prey by Equation (16) - 22.
end if
|
- 23.
end for
% Fitness Evaluation
- 24.
for (s = 1 : PopSize) - 25.
Calculation of the fitness of each grey wolf s using Equation (4) - 26.
End for
- 27.
Updating the best solution as alpha wolf: Xα
- 28.
Updating the second best solution as beta wolf: Xβ
- 29.
Updating the third best solution as delta wolf: Xδ
- 30.
End For
Return Xα as the optimized feature subset
|
4.1.1. Calculating Importance Score of Features using PCC
PCC is a measure of the degree and direction of a relationship between two variables [
41]. The PCC values vary from -1 to +1. A value of zero shows that there is no correlation between the two variables, while values near -1 or +1 suggest that there is a strong association between the two variables. The PCC is determined by:
where
and
are the means of the two variables
x and
y, respectively.
xi denotes the
i-th value of the variable
x, and
yi denotes the
i-th value of the variable
y.
By computing the correlation coefficient between each feature and the target variable, the method identifies the most informative features for an accurate classification. Then, by considering the correlation of each feature with respect to all other features in the dataset, the method identifies redundant or highly correlated features that may not provide much additional information. The selection status of each feature is then determined based on a threshold value derived from its correlation coefficients. Finally, the GWO algorithm is used to repeat the selection process multiple times, and the feature subset with the highest fitness value is selected as the final solution. This method provides an effective way to identify and select the most valuable features in high-dimensional datasets, leading to improved predictive accuracy and better performance of machine learning models. The overall operation of PCC can be summarized as follows:
- 1)
The correlation coefficient of each feature i with the class is computed as CCi.
- 2)
The correlation coefficient of each feature i in relation to the other features is calculated as CFi.
- 3)
The importance score of each feature i can be calculated as ISi=CCi/CFi.
In PCC, if the value of ISi is greater than a specific threshold TH (ISi>TH), the feature i is selected; otherwise, it is not chosen. However, in the proposed combined PCC-GWO algorithm, the importance scores obtained by PCC are used to guide the search process of GWO for achieving a better convergence.
4.1.2. Feature Subset Selection using GWO
GWO was originally introduced by Mirjalili et al. [
42]. It is based on the hunting behavior and social order of grey wolves found in nature. The social hierarchy of grey wolves is described by four types of wolves, which are the following:
- Alpha
(α): the finest solution
- Alpha
Beta (β): the second best solution
- Alpha
Delta (δ): the third best solutions
- Alpha
Omega (ω): the rest of grey wolves
Similar to other metaheuristic algorithms, the GWO initiates its search procedure by creating an initial population of viable solutions. Subsequently, it undergoes iterative phases, comprising fitness assessment and population adaptation, until it fulfills a predefined stopping condition, such as reaching a specific number of iterations.
Representation of Feasible Solutions: Encoding of a feasible solution
X (i.e., a grey wolf) is depicted in
Figure 3. If the quantity of
i-th variable is equal to 1, the feature
i selected by the grey wolf; otherwise, it is not picked. Consequently, a value of 1 is used to represent the feature subset's scope which is expressed as follows:
Initial Population Generation: As mentioned above, the original GWO algorithm starts its search process by a random population of grey wolves. However, in the proposed combined PCC-GWO algorithm, the importance scores of features obtained by PCC are utilized to generate a set of near-optimal initial solutions for GWO. To achieve this purpose, at first the normalized importance score for each feature
i is calculated, and then, the probability of feature
i to be selected in each solution (grey wolf)
s can be expressed using Roulette Wheel Selection method as follows:
Fitness Evaluation: The original dataset is separated into train and test datasets. The train dataset is considered for the optimization procedure via GWO by means of K-Fold Cross Validation. However, the test dataset is subjected to be unseen for final evaluation of the generalizability of the trained model. The following is the fitness function of GWO to assign the quality of each solution, aims to be maximized:
where
accuracy is the total accuracy of the base learner on the validation dataset, and
μ is a parameter (0<
μ<1) that determines the relative importance of accuracy and the number of selected features on the fitness value. The higher
μ, the higher impact of
accuracy on the fitness value. We consider
μ=0.99 to ensure achieving high-accuracy solutions, while minimization of the number of features is in the second rank.
Population Updating: At every iteration of GWO, after fitness evaluation of all wolves, the first three best wolves,
α,
β, and
δ, are in charge of the optimizer's leading hunting process, while
ω simply obeys and follows them. Encircling, hunting, and attacking are the three well-organized steps that GWO does during the optimization process. The following equations were used to determine the encircling process:
where
t indicates the number of iterations,
X represents the location vector of the wolf,
Xp represents the location vector of the prey. Moreover,
A and
C represent the vector coefficients expressed as follows:
where [0,1] is a random range for the vectors
r1 and
r2, and the elements within the vector
a start at 2 and fall linearly to 0 during the execution of the algorithm as follows:
where MaxIter denotes the maximum number of iterations.
GWO keeps the top three solutions (
α,
β, and
δ) obtained so far and compels ω to modify their placements in order to follow them. As a result, a series of equations that run for each search candidate is used to simulate the GWO hunting process. To achieve this, at first, the parameters of
D for alpha, beta, and delta wolves are expressed as follows:
Then, the moving vectors of the grey wolf
X towards the alpha, beta, and delta wolves can be calculated as Equations (12) – (14), respectively. Finally, the movement of the grey wolf
X is obtained through the aggregation of the three moving vectors according to Equation (15).
4.2. Ensemble Learning Model
Ensemble learning is a technique for improving the performance of a classifier. It is an efficient classification strategy that combines a weak classifier with a strong classifier to improve the effectiveness of the weak learner [
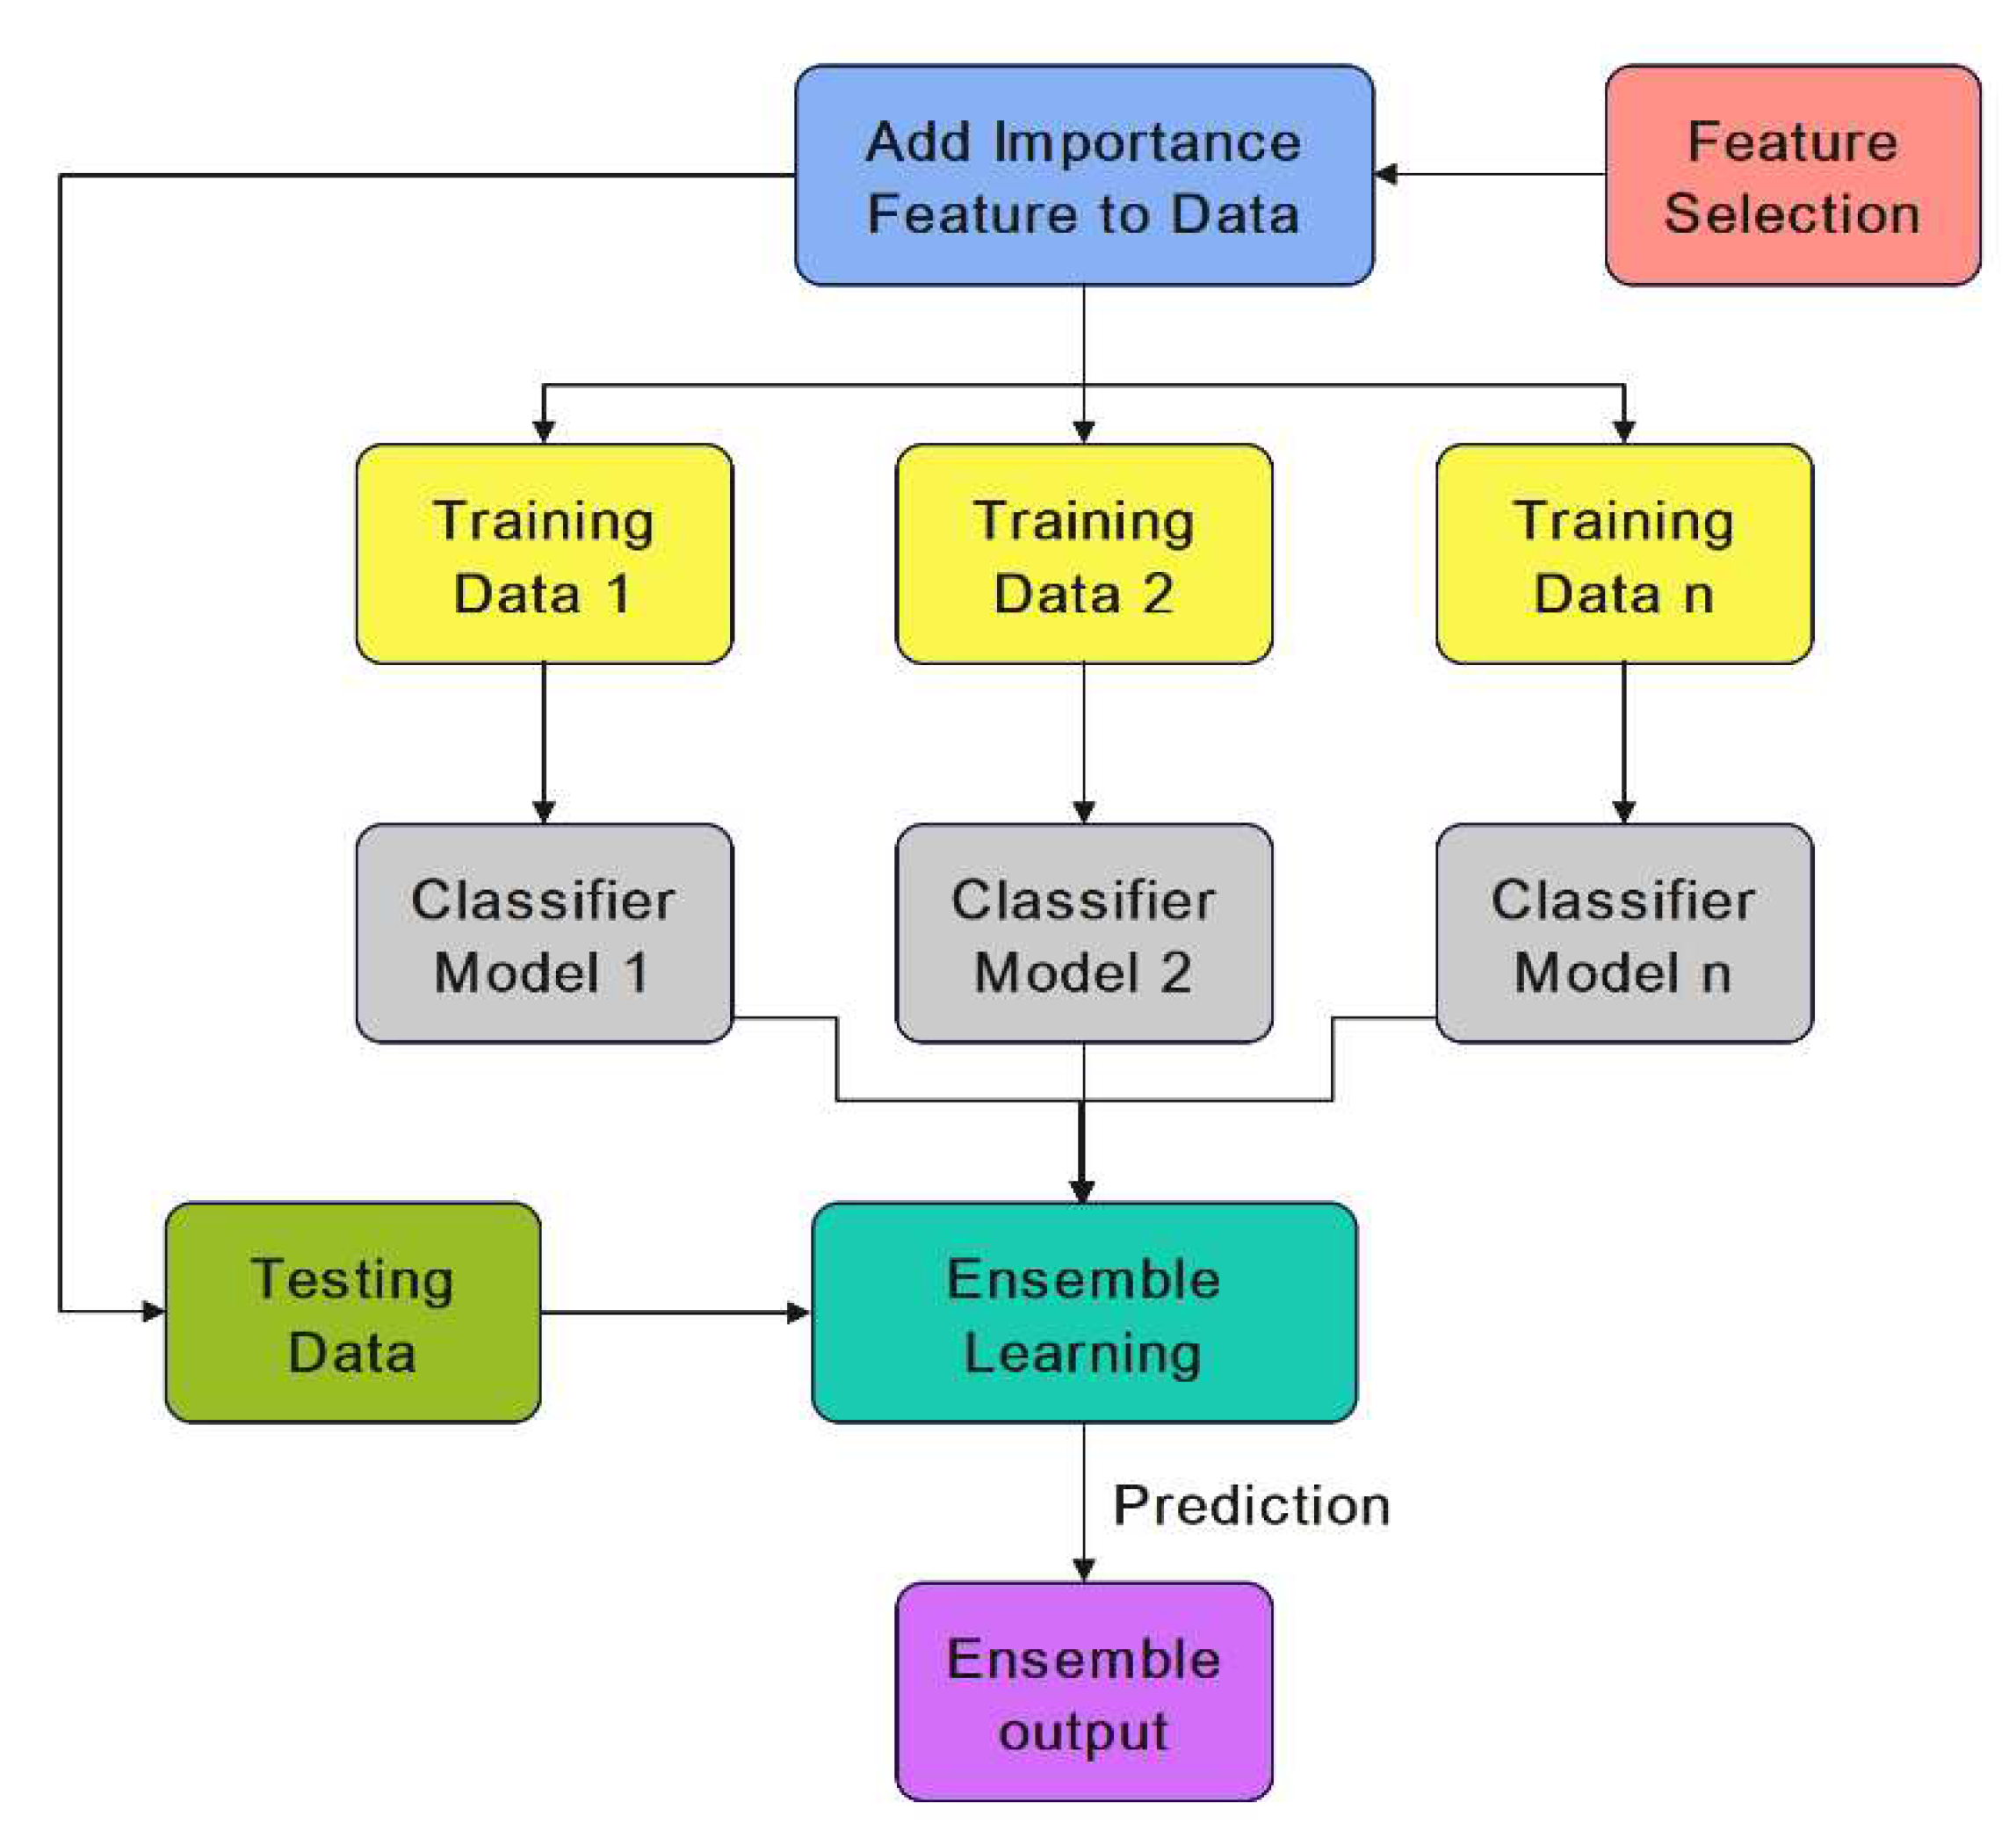
43]. The proposed EHMFFL algorithm utilizes the ensemble technique to improve the accuracy of SVM, KNN, LR, RF, NB, DT, and XGBoost base learners for diagnosing heart disease. When compared to a single classification, the goal of integrating numerous learning models is to get better performance with more robustness.
Figure 4 illustrates how the ensemble learning is used to improve heart disease diagnosis using these seven base learners.
Finally, using a weighted averaging method, we predict heart disease in each dataset. The weights of the different base learners are adjusted so that each learner with a higher accuracy has a higher weight in the ensemble learning model. The algorithm involves separately predicting each class and then using a weighted function to combine the outcomes. In contrast to hard voting with equal chance for each base learner, each prediction receives a weight, and the final results are combined by computing the weighted average. More specifically, the weight of base learner b is proportional to its normalized accuracy on the validation dataset against all base learners withing the ensemble model.
5. Evaluation and Findings
This section offers a comprehensive view of the performance metrics and results obtained in our study. All simulations were meticulously conducted on a PC, featuring an Intel i7 CPU with 2.6 GHz and 16 GB of RAM, and executed on MATLAB R2022b within the Windows 10 environment.
Table 2 provides a snapshot of the parameter set applied to the GWO algorithm, facilitating a clearer understanding of the experimental setup. In the following, we evaluate the performance of the proposed EHMFFL algorithm against its seven base learners as well as the state-of-the-art techniques.
5.1. Performance Metrics
In this paper, each dataset was splitted into 80% and 20% to train and test datasets. The train dataset (using K-Fold Cross Validation with K=10) was applied to optimize the model, while the test dataset was used to assess the generalizability of the tuned model on new unseen data samples. Considering True Positive (TP), True Negative (TN), False positive (FP), and False Negative (FN), we utilized different performance measures to evaluate the performance of the different techniques:
True Positive (TP): the number of correctly identified positive instances inside the desired class.
True Negative (TN): the number of correctly identified negative instances outside the desired class.
False Positive (FP): the number of incorrectly predicted positive samples when the actual target was negative.
False Negative (FN): the number of incorrectly predicted negative samples when the actual target was positive.
Accuracy: It is the proportion of occurrences correctly classified by the classification learner means the proportion of correctly predicted samples to the total number of examples, which can be calculated as follow:
Precision: It is one of the performance indicators that will be used to determine how many correct positive forecasts were made. So, precision measures the minority class's accuracy; then, the ratio of correctly predicted positive instances divided by the total number of positive cases predicted is utilized to compute it using:
Recall: It is a measurement that quantifies the proportion of actual positive predictions correctly identified out of all potential positive predictions. Unlike precision, which considers the correctly predicted positives relative to all positive predictions, recall focuses on the positives that were overlooked. Essentially, in this approach, recall signifies the extent to which the positive class is comprehensively captured, which is calculated as follows:
F1-score: In an ideal classifier, we aim for both accuracy and recall to be maximized, equating to values of one. This optimal scenario indicates that both FP and FN are reduced to zero, highlighting the classifier's ability to make accurate and comprehensive predictions, ultimately minimizing errors in both positive and negative classifications. As a result, we need a statistic that takes precision and recall into account. The F1-score is a precision and recall-based measure that is defined as follows:
Specificity: It is the proportion of true negative samples to all actual negative samples, which indicates the ratio of projected presence to total samples with heart disease presence. The specificity is expressed as follows:
5.2. Experimental Findings
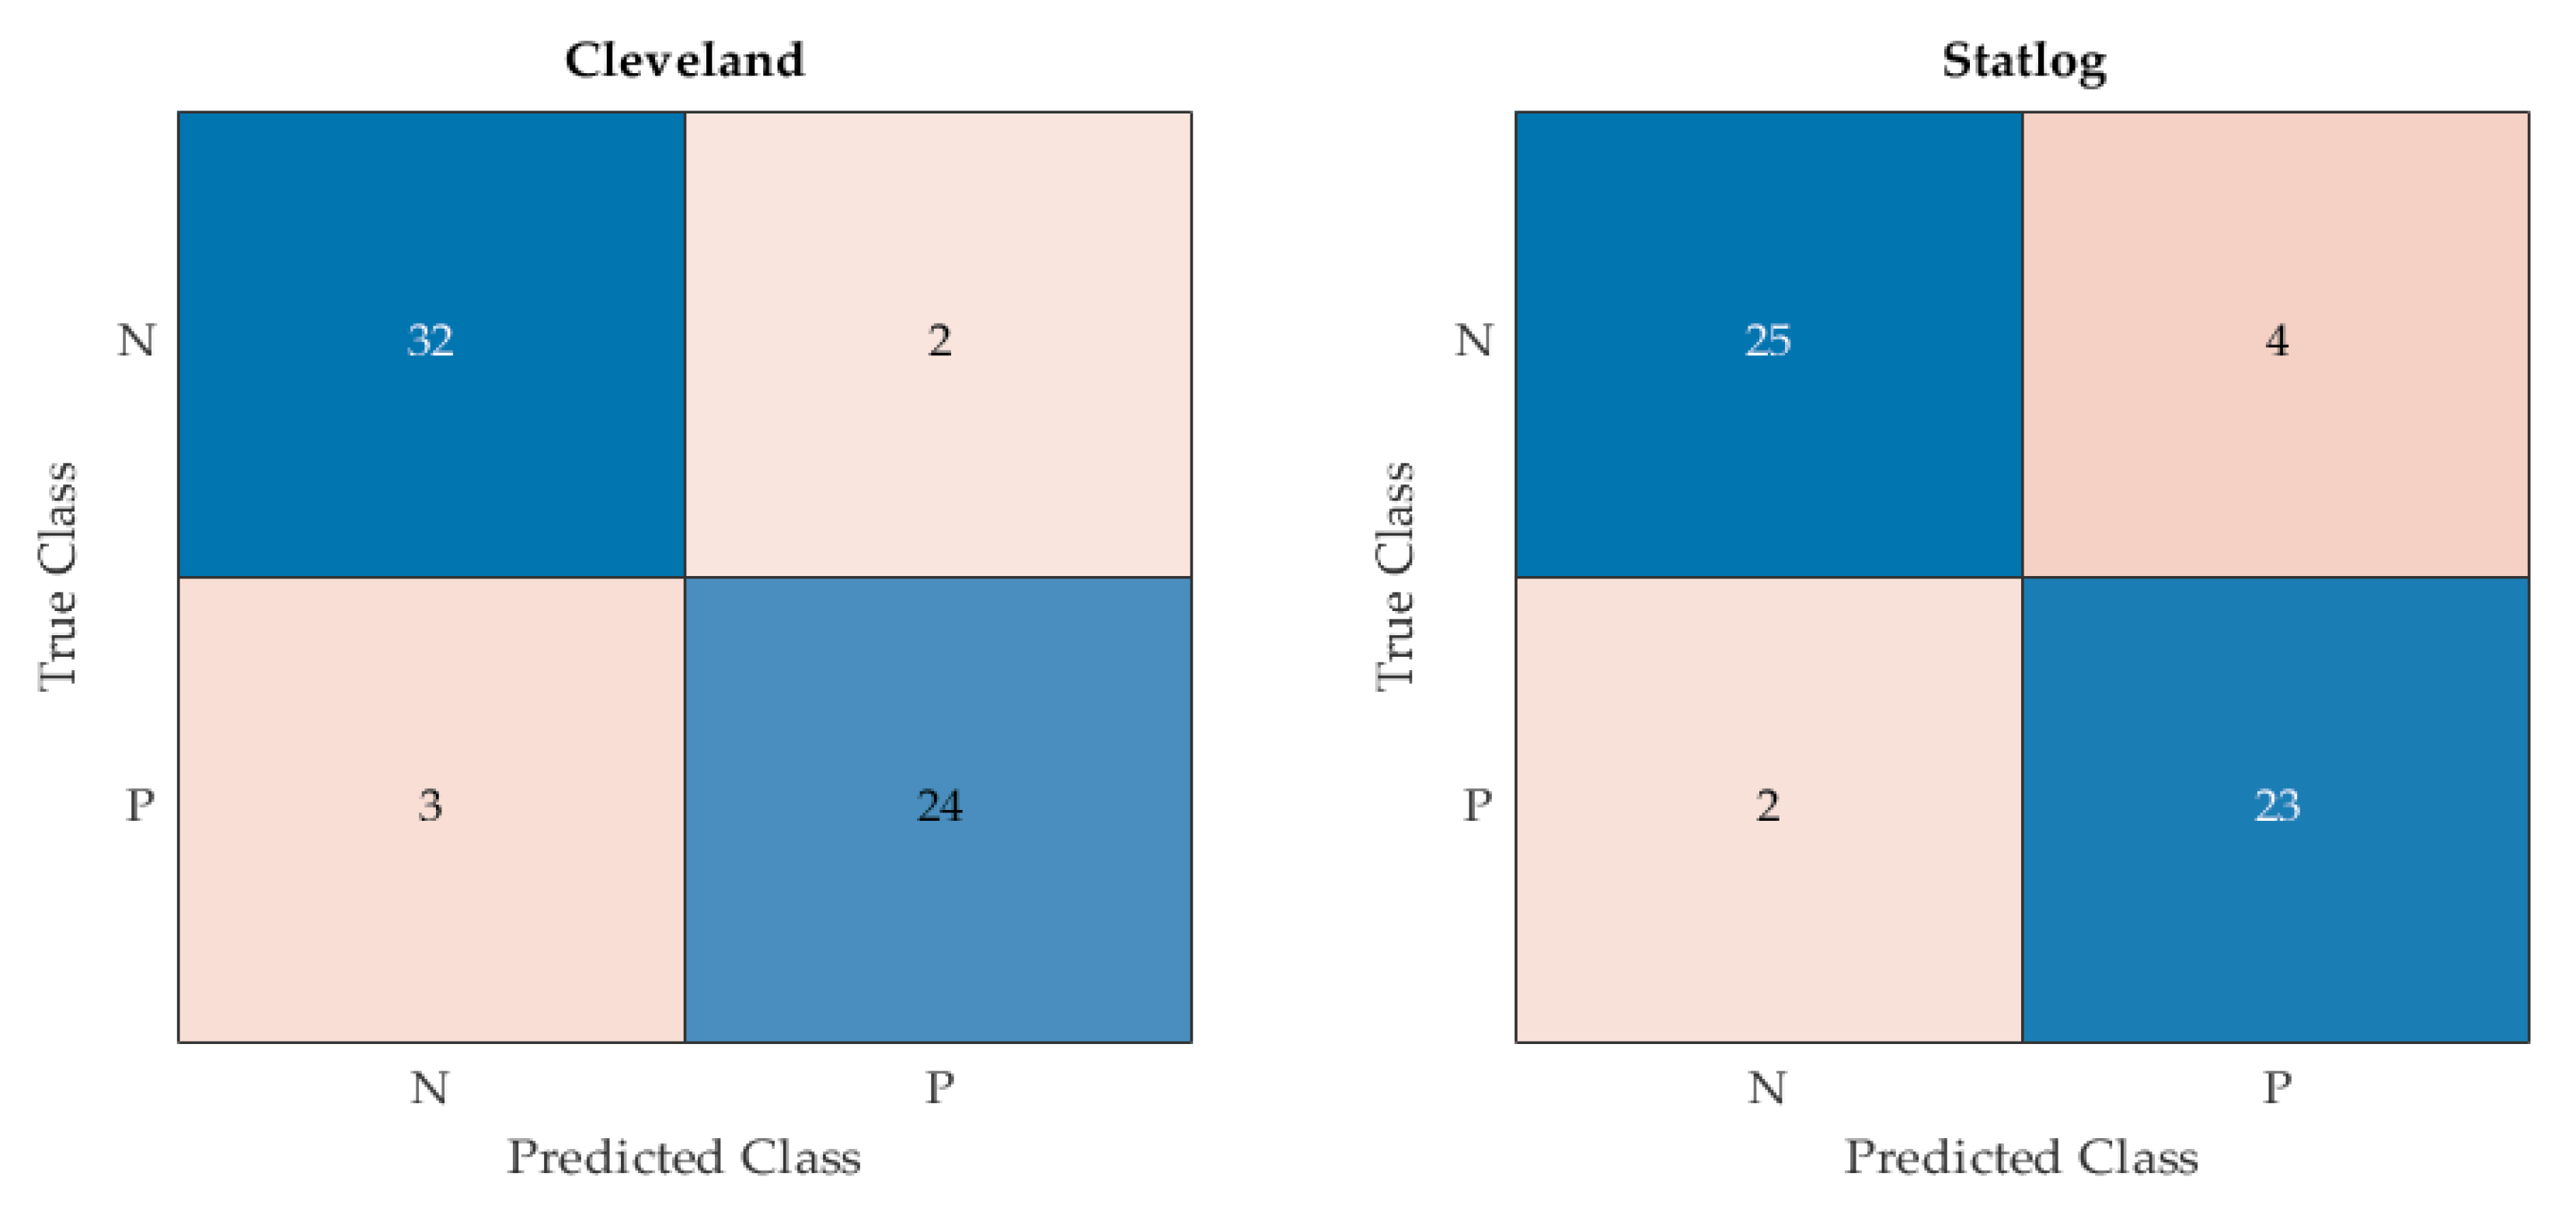
As mentioned above, 80% of each dataset has been used for the training of the proposed model, while the remaining 20% of data samples were kept unseen for the validation of the tuned model. More specifically, 61 and 54 data samples are used to test the proposed model and compare it with the other techniques on Cleveland and Statlog datasets, respectively. The obtained confusion matrix by the proposed EHMFFL algorithm on both datasets can be seen in
Figure 5.
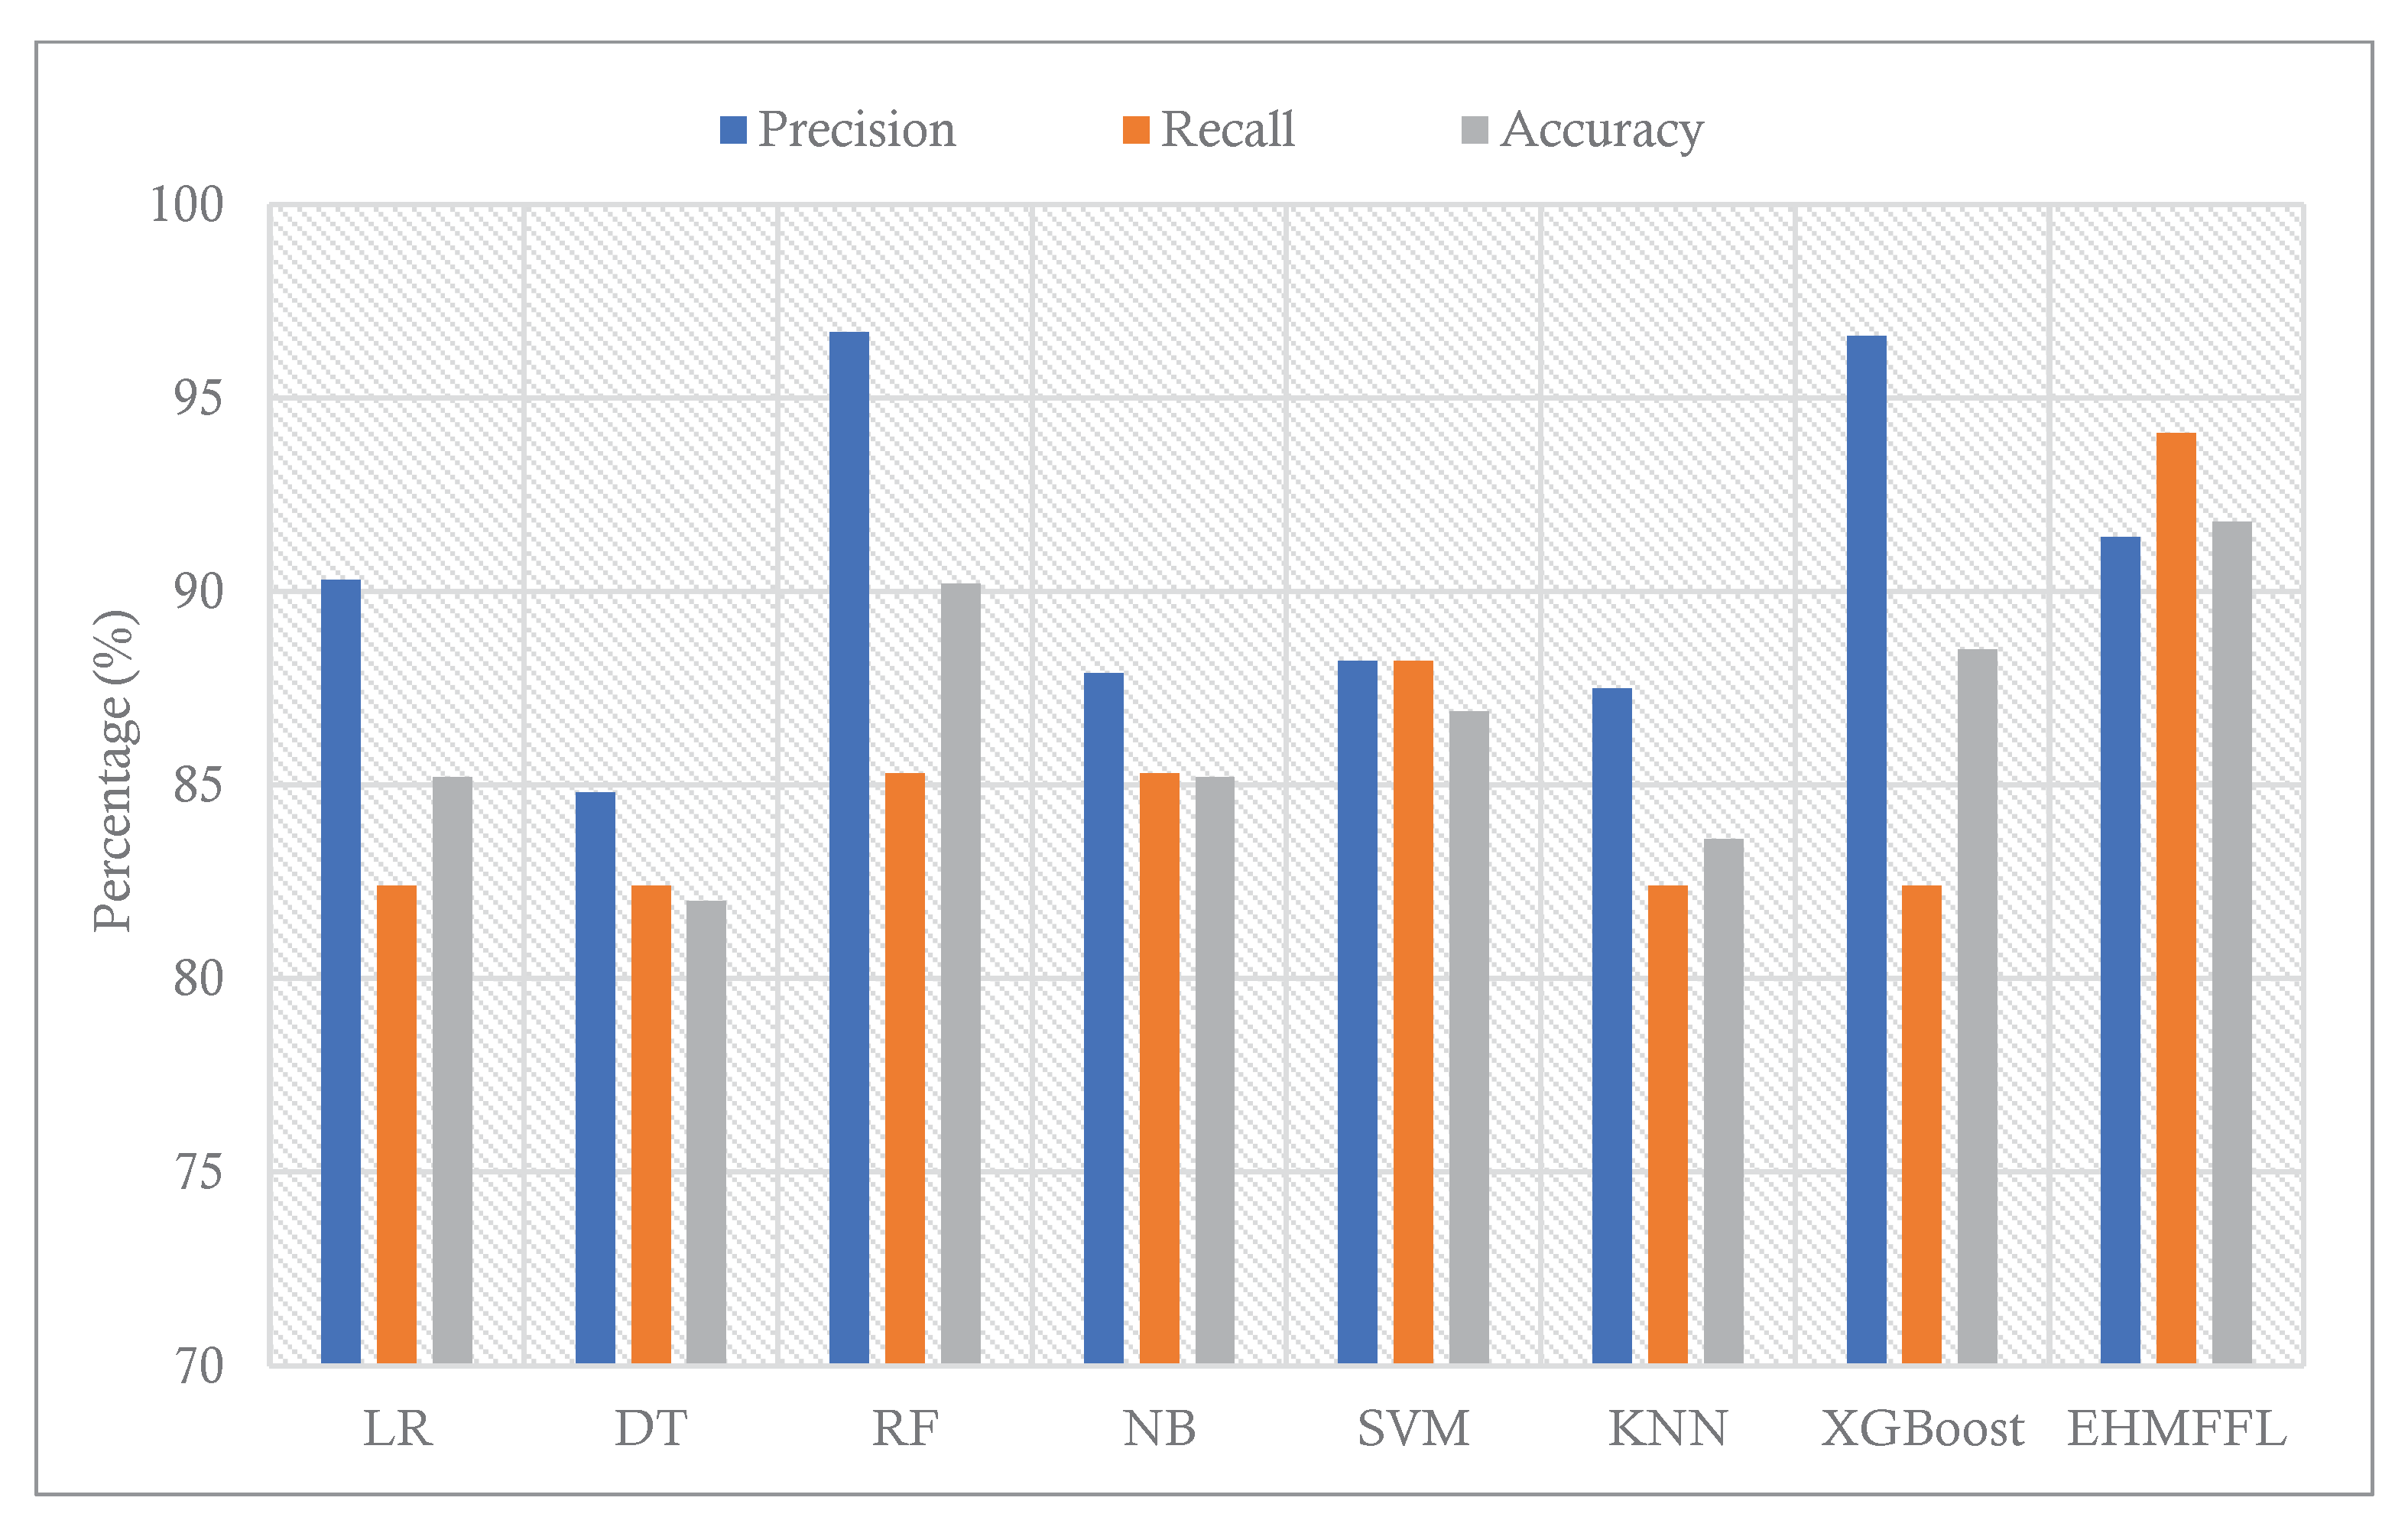
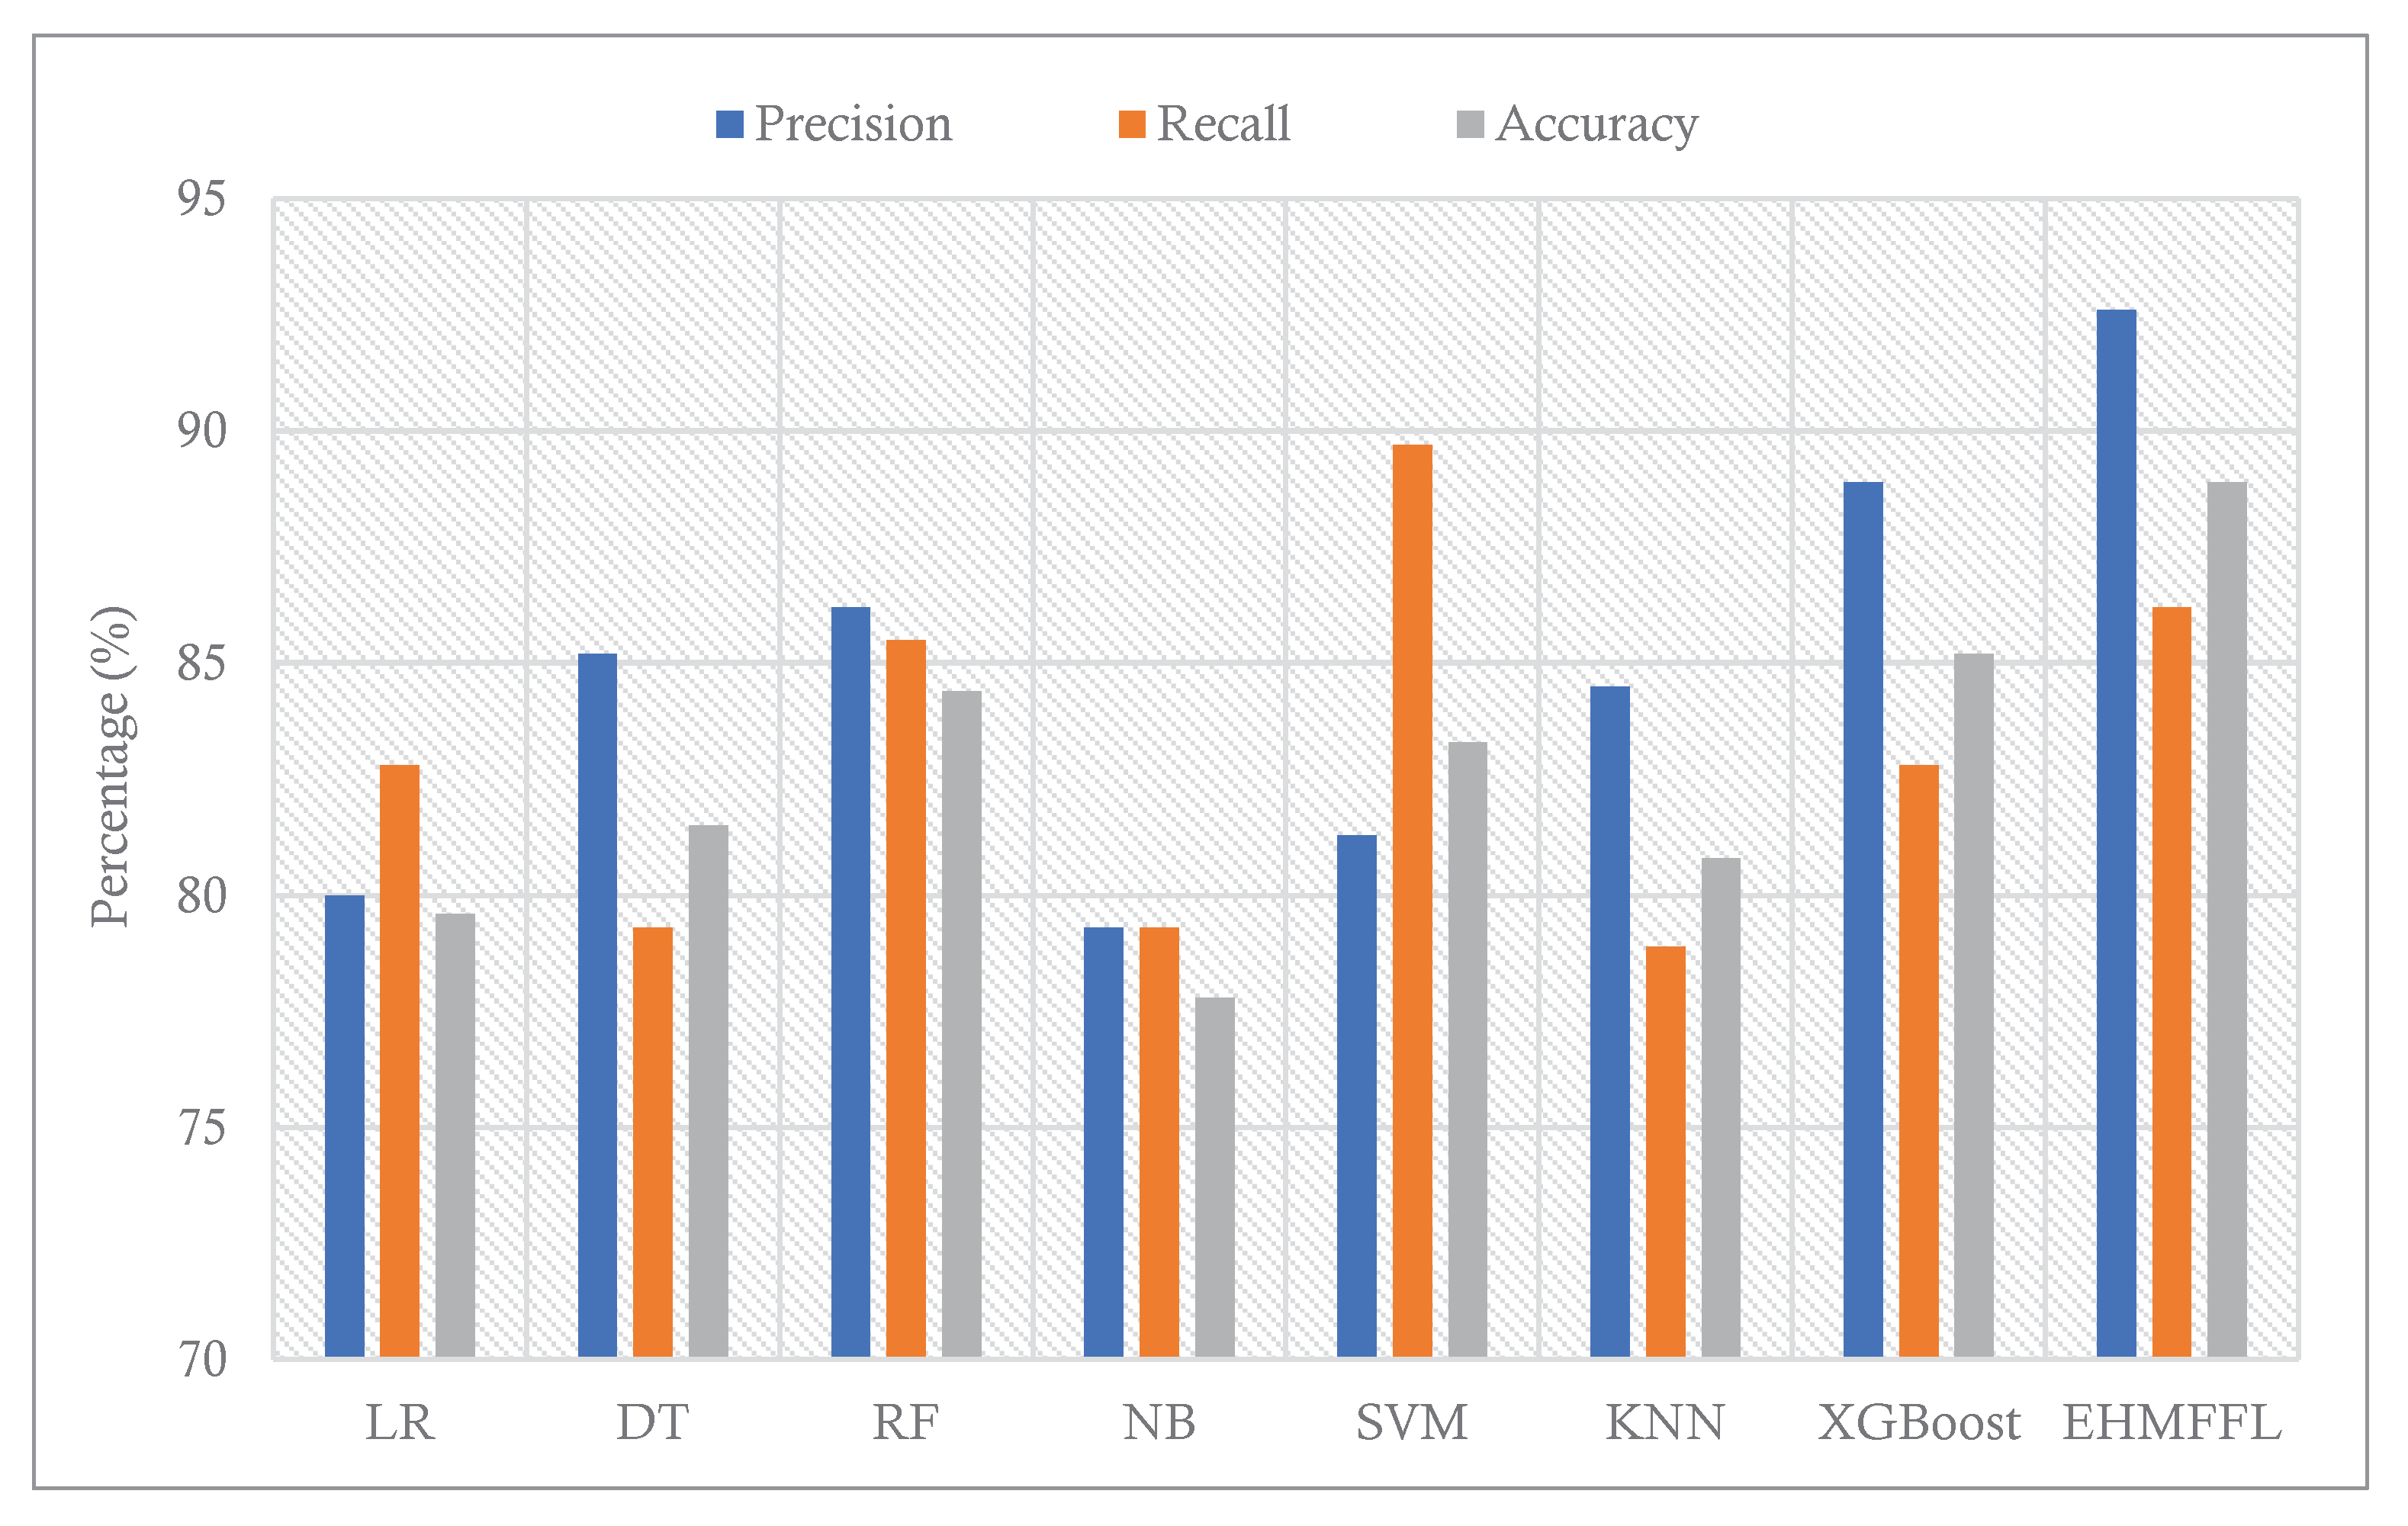
To find the effectiveness of the proposed ensemble EHMFFL algorithm against its base learners, a comparison of various performance measures on the test data samples of the Cleveland and Statlog datasets is provided in
Table 3 and
Table 4, respectively. While some algorithms may display higher performance than the EHMFFL algorithm on a measure, the proposed method outperforms all techniques on average for both datasets.
Figure 5 and
Figure 6 show the accuracy of EHMFFL using various methods. The EHMFFL algorithm surpasses all other methods, as illustrated in
Figure 6 and
Figure 7.
According to the different performance metrics for various classification techniques on the Cleveland dataset, the EHMFFL algorithm outperforms all base learners with an accuracy of 91.8%, precision of 91.4%, recall of 94.1%, F1-score of 92.8%, and specificity of 88.9. This shows that the EHMFFL algorithm is the most effective and efficient for the supplied dataset. Other algorithms also perform well in some cases, with accuracies ranging from 82% to 90.2%. When comparing the other algorithms, RF is the best base learner with an accuracy of 90.2%, and then, XGBosst and SVM with accuracies of 88.5% and 86.9% are in the next orders. Also, based on the results in
Table 4, the EHMFFL algorithm exceeds all other algorithms with an accuracy score of 88.9%. After the EHMFFL, XGBoost, RF, and SVM, have obtained better results than the other base learners with accuracy scores of 85.2%, 84.4%, and 83.3%, indicating that these three methods are the most accurate base learners as same as observed for the Cleveland dataset. The results show that the EHMFFL again shines out in terms of all performance metrics, on average.
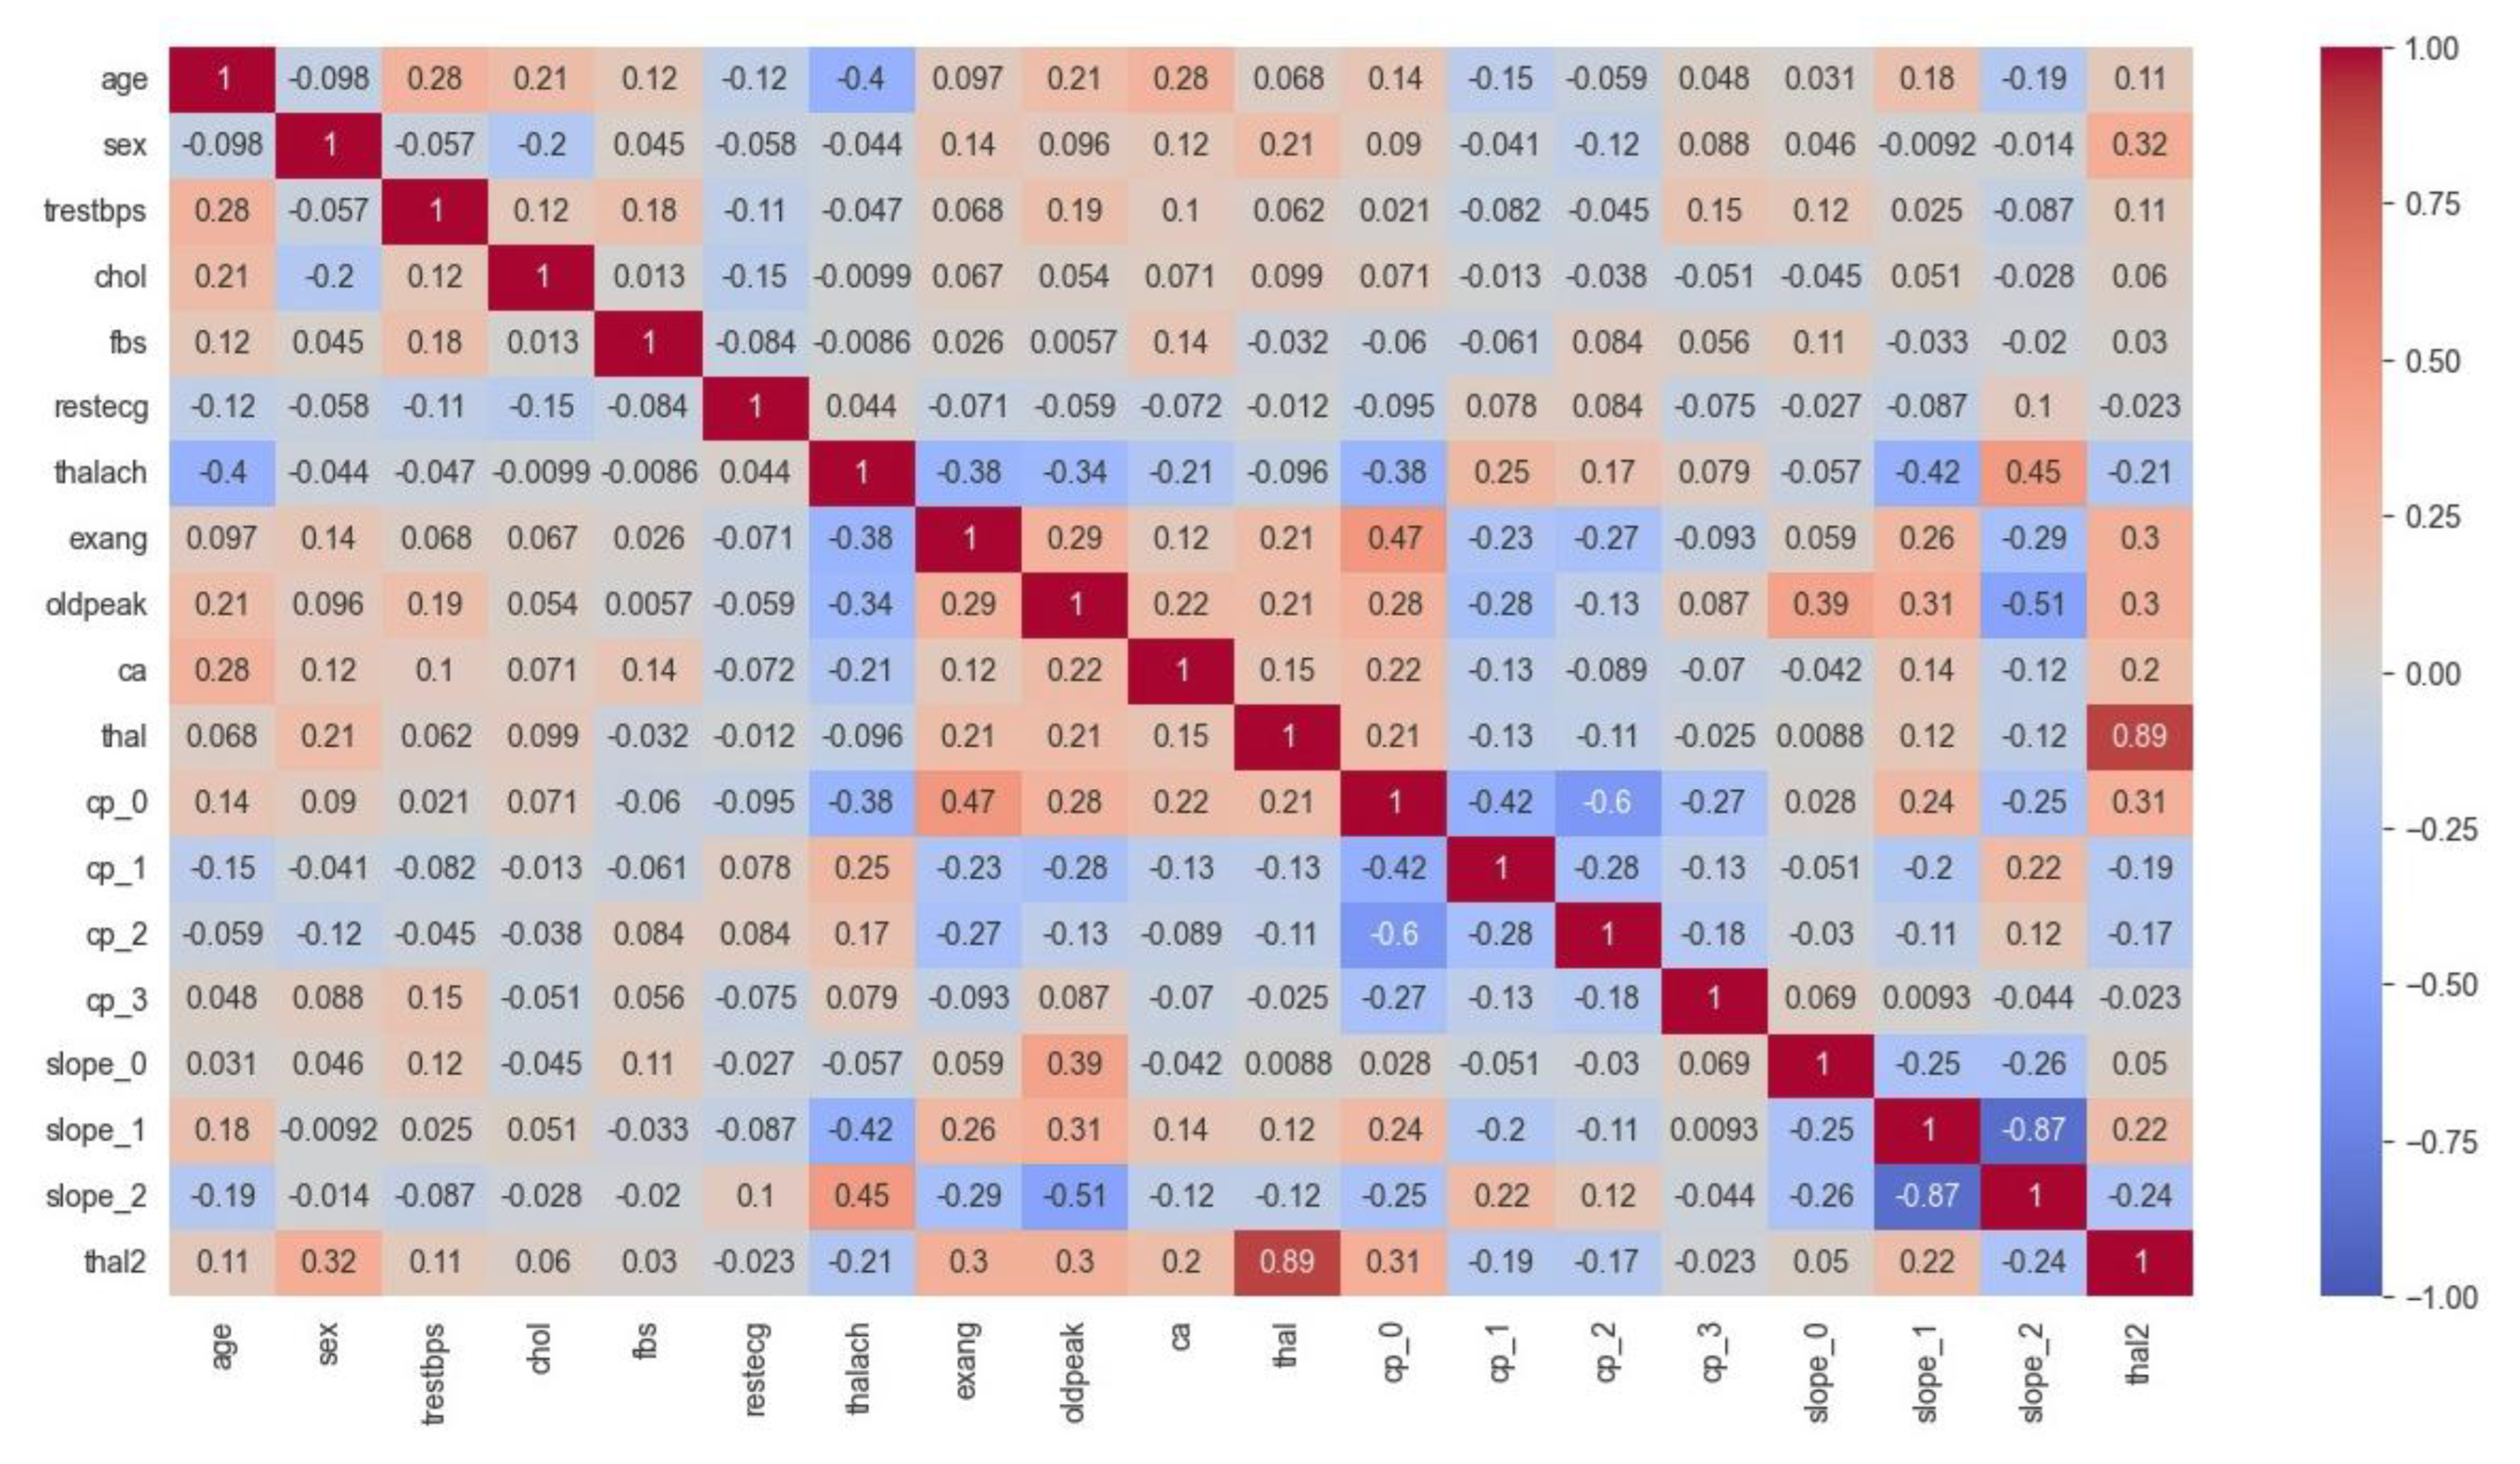
5.3.1. Analysis of Correlation Heat Map (CHM)
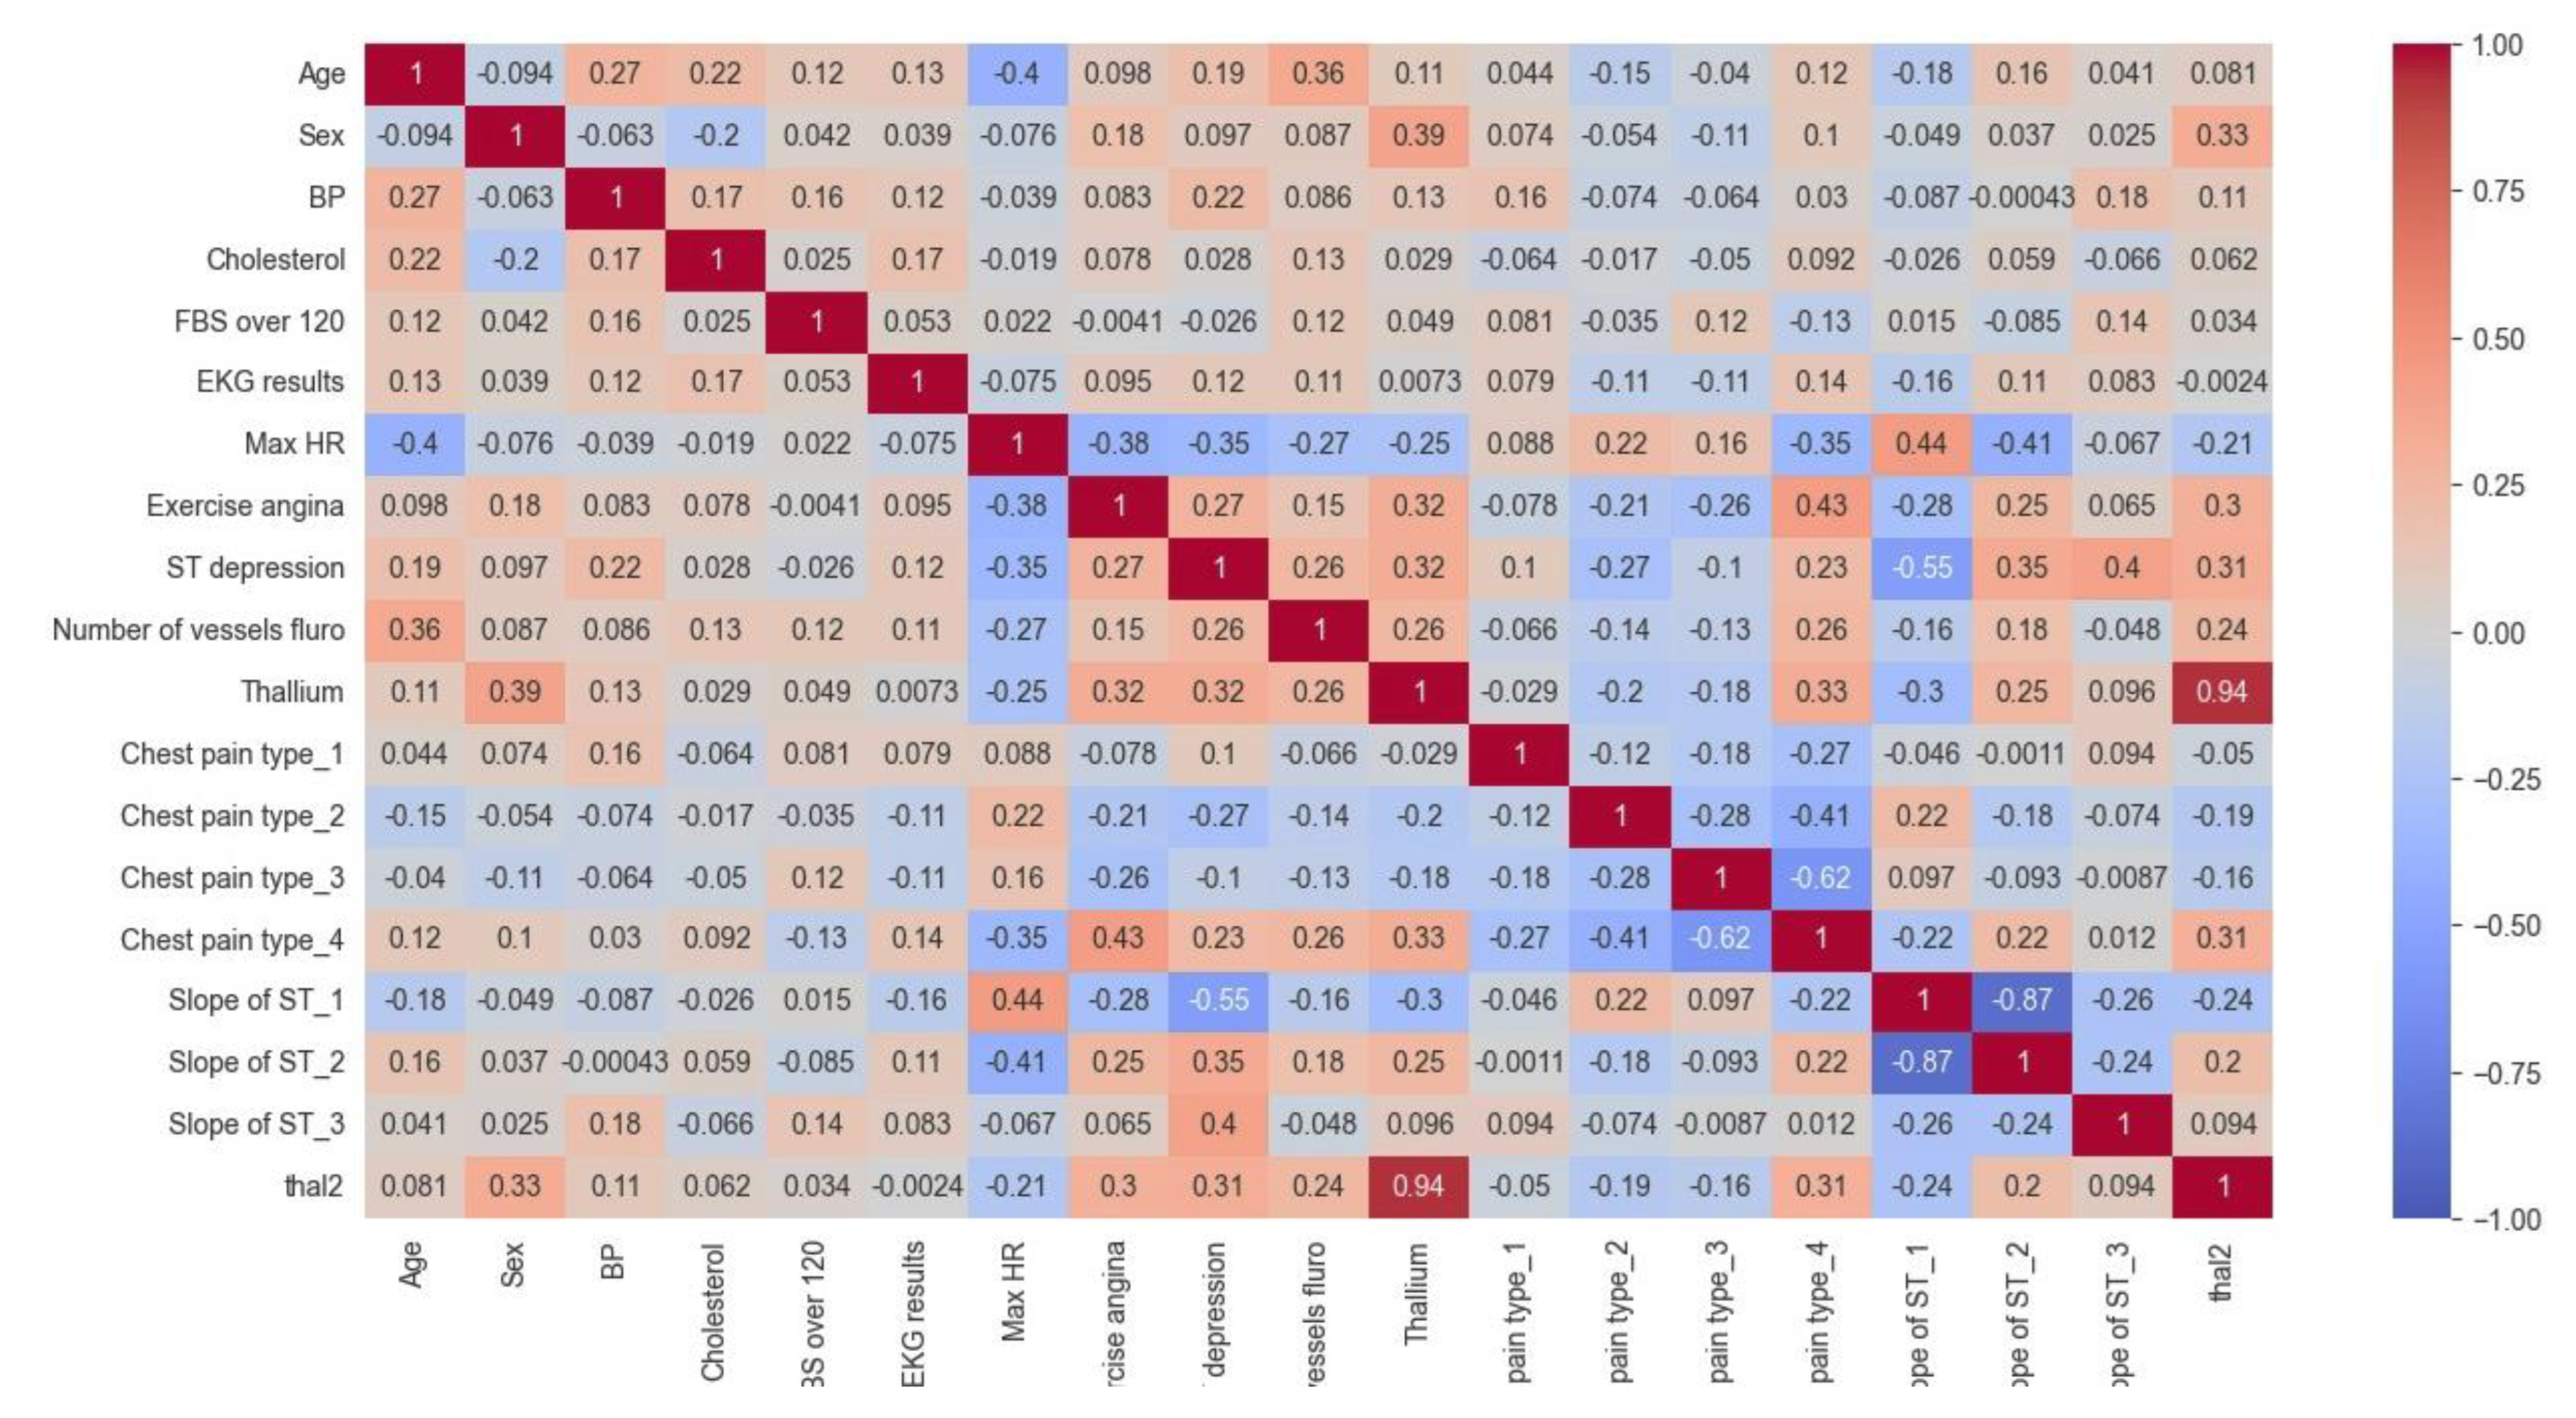
This section presents the CHM illustrating the relationships between different variables within the cardiovascular data for both the Cleveland and Statlog datasets.
Figure 8 and
Figure 9 display these CHMs, where each column signifies a specific variable, and each row visualizes its correlations with other variables. The numerical values within the tables convey the strength and direction of these correlations, which can span from -1, indicating a perfect inverse correlation, to 1, representing a perfect positive correlation. This visual representation offers valuable insights into the interplay among the dataset variables and their potential impacts on heart disease prediction.
In
Figure 8, the CHM of the Cleveland dataset illustrates the comparisons among various variables. These variables include age, gender, blood pressure (trestbps), cholesterol level (chol), fasting blood sugar (fbs), electrocardiogram results (restecg), maximum heart rate achieved (thalach), exercise-induced angina (exang), ST depression induced by exercise relative to rest (oldpeak), the number of major vessels colored by fluoroscopy (ca), type of chest pain (cp), and slope of the peak exercise ST segment (slope). Additionally, the presence of two types of thalassemia, indicated as thal and thal2, is considered. The values within the matrix fall within the -1 to 1 range, where positive values signify a positive correlation, negative values indicate a negative correlation, and a value of 0 denotes no discernible correlation between the variables. Analysis of the CHM for the Cleveland dataset concludes the following insights:
The first section of the matrix compares age, sex, and blood pressure. The correlation between age and blood pressure is weakly positive (0.28), while the correlation between sex and blood pressure is weakly negative (-0.098).
The second section compares cholesterol and blood sugar. Cholesterol and blood sugar have a weakly negative correlation (-0.057).
The third section compares restecg, thalach, exang, and oldpeak. Resting electrocardiogram results (restecg) and exercise-induced angina (exang) have a weakly positive correlation (0.14), while maximum heart rate achieved during exercise (thalach) has a weakly negative correlation (-0.044) with ST depression induced by exercise relative to rest (oldpeak).
The fourth section compares the number of major vessels colored by fluoroscopy (ca) with the other variables. There is a weakly positive correlation between ca and age (0.12), and a weakly positive correlation between ca and cholesterol (0.097).
The fifth section compares the different types of chest pain (cp) and their correlations with the other variables. Chest pain type 0 (cp_0) has a weakly positive correlation with ca (0.14), while chest pain type 1 (cp_1) has a weakly negative correlation with thal2 (-0.15). Chest pain type 2 (cp_2) has a weakly positive correlation with fbs (0.084), and chest pain type 3 (cp_3) has a weakly positive correlation with age (0.048).
The final section of the matrix compares the slope of the peak exercise ST segment (slope) and the two types of thalassemia (thal and thal2). There is a weakly positive correlation between slope and thal2 (0.18), and a weakly negative correlation between slope and thal (-0.42).
Also, according to the results of the CHM of the proposed model for the Statlog dataset in
Figure 9, it can be understood that:
The values in the matrix represent the correlations between each pair of variables. A positive value indicates a positive correlation (as one variable increases, so does the other), while a negative value indicates a negative correlation (as one variable increases, the other decreases).
For example, we can see that age is highly negatively correlated with itself (correlation coefficient of -1.00) since it is impossible for someone's age to be negatively correlated with their own age. Sex is negatively correlated with BP and positively correlated with cholesterol levels. We can also see that the ST depression is positively correlated with exercise-induced angina, Thallium stress test results, and chest pain types 3 and 4.
Some notable correlations include a positive correlation between age and BP (r=0.27), a negative correlation between age and max HR (r=-0.4), and a positive correlation between chest pain type 3 and ST depression (r=0.35). There also appear to be some negative correlations between certain variables, such as sex and chest pain type 3 (r=-0.26) and slope of ST 3 and thal2 (r=-0.24).
5.3.2. Analysis of Receiver Operating Characteristic (ROC)
In
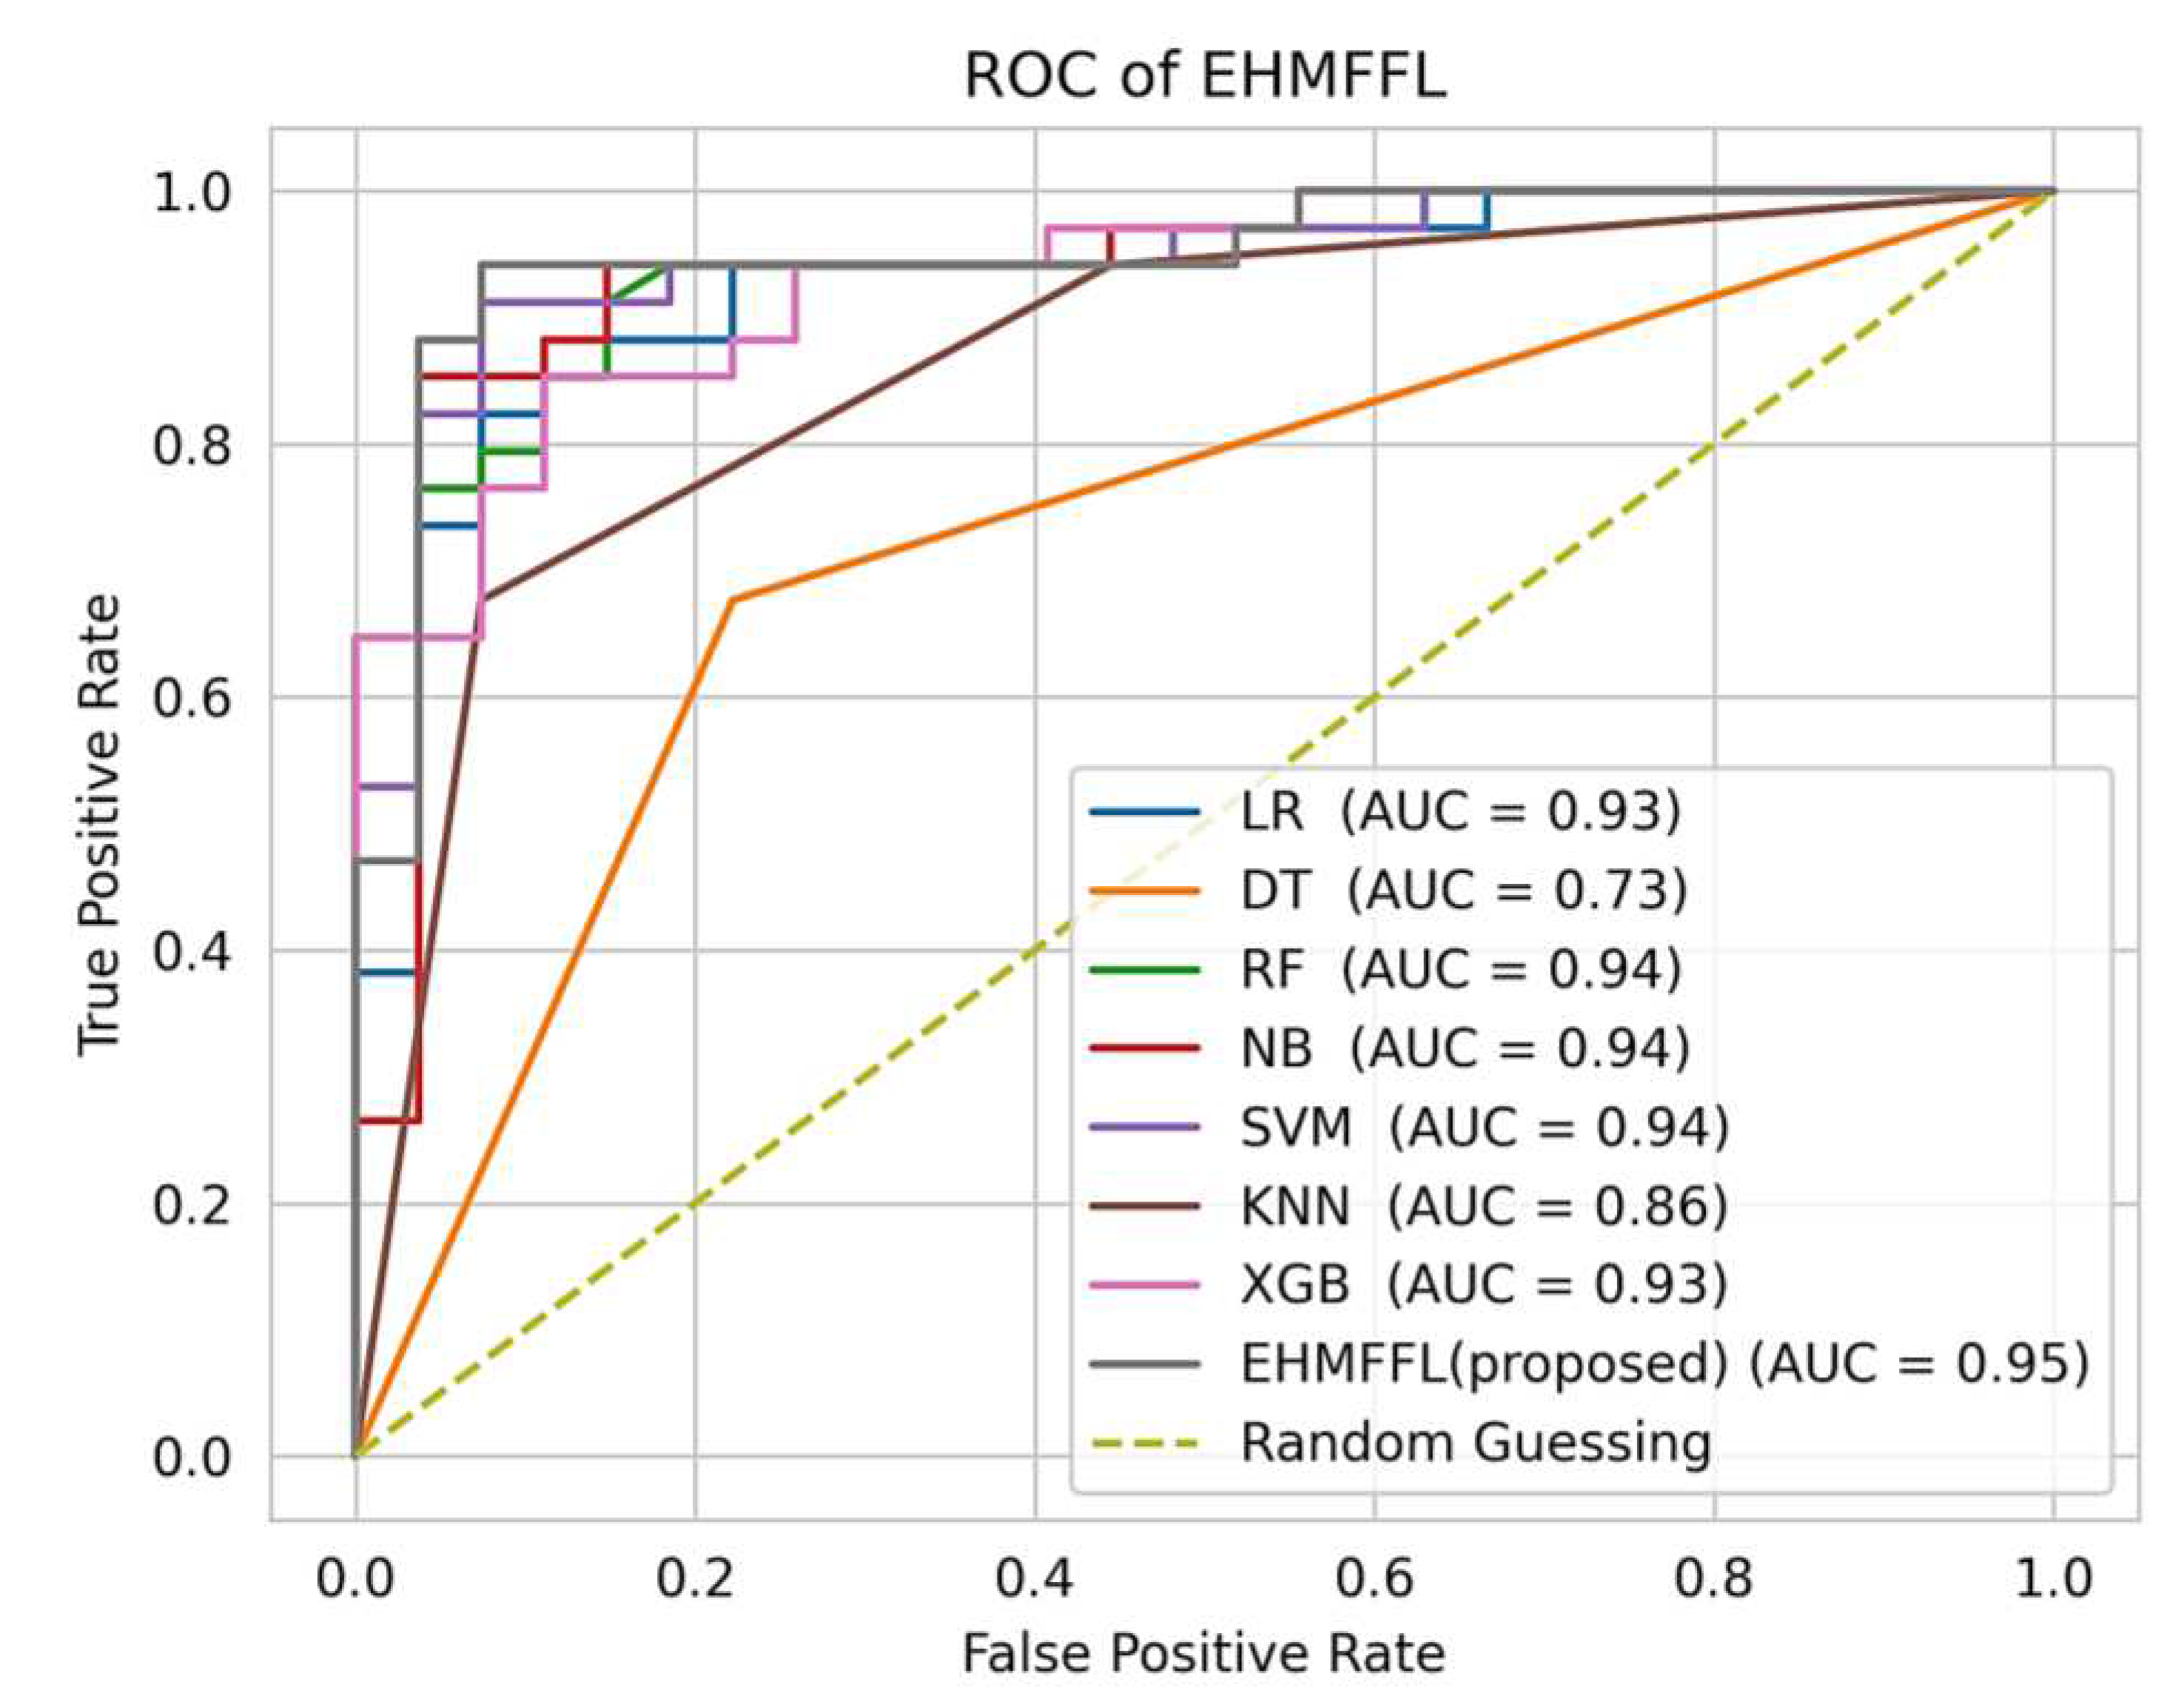
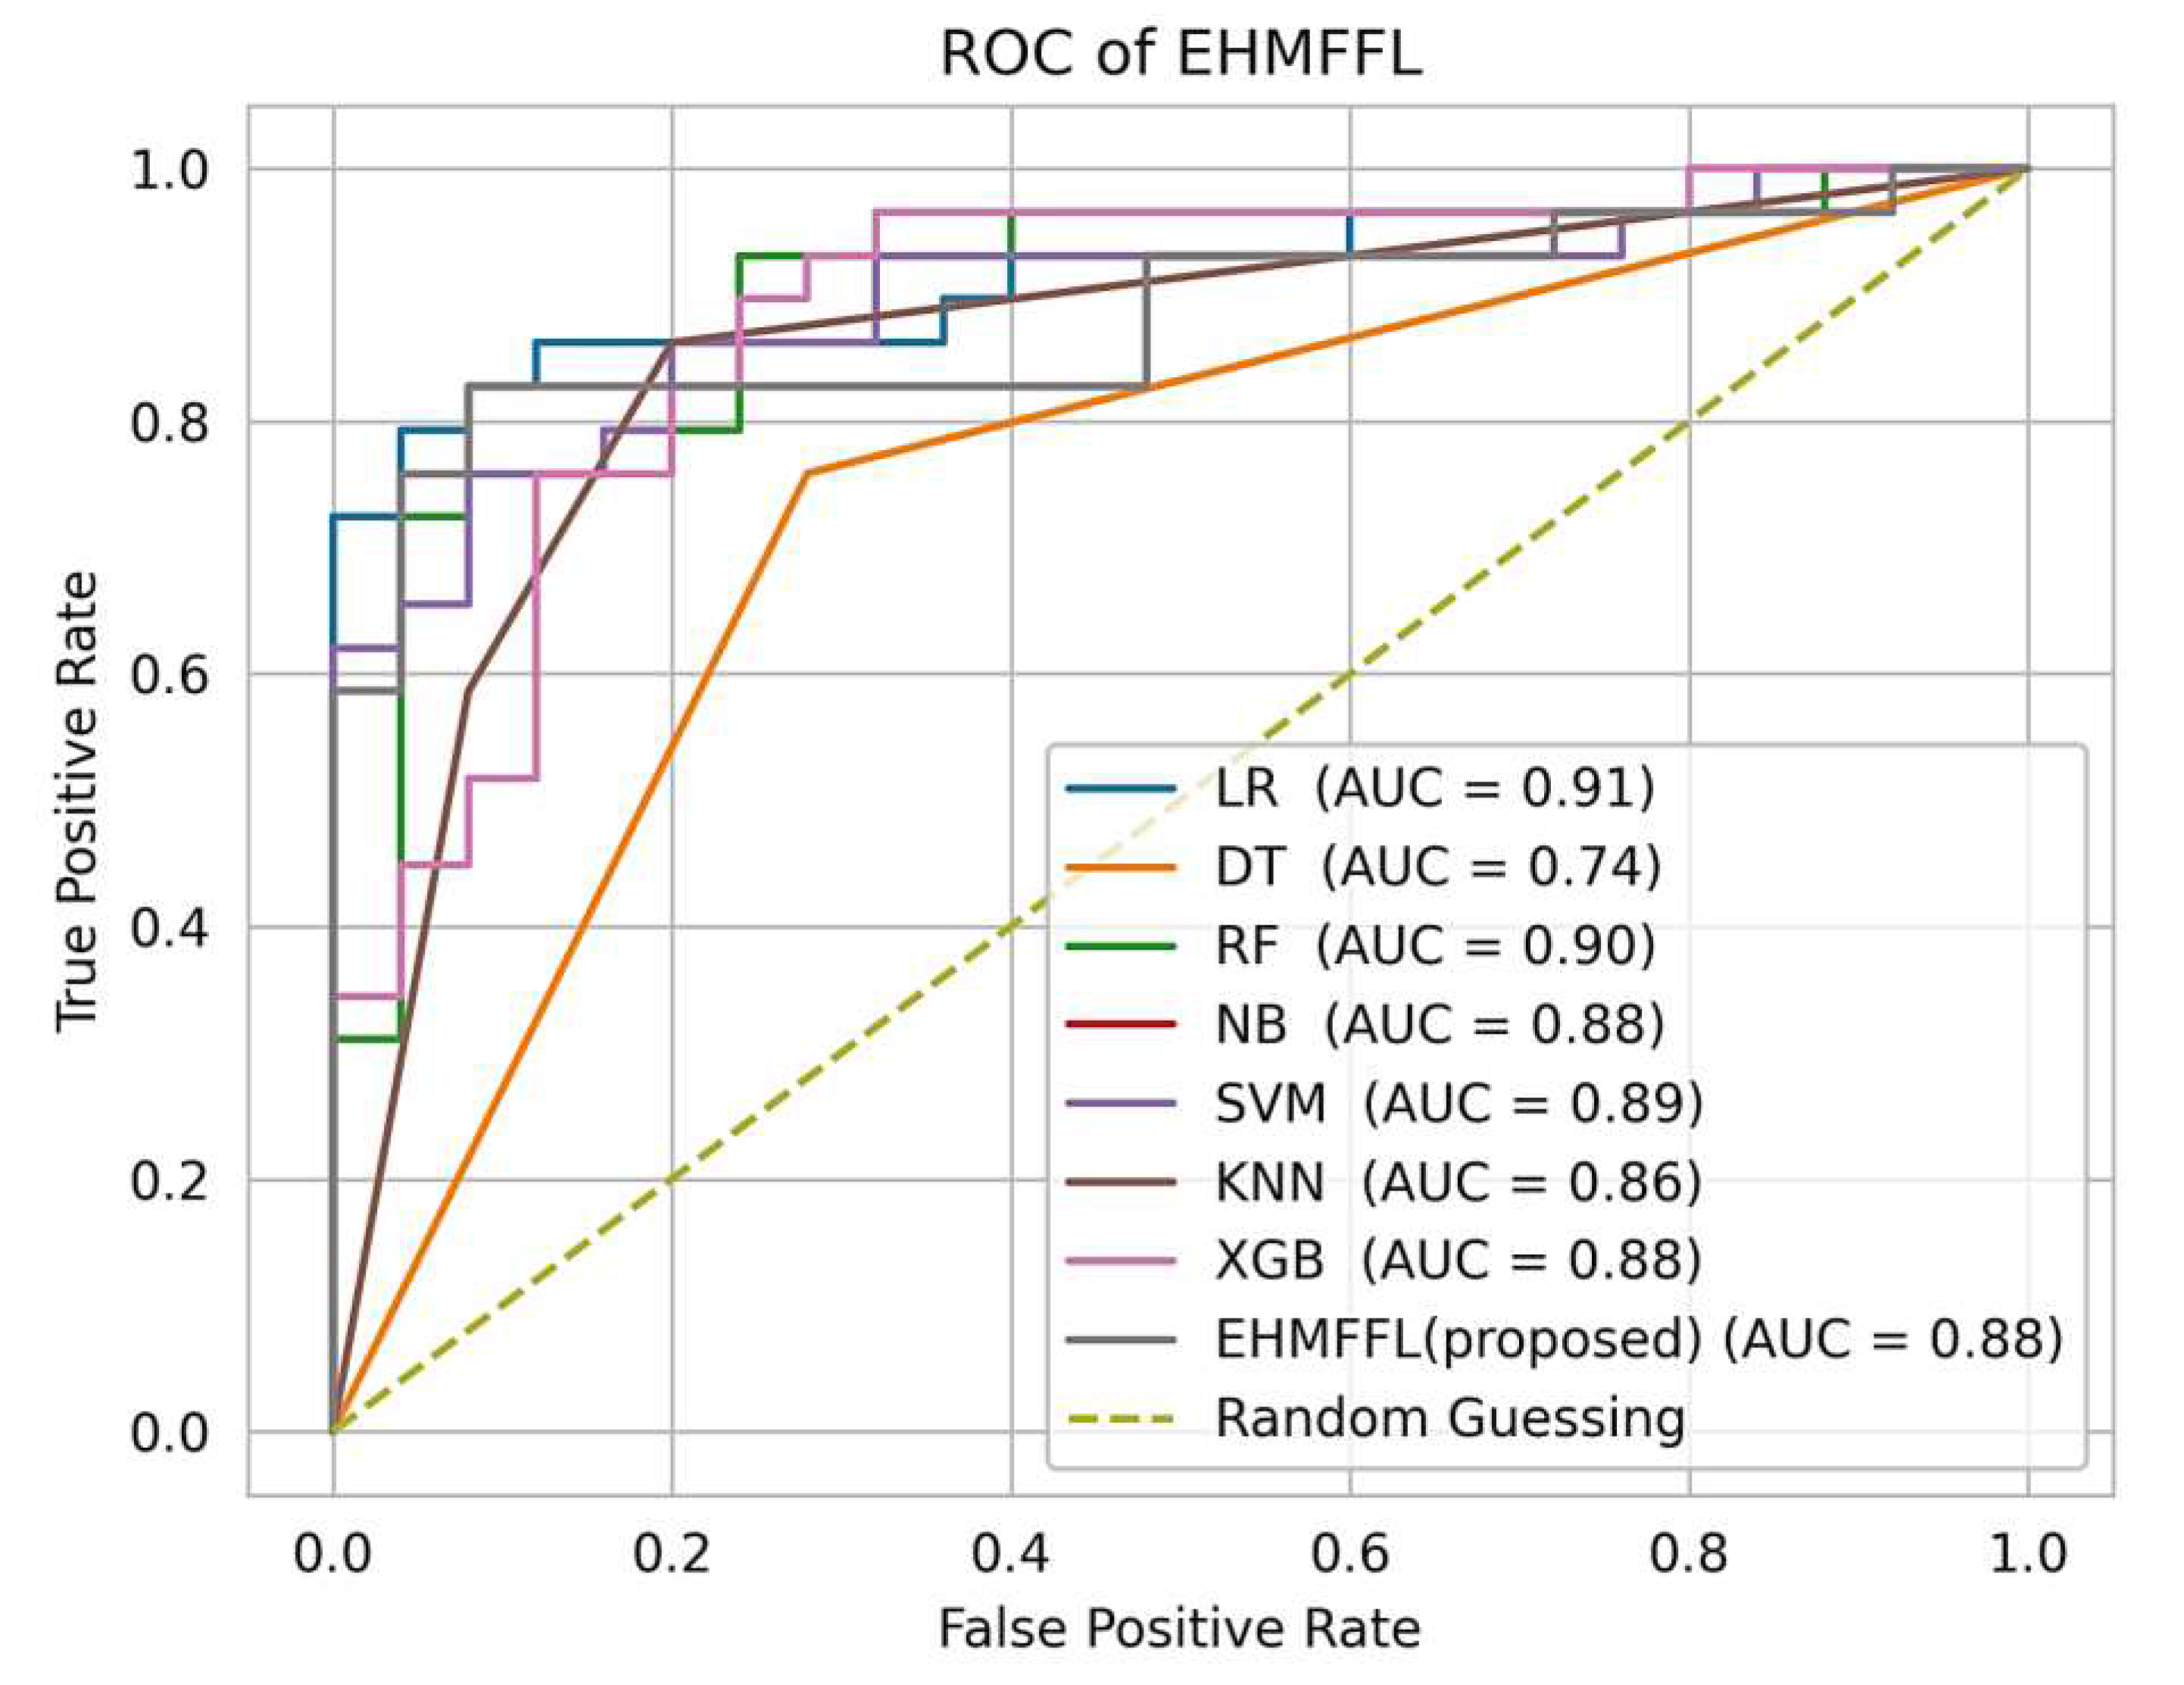
Figure 10 and
Figure 11, we present the ROC curves, which illustrate the performance of various heart disease prediction models, encompassing the seven base learners within our ensemble learning model, the EHMFFL algorithm as a whole, and random classification. These curves showcase the trade-off between sensitivity and specificity at different decision thresholds. To gauge the diagnostic value of these tests, we calculate the area under the ROC curve (AUC), where a larger AUC signifies a more effective test. According to the obtained results, the EHMFFL algorithm outperforms all other compared techniques, achieving AUC values of 0.95 for the Cleveland dataset and 0.88 for the Statlog dataset, underscoring its superior predictive capability in heart disease diagnosis.
5.3. Comparison With Existing Techniques
In this section, we conduct a comparative analysis of the EHMFFL algorithm against three other heart disease diagnosis techniques. These techniques include a machine learning approach by Jindal et al. (2021) [
18] (referred to as ML), an ensemble learning model developed by Shorewala (2021) [
23] (referred to as EL), and a feature selection method by Ahmed et al. (2022) [
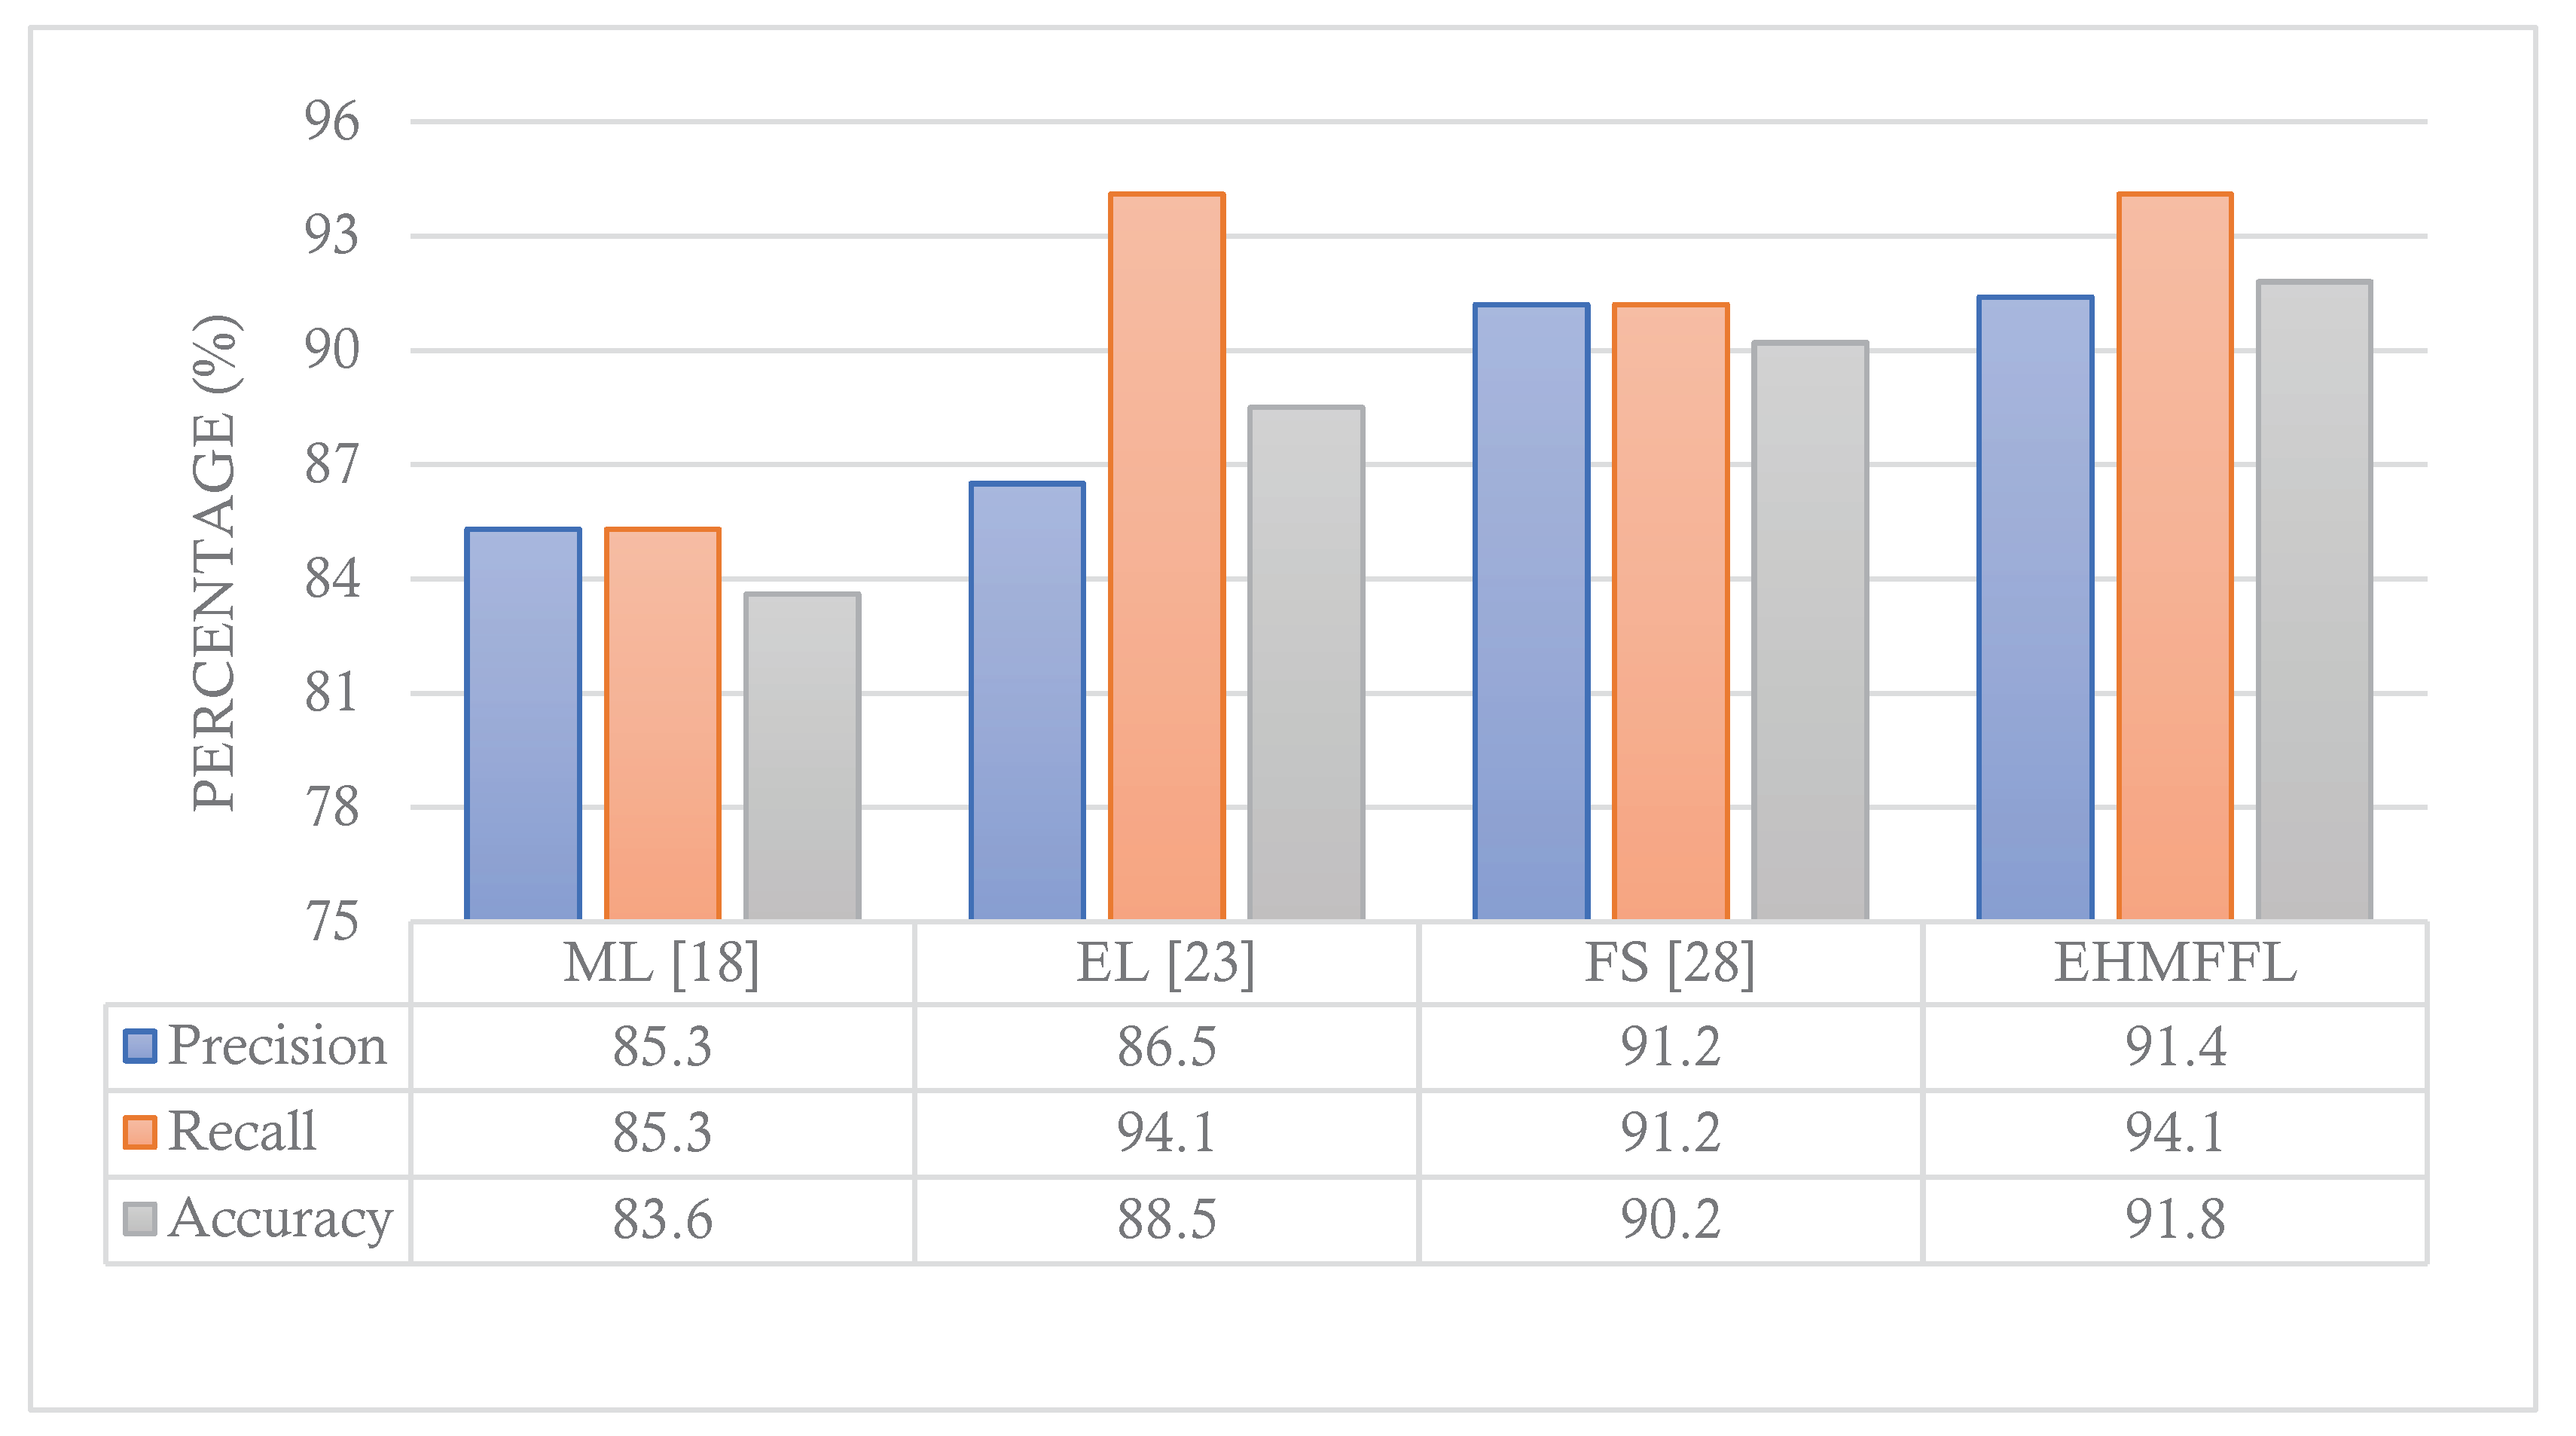
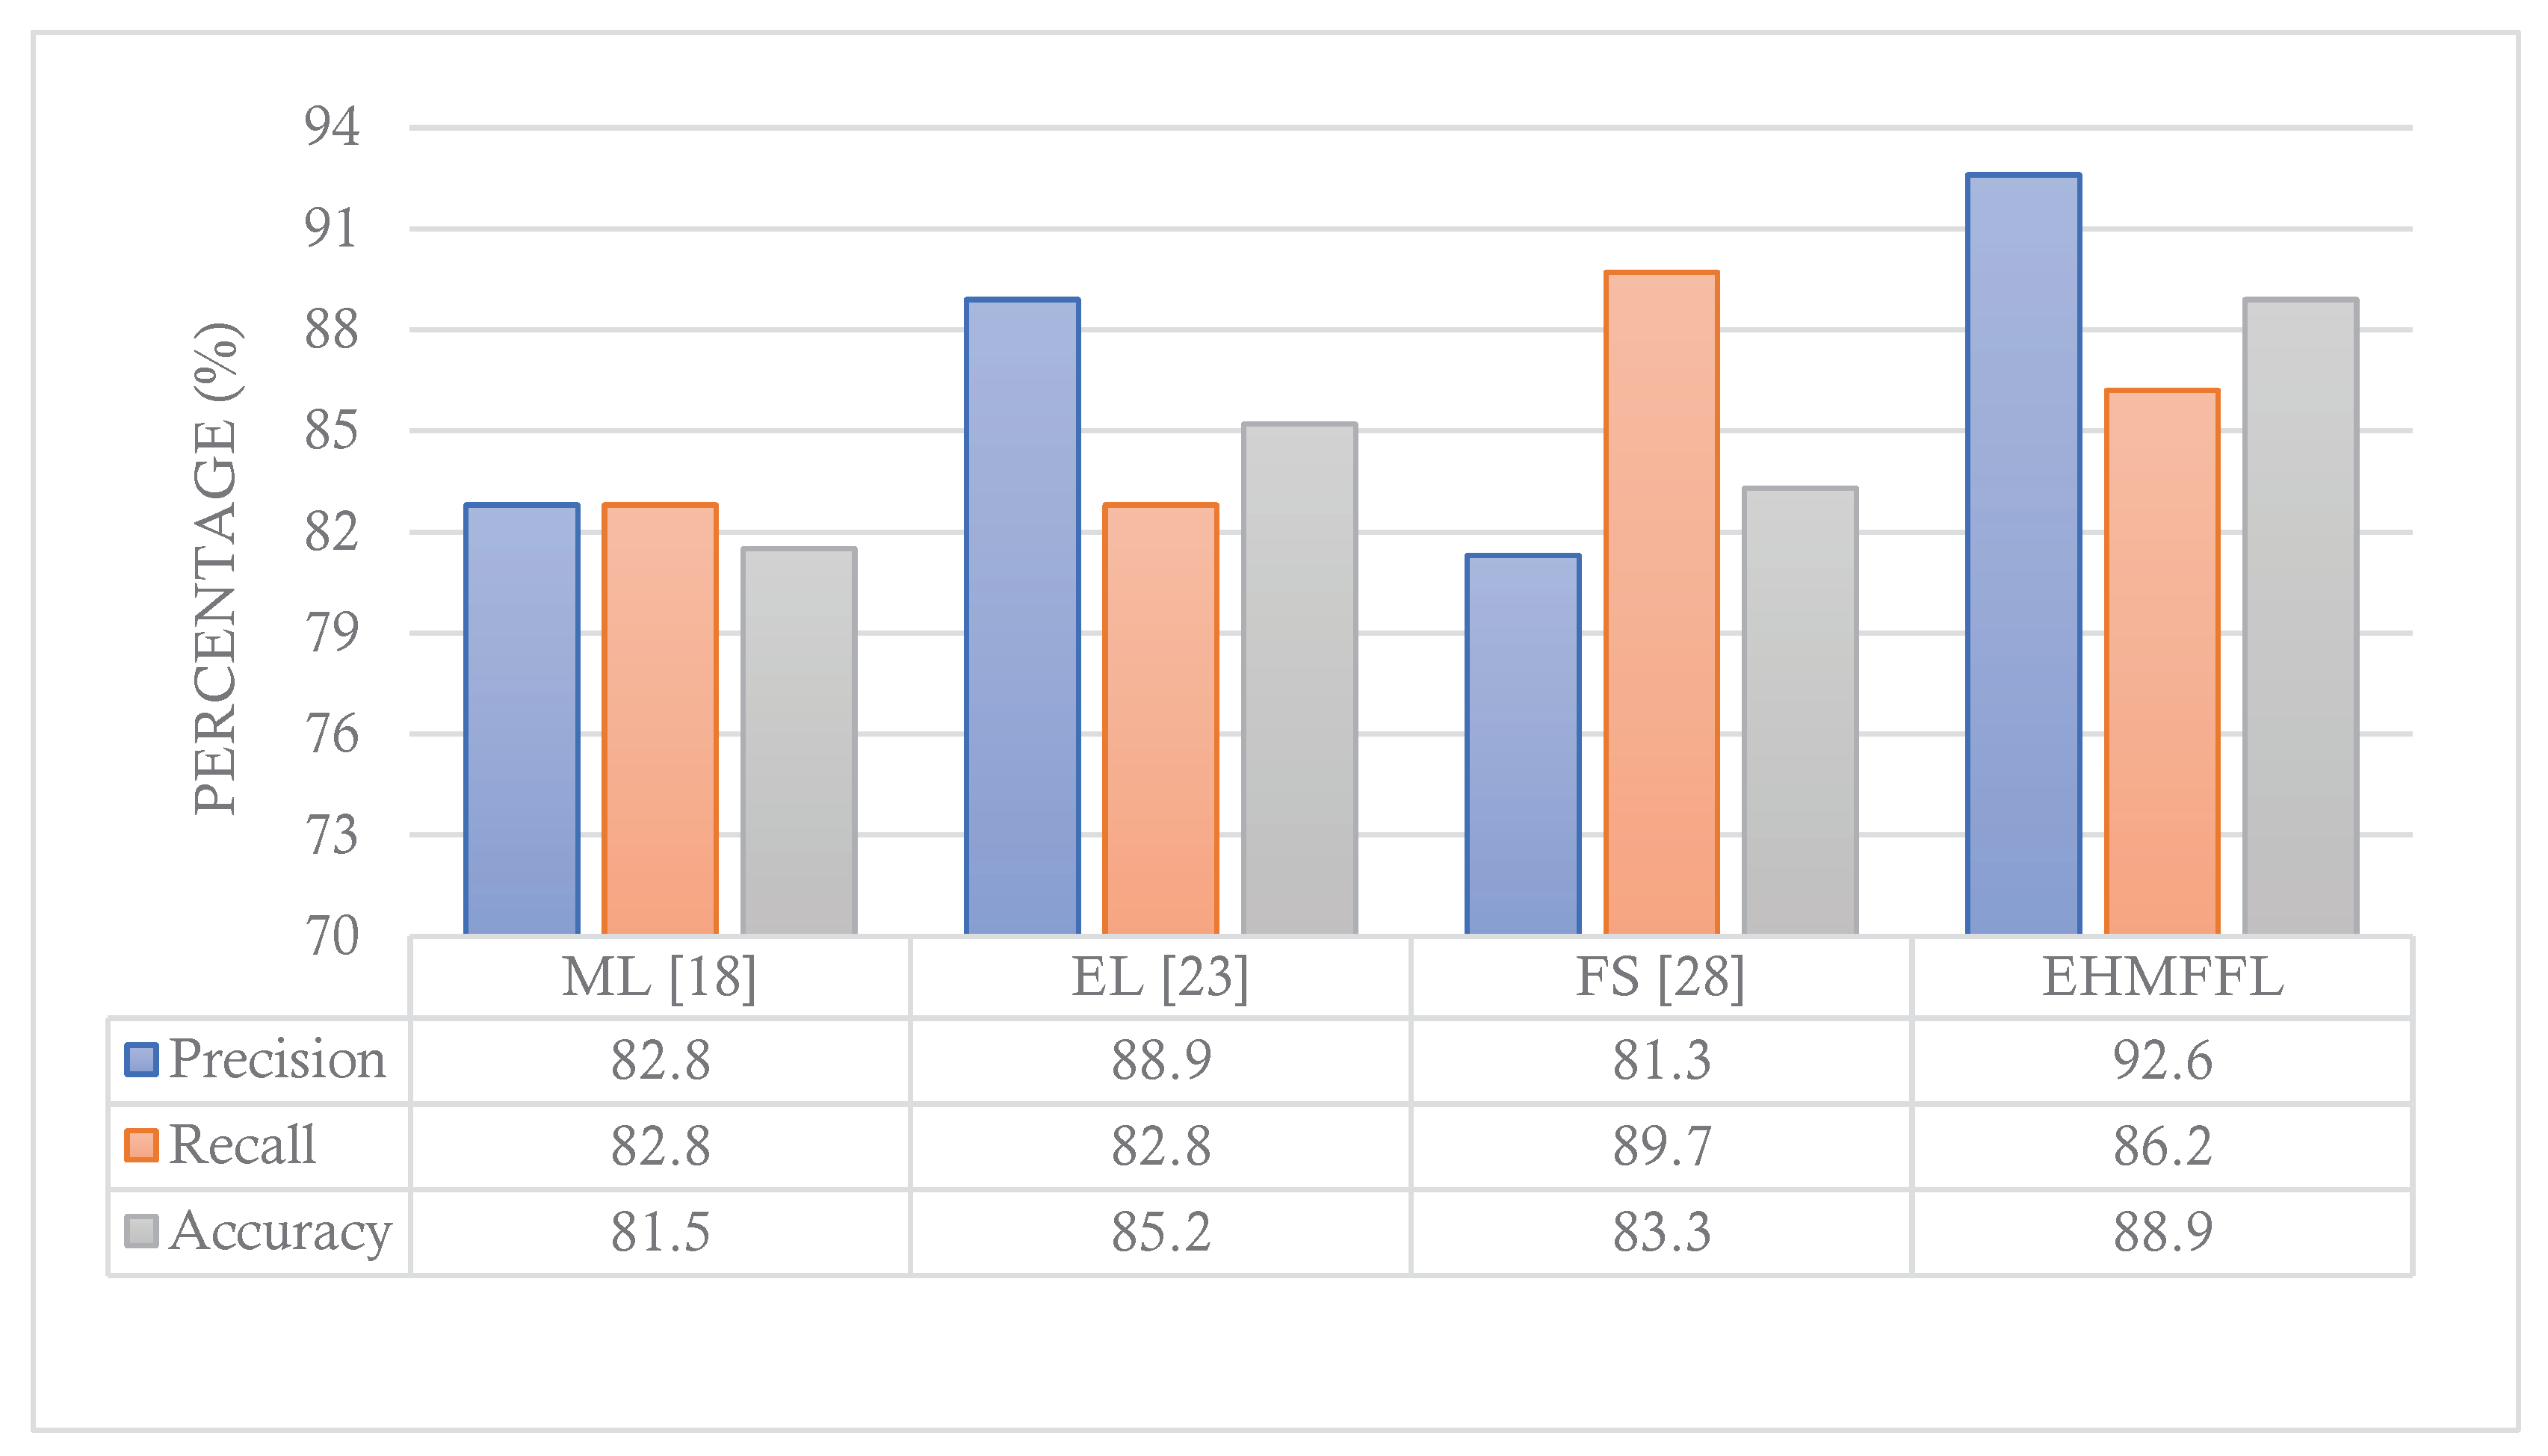
28] (referred to as FS). We assess the precision, recall, and accuracy achieved by these different approaches, as depicted in
Figure 12 and
Figure 13 for the Cleveland and Statlog datasets, respectively. The results in
Figure 12 indicate that the EL model outperforms the EHMFFL algorithm in terms of recall for the Cleveland dataset. A similar trend is observed in
Figure 13 for the Statlog dataset, where the FS method excels in achieving the highest recall among all techniques. However, when considering overall performance and emphasizing accuracy as the main metric, the proposed EHMFFL model demonstrates its superiority over all the compared techniques in both datasets, underscoring its effectiveness in heart disease diagnosis.
6. Conclusion
In this study, we have introduced an ensemble heuristic-metaheuristic feature fusion learning (EHMFFL) algorithm, as a powerful tool for heart disease diagnosis. EHMFFL's first phase employed a hybrid feature selection approach, combining heuristic-based PCC and metaheuristic-driven GWO techniques through the innovative PCC-GWO method. This approach effectively selects essential features for each machine learning model, facilitating the construction of a robust predictive model through ensemble learning. We evaluated the performance of the EHMFFL algorithm on the Cleveland and Statlog datasets. With an accuracy rate of 91.8% for the Cleveland dataset and 88.9% for the Statlog dataset, our method outperformed the base learners and state-of-the-art approaches. These outcomes highlight the potential of our strategy to elevate cardiac disease prediction accuracy and support healthcare professionals in making more informed patient care decisions. Looking ahead, the application of the EHMFFL algorithm could be expanded to a broader range of medical datasets, investigating its potential in diagnosing various health conditions beyond heart disease. Additionally, the integration of real-time patient data streams and the development of a user-friendly interface could lead to a transformative healthcare tool for timely disease detection and proactive intervention. Furthermore, we plan to explore further enhancements to our algorithm by delving into more advanced feature selection methods and metaheuristic algorithms, continually striving to optimize diagnostic accuracy and efficiency in healthcare.
Author Contributions
Conceptualization, Mohamad Hasanvand and Elaheh Moharamkhani; Data curation, Mohamad Hasanvand and Elaheh Moharamkhani; Formal analysis, Mohammad Shokouhifar and Frank Werner; Investigation, Mohamad Hasanvand and Elaheh Moharamkhani; Methodology, Mohamad Hasanvand, Elaheh Moharamkhani and Mohammad Shokouhifar; Resources, , Mohamad Hasanvand and Elaheh Moharamkhani; Software, Mohamad Hasanvand and Elaheh Moharamkhani; Supervision, Mohammad Shokouhifar and Frank Werner; Validation, Mohammad Shokouhifar and Frank Werner; Writing – original draft, Mohamad Hasanvand and Elaheh Moharamkhani; Writing – review & editing, Mohammad Shokouhifar and Frank Werner.
Institutional Review Board Statement
Not applicable.
Informed Consent Statement
Not applicable.
Data Availability Statement
The data used in the study is available with the authors and can be shared upon reasonable requests.
Conflicts of Interest
The authors declare no conflict of interest.
References
- Das, S., Sharma, R., Gourisaria, M. K., Rautaray, S. S., & Pandey, M. (2020). Heart disease detection using core machine learning and deep learning techniques: A comparative study. International Journal on Emerging Technologies, 11(3), 531-538.
- Hasan, T. T., Jasim, M. H., & Hashim, I. A. (2018, December). FPGA design and hardware implementation of heart disease diagnosis system based on NVG-RAM classifier. In 2018 Third Scientific Conference of Electrical Engineering (SCEE) (pp. 33-38). IEEE.
- Rahman, A. U., Saeed, M., Mohammed, M. A., Jaber, M. M., & Garcia-Zapirain, B. (2022). A novel fuzzy parameterized fuzzy hypersoft set and riesz summability approach based decision support system for diagnosis of heart diseases. Diagnostics, 12(7), 1546. [CrossRef]
- Javid, I., Alsaedi, A. K. Z., & Ghazali, R. (2020). Enhanced accuracy of heart disease prediction using machine learning and recurrent neural networks ensemble majority voting method. International Journal of Advanced Computer Science and Applications, 11(3). [CrossRef]
- Muhsen, D. K., Khairi, T. W. A., & Alhamza, N. I. A. (2021). Machine learning system using modified random forest algorithm. In Intelligent Systems and Networks: Selected Articles from ICISN 2021, Vietnam (pp. 508-515). Springer Singapore.
- Mastoi, Q. U. A., Wah, T. Y., Mohammed, M. A., Iqbal, U., Kadry, S., Majumdar, A., & Thinnukool, O. (2022). Novel DERMA fusion technique for ECG heartbeat classification. Life, 12(6), 842. [CrossRef]
- Nahar, J., Imam, T., Tickle, K. S., & Chen, Y. P. P. (2013). Computational intelligence for heart disease diagnosis: A medical knowledge driven approach. Expert systems with applications, 40(1), 96-104. [CrossRef]
- Lee, H. G., Noh, K. Y., & Ryu, K. H. (2007). Mining biosignal data: coronary artery disease diagnosis using linear and nonlinear features of HRV. In Emerging Technologies in Knowledge Discovery and Data Mining: PAKDD 2007 International Workshops Nanjing, China, May 22-25, 2007 Revised Selected Papers 11 (pp. 218-228). Springer Berlin Heidelberg.
- Sudhakar, K., & Manimekalai, D. M. (2014). Study of heart disease prediction using data mining. International journal of advanced research in computer science and software engineering, 4(1), 1157-1160.
- Khazaee, A. (2013). Heart beat classification using particle swarm optimization. International Journal of Intelligent Systems and Applications, 5(6), 25.
- Xing, Y., Wang, J., & Zhao, Z. (2007, November). Combination data mining methods with new medical data to predicting outcome of coronary heart disease. In 2007 International Conference on Convergence Information Technology (ICCIT 2007) (pp. 868-872). IEEE.
- Breiman, L. (1996). Bagging predictors. Machine learning, 24, 123-140.
- Schapire, R. E., & Singer, Y. (1998, July). Improved boosting algorithms using confidence-rated predictions. In Proceedings of the eleventh annual conference on Computational learning theory (pp. 80-91).
- Miao, K. H., & Miao, J. H. (2018). Coronary heart disease diagnosis using deep neural networks. International journal of advanced computer science and applications, 9(10).
- Vijayashree, J., & Sultana, H. P. (2018). A machine learning framework for feature selection in heart disease classification using improved particle swarm optimization with support vector machine classifier. Programming and Computer Software, 44, 388-397. [CrossRef]
- Waigi, D., Choudhary, D. S., Fulzele, D. P., & Mishra, D. (2020). Predicting the risk of heart disease using advanced machine learning approach. Eur. J. Mol. Clin. Med, 7(7), 1638-1645.
- Tuli, S., Basumatary, N., Gill, S. S., Kahani, M., Arya, R. C., Wander, G. S., & Buyya, R. (2020). HealthFog: An ensemble deep learning based Smart Healthcare System for Automatic Diagnosis of Heart Diseases in integrated IoT and fog computing environments. Future Generation Computer Systems, 104, 187-200. [CrossRef]
- Jindal, H., Agrawal, S., Khera, R., Jain, R., & Nagrath, P. (2021). Heart disease prediction using machine learning algorithms. In IOP conference series: materials science and engineering (Vol. 1022, No. 1, p. 012072). IOP Publishing.
- Sarra, R. R., Dinar, A. M., Mohammed, M. A., & Abdulkareem, K. H. (2022). Enhanced heart disease prediction based on machine learning and χ2 statistical optimal feature selection model. Designs, 6(5), 87. [CrossRef]
- Aliyar Vellameeran, F., & Brindha, T. (2022). A new variant of deep belief network assisted with optimal feature selection for heart disease diagnosis using IoT wearable medical devices. Computer Methods in Biomechanics and Biomedical Engineering, 25(4), 387-411. [CrossRef]
- Latha, C. B. C., & Jeeva, S. C. (2019). Improving the accuracy of prediction of heart disease risk based on ensemble classification techniques. Informatics in Medicine Unlocked, 16, 100203. [CrossRef]
- Ali, F., El-Sappagh, S., Islam, S. R., Kwak, D., Ali, A., Imran, M., & Kwak, K. S. (2020). A smart healthcare monitoring system for heart disease prediction based on ensemble deep learning and feature fusion. Information Fusion, 63, 208-222. [CrossRef]
- Shorewala, V. (2021). Early detection of coronary heart disease using ensemble techniques. Informatics in Medicine Unlocked, 26, 100655. [CrossRef]
- Ghasemi Darehnaei, Z., Shokouhifar, M., Yazdanjouei, H., & Rastegar Fatemi, S. M. J. (2022). SI-EDTL: swarm intelligence ensemble deep transfer learning for multiple vehicle detection in UAV images. Concurrency and Computation: Practice and Experience, 34(5), e6726. [CrossRef]
- Shokouhifar, A., Shokouhifar, M., Sabbaghian, M., & Soltanian-Zadeh, H. (2023). Swarm intelligence empowered three-stage ensemble deep learning for arm volume measurement in patients with lymphedema. Biomedical Signal Processing and Control, 85, 105027. [CrossRef]
- Nagarajan, S. M., Muthukumaran, V., Murugesan, R., Joseph, R. B., Meram, M., & Prathik, A. (2022). Innovative feature selection and classification model for heart disease prediction. Journal of Reliable Intelligent Environments, 8(4), 333-343. [CrossRef]
- Al-Yarimi, F. A. M., Munassar, N. M. A., Bamashmos, M. H. M., & Ali, M. Y. S. (2021). Feature optimization by discrete weights for heart disease prediction using supervised learning. Soft Computing, 25, 1821-1831. [CrossRef]
- Ahmad, G. N., Ullah, S., Algethami, A., Fatima, H., & Akhter, S. M. H. (2022). Comparative study of optimum medical diagnosis of human heart disease using machine learning technique with and without sequential feature selection. ieee access, 10, 23808-23828. [CrossRef]
- Pathan, M. S., Nag, A., Pathan, M. M., & Dev, S. (2022). Analyzing the impact of feature selection on the accuracy of heart disease prediction. Healthcare Analytics, 2, 100060. [CrossRef]
- Zhang, D., Chen, Y., Chen, Y., Ye, S., Cai, W., Jiang, J., ... & Chen, M. (2021). Heart disease prediction based on the embedded feature selection method and deep neural network. Journal of Healthcare Engineering, 2021, 1-9. [CrossRef]
- https://archive.ics.uci.edu/ml/datasets/heart+disease.
- http://archive.ics.uci.edu/ml/datasets/Statlog+%28Heart%29.
- Jensen, R. (2005). Combining rough and fuzzy sets for feature selection (Doctoral dissertation, University of Edinburgh).
- Shokouhifar, M., & Farokhi, F. (2010, December). An artificial bee colony optimization for feature subset selection using supervised fuzzy C_means algorithm. In 3rd International conference on information security and artificial intelligent (ISAI) (pp. 427-432).
- Shokouhifar, M., & Jalali, A. (2017). Optimized sugeno fuzzy clustering algorithm for wireless sensor networks. Engineering applications of artificial intelligence, 60, 16-25. [CrossRef]
- Shokouhifar, M. (2021). FH-ACO: Fuzzy heuristic-based ant colony optimization for joint virtual network function placement and routing. Applied Soft Computing, 107, 107401. [CrossRef]
- Behmanesh-Fard, N., Yazdanjouei, H., Shokouhifar, M., & Werner, F. (2023). Mathematical Circuit Root Simplification Using an Ensemble Heuristic–Metaheuristic Algorithm. Mathematics, 11(6), 1498. [CrossRef]
- Shokouhifar, M., Sohrabi, M., Rabbani, M., Molana, S. M. H., & Werner, F. (2023). Sustainable Phosphorus Fertilizer Supply Chain Management to Improve Crop Yield and P Use Efficiency Using an Ensemble Heuristic–Metaheuristic Optimization Algorithm. Agronomy, 13(2), 565. [CrossRef]
- Sohrabi, M., Zandieh, M., & Shokouhifar, M. (2023). Sustainable inventory management in blood banks considering health equity using a combined metaheuristic-based robust fuzzy stochastic programming. Socio-Economic Planning Sciences, 86, 101462. [CrossRef]
- Xie, W., Li, W., Zhang, S., Wang, L., Yang, J., & Zhao, D. (2022). A novel biomarker selection method combining graph neural network and gene relationships applied to microarray data. BMC bioinformatics, 23(1), 303. [CrossRef]
- Pearson, K. (1894). Contributions to the mathematical theory of evolution. Philosophical Transactions of the Royal Society of London. A, 185, 71-110.
- Mirjalili, S., Mirjalili, S. M., & Lewis, A. (2014). Grey wolf optimizer. Advances in engineering software, 69, 46-61.
- Grover, P., Chaturvedi, K., Zi, X., Saxena, A., Prakash, S., Jan, T., & Prasad, M. (2023). Ensemble Transfer Learning for Distinguishing Cognitively Normal and Mild Cognitive Impairment Patients Using MRI. Algorithms, 16(8), 377. [CrossRef]
Figure 1.
Maximum heart rate versus age.
Figure 1.
Maximum heart rate versus age.
Figure 2.
Distribution of all features.
Figure 2.
Distribution of all features.
Figure 3.
Representation of a feasible solution.
Figure 3.
Representation of a feasible solution.
Figure 4.
The proposed ensemble learning model.
Figure 4.
The proposed ensemble learning model.
Figure 5.
Confusion matrix of the proposed EHMFFL algorithm on Cleveland and Statlog datasets.
Figure 5.
Confusion matrix of the proposed EHMFFL algorithm on Cleveland and Statlog datasets.
Figure 6.
Comparison of the results of different methods on Cleveland dataset in terms of Precision, Recall, and Accuracy.
Figure 6.
Comparison of the results of different methods on Cleveland dataset in terms of Precision, Recall, and Accuracy.
Figure 7.
Comparison of the results of different methods on Statlog dataset in terms of Precision, Recall, and Accuracy.
Figure 7.
Comparison of the results of different methods on Statlog dataset in terms of Precision, Recall, and Accuracy.
Figure 8.
CHM of the proposed EHMFFL algorithm for the Cleveland dataset.
Figure 8.
CHM of the proposed EHMFFL algorithm for the Cleveland dataset.
Figure 9.
CHM of the proposed EHMFFL algorithm for the Statlog dataset.
Figure 9.
CHM of the proposed EHMFFL algorithm for the Statlog dataset.
Figure 10.
Analyzing the ROC curves of the different techniques for the Cleveland dataset.
Figure 10.
Analyzing the ROC curves of the different techniques for the Cleveland dataset.
Figure 11.
Analyzing the ROC curves of the different techniques for the Statlog dataset.
Figure 11.
Analyzing the ROC curves of the different techniques for the Statlog dataset.
Figure 12.
Figure 12. Comparison of the results of the EHMFFL algorithm with the existing techniques for the Cleveland dataset.
Figure 12.
Figure 12. Comparison of the results of the EHMFFL algorithm with the existing techniques for the Cleveland dataset.
Figure 13.
Comparison of the results of the EHMFFL algorithm with the existing techniques for the Statlog dataset.
Figure 13.
Comparison of the results of the EHMFFL algorithm with the existing techniques for the Statlog dataset.
Table 1.
Description of attributes in the datasets.
Table 1.
Description of attributes in the datasets.
| Feature |
Description |
Type |
Values |
| Age |
Age of the patients |
Numeric |
Years |
| Sex |
Gender of patients |
Categorial |
M, F |
| Ca |
Number of major vessels |
Categorial |
0-4 |
| Chol |
Serum cholesterol |
Numeric |
mg/dl |
| Exang |
Exercise induced angina |
Categorial |
Yes=1, No=0 |
| Cp |
Chest pain type |
Categorial |
Male=1, Female=0 |
| Oldpeak |
ST depression induced by exercise relative to rest |
Numeric |
0-6.2 |
| Fbs |
Fasting blood sugar |
Categorial |
mg/dl |
| Restecg |
Resting electrocardiographic |
Categorial |
0, 1, 2 |
| Thal |
Normal; Fixed defect; Reversible defect |
Categorial |
0, 1, 2, 3 |
| Thalach |
Maximum heart rate achieved |
Numeric |
71-202 |
| Slope |
the slope of the peak exercise ST segment |
Categorial |
0, 1, 2 |
| Trestbps |
Resting blood pressure |
Numeric |
94-200 |
| Num |
Heart disease status |
Categorial |
Yes/No |
Table 2.
Parameter settings for GWO.
Table 2.
Parameter settings for GWO.
| Parameter |
Value |
| Number of grey wolves (PopSize) |
30 |
| Number of iterations (MaxIter) |
100 |
| Search domain |
{0,1} |
| Solution dimension |
No. Features |
Table 3.
Comparison of the EHMFFL algorithm with existing methods on Cleveland dataset.
Table 3.
Comparison of the EHMFFL algorithm with existing methods on Cleveland dataset.
| Algorithms |
Accuracy |
Precision |
Recall |
Specificity |
F1-score |
| LR |
85.2 |
90.3 |
82.4 |
88.9 |
86.2 |
| DT |
82 |
84.8 |
82.4 |
81.5 |
83.6 |
| RF |
90.2 |
96.7 |
85.3 |
96.3 |
90.6 |
| NB |
85.2 |
87.9 |
85.3 |
85.2 |
86.6 |
| SVM |
86.9 |
88.2 |
88.2 |
85.2 |
88.2 |
| KNN |
83.6 |
87.5 |
82.4 |
85.2 |
84.8 |
| XGBoost |
88.5 |
96.6 |
82.4 |
96.3 |
88.9 |
| EHMFFL (Proposed) |
91.8 |
91.4 |
94.1 |
88.9 |
92.8 |
Table 4.
Comparison of the EHMFFL algorithm with existing methods on Statlog dataset.
Table 4.
Comparison of the EHMFFL algorithm with existing methods on Statlog dataset.
| Algorithms |
Accuracy |
Precision |
Recall |
Specificity |
F1-score |
| LR |
79.6 |
80 |
82.8 |
76 |
81.4 |
| DT |
81.5 |
85.2 |
79.3 |
84 |
82.1 |
| RF |
84.4 |
86.2 |
85.5 |
76 |
87.4 |
| NB |
77.8 |
79.3 |
79.3 |
76 |
79.3 |
| SVM |
83.3 |
81.3 |
89.7 |
76 |
85.2 |
| KNN |
80.8 |
84.5 |
78.9 |
83 |
81.6 |
| XGBoost |
85.2 |
88.9 |
82.8 |
88 |
85.7 |
| EHMFFL (Proposed) |
88.9 |
92.6 |
86.2 |
92 |
89.3 |
|
Disclaimer/Publisher’s Note: The statements, opinions and data contained in all publications are solely those of the individual author(s) and contributor(s) and not of MDPI and/or the editor(s). MDPI and/or the editor(s) disclaim responsibility for any injury to people or property resulting from any ideas, methods, instructions or products referred to in the content. |
© 2023 by the authors. Licensee MDPI, Basel, Switzerland. This article is an open access article distributed under the terms and conditions of the Creative Commons Attribution (CC BY) license (http://creativecommons.org/licenses/by/4.0/).
