1. Introduction
Atomic clocks, as the most accurate scientific instruments for time-frequency measurement, have provided crucial reference values for scientific research such as the validation of the general theory of relativity and the measurement of the fine-structure constant.[
1] Due to the chaotic thermal motion of atoms and molecules at ambient temperature, the intense collisions between atoms pose a significant barrier to the improvement of atomic clock performance indicators. The advancement of laser cooling technology has brought about a theoretical breakthrough in improving the accuracy of atomic clocks. By utilizing laser cooling technology, atomic gas is prepared into ultra-cold atomic cloud near absolute zero (
level). The frequency stability
of atomic clocks can be described as:
where
represents the center frequency of the atomic transition spectrum,
is the number of atoms,
represents the traversal time of atoms in the microwave cavity, and
is the total measurement time.[
2] By cooling atoms with lasers, the Doppler effect of atoms can be greatly reduced, and the interference time of atoms with microwaves can be increased, thereby theoretically realizing a high-precision cold atomic clock. Steven Chu's group completed the first demonstration experiment of a Zacharias-type Cs atomic fountain in 1991,[
3] with an atomic temperature of 5
, a Ramsey fringe linewidth of 2Hz, which is two orders of magnitude smaller than that of a beam-type thermal atom frequency standard.
In response to the requirements for cold atomic clocks in space applications such as satellite navigation to be small in size, light in weight, and low in power consumption, various countries have initiated research on miniaturized cold atomic clocks. In 2011, the University of São Paulo (USP) in Brazil proposed an integrated atomic interference scheme within a cavity, where atoms achieve three-dimensional cooling inside a cylindrical microwave cavity and achieve Ramsey interference in a very short free-fall time. The physical structure is greatly reduced, and the short-term frequency stability reached 5×10
-13/τ
-1/2 in 2014.[
4,
5] In 2016, the Shanghai Institute of Optics and Mechanics in China developed an isotropic integrating sphere cold atomic clock using a cylindrical resonator, with a frequency stability of 3.0×10⁻¹³/τ
-1/2.[
6]
This paper demonstrates research on the Ramsey interference and spectral line locking techniques of rubidium-87 cold atoms. Using a three-dimensional magneto-optical trap, the atoms are cooled and trapped. During the free fall of the cold atomic cloud, a microwave antenna interacts with the atoms to induce Ramsey interference, causing the atoms to undergo two π/2 interactions.[
7] Through virtual instrument technology, microwave frequency scanning is designed to obtain the Ramsey interference fringes of rubidium-87 atoms and to lock the central frequency of Ramsey fringes with clock servo.
2. System Composition and Principles
2.1. Experimental Setup
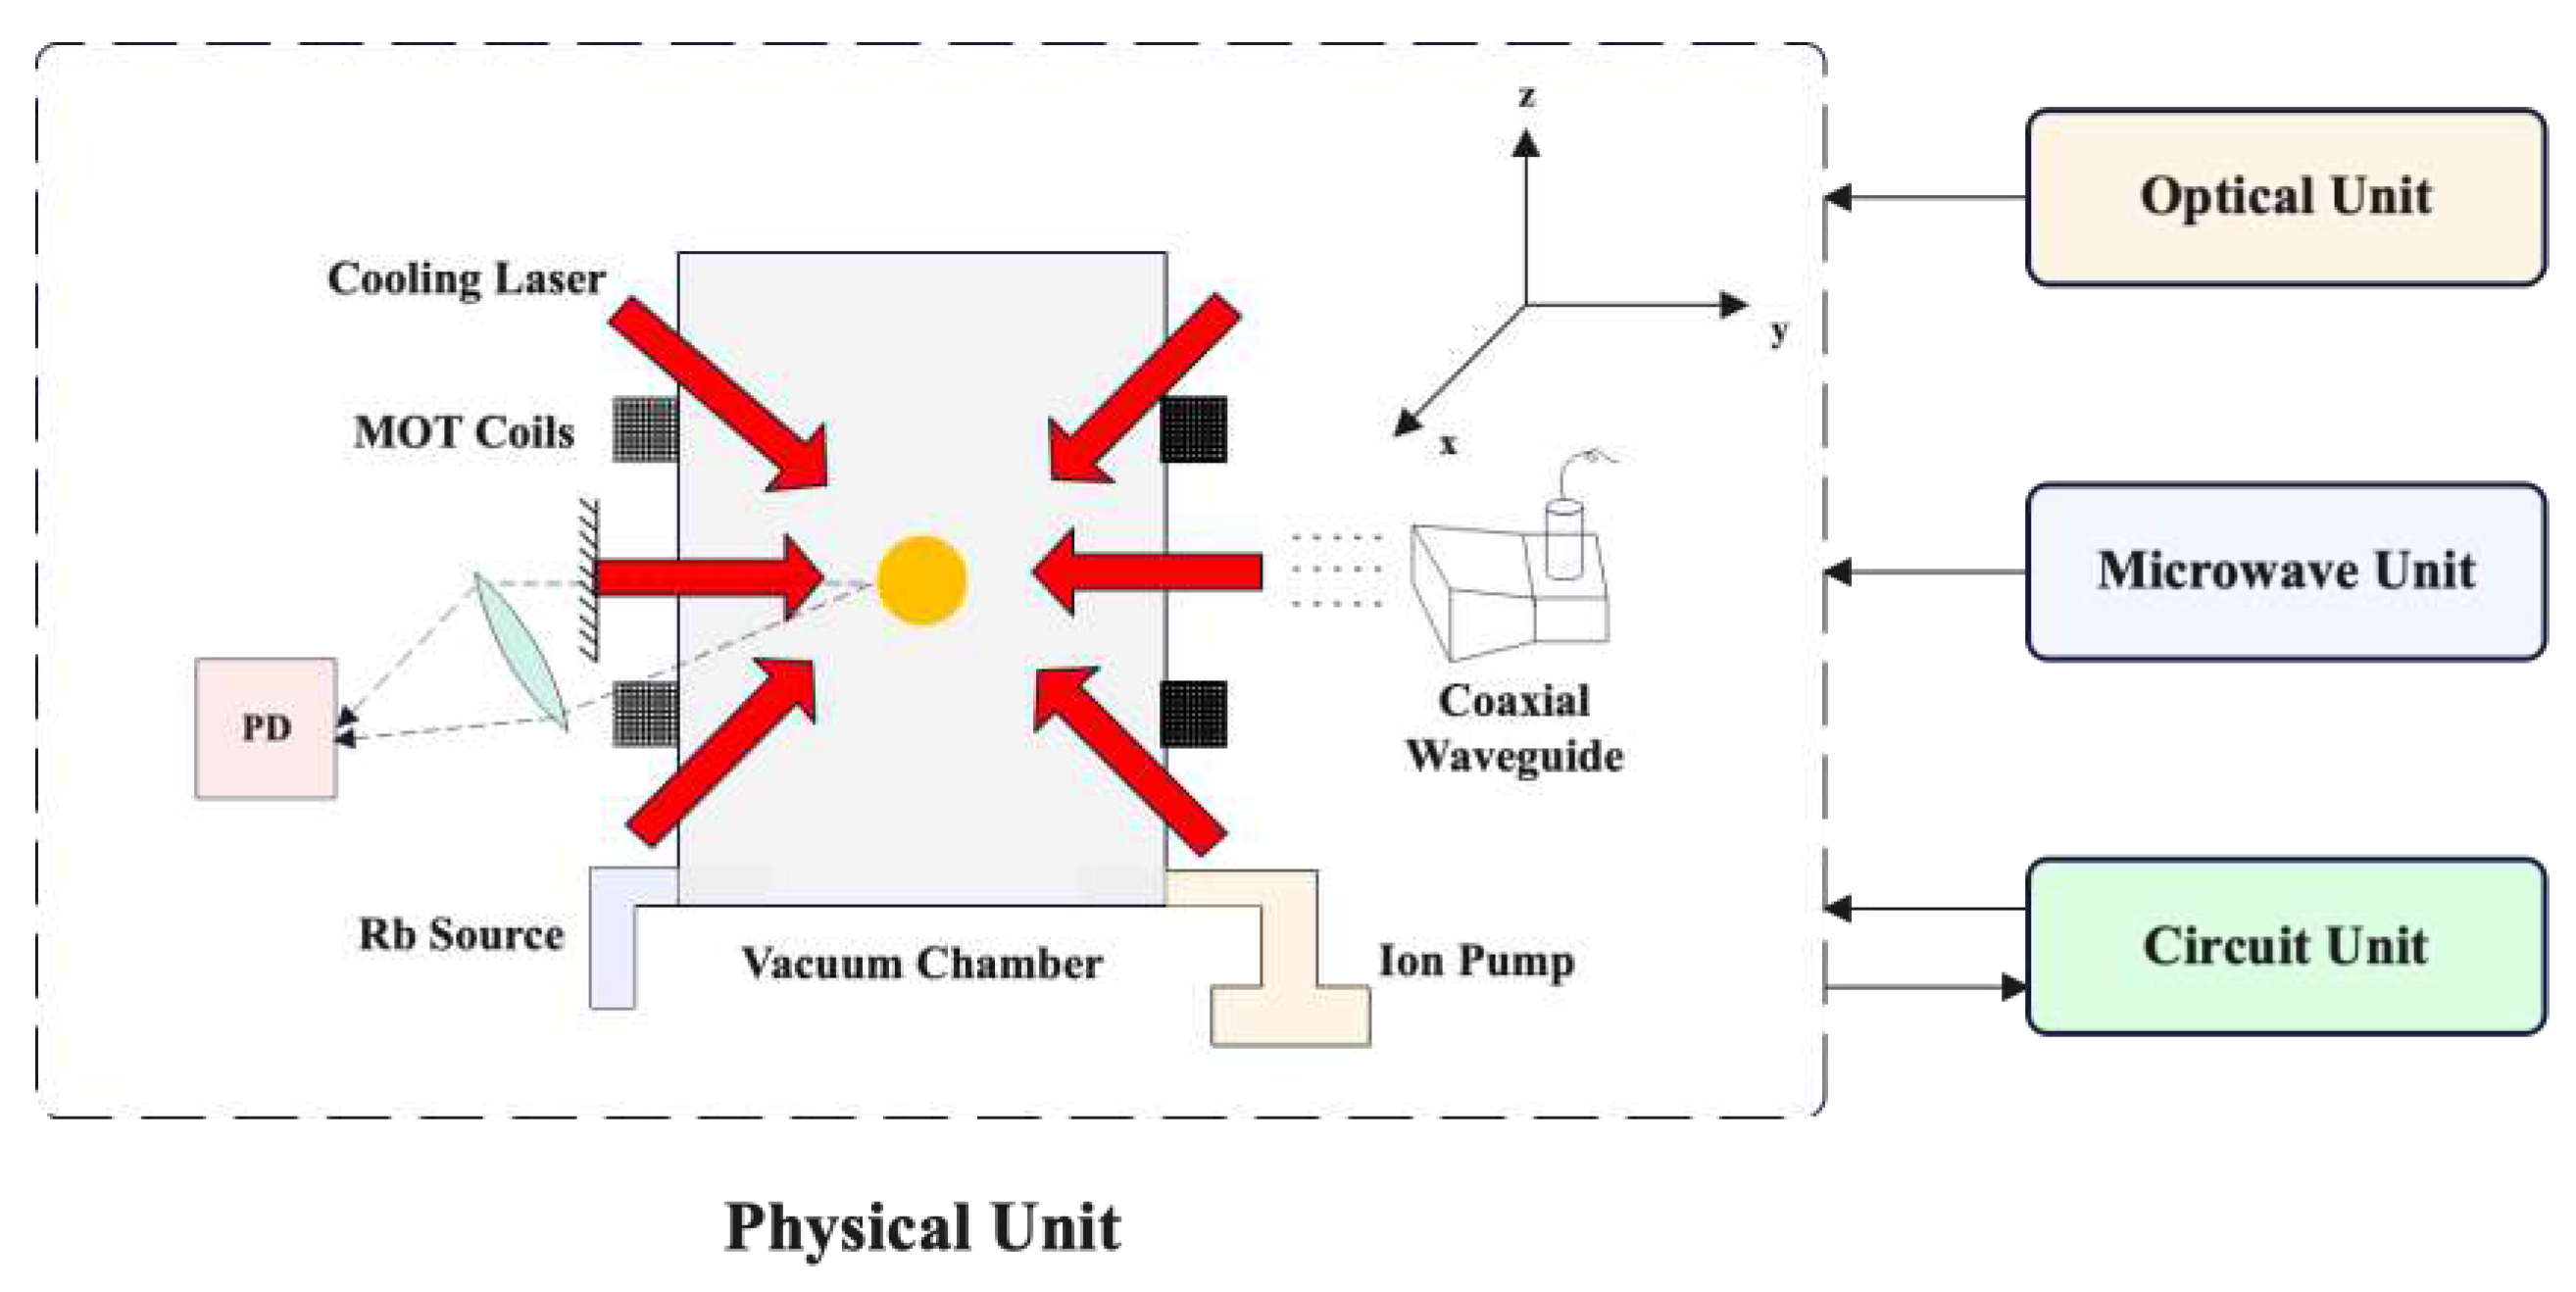
The cold atom interference system mainly consists of an optical unit, a microwave unit, a circuit unit, and a physical unit, as shown in
Figure 1. The optical unit provides the cooling laser, repumping laser, and detecting laser required for the cooling, trapping, and detection of rubidium-87 atoms. The microwave unit provides the frequency required for the transition of
87Rb atoms between 5
2S
1/2|F=1, mF=0> and 5
2S
1/2|F=2, mF=0>. The circuit unit provides power supply, sequential control, and data acquisition for the entire system. In the physical unit, the cooling laser forms counter-propagation in three directions within the vacuum chamber, leading to a three-dimensional magneto-optical trap (MOT) together with the anti-Helmholtz coils, trapping the atoms inside the vacuum chamber.[
8,
9]
2.2. Laser Frequency Design
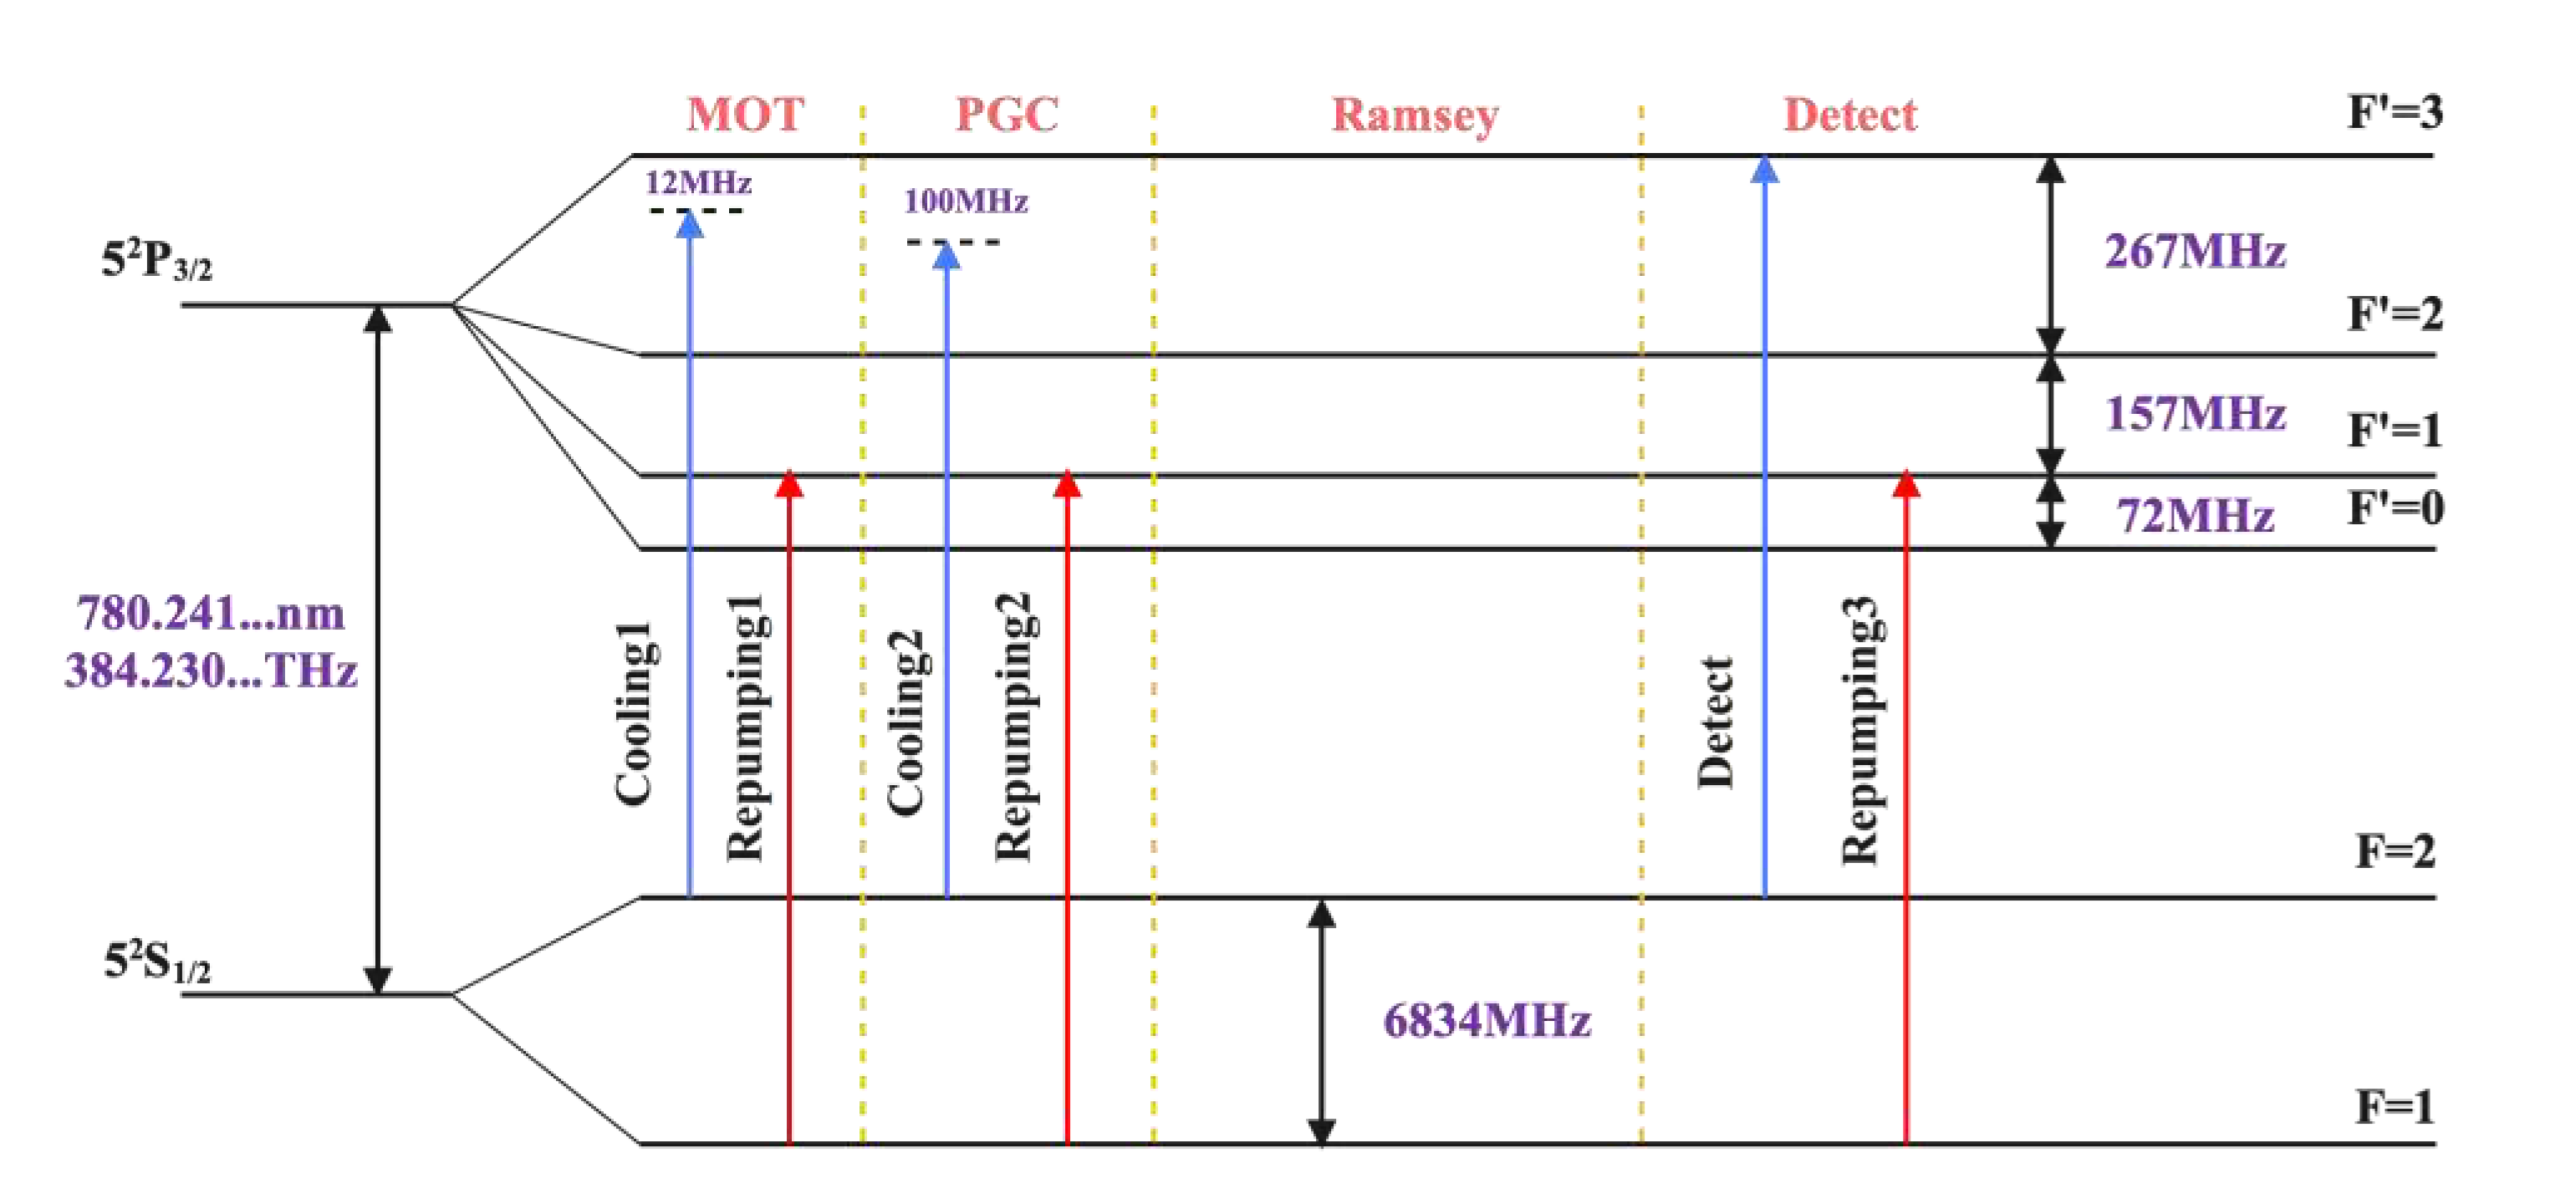
The frequency design and main workflow of the cold atom interference system are shown in
Figure 2. Initially,
87Rb evaporates from the rubidium source, after which is cooled in the MOT. Subsequently, the cold atom cloud undergoes transitions under microwave interaction. Finally, a two-level fluorescence detection is performed on the atoms after the transition. Laser frequencies involved in such process include:
(i) Cooling Laser: The cooling laser is frequency-locked through an Acousto-Optic Modulator (AOM) at a red detuned position from the transition frequency of
87Rb atom's D2 line 5
2S
1/2|F=2> to 5
2P
3/2|F=3>, typically between 12MHz and 36MHz.[
10]
(ii) Repumping Laser: This is locked to the transition frequency of 5
2S
1/2|F=1> to 5
2P
3/2|F=2>.[
11] It serves to pump atoms that have spontaneously radiated to the ground state F=1 level back to the excited F=2 level, thereby enhancing the utilization efficiency of the cold atoms.
(iii) Detecting Laser: Produced by branching from the cooling light laser, it is frequency-locked using an AOM to the transition frequency of 52S1/2|F=2> to 52P3/2|F=3>. Consequently, by monitoring the fluorescence signal generated from the spontaneous radiation of the F=3 state atoms, the population of atoms in the F=2 state can be measured.
Upon switching off the MOT, the trapped cold atomic cluster will free fall within the vacuum chamber, after which the atoms transit from the state 52S1/2|F=1> to the state 52P3/2|F=2> under interactions between atoms and microwave. The fluorescence detector, by detecting the fluorescent power produced from the atoms' spontaneous radiation, completes the population detection of atoms in the 52S1/2|F=1> and 52P3/2|F=2> states.
2.3. Optical Path Design
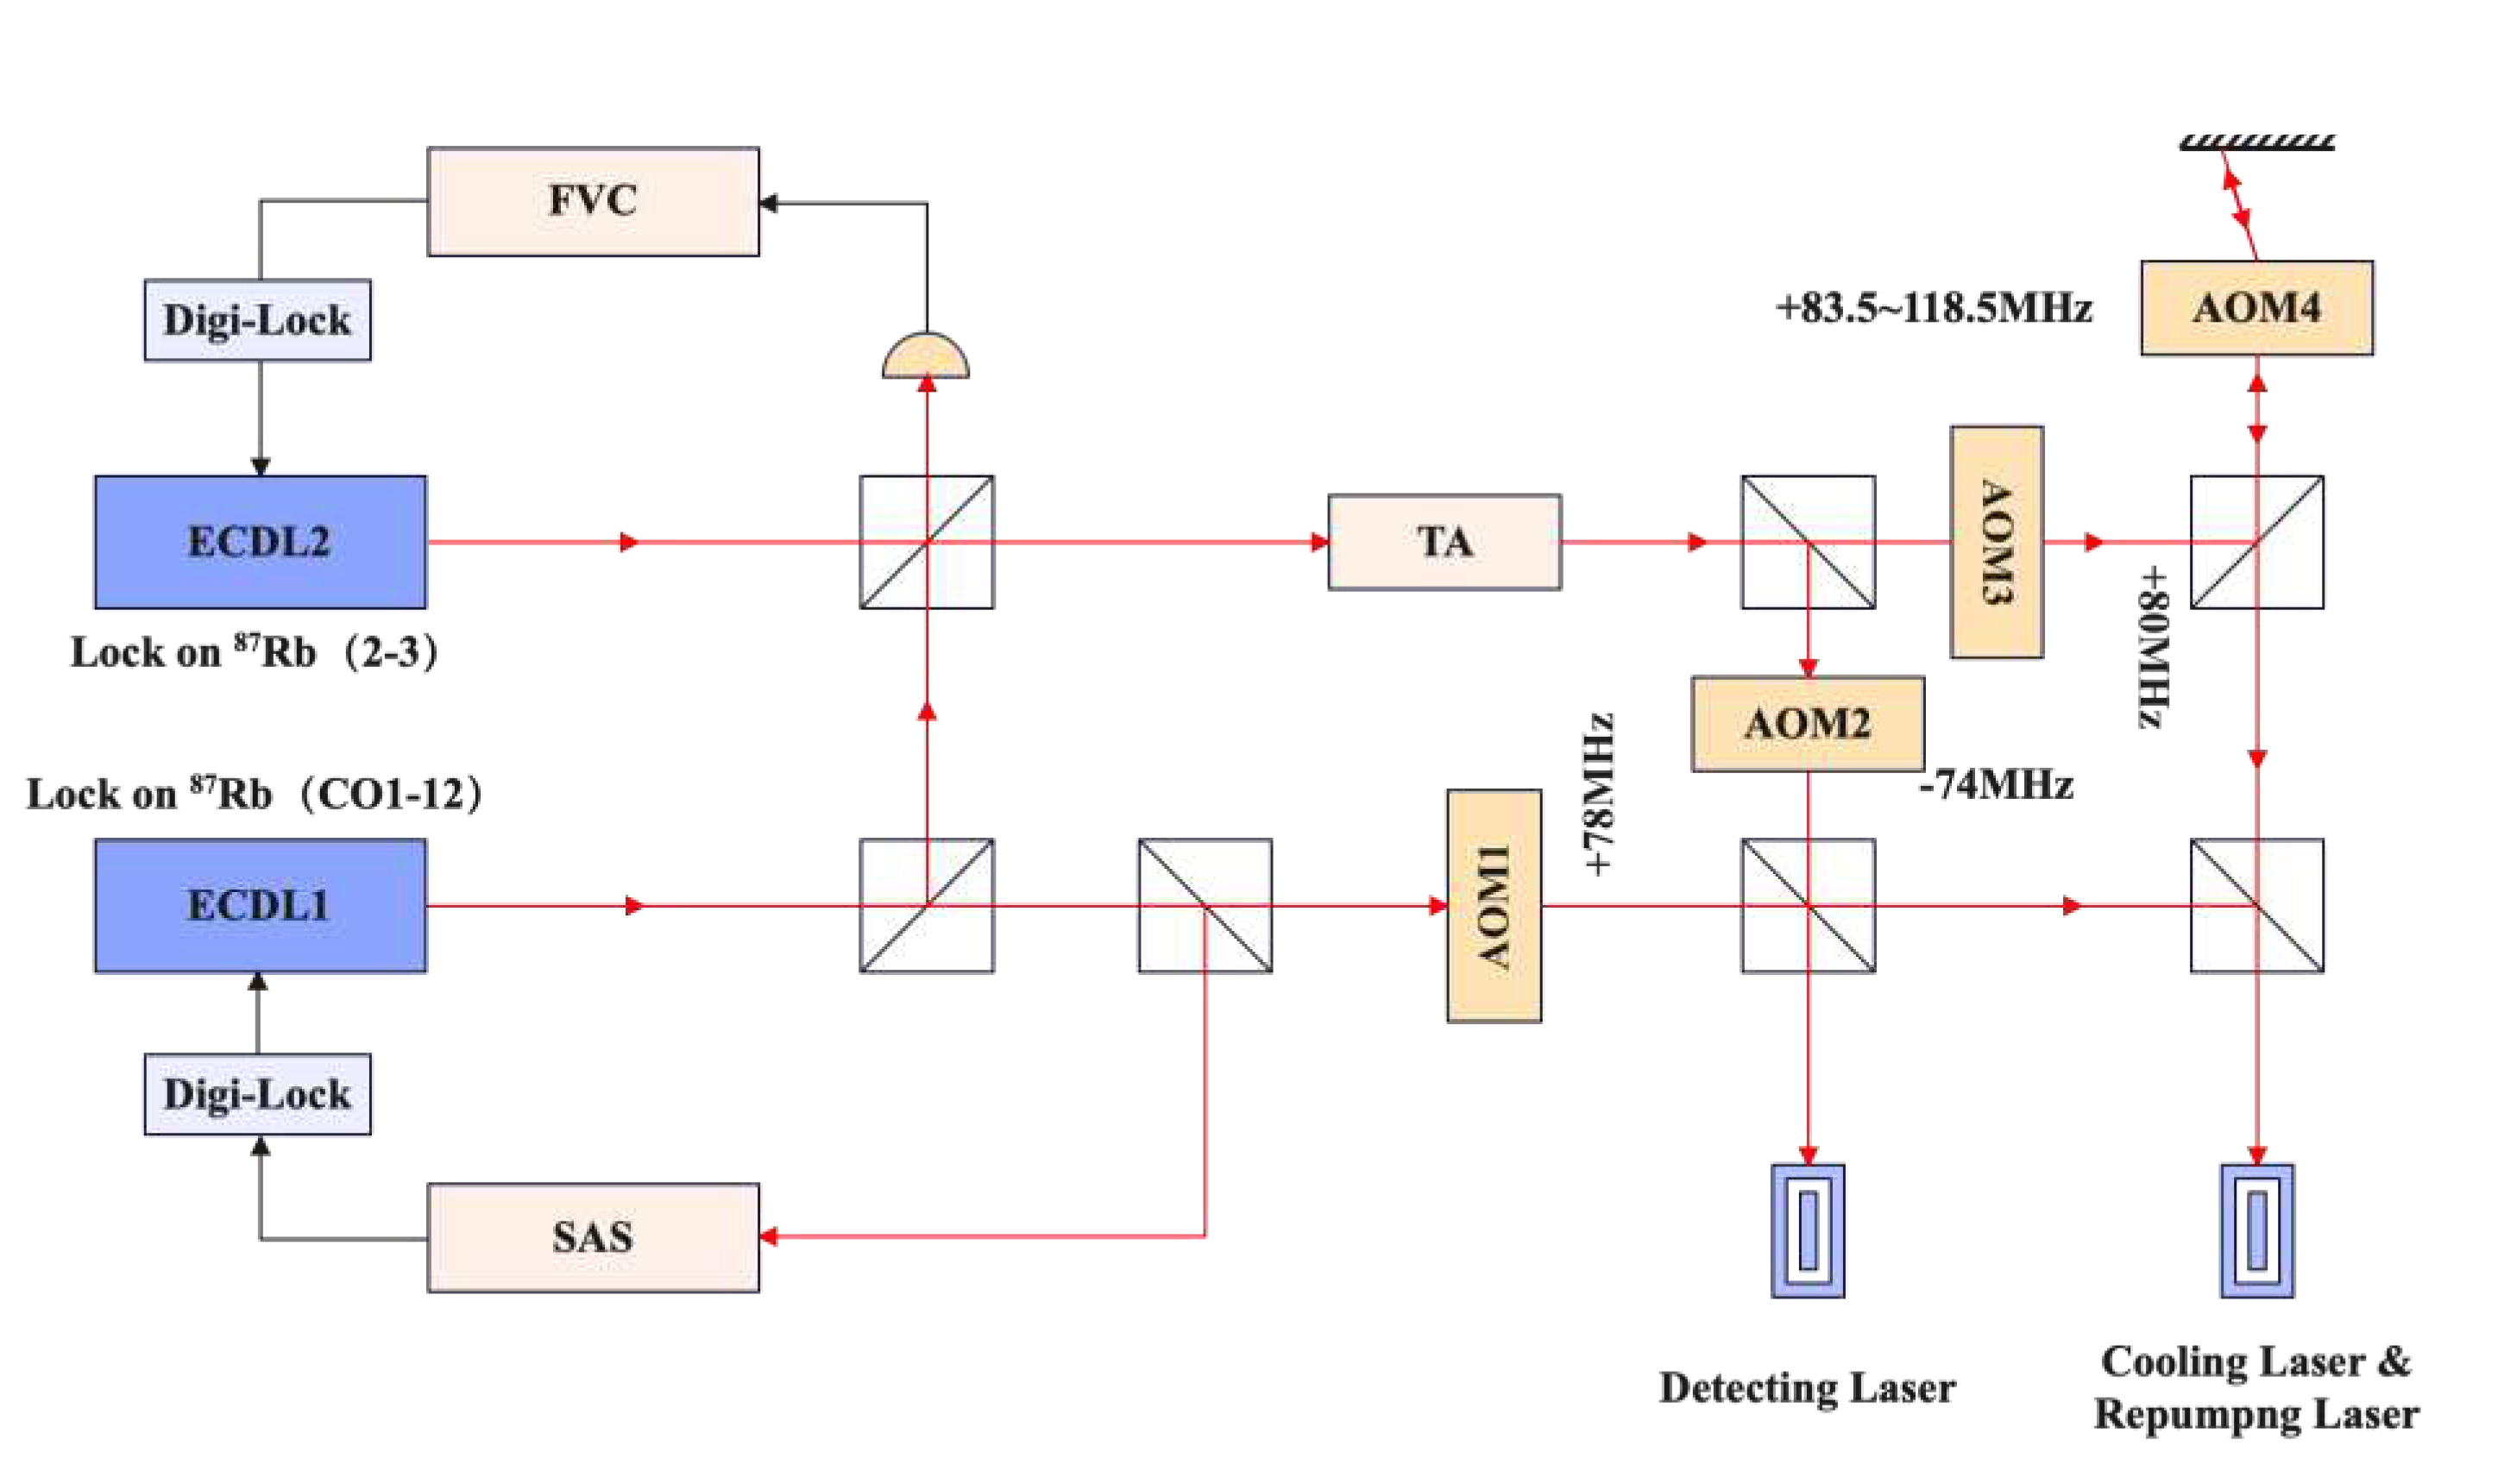
The optical path design for the
87Rb cold atom system is depicted in
Figure 3. This experiment utilizes two DLpro lasers manufactured by TOPTICA, designated as ECDL1 and ECDL2. Specifically, the laser frequency of ECDL1 is stabilized by using a saturated absorption spectroscopy technique. The underlying principle involves leveraging two counter-propagating laser beams (one strong and one weak) inside a rubidium cell to obtain a saturated absorption signal (SAS). The frequency of ECDL1 is then locked by exploiting the spectral hole-burning effect, establishing a reference frequency for the system. [
12] After stabilization, the ECDL1 and ECDL2 are superimposed to generate a beat frequency. This beat frequency signal is transformed into a voltage signal via a frequency-to-voltage converter (FVC) module and manually locked using a master computer system.
Subsequent to stabilization, the emitted light from the ECDL2 serves as seed light, which is further amplified in power via a Tapered Amplifier (TA).[
13] Employing a combination of a half-wave plate and a Polarizing Beam Splitter (PBS), the beam is split into two paths. One path serves as the detecting laser for rubidium atoms, while the other, using another half-wave plate and PBS combination, further divides the beam into upper cooling laser and lower cooling light. Following a secondary frequency shift accomplished through an AOM4 and mirror assembly, these beams are used to form a three-dimensional optical trap. During the actual cooling process, a fraction of the atoms may return to the 5
2S
1/2|F=1> state due to the spontaneous radiation, thus ceasing their participation in cooling. To enhance atomic utilization, ECDL2 is employed to pump these atoms back to the 5
2S
1/2|F=2> state.
2.4. Sequential Control Design
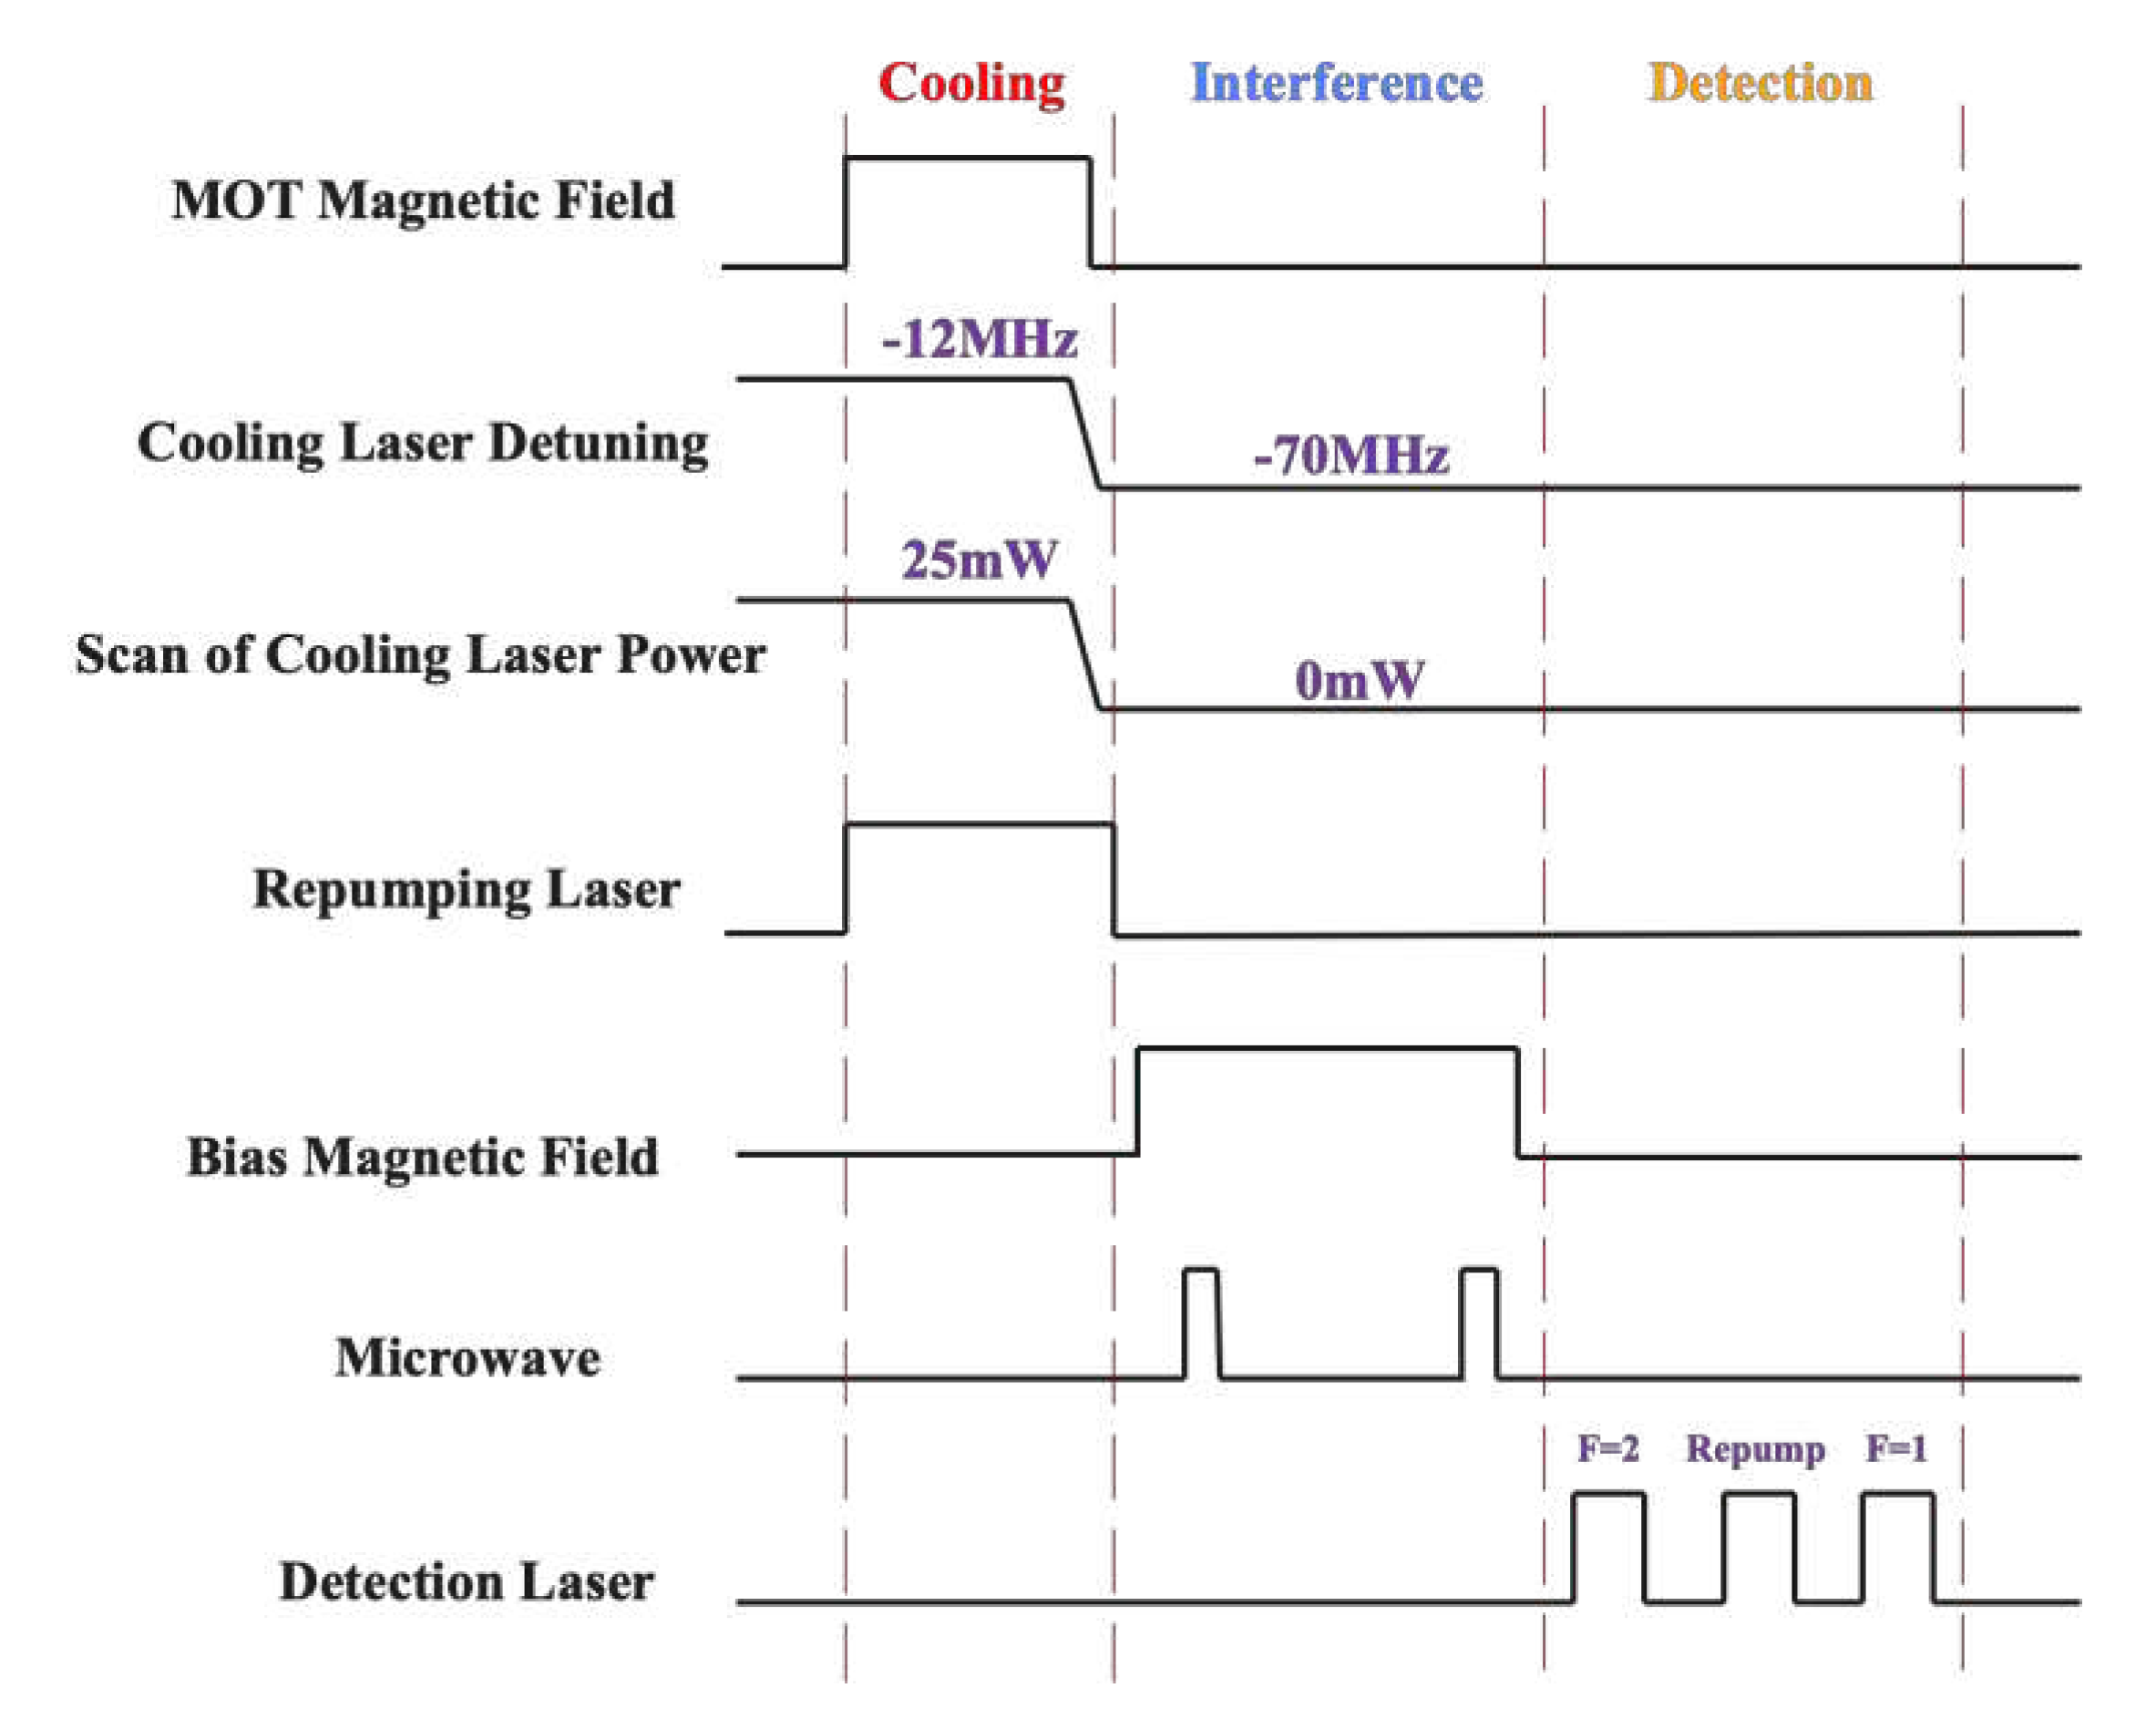
In this experiment, the USB-6341 data acquisition card produced by NI (National Instruments) is employed to trigger input signals for optical switches, C-field controllers, oscillators, and microwave signal generators on the optical platform. Furthermore, a sequential control program is developed on a virtual instrument platform, facilitating millisecond-level sequence control. The process of this sequential control is illustrated in
Figure 4.
Based on the established sequential control in
Figure 4, the time of flying (TOF) signals acquired via the data acquisition card are processed by the master computer. The acquisition process is as follows: TOF signals generated by the ground state F=2 (State 2) atoms and ground state F=1 (State 1) atoms are captured by the USB-6341 data acquisition card. Communication is established between virtual instrument platform and USB-6341. Through the configuration of the sampling clock, clock trigger, and sampling method, real-time acquisition of TOF signals is realized. Specifically, the parameters for the sampling clock are set as: number of samples
and sampling frequency
; the acquisition method is set as “Analog 1D waveform (N channels, N samples)”. Subsequently, using the platform to control the frequency output of the microwave module, interference between falling atoms and the microwave is facilitated. The amplitude of the acquired interference signal is then subtracted from the baseline. The resulting values, V
1 and V
2, respectively reflect the population numbers of State 1 and State 2 atoms. Finally, the Ramsey transition signal, which represents the transition probability, is calculated using the formula (2).
3. Experiment and Data Analysis
3.1. Scan of Ramsey Interference Fringes
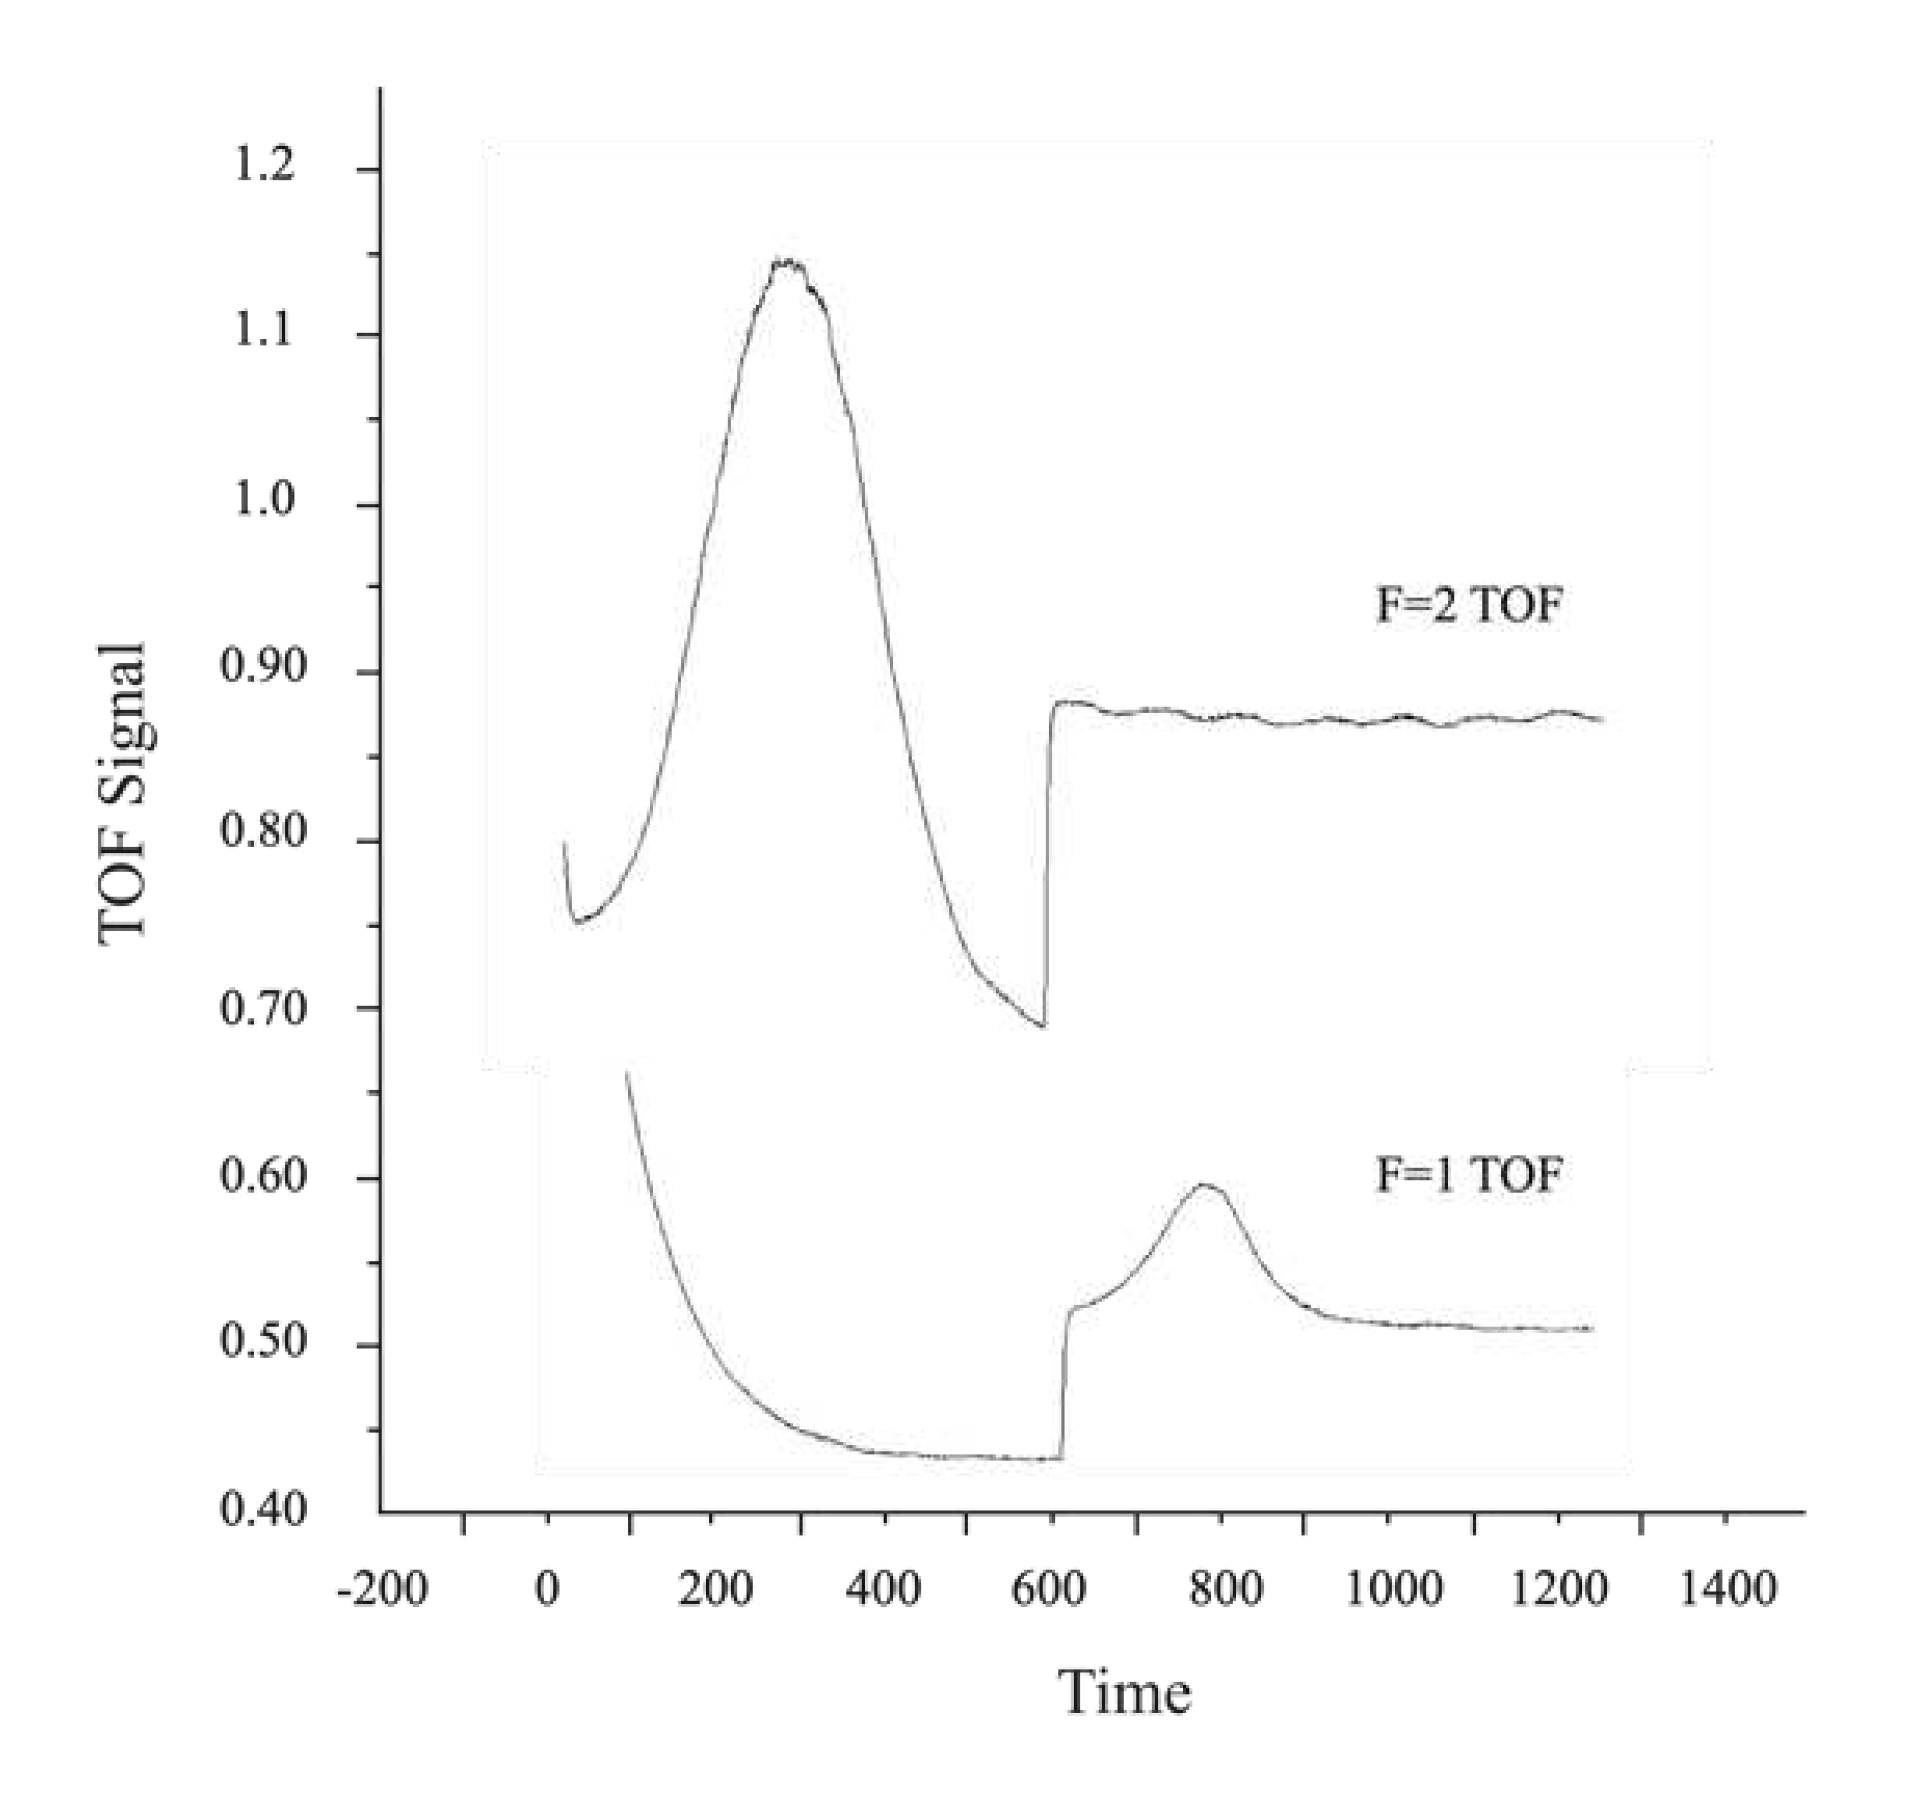
The TOF signals of 52S1/2|F=1> state and 52S1/2|F=2> state atoms obtained following the cold atom microwave interference sequence in
Figure 4 are shown in
Figure 5.
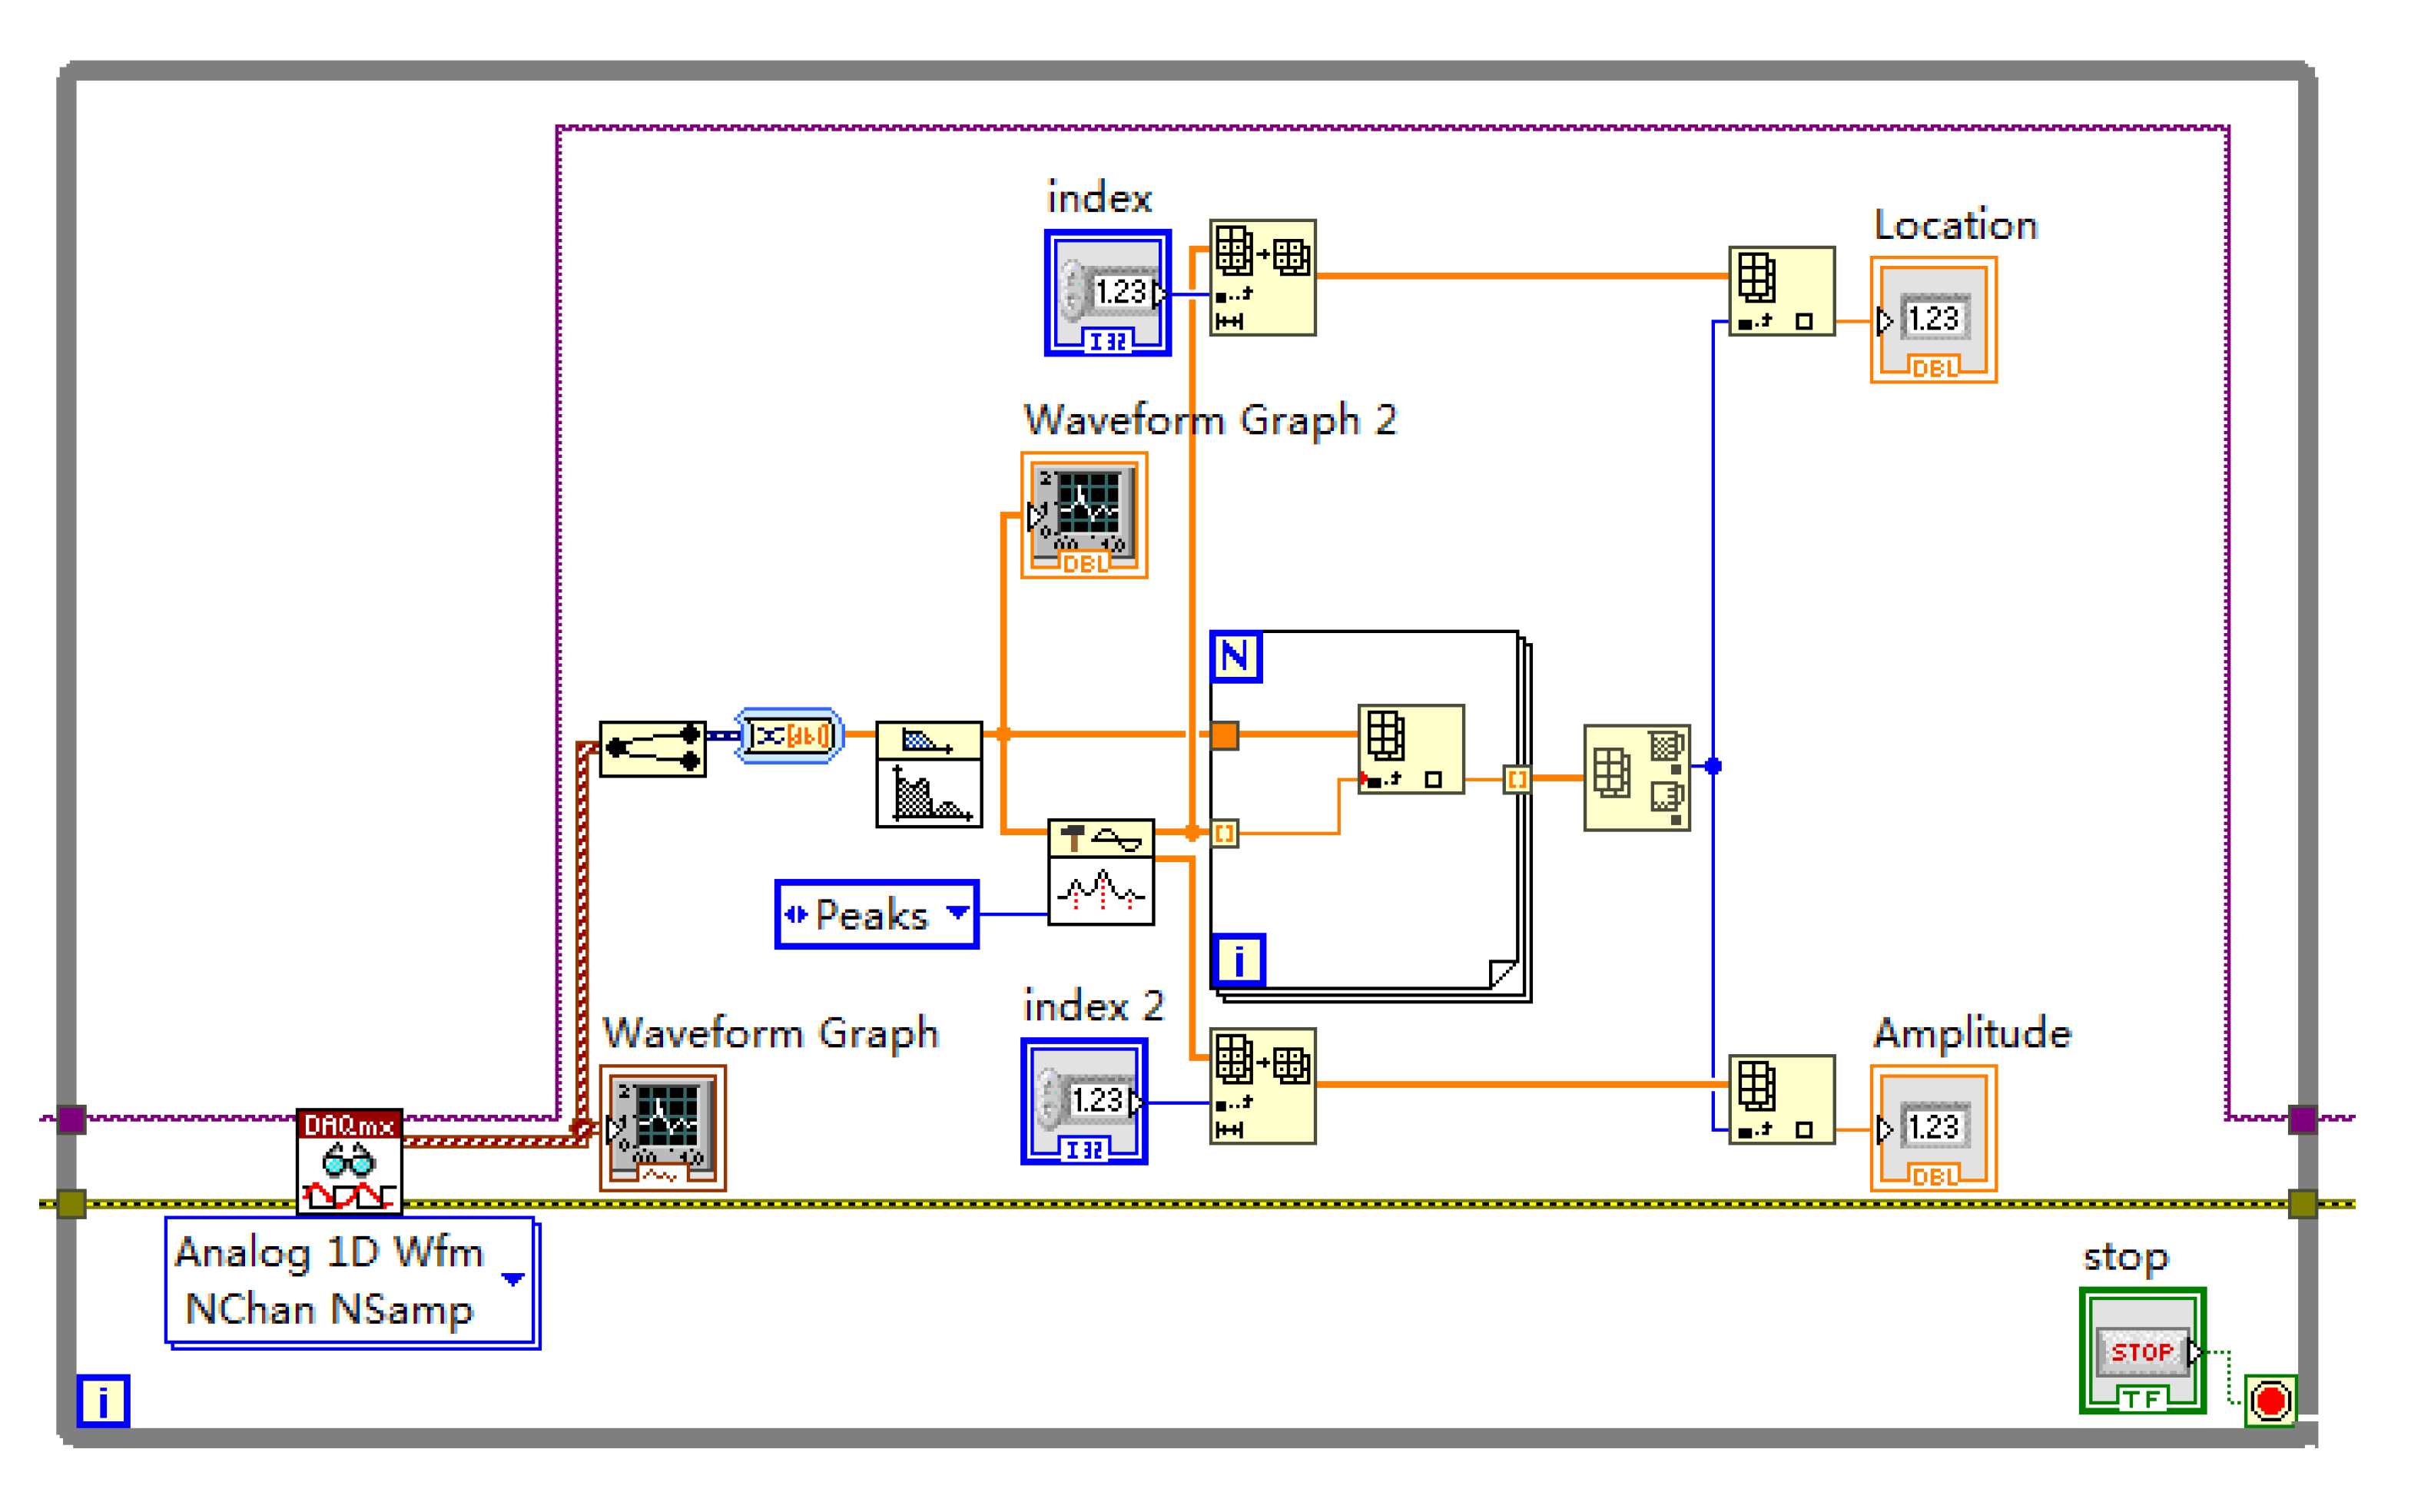
During the experiment, due to periodic fluctuations in the number of atoms in State 1 and State 2, TOF signals also exhibit periodic variations. Hence, using fixed integration parameters does not yield precise Ramsey interference probability signal values. For this reason, a peak tracking algorithm was designed in virtual instrument platform. The main principle of this algorithm involves fitting the TOF signals based on the Lorentzian line shape. Through real-time detection of extreme values in the TOF signal, the integration interval of the TOF signal will vary according to the movement of these extreme values, thereby allowing dynamic integration of the TOF signal. The design of the peak detection based on the LabVIEW platform is shown in
Figure 6.
After obtaining the single-point Ramsey signal, a 'While' loop can be designed to sweep the frequency of the microwave module, thereby capturing the Ramsey fringes. The process is as follows: Initially, parameters such as the starting frequency
, ending frequency
, and step size
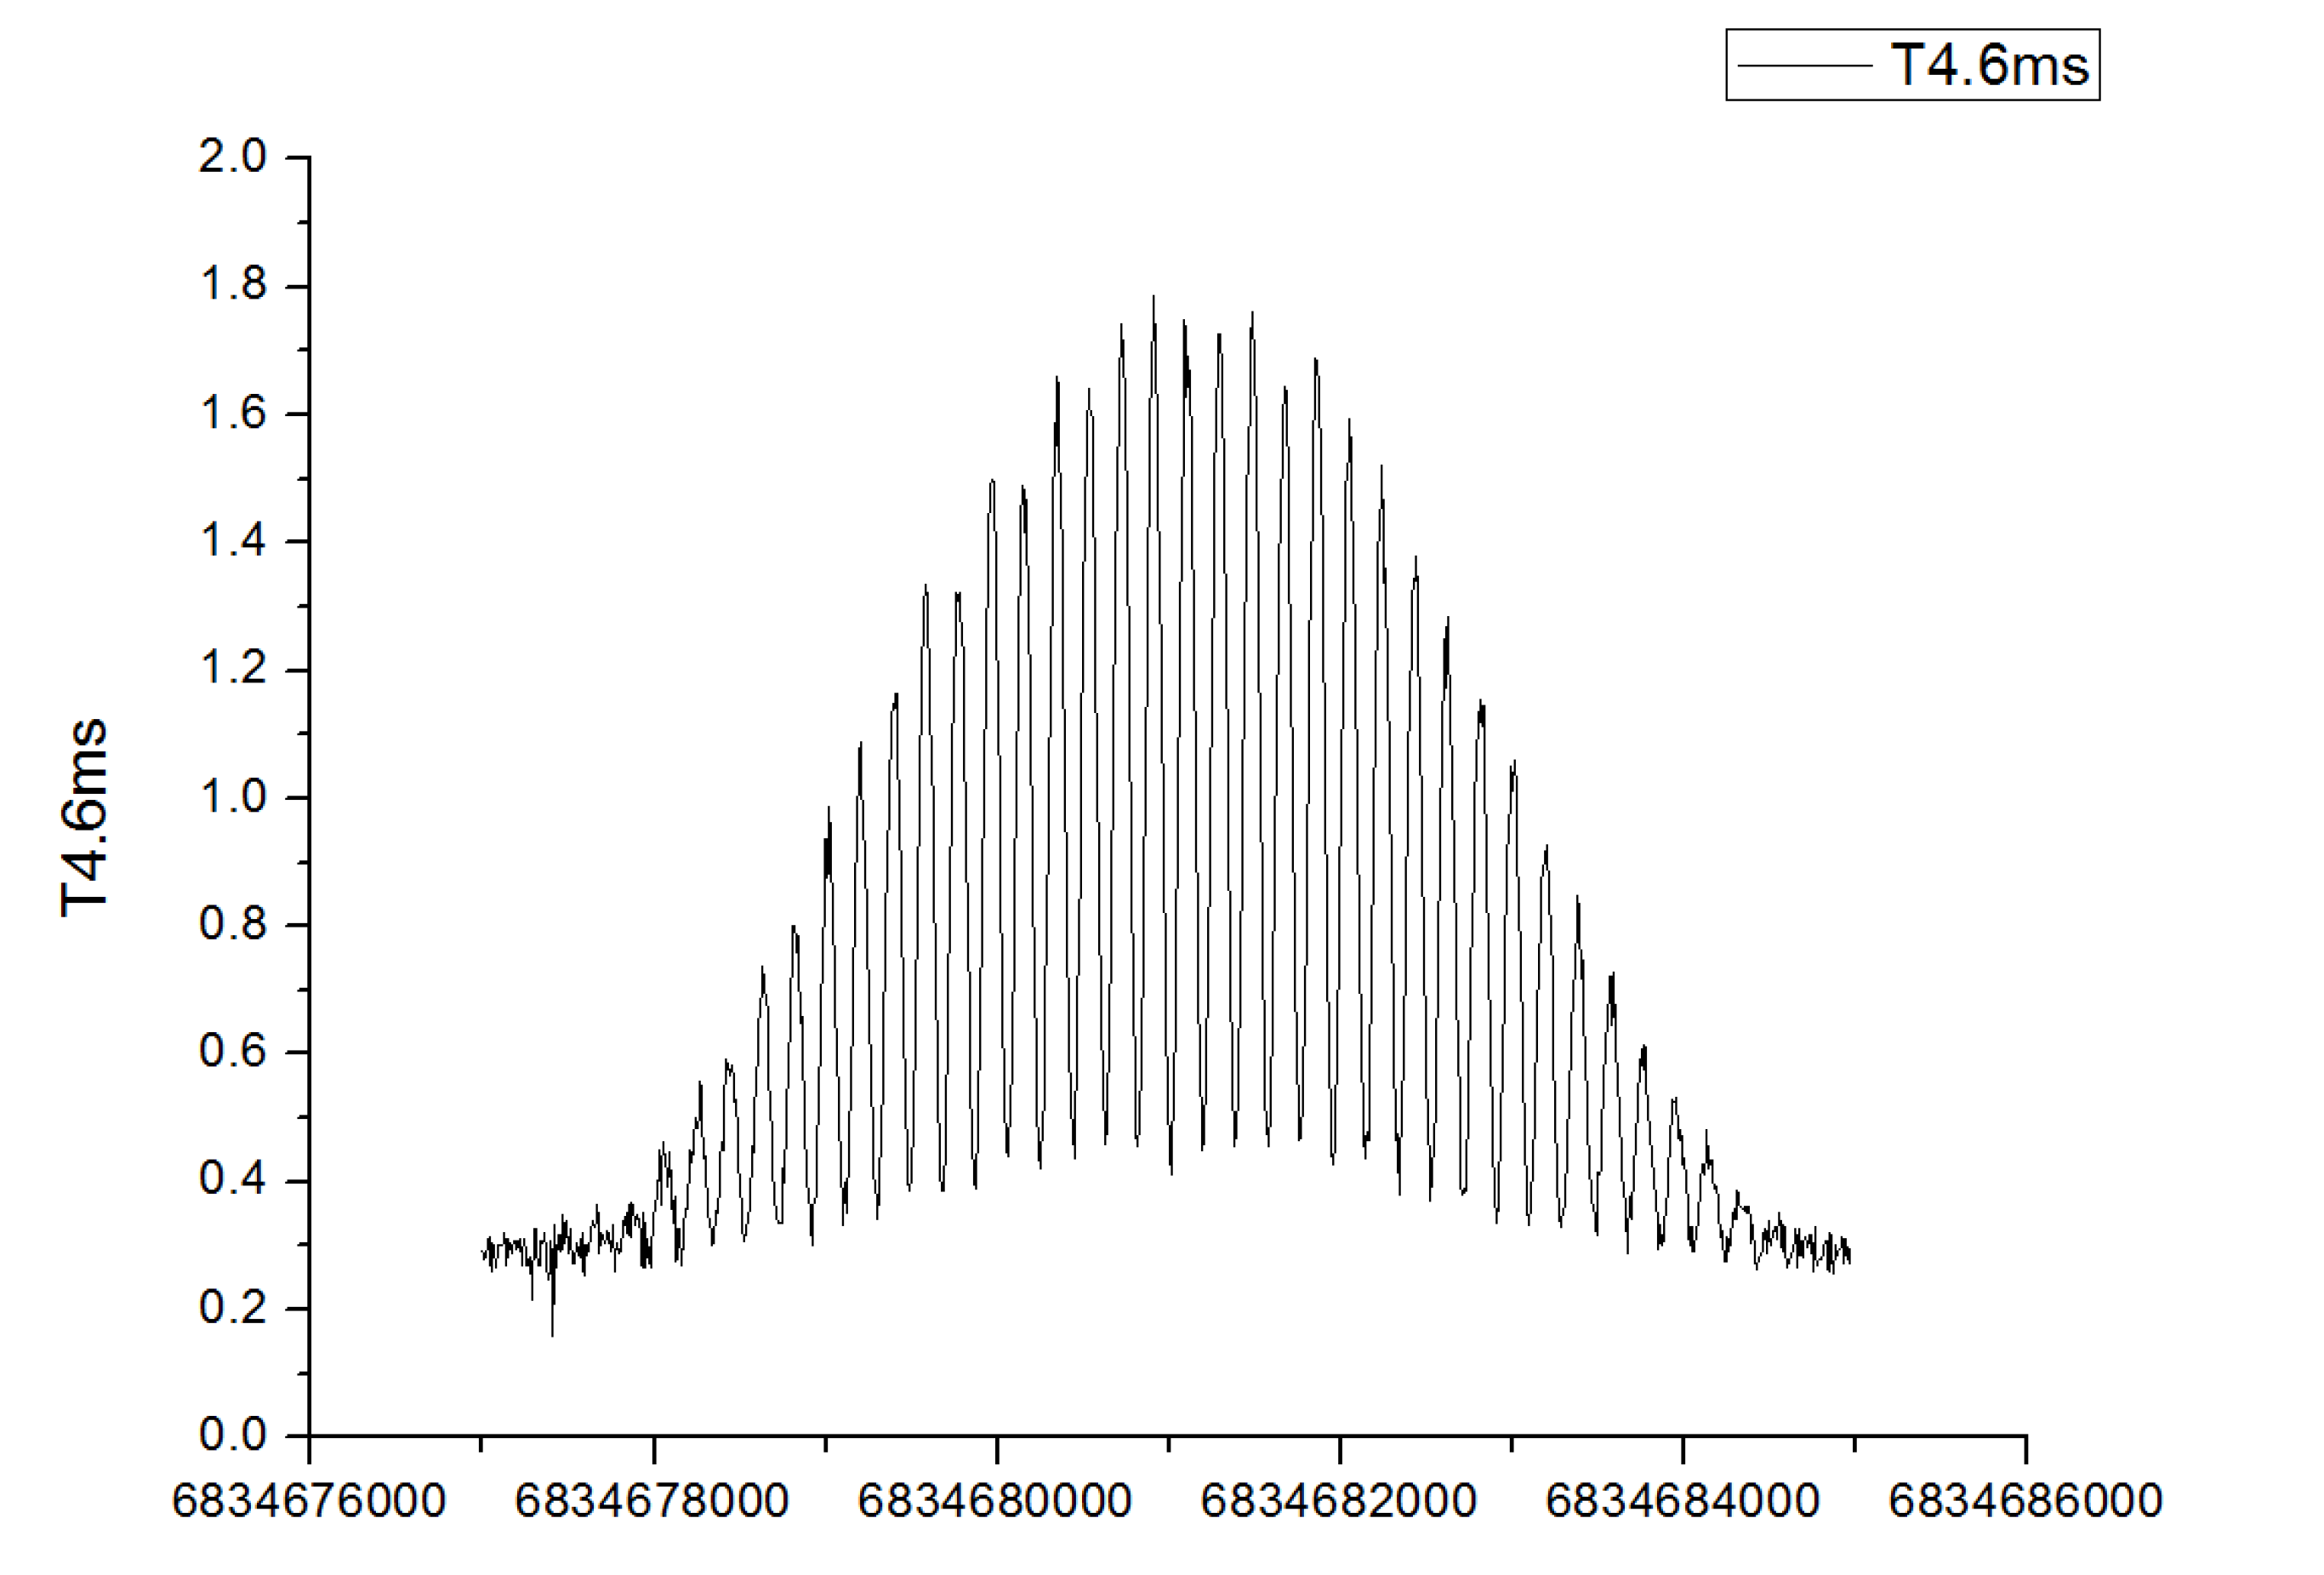
are set. By controlling the microwave module to enter scan mode through the 'While' loop, the TOF signal is continuously captured. Using the single-point Ramsey signal algorithm, the scanning of Ramsey fringes is realized. Subsequently, by controlling the descent height of the atoms, it is possible to scan the Ramsey fringes when the atoms experience different interference times. The interference time is set in the range of 1 to 12 milliseconds. The Ramsey fringes scanned at 4.6ms interference time are shown in the
Figure 7.
3.2. Servo Locking
After scanning and identifying the Ramsey fringes produced by the rubidium atom transition, it is necessary to lock onto the central frequency of the transition in a closed loop. The method of scanning frequency and hopping frequency differs significantly in their implementations: the former requires the control system to output frequencies with an arithmetic progression sequentially, whereas the latter requires the control system to use a hopping mode. By selecting frequency points at equidistant intervals on either side of the central frequency and toggling between them, feedback control is realized through the comparison of differences. A high-precision output module for a 10MHz temperature-stabilized crystal voltage control was designed based on DAC1220 and STM32F103. The clock servo control system is depicted in
Figure 8.
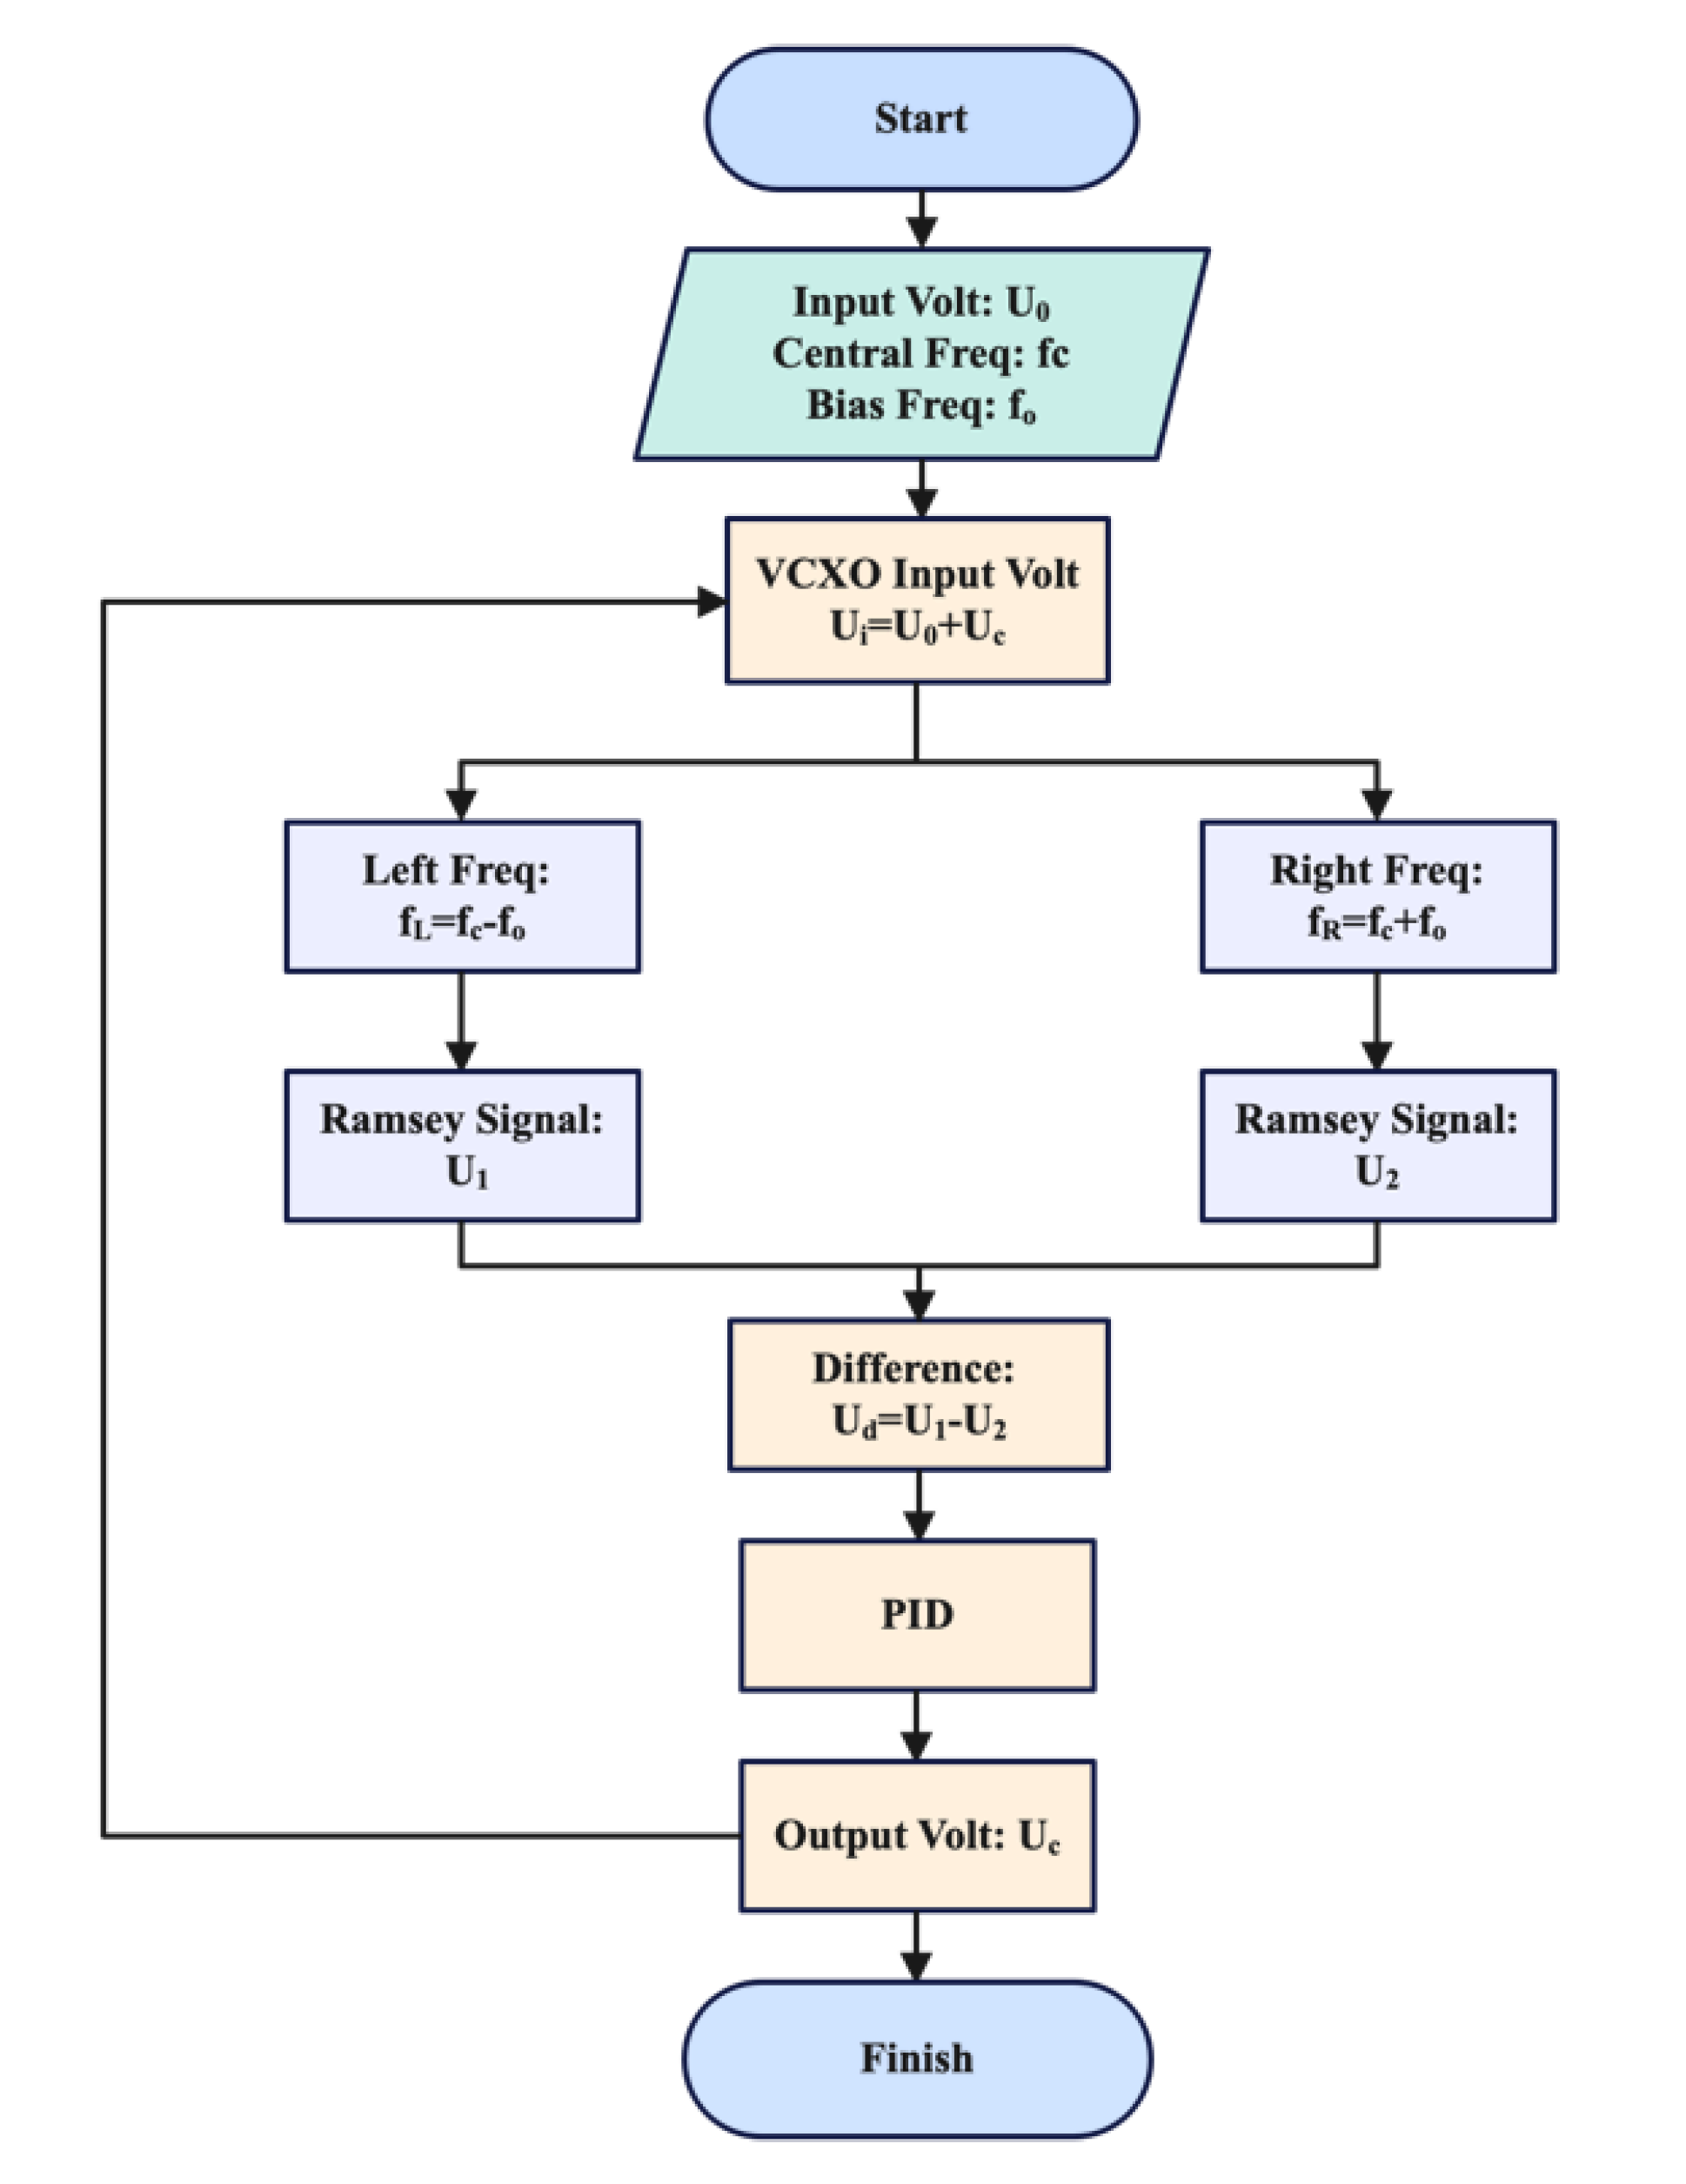
The flowchart of the PID control method for the 10MHz temperature-stabilized crystal voltage control, implemented on the computer, is shown in
Figure 9. The basic process for hopping and locking to the atomic transition central frequency is as follows: modulation points
and
equidistant from the central frequency of the Ramsey fringe's central peak are first chosen. The microwave module is controlled by master computer to output a modulation point frequency each time. Through a designed shift register and conditional structure, two Ramsey signal values
and
are obtained in one period, and the difference signal
is calculated. Feedback control of the crystal achieves the locking of the clock transition frequency.
4. Experimental Results and Discussion
The linewidth of the experimental setup is intrinsically linked to the transit time
of cold atoms traversing between two microwave interactions, a parameter deliberately set to 12.6 milliseconds. As these cold atoms descend a distance of approximately 5 millimeters, the theoretical linewidth can be calculated employing Eq. (3).
In our experimental observations, several factors potentially contribute to the difference between the experimental linewidth and the theoretical one:
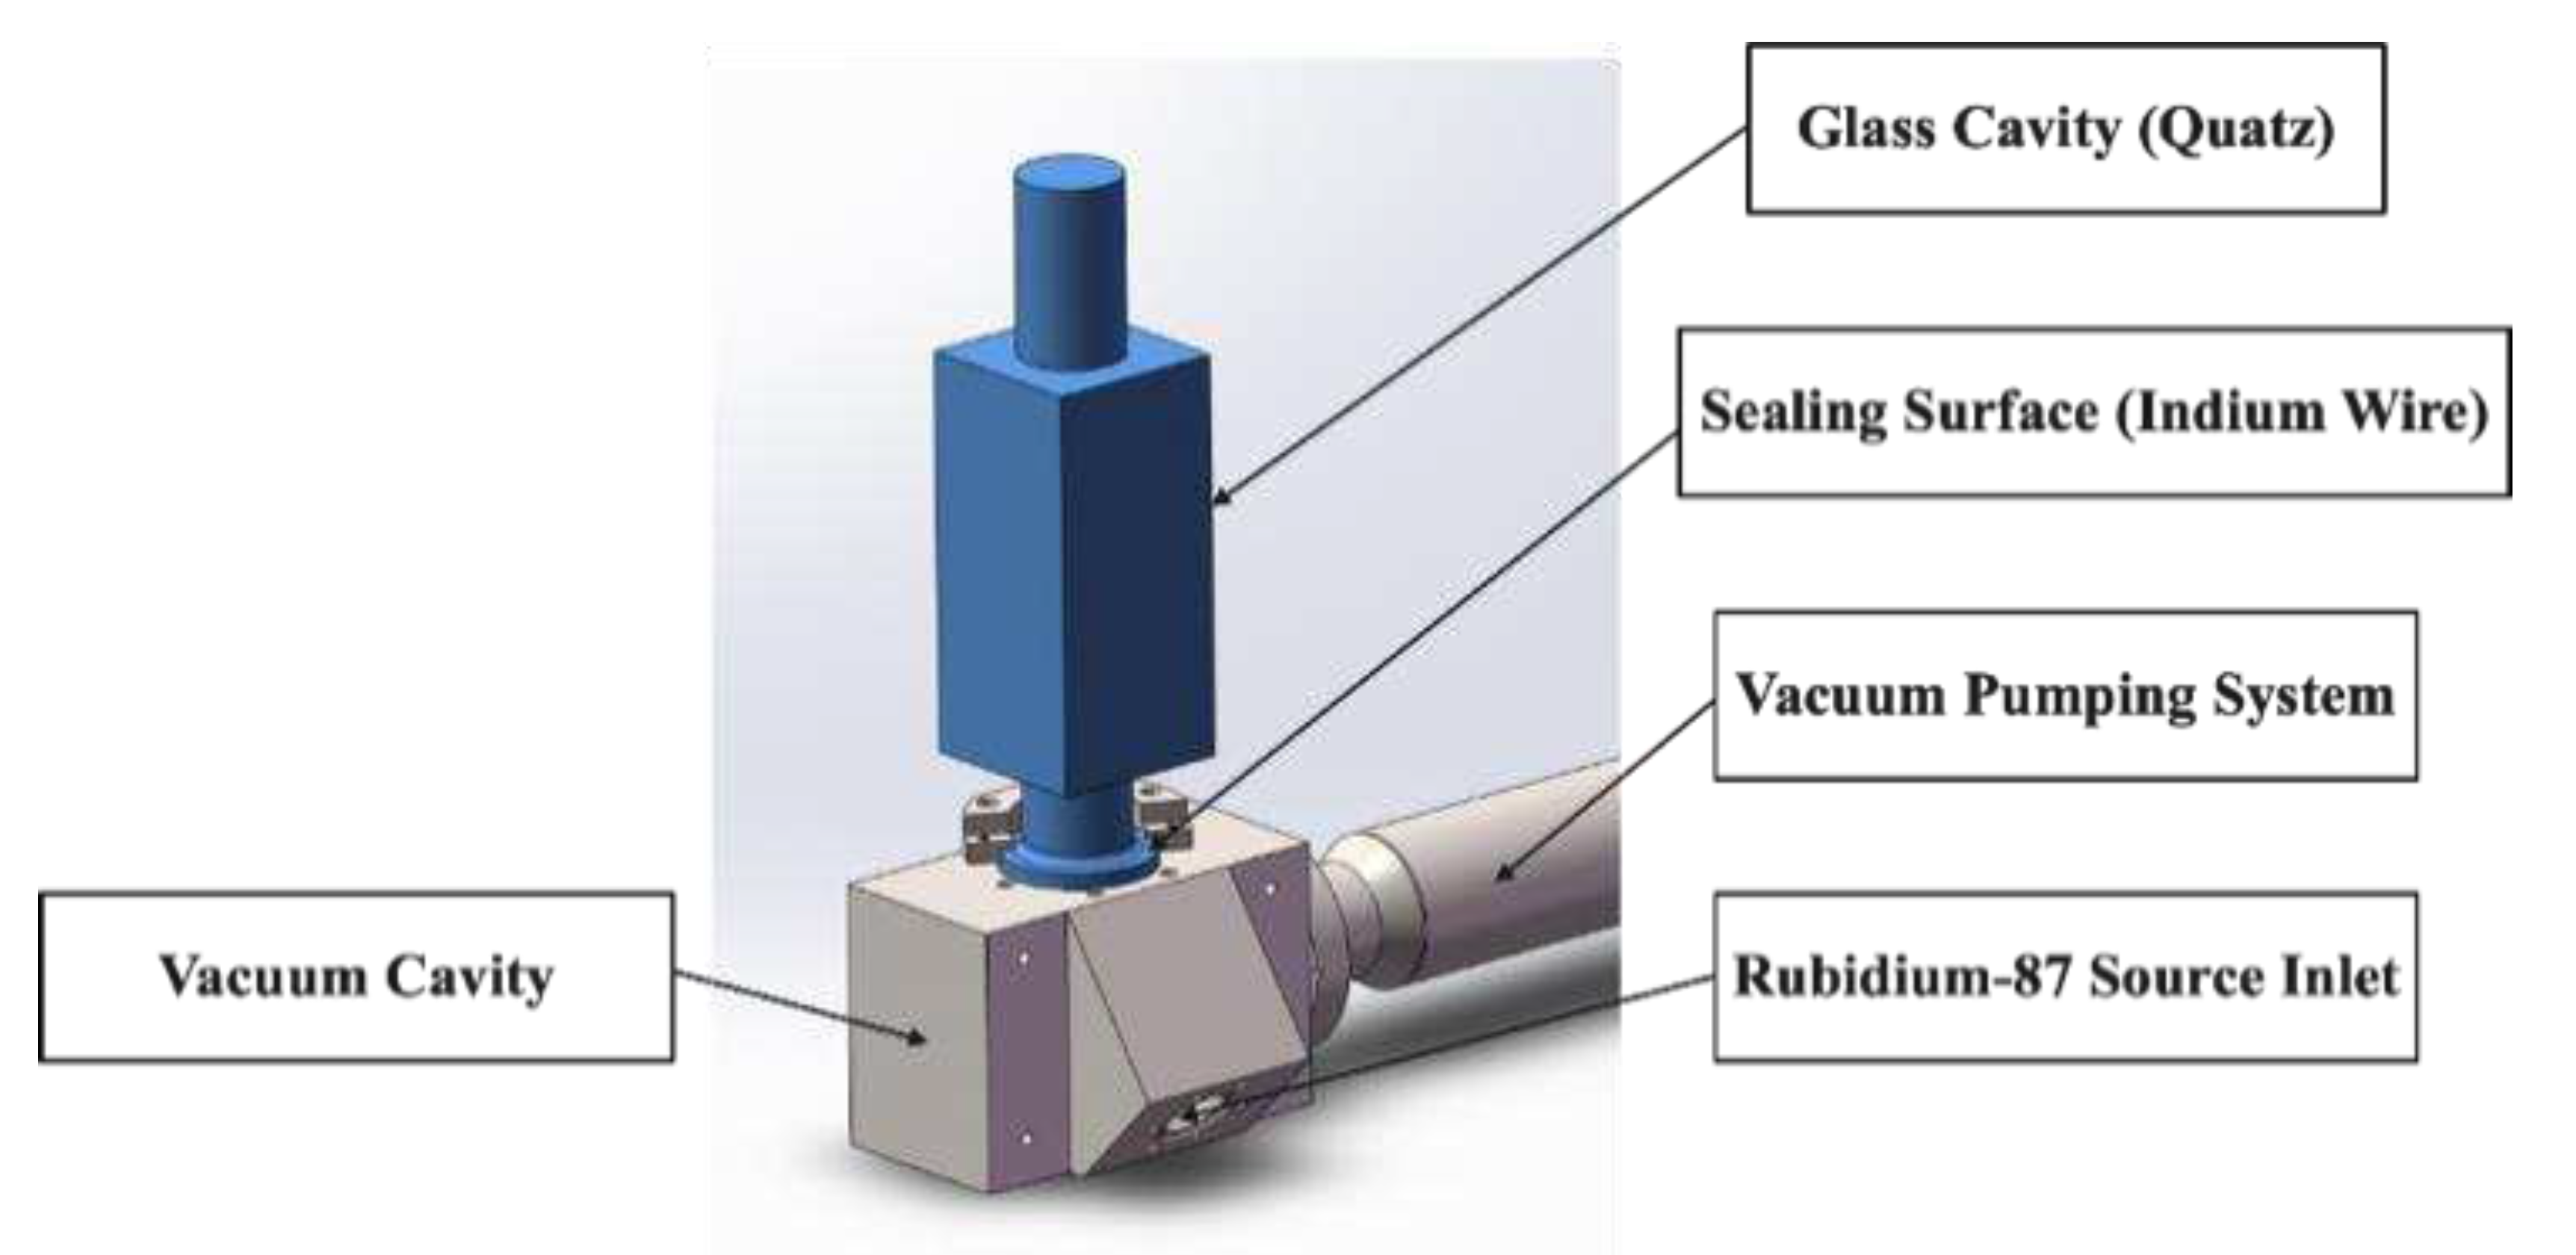
(i) The physical componentry of the rubidium-cooled atomic clock encompasses a vacuum system, delineated in
Figure 10, comprising a contoured glass cavity, a vacuum chamber, a rubidium-87 source, and a vacuum pumping system. Upon the system's initial construction, it adequately met the design prerequisite of 5×10
-7Pa for vacuum levels.
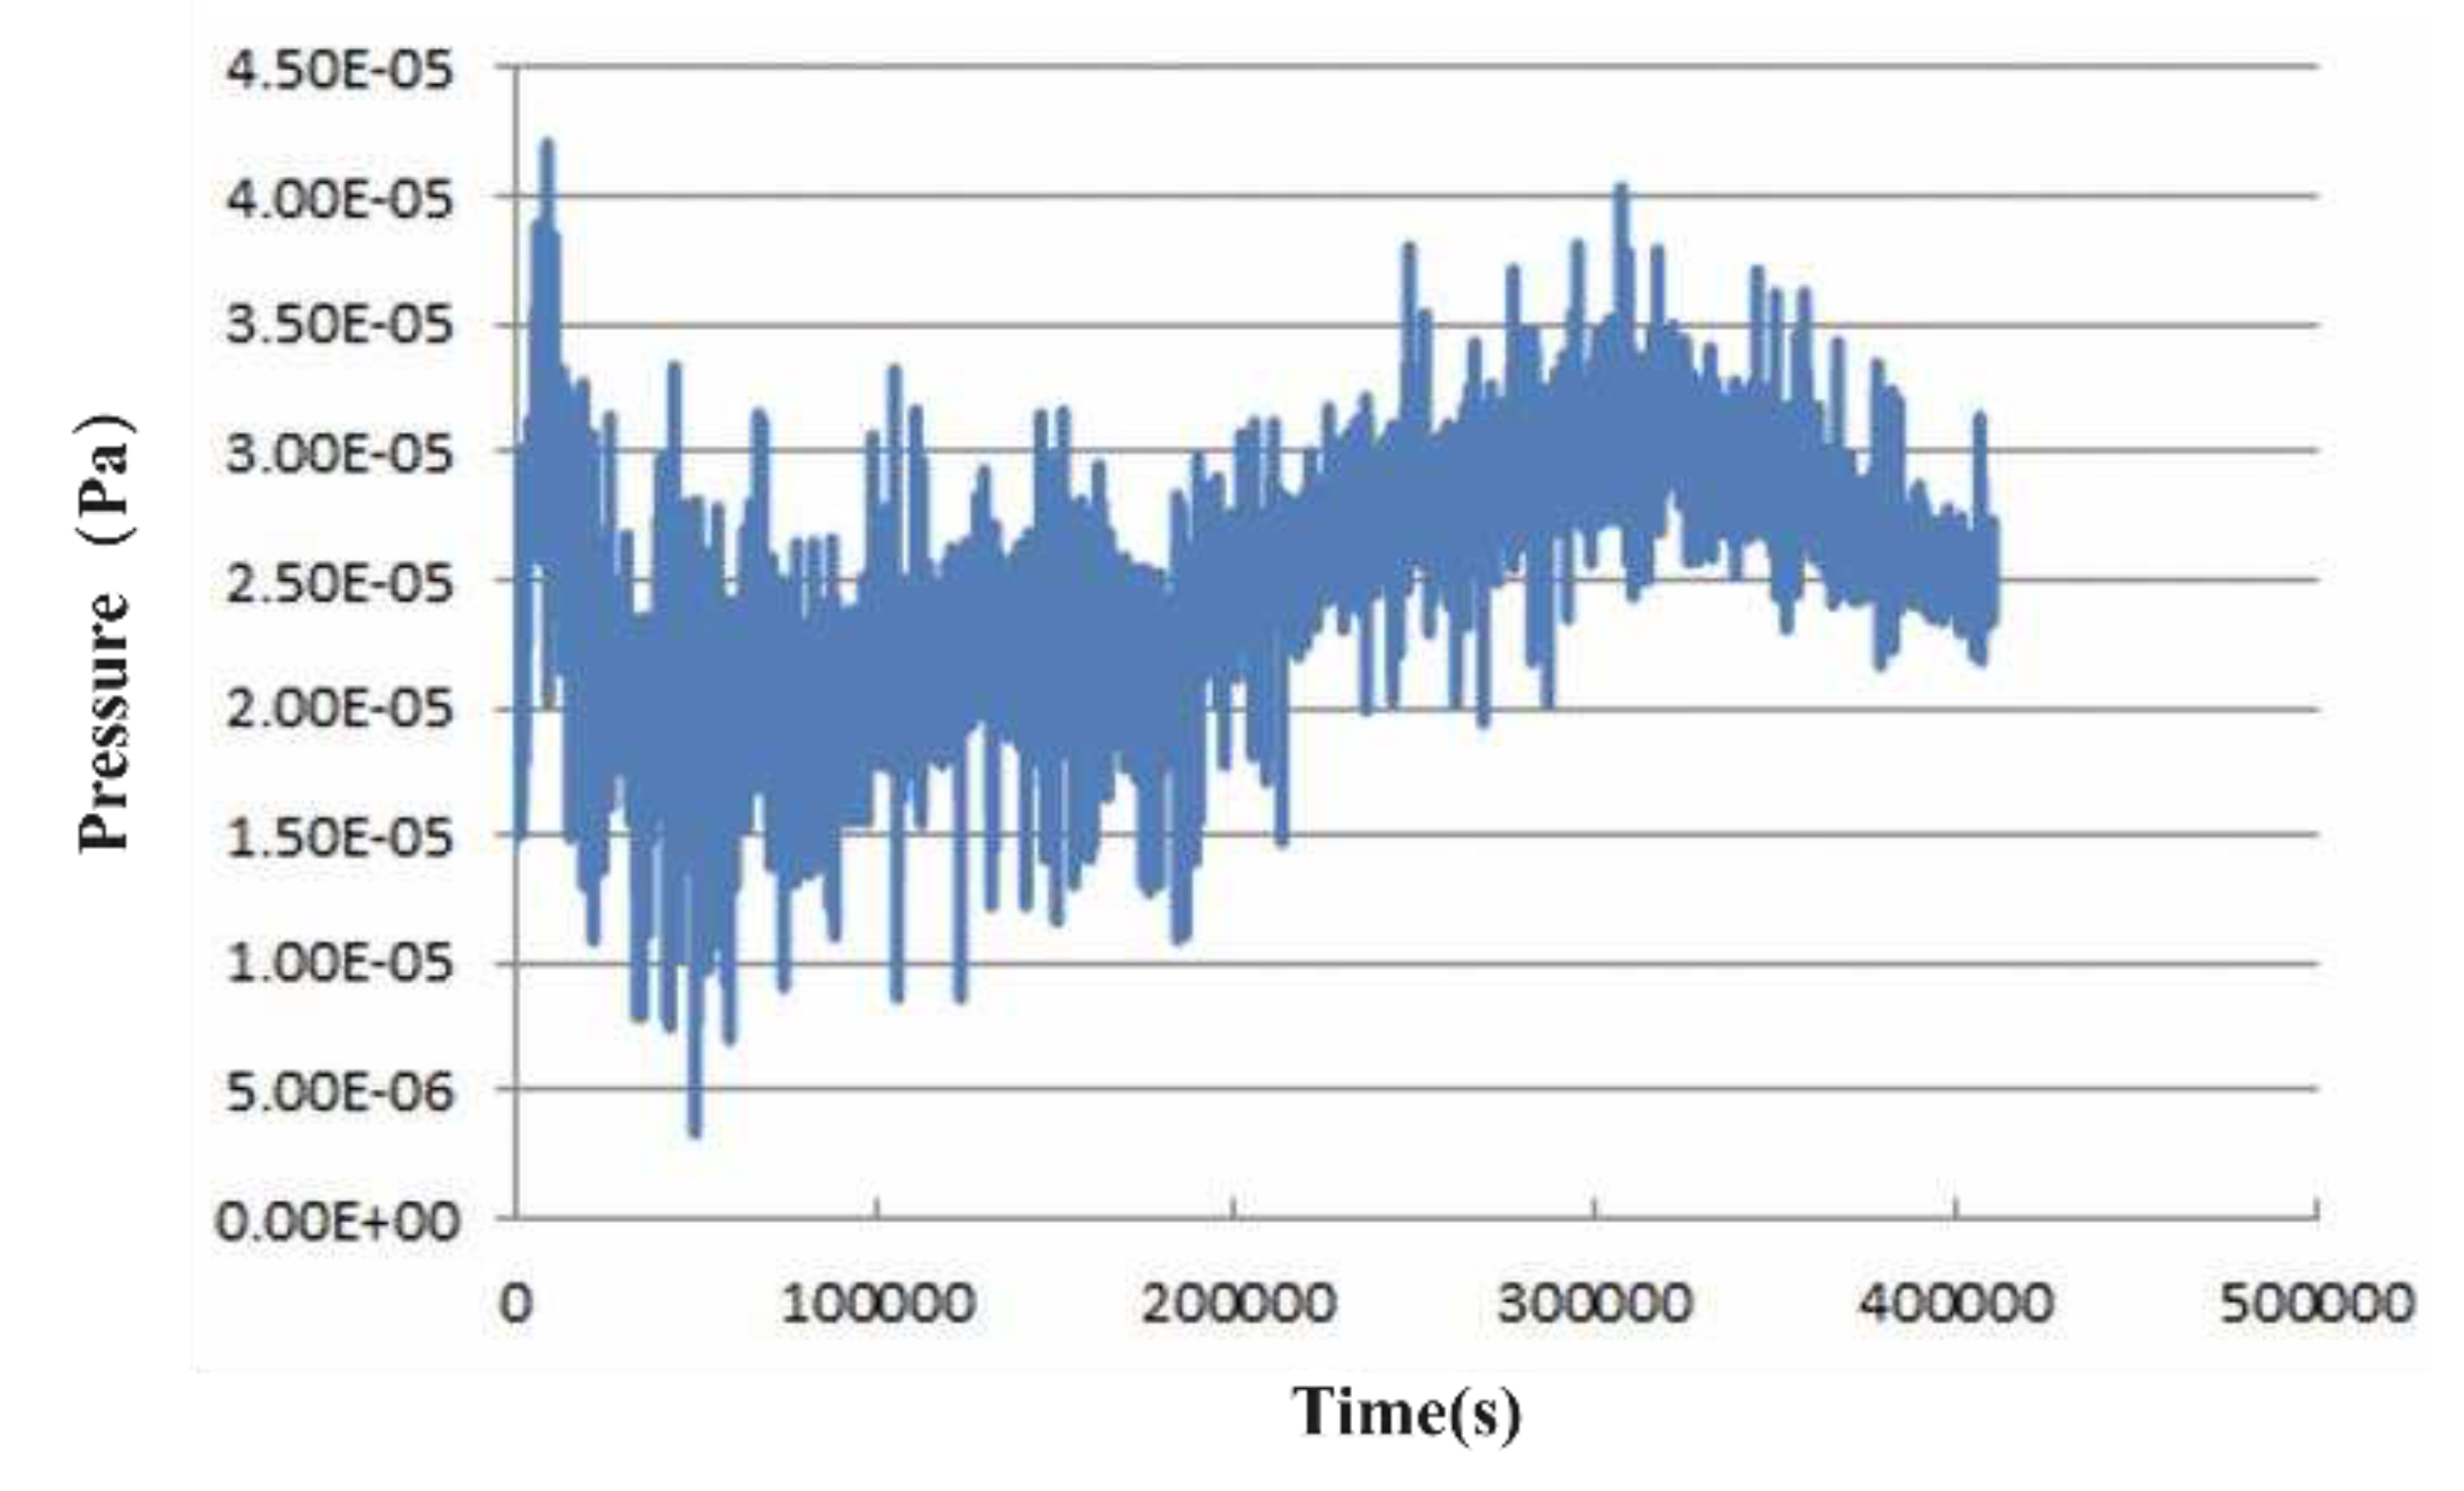
However, following over two years of continuous operation, a gradual vacuum leakage has emerged at the sealing interface between the glass chamber and the vacuum chamber. Presently, the vacuum level has diminished to a modest 2×10
-5 Pa, as evidenced by the continuous vacuum level monitoring results in
Figure 11.
(ii) In congruence with prior work at the University of São Paulo (USP) in Brazil, an antenna was integrated into our experimental setup to generate the requisite microwave field for interaction with the descending cold atoms. The microwave antenna is comprised of a WR-137 rectangular waveguide (34.85mm×15.8mm), spanning a frequency range of 5.85-8.2 gigahertz, which conveniently encompasses the rubidium atomic jump frequency. The microwave frequency source, as shown in
Figure 12, is currently limited to frequency adjustment and does not facilitate microwave power modulation. Specifically, the amplifier (AMP) in the figure lacks adjustability, thereby precluding the optimization of microwave power to maximize signal quality.
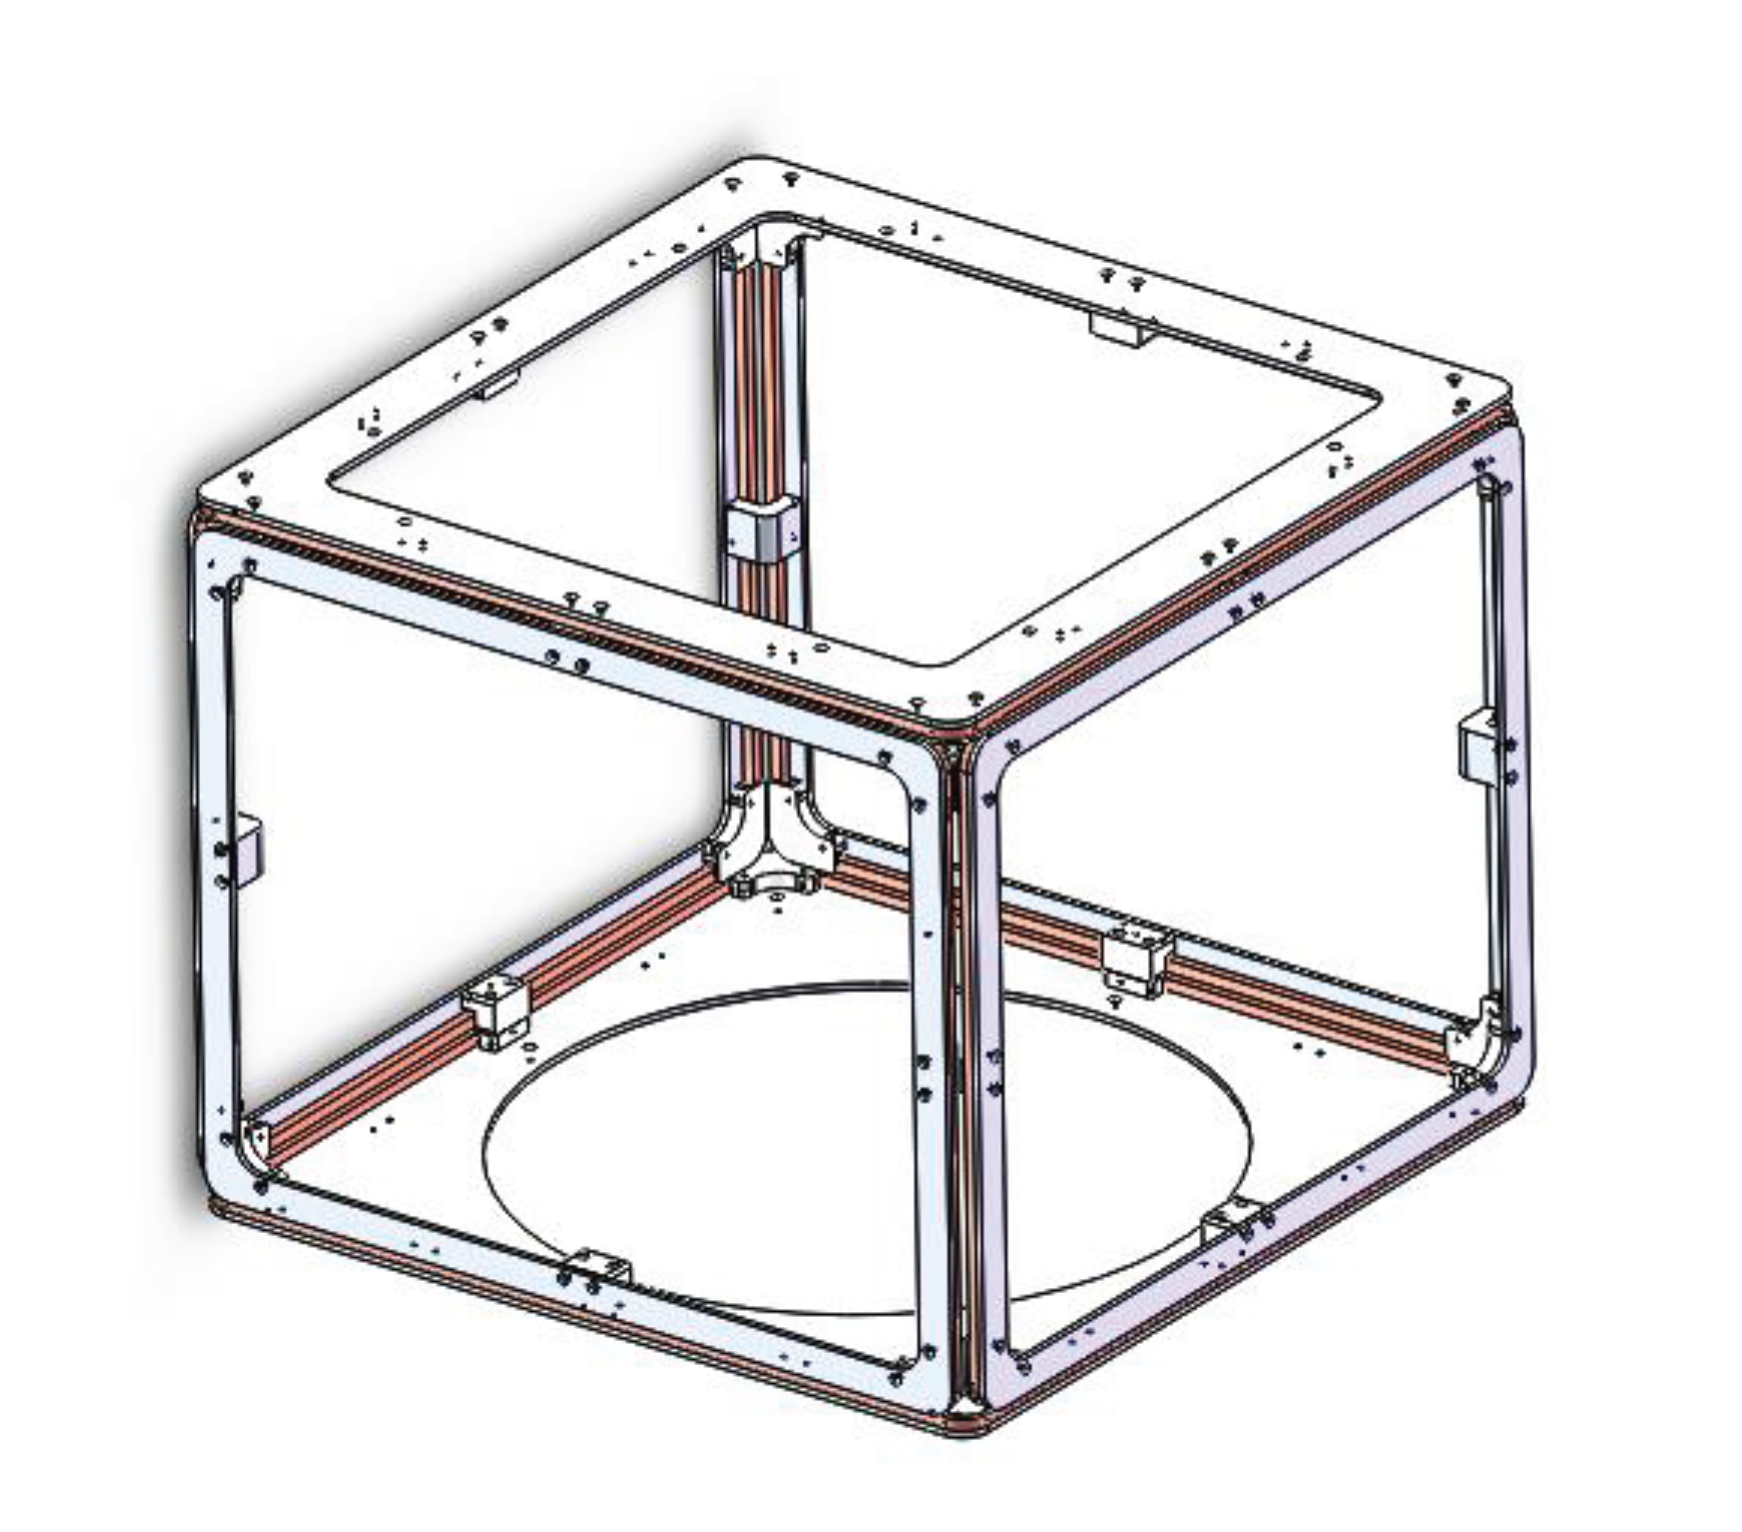
(iii) To mitigate the impact of the geomagnetic field, a three-dimensional geomagnetic field compensation coil, as illustrated in
Figure 13, was designed. This coil is tailored to compensate for geomagnetic field influences along three axes. Adjacent to the atom cooling position, a 3D flux gate serves to measure the efficacy of the compensation, with adjustments made to the coil compensation currents until the magnetic field in proximity to the cold atom cluster is reduced to below 5 milligauss.
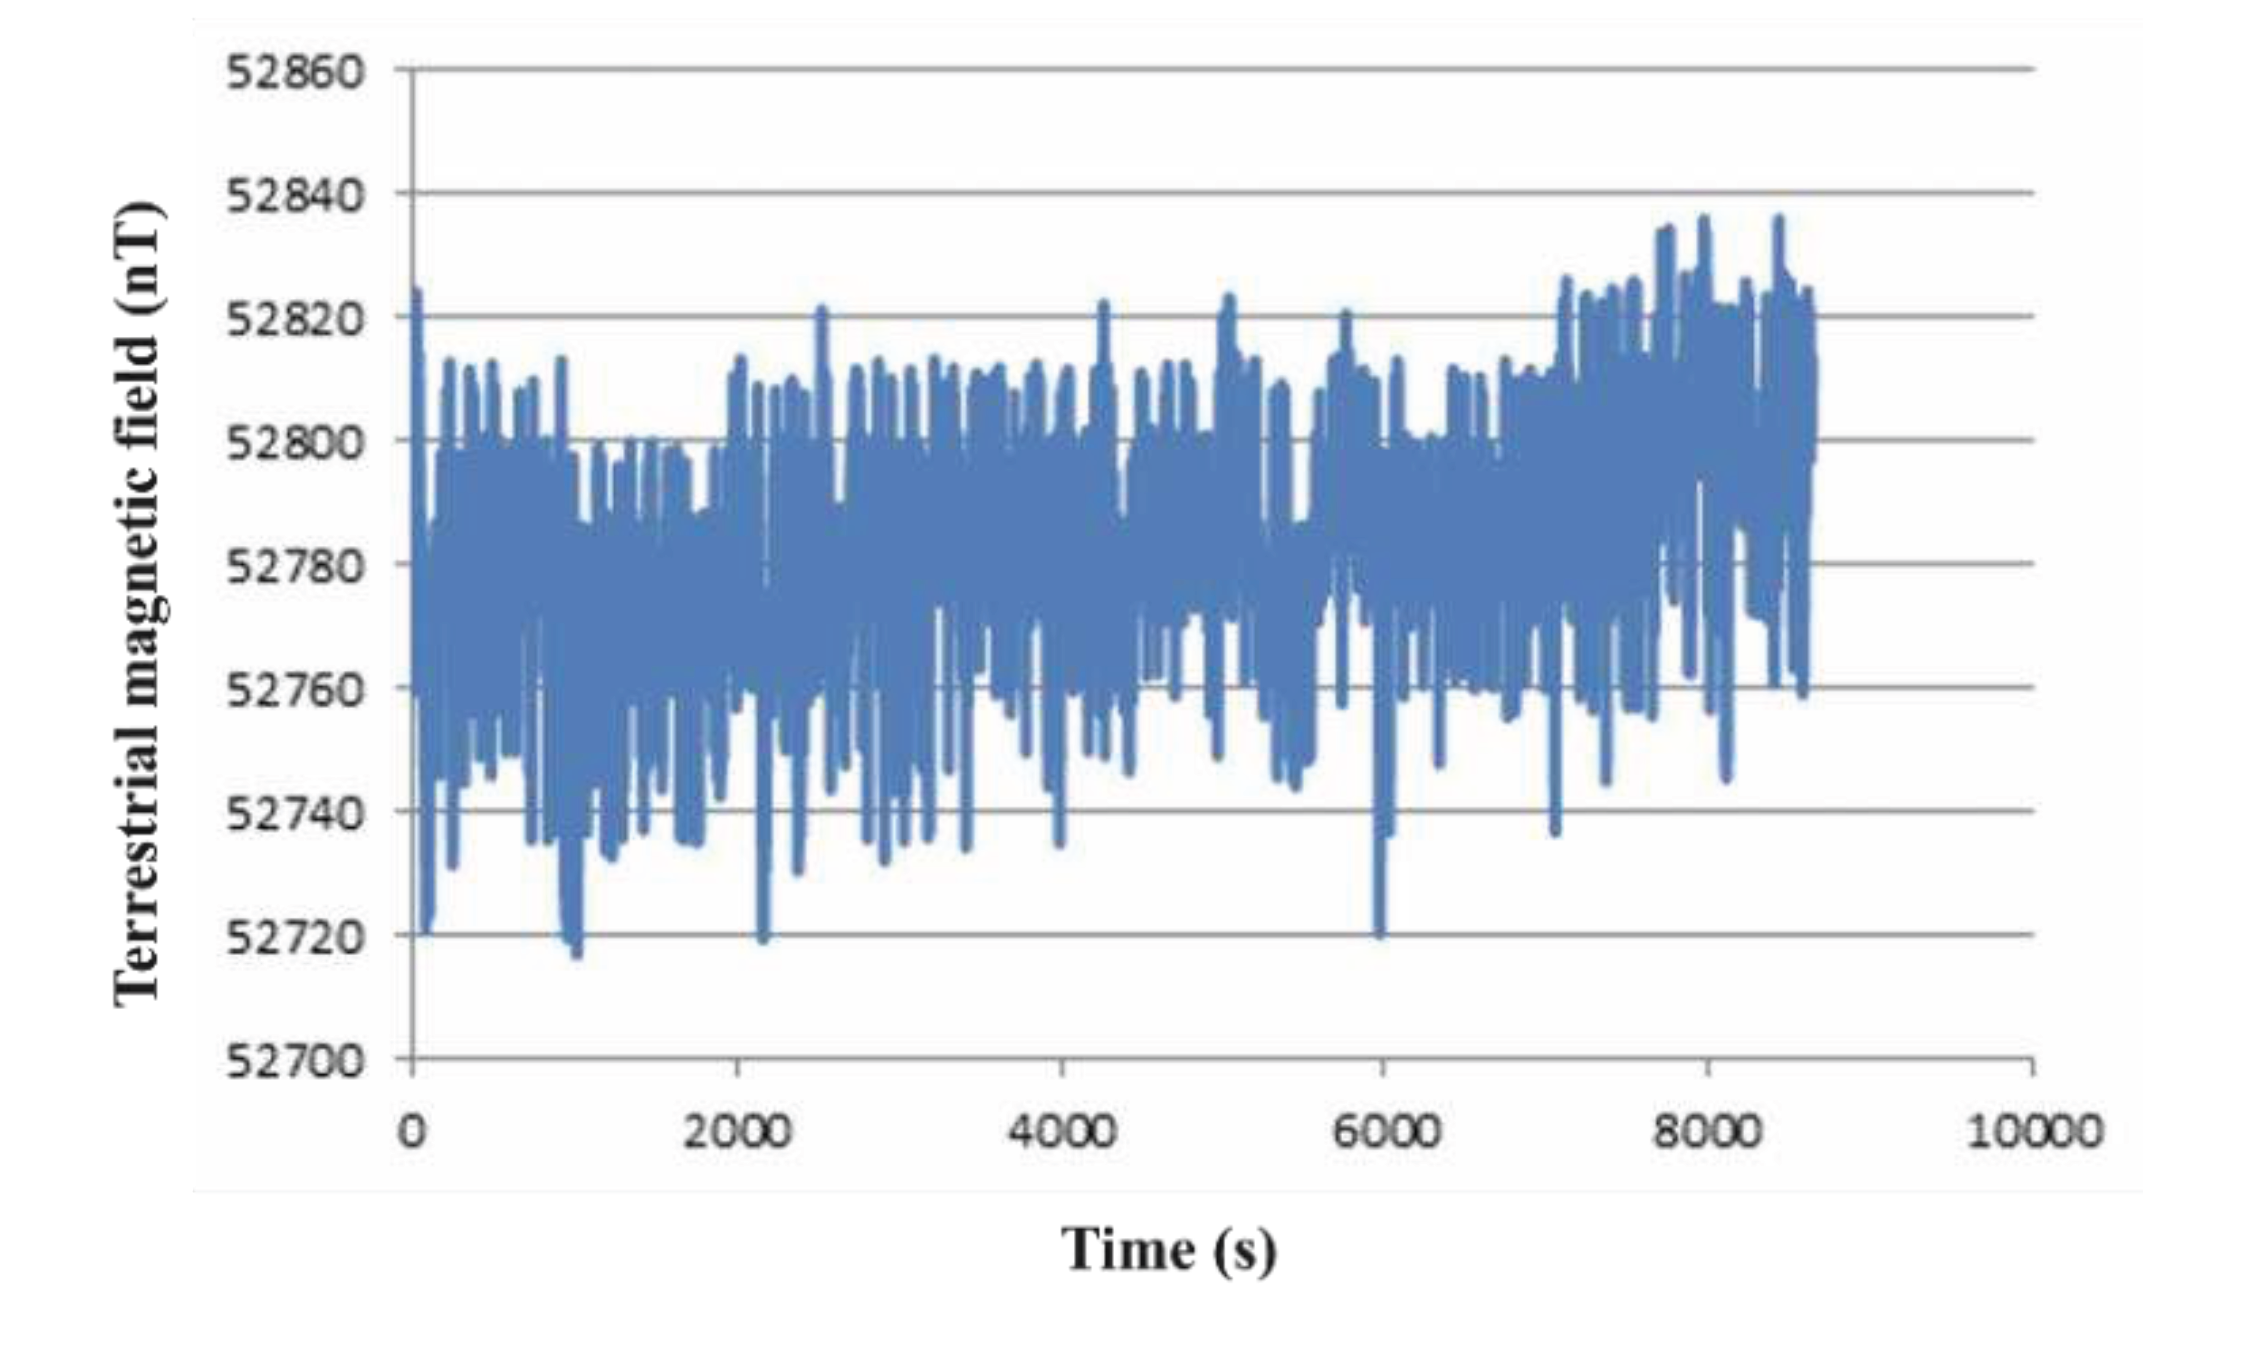
However, the system lacks real-time closed-loop control to counteract residual magnetic field effects and fluctuations in the ambient geomagnetic field. A 2-hour test of the geomagnetic field, performed using the developed optical pump atomic magnetometer, is visualized in
Figure 14. Notably, fluctuations in the geomagnetic field hover around 100nT (i.e., 1 milligauss), while the C-field of the rubidium cold atomic clock within the experiment registers approximately 40 milligauss.
(iv) Given the inherent limitations in the availability of cold atoms, the collisional effects, which scale linearly with atom density, can exert a pronounced impact on stability, as indicated by Eq. (1).[
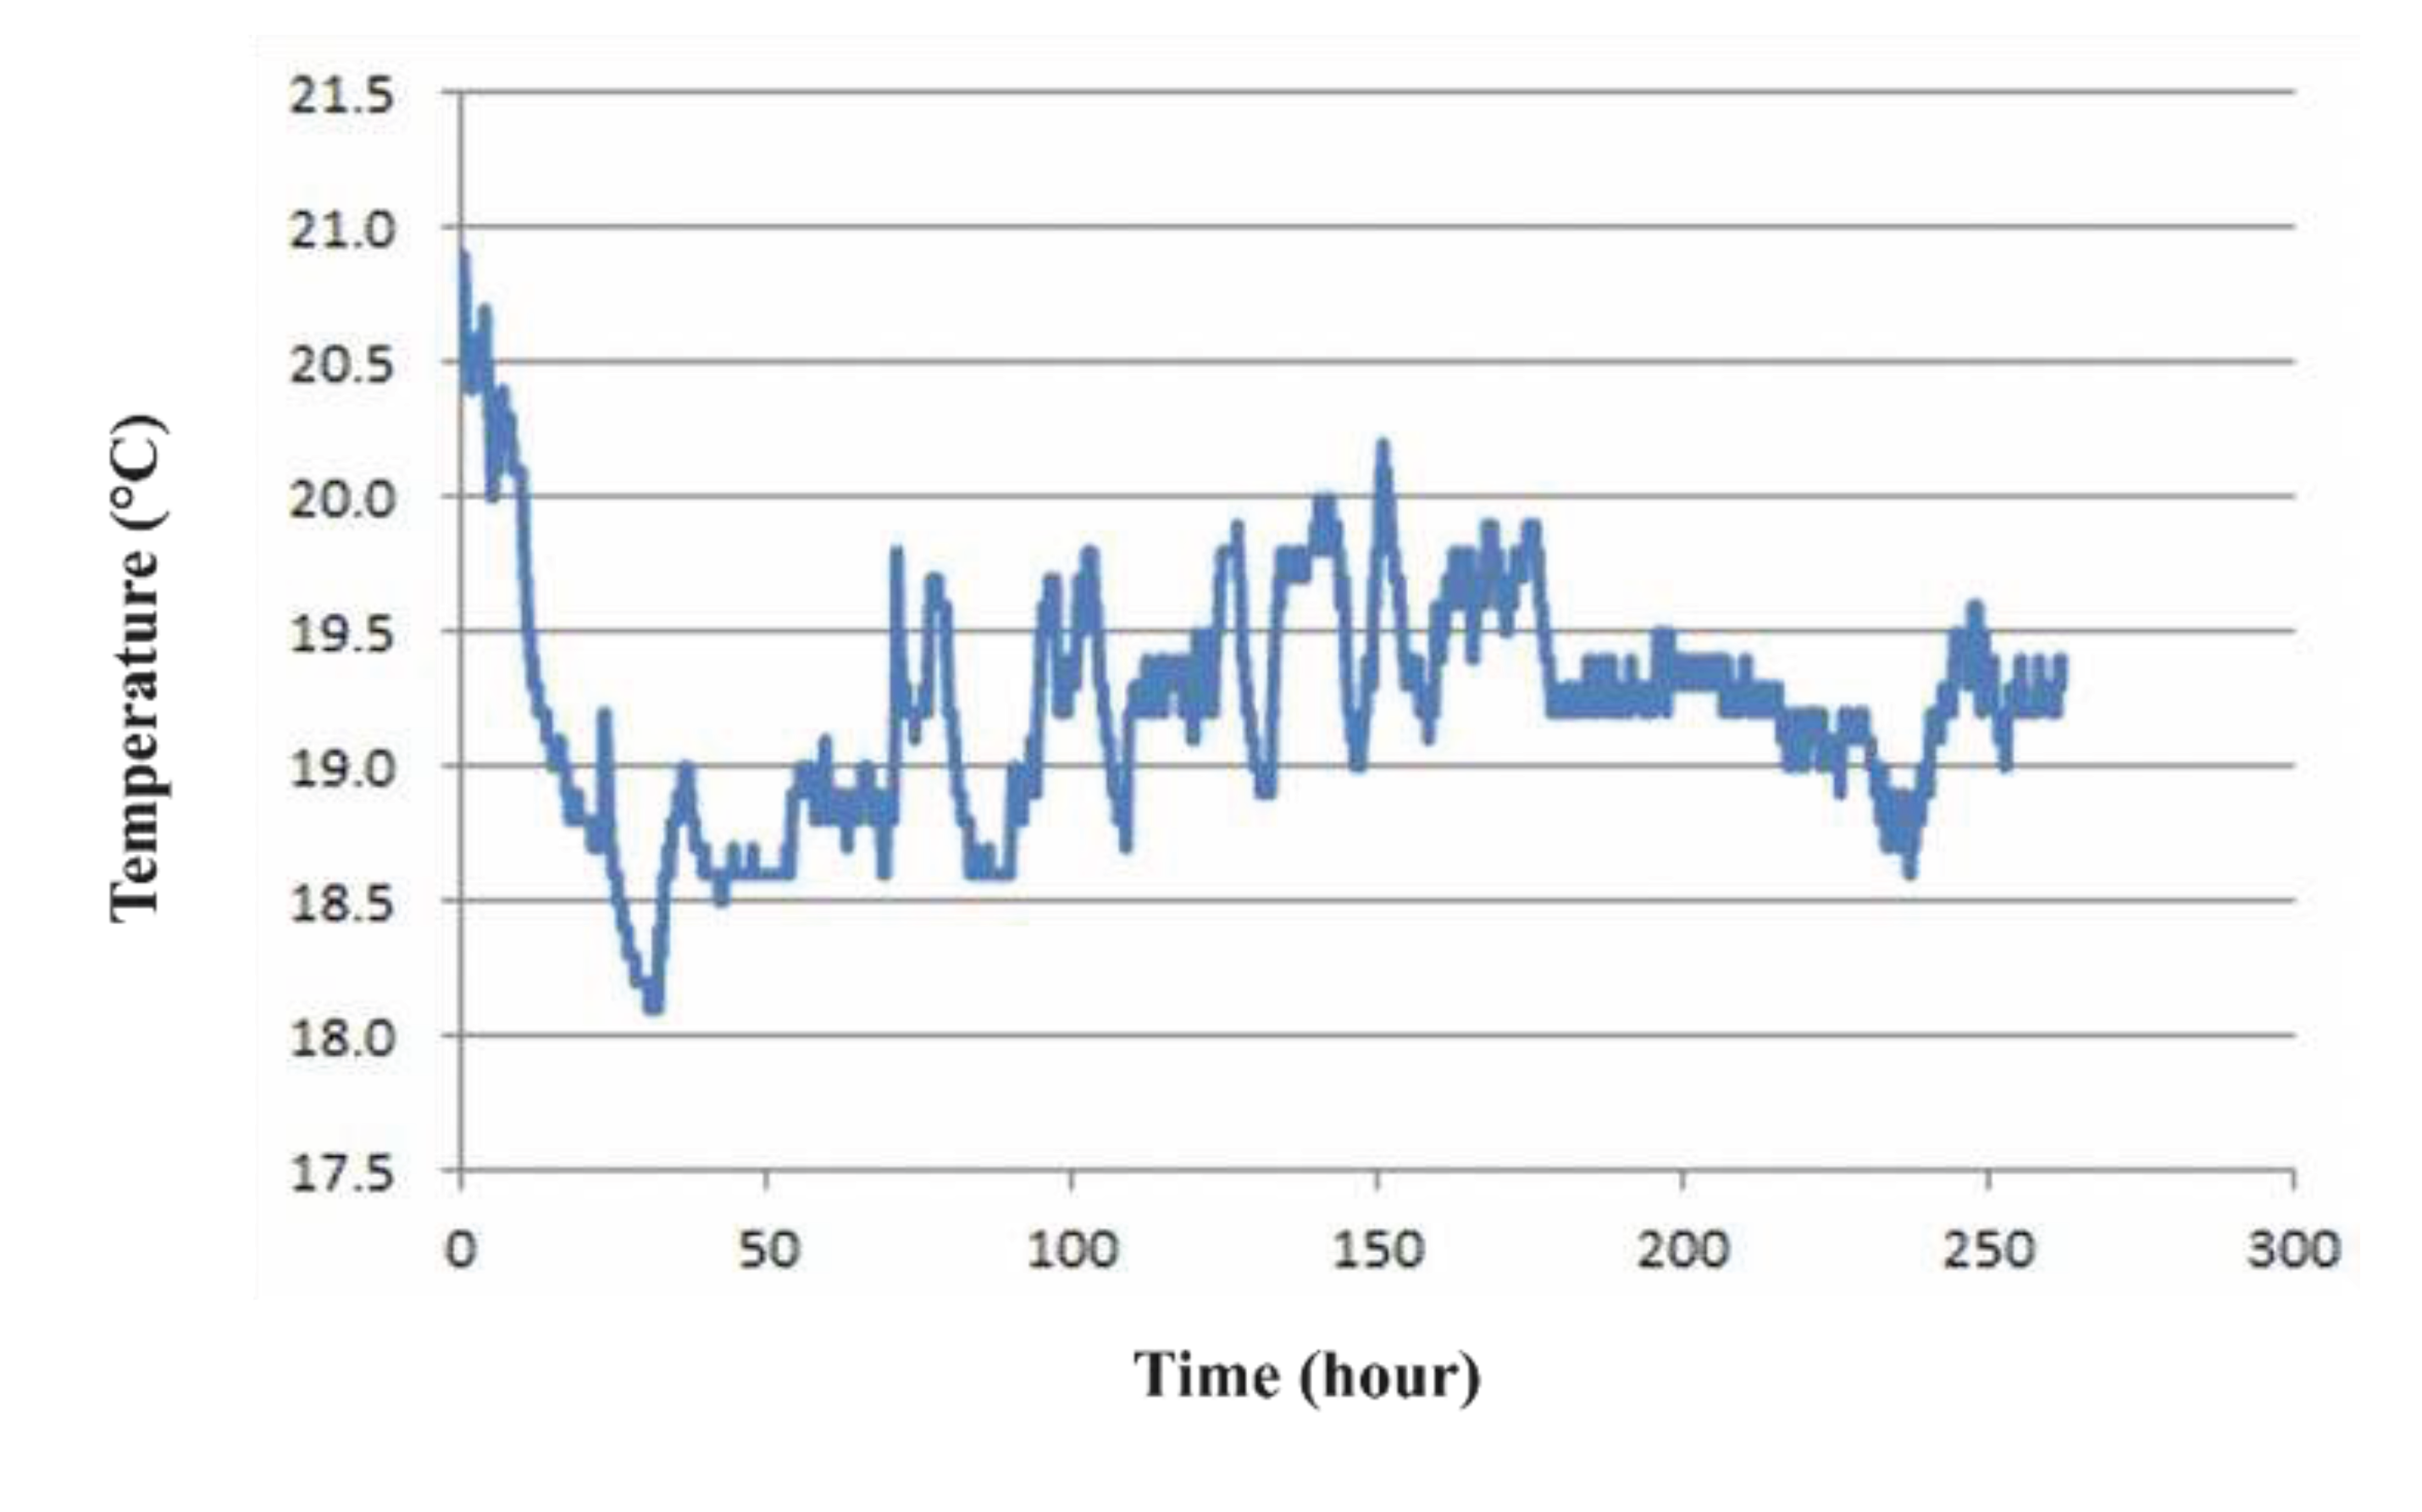
14] Moreover, the rubidium-87 source was encased within a glass ampoule, which incurred damage during use. Notably, during this process, no thermostatic maintenance measures were implemented, resulting in variable cesium atom temperatures and an unstable atomic beam current density. Over a span of more than 200 hours, tests were systematically conducted to monitor laboratory ambient temperature variations, as depicted in
Figure 15.
According to the Eq. (4) and (5), the vapor density of the rubidium atomic beam and its fluctuation can be calculated as
where
is the vapor pressure in torr, and
is the temperature in K. [
15]
where
is the molar mass (constant for a specific element),
is the ideal gas constant.
(v) In the realm of theoretical considerations, during the phase of quantum state preparation for cold atoms, the introduction of a light-based sweeping mechanism is envisioned to purge atoms, thus mitigating magnetic field interference. However, due to the relatively brief free-fall duration of the atoms, the current experimental timing configurations do not accommodate this initial state preparation process. Consequently, atoms with states persist during the interference phase, diminishing the contrast of the fringes. The removal of these atoms via a blowing light mechanism would theoretically bolster the fringe contrast to at least 0.8.
5. Conclusion
This paper focuses on the study of Ramsey interference and locking techniques for 87Rb cold atoms. By designing an optical system, processes such as saturated absorption frequency stabilization and polarization gradient cooling for quantum state preparation were achieved. During the free fall of the atom cluster, interaction occurred twice with the microwave. By designing an automatic peak-finding system based on a virtual instrument platform, dynamic integration of the flight time signal was conducted. Through the hopping method, closed loop locking of the cold atom's transition frequency was achieved, obtaining the linewidth of 38Hz.
Author Contributions
The cold atom scientific research is conducted by the following authors: writing—original draft preparation, plots drawing and the virtual instrument setup, Wangyuan Gao; supervision and plots drawing, Ji Wang; funding acquisition and optical path setup, Yuhua Xiao; physical system optimization, Jiongyang Zhang. All authors have read and agreed to the published version of the manuscript.
Funding
This research was funded by Key Laboratory Vacuum Technology and Physics Foundation (No.6143307210101) and the Fund for Outstanding Young Talents of China Academy of Space Technology.
Conflicts of Interest
The authors declare no conflict of interest.
References
- Dai, S.Y.; Zheng, F.S.; Liu, K.; et al. Cold atom clocks and their applications in precision measurements. Chinese Physics B 2021, 30, 42–56. [Google Scholar] [CrossRef]
- Ludlow, A.D.; Boyd, M.M.; Ye, J. , et al. Optical atomic clocks. Reviews of Modern Physics 2015, 87, 637. [Google Scholar] [CrossRef]
- Peters, A.; Chung, K.Y.; Chu, S. High-precision gravity measurements using atom interferometry. Metrologia 2001, 38, 25. [Google Scholar] [CrossRef]
- S. T. Müller, D.V. Magalhães, R.F. Alves, V.S. Bagnato. Compact frequency standard based on an Intracavity sample of cold cesium atoms. J. Opt. Soc. Am. B 2011, 28, 2592–2596. [Google Scholar] [CrossRef]
- Müller, S.T.; Pechoneri, R.D.; Júnior, J.M.; Bagnato, V.S.; Magalhães, D.V. The Brazilian compact frequency standard with cold atoms: current status and future perspectives. 2014 Conference on Precision Electromagnetic Measurements (CPEM 2014); pp. 66–69.
- Liu, L.; Lü, D.S.; Chen, W.B. , et al. In-orbit operation of an atomic clock based on laser-cooled 87Rb atoms. Nature Communications 2018, 9, 2760. [Google Scholar] [CrossRef] [PubMed]
- Moler, K.; Weiss, D.S.; Kasevich, M. Theoretical analysis of velocity-selective Raman transitions. Physical Review A 1992, 45, 342. [Google Scholar] [CrossRef] [PubMed]
- Schuldt, T.; Schubert, C.; Krutzik, M. , et al. Design of a dual species atom interferometer for space. Experimental Astronomy 2015, 39, 167–206. [Google Scholar] [CrossRef]
- Jin, S.; Gao, J.; Chandrashekara, K. Two-dimensional magneto-optical trap of dysprosium atoms as a compact source for efficient loading of a narrow-line three-dimensional magneto-optical trap. Physical Review A 2023, 108, 023719. [Google Scholar] [CrossRef]
- Templier, S.; Hauden, J.; Cheiney, P. Carrier-suppressed multiple-single-sideband laser source for atom cooling and interferometry. Physical Review Applied 2021, 16, 044018. [Google Scholar] [CrossRef]
- Rosi, S.; Burchianti, A.; Conclave, S. λ-enhanced grey molasses on the D 2 transition of Rubidium-87 atoms. Scientific reports, 2018, 8, 1301. [Google Scholar] [CrossRef] [PubMed]
- Yuan, J.Q. Research on single frame scanning polarization resolution degenerate four-wave mixing and saturation absorption spectroscopy based on vector light field. Northwestern University: 2022. [CrossRef]
- Shammout, B. A Laser System for Gray-Molasses Cooling on the D1 Transition of an Atomic Gas of 39K[D]. Hannover: Gottfried Wilhelm Leibniz Universität, 2020.
- Calonico D, Levi F, Lorini L; et al. Use of Bayesian Statistics to reduce the density shift uncertainty in cesium fountain. 2010 IEEE International Frequency Control Symposium; IEEE, 2010; pp. 324–328. [Google Scholar]
- Steck, D.A. Rubidium 87 D line data. 2001.
Figure 1.
Schematic diagram of the components of the cold atom interference system. The whole system mainly contains an optical unit, a microwave unit, a circuit unit, and a physical unit.
Figure 1.
Schematic diagram of the components of the cold atom interference system. The whole system mainly contains an optical unit, a microwave unit, a circuit unit, and a physical unit.
Figure 2.
Frequency design and operational process based on the 87Rb cold atom system. Based on the transition frequency of the 87Rb, frequency for cooling, repumping, and detecting process were designed.
Figure 2.
Frequency design and operational process based on the 87Rb cold atom system. Based on the transition frequency of the 87Rb, frequency for cooling, repumping, and detecting process were designed.
Figure 3.
Schematic of the optical path based on 87Rb cold atom interference. By using the SAS technology and FVC technology, combined with Digi-lock on the master computer, frequency stabilization for ECDL1 and ECDL2 can be realized respectively. The four AOMs are designed for the frequency shift for the optical path, and by utilizing the AOM4 and a mirror, a double path for secondary frequency shift was realized.
Figure 4.
Diagram of the sequential control for the cold atom microwave interference. The sequential control of cooling process, two microwave interactions, and three transitions are respectively designed for the cooling, interference, and detection stage.
Figure 4.
Diagram of the sequential control for the cold atom microwave interference. The sequential control of cooling process, two microwave interactions, and three transitions are respectively designed for the cooling, interference, and detection stage.
Figure 5.
Diagram for cold atom TOF signals on F=1 and F=2. When atoms on the two ground states (52S1/2|F=1> and 52S1/2|F=2>) are excited by laser, the detector set at the bottom of the vacuum chamber can receive the fluorescent signal spontaneously radiated by the excited state., thus the population of the two states can be deduced.
Figure 6.
Peak of TOF signal detection design. This algorithm is realized by using a core function called “Gaussian Peak Detection”, thus we can find the peaks of the two TOF signals and their corresponding time.
Figure 6.
Peak of TOF signal detection design. This algorithm is realized by using a core function called “Gaussian Peak Detection”, thus we can find the peaks of the two TOF signals and their corresponding time.
Figure 7.
Diagram of Ramsey fringes in the interference time of 4.6ms. By using the analysis software, the linewidth and noise-to-signal ratio (SNR) of the Ramset fringes can be achieved.
Figure 7.
Diagram of Ramsey fringes in the interference time of 4.6ms. By using the analysis software, the linewidth and noise-to-signal ratio (SNR) of the Ramset fringes can be achieved.
Figure 8.
Servo control system for the cold atomic clock. The diagram depicts a closed design for the frequency locking control system, in which the output frequency of the temperature-stabilized crystal is adjusted by a PID algorithm based on DAC1220 and STM32F103.
Figure 8.
Servo control system for the cold atomic clock. The diagram depicts a closed design for the frequency locking control system, in which the output frequency of the temperature-stabilized crystal is adjusted by a PID algorithm based on DAC1220 and STM32F103.
Figure 9.
Locking servo PID algorithm block diagram. The basic principle of this locking system is the PID controlling algorithm. By sending the difference signal into the PID module and adjusting the parameters, the difference signal can be reduced to zero.
Figure 9.
Locking servo PID algorithm block diagram. The basic principle of this locking system is the PID controlling algorithm. By sending the difference signal into the PID module and adjusting the parameters, the difference signal can be reduced to zero.
Figure 10.
Vacuum system of a rubidium cold atomic clock. This vacuum system mainly contains five parts: a glass cavity made by quartz, a sealing surface, a pumping system, a rubidium source inlet, and a vacuum cavity.
Figure 10.
Vacuum system of a rubidium cold atomic clock. This vacuum system mainly contains five parts: a glass cavity made by quartz, a sealing surface, a pumping system, a rubidium source inlet, and a vacuum cavity.
Figure 11.
Monitoring results of vacuum degree in vacuum system. During a 400000s test, it is obvious that the pressure in the vacuum cavity varies from 1×10⁻⁵ to 4×10⁻⁵.
Figure 11.
Monitoring results of vacuum degree in vacuum system. During a 400000s test, it is obvious that the pressure in the vacuum cavity varies from 1×10⁻⁵ to 4×10⁻⁵.
Figure 12.
Microwave frequency source program. An antenna is utilized for providing a microwave source for the cold atom transition, following the previous work at the USP.
Figure 12.
Microwave frequency source program. An antenna is utilized for providing a microwave source for the cold atom transition, following the previous work at the USP.
Figure 13.
Diagram of the earth field compensation coil. The design for the coil is mainly used to compensate the interruption of the geomagnetic field, thus resulting in a vertical quantization axis.
Figure 13.
Diagram of the earth field compensation coil. The design for the coil is mainly used to compensate the interruption of the geomagnetic field, thus resulting in a vertical quantization axis.
Figure 14.
Fluctuations in the Earth's magnetic field. During a 2-hour period of test, it is obvious that fluctuations in the geomagnetic field hover around 100nT.
Figure 14.
Fluctuations in the Earth's magnetic field. During a 2-hour period of test, it is obvious that fluctuations in the geomagnetic field hover around 100nT.
Figure 15.
Variation of the temperature in the laboratory. During a 250-hour test, the temperature in the laboratory fluctuated from 18.5℃ to 21℃, which has an obvious impact on the number of atoms.
Figure 15.
Variation of the temperature in the laboratory. During a 250-hour test, the temperature in the laboratory fluctuated from 18.5℃ to 21℃, which has an obvious impact on the number of atoms.
|
Disclaimer/Publisher’s Note: The statements, opinions and data contained in all publications are solely those of the individual author(s) and contributor(s) and not of MDPI and/or the editor(s). MDPI and/or the editor(s) disclaim responsibility for any injury to people or property resulting from any ideas, methods, instructions or products referred to in the content. |
© 2023 by the authors. Licensee MDPI, Basel, Switzerland. This article is an open access article distributed under the terms and conditions of the Creative Commons Attribution (CC BY) license (http://creativecommons.org/licenses/by/4.0/).
