Before the lunar orbit insertion, the KMAG team conducted a calibration procedure to account for the disturbances generated by the spacecraft maneuvering and calculated the daily zero-offset value for the dataset. Two days after deploying the KMAG boom, an unexpected disturbance appeared in the KMAG observation data from the spacecraft maneuvering. Since the zero-offset calculation uses the method that minimizes the variance of the field magnitude, the measured magnetic field containing disturbances made the result of the zero-offset calculation inaccurate. This section outlines a case concerning the clearance results and process associated with a spacecraft-generated disturbance on 6 August 2022 at a position just outside the Earth’s bow shock.
4.1. Comparison of DSCOVR FGM and KMAG
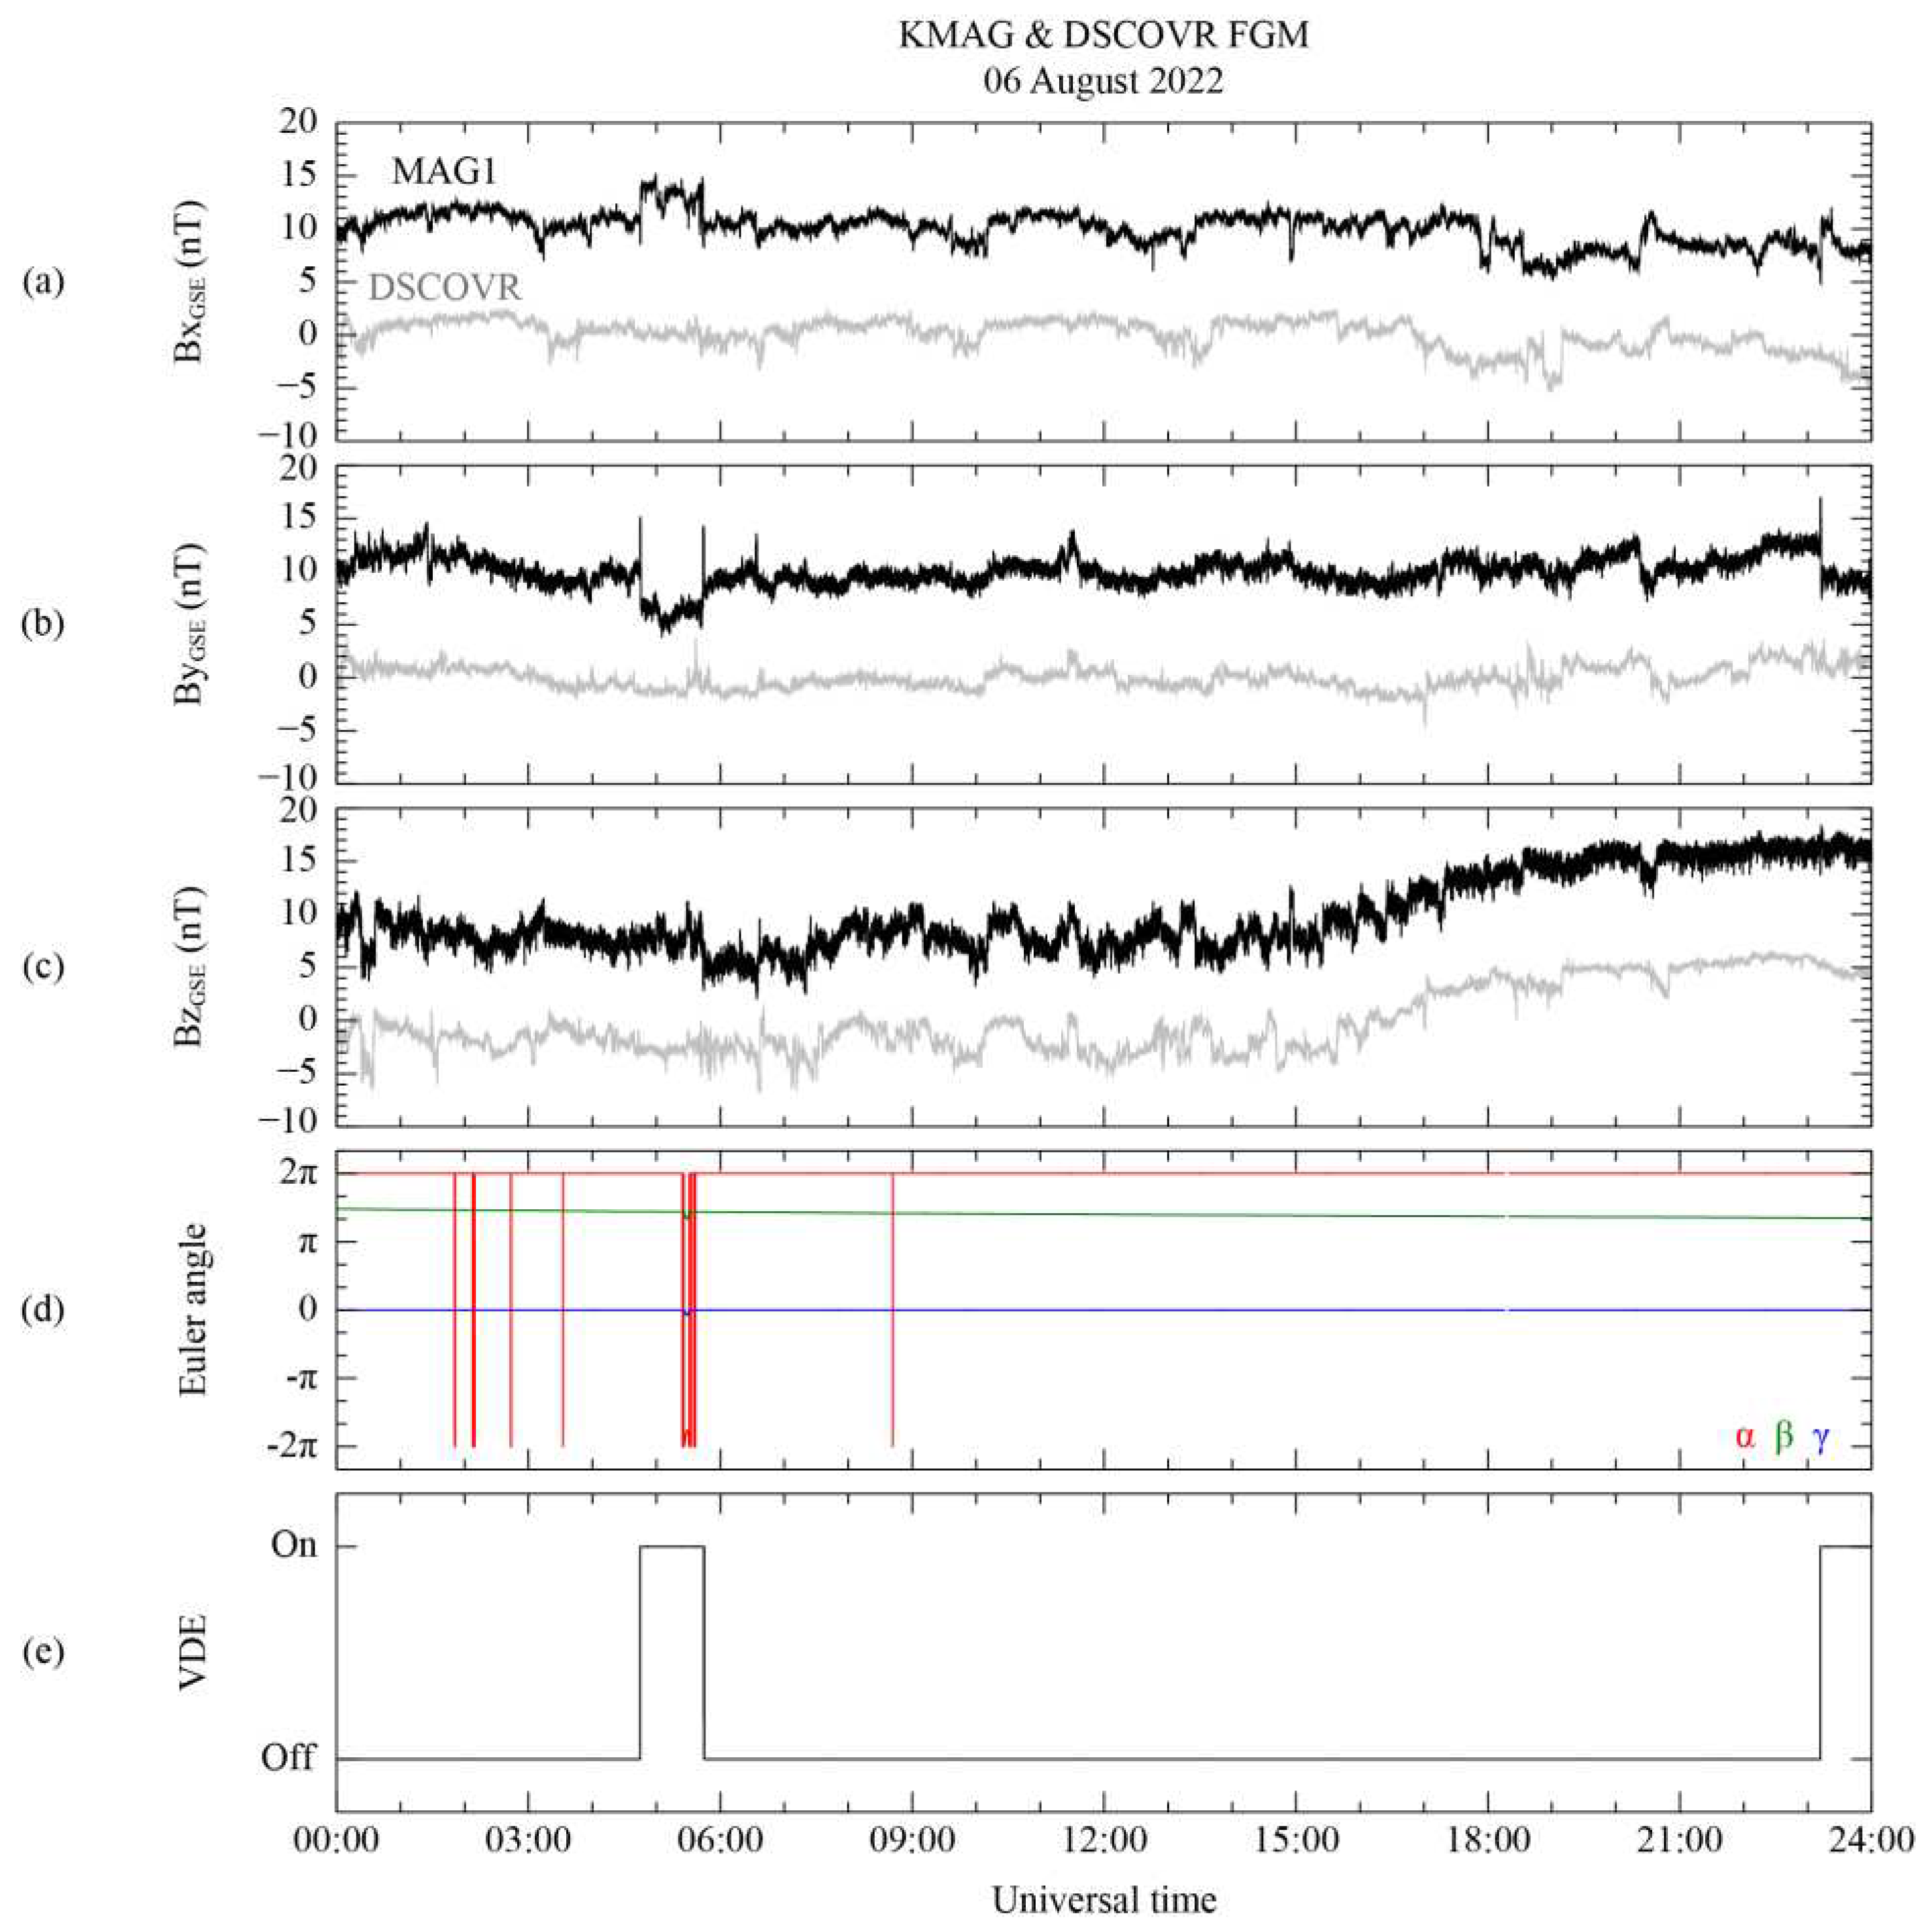
Figure 2 displays the time series of the magnetic field measured by the KPLO-MAG1 and DSCOVR-FGM using the GSE coordinate system and the operational information of the KPLO satellite related to the attitude and interior electronics on 6 August 2022. All components of the magnetic field data from MAG1 are displayed in
Figure 2a–c by adding 10 nT after subtracting the daily-averaged value to compare with DSCOVR FGM measurements. Note that the daily averaged value from MAG1 does not represent its daily zero offset value. Additionally, we confirmed that there were no dynamic solar wind events during the same period. As shown in
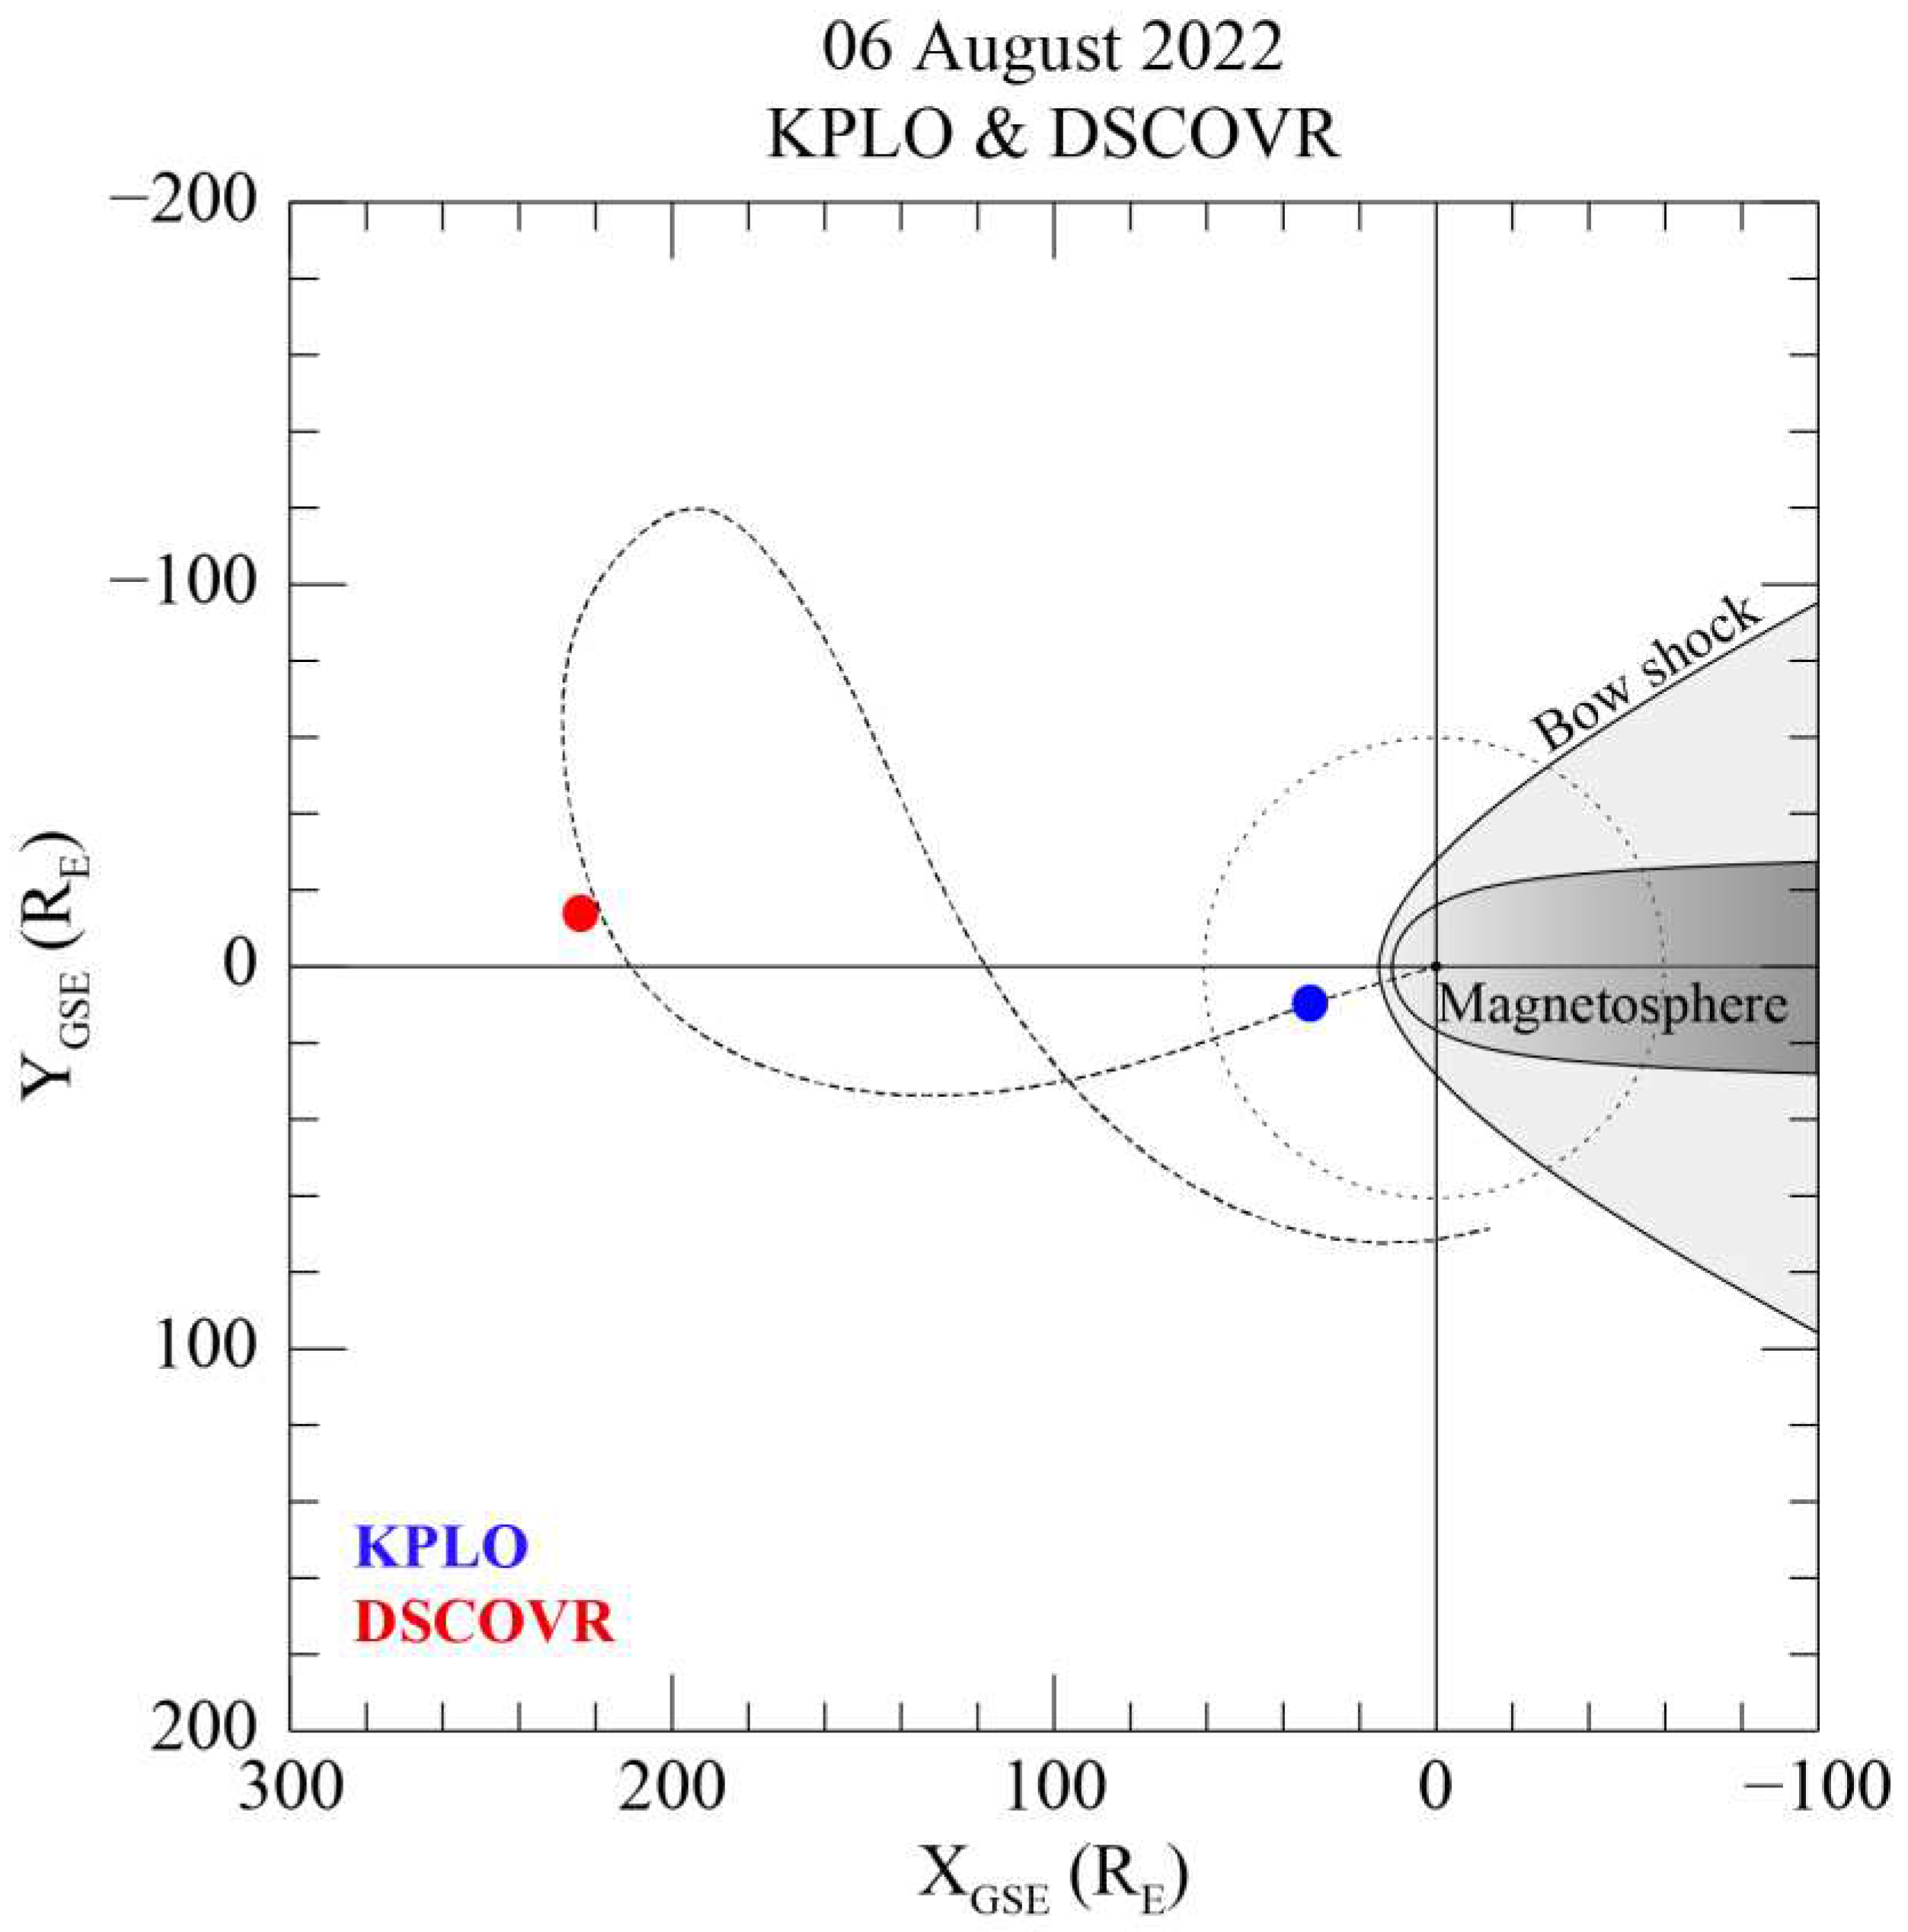
Figure 3, the DSCOVR satellite is positioned at the L
1 point (223.9 R
E, −14.9 R
E, −24.4 R
E) in the geocentric solar ecliptic (GSE) coordinate system, while the KPLO is located just outside the Earth’s bow shock (32.9 R
E, 8.7 R
E, −8.2 R
E), with R
E referring to the Earth’s radius. According to Richardson and Paularena [
18], if the difference in distance of both satellites in the GSE Y-Z plane is less than 50 R
E in the interplanetary medium, it is possible to measure the same solar magnetic field. Therefore, since the distance between the DSCOVER and KPLO satellites is approximately 16 R
E on the Y-Z plane, the KMAG can observe a similar magnetic field to that measured by the DSCOVR FGM. Nevertheless, the difference of ~191 R
E between the two satellites along the X
GSE direction causes a 40 min delay in solar wind propagation. The calculations for this time delay were applied to the KMAG measurements in
Figure 2.
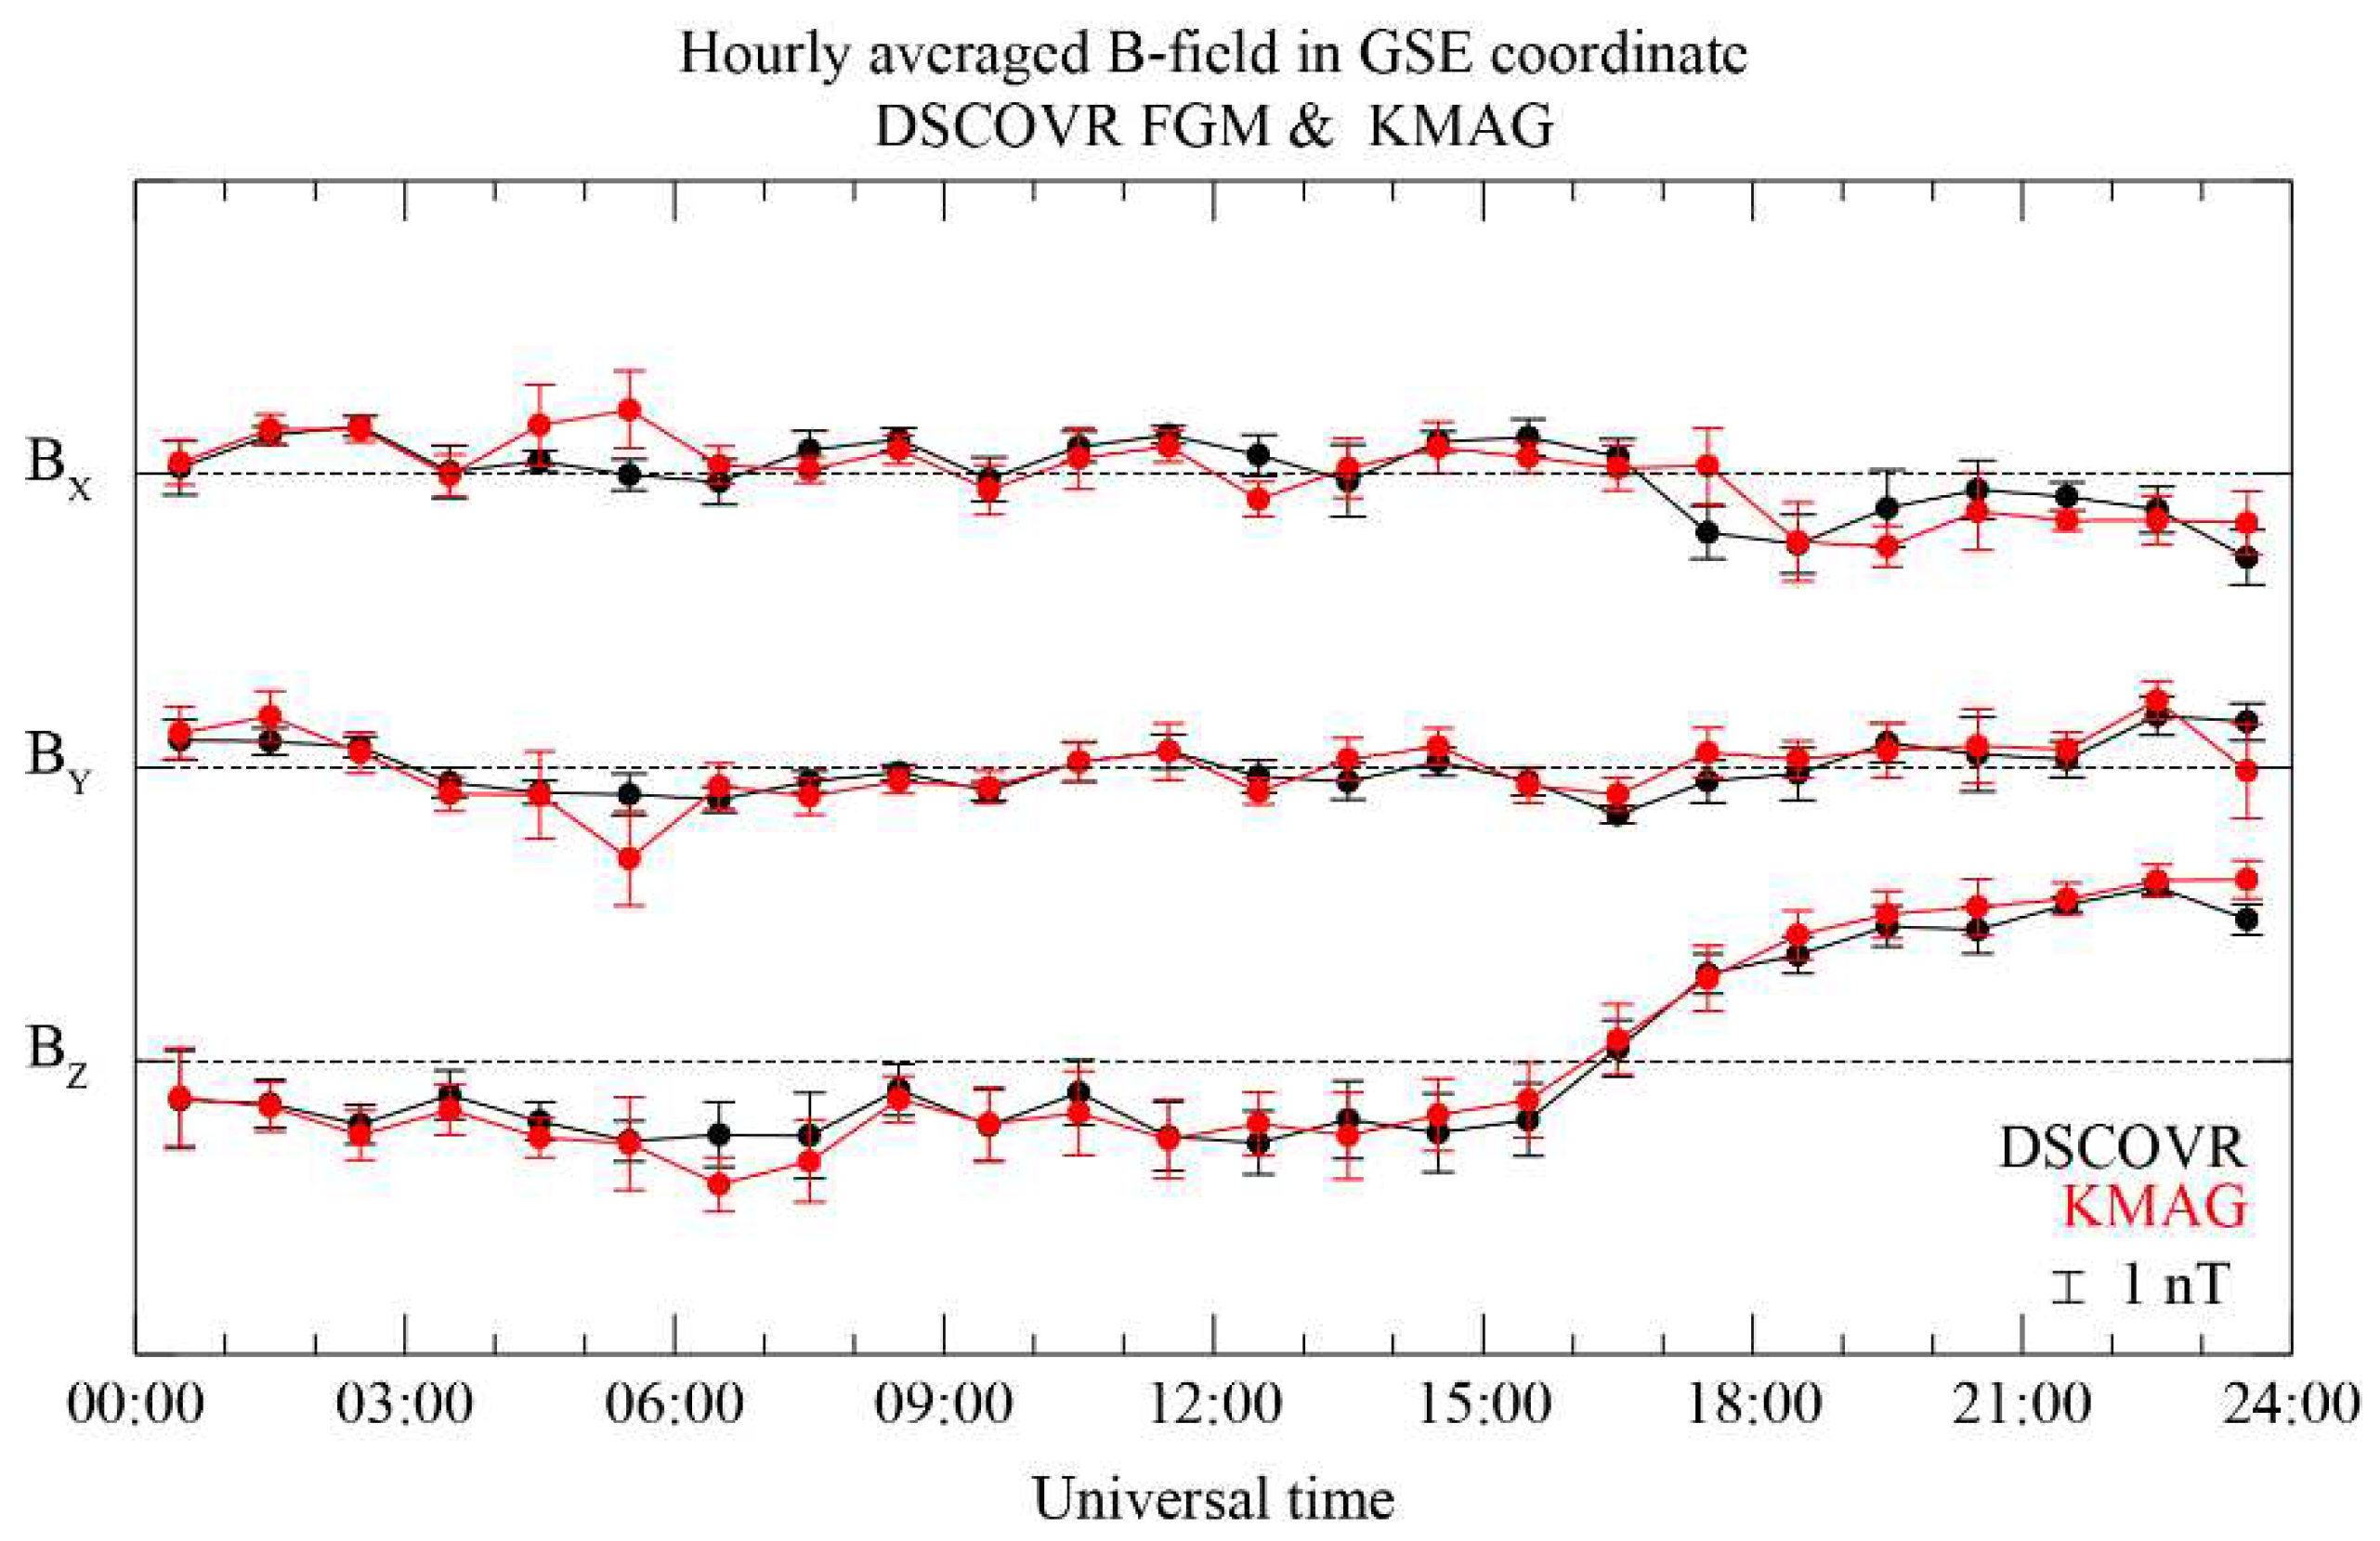
To evaluate the consistency of magnetic measurements from each position within the interplanetary region, we conducted a comparison of hourly averaged magnetic fields, as illustrated in
Figure 4. Given the absence of significant IMF magnetic field variations within a 1 hour window during quiet solar wind conditions, we calculated the standard deviation based on 1 h boxcar averaged data without temporal overlaps. The relationship between measurements shows notably high correlation coefficients of 0.77, 0.86, and 0.98 in the B
X, B
Y, and B
Z components, respectively, except for a 2 h interval starting from 04:00 UT. In addition, the background magnetic field, as measured by the DSCOVR FGM, exhibits a standard deviation of less than 1 nT throughout the entire observation period. MAG1 measurements show a comparable standard deviation of less than 1 nT over the same duration. However, there are instances of abrupt and substantial variations in the averaged magnitude and standard deviation, particularly for the B
X and B
Y components in the MAG1 measurement. These variations increase up to four times compared to the DSCOVR FGM measurements during the time intervals of 04:44 to 05:44 UT and 23:11 to 24:00 UT, which can be characterized as unknown disturbed periods.
This result suggests two perspectives. Firstly, the consistency of the observations between DSCOVR FGM and KMAG shows that KMAG is a reliable tool for magnetic field measurements. Secondly, considering that DSCOVR FGM can accurately observe the background magnetic field, the difference in measurement between the two satellites for the unknown disturbed period implies that the KMAG measurement may have originated from other magnetic sources.
Thus, for the results in
Figure 2a–c, it is considered that KMAG measured the magnetic fields related to different magnetic sources about the background field during the unknown disturbed period. To find the disturbed magnetic source, we conducted a survey of the satellite’s attitude data.
Figure 2d confirms that the satellite’s Euler angle with all directions suddenly varied for about 12 min from 05:24 to 05:36 UT. Variations in the spacecraft’s Euler angles indicate changes in its attitude, such as spinning or flipping, which is strongly linked to the disturbed magnetic field. When the spacecraft's attitude changes, the operation of electronic equipment within its body is typically expected. However, this finding is inadequate to explain the measurement taken before 05:24 UT. To find the disturbance source, an additional investigation was conducted to determine the relationship between spacecraft-generated disturbance and spacecraft maneuvering using the monitoring data of the valve drive electronics (VDE), as depicted in
Figure 2e.
The identification of VDE activation indicates that the circuit inside the spacecraft is carrying an electrical current relevant to the operation of the thrusters, as indicated by as turned-on or -off signals depending on whether electronic devices are activated or not. The VDE switching signal clearly coincides with the time of abrupt variations in KMAG observation data, or the unknown disturbance period. For example, the occurrence of the VDE switching-on signal for 1 h from 04:44 UT accurately coincides with abrupt variations in KMAG measurements. Consequently, these abrupt variations in the measurements, as depicted in
Figure 2a–c, indicate that the measurement includes artificial disturbances generated by the spacecraft.
4.2. Elimination of Artificial Disturbance
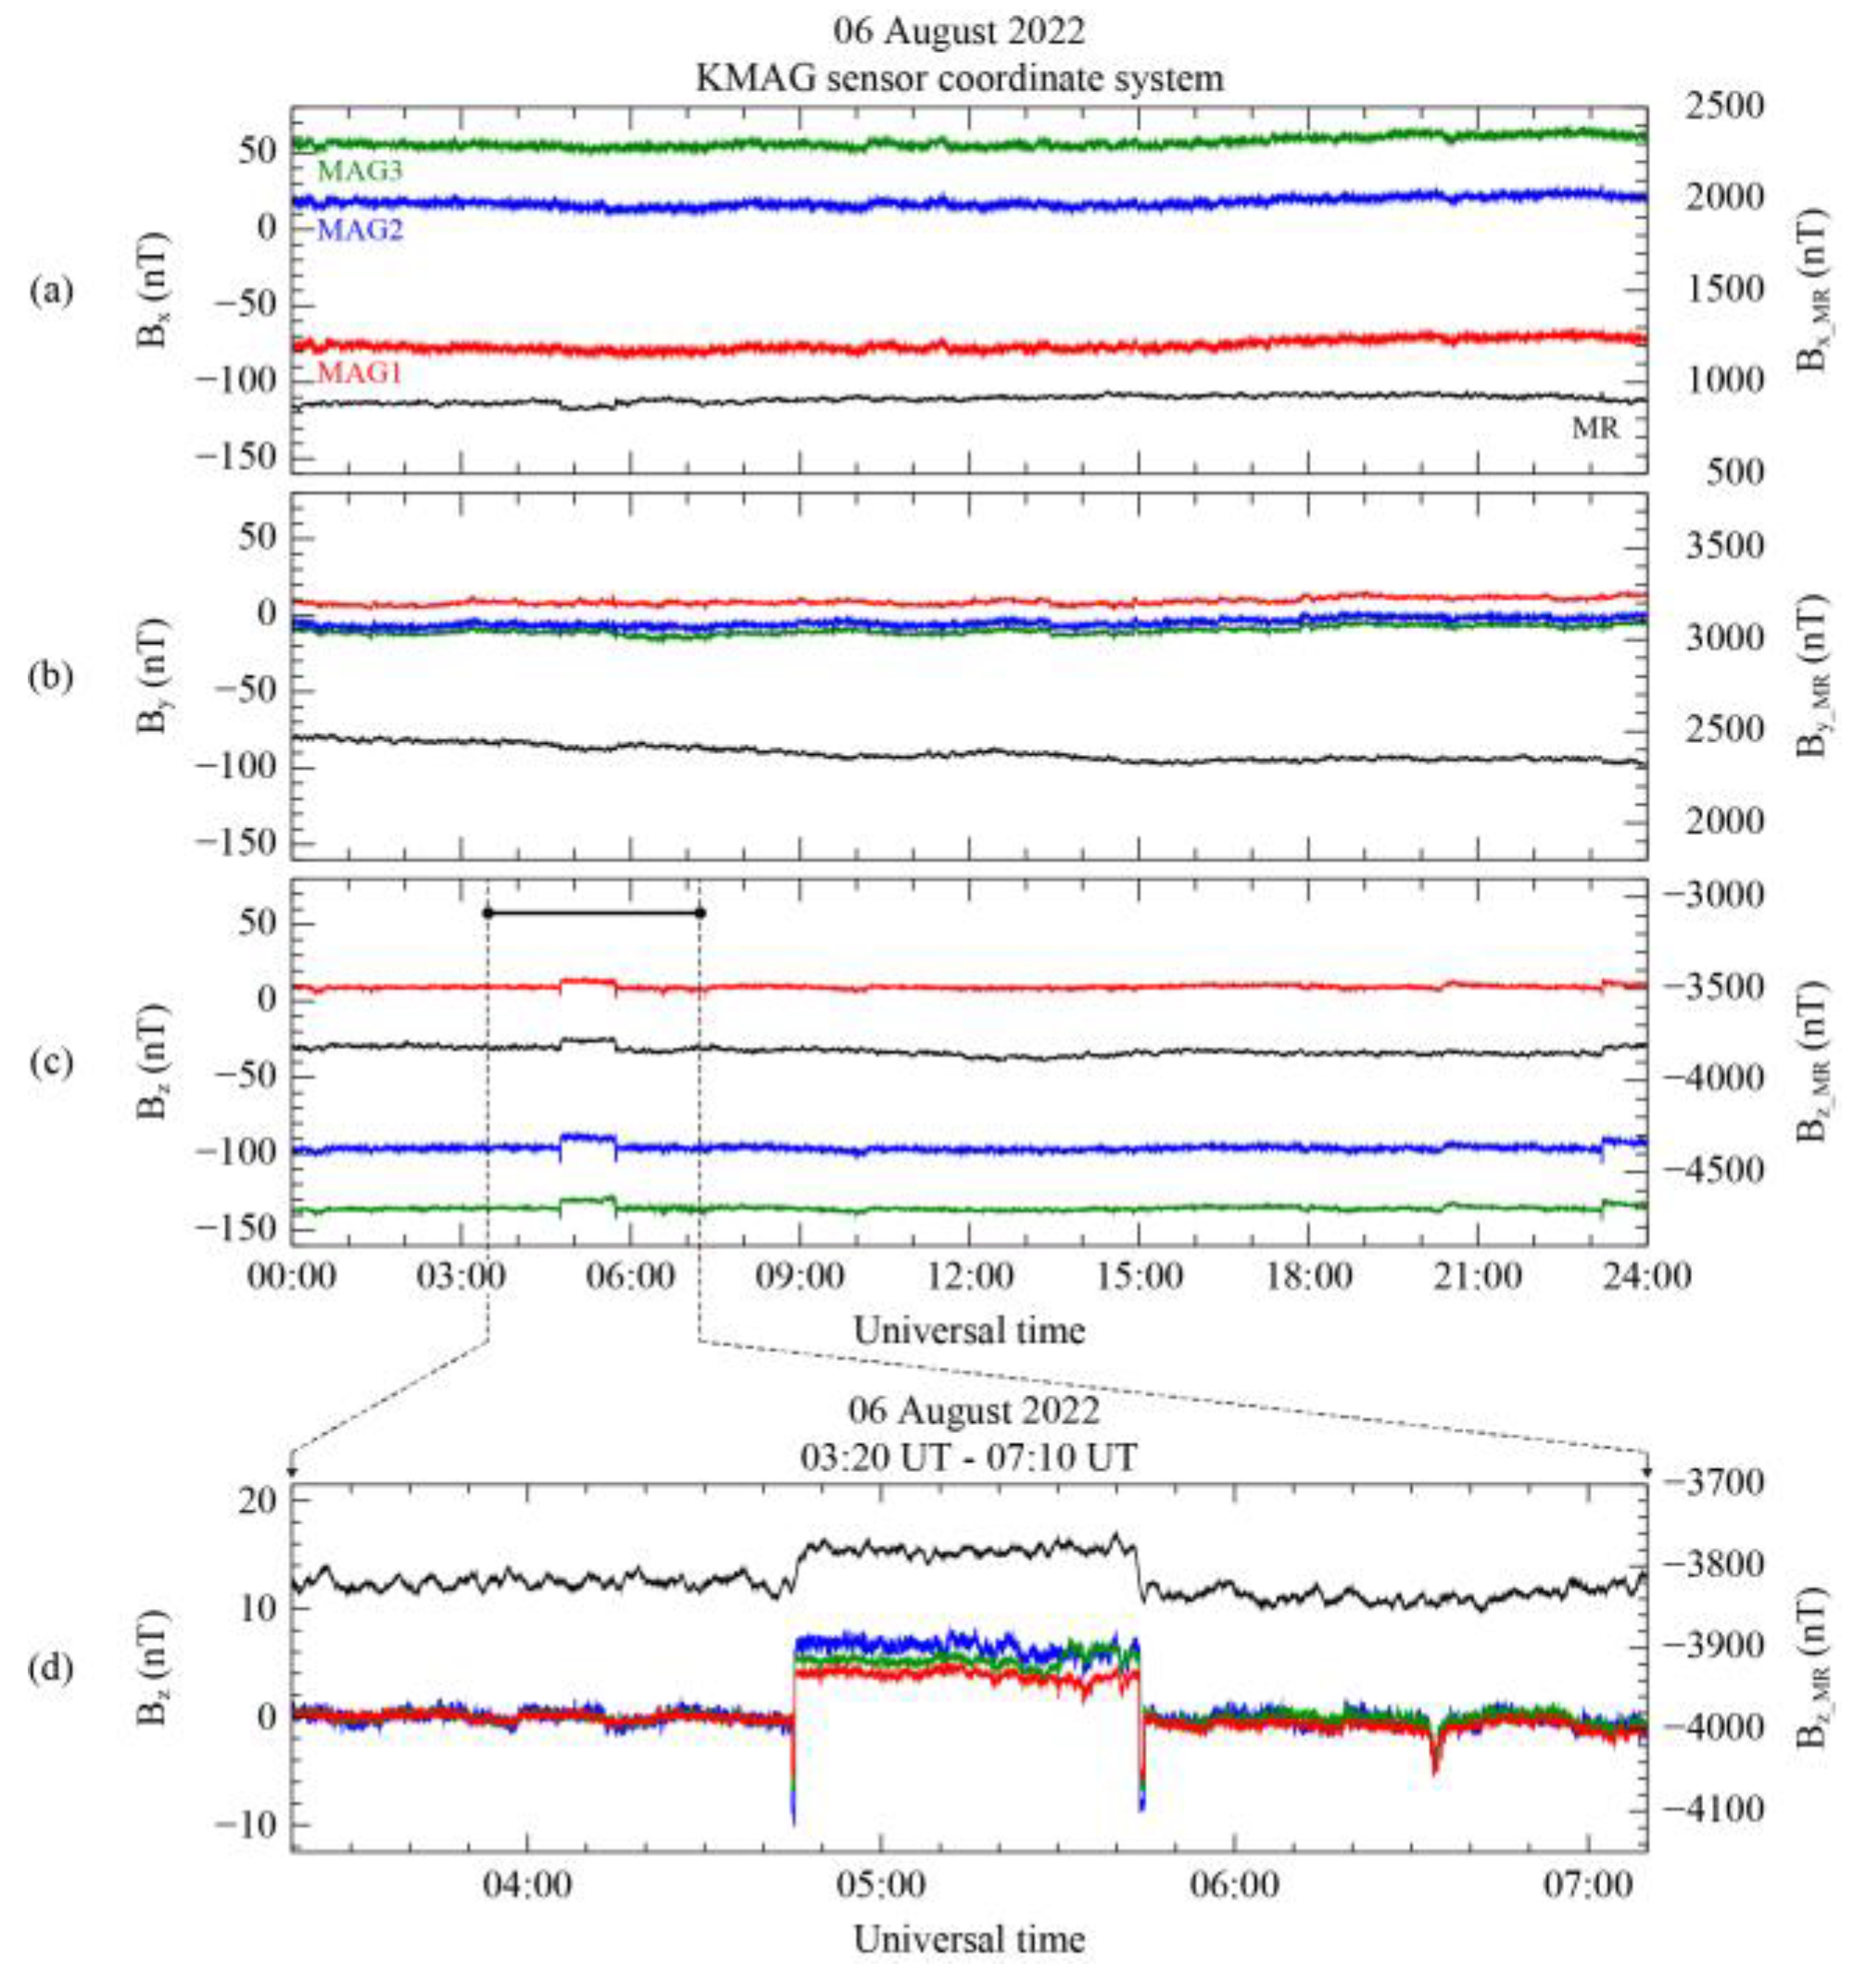
Figure 5 shows the measurements from MAG1, MAG2, MAG3, and MR sensors on 6 August 2022 in the sensor reference coordinate system. Note that since the zero offset calculation was not yet applied to each sensor’s data, the magnetic field observation in
Figure 5 does not represent a realistic value for the background. The MAG and MR measurements are expressed on the left and right axes, respectively, in units of nT. In
Figure 5a, the abrupt changes in the B
X component from all MAG sensors are not shown from 04:44 to 05:44 UT. However, there is a decrease of approximately 40 nT in the measured B
X in MR. As shown in
Figure 5b, although the B
Y from the MR sensor gradually decreases over time by about 100 nT, the MAG and MR sensor measurements show no evidence of the artificial disturbance toward the Y-direction. The B
Z components from the MAG and MR sensors in
Figure 5c simultaneously show a step-like shape disturbance from 04:44 to 05:44 UT.
The magnitude of this disturbance increased suddenly compared to the period before the disturbance, by ~4.5 nT for MAG1, ~6.1 nT for MAG2, ~7.0 nT for MAG3, and ~60.0 nT for MR. These varying disturbance magnitudes are dependent on the distance of each sensor from the center of the spacecraft. The relationship between disturbance magnitude and sensor position obviously indicates the presence of an additional magnetic source within the spacecraft body. By analyzing the readings of the MR sensor, which detected a disturbance in the B
X and B
Z components, it can be deduced that the magnetic disturbance was caused by a source with a magnetic moment aligned parallel to the B
Y component. Hence, the detection of magnetic disturbances with all sensors exhibiting distance-dependent variations in the same directional components again strongly supports that these disturbances originated from within the satellite’s interior.
Figure 5d shows a zoomed-in view of the 230 min interval of the BZ component of the magnetic field measurement for all KMAG sensors, indicated by the black bar in
Figure 5c. Note that the measurements from all MAG sensors were adjusted by subtracting the daily average, except for the MR measurement. Spike-like disturbances are observed just before and after the step-like disturbance in the measurements obtained from all MAG sensors. The spike-like disturbances have a shorter interval of ~2 min compared to the step-like disturbances. However, since the MR sensor measurement was averaged in the preprocessing, the spike-like disturbance is not presented in the MR sensor measurement. For this reason, MR sensor measurement is useful for the removal of step-like disturbance only.
Therefore, our strategy is to preferentially eliminate the step-like disturbance from the data of each MAG by using MR measurements, and then remove the spike disturbance using only MAG data. The time interval over the disturbance elimination is selected from 04:30 UT to 06:00 UT to isolate the targeted step-like disturbance. Using the gradiometer technique mentioned in
Section 3.1, we determined the direction for the maximum variance to find the scaling factor and the rotation matrix. To compare the most evident difference from the magnetic source inside the spacecraft body, we used the data from the inboard sensor and the outmost sensor of the spacecraft, MR and MAG1.
As shown in
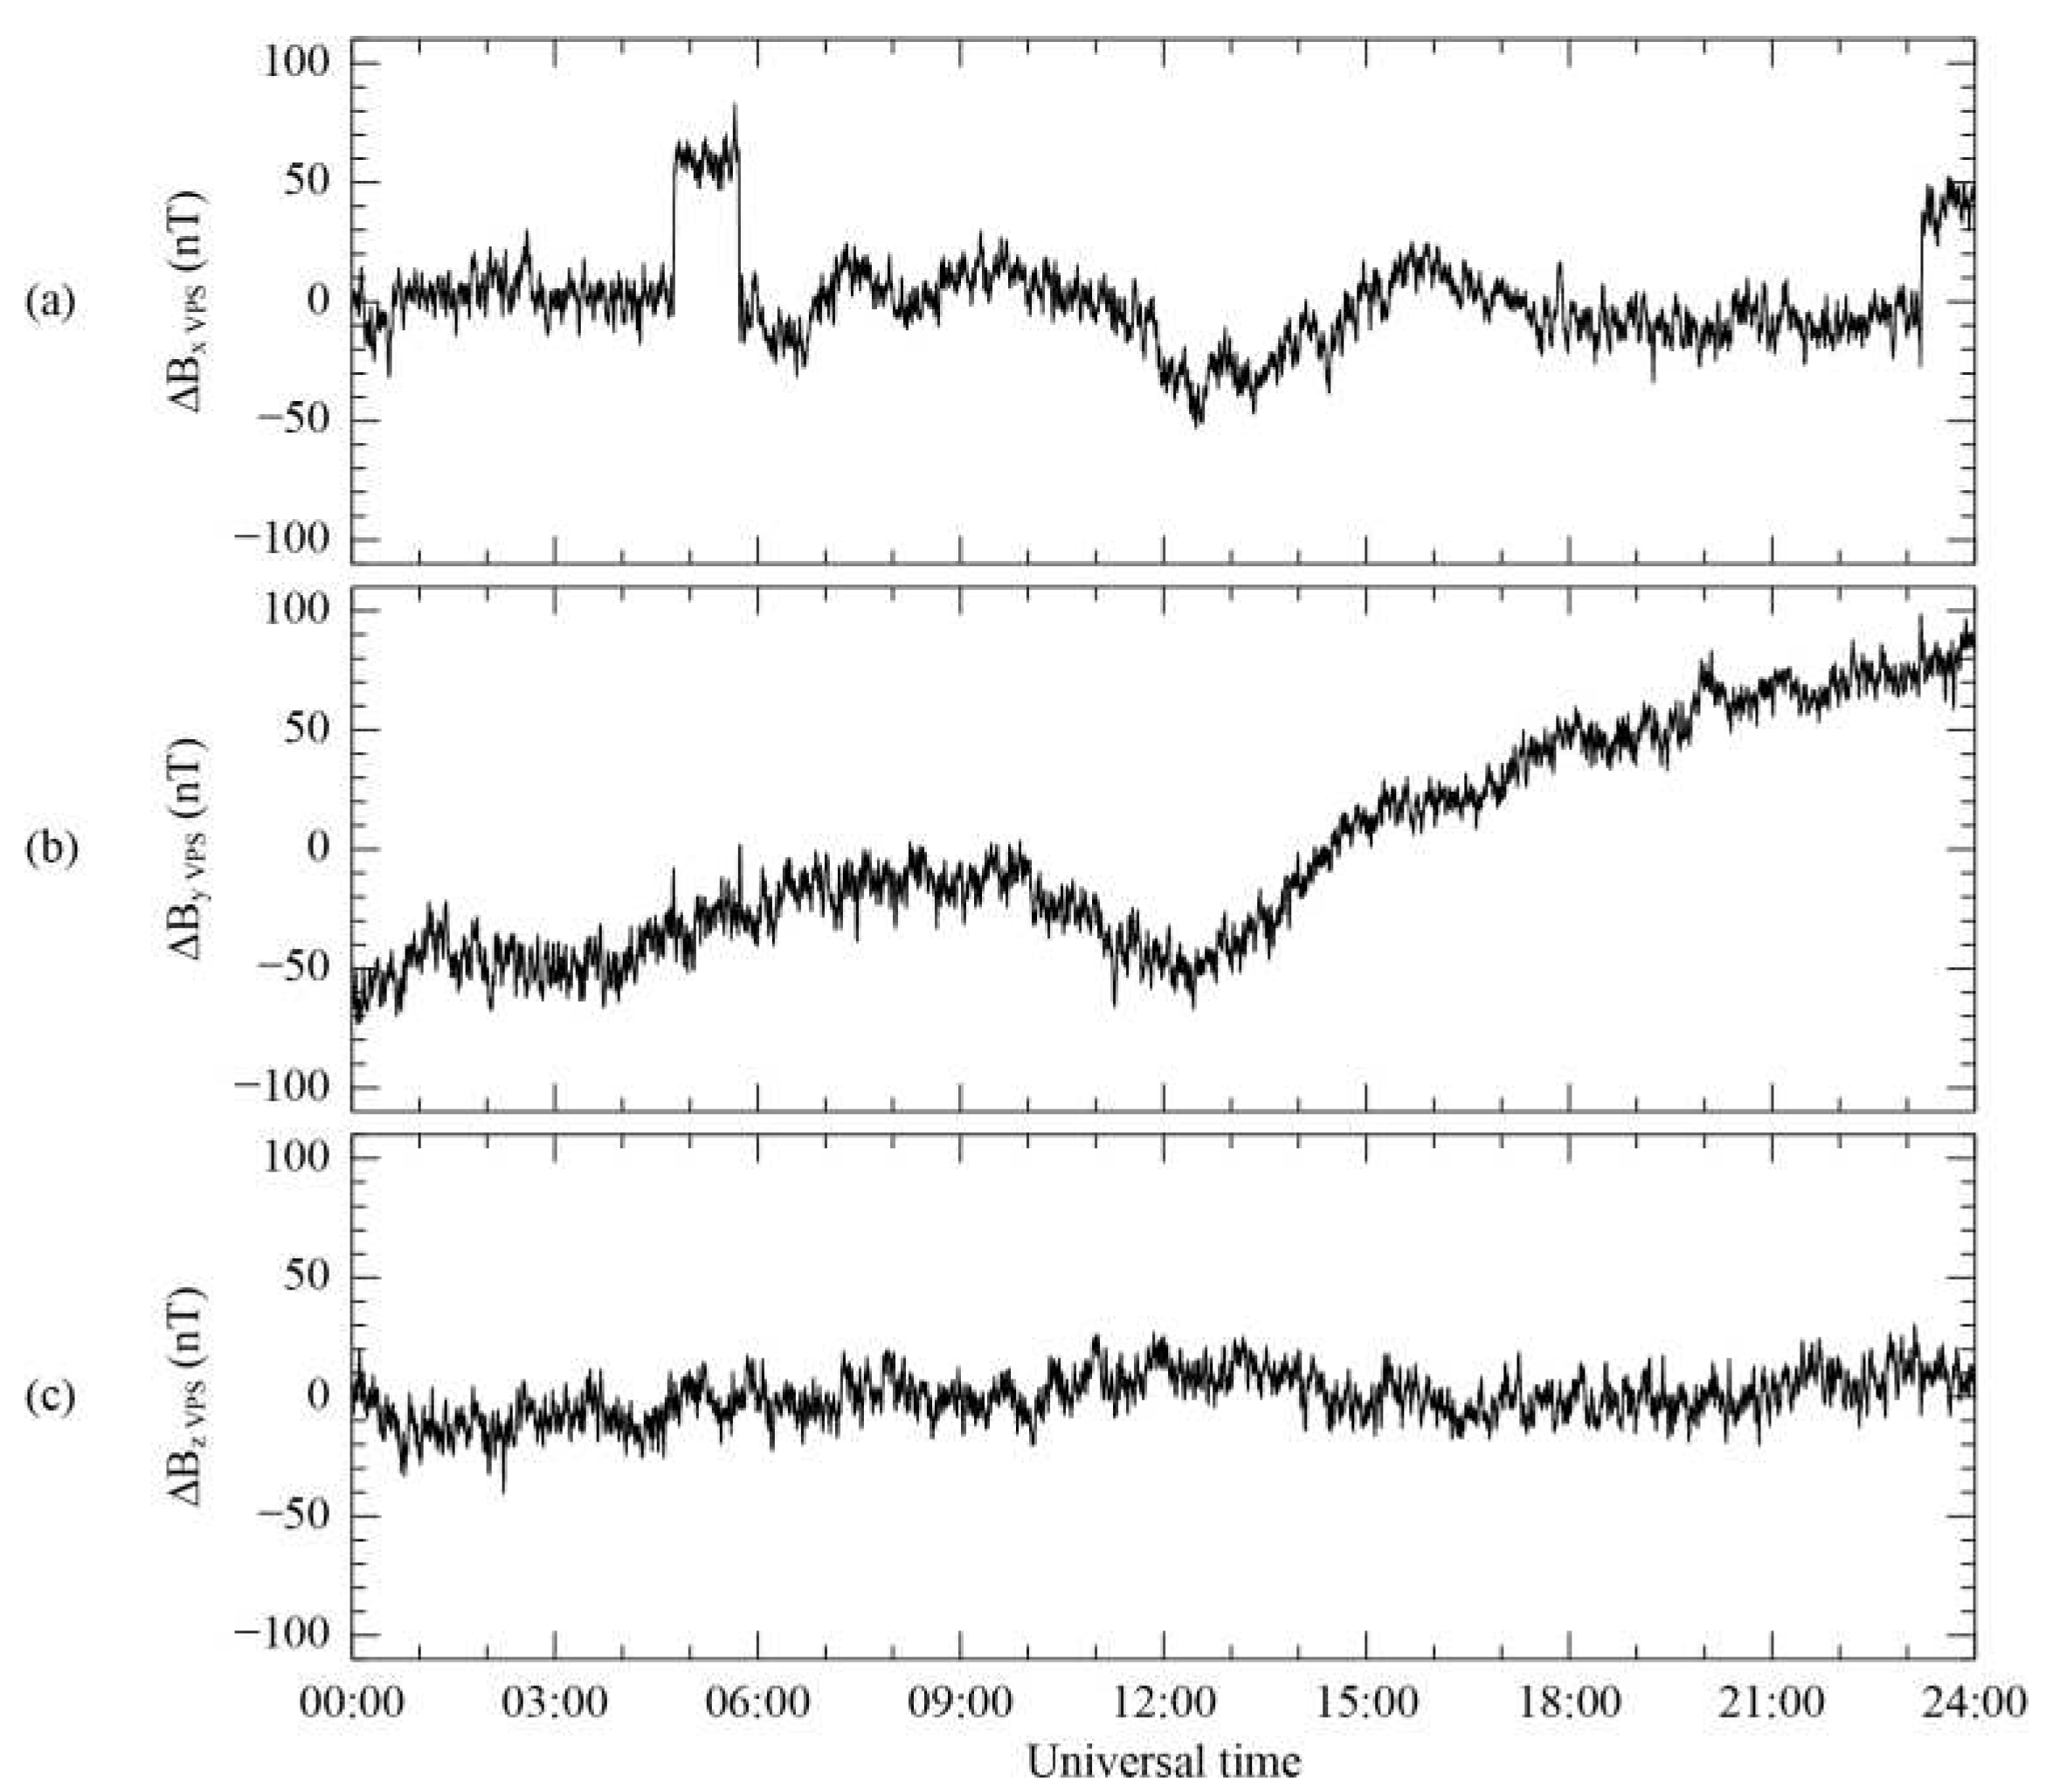
Figure 6, the step-like disturbance was extracted in the difference
ΔB0,ij between the MAG1 and MR sensors for each component in the VPS coordinate system using the PCA method. Specifically,
Figure 6a–c shows these components, which were rotated to align with the directions of maximum, intermediate, and minimum variance. These components correspond to the LMN coordinate components explained in
Section 3.1. In
Figure 6a, the step-like disturbance is also extracted for the selected time interval and the second disturbance after 23:00 UT. The extraction of both step-like disturbances to the maximum variance components at the same time implies that both disturbances can be eliminated in the first-order correction process simultaneously.
Figure 6b shows the largest change of ΔB
Y, by ~140 nT across all time periods, while
Figure 6a shows that ΔB
X changes by ~90 nT over the entire period of the data. However, it is important to note that the variance direction is determined based on the difference values of ΔB
X ~65 nT, ΔB
Y ~40 nT, and ΔB
Z ~20 nT for the isolated time interval. In other words, the rotation matrix used to transform to the VPS coordinates only reflects these difference values in the isolated time range.
Figure 6c shows the minimum variation in the same interval, representing the minimum variance direction. Since the MR measurement initially includes high-frequency noise, the result obtained by subtracting both sensor measurements reflects this noise in all components, as demonstrated in
Figure 6a–c. However, in the first-order correction process, the high-frequency noise can be ignored due to the significantly more significant variance of the step-like disturbance.
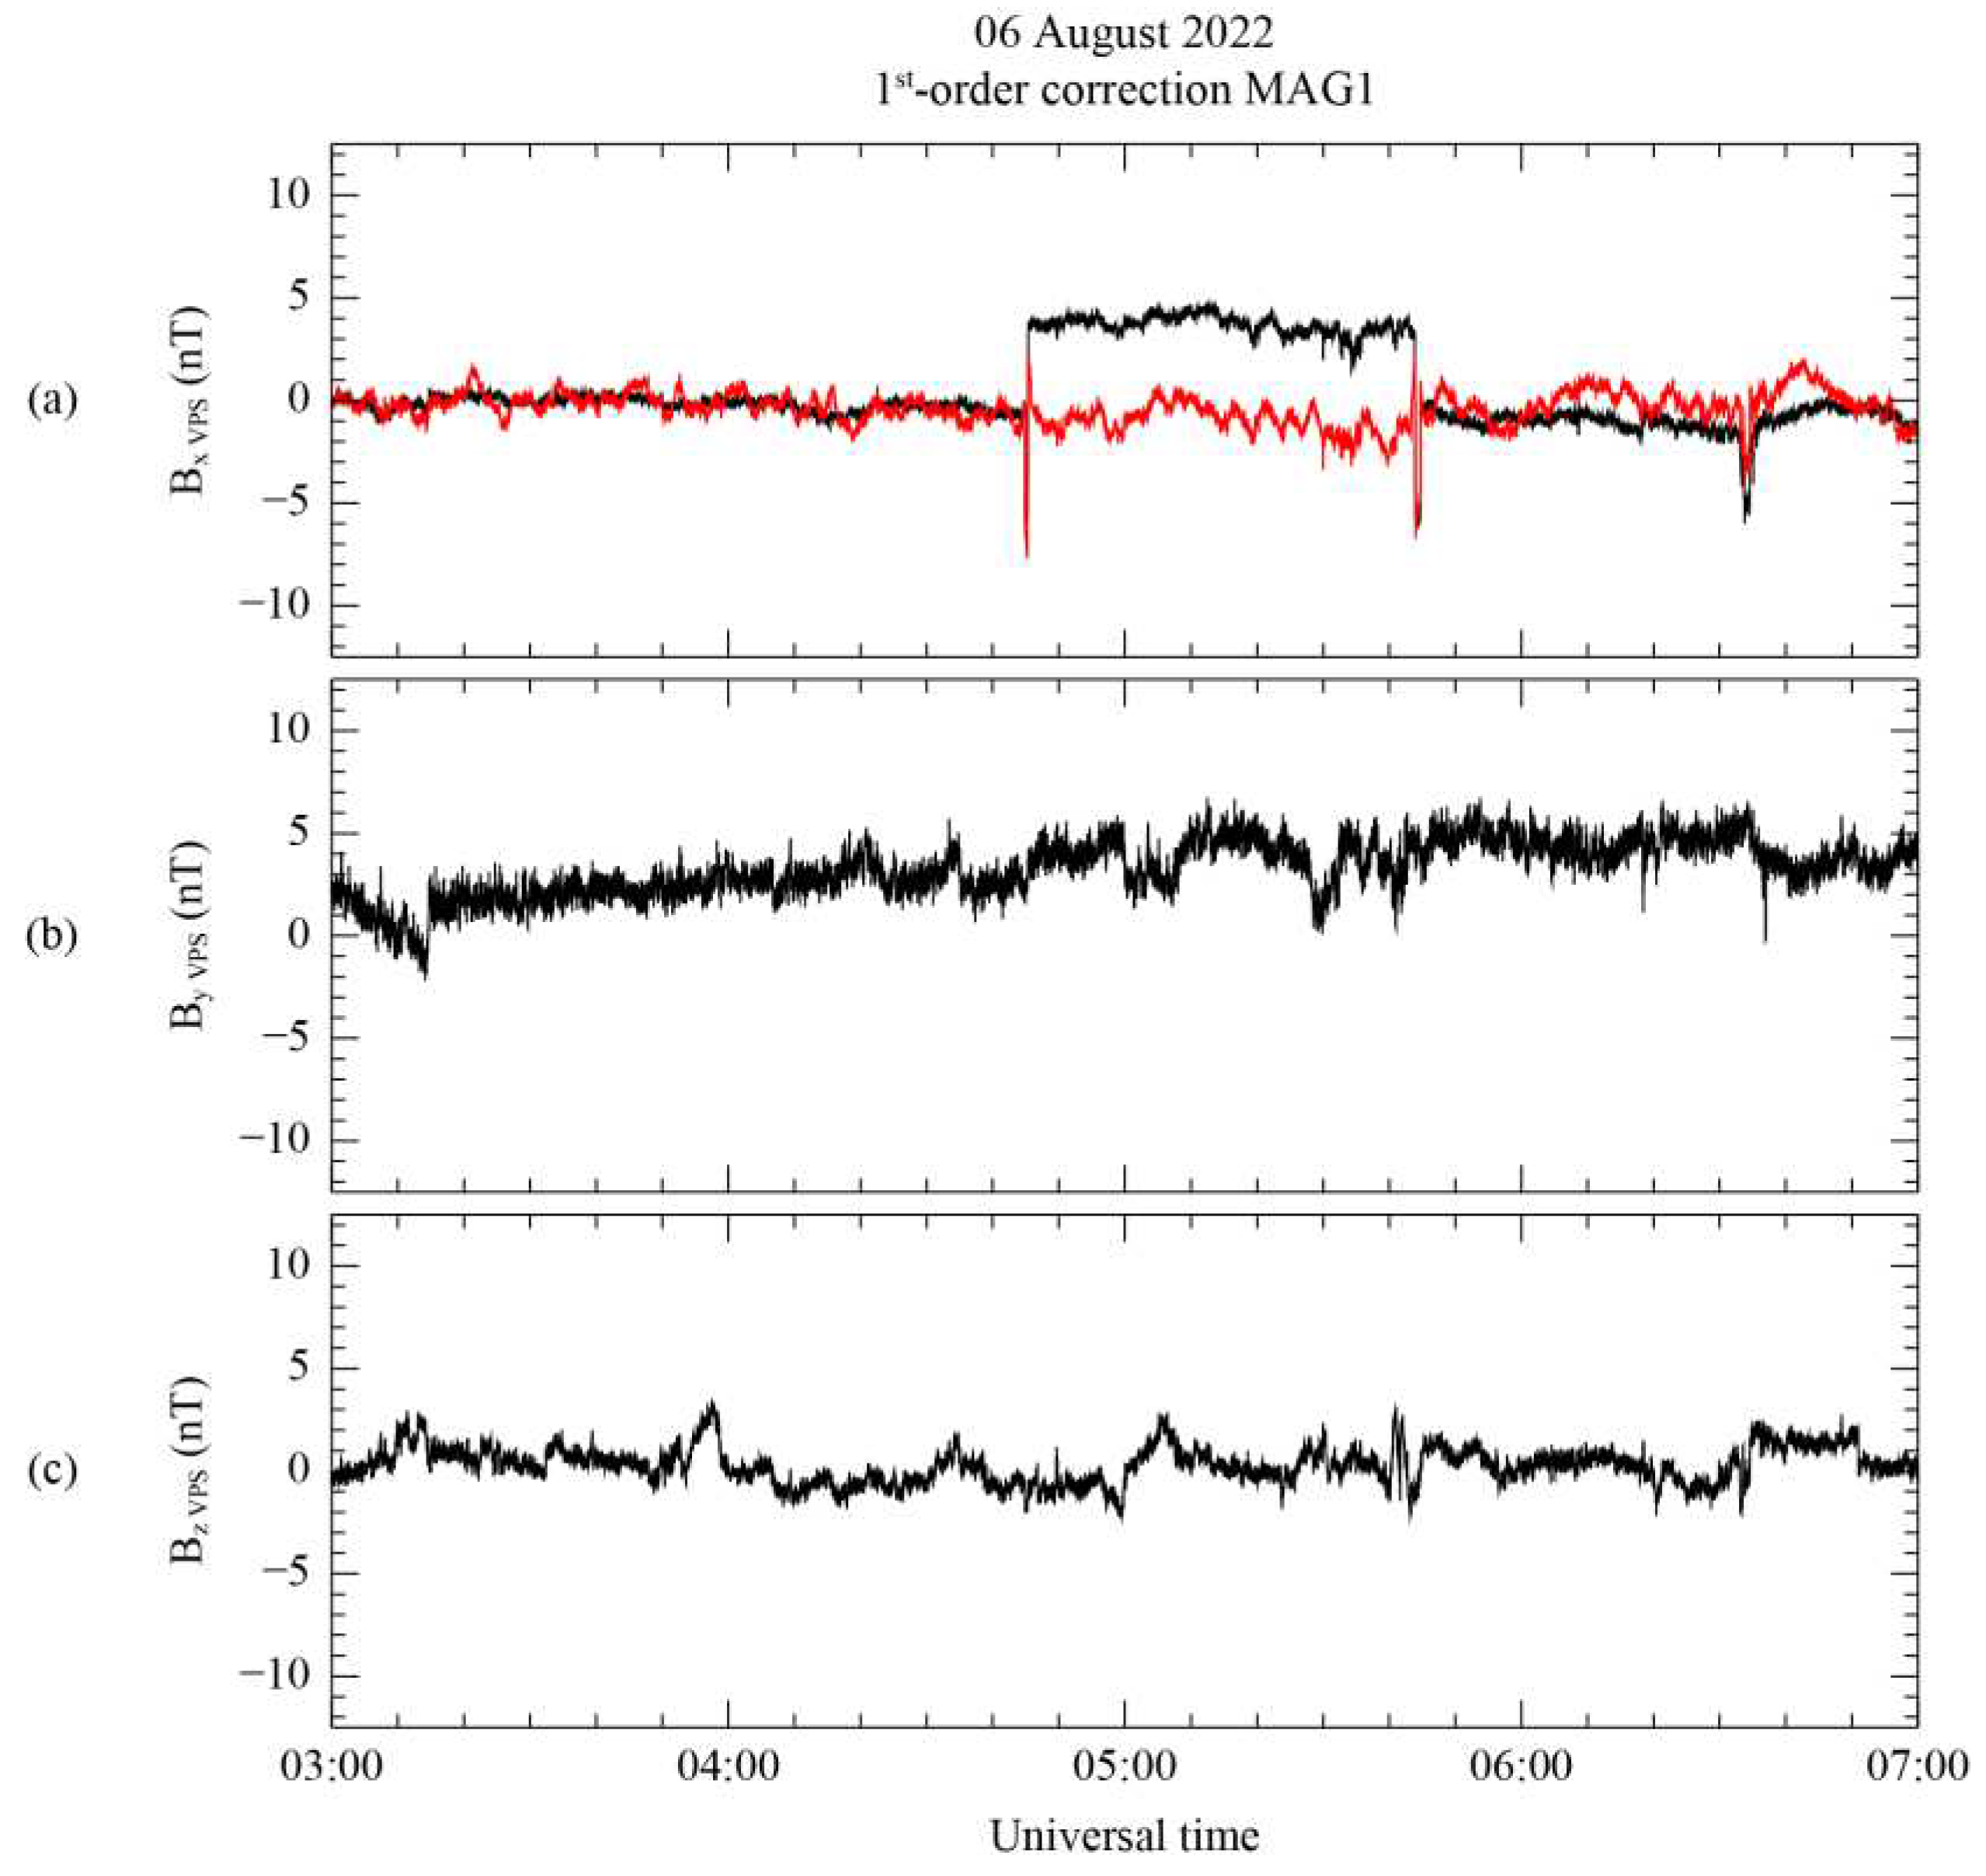
The initial measurement and the first-order corrected results are shown in on the initial VPS coordinate system in
Figure 7 as black and red lines, respectively, with the mean value subtracted. In
Figure 7a, the targeted step-like disturbance occurring between 04:45 and 05:44 UT is successfully eliminated in the maximum-variance direction, while the spike-like disturbance still persists. Additionally, the initial MR measurement introduces high-frequency noise in the first-order corrected result, which is subsequently mitigated following the method outlined in
Section 3.2. Despite the correction process, the corrected result after 05:44 UT differs from the uncorrected measurement. According to Constantinescu et al. [
12], this discrepancy arises because spacecraft-generated disturbances continue to affect magnetic field measurements even after the maneuver has concluded. In accordance with Equations (6)-(8), it is important to note that the intermediate and minimum variance direction components in
Figure 7b and 7c do not influence this correction step.
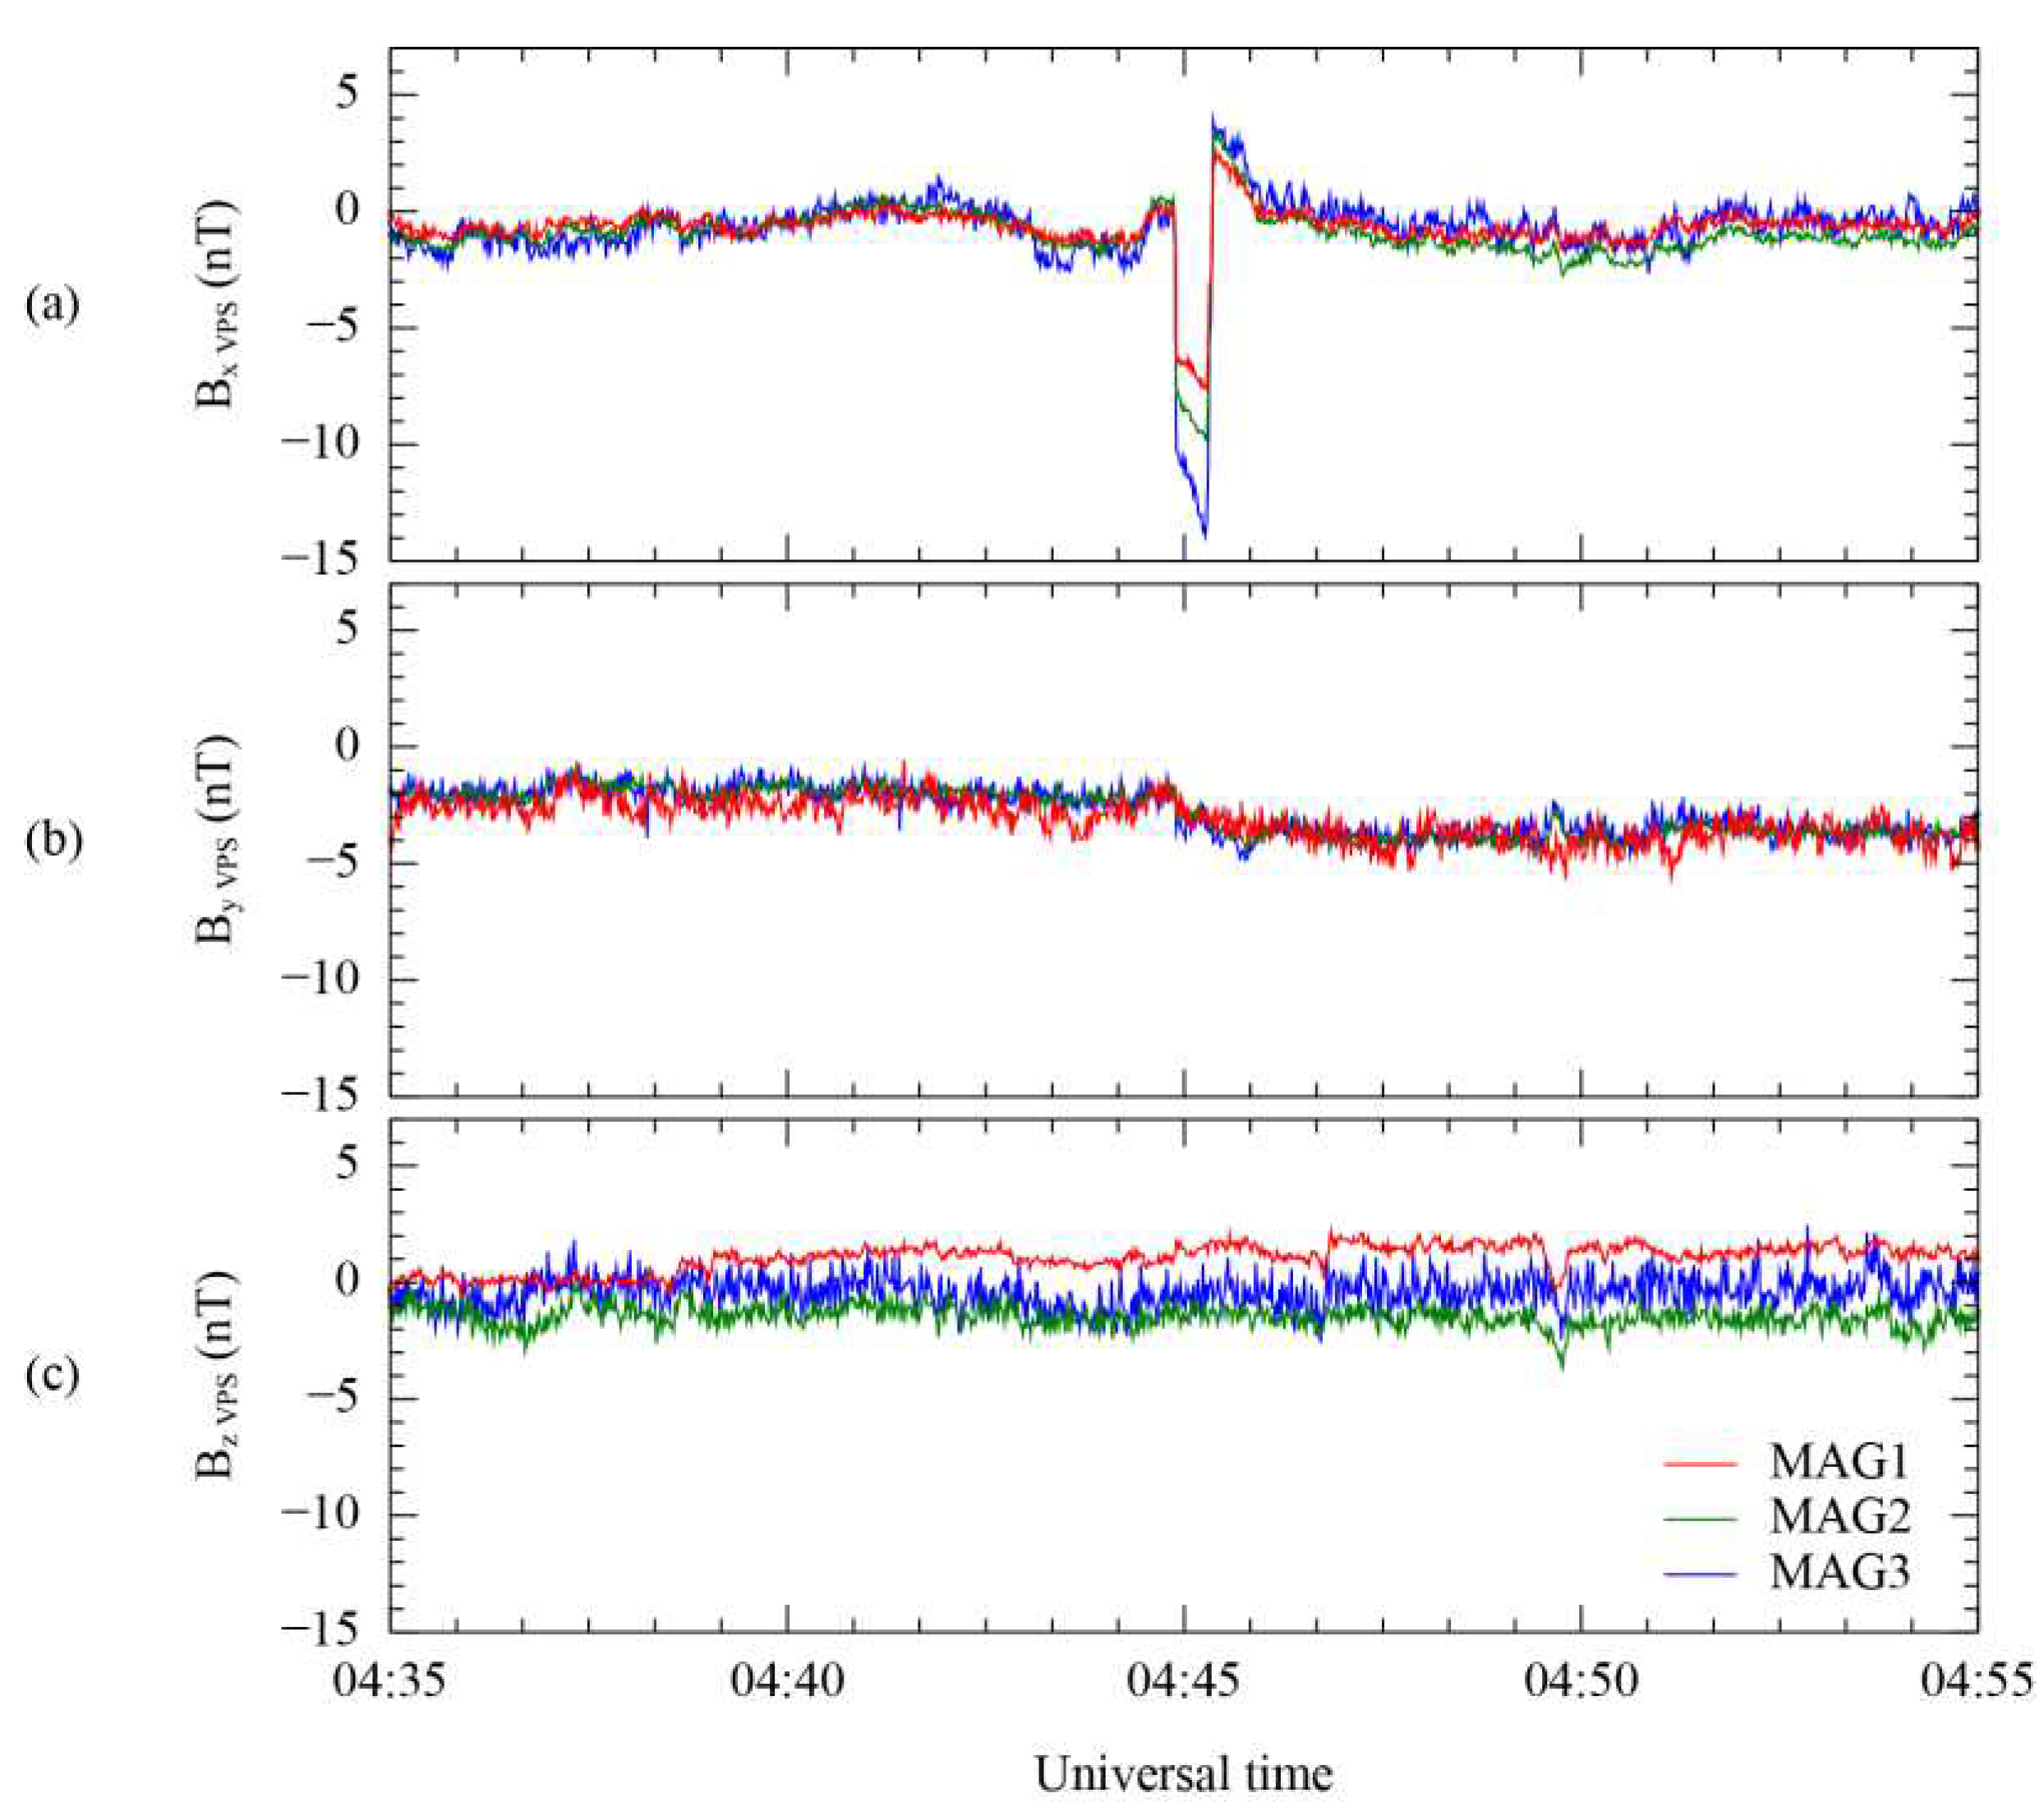
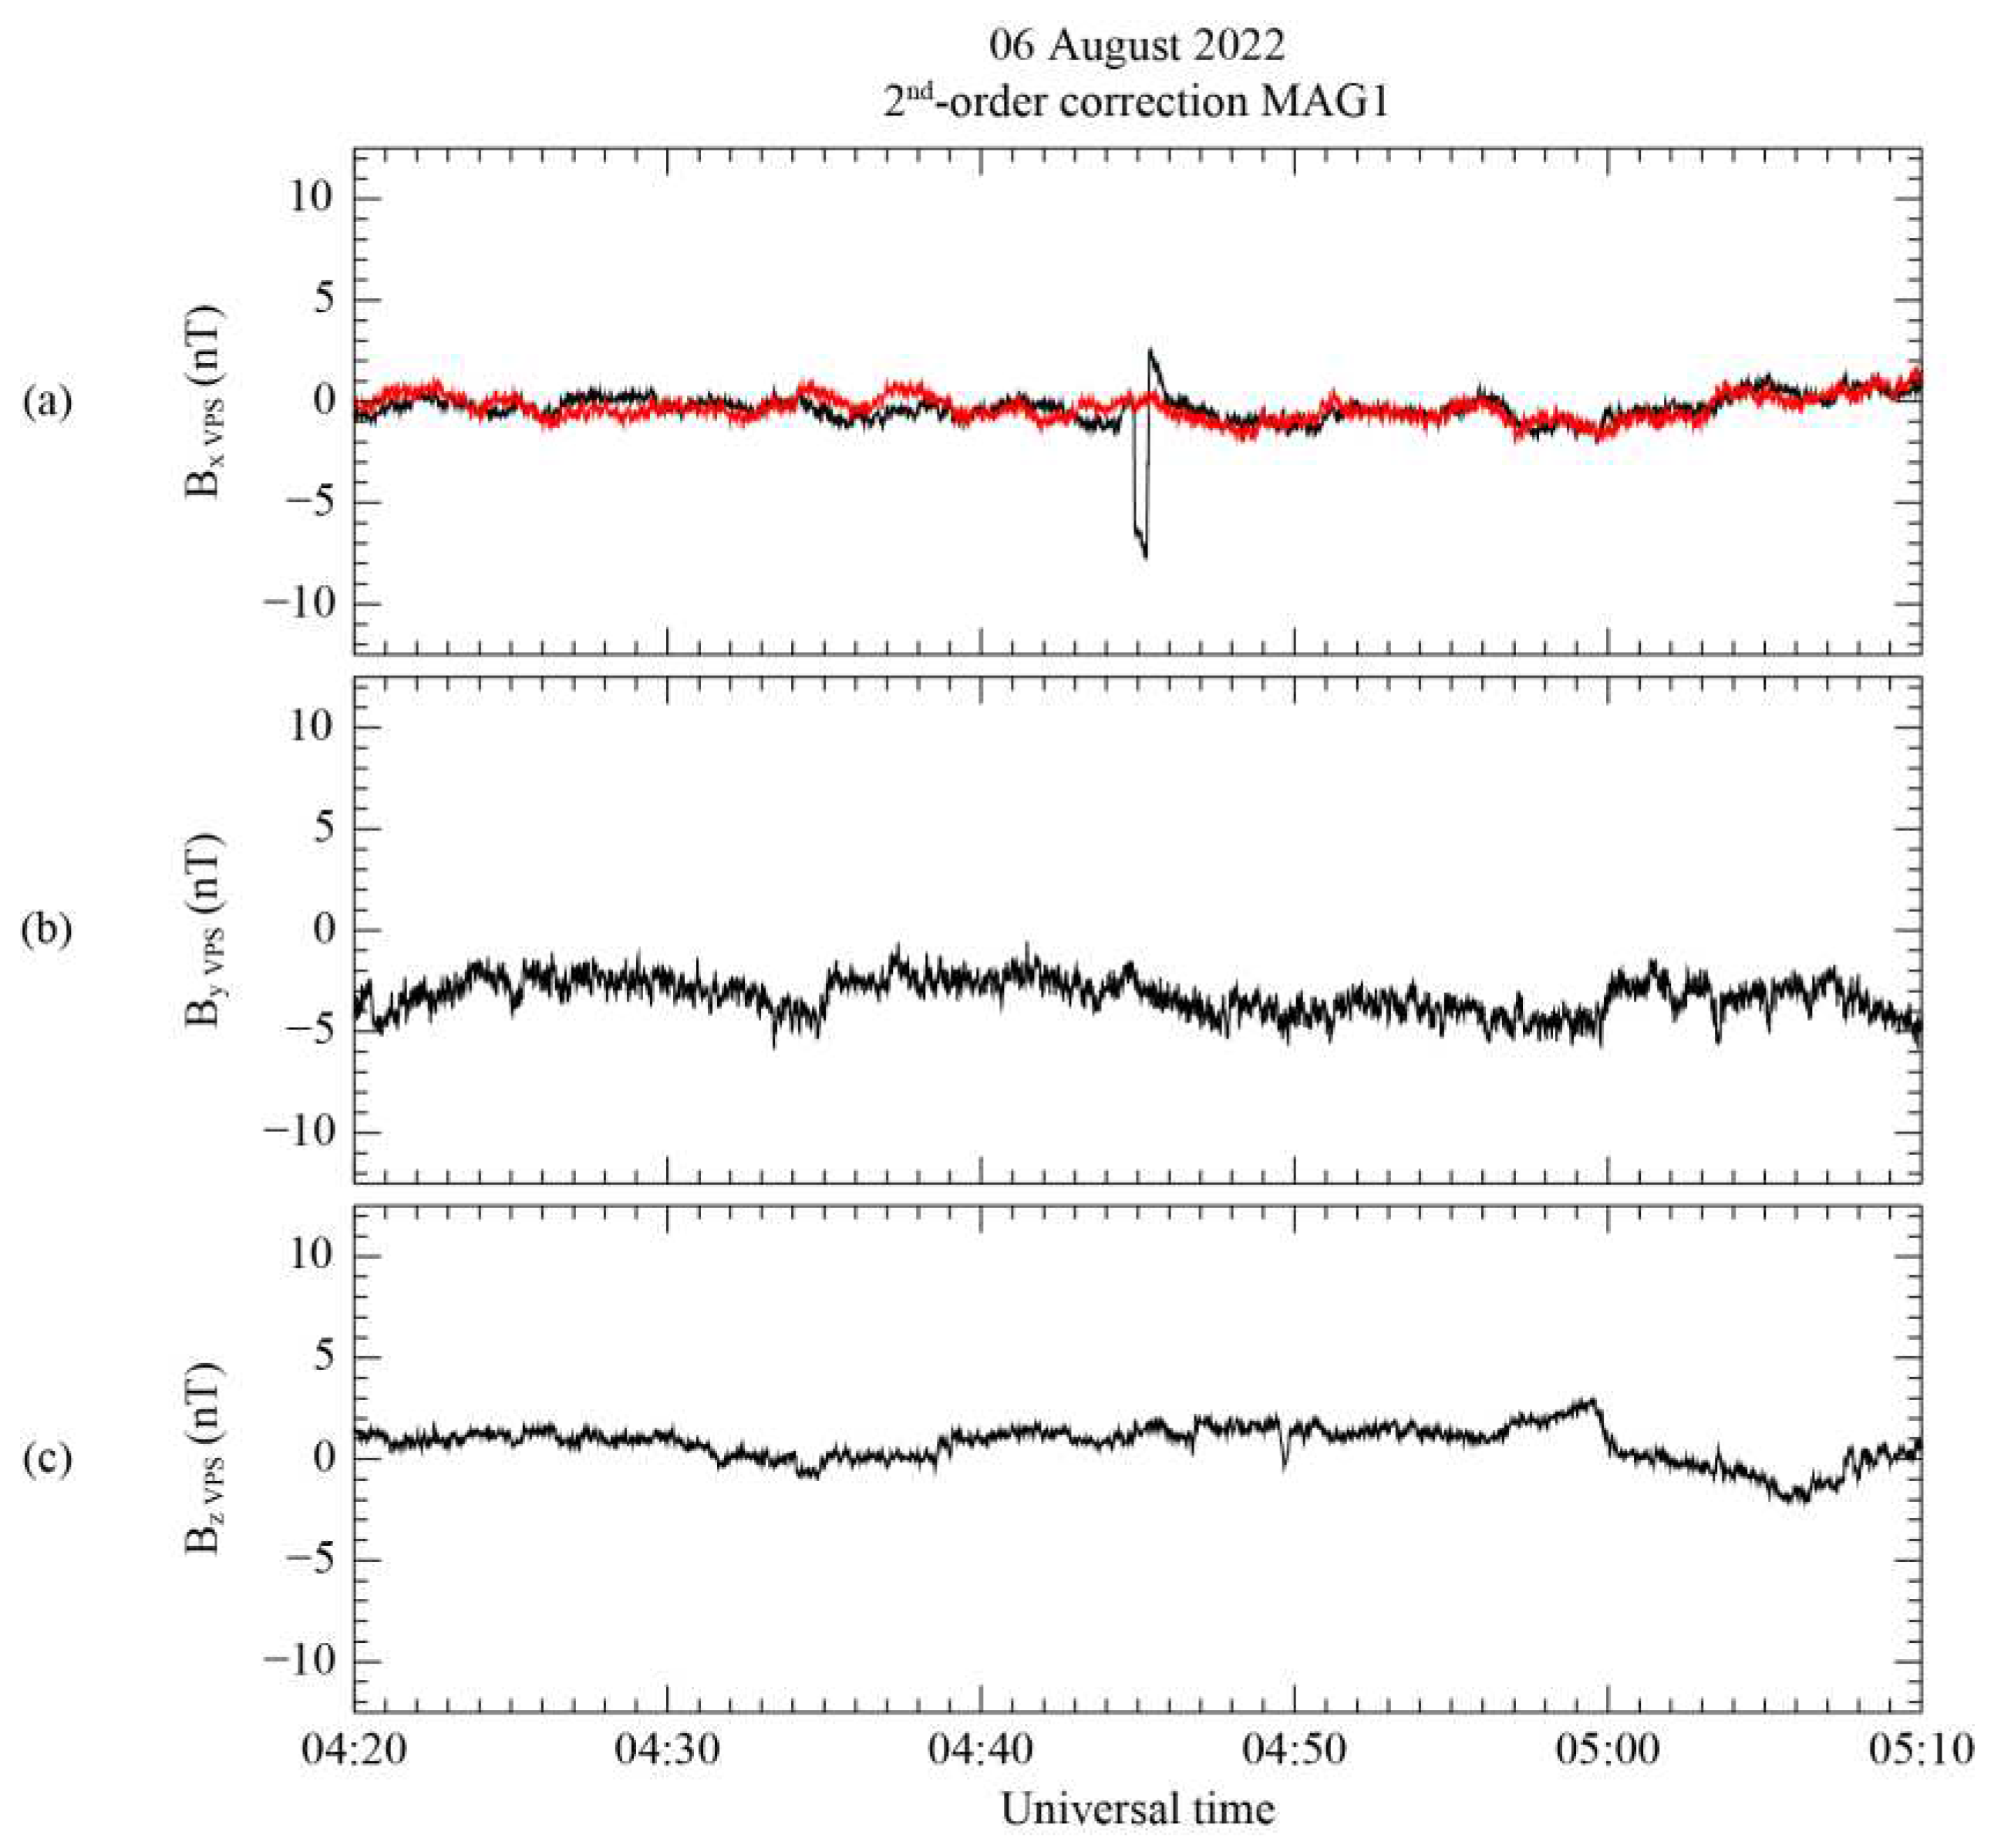
Figure 8 shows a spike-like disturbance still present in the first-order corrected results of measurements from the three MAG sensors. We selected an isolated time range of 6 min from 04:42 to 04:48 UT to decouple the spike-like disturbances after the first-order correction. The disturbance in this period, shown in
Figure 8, corresponds to the spike just before the step-like disturbance. The spike-like disturbance in the Bx components on the VPS coordinates is extracted from the first-order corrected results of the three MAG sensors using the calculated rotation matrix, as depicted in
Figure 8a. The minimum peak magnitude of each disturbance on the Bx component is −7.5 nT for MAG1, −9.8 nT for MAG2, and −13.8 nT for MAG3. Similar to the case of the step-like disturbance, this result also indicates that the magnitude of these disturbances is well sorted for the differences in distance between magnetometers. On the other hand, other components in
Figure 8b,c show only high-frequency noise initially included in the measurement. The high-frequency noise tends to have a larger amplitude in the MAG3 measurement than MAG1 and MAG2. This tendency for noise is also shown in
Figure 8a. Therefore, we can expect that the different amplitudes of high-frequency noise affect the results after the second-order correction according to Equations (6)-(8) when we use only MAG sensors to conduct the second-order correction.
In the second-order correction, the initially corrected results are adjusted by the maximum variance direction to extract the spike-like disturbance. Since the MR sensor cannot measure spike-like disturbances, the measurement from the MAG3 sensor is used to eliminate the disturbance. The MAG3 sensor is located farthest from the MAG1 sensor. The second-order correction result of the MAG1 measurement over the remaining spike-like disturbance is plotted in
Figure 9. In the VPS coordinate system for the first-order correction result, the first-order and second-order correction results are depicted as black and red lines, respectively, using the same format as
Figure 7. As in the case of
Figure 7, the second-order correction is conducted only for the component in the maximum variance direction. In addition, although there are two spike-like disturbances just before and after the step-like disturbance, we perform the correction for the preferentially observed spike-like disturbance in time as a target. In
Figure 9a, the second-order correction process eliminates the targeted spike-like disturbance from 04:44 to 04:47 UT from the maximum variance direction. Mitigation of the generated high-frequency noise after the second-order correction was also conducted.
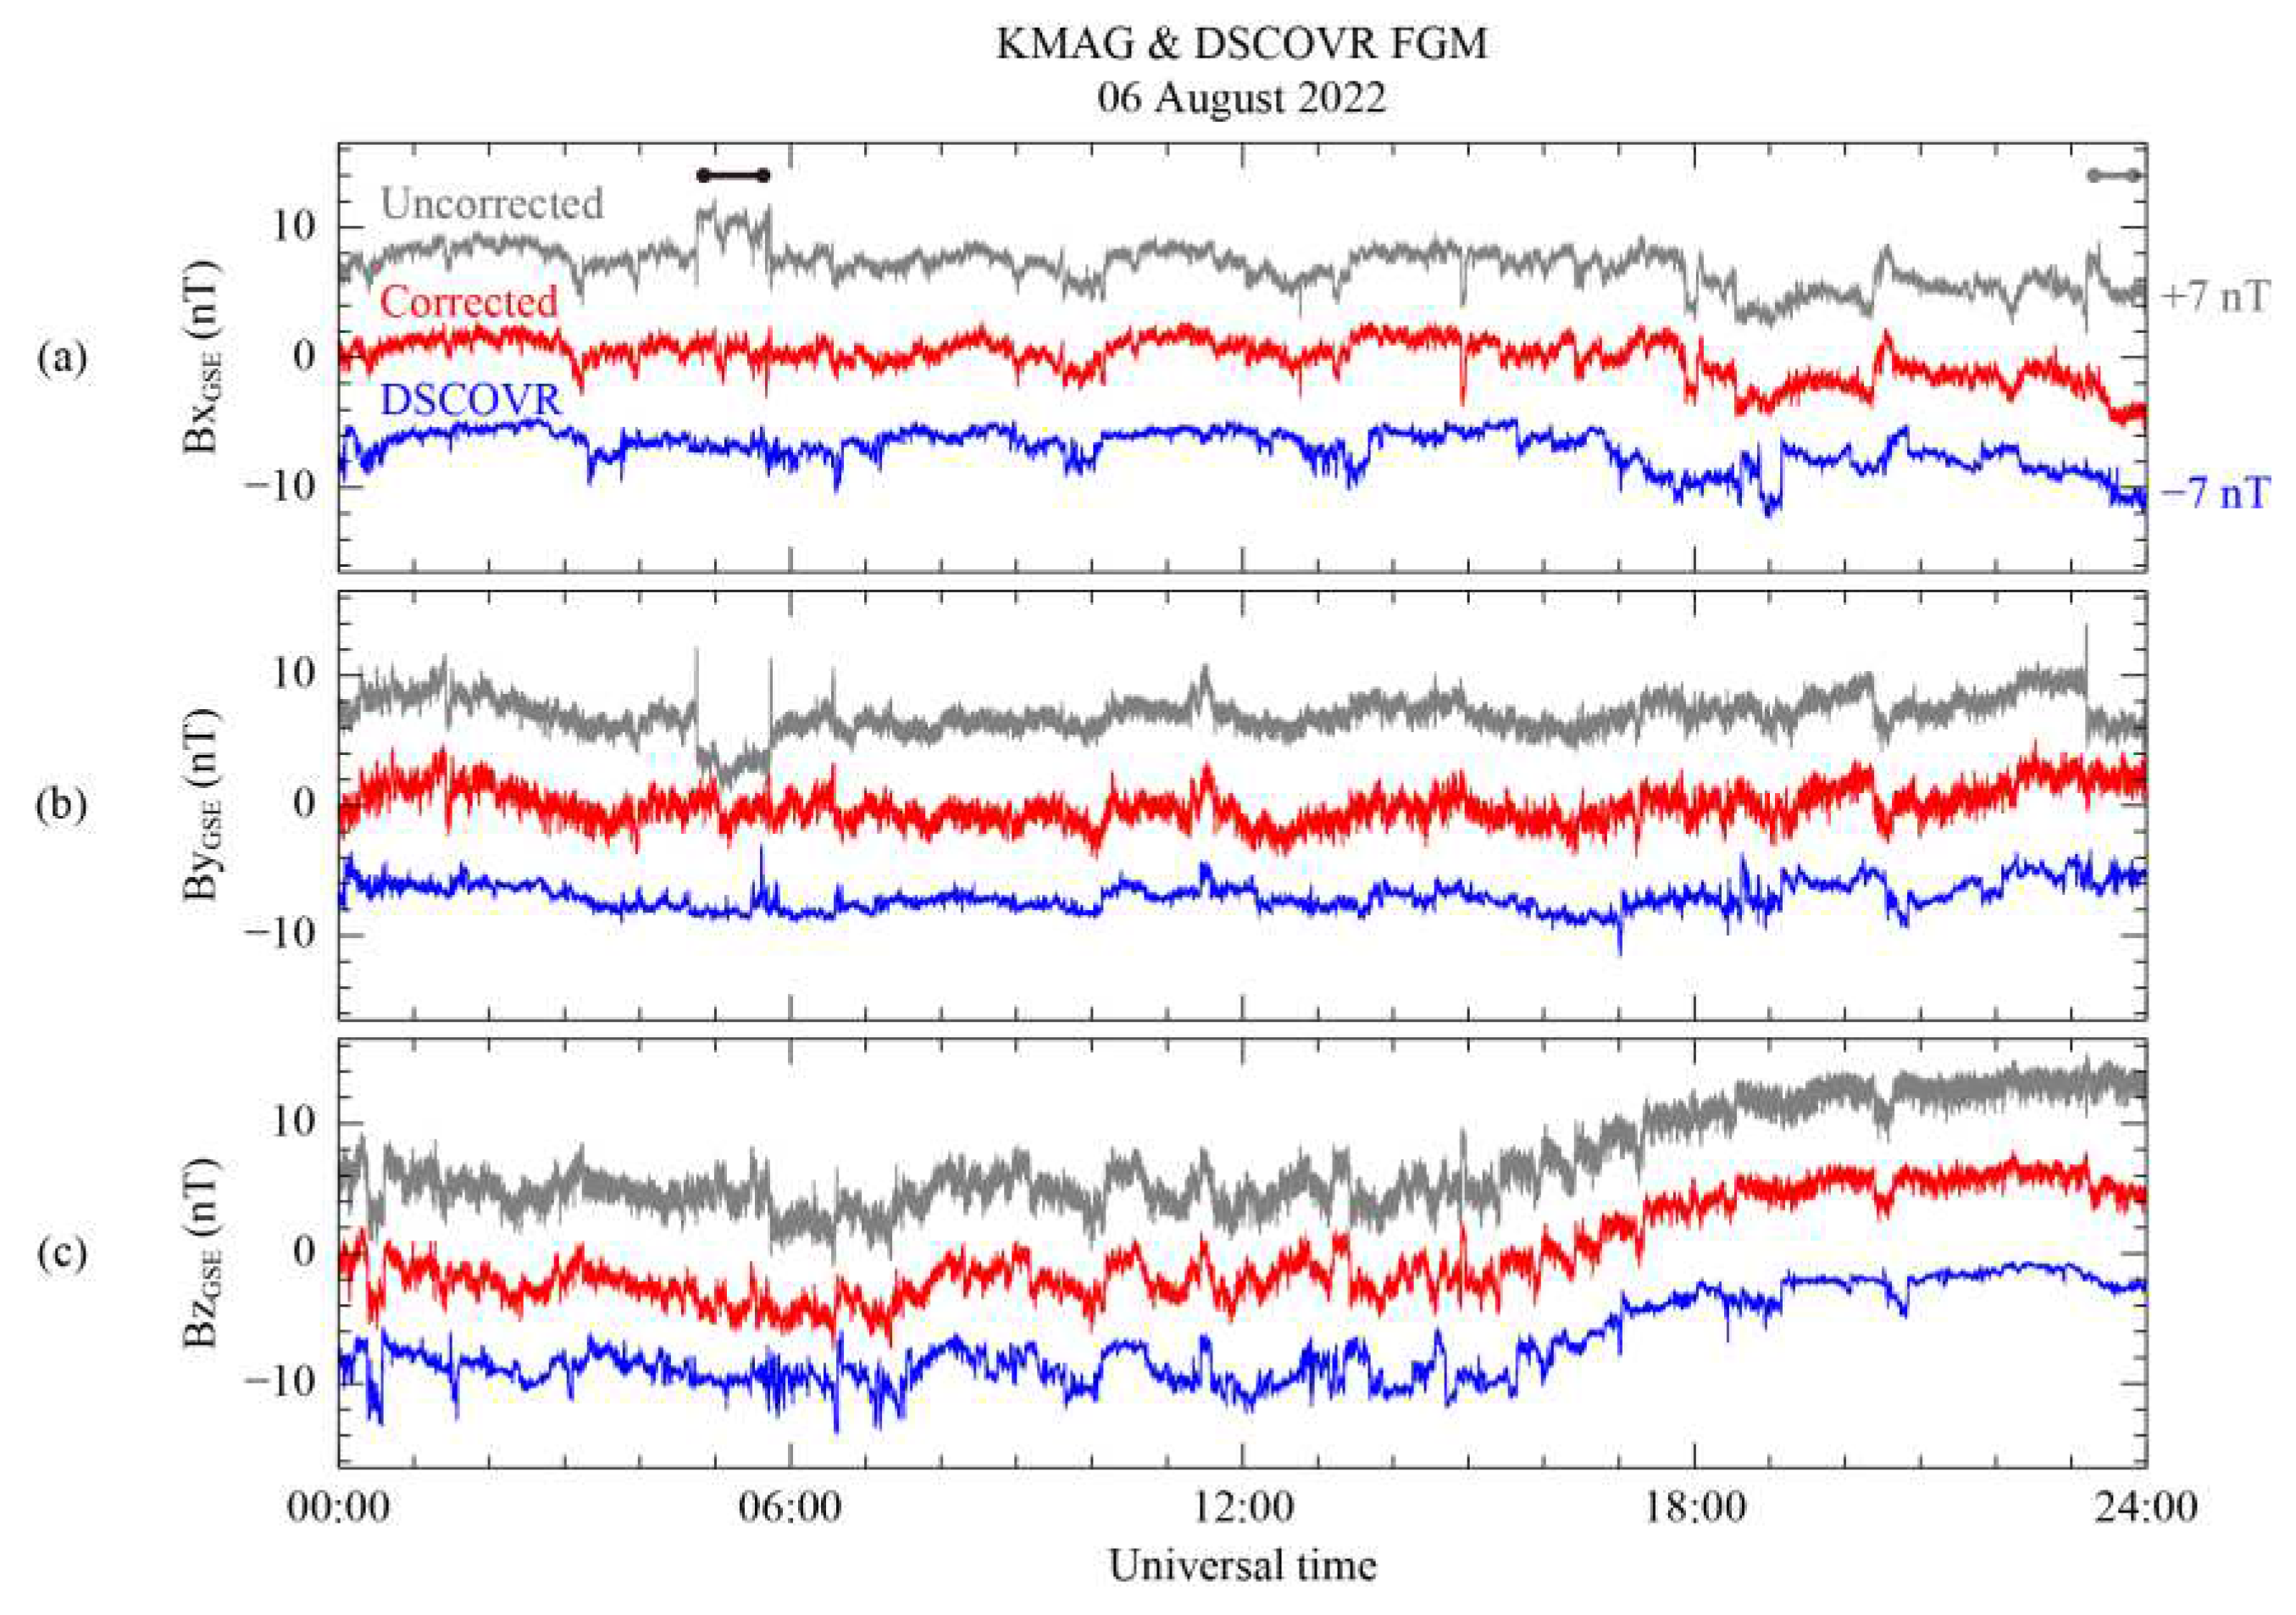
Figure 10 shows the DSCOVR FGM measurement and the corrected MAG1 measurement in the GSE coordinate system. Both measurements are subtracted from their daily average. To compare the two measurements, the DSCORVR magnetic field data was time-shifted by 40 min over the KMAG observation. The time shift was determined by identifying peaks in the magnetic field data collected by two spacecraft over 4 h starting at 10:00 UT. On the Bx and By components in
Figure 10a and 10b, indicated by a black bar, the step-like disturbance from 04:44 to 05:44 UT for raw measurements (gray) is successfully eliminated in the corrected data (red). Although the scaling matrix
A0,ij in Equation (10) is applied over all time ranges, only the disturbance is clearly removed. In addition, another step-like disturbance exists from 23:20 UT, indicated by a gray bar. This disturbance is removed after the correction process. Considering the switching-on signal on the VDE and the magnetic field components B
Y and B
Z related to the disturbance in
Figure 2, it can be seen that the two disturbances under the black and gray bars share the same generating source. For this reason, even if the scaling matrix is only calculated for the time range indicated by the black bar, the matrix can eliminate disturbance for the time range of the gray bar at the same time. As a result,
Figure 10 shows good agreement between DSCOVR and KMAG observations.
