1. Introduction
Elongate loach (
Leptobotia elongata), belonging to Cobitidae of Cypriniformes, is indigenous to the middle and upper reaches of the Yangtze River in China [
1]. It is characterized by rapid growth and exceptional ornamental value [
2,
3]. However, the wild population resources of
L. elongata have experienced a significant decline since the 1980s due to overfishing, dam construction, destruction of feeding, and spawning grounds [
4]. As a result, it has been classified as vulnerable grade (VU) in China Red Book of Endangered Animals-Fish [
5].
The family Cobitidae was originally proposed by Regan [
6]. In this family, extensive research focused on morphological characteristics and mitochondrial genes has been conducted for over a century [
7,
8,
9,
10,
11]. Currently, many scientists tend to divide Cobitidae into three subfamilies: Nemacheilinae, Botiinae, and Cobitinae [
12]. In order to maintain consistency between the phylogenetic relationship and the natural classification of Cobitidae fishes, Tang et al [
13] elevated these three subfamilies to the family level, which aligns with the classification of Liu et al [
9]. As the second-largest group of Cypriniformes, Cobitidae is a key element in resolving the phylogenetic relationships of Cypriniformes. Investigating the phylogenetic relationships of the
L. elongate, one of the youngest species in the Cobitidae, in family Cobitidae is beneficial to resolve the taxonomic ambiguity of Cobitidae fishes. Previous studies only focused on biological characteristics [
14], artificial breeding [
15], embryo development, and genetic diversity [
16,
17]. However, its research on the phylogenetic relationships of
L. elongate is limited [
18]. Therefore, a reevaluation of the phylogenetic relationships of
L. elongata, involving additional genes and a broader range of taxa, could provide more data for the conservation of
L. elongata's wild population resources.
Mitochondrial DNA (mtDNA) is present in the cells of all eukaryotes and possesses several genetic characteristics. It is primarily inherited maternally and exhibits conservation of coding regions, rapid evolution of the control region (CR), a high mutation rate, and a relatively independent genetic transcription system [
19,
20]. Compared to nuclear genes, mtDNA evolves at a faster rate, allowing for a more accurate representation of phylogenetic relationships. Therefore, mtDNA is widely utilized as a molecular marker in phylogenetic studies [
21,
22,
23]. In fish phylogeny research, genes such as cytochrome b (
cytb), cytochrome oxidase (
cox), and 16SrRNA are commonly employed at species-to-family level [
22,
24,
25]. However, when investigating higher taxonomic categories, relying solely on a single mitochondrial gene may lead to misleading phylogenetic data due to limited information capacity and homogenization effects [
26]. In contrast, utilizing the complete mitochondrial genome could provide a more comprehensive set of phylogenetic information [
27].
In this study, we sequenced the mitochondrial genome, analyzed the structural information of L. elongata, and compared the structures and complete mitochondrial genome with some of the determined Leptobotia species. Additionally, we reconstructed phylogenetic trees using complete mitochondrial genome sequences to analyze the evolutionary relationships L. elongata in the Cobitidae family. These study might provide futher insight into the structural of L. elongate, and improve understanding of evolutionary relationships of L. elongate within the Cobitidae.
2. Materials and Methods
2.1. Sample Collection and DNA Extraction
The L. elongata sample was collected from Chengdu, Sichuan Province, China, in October 2020. The pectoral fin was collected and stored in 95% ethanol at −20°C. Genomic DNA was isolated from the pectoral fin using the phenol-chloroform method and DNA degradation and contamination were estimated using agarose gel electrophoresis.
2.2. Mitochondrial Genome Sequencing and Assembly
After qualifying the DNA sample, the DNA was mechanically fragmented using ultrasonic interruption. The fragmented DNA underwent fragment purification, end-repair, addition of A at the 3' end, connection of sequencing adapters, and selection of fragments of different sizes using agarose gel electrophoresis. PCR amplification was then performed to generate a sequencing library [
18]. The qualified PCR products were sequenced on the Illumina HiSeq 2500 platform.
Prior to assembly, low-quality data, including the reads of average quality value< 5 or N content>5, were filtered using Fasta software (version 0.20.0), and the sequences linker and primer sequence were trimmed from the reads. The mitochondrial genome assembly was carried out using the following methodology. First, clean reads were assembled using SPAdes (version 3.10) [
28]. Second, contigs were connected to generate scaffold sequences using SSPACE (version 2.0), and Gaps in the scaffold sequences were filled using Gapfiller (version 2.1.1) until a complete pseudo genome sequence was assembled. Lastly, the sequencing results were mapped onto the assembled pseudo genome sequence to identify and correct any incorrect bases, and the complete mitochondrial circular genome sequence was obtained by coordinate remaking.
2.3. Mitochondrial Genome Annotation and Analysis
The newly assembled sequences were annotated in the Mitos web server (
http://mitos2.bioinf.uni-leipzig.de) [
29] with the following parameters: E-value Exponent=5, Maximum Overlap=100, ncRNA overlap=100. The annotation results were then compared with those of closely related species. Finally, after manual correction, the final annotation results were obtained.
The secondary structure of tRNAs was obtained from the annotation results. The circular map of the mitochondrial genome was generated using OGDRAW (version 1.3.1) [
30]. The relative synonymous codon usage (RSCU) values were analyzed with MEGA (version 6.0). The mitochondrial genome skew values were calculated using the following formula: ATskew=(A-T)/(AT); GCskew=(G-C)/(GC) [
31]. Mafft (version 7. 310) [
32] software was used for gene sequences comparative between
L. elongata and six Leptobotia fishes (
Leptobotia mantschurica,
Leptobotia taeniops,
Leptobotia microphthalma,
Leptobotia rubrilabris,
Leptobotia punctata, and
Leptobotia pellegrini), and the evolutionary rate (Ka/Ks, ω) was calculated using KaKs_Calculator (version 2. 0) [
33]. If the evolutionary rate is equal to 1, >1, or, <1, the PGCs are expected to be under no selection, positive selective constraint (purifying selection), or diversifying selection. The mitochondrial genome structure was compared between
L. elongata and six Leptobotia fish species in CGVIEW server [
34] with default parameters (
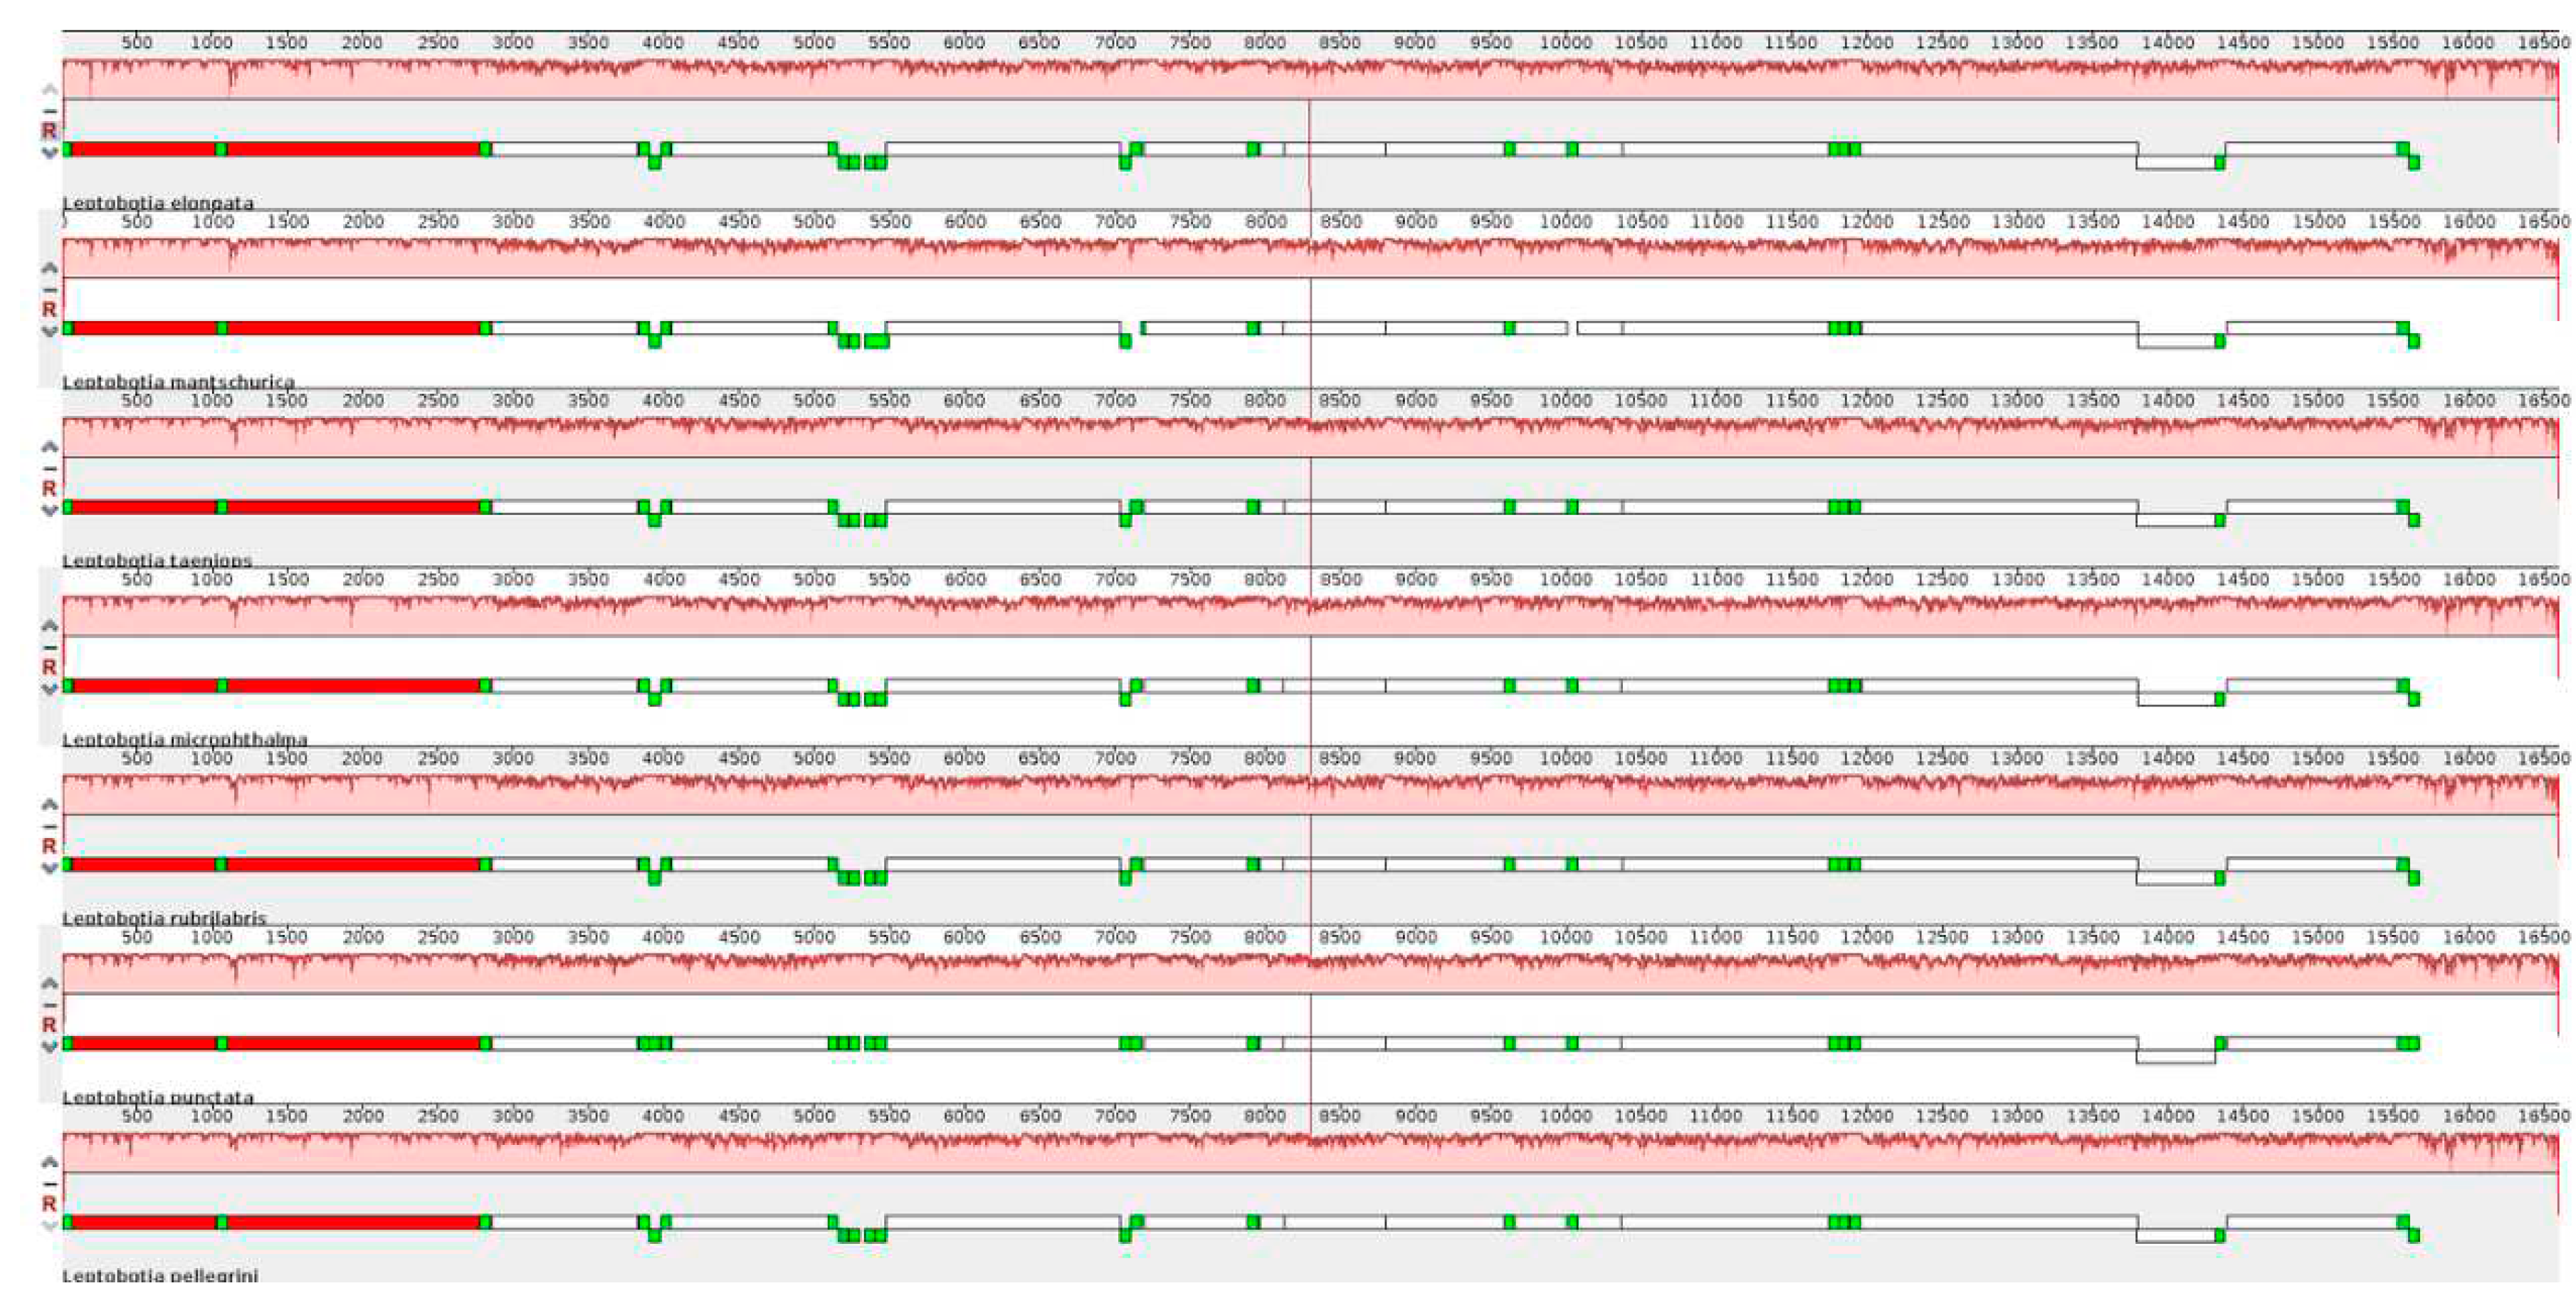
http://stothard.afns.ualberta.ca/cgview_server/), and the alignment results were visualized using mauve software (version 2.4.0).
2.4. Phylogenetic Analyses
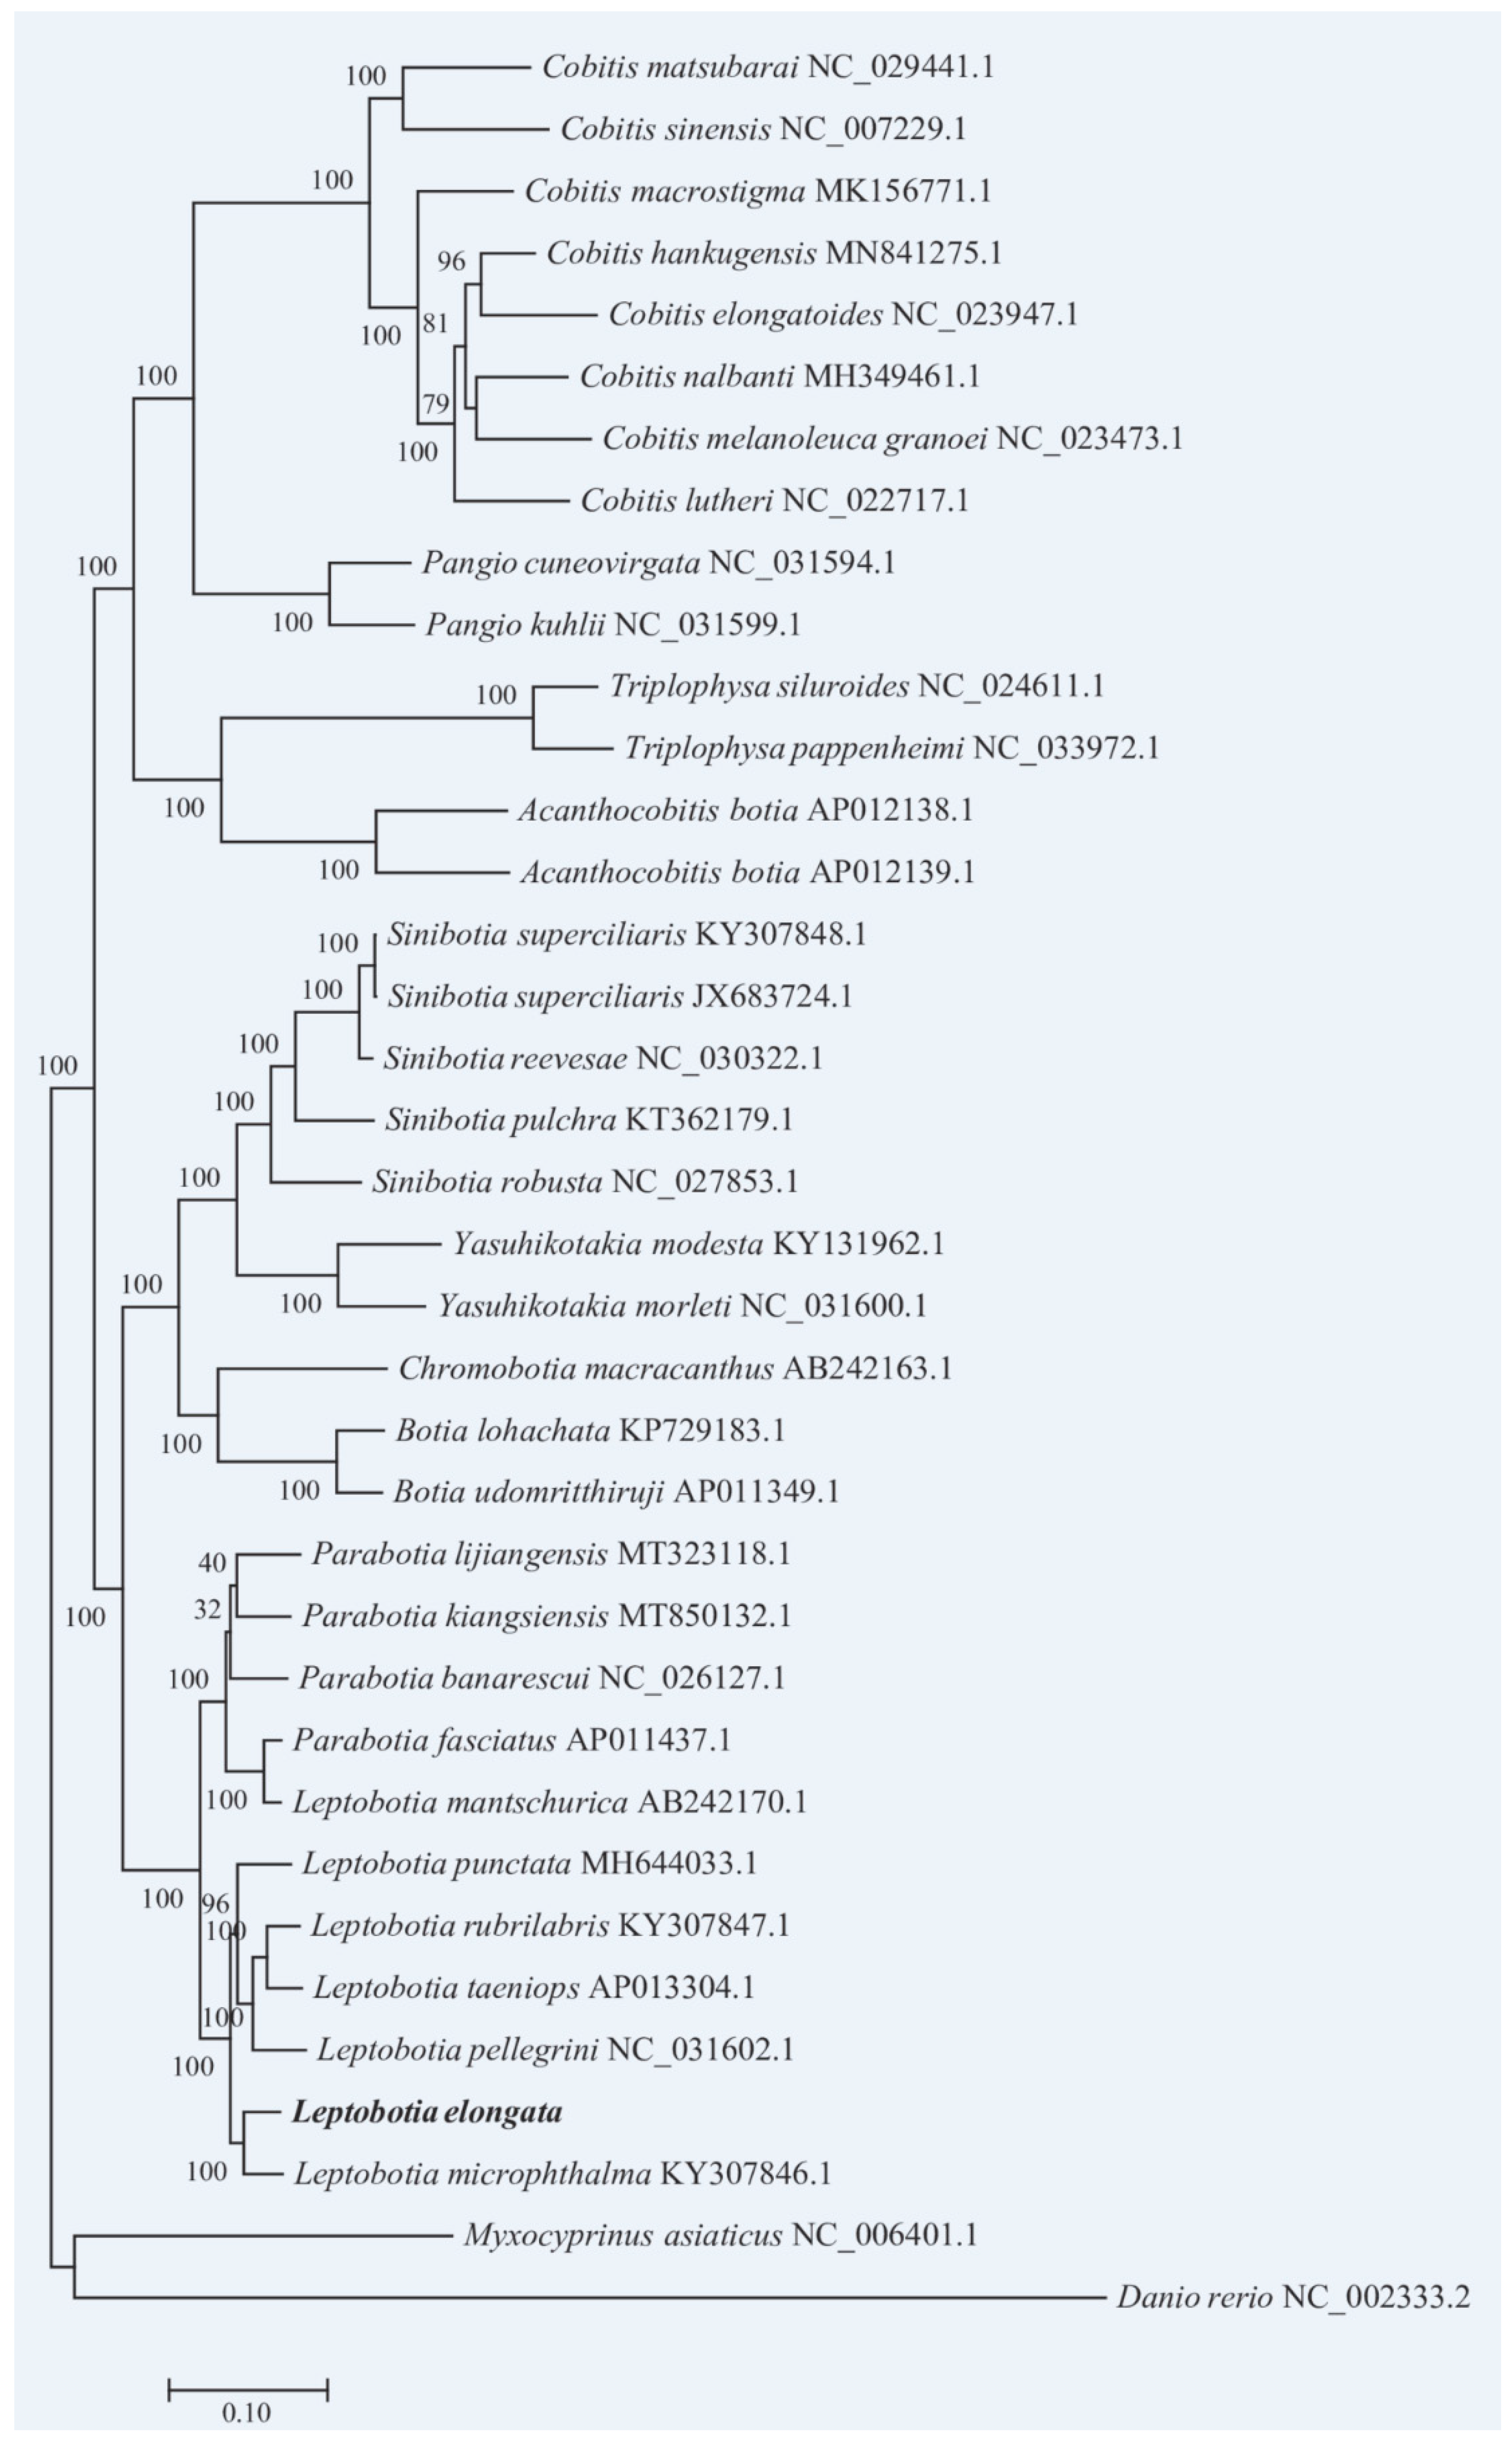
The phylogenetic tree was reconstructed using the complete mitochondrial genome sequences of 37 Cypriniformes species, with
Myxocyprinus asiaticus and
Danio rerio used as outgroups (
Table 1). All the genome sequences were set to the same start points in the circular sequence. Multiple sequence alignment was performed in MAFFT software (version 7.42) with auto model, and the alignment sequences were trimmed using trimAl (version 1.4. rev15). Subsequently, the RaxML (version 8.2.0) software was used to conduct the rapid bootstrap analysis (bootstrap=1000) to construct the maximum likelihood evolution tree.
3. Result and Discussion
3.1. Mitochondrial Structural Characteristics
The complete mitochondrial genome of
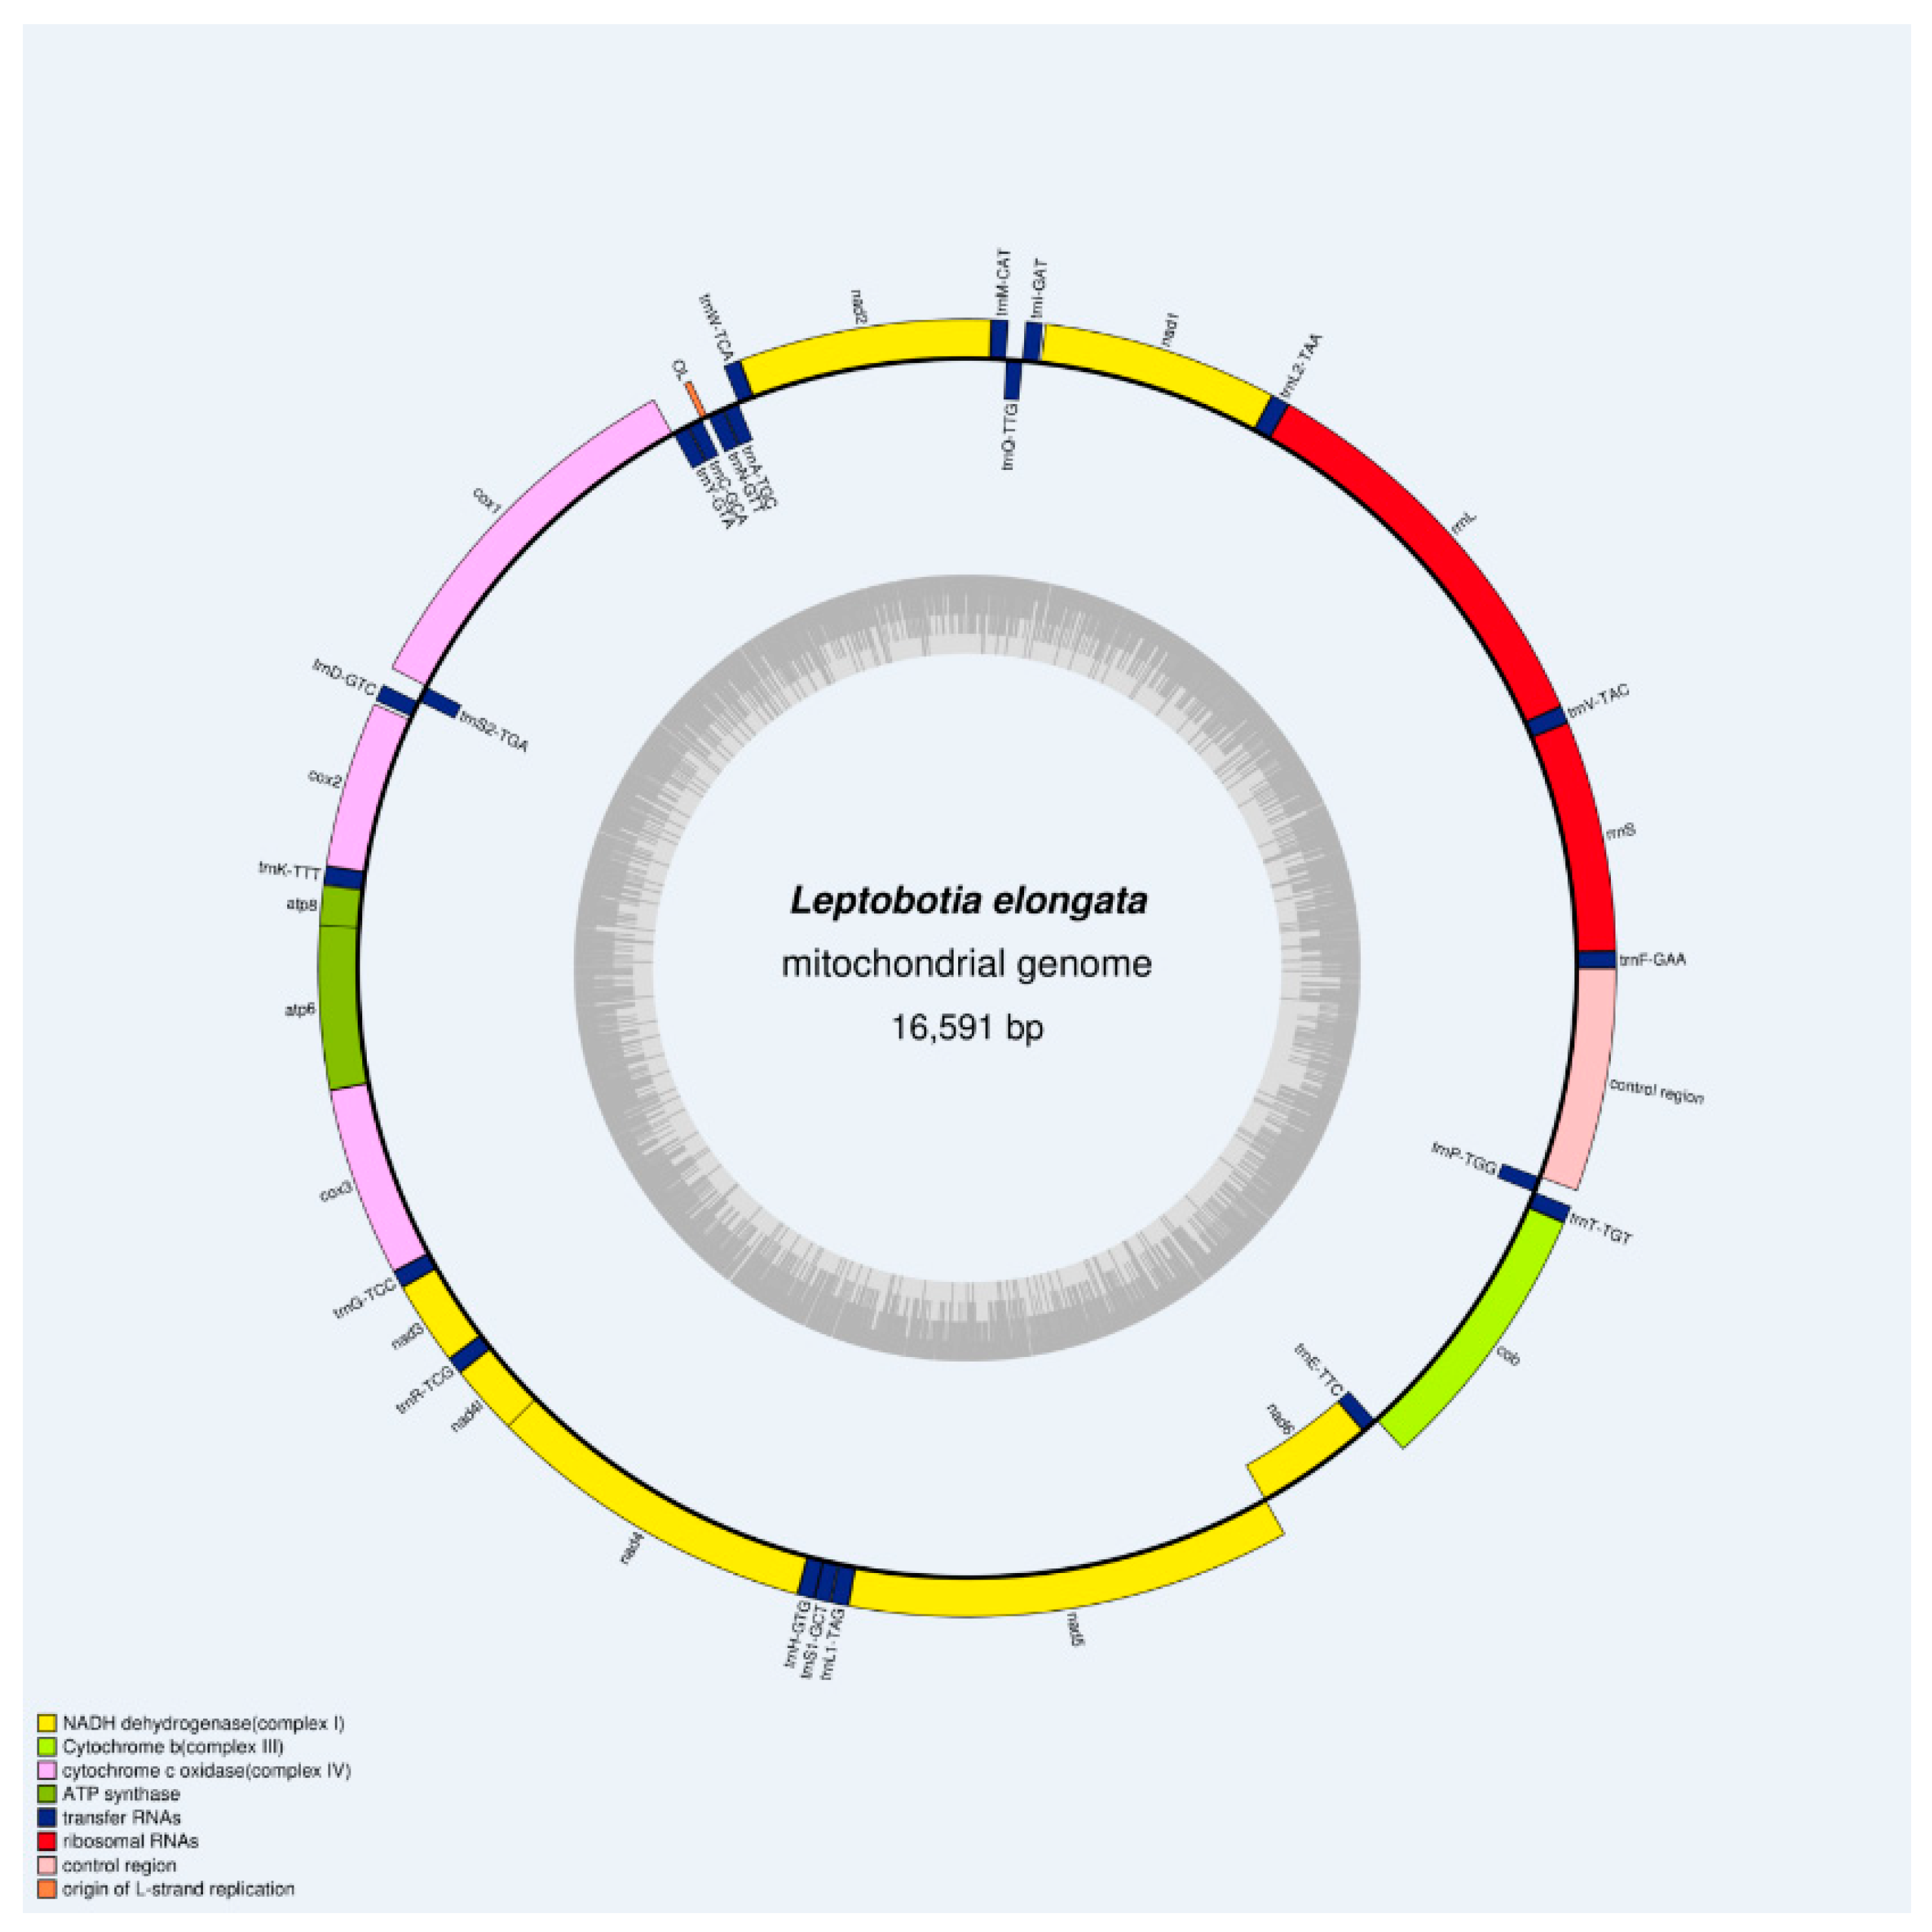
L. elongata was obtained through high-throughput sequencing technology, with a total length of 16,591bp (
Figure 1). It consists of 37 typical animal mitochondrial genes, including 22 tRNA genes, 13 PCGs, 2 rRNA genes, and two non-coding regions (D-Loop and OL). Among the mitochondrial genes, nine genes (
trnQ, trnP, trnE, nad6, trnS2, trnY, trnC, trnN, trnA) were encoded by the light (L) strand, while the remaining genes are encoded by the heavy (H) strand. The arrangement and content of the mitochondrial genome in
L. elongata were similar to those reported in teleost fishes [
20,
35,
36]. The entire base composition of the
L. elongata mitochondrial genes is as follows (
Table 2): 30.79 %A, 24.77 %T, 16.17 %G, and 28.27 %C, and the AT and GC percentages are 55.56 % and 44.44 % respectively, which results in a positive skew value for AT and a subtractive skew value for CG. It was suggested that the occurrence of A and C bases was more frequent in the genome. Previous studies have shown that the bias in base composition plays a crucial role in the replication and transcription of mitochondrial genomes [
37].
3.2. Protein Coding Genes (PCGs)
The PCGs account for 68.89% of the total length of the
L. elongata mitochondrial genome. As expected (
Table 3), most PCGs started with the regular codon ATG, except for the
cox1, started with GTG. Among the PCGs, there were 7 genes that shared the complete stop codon TAA. While six genes shared incomplete stop codons (TA- or T--), which existed in many teleostean as numerous studies:
L. microphthalma with seven incomplete stop codons [
38],
Cobitis macrostigma with seven incomplete stop codons [
39],
Pelteobagrus fulvidraco with five incomplete stop codons [
20],
Parabotia kiangsiensis with three incomplete stop codons [
40], etc. The presence of tRNA sequences at the 3' end of these genes is responsible for the incomplete stop codons [
41], and these incomplete stop codons can be converted to TAA through post-transcriptional polyadenylation [
42].
Three overlapping regions between certain PCGs: ATPase8-ATPase6, ND4-ND4L, and ND5-ND6 were also identified in this study. These overlapping regions were 4-10bp in length, with the largest overlapping occurring between ATP8 and ATP6, which was common among Cobitidae species [
43]. These overlapping regions contribute to the variation in mitochondrial genome length among closely related species [
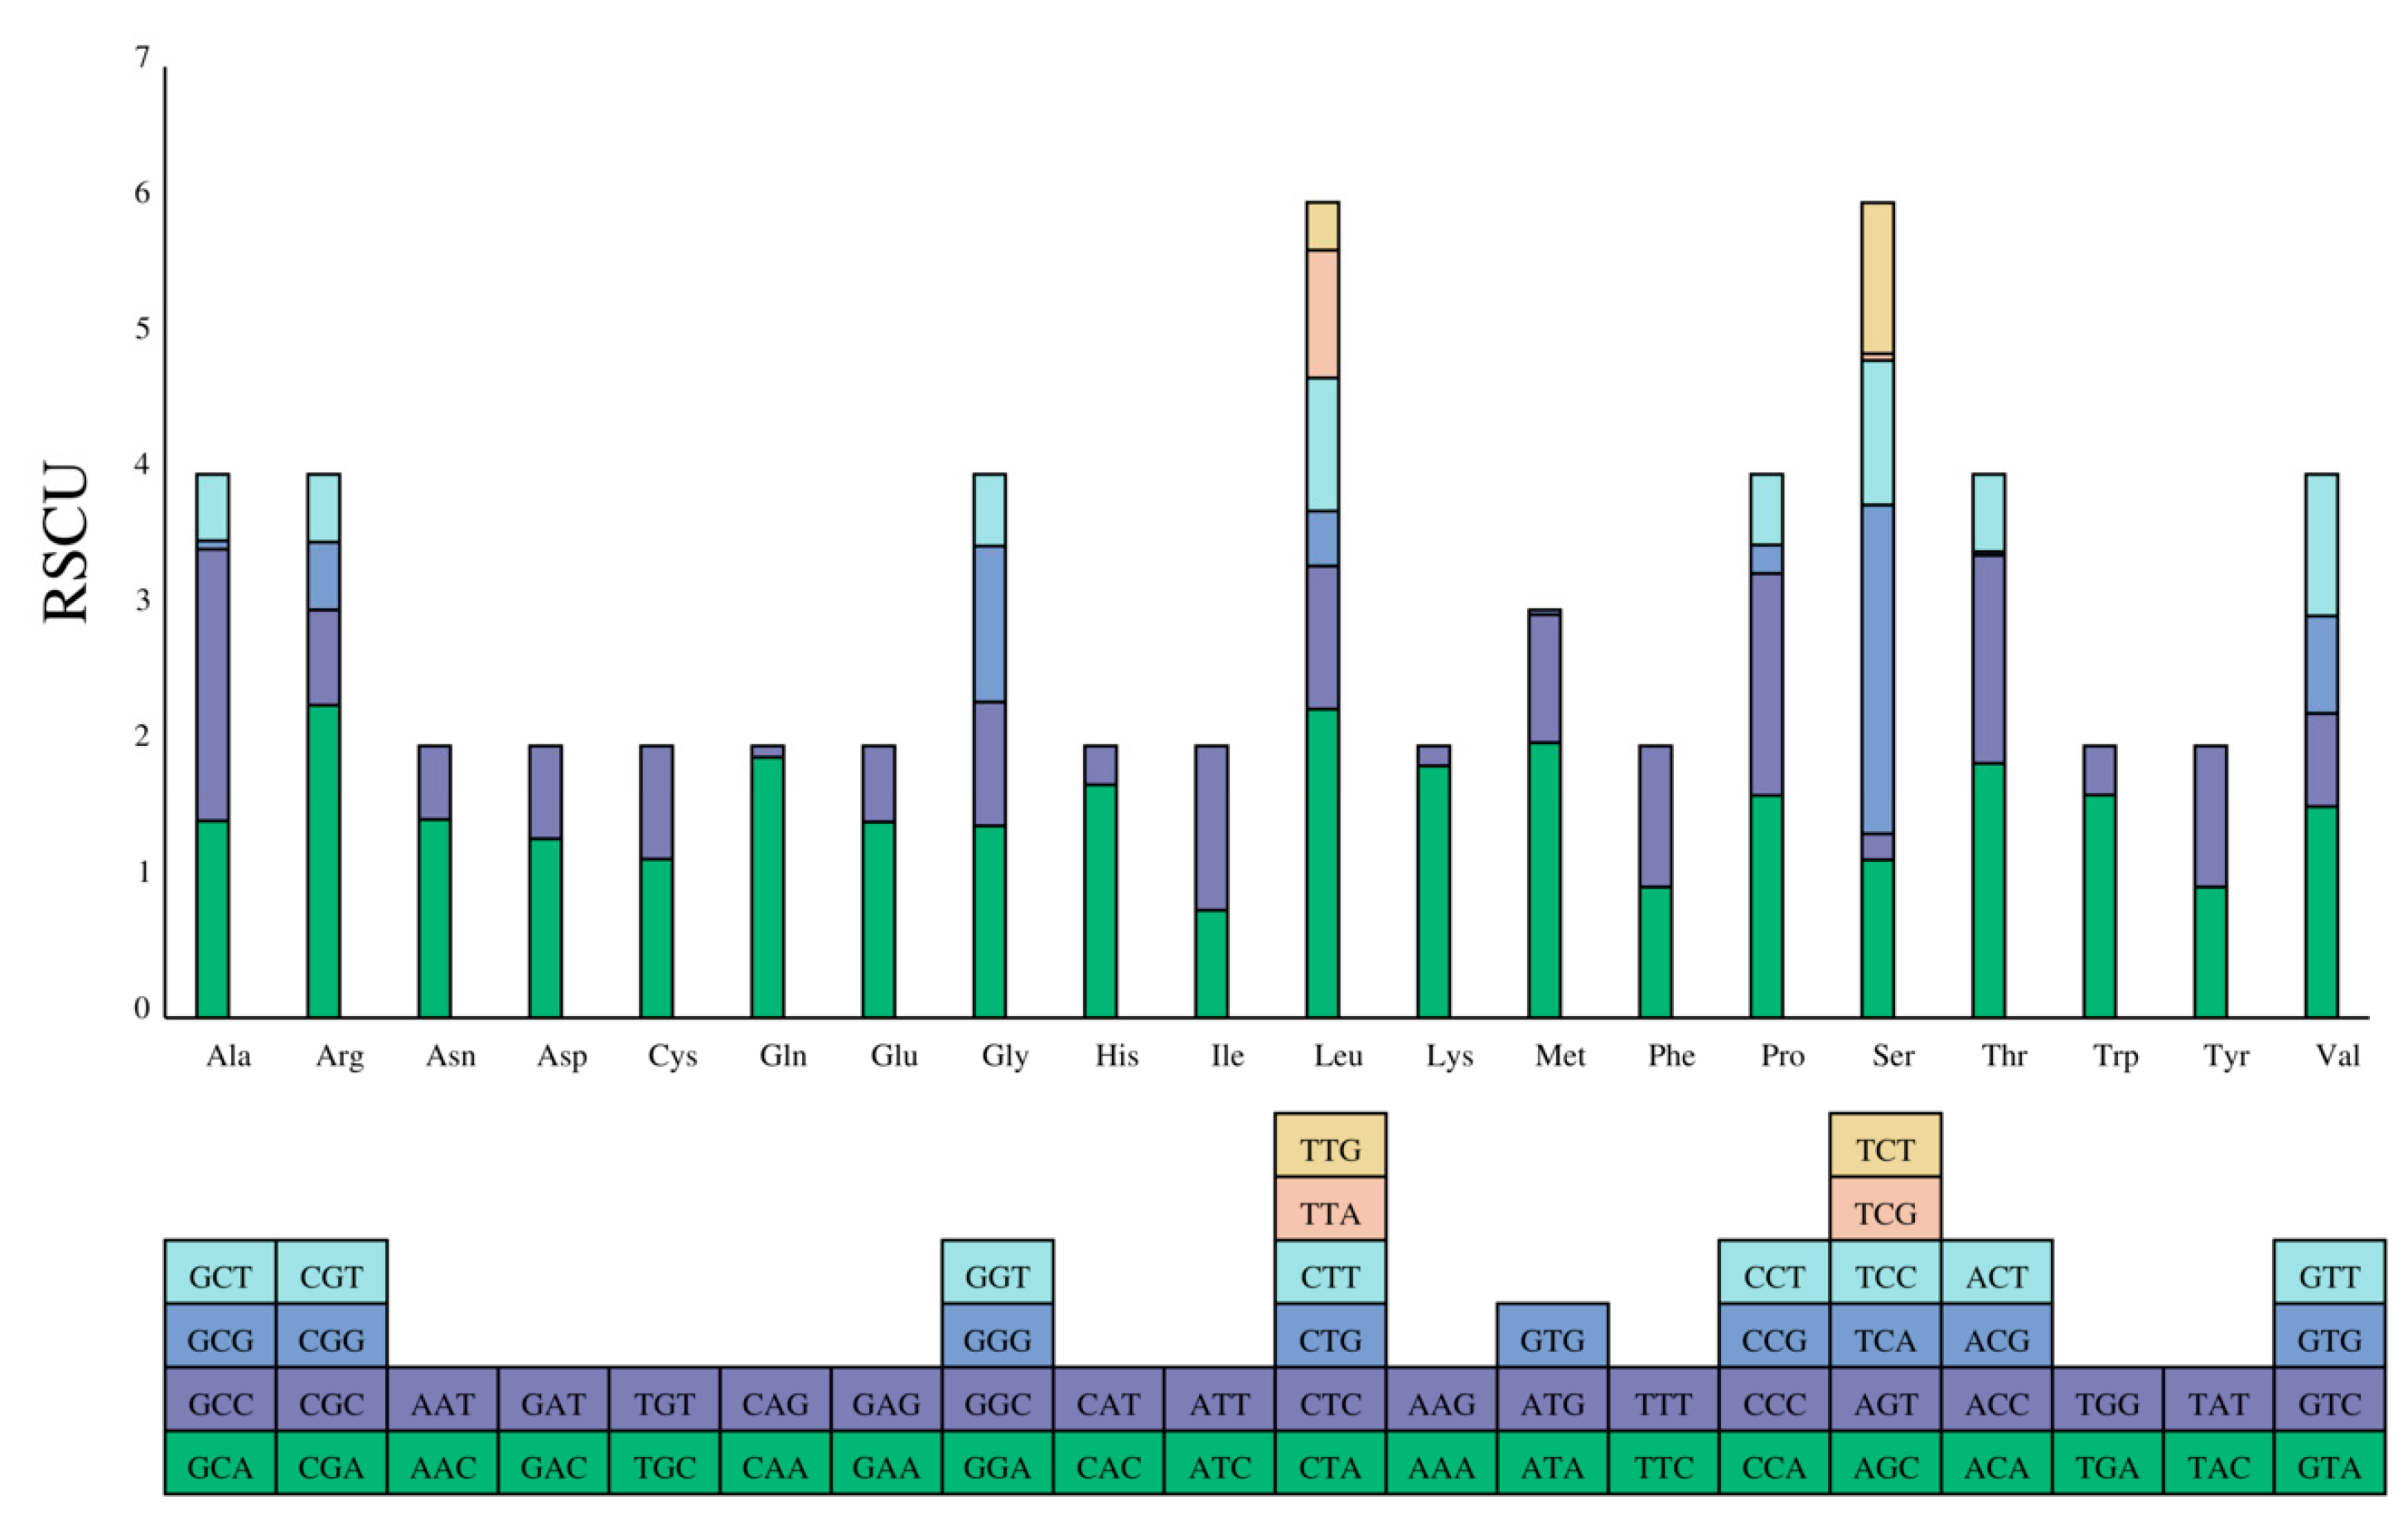
44]. The relative synonymous codon usage (RSCU) values of PCGs are revealed in
Table 4 and
Figure 2. In the protein-coding region, a total of 2012 codons were used. According to the degeneracy of codons, serine and leucine were encoded by six codons, while the remaining amino acids were encoded by either four or two codons. In the coded passwords, CUA (leucine), AUU (isoleucine), GCC (Aminopropanoic), and GCA (Aminopropanoic) are the most common, while AAA (Lysine) and CUA (leucine) have the highest RSCU values. Therefore, PCGs preferred the codons using adenine at the third codon. The codon usage varied between different species, which was more prominent between species with further phylogenetic relationship [
45]. It is relevant to gene length, mutation bias, GC composition, amino acid composition, tRNA abundance, and translational selection [
46,
47,
48,
49,
50,
51].
3.3. Genome Comparative Analysis
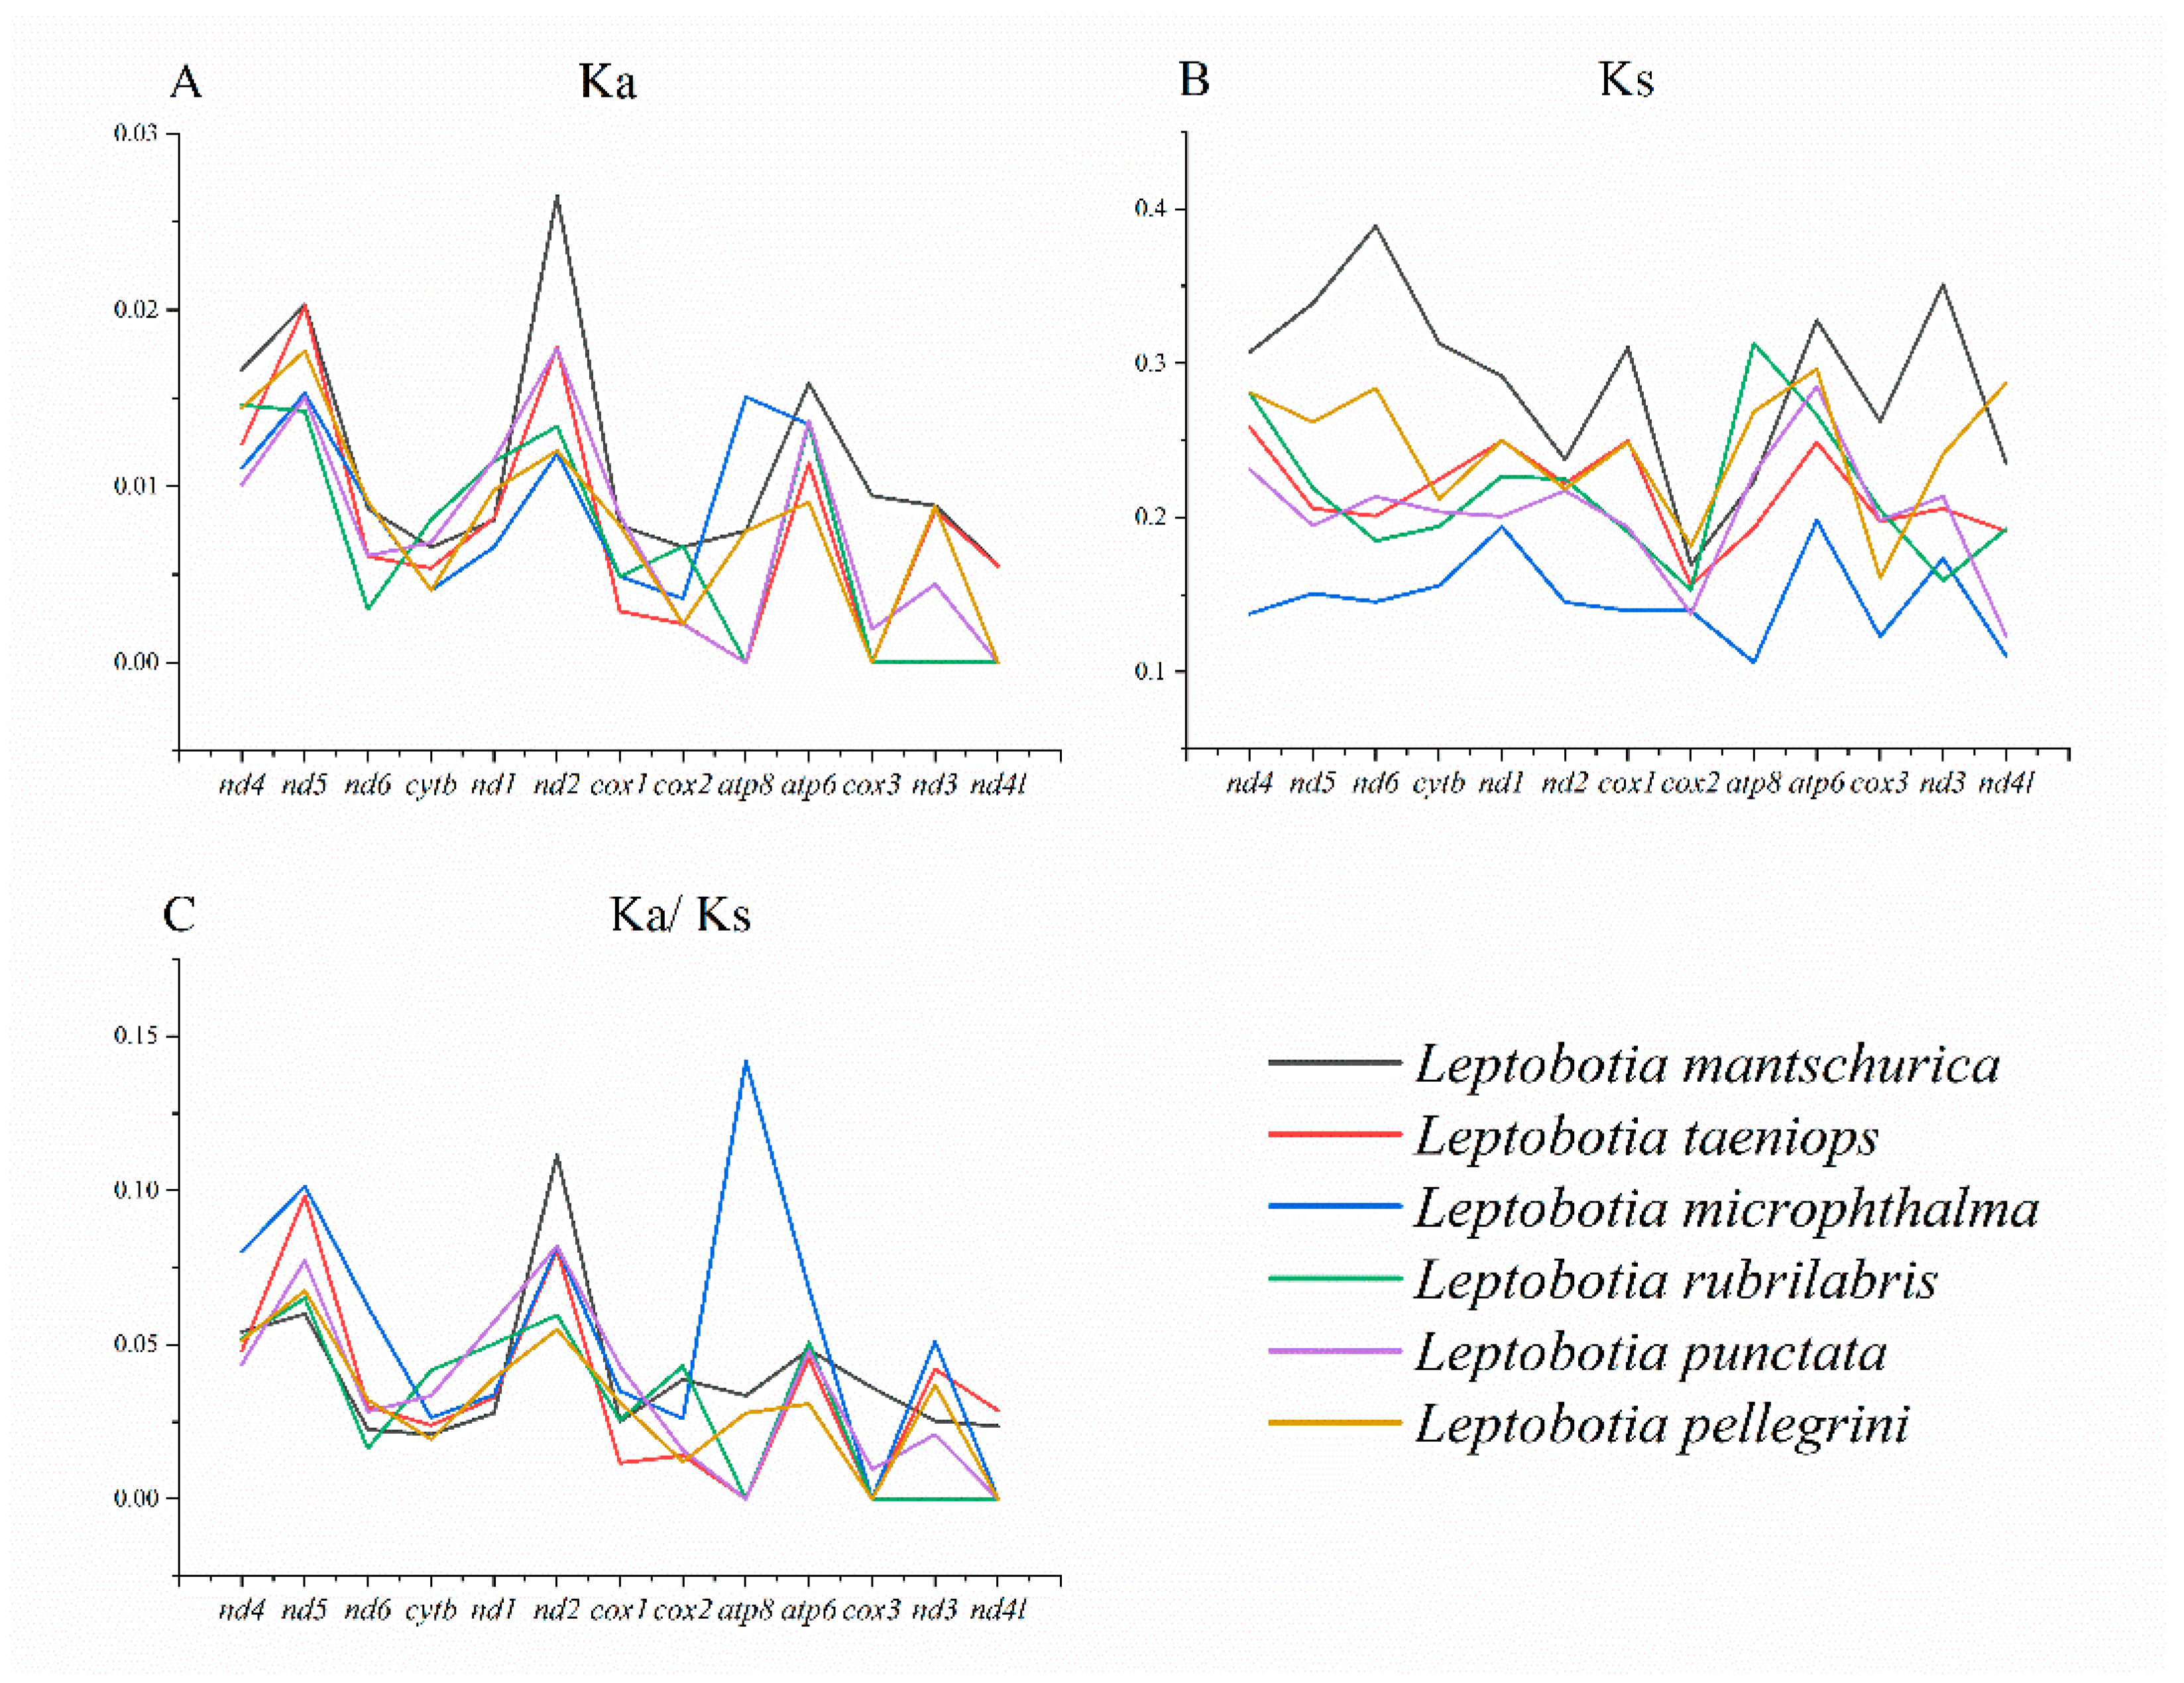
The nonsynonymous substitution ratio (Ka) and synonymous substitution ratio (Ks) were calculated to evaluate selective pressures during the evolutionary process of PCGs among Leptobotia species. It was shown that the average Ka was similar among the 6 fishes (0.0089-0.0114), with
nd5 exhibiting the highest average Ka (
Figure 3A;
Table 5), indicating that it might be under positive selection across species. The Ks of
Leptobotia microphthalma was significantly lower than the other species (
Figure 3B;
Table 6). There were more synonymous substitutions per synonymous sites in
nd4 and
atp6, exhibiting the high polymorphic nature of the genes in these fishes.
nd4 has also been confirmed to be polymorphism among sharks [
52] and blue-spotted maskray [
45]. The Ka/Ks ratio (ω) is a means to examine molecular adaption [
53,
54], which could be used to estimate the evolutionary rate among Cobitidae species. In this study, the Ka/Ks ratios of all PGCs were less than 1, indicating that purifying selection possesses the leading role in the evolution of these PGCs (
Figure 3C;
Table 7). Therein,
cox3 (0.0076) and
nd4l (0.0087) were evolving under a strong purifying selection, whereas
nd4 (0.0549),
nd5 (0.0782), and
nd2 (0.0784) were evolving under comparatively relaxed mutational constraints. Currently, selective pressure in mitochondrial PCGs has been studied poorly on other Cobitidae species [
13,
18,
38,
39,
55,
56,
57]. While the same pattern of widespread purifying selection has been discovered in several other decapod crustaceans [
58].
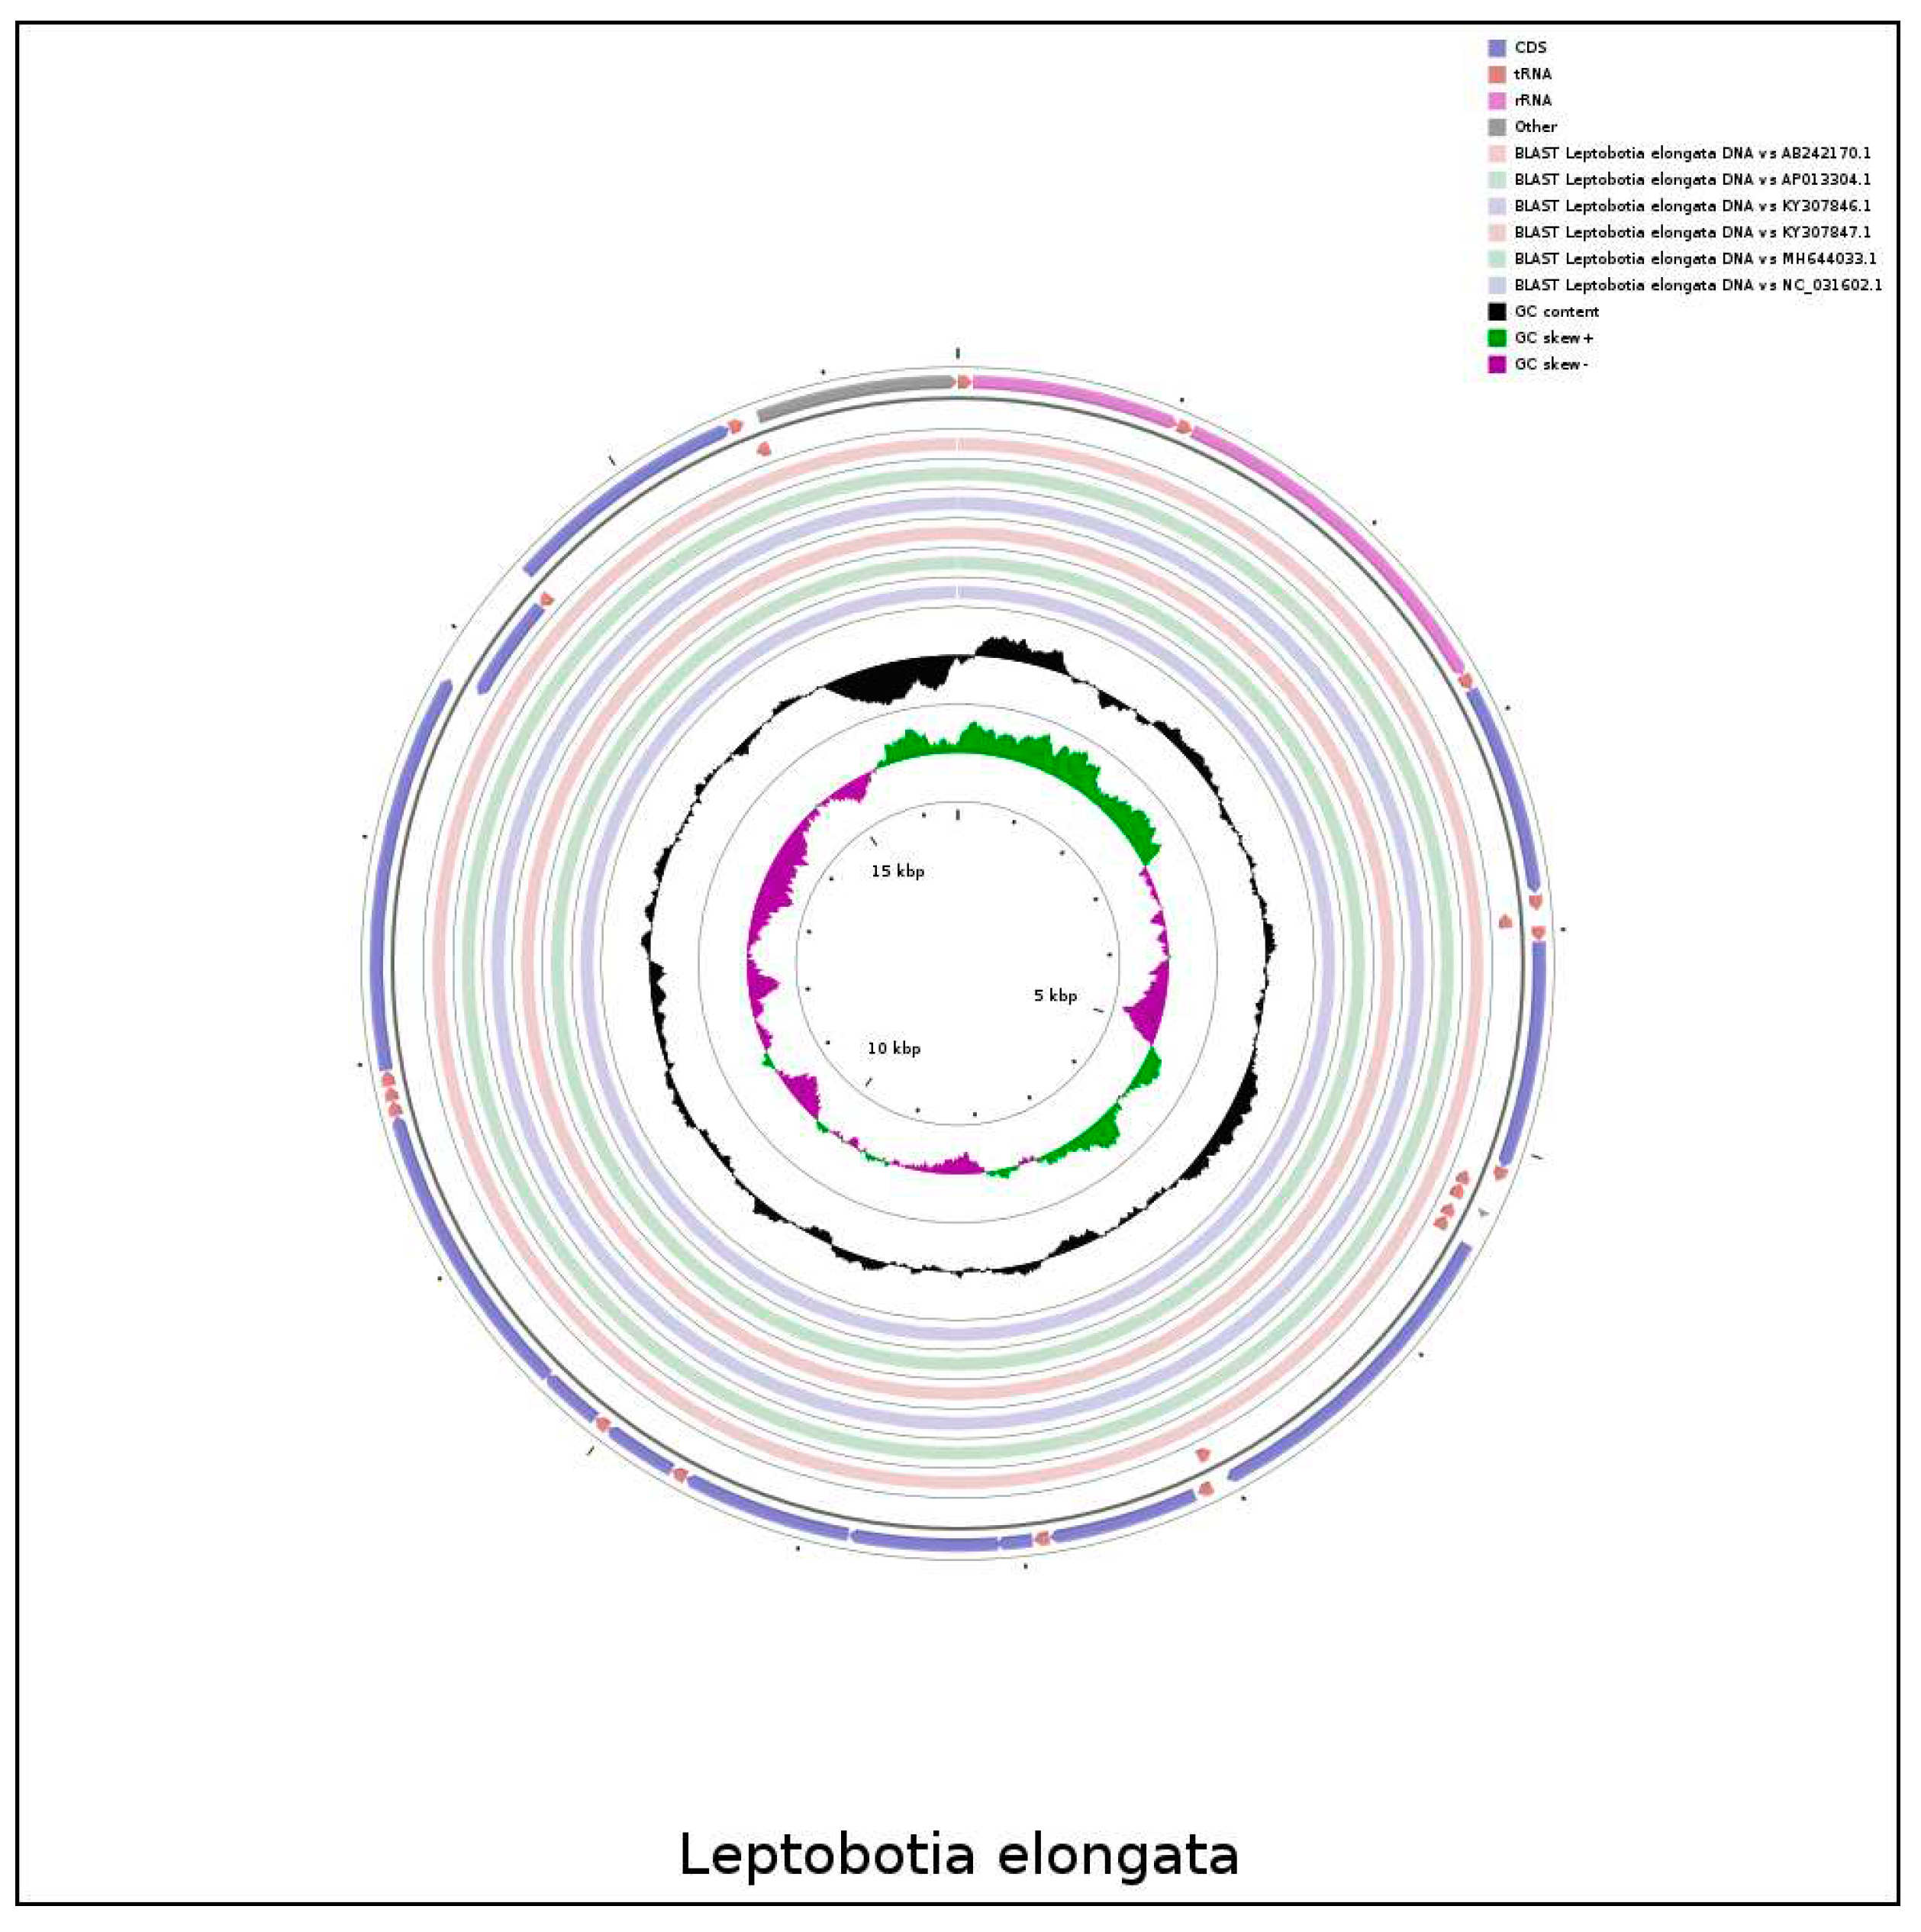
The comparison of the mitochondrial genome sequences between
L. elongata and 6 Leptobotia species showed a significant sequence homology within the Leptobotia genus (
Figure 4;
Figure 5).
L. elongata showed a higher identity with the other five species, except for
L. microphthalma, which lacked the
tRNA-Arg and a shorter
tRNA-Asp, indicating that the arrangement of genes of Leptobotia species is comparatively conserved.
3.4. Ribosomal RNA and Transfer RNA Genes
The total length of rRNAs was 2638bp, with an AT skew value of 0.272 and a GC skew value of -0.095. The lengths of 12SrRNA and 16SrRNA were 955bp and 1683bp, respectively (
Table 3). These rRNAs were located between
tRNA-Phe and
tRNA-Leu and are separated by
tRNA-Val, which is consistent with the most reported teleost [
59].
There were 22 tRNAs in the mitochondrial genome of
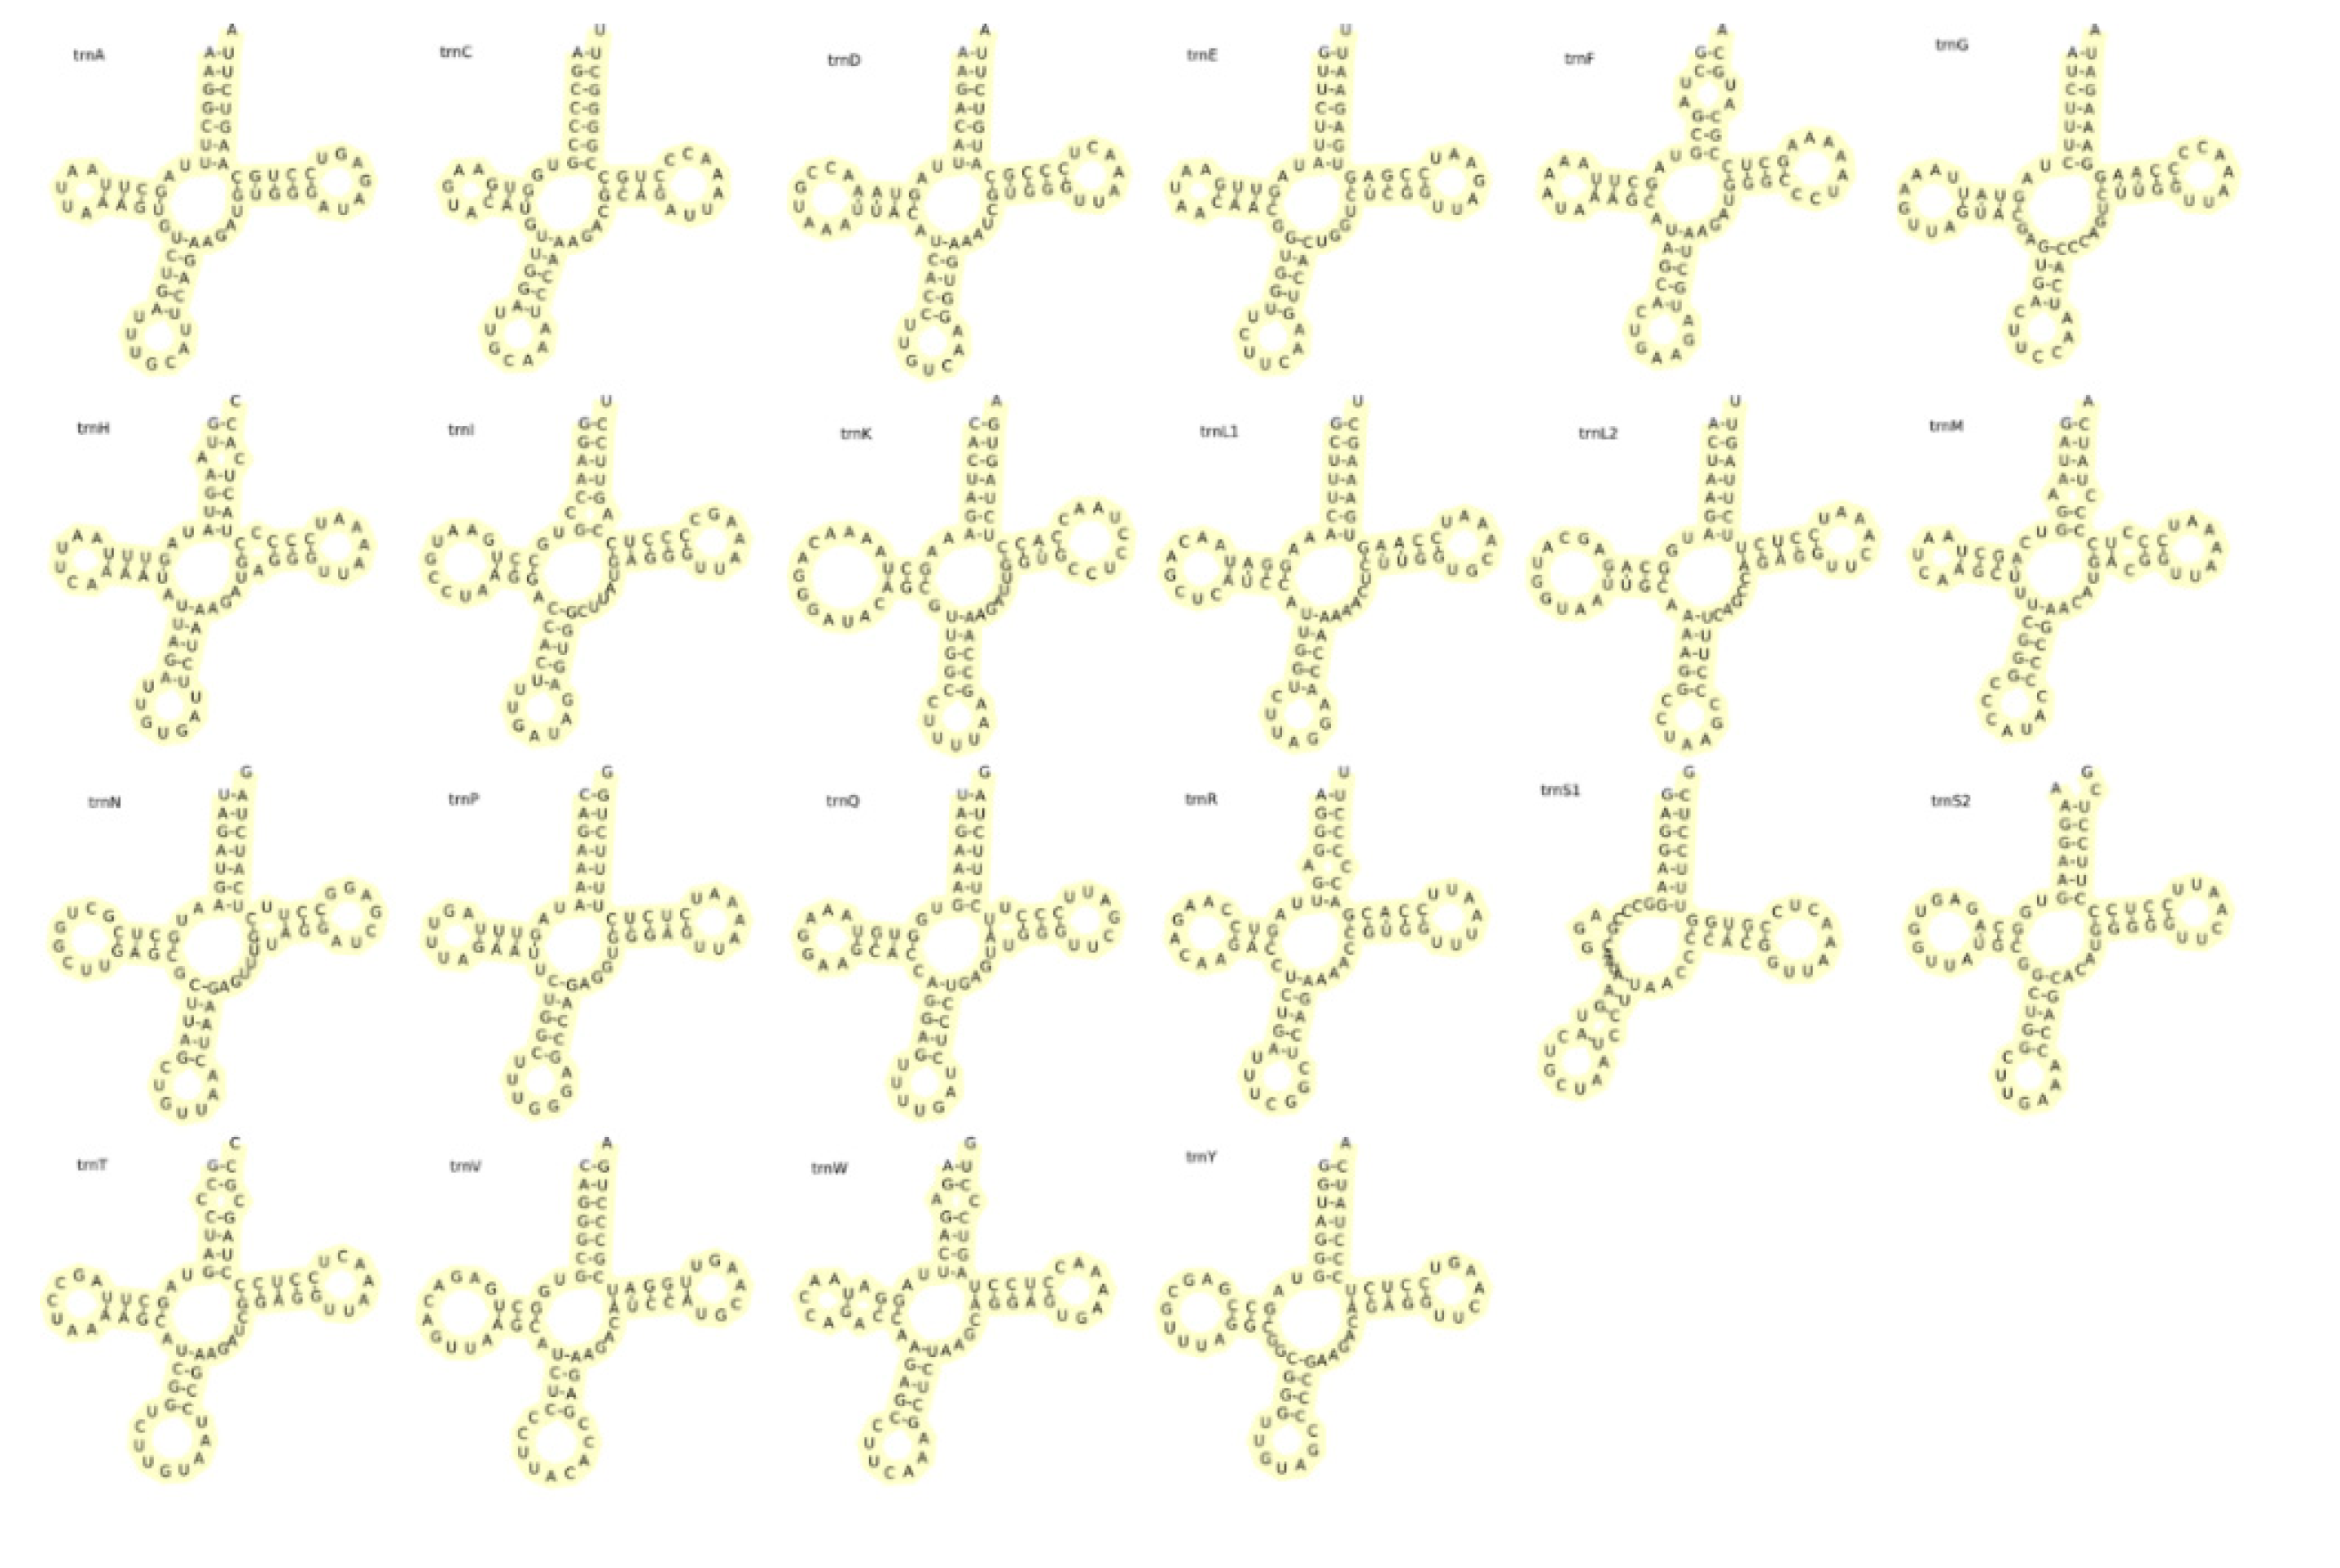
L. elongata, with a total length of 1558bp. The AT content was 53.89% and AT skew value was 0.044. Each tRNA has a length of 66-76bp, with 14 encoded in the H chain and 8 encoded in the L chain. Most of the secondary structure of tRNA genes (
Figure 6) in
L. elongata were standard clover-shaped, except for
trnS1, which lacked the DHU stem. It was very common to defect DHU stem in metazoan [
42]. Additionally, there were 18 false GU pairings in the tRNA sequences of
L. elongata. GU mismatch was frequently observed in teleost fishes and allowed for an expanded chemical and conformational diversity of double-stranded RNA. This diversity provided unique sites that were recognized by amino acids, contributing to a higher genetic diversity for
L. elongate [
60]. The base mismatch was essential for the secondary structure of tRNA and played a crucial role in the accurate translation of the genetic code. It also helped minimize errors during mRNA transcription [
61].
3.5. Non-Coding Regions
Two common non-coding regions (OL and CR) were identified in the
L. elongata mitogenome, the OL region was 31 bp in length and was located between
tRNA-Asn and
tRNA-Cys. The CR region was located between
tRNA-Pro and
tRNA-Phe, which is the longest no-coding region in the entire mitochondrial genome with a span distance of 926 bp. It plays a key role in the replication and transcription [
62]. Similar to other vertebrates [
21,
63], the CR of
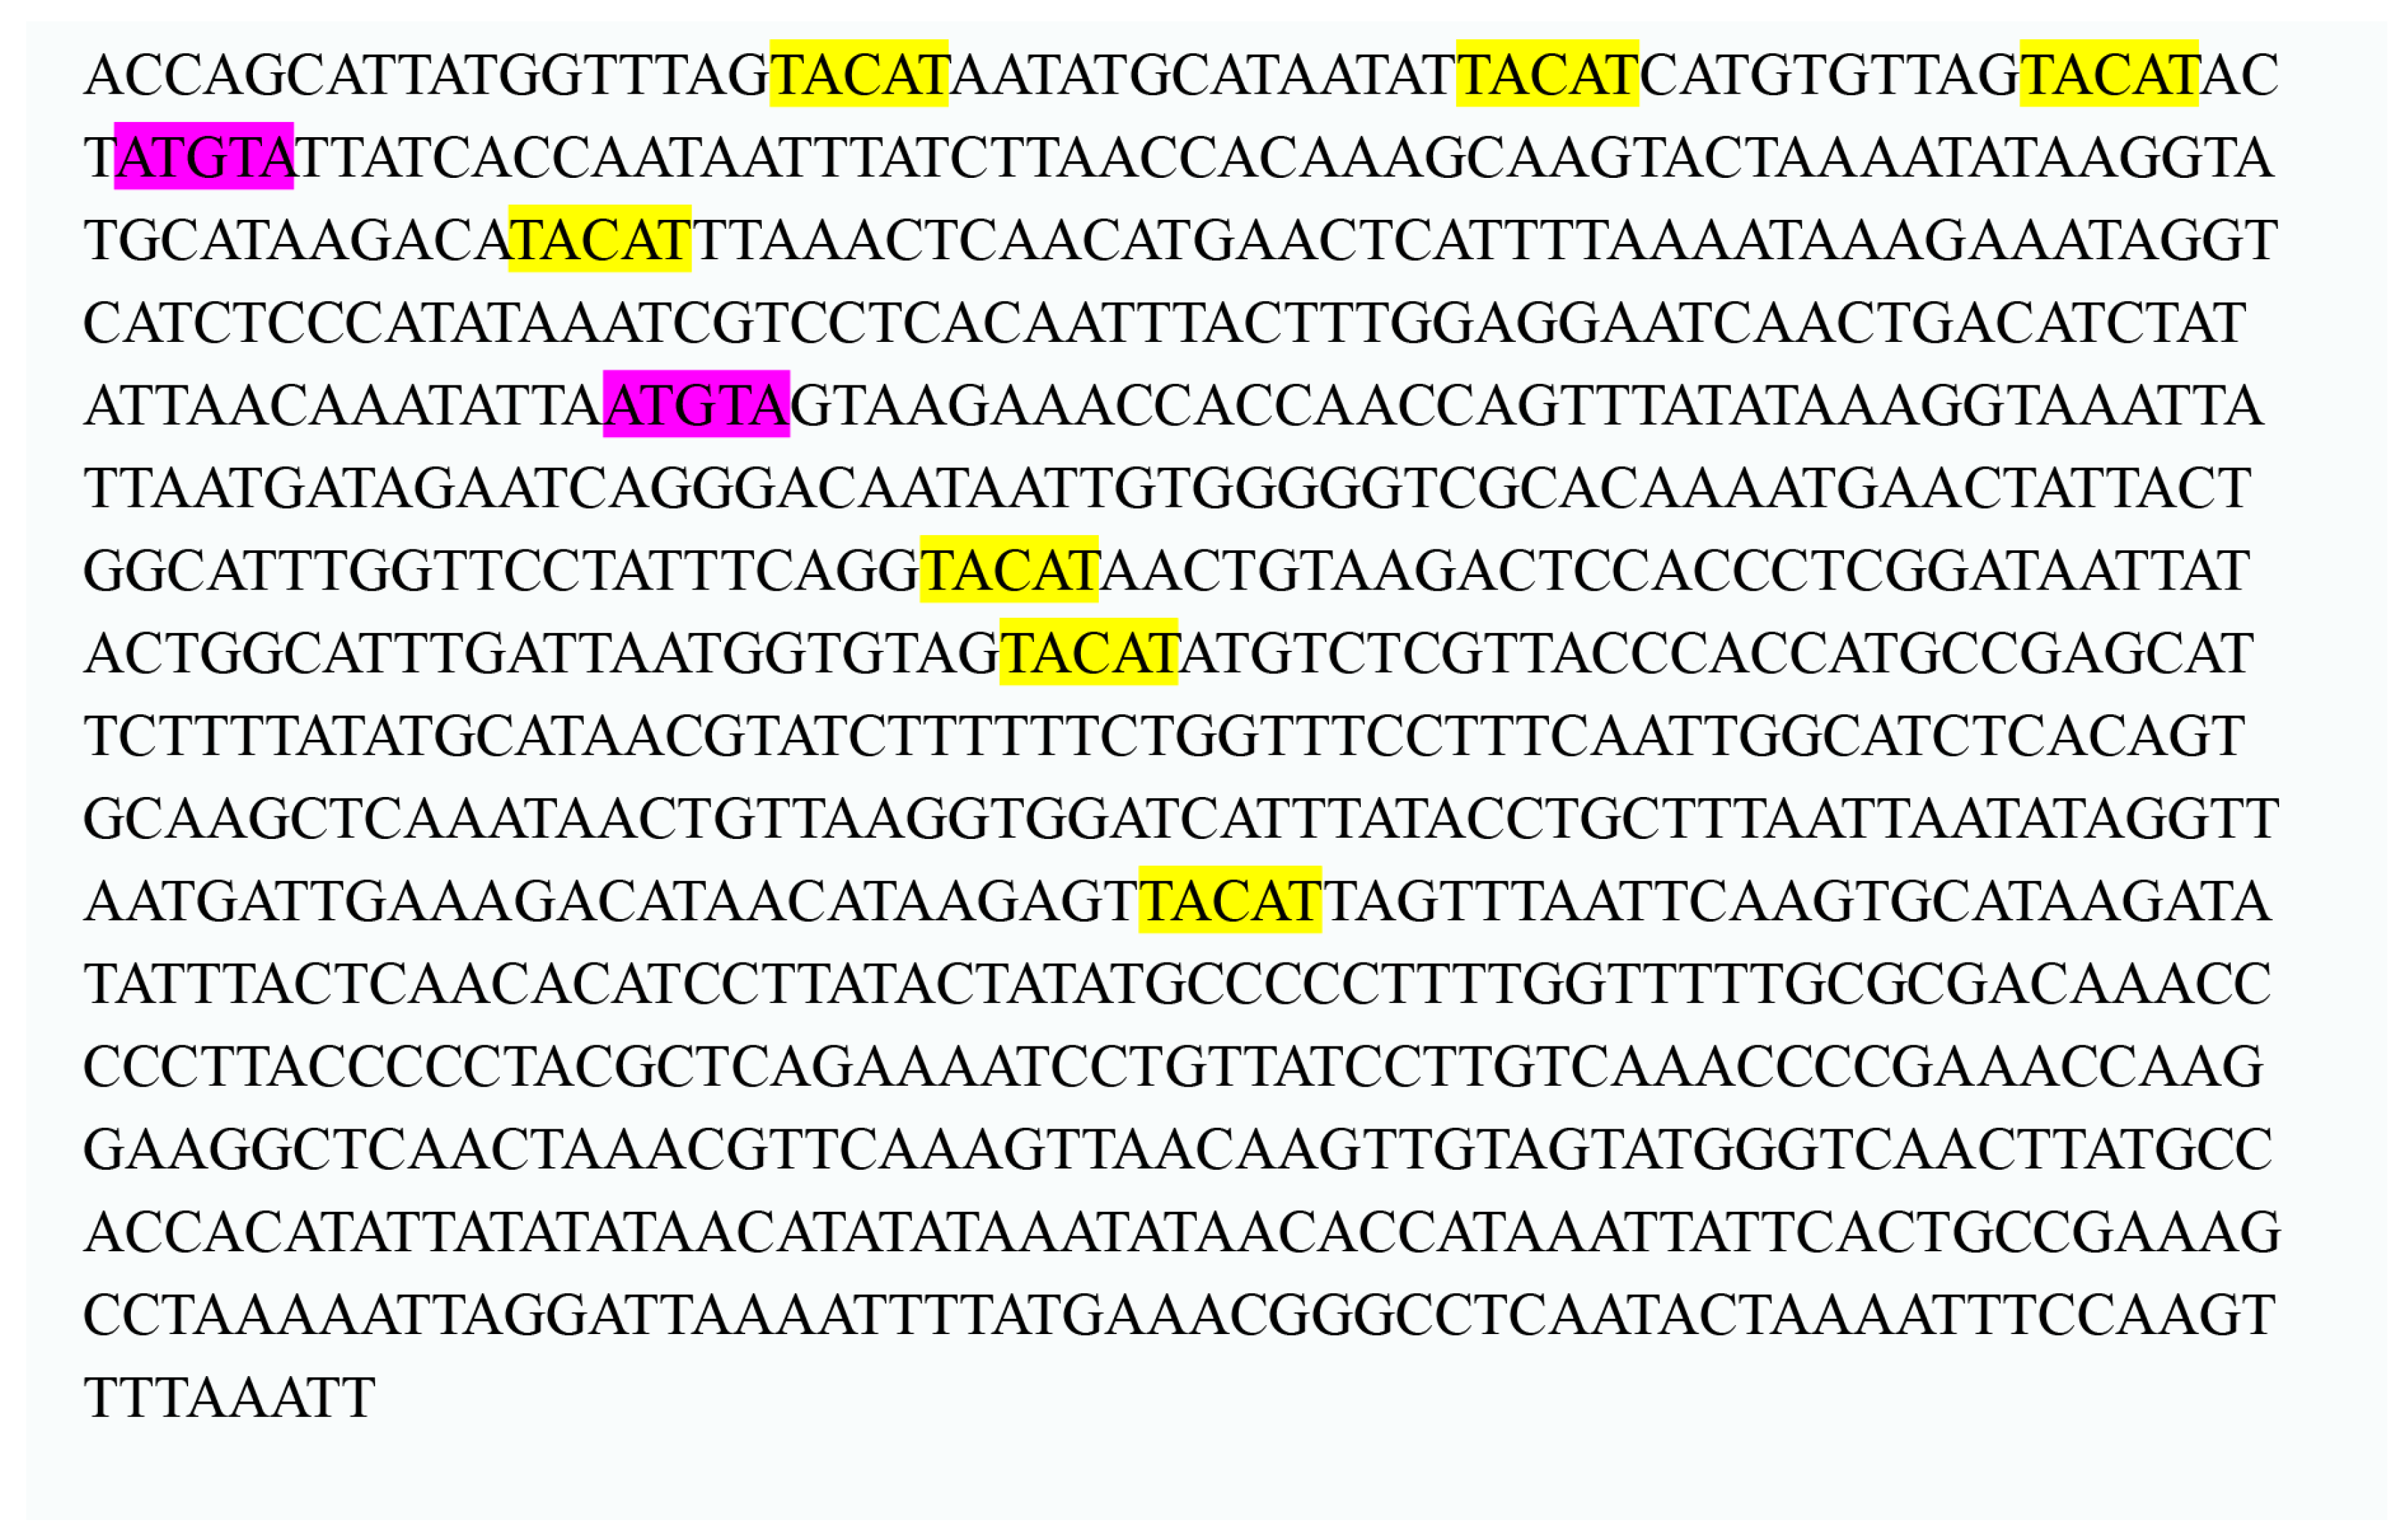
L. elongata exhibited the highest AT content (67.39%) among all regions of the mitochondrial genome. The palindromic sequence motifs ‘tacat’ and ‘atgta’ were related to the termination of H strand replication found in the CR of
L. elongata (
Figure 6), which might complete the termination by forming a stable hairpin structure [
64].
3.6. Phylogenetic Relationships
Based on the complete mitochondrial genome sequences of the
L. elongata and 36 Cyprinidaes, the phylogenetic tree was constructed. It was shown that the entire phylogenetic tree was grouped into two major clades (
Figure 7). The genus Cobitis, Pangio, Triplophysa, and Acanthocobitis formed one clade and matched the subfamily Cobitinae. The Cobitis and the Pangio were sister-lineage, the Triplophysa and the Acanthocobitis were sister-lineage, and the two sister-lineages were sister-lineages to each other. The other clade consisted of Yasuhikotakia, Sinibotia, Chromobotia, Botia, Parabotia, and Leptobotia, corresponding to the subfamily Botiinae. In the subfamily Botiinae,
L. elongata was more closely related to
L. microphthalma than other species.
As a diverse population, there was a controversy in the taxonomic relationship of the subfamily Cobitinae. This study exhibited a monophyly of the subfamily CobitinaeN, which consists of four clades. However, according to Liu et al [
11], there were sisterhoods in many branches. Therefore, the species in Cobitinae can’t form a monophyletic group, and the classification of Cobitinae in our study is incomplete, and more taxon should be used in future studies.
It is generally considered that the subfamily Botiinae is a group with relatively clear taxonomic relationship. In this study, according to their respective genera separately, all individuals except
L. mantschurica of the subfamily Botiinae were clustered into a common branch, which could be confirmed the monophyly of the subfamily Botiinae. In the previous study, the genera Botia was separated into a separate genus [
7], and the genera Botia was divided into three subgenera: Sinibotia, Botia, and Hymenophysa [
65]. Others did not further categorize these subgenra, but instead grouped them under the genus Botia [
12,
66]. In this study, subgenera Botia and subgenra sinibotia species were clustered separately and formed parallel branches with the species of other genera. Thus, the results supported that subgenera Botia and subgenra sinibotia should be raised to genus. Additionally, the phylogenetic tree showed that
L. elongata and
L. microphthalma formed a sister group, which together formed a sister group of other Leptobotia species. Acorrding to Li et al. [
18], the
L. elongata and
L. mantschurica were classified as sister lineages using protein genome sequence to construct the phylogenetic tree, however, this study was analysed based on limited taxon sampling and mitochondrial genes, lacking of sufficient information of phylogenetic the
L. elongata.
Slechtova et al. [
67] suggested that the Leptobotia and Parabotia genera were monophyletic using only the
Cytb and
12S. However, the phylogenetic tree in our study clearly showed that
L. mantschurica was nested with Parabotia, indicating that Leptobotia and Parabotia genera were an unnatural group and not reciprocally monophyletic groups as previously hypothesized [
13,
66,
68]. Additionally, there was obvious structural variation among the mitochondrial genome of
L. mantschurica, compared with other Leptobotia species, proving that
L. mantschurica formed a sister relationship with
Parabotia fasciatus instead of Leptobotia species is reliable, which shared the same results with Tang et al. [
13]. In the Parabotia species, part of the support vaule in the branch was low, suggestting that the phylogenetic relationships of these species haven‘t been solved well. Futher investigations should be performed to solve this problem.
4. Conclusion
In this study, we reported the complete mitogenome of L. elongata, the structural characteristics of the mitogenome of L. elongata were analyzed in detail, and the phylogenetic analyses of L. elongata were inferred using the complete mitogenome. The full length of the genome sequence was 16591 bp, and the arrangement of the L. elongata mitochondrial genome is similar to most teleost fishes. Almost all 13 PCGs showed the regular start codon ATG except gene cox1, which started with GTG. 6 PCGs have incomplete stop codons T--. 13PCGs were evolving under purifying selection, and the mitogenome shared the high identity with Leptobotia species. All the tRNA genes were standard clover-shaped except the lacking of DHU stem in trnS1. The phylogenetic analysis showed that L. elongata was more closely related to L. microphthalma than other species. L. mantschurica formed a sister relationship with Parabotia fasciatus, and the Leptobotia and Parabotia genera was polyphyletic. In this study, we first studied the selection pressure of complete PCGs in the L. elongata. Overall, we have a deeper understanding of the mitochondrial genome structure and phylogenetic analysis of L. elongata. However, exact information of about many Cobitidae fishes is still unkown. Extra taxon should be used for the phylogenetic research of Cobitidae in the future.
Author Contributions
Conceptualization, Z.K. and H.Y.; methodology, H.Y. and K.Z.; writing—original draft preparation, Z.K.; writing—review and editing, Z.K., M.H., H.Y., Z.L., H.L., T.J. and X.P. All authors have read and agreed to the published version of the manuscript.
Funding
This research was funded by supported by the National Training Program of Innovation and Entrepreneurship for Undergraduates of China (202110635024), and the Chongqing Alliance for Aquatic Science and Technology Innovation (CQFTIU2022-09).
Institutional Review Board Statement
The study was conducted in accordance with the Declaration of Helsinki and approved by the Animal Care and Use Committee of University of Southwest (Approval ID was 20190922, and the approval date was on 22 September 2019).
Informed Consent Statement
Not applicable.
Data Availability Statement
The datasets presented in this study were submitted to The National Center for Biotechnology Information (NCBI) database.
Acknowledgments
We would like to express our sincere thanks to Sichuan Fisheries Research Institute for their help in sample collecting.
Conflicts of Interest
The authors declare no conflict of interest.
References
- Yuan, Y.C; Yang, H.J; Gong, S.Y; Liang, Y.Q. Threatened fishes of the world: Leptobotia elongata Bleeker, 1870 (Bottiinae). Environ Biol Fish. 2010, 87, 295–296. [Google Scholar] [CrossRef]
- Chen, K.G.; Wang, Z.J.; Yue, X.J. Study of the structurs of the digestive system in Leptobotia Elongata. Southwest Agric. Univ. 2002, 24, 1000–2642. [Google Scholar] [CrossRef]
- Tian, H.W.; Duan, X.B.; Xiong, X.; Luo, H.Q.; Liu, S.P; Chen, D.Q. Estimation of growth and population parameters of elongate loach (Leptobotia elongata) in the upper reaches of the Yangtze River. Yangtze Basin. 2013, 22, 1305–1312. [Google Scholar]
- Zhang, Y.; Cao, X.; Zou, Y.; Yan, Z.; Huang, Y.; Zhu, Y.; Gao, J. De novo gonad transcriptome analysis of elongate loach (Leptobotia elongata) provides novel insights into sex-related genes. Comp Biochem Phys D. 2022, 42, 100962. [Google Scholar] [CrossRef] [PubMed]
- Yue, P.; Chen, Y. China Red Data Book of Endangered Animals: Pisces; Science Press: Beijing, China, 1998; pp. 240–243. [Google Scholar]
- Regan, C.T. The classification of the teleostean fishes of the order Ostariophysi. I. Cyprinidae. Ann. Mag. Nat. Hist. 1911, 8, 13–32. [Google Scholar] [CrossRef]
- Hora, S.L. Classification, bionomics and evolution of homalopterid fishes. Mem. Indian. Mus. 1932, 12, 263–330. [Google Scholar]
- Berg, L.S. Classification of fishes both recent and fossil. Trav. Inst. Zool. Acad. Sci. USSR. 1940, 87–345. [Google Scholar] [CrossRef]
- Liu, H.Z.; Tzeng, C.S.; Teng, H.Y. Sequence variations in the mitochondrial DNA control region and their implications for the phylogeny of the Cypriniformes. Can. J. Zool. 2002, 80, 569–581. [Google Scholar] [CrossRef]
- Nalbant, T.T. Sixty million years of evolution. Part one: family Botiidae (Pisces: Ostariophysi: Cobitoidea). Trav. Mus. Hist. Nat, 44.
- Liu, H.Y; Cai, J.; Xie, Z.G.; Xiong, F.; Wang, Y.; Wang, Q.; Yu, J.X.; Zhai, D.D.; Xia, M.; Chen, Y.Y. DNA Barcodes for species identification and systematic evolution of cobitidae fish. Acta Agric. Univ. Jiangxiensis. 2020, 42, 766–777. [Google Scholar] [CrossRef]
- Liu, S.Q.; Mayden, R.L.; Zhang, J.B.; Yu, D.; Tang, Q.Y.; Deng, X.; Liu, H.Z. Phylogenetic relationships of the Cobitoidea (Teleostei: Cypriniformes) inferred from mitochondrial and nuclear genes with analyses of gene evolution. Gene. 2012, 508, 60–72. [Google Scholar] [CrossRef]
- Tang, Q.Y.; Liu, H.Z.; Mayden, R.; Xiong, B.X. Comparison of evolutionary rates in the mitochondrial DNA cytochrome b gene and control region and their implications for phylogeny of the Cobitoidea (Teleostei: Cypriniformes). Mol. Phylogenet.Evol. 2006, 39, 347–357. [Google Scholar] [CrossRef]
- Yuan, Q.; Wang, Y.; Liang, R.; Feng, J.; Kefeng, A. Field observations of the lethality characteristics of endangered and endemic fish under the stress of total dissolved gas supersaturation. River Res Appl. 2020. 38, 1156–1167. [CrossRef]
- Zhang, Y.H.; Ding, Y.; Zheng-Xuan, G.U.; Huang, X.X.; Wen, Y.Z.; Min, S. Artificial propagation and embryonic development observation of leptobotia elongata from Jinsha River and Yangtze River. HubeiAgric.Sci. 2018, 57, 104–107. [Google Scholar] [CrossRef]
- Liu, D.; Li, X.; Song, Z. No decline of genetic diversity in elongate loach (Leptobotia elongata) with a tendency to form population structure in the upper Yangtze River. Glob ecol conserv. 2020, 23, e01072. [Google Scholar] [CrossRef]
- Liu, D.Q.; Wu, J.Y.; Deng, L.J.; Gan, W.X.; Du, L.M.; Song, Z.B. Development of Microsatellite Markers for Leptobotia elongata (Cypriniformes: Cobitidae) Using 454 Sequencing and Cross-species Amplification. Pak J Zool. 2014, 4, 1147–1151. [Google Scholar]
- Li, P.; Yang, C.Z.; Tu, F.Y.; Liu, G.X. The complete mitochondrial genome of the Elongate loach Leptobotia elongata (Cypriniformes: Cobitidae). MtDNA. 2012, 23, 352–354. [Google Scholar] [CrossRef]
- Caccone, A.; Gentile, G.; Burns, C.E.; Sezzi, E.; Powell, J.R. Extreme difference in rate of mitochondrial and nuclear DNA evolution in a large ectotherm, Galápagos tortoises. Mol phylogenet evol. 2004, 31, 794–798. [Google Scholar] [CrossRef] [PubMed]
- Liu, Y.; Wu, P.D.; Zhang, D.Z.; Zhang, H.B.; Tang, B.P.; Liu, Q.N. Mitochondrial genome of the yellow catfish Pelteobagrus fulvidraco and insights into Bagridae phylogenetics. Genomics. 2018, 111, 1258–1265. [Google Scholar] [CrossRef] [PubMed]
- Wang, C.H.; Chen, Q.; Lu, G.Q.; Xu, J.W.; Yang, Q.L.; Li, S. Complete mitochondrial genome of the grass carp (Ctenopharyngodon idella, Teleostei): Insight into its phylogenic position within Cyprinidae. Gene. 2008, 424, 96–101. [Google Scholar] [CrossRef] [PubMed]
- Tang, K.L.; Agnew, M.K.; Hirt, M.V.; Sado, T.Y.; Schneider, L.M.; Freyhof, J.; Sulaiman, Z.; Swartz, E.; Vidthayanon, C.; Miya, M.; Saitoh, K.; Simons, A.M.; Wood, R.M.; Mayden, R.L. Systematics of the subfamily Danioninae (Teleostei: Cypriniformes: Cyprinidae). Mol phylogenet evol. 2010, 57, 189–214. [Google Scholar] [CrossRef]
- Muniyangd, N.; Raja, M.; Vikram, P. Genetic characterization of Bagarius species using cytochrome c oxidase I and cytochrome b genes. MtDNA. 2016, 27, 3781–3783. [Google Scholar] [CrossRef]
- Chen, D.X.; Chu, W.Y.; Liu, X.L.; Nong, X.X.; Li, Y.L.; Du, S.J.; Zhang, J. Phylogenetic studies of three sinipercid fishes (Perciformes: Sinipercidae) based on complete mitochondrial DNA sequences. MtDNA 2012, 23, 70–76. [Google Scholar] [CrossRef] [PubMed]
- Pavan-Kumar, A.; Raman, S.; Koringa, P.G.; Patel, N.; Chaudhari, A. Complete mitochondrial genome of threatened mahseer Tor tor (Hamilton 1822) and its phylogenetic relationship within Cyprinidae family. J. Genet. 2016, 95, 853–863. [Google Scholar] [CrossRef] [PubMed]
- Zou, X.H.; Ge, S. Conflicting gene trees and phylogenomics. J SYST EVOL. 2008, 46, 795–807. [Google Scholar] [CrossRef]
- Rieppel, O. ‘Total evidence’ in phylogenetic systematics. Biol Philos. 2009, 24, 607–622. [Google Scholar] [CrossRef]
- Bankevich, A.; Nurk, S.; Antipov, D.; Gurevich, A.A.; Dvorkin, M.; Kulikov, A.S.; Lesin, V.M.; Nikolenko, S.I.; Pham, S.; Prjibelski, A.D.; Pyshkin, A.V.; Sirotkin, A.V.; Vyahhi, N.; Tesler, G.; Alekeseyev, A.M.; Pevzner, P.A. SPAdes: a new genome assembly algorithm and its applications to single-cell sequencing. J Comput Biol. 2012, 19, 77–455. [Google Scholar] [CrossRef] [PubMed]
- Bernt, M.; Donath, A.; Jühling, F.; Externbrink, F.; Florentz, C.; Fritzsch, G.; Pütz, J.; Middendorf, M.; Stadler, P.F. MITOS: Improved de novo metazoan mitochondrial genome annotation. Mol. phylogenet. Evol 2013, 69, 313–319. [Google Scholar] [CrossRef] [PubMed]
- Lohse, M.; Drechsel, O.; Bock, R. OrganellarGenomeDRAW (OGDRAW): a tool for the easy generation of high-quality custom graphical maps of plastid and mitochondrial genomes. Curr Genet. 2007. 52, 74–267. [CrossRef]
- Perna, N.T.; Kocher, T.D. Patterns of nucleotide composition at fourfold degenerate sites of animal mitochondrial genomes. J Mol Evol. 1995, 41, 353–358. [Google Scholar] [CrossRef]
- Katoh, K.; Standley, D.M. MAFFT multiple sequence alignment software version 7: improvements in performance and usability. Mol Biol Evol. 2013, 30, 80–772. [Google Scholar] [CrossRef]
- Wang, D.P.; Zhang, Y.B.; Zhang, Z.; Zhu, J.; Yu, J. KaKs_Calculator 2.0: a toolkit incorporating gamma-series methods and sliding window strategies. Genom Proteom Bioinf. 2010, 8, 77–80. [Google Scholar] [CrossRef]
- Stothard, P.; Grant, R.J.; Domselaar, G.V. Visualizing and comparing circular genomes using the CGView family of tools. Brief Bioinform. 2019, 20, 1576–1582. [Google Scholar] [CrossRef] [PubMed]
- Zhong, L.Q.; Wang, M.H.; Li, D.; Tang, S.; Zhang, T.Q.; Bian, W.J.; Chen, X.H. Complete mitochondrial genome of Odontobutis haifengensis (Perciformes, Odontobutiae): A unique rearrangement of tRNAs and additional non-coding regions identified in the genus Odontobutis. Genomics. 2018, 110, 382–388. [Google Scholar] [CrossRef] [PubMed]
- Prabhu, V.R.; Singha, H.S.; Kumar, R.G.; Gopalakrishnan, A.; Nagarajan, M. Characterization of the complete mitochondrial genome of Barilius malabaricus and its phylogenetic implications. Genomics. 2020, 112, 2154–2163. [Google Scholar] [CrossRef] [PubMed]
- Wei, S.; Shi, M.; Chen, X.; Sharkey, M.; Achterberg, C.; Ye, G.; He, J. New views on strand asymmetry in insect mitochondrial genomes. PLoS ONE. 2010, 5, e12708. [Google Scholar] [CrossRef] [PubMed]
- Tian, H.; Wang, D.; Jia, X.; Duan, X.; Chen, D. The mitogenome of Leptobotia microphthalma (Teleostei, Cypriniformes: Cobitidae). MtDNA 2014, 25, 261–262. [Google Scholar] [CrossRef]
- Yang, N.; Li, Y.; Liu, Z.; Chen, Q.; Shen, Y. The complete mitochondrial genome of Cobitis macrostigma (Cypriniformes: Cobitidae: Cobitinae) and a phylogenetic implication for its closely related species. Biologia. 2020, 75, 393–399. [Google Scholar] [CrossRef]
- Ma, Q.; Zhang, T.L.; Chen, L.; Tang, Q.Y. The Complete Mitochondrial Genomes of Parabotia Kiangsiensis (Cypriniformes: Botiidae). MtDNA. 2020, 5, 3629–3631. [Google Scholar] [CrossRef] [PubMed]
- Ojala, D.; Montoya, J.; Attardi, G. tRNA punctuation model of RNA processing in human mitochondria. Nature, 1981, 290, 470–474. [Google Scholar] [CrossRef]
- Garey, J.R.; Wolstenholme, D.R. Platyhelminth mitochondrial DNA: Evidence for early evolutionary origin of a tRNAserAGN that contains a dihydrouridine arm replacement loop, and of serine-specifying AGA and AGG codons. J Mol Evol. 1989, 28, 374–387. [Google Scholar] [CrossRef]
- Sharma, A.; Siva, C.; Ali, S.; Sahoo, P.K.; Sarma, D. The complete mitochondrial genome of the medicinal fish, Cyprinion semiplotum: Insight into its structural features and phylogenetic implications. INT J BIOL MACROMOL. 2020, 164, 939–948. [Google Scholar] [CrossRef]
- Lee, Y.S.; Prakash Patil, M.; Kim, J.O.; Lee, Y.J.; Seo, Y.B.; Kim, J.K.; Suryawanshi, R.K. The Complete Mitochondrial Genome of the Fivespot Flounder, Pseudorhombus pentophthalmus (Pleuronectiformes: Paralichthyidae), from Korea and Its Phylogenetic Analysis. Fishes. 2023, 8, 150, doi103390/fishes8030150. [Google Scholar] [CrossRef]
- Pavan-Kumar, A.; Singh, S.; Mishra, A.; Suman, S.; Gireesh-Babu, P.; Chaudhari, A.; Shen, K.N.; Borsa, P. Characterization of mitochondrial genome of Indian Ocean blue-spotted maskray, Neotrygon indica and its phylogenetic relationship within Dasyatidae Family. Int. J. Biol. Macromol. 2022, 223, 458–467. [Google Scholar] [CrossRef]
- William, B. Codon distribution in vertebrate genes may be used to predict gene length. J MOL BIOL. 1987, 197, 379–388. [Google Scholar] [CrossRef]
- Sueoka, N. Two Aspects of DNA Base Composition: G+C Content and Translation-Coupled Deviation from Intra-Strand Rule of A=T and G=C. J MOL EVOL. 1999, 49, 49–62. [Google Scholar] [CrossRef]
- Akashi, H. Translational selection and yeast proteome evolution. Genetics. 2003, 164, 1291–1303. [Google Scholar] [CrossRef]
- Bernardi, G.; Bernardi, G. Compositional Constraints and Genome Evolution. J. Mol. Evol. 1986, 24, 1–11. [Google Scholar] [CrossRef]
- D'Onofrio, G.; Mouchiroud, D.; Aïssani, B.; Gautier, C.; Bernardi, G. Correlations between the compositional properties of human genes, codon usage, and amino acid composition of proteins. J Mol Evol. 1991, 32, 504–510. [Google Scholar] [CrossRef]
- Foster, P.G.; Jermiin, L.S.; Hickey, D.A. Nucleotide Composition Bias Affects Amino Acid Content in Proteins Coded by Animal Mitochondria. J Mol Evol. 1997, 44, 282–288. [Google Scholar] [CrossRef] [PubMed]
- Dudgeon, C.L.; Broderick, D.; Ovenden, J.R. IUCN classification zones concord with, but underestimate, the population genetic structure of the zebra shark Stegostoma fasciatum in the Indo-West Pacific. Mol. Ecol. 2009, 18, 248–261. [Google Scholar] [CrossRef] [PubMed]
- Hurst, L.D. The Ka/Ks ratio: diagnosing the form of sequence evolution. Trends Genet. 2002, 18, 486–487. [Google Scholar] [CrossRef]
- Yang, Z.; Bielawski, J.P. Statistical methods for detecting molecular adaptation. Trends Ecol. Evol. 2000, 15, 496–503. [Google Scholar] [CrossRef]
- He, Y.; Chen, Y.; Yan, J.; Page, L.M. Phylogenetic analysis and osteological comparison of the cave-dwelling spined loach, Bibarba parvoculus (Cypriniformes: Cobitidae), and its surface congener. Zool. J. Linn. Soc. 2021, 191, 1059–1074. [Google Scholar] [CrossRef]
- Shen, Y.J.; Wang, J.; Zhang, F.B. Complete Mitochondrial Genome of Parabotia bimaculata (Cypriniformes: Cobitidae: Botiinae), an Endemic Riverine Loach in China and Phylogenetic Analysis for Botiinae. Thalassas. 2020, 36, 387–393. [Google Scholar] [CrossRef]
- Yang, X.G.; Lian, Y.X.; Chen, M.M.; Li, X.Q.; Yu, D.P. Characterization and phylogenetic analysis of the complete mitochondrial genome of sun loach (Yasuhikotakia eos). MtDNA. 2021, 6, 13–14. [Google Scholar] [CrossRef]
- Baeza, J.A. The complete mitochondrial genome of the Caribbean spiny lobster Panulirus argus. Sci. Rep. 2018, 8, 1–10. [Google Scholar] [CrossRef]
- Inoue, J.G.; Miya, M.; Tsukamoto, K.; Nishida, M. Complete mitochondrial DNA sequence of the Japanese sardine Sardinops melanostictus. Fish Sci. 2010, 66, 924–932. [Google Scholar] [CrossRef]
- Varani, G.; McClain, W.H. The G·U wobble base pair: A fundamental building block of RNA structure crucial to RNA function in diverse biological systems. EMBO Rep. 2000, 1, 18–23. [Google Scholar] [CrossRef]
- Chen, L.; Lin, Y.F.; Xiao, Q.; Lin, Y.; Du, Y.; Lin, C.X.; Ward-Fear, G.; Hu, C.C.; Qu, Y.F.; Li, H. Characterization of the complete mitochondrial genome of the many-lined sun skink (Eutropis multifasciata) and comparison with other Scincomorpha species. Genomics. 2021, 113, 2526–2536. [Google Scholar] [CrossRef] [PubMed]
- Gao, Y.C.; Zhang, J.; Wang, Q.H.; Liu, Q.N.; Tang, B.P. The Complete Mitochondrial Genome of Box Tree Moth Cydalima perspectalis and Insights into Phylogenetics in Pyraloidea. Animals. 2023, 13, 1045. [Google Scholar] [CrossRef] [PubMed]
- Wang, X.; Wang, J.; He, S.; Mayden, R.L. The complete mitochondrial genome of the Chinese hook snout carp Opsariichthys bidens (Actinopterygii: Cypriniformes) and an alternative pattern of mitogenomic evolution in vertebrate. Gene. 2007, 399, 11–19. [Google Scholar] [CrossRef]
- Broughton, R.E.; Milam, J.E.; Roe, B.A. The Complete Sequence of the Zebrafish (Danio rerio) Mitochondrial Genome and Evolutionary Patterns in Vertebrate Mitochondrial DNA. Genome Res. 2001, 11, 1958–1967. [Google Scholar] [CrossRef]
- Fang, P.W. Study on Botoid Fishes of China. Sinensia 1936, 7. [Google Scholar]
- Tang, Q.Y. molecular phylogeny of the cobitoidea. HZAU. 2005.
- Slechtova, V.; Bohlen, J.; Freyhof, J.; Rab, P. Molecular phylogeny of the Southeast Asian freshwater fish family Botiidae (Teleostei: Cobitoldea) and the origin of polyploidy in their evolution. Mol. Phylogenet. Evol. 2006, 39, 529–541. [Google Scholar] [CrossRef]
- Tang, Q.Y.; Yu, D.; Liu, H.Z. Leptobotia zebra Should Be Revised as Sinibotia zebra (Cypriniformes: Botiidae). Zoological Research. 2008, 29, 1–9. [Google Scholar] [CrossRef]
|
Disclaimer/Publisher’s Note: The statements, opinions and data contained in all publications are solely those of the individual author(s) and contributor(s) and not of MDPI and/or the editor(s). MDPI and/or the editor(s) disclaim responsibility for any injury to people or property resulting from any ideas, methods, instructions or products referred to in the content. |
© 2023 by the authors. Licensee MDPI, Basel, Switzerland. This article is an open access article distributed under the terms and conditions of the Creative Commons Attribution (CC BY) license (http://creativecommons.org/licenses/by/4.0/).
