3.1. Thermal decomposition
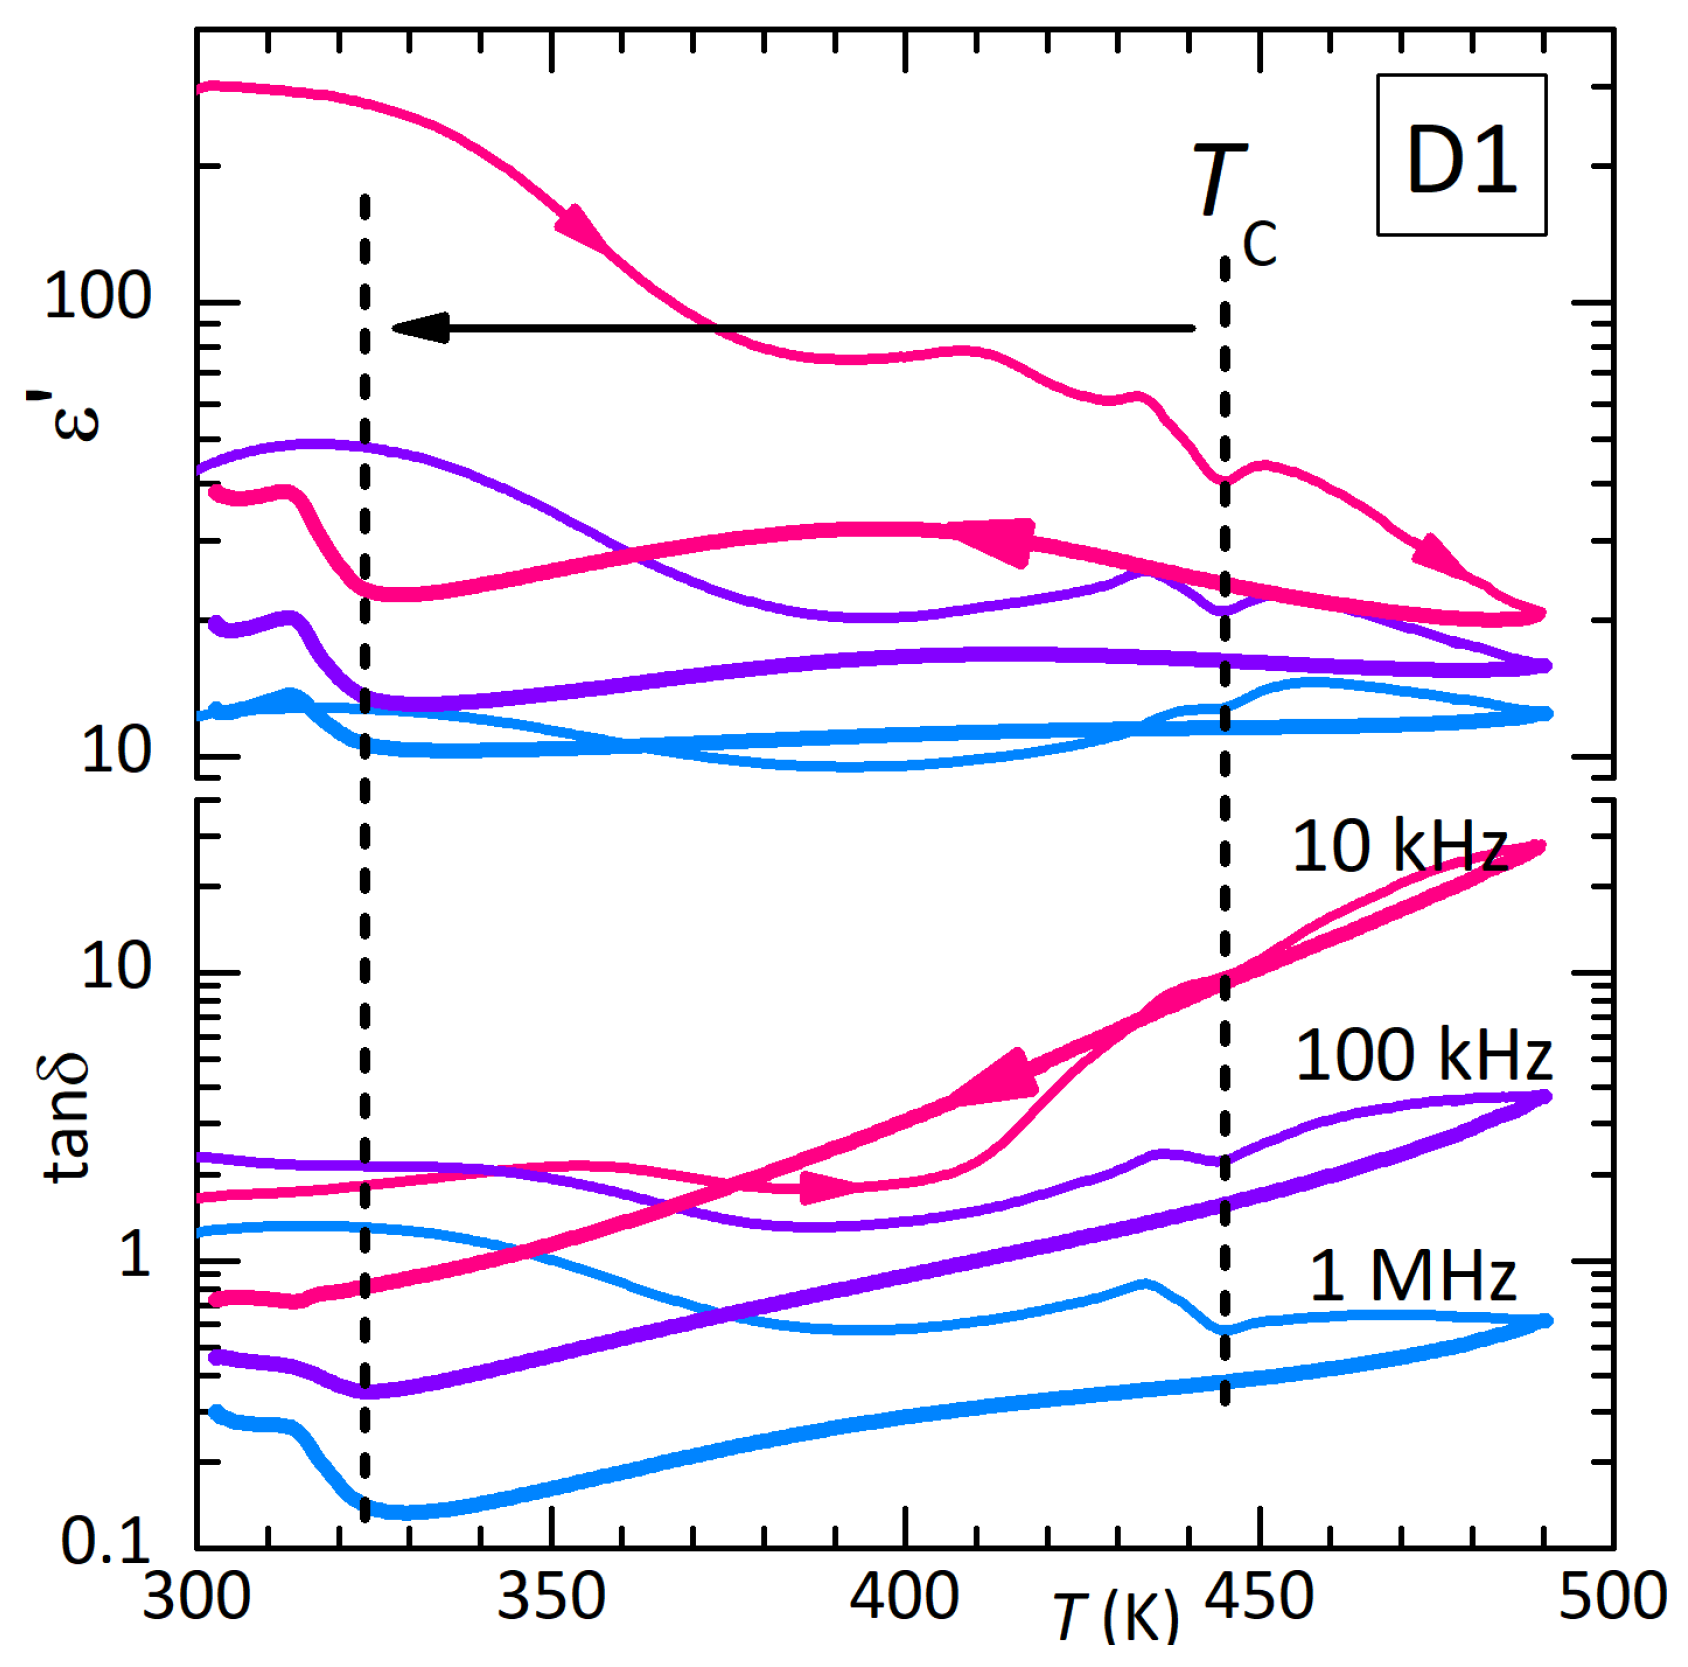
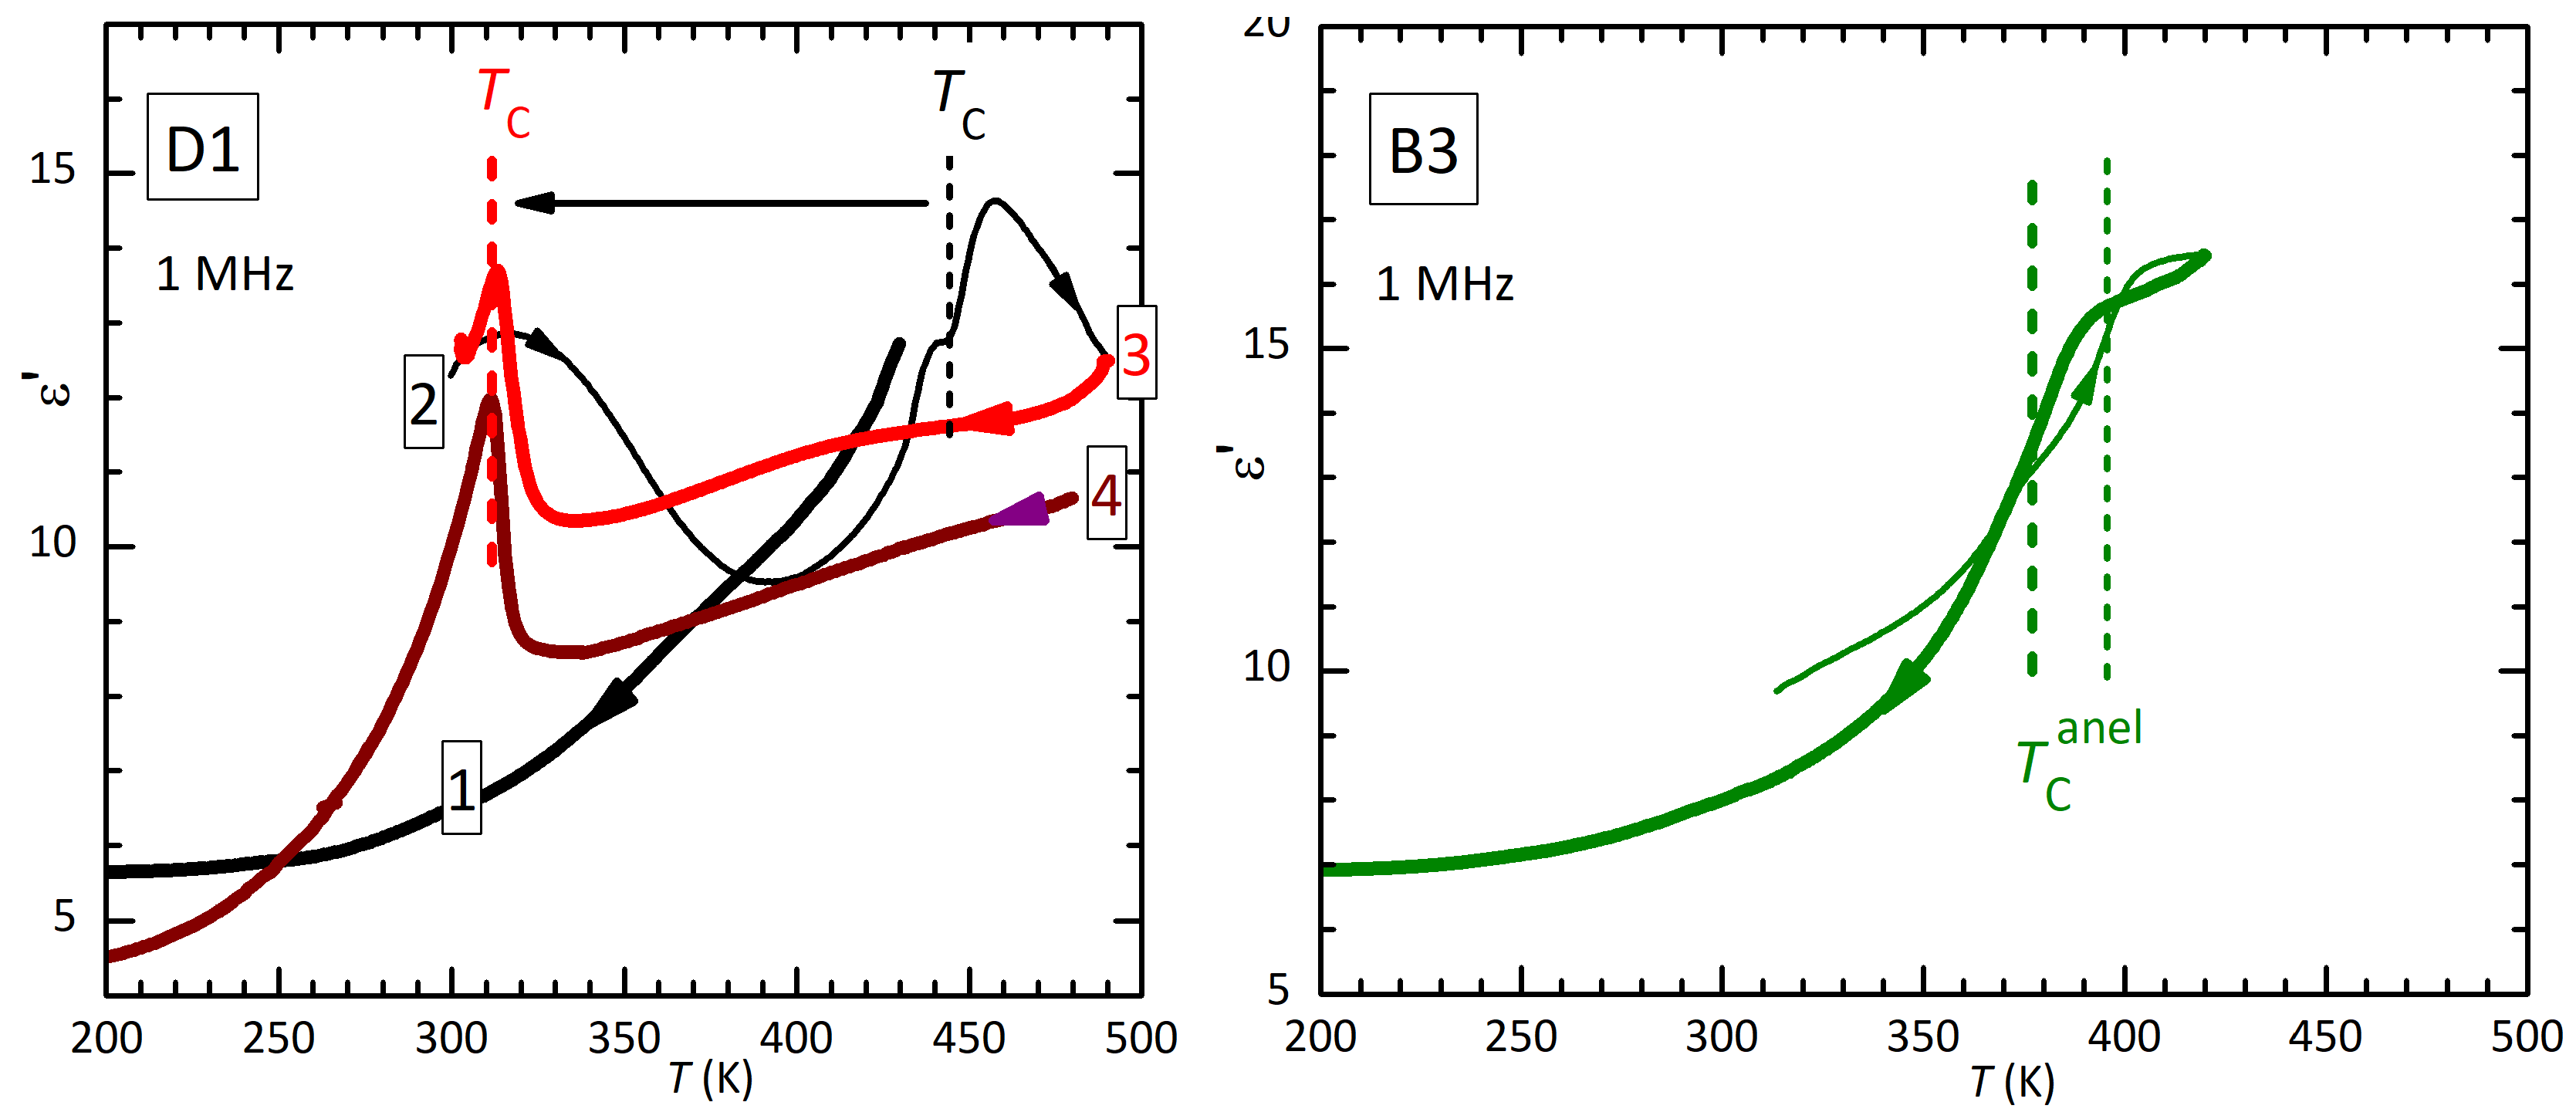
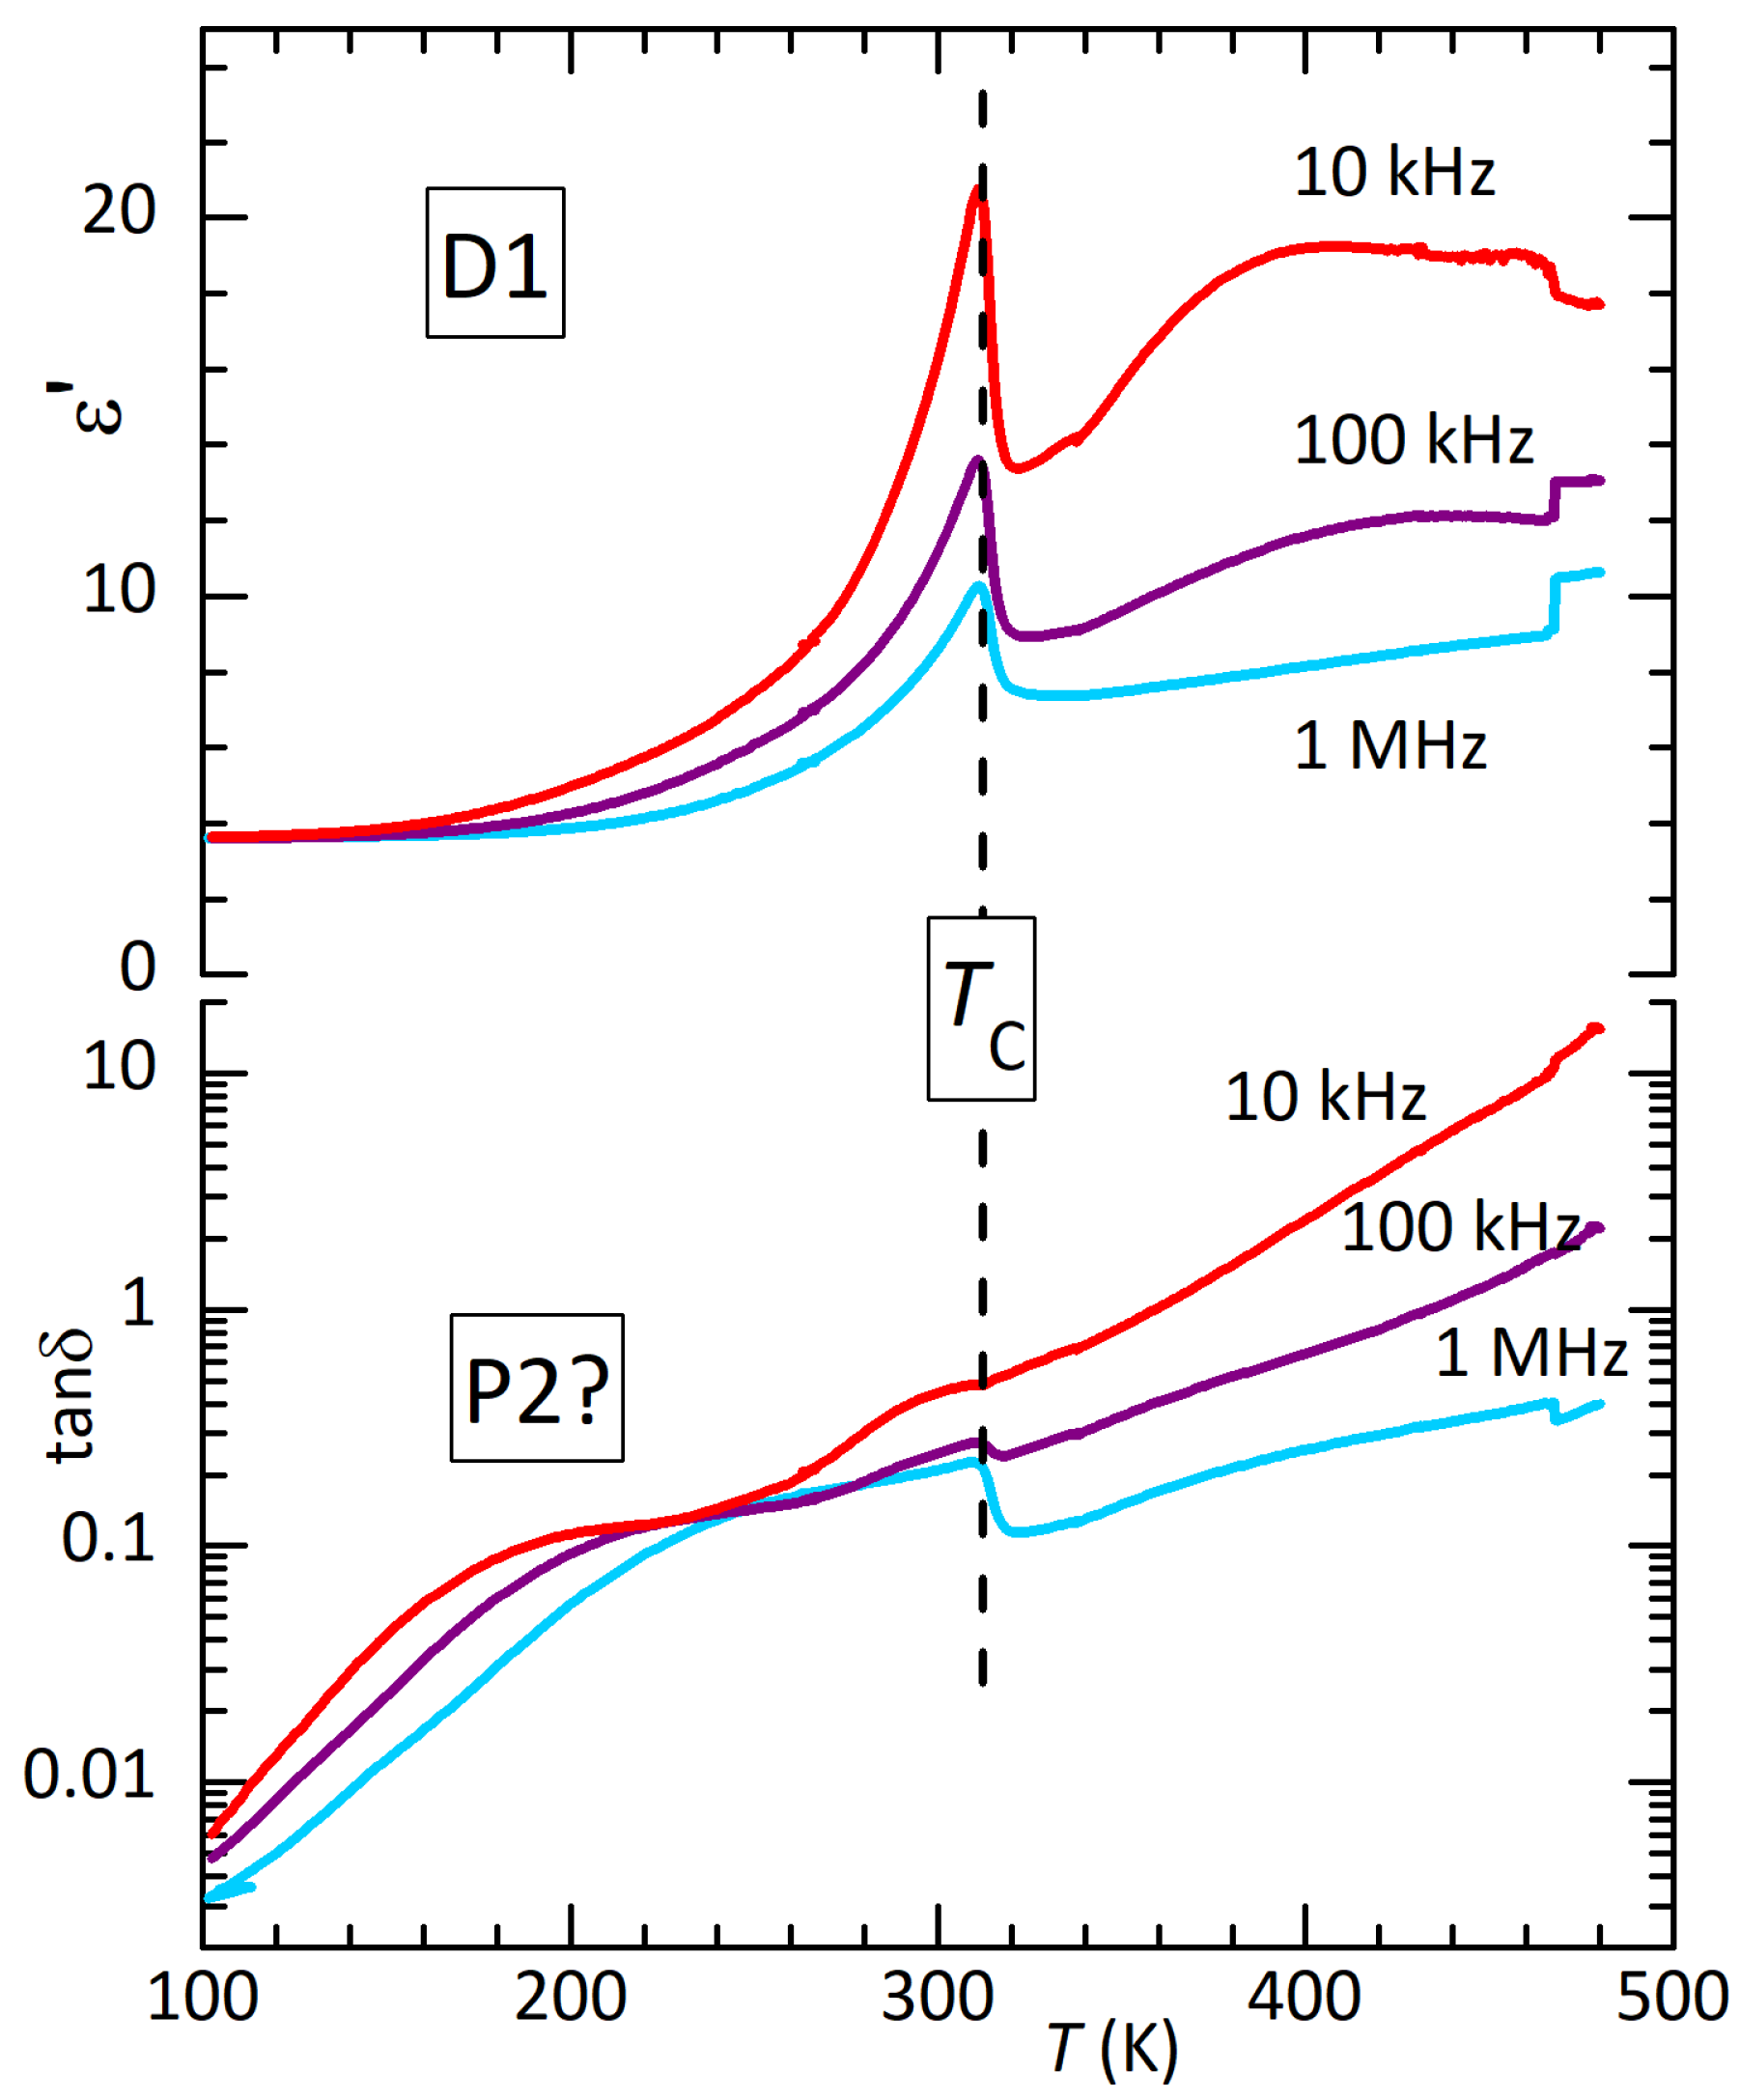
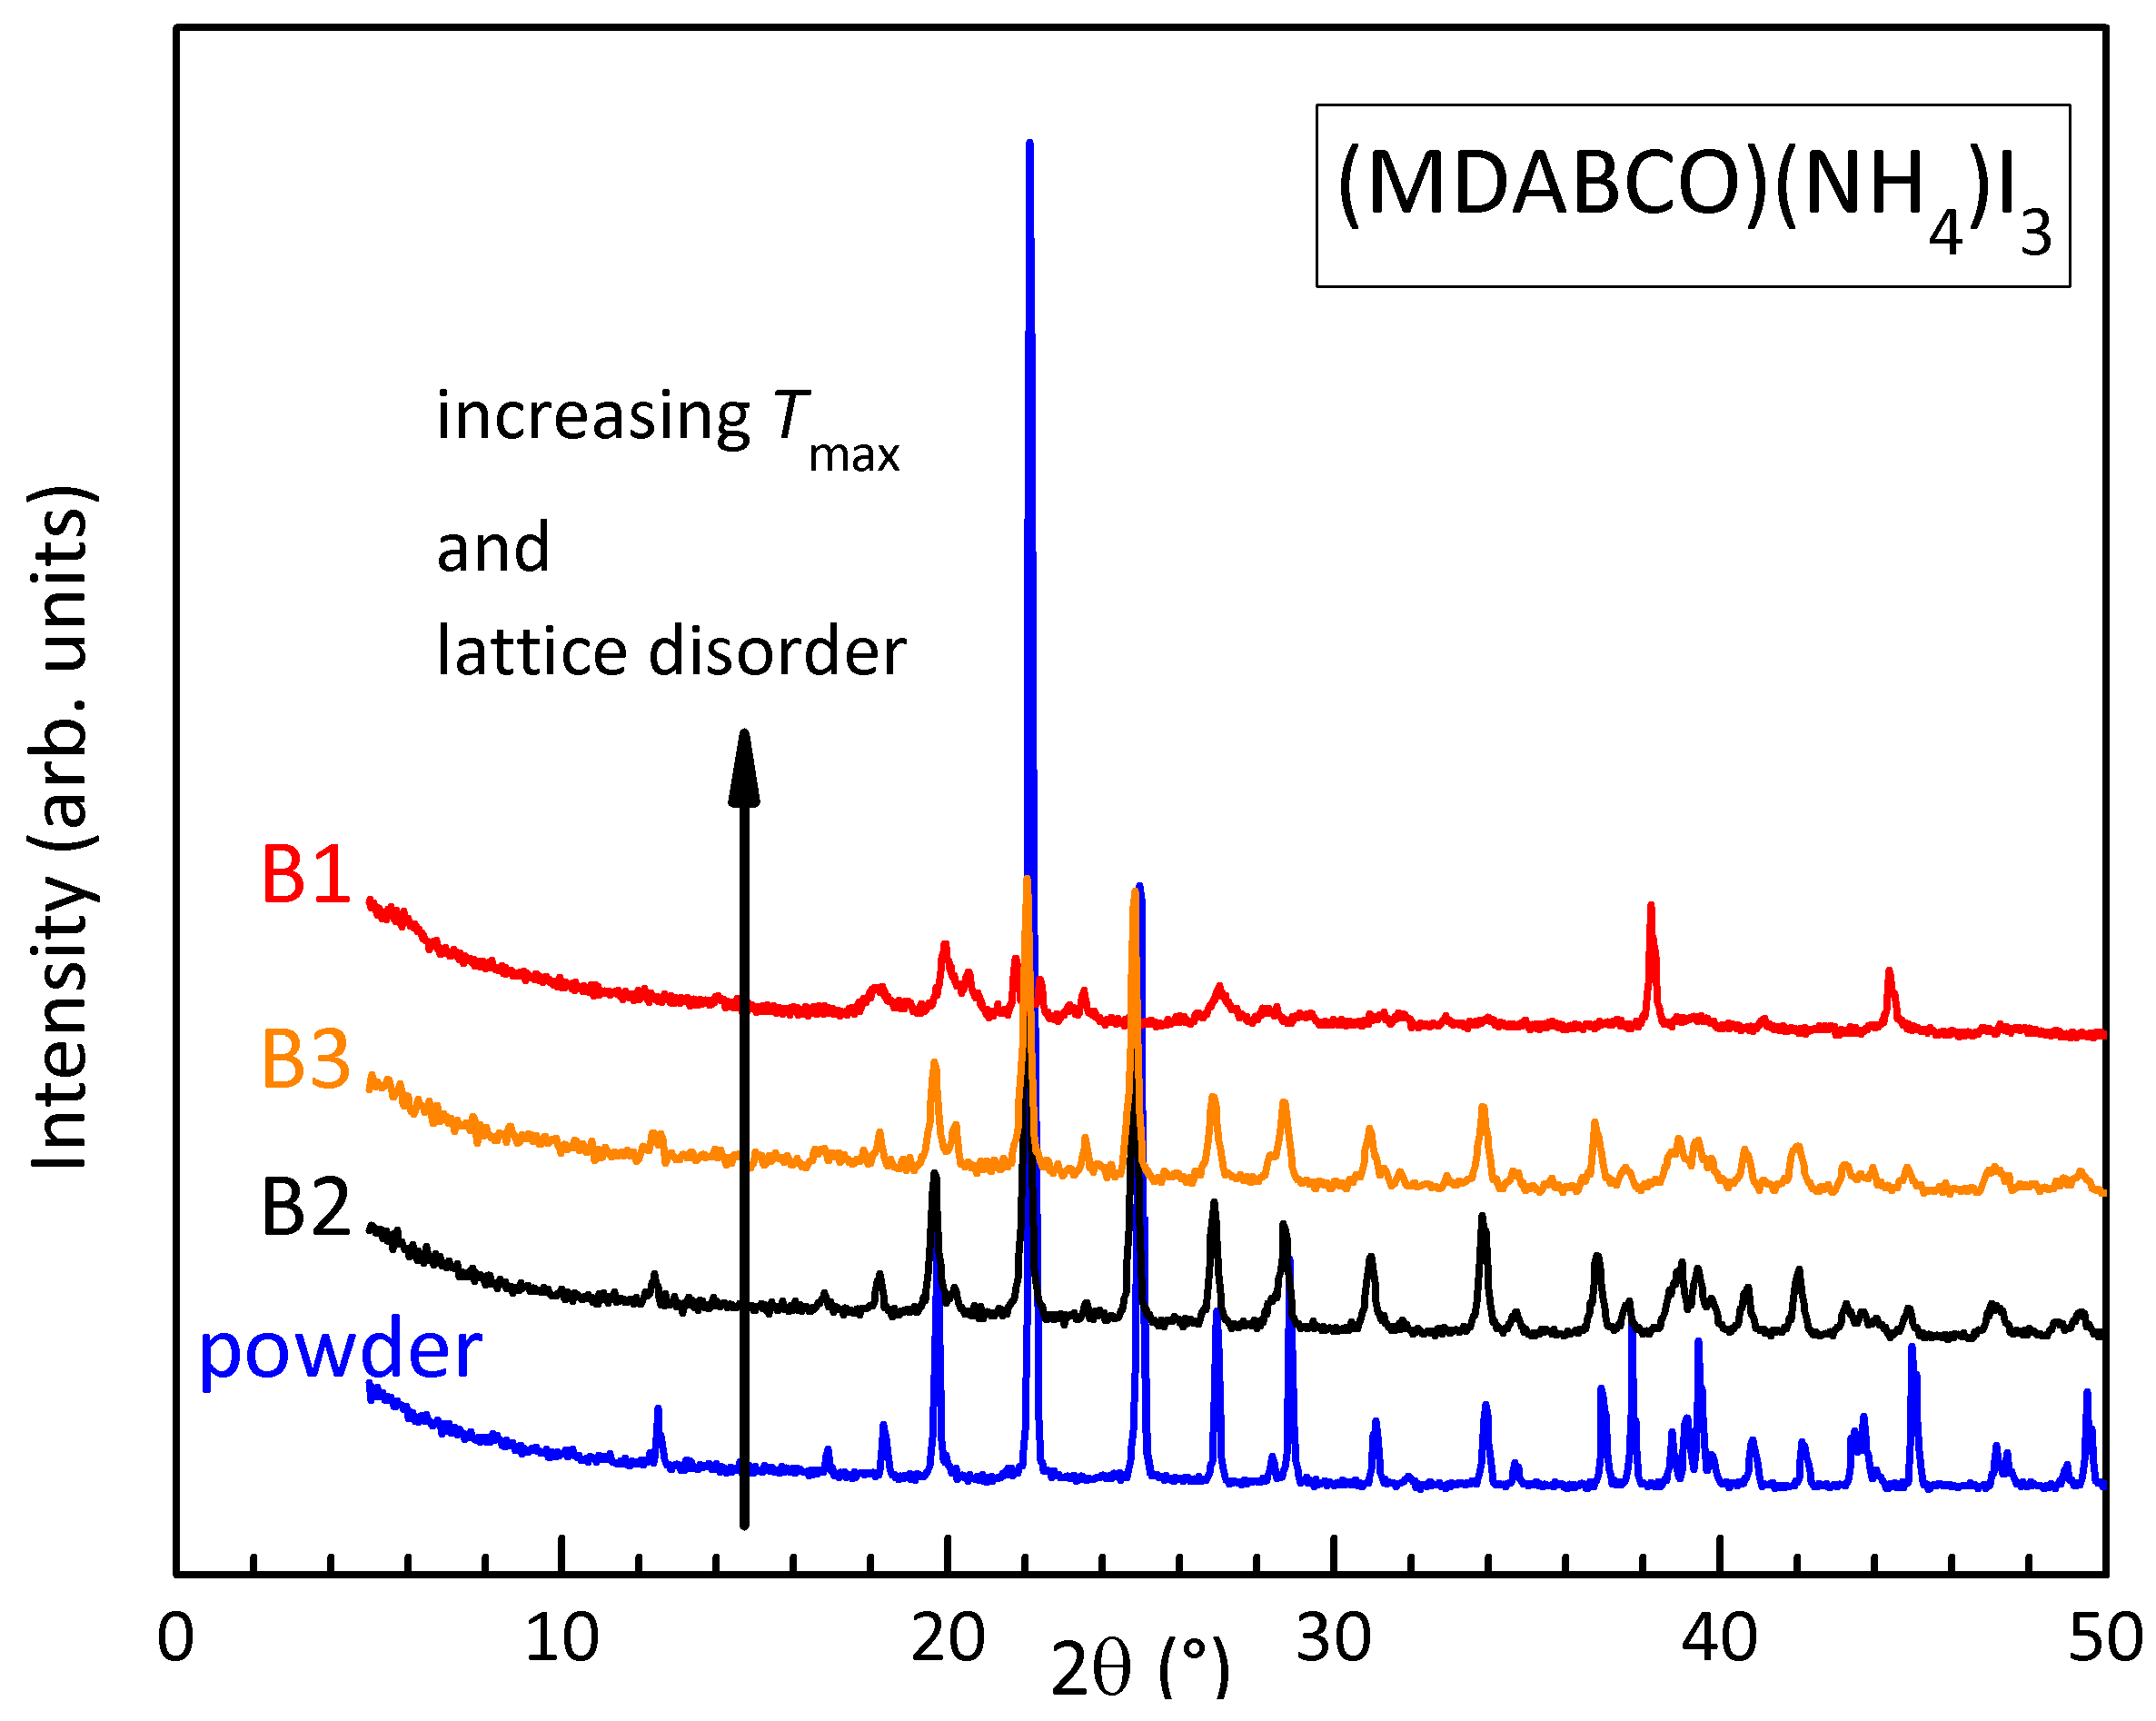
From these measurements one deduces that polycrystalline (MDABCO)() suffers thermal decomposition in vacuum already just above 445 K, as demonstrated by the lowering of , the appearance of intense thermally activated processes in the anelastic and dielectric spectra and the degradation of the XRD spectra.
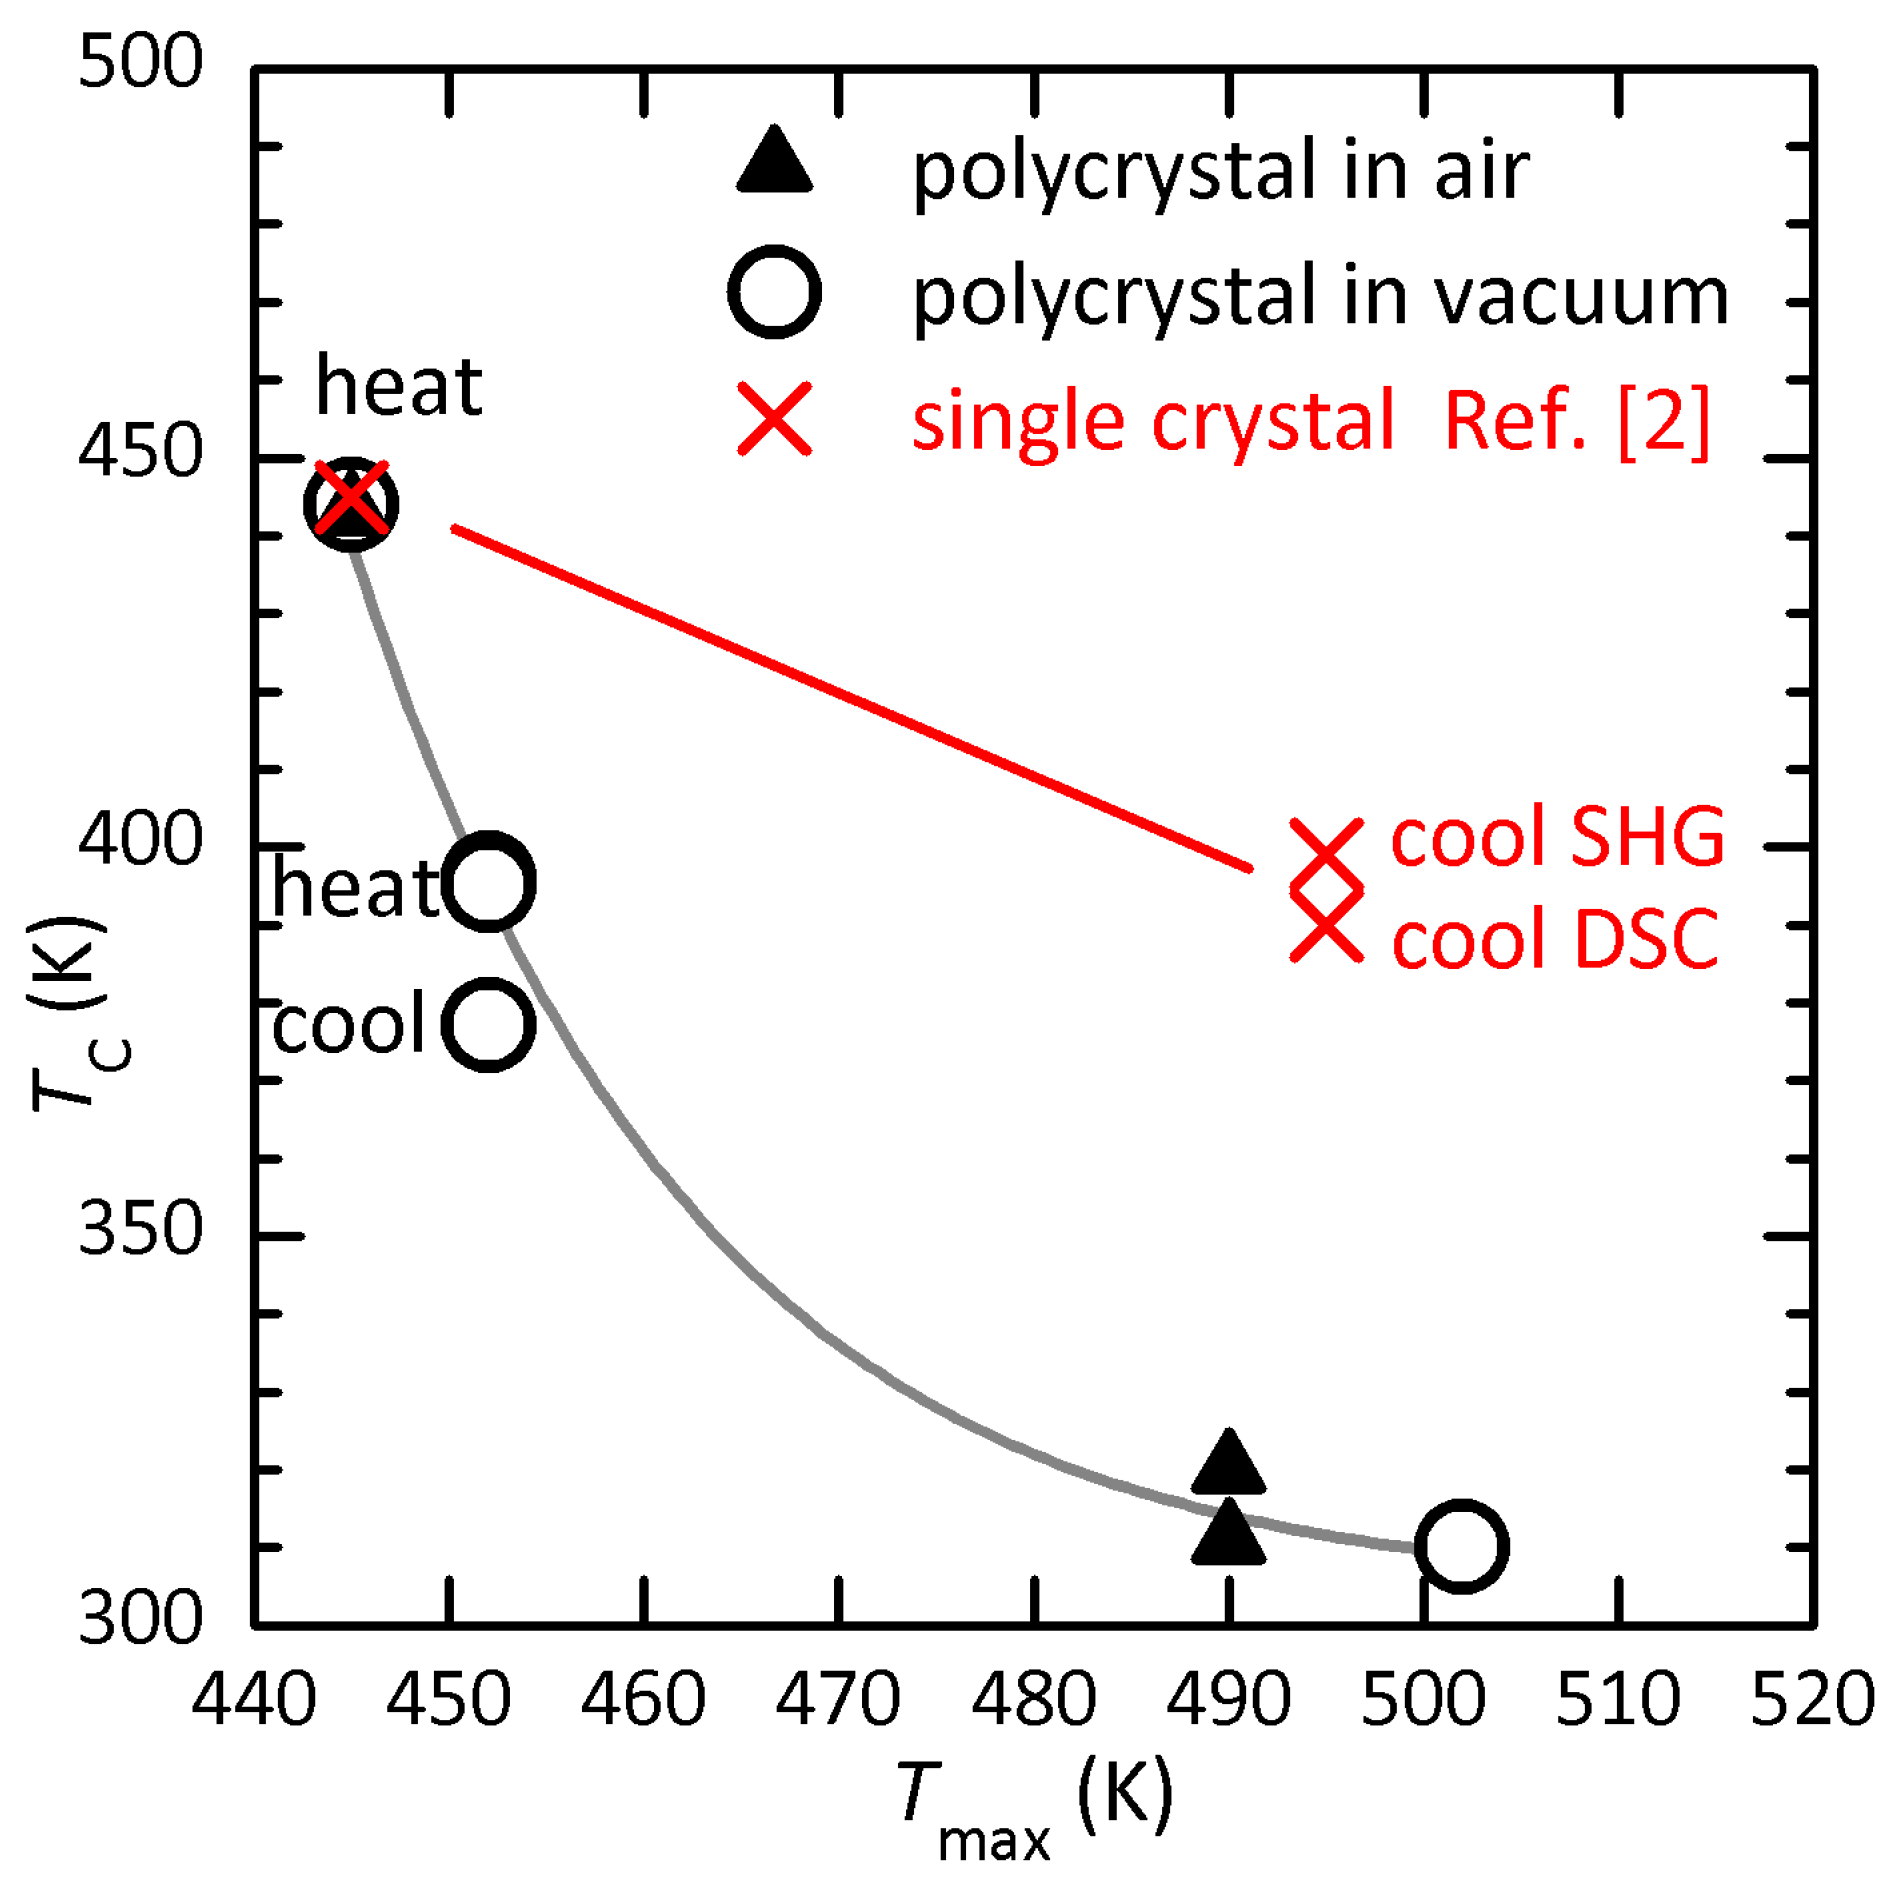
Figure 9 show the lowering of
as a function of
, the maximum temperature reached during the anelastic measurement in high vacuum or dielectric measurements in air. The points at the top correspond to the initial state and are obtained setting
. Both sets of data follow a same line, so that there is no visible effect of the atmosphere on the process of thermal degradation. Single crystals have a reduced exposed surface with respect to polycrystals and should follow a higher curve. In fact. the crosses are the reported
during heating and cooling of single crystals measured with DSC and SHG [
2], where
is set to the upper values of the abscissas in the respective figures (hence it might be higher). Considering that in our polycrystals the thermal hysteresis of reduced
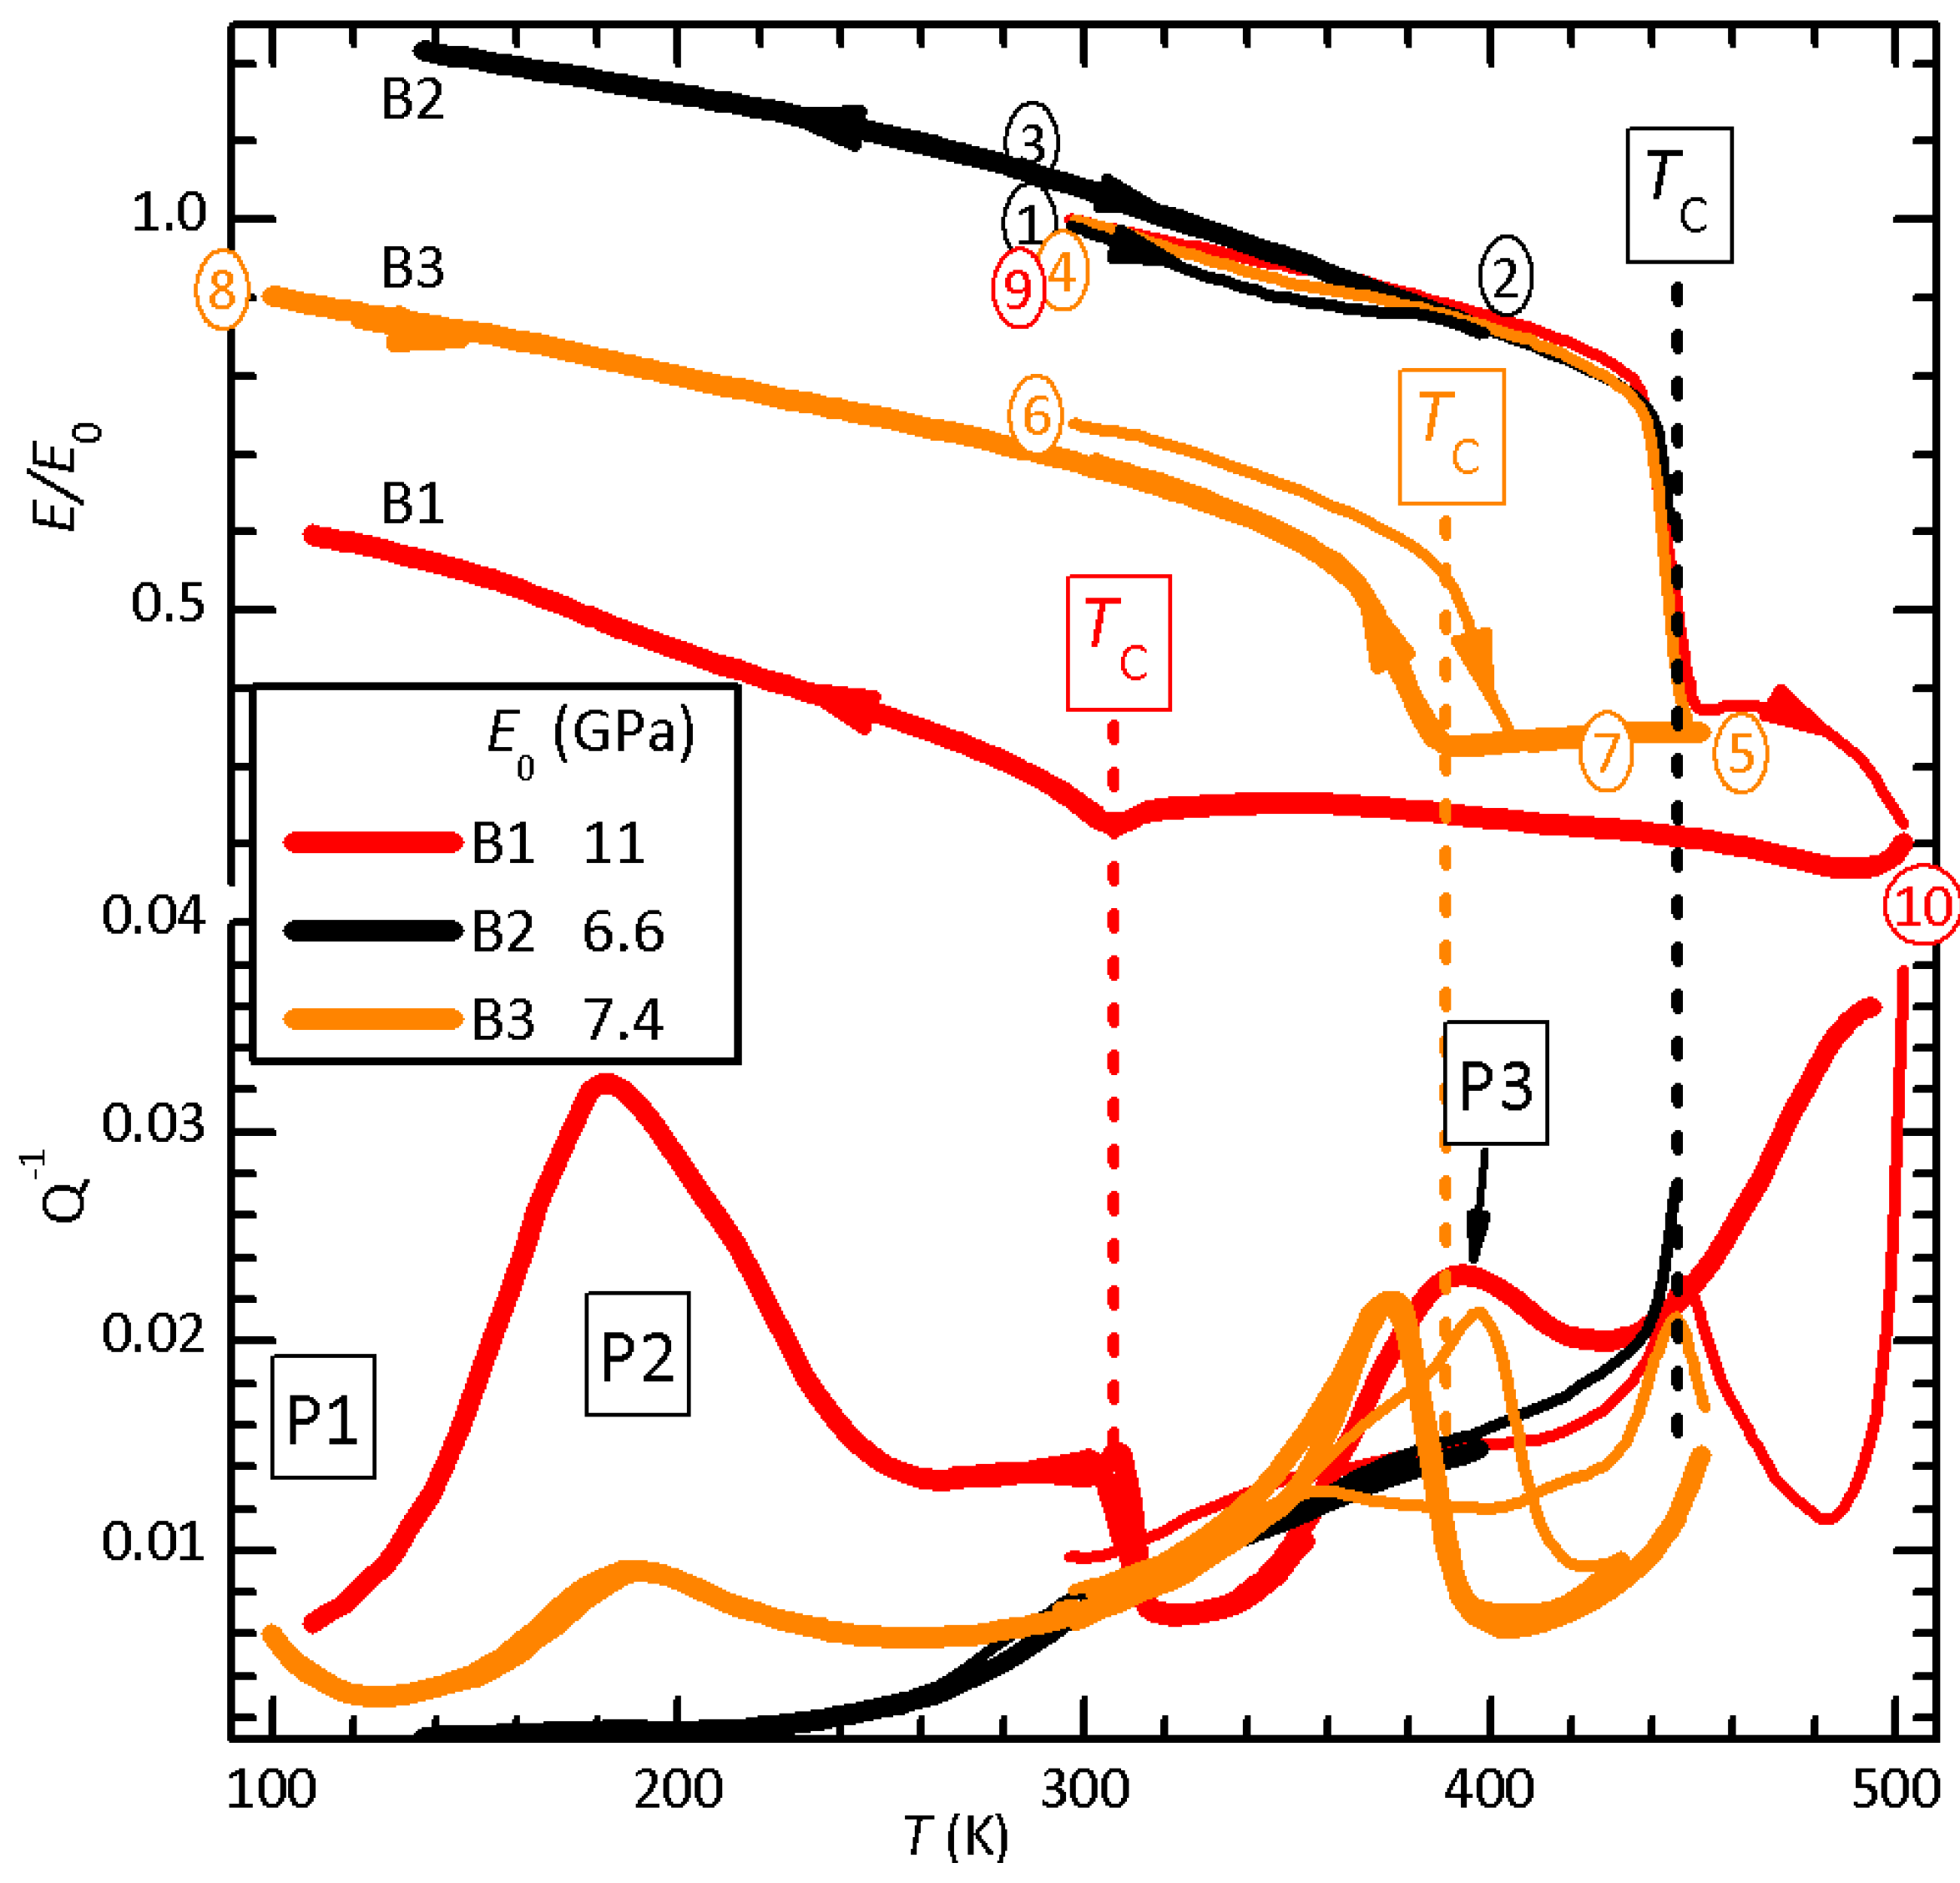
does not exceed 20 K (curves 5–8 of
Figure 1), it seems likely that the hysteresis of
K reported in the single crystals is rather due to the fact that during cooling the samples were degraded.
Figure 9.
Transition temperature after having reached in air or high vacuum..
Figure 9.
Transition temperature after having reached in air or high vacuum..
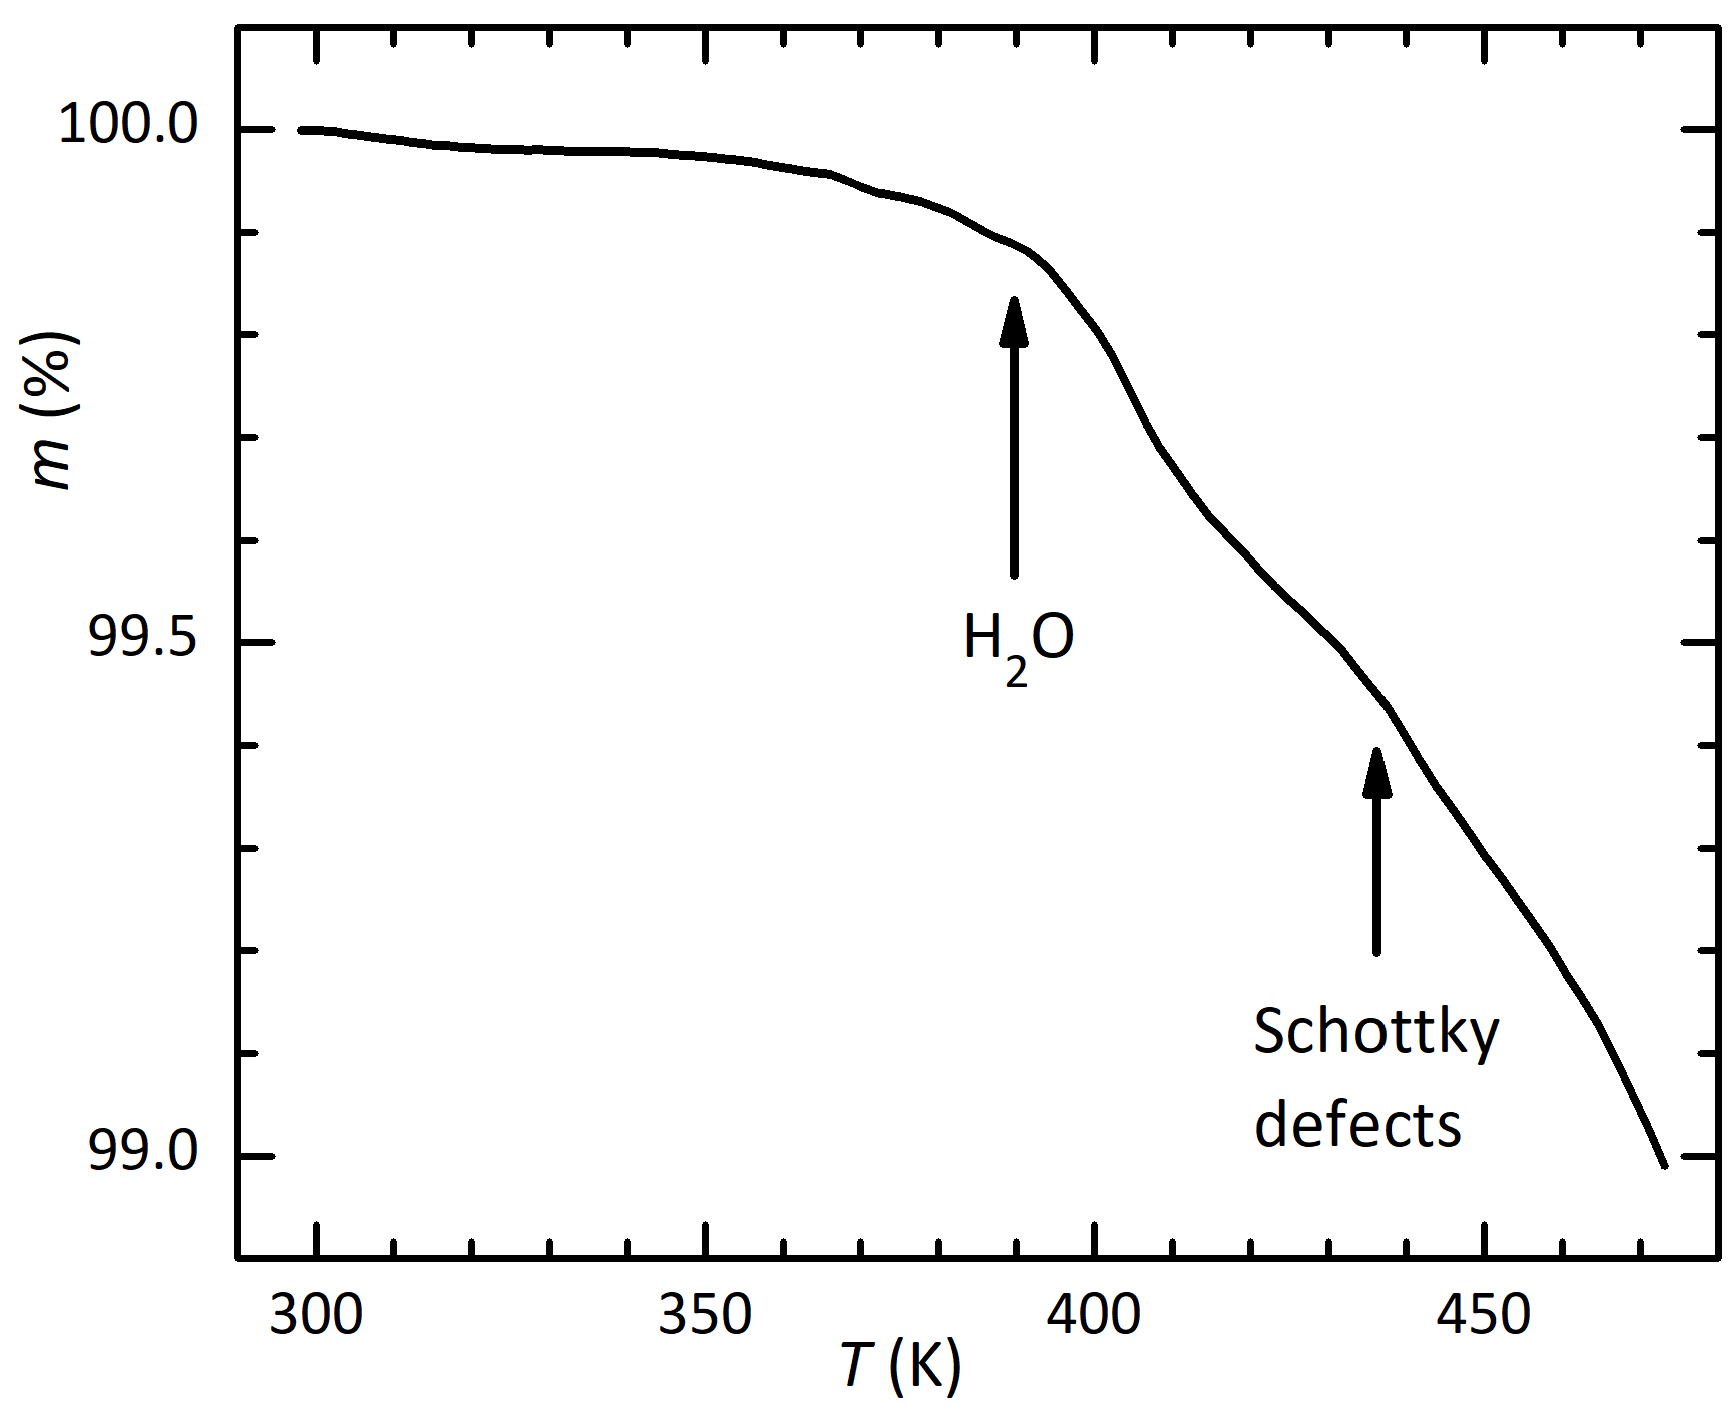
Further evidences of mass loss above 440 K in mbar are a marked rise of pressure above that temperature during continuous pumping, in the anelastic measurements, and a yellow/brown coloration of the quartz tube enclosing the sample holder. This is typical of the deposition of iodate compounds.
The major mechanism of degradation of perovskites at high temperature is the formation of Schottky defects, namely pairs or complexes of anion X and cation A or B vacancies in order to leave unchanged the neutral total charge according to the formal valence of the ions. These vacancies can then migrate into the bulk, with the combined effects of depressing the temperatures of the structural transitions, softening the lattice and producing anelastic and dielectric relaxation, if the vacancies or their complexes have electric or elastic dipoles. Both effects are very strong in the present measurements.
3.2. Elastic and dielectric anomalies at
The elastic anomaly in normal ferroelectrics is a steplike softening below
[
14] of piezoelectric origin [
15], opposite to what observed in the present case, where all three samples soften above
. The explanation of this behaviour comes from the fact that, even though the material is ferroelectric below
, the transition is mainly due to the loss of the free rotation of the molecular cation
. From this point of view, the step in the modulus is nothing other than the softening from the coupling between strain and the molecular rotation mode, which is frozen below
. The transition is then similar to the other order-disorder transitions of the molecular orientations in the metal-organic perovskites
-Zn(HCOO)
3[
16] and TMCM-MnCl
3 [
17,
18], also improper ferroelectric, and to the tetragonal-to-orthorhombic transitions in MAPb
[
19] and FAPb
[
20]. As discussed in those previous cases, part of the stiffening in the low-temperature phase can be due to the formation of stronger H bonds of the ordered molecules with the surrounding halide octahedra.
The above observations are corroborated by the fact that, when
is lowered, the dielectric anomaly becomes more evident (opposite with respect to the anelastic one, see
Figure 3,
Figure 5) but it is not a Curie-Weiss peak, whose slope at low temperature should be higher than at high temperature. This fact, together with the softening rather than stiffening when passing to the paraelectric phase, demonstrates that the transition is not Curie-Weiss with the polarization as order parameter, but it is driven by something else, and the appearance of the electric polarization is a side effect.
3.4. Point defects relaxations
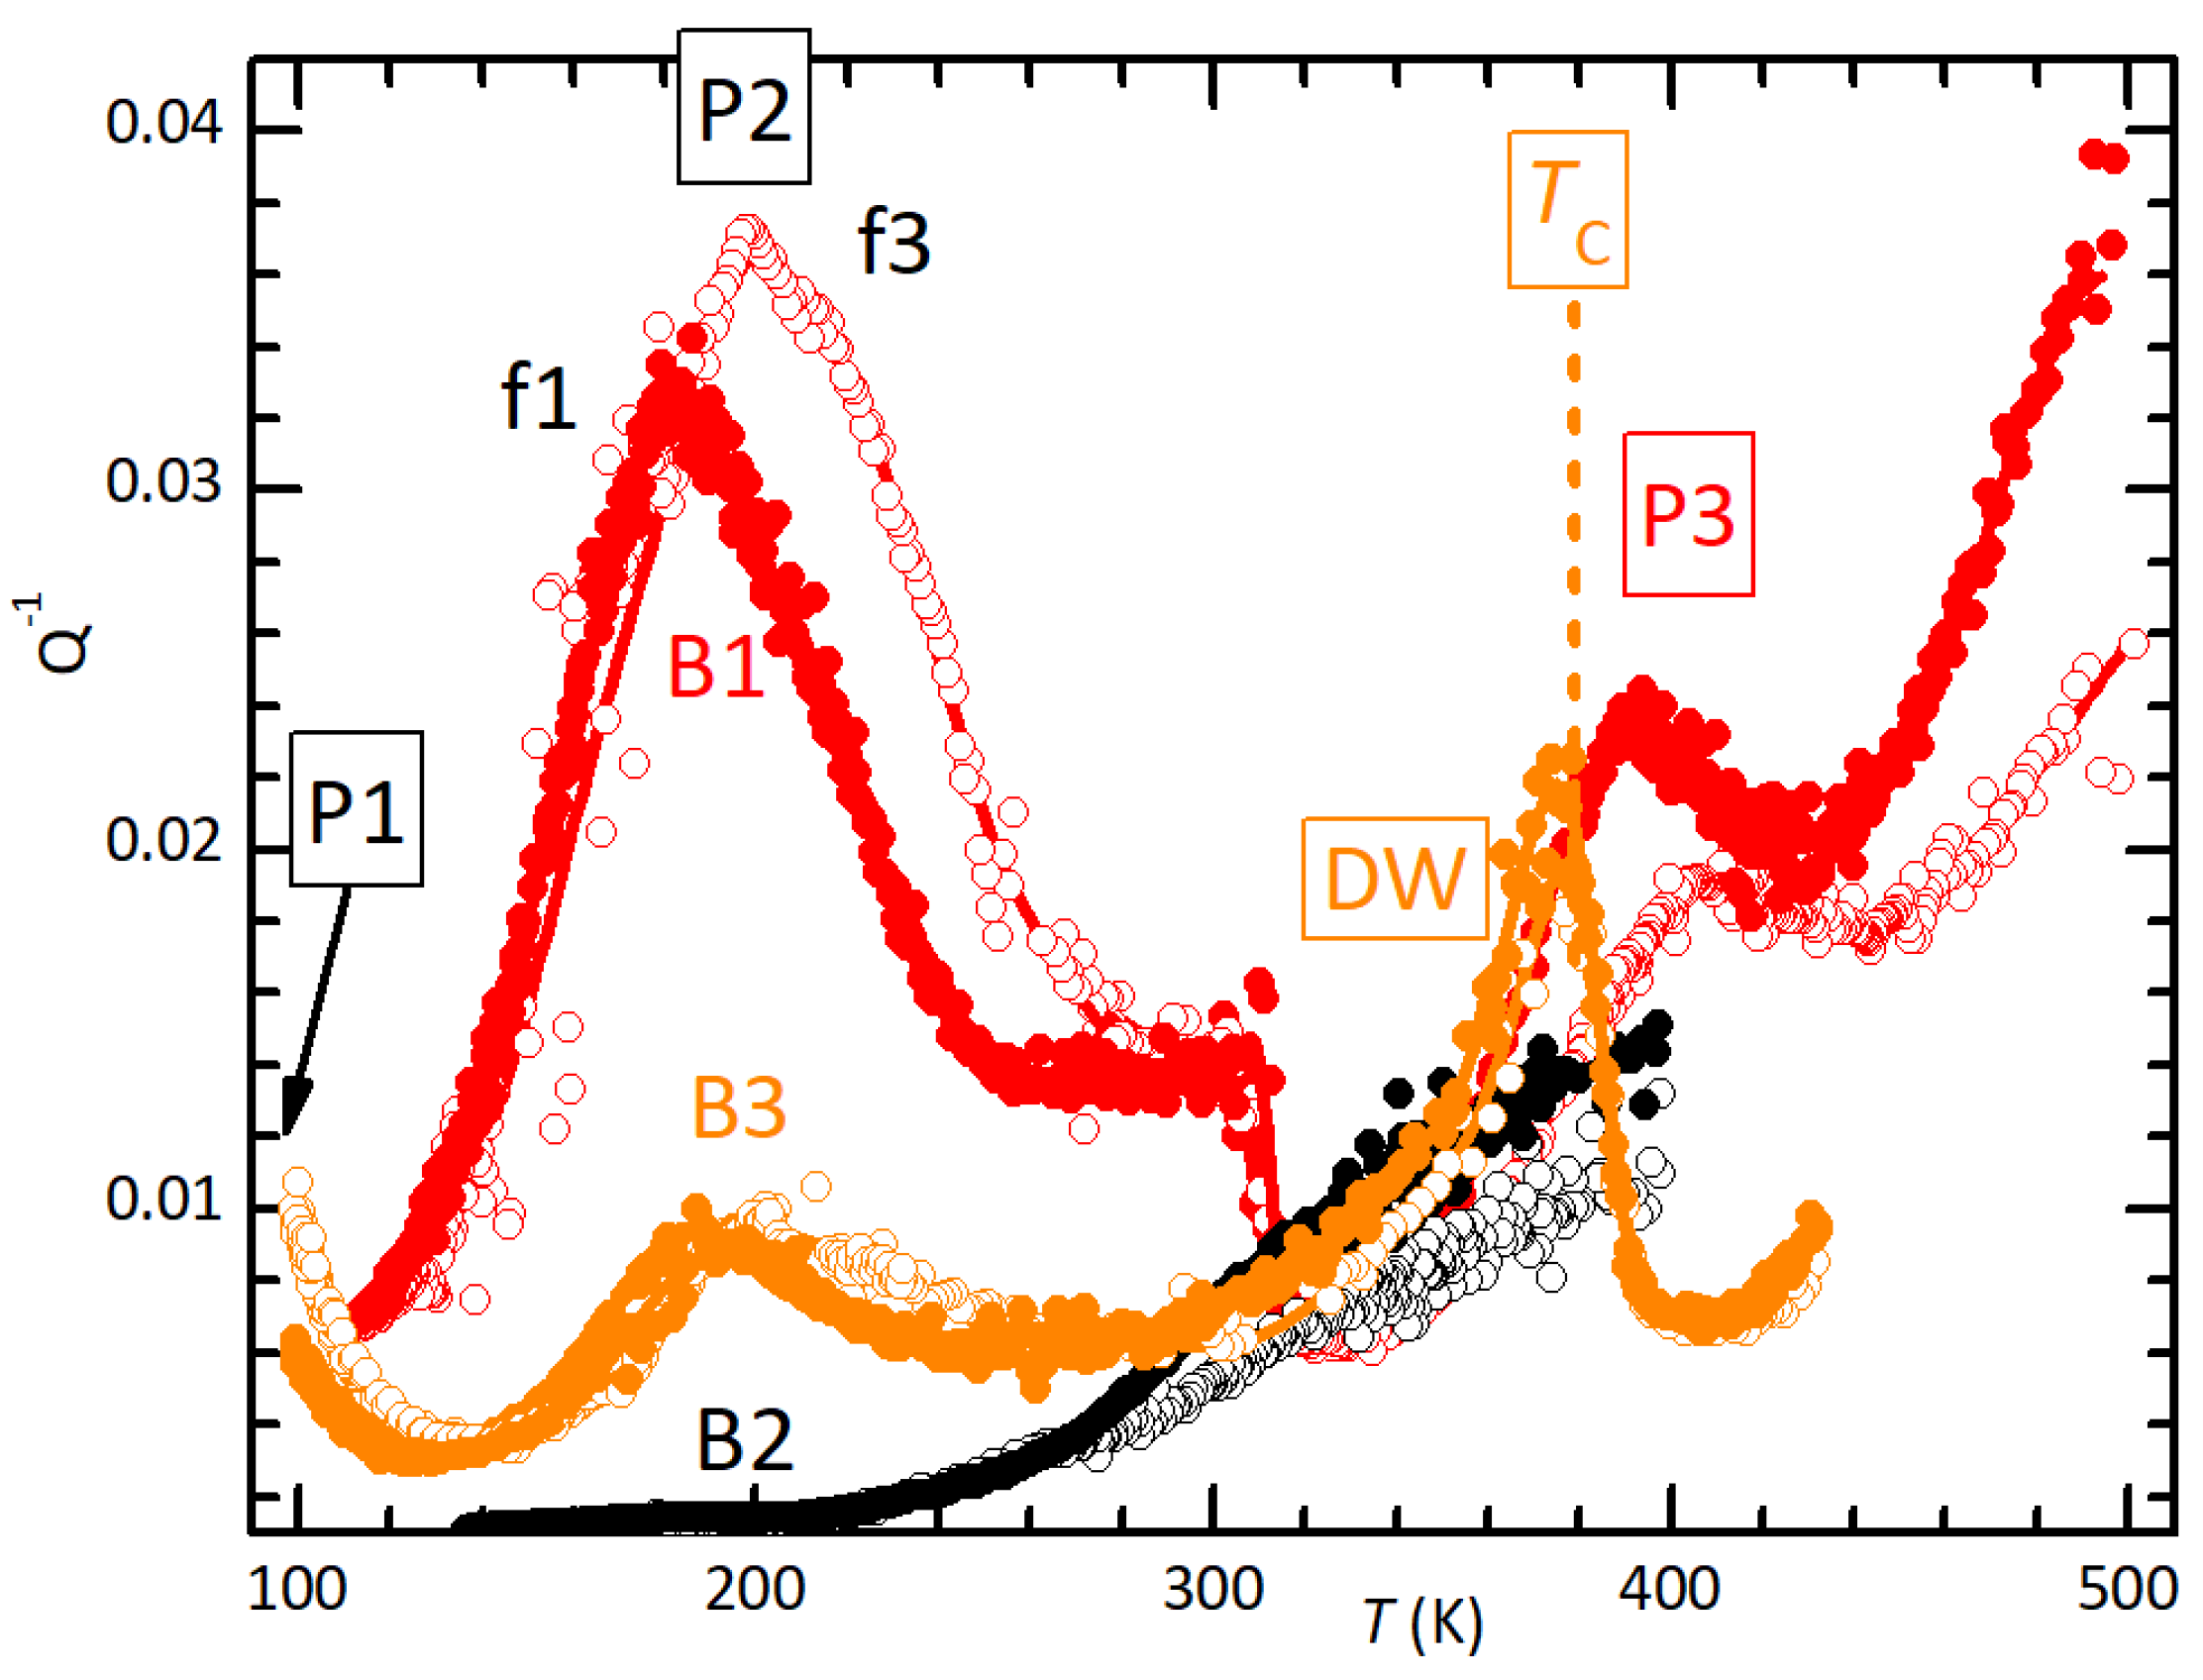
At least three thermally activated peaks, P1–P3, appear when is depressed by partial decomposition, and they must be due to newly created defects.
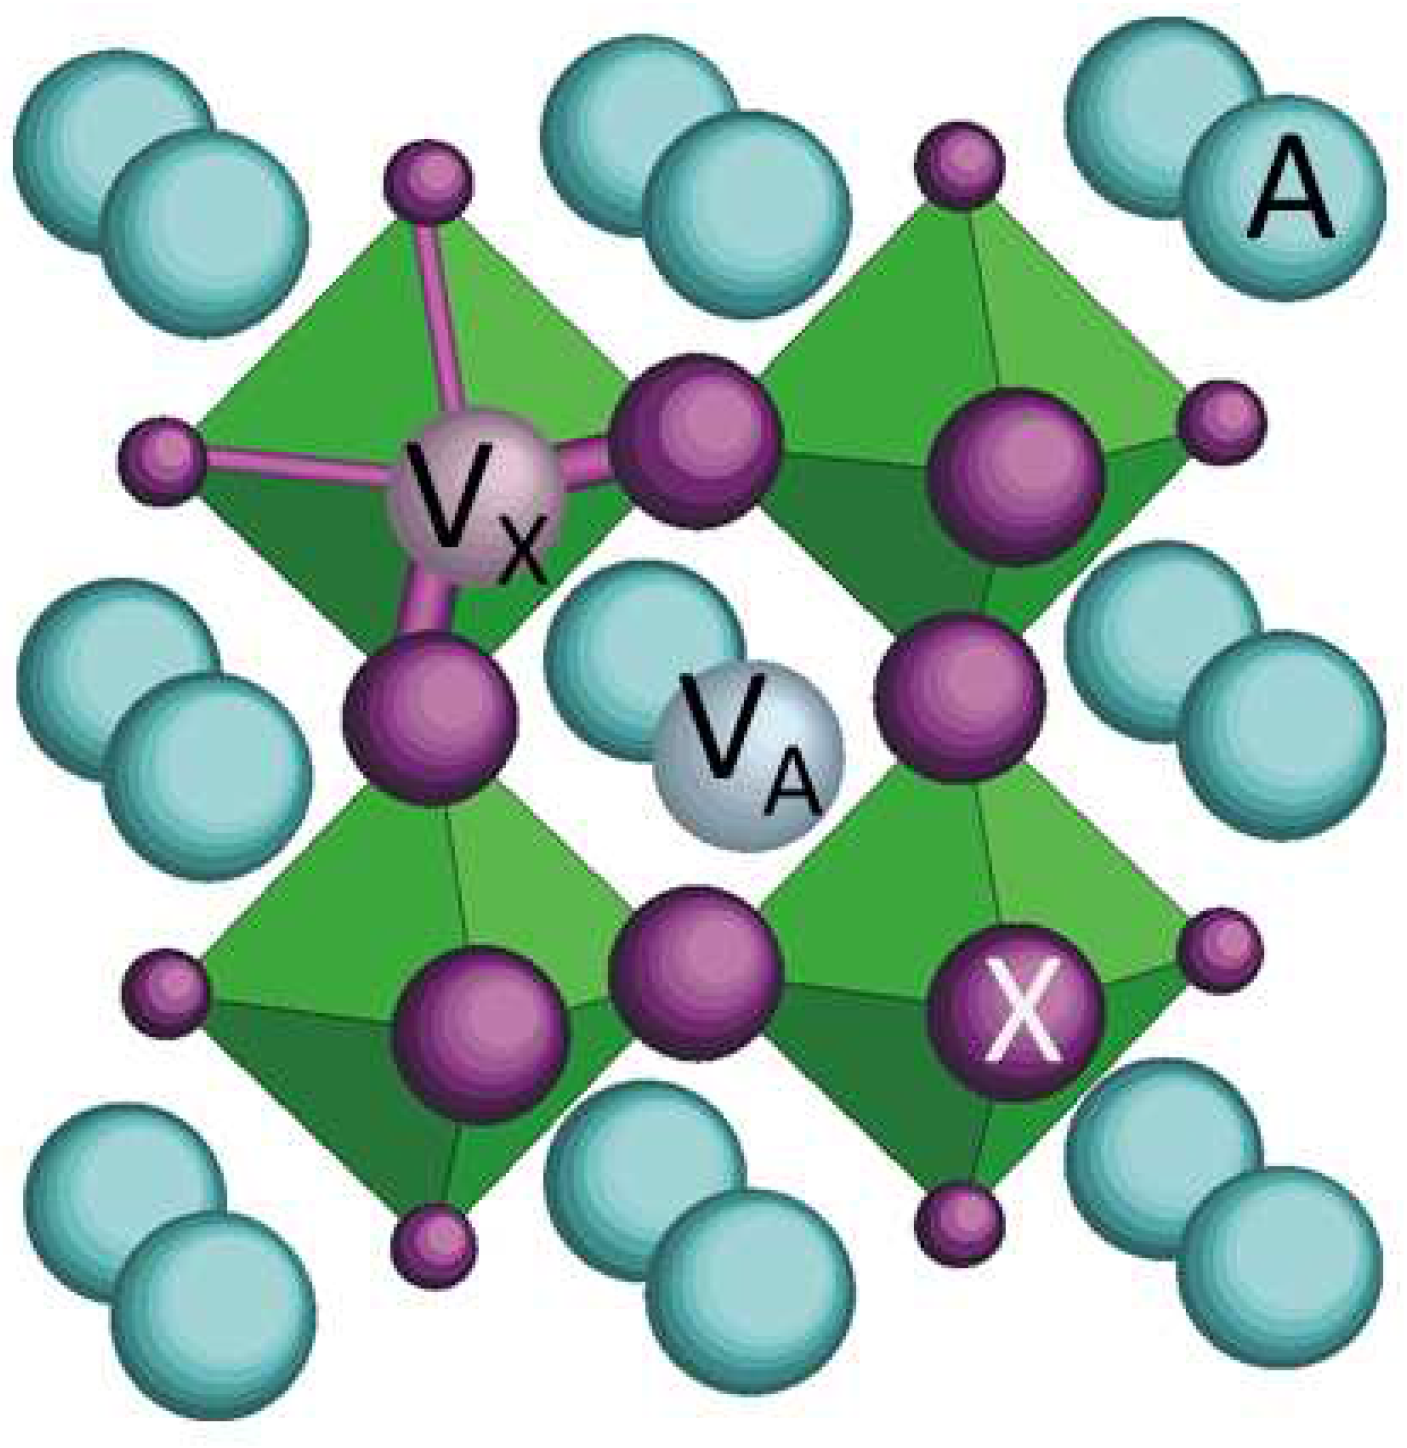
In defective perovskites
(
Figure 10) the most abundant and mobile defects causing anelastic relaxation are the X vacancies (
). When a
jumps to a nearest neighbour X position along an edge of a BX
6 octahedron, the direction of its two nearest neighbour B atoms, at the centres of the octahedra, rotates of
and therefore also the local anisotropic strain (elastic dipole) rotates. The elastic energies of these three types of elastic dipoles change upon application of a uniaxial stress and therefore induce changes of their average populations. This results in a relaxation of the macroscopic strain due the elastic dipoles with a kinetics determined by their mean hopping time; this is called anelastic relaxation [
24]. If a periodic stress with angular frequency
is applied, the continuous readjustment of these populations causes an additional retarded anelastic strain, and therefore an increment of the elastic compliance
given by
, where the relaxation time generally follows the Arrhenius law
with
s <
s for point defects, and the relaxation strength is
where
n is the defect population and
the change of elastic dipole after the jump/reorientation of the defect. Each process contributes to the losses as a Debye relaxation [
24,
25]
peaked at the temperature such that
. Notice that isolated
do not have an electric dipole and therefore do not cause dielectric relaxation, while pairs of cation and anion vacancies have both elastic and electric dipoles.
Even though peaks P1-P3 are considerably broader than Debye relaxations, they are clearly due to well defined defects with quite different activation barriers
E. It would be tempting to make parallels with the anelastic relaxation spectra of other defective perovskites, like O deficient SrTi
[
26] and partially decomposed (TMCM)MnCl
3 [
18], but the present situation is different. Oxide perovskites are quite stable compounds and may loose only O atoms at high temperature in reducing atmosphere. The charge compensation in SrTi
from the loss of O
2− anions can be achieved by the reduction of
Ti
4+ cations to Ti
3+. The resulting defects are
and small polarons and the anelastic spectra of SrTi
and BaTi
show peaks due to their hopping, with clearly distinct peaks for vacancies that are isolated and paired [
26,
27].
In these halide perovskites heated close to the decomposition temperature it is unlikely that only anion vacancies are formed, since the organic cation is volatile and the prevalent mechanism of decomposition is expected to be the formation of Schottky defects, namely neutral pairs or complexes of cation and anion vacancies. In (TMCM)MnCl
3 it was assumed that an equal concentration of TMCM
+ and Cl
− was formed [
18] for two reasons:
i) A = TMCM is organic and more volatile than inorganic B = Mn;
ii) vacancies on the B-site of perovskites are rare, though they may be created under particular circumstances [
28,
29,
30]. A reason for the tendency to loose A rather than B ions is that the BX
6 octahedra are clearly the stable backbone of the lattice, because the B-X bonds are shorter than the A–X ones and therefore stronger, especially when they involve larger charge (B
4+ and A
2+ or B
2+ and A
+). That the B–X bonds are much stronger than the A–X ones is demonstrated by the common tilting transitions of the octahedra upon cooling [
31]. In fact, during cooling, the weaker and more anharmonic A–X sublattice contracts more than the rigid network of BX
6 octahedra, and the octahedra, unable to compress, rigidly tilt [
32]. In the present case both the conditions of smaller volatility of B and stronger B–X bonds are impaired: not only both cations are organic, but B
2+ has larger charge than A
+. It is therefore possible that in (MDABCO)(
)
the loss through Schottky defects of
with one
is not negligible with respect to the loss of
with two
. Yet, only jumps of
are expected to occur over barriers
eV, small enough to cause anelastic relaxation below room temperature. In fact, the jumps of
and
are
times longer than the octahedron edge and must occur with the participation of another
or cation vacancy of the other type. As a consequence, vacancies
are far more mobile than
, and this is true not only in perovskite oxides but also in the metal-organic halide perovskites for photovoltaic applications [
33].
Peaks P1–P3 should therefore be attributed to different types of jumps of the vacancies among quasistatic vacancies and possibly vacancies . The major mobile defects that should be considered are that are: i) isolated, ii) paired with and iii) paired with ; iv) form neutral complexes. Pairs of , as in perovskite oxides, are unlikely to form in presence of cation vacancies, that provide stronger binding energies of electrostatic nature.
We are not aware of studies of the mobility of in presence of cation vacancies in perovskites, but we assume that the jumps within the sites nearest neighbour to the cation vacancies are faster than those in the unperturbed lattice, because the missing cation certainly lowers the hopping barrier. It is less obvious to establish which cation vacancy provides the easiest environment for hopping, whether the octahedron centred on or the cuboctahedron centred on . We assume that lowers more than the hopping barrier for , because of the shorter B–X bond. The influence of should therefore be more sensible than .
Based on the above considerations, as a first guess we assume that P1 is due to jumps of around , or equivalently to the reorientation of – pairs, and P2 to – pairs. The possible –– complex, presumably with on opposite sides of , requires a two-step reorientation, and the stronger lattice relaxation around an in-line –– complex suggests a higher barrier, due the unfavourable intermediate state.
Finally, one should consider the plethora of jumps between non-equivalent sites,
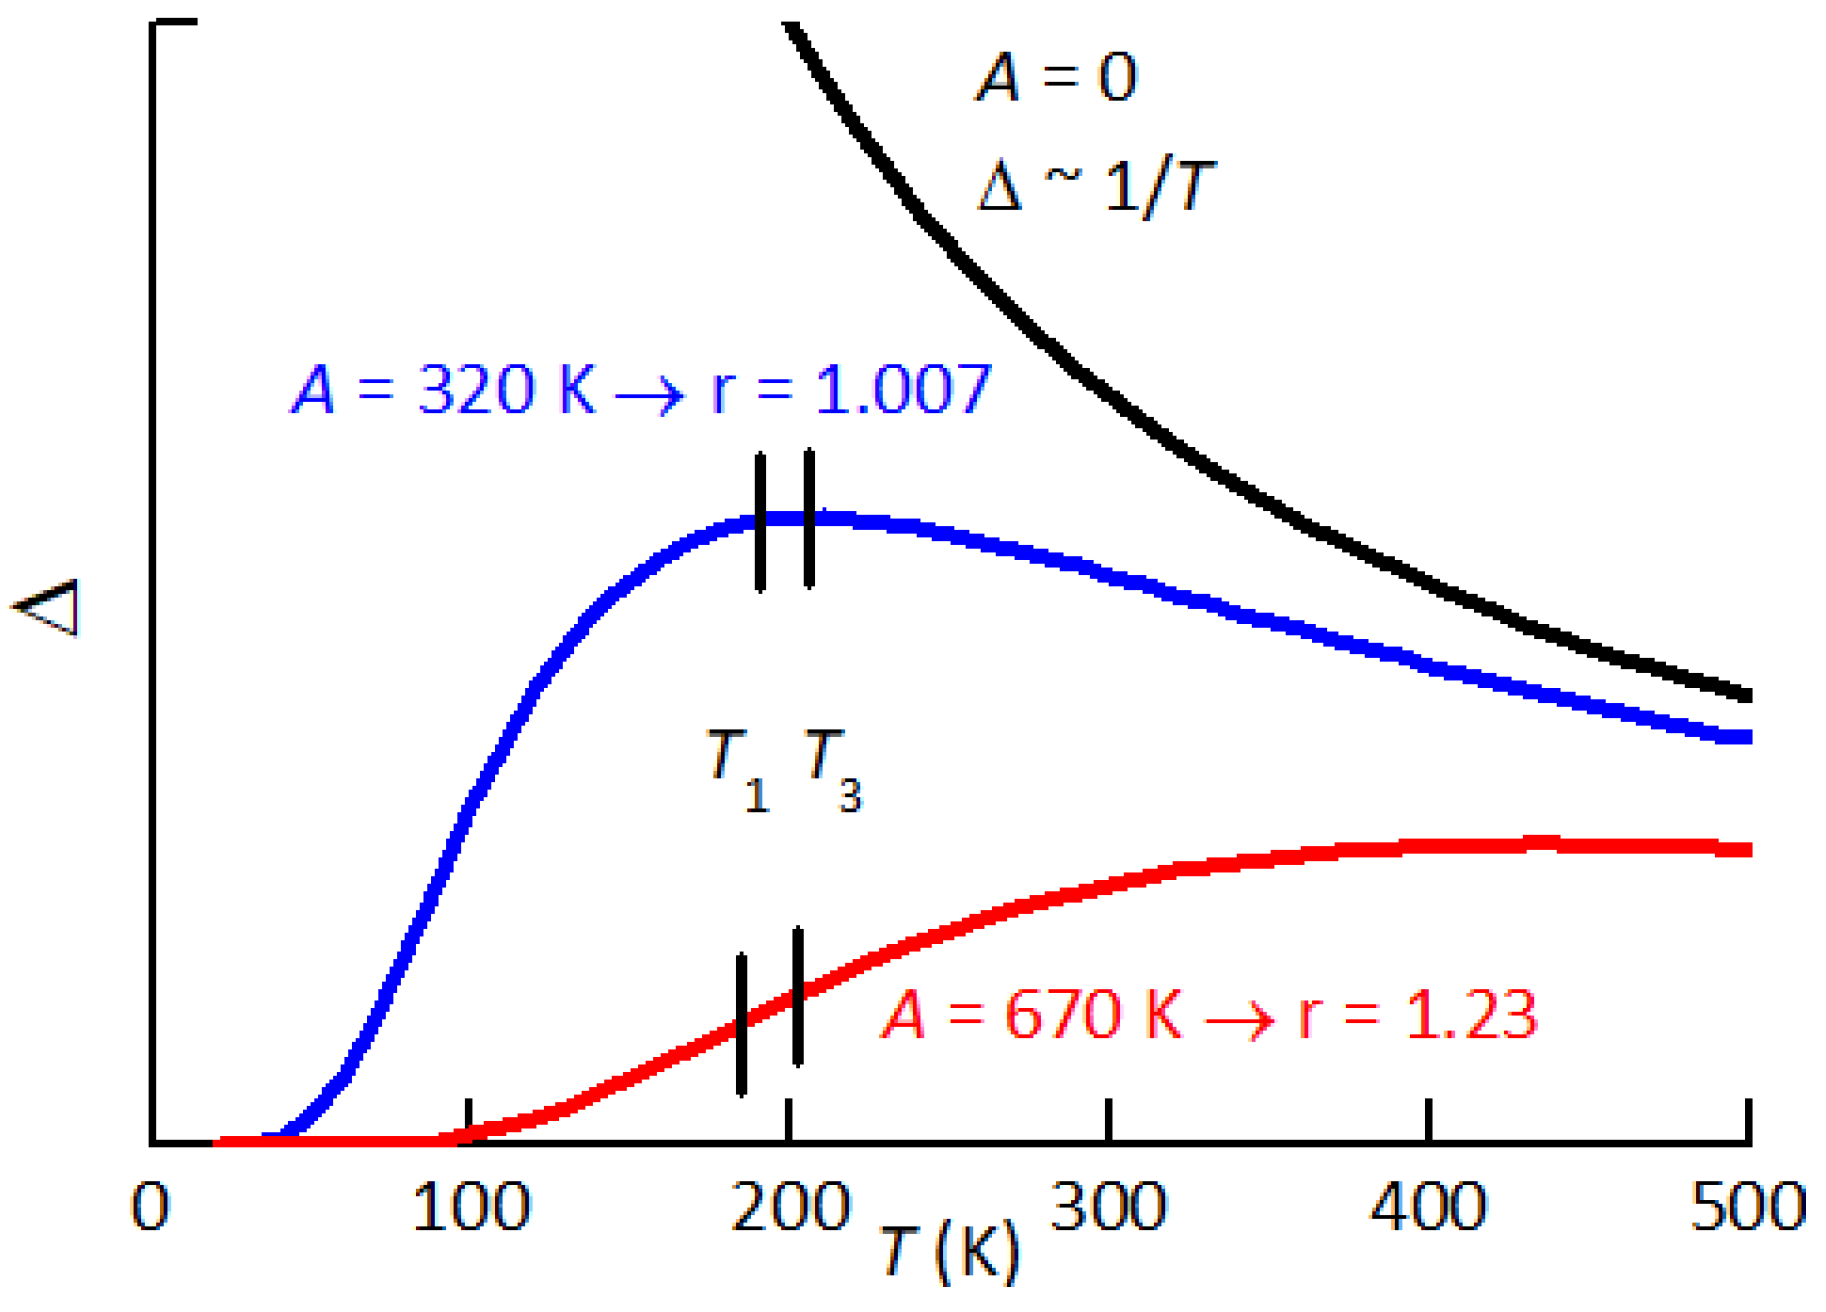
e.g. between 1st and 2nd neighbours to a cation vacancy. These jumps would contribute both to the broadening of the major relaxation peaks and to the background. In fat, if one considers the relaxation between states differing in energy of
A, then the relaxation strength is reduced by the factor [
34]
which below
transforms the
divergence of
into an exponential decrease to 0 (
Figure 11).
Therefore, jumps between strongly inequivalent positions, like those for forming and separating a defect pair, produce relaxation processes distinct from those cited above, and with a much depressed intensity. This type of relaxation between inequivalent states is hardly distinguishable in SrTi
with
, where a small but distinct peak can be attributed to the partial dissociation of pairs of
[
26].
We should also take into account the temperature dependence of the relaxation strengths Eq. (
2), which are proportional to
, where
n is the relative concentration of the defect. This fact should help distinguishing the population of isolated vacancies from those of the defect complexes, since the first rises with temperature while the others decrease, due to the thermal dissociation.
The considerable width of the peaks with respect to single Debye relaxations is justified by the presumably high concentration of defects and by the softness of the lattice, that result in large local deviations of the bond lengths and angles from the ideal lattice.
3.5. Two possible scenarios for P2
The attention will be focused on peak P2, because it is clearly observable in both samples annealed at high temperature and is stable, while peak P3 is observable only at the highest content of defects and is not stable; of P1 only the high-temperature tail could be seen. A feature of P2 is the change of the temperature dependence of its intensity when passing from low- to high-defect concentration. The peak is maximum at
and
when measured at the low and high frequencies
and
. If we define the ratio of the intensities at these temperature
then at low defect content (sample B3) it is
, while at high content of defects (sample B1) it is
. The rise of
r at rising defect concentration is large and can be explained by two concomitant mechanisms:
i) increase of the lattice disorder and therefore of the average asymmetry
A in Eq. (
4);
ii) increase with temperature of the population of the defects producing P2. We will discuss the two possibilities separately, although they can be concomitant, in the hypothesis that P2 is due to the reorientation of
–
pairs and possibly also
–
–
complexes.
We first assume that the population of such defects depends little on temperature in the range where P2 is observed and therefore only a change of
A in Eq. (
4) occurs.
Figure 11 shows how the
dependence of the relaxation strength
is depressed by increasing the average asymmetry
A between relaxing states. The two values
and 670 K are those of the fits of P2 at low and high defect concentrations, yielding
and 1.23 respectively. The fits are obtained with the expressions
which are a generalization of Eq. (
3) to include asymmetric broadening with
and energy asymmetry
A. The factor in the expression of the relaxation time is due to the fact that
between states 1, 2 with energies
separated by a barrier
. In this formula the energies are expressed in kelvin, actually being
and
, because in this manner their influence on the fitting curves is more transparent.
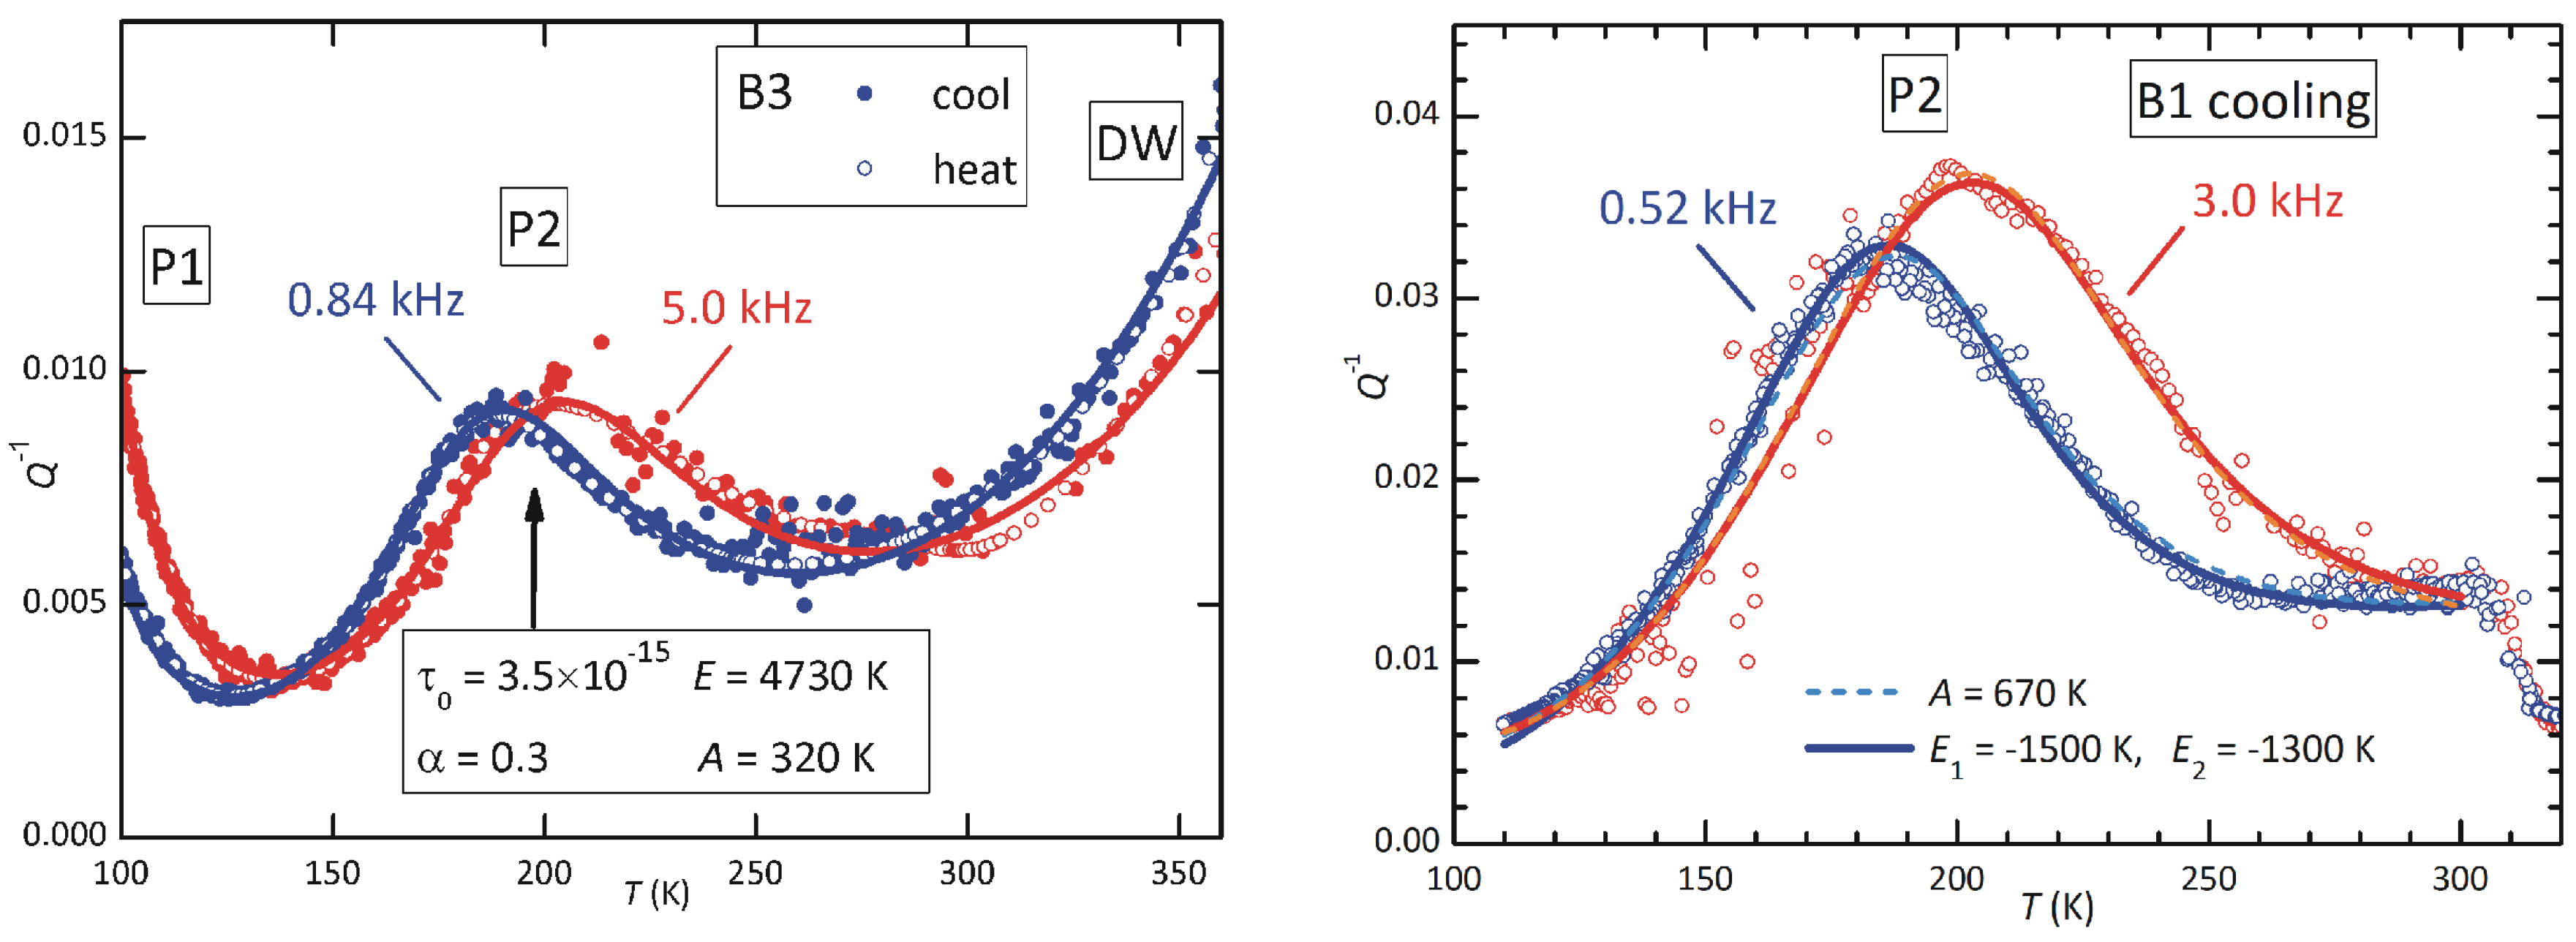
The fit of sample B3 includes the two adjacent peaks, P1 and that attributed to domain wall relaxation, plus a linear background. The parameters of interest of P2 are in the first column of Table 1:
Table 1.
Parameters used in the fits of
Figure 12.
Table 1.
Parameters used in the fits of
Figure 12.
| sample: |
B3 |
B1 |
B1 |
|
A (K) |
320 |
670 |
0 |
|
(K) |
– |
– |
1500 |
|
(K) |
– |
– |
1300 |
|
(s) |
|
|
|
|
E (K) |
4730 |
4500 |
3600 |
|
0.3 |
0.1 |
0.15 |
|
0.3 |
0.6 |
0.6 |
The relaxation time extrapolated to infinite temperature, , is typical of point defects, and the activation energy 4730 K corresponds to 0.41 eV. This would be the barrier for the local motion of an iodine vacancy around a MDABCO vacancy. The effective activation energy for the long range diffusion of I would be larger, because it would include the higher barrier for escaping from and, as discussed above, the activation energy for hopping in the unperturbed lattice might be higher than around a cation vacancy. The peak is much broader than a single time relaxation, since are definitely , and this justifies an average asymmetry A that is 6–7% of the activation energy.
The parameters of peak P1 cannot be reliably determined, but we mention that its relaxation time has s and eV. This values are again typical of point defects, but it is unlikely that an iodine vacancy can diffuse so fast in the unperturbed lattice, and we suggest that this is the barrier for hopping around a vacancy. In addition, at such low temperature all the are trapped, as will be shown later.
The right panel of
Figure 12 shows a similar fit of P2 at high content of defects (sample B1). The parameters corresponding to the continuous lines are in the second column of Table I: the average site energy disorder,
A, is doubled, which is reasonable, and the peak shape is much more asymmetric, with very different broadening parameters
and
. With such broad shape, there is not much sensitivity to changes of the pair of parameters
and
E, and it is possible to fit with
s
s accordingly varying
E within 3800 K – 4800 K. A similar remark holds for the previous fit.
While this pair of fits is compatible with the hypothesis that P2 is due to the hopping of around , the presence of various types of defects, confirmed by the presence of peak P1, calls for an analysis of the defect populations as a function of temperature.
3.6. Calculation of the populations of defects
In order to calculate the populations of the various types of defects, based on their respective energies and geometries, we will adapt the calculation of the mean occupation numbers
from the grand partition function [
35]
where, for each site
i with energy
, 1 is the statistical weight for being unoccupied and the second term for being occupied;
and
is the chemical potential, or Fermi energy in this case. The mean occupation numbers with a total of
M occupied states are calculated as
By grouping different types of sites and assigning different site energies, it is possible to obtain the occupations
of coexisting defects configurations and calculating them by numerically solving the above implicit equation for
[
34,
36].
In the present case
represents a
vacancy in site X
i and
a regular X
i site. For simplicity, let us consider the case that only
Schottky defects are formed. Then, there are
iodine vacancies
and
MDABCO vacancies
per mole. The
are assumed to be static and isolated, so that each of them has
X nearest neighbour (nn) sites. In
Z we can group together the
normal sites with energy
0 and those nn to a same
with binding energy
0 so that, for
N unit cells,
At this point it is possible to introduce arbitrary conditions on the type of
–
complexes, by expanding and manipulating the sub-partition function
of each set of
m sites nn to a
. From the polynomial expansion of
we retain only the terms with up to two
setting
as the energy of a
–
complex and
as that of a
–
–
complex. In addition, we suppose that the latter can only have
on opposite sides of
, so that there are only
such configurations. In this manner, Eq. (
8) becomes
with
where, setting
we recognize the occupation numbers of isolated
and
–
and
–
–
complexes as
The chemical potential in
y is determined by the condition
This is a 3rd degree polynomial equation in
which is best solved numerically. Notice that, without the
–
–
complexes (
), the equation is of 2nd degree and
and
have a simple closed form. The inclusion of additional defects, for example
–
pairs, can be done easily in the same manner, but, with only two measurements of P2, it is not worth introducing new parameters. It is also not worth including the numerical solution of Eq. (
10) in the non-linear fitting procedure of the anelastic spectra, and therefore we simply identify a combination of binding energies
and
and reasonable values of
, that roughly reproduce the observed temperature dependences of P2.
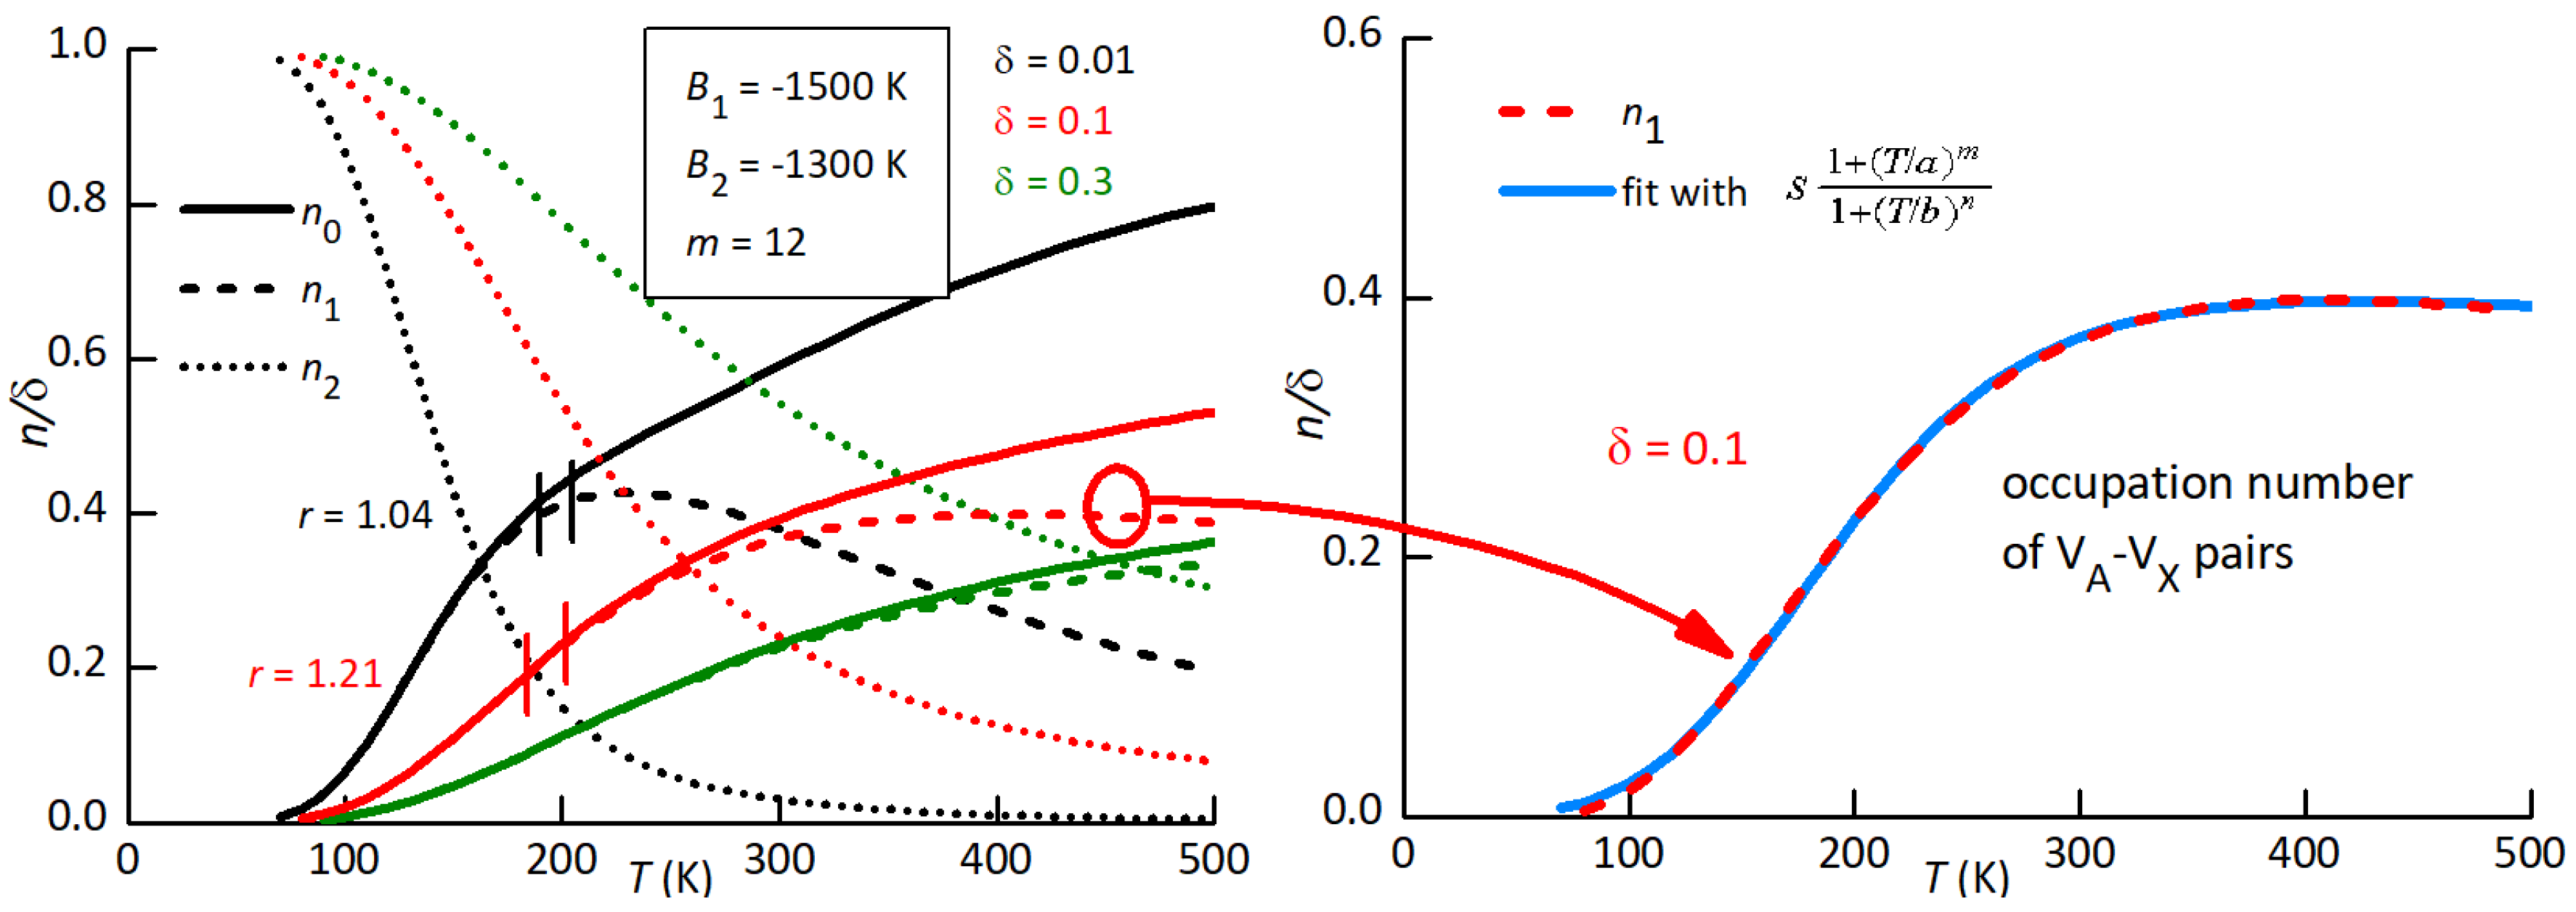
Figure 13 shows the occupation numbers calculated with
K,
K at three defect concentrations
. In the low-
T limit all
are trapped and therefore
, but above 100 K they start to detrap, each time forming a
–
pair and an isolated
, so that
Finally, at
there is equal probability of occupying all sites, and the populations depend only on total number of trap and free sites. In the intermediate region,
has a maximum, that shifts to higher
T with increasing
, and can therefore account for the behaviour of P2. In fact, passing from
to 0.1 the ratio
r of the intensities of P2, Eq. (
5), passes from 1.04 to 1.21, compatible with
Figure 12.
Therefore, we fitted again P2 at high defect concentration using Eq. (
3) with
and
. In practice, we fitted the intermediate
curve in
Figure 13 with a rational expression (blue line in the right panel of
Figure 13), that we introduced in the final fitting expression for
The dashed lines in
Figure 12 are obtained in this manner with the following parameters:
s,
3610 K (0.31 eV),
,
, and the resulting fit practically coincides with the previous one with constant
and
. This suggests that it is possible to equally well fit peak P2 assuming intermediate situations with slightly different values of the binding energies to the cation vacancies and
.
We have therefore shown that peak P2 can be explained in terms of reorientation of – pairs, corresponding to the local hopping of an iodine vacancy around a MDABCO vacancy, with an activation energy eV. The change in the temperature dependence of the P2 intensity, passing from low to high defect concentrations, can be explained both in terms of increasing lattice disorder (site energy asymmetry A) and with the presence of at least another type of trapping (–– complexes), that compete with the – pairs. The introduction of – pairs, possibly giving rise to peak P1, could only improve the description of the anelastic spectra, but the present data, at only two defects concentrations and limited in the low temperature range, do not justify fittings with so many parameters.
