1. Introduction
The pore structure within rock masses encompasses heterogeneous elements such as voids, pores, and cracks [
1]. Numerous studies have revealed that the presence of pores in rocks triggers stress redistribution in their proximity, which may induce brittle fractures at the pores and augment the permeability of the surrounding rock [
2,
3]. Therefore, it becomes imperative to investigate the initiation and progression of stress-induced microcracks in rocks. Rocks serve as a natural building material in various aspects of our lives, from structures founded on rock bases to concrete gravity dams, tunnels, and more [
4]. These rock masses exhibit a porous matrix with embedded discontinuities, including bedding planes, faults, joints, and artificial cracks [
5]. Among these discontinuities, cracks are the most prevalent form of defect, with a variety of applications spanning blasting, rock permafrost [
6], hydraulic fracturing [
5], and slope stability analysis. The uncontrolled proliferation of cracks within rock formations can result in structural damage, culminating in landslides, tunnel collapses, etc. Predicting crack growth has always constituted a paramount research challenge. A comprehensive understanding of the behavior of cracked materials is pivotal for evaluating their overall reliability.
Numerous experiments and numerical simulations have been deployed to scrutinize the intricate behavior of rocks containing defects, encompassing aspects such as crack initiation, propagation, interconnection, and linkage. Wu et al. [
7] harnessed the numerical manifold method to analyze the initiation and propagation of frictional cracks in rock. Haeri et al. [
8] combined the XFEM method with experiments to study the failure mechanism of non-persistent joints in mortar subjected to compression. Zhang et al. [
9] proposed a thermo-hydro-mechanical coupling peridynamic (PD) model to simulate the deformation and failure of rock materials and the diffusion of the flow and temperature within the context of multi-physical fields. Mu et al. [
10] leveraged an improved smoothed particle hydrodynamics method (ISPH) to simulate the fracture process of rock samples already bearing flaws under uniaxial compression. Cen et al. [
11] employed a combination of experimental observations and numerical simulations to investigate the mechanisms governing the crack extension in both single- and double-cracked rocks under tensile and shear stress conditions. Wang et al. [
12] introduced an extended peridynamic model equipped with a novel bond-breakage criterion to simulate mixed-mode fractures in rock-like materials. In a different perspective, Mohtarami et al. [
13] harnessed the extended finite element method to explore the chemical effects on rock fracturing.
Recently, the phase-field model (PFM) [
14,
15,
16] has emerged as a highly promising tool for fracture mechanics calculations. What sets it apart from other models is its capacity to determine crack initiation, propagation, branching, merging, and other processes without the need for ad hoc failure criteria [
17]. Duan et al. [
18] employed a dynamic phase field model to anticipate the rock fracture diversity under impact loading. Liu et al. [
19] introduced a thermodynamically consistent phase-field model to simulate mixed-mode fractures in rock-like materials. Li et al. [
20] applied a hybrid phase-field method for modeling to investigate mixed-mode fractures in elastoplastic rock-like materials. Meanwhile, Xu et al. [
21] developed a new phase-field model, derived from triple shear energy criterion, to address mixed-mode brittle fractures in rocks. Moreover, PFM found extensive utility in a range of fracture scenarios, encompassing cohesive fracture [
22,
23,
24], ductile fracture [
25], brittle fracture [
26,
27,
28], dynamic fracture [
29,
30], multi-physics fracture [
31,
32], and hyperelastic fracture [
33,
34,
35].
Wong et al. [
36,
37] demonstrated that the crack growth path is significantly influenced by rock discontinuities and the porous rock structure. However, the influence of rock defect characteristics such as shape, size, distance, and relative position on crack propagation remains understudied. When cracks propagate within porous rocks, the way in which the surrounding pores control the crack path is controlled by the surrounding pores remains a complex and uncharted territory. Questions arise regarding which pores the crack tends to deflect towards and which specific pore’s deflection exerts a critical influence amid the multitude of pores. To delve into the effect of these features on crack extension in rock, the phase-field regularization cohesion model (PF-CZM) was employed to model and analyze the crack path propagation. Our study focuses on the influence of three key parameters on crack extension: pore radius (r), initial crack-pore distance (D), and pore-crack angle (θ), which exist independently or in conjunction. By investigating these fundamental parameters, we gain deeper insights into crack propagation in porous media.
The structure of this paper is as follows:
Section 2 introduces the unified phase-field regularized cohesion model (PF-CZM) for rock fracture. In
Section 3, we present experimental results of SCB disk and porous granite to verify the capability of the PF-CZM in simulating the rock crack propagation accurately. In
Section 4, we study the effects of pore-crack relative locations, including parameters like D, r, and θ on the crack growth path. In
Section 4.3, the effects of pore-crack relative location parameters are investigated simultaneously in one model with two pores. Finally, we conclude this paper in
Section 5.
2. Materials and Methods
In this section, we provide a concise overview of the phase field theory of damage and fracture [
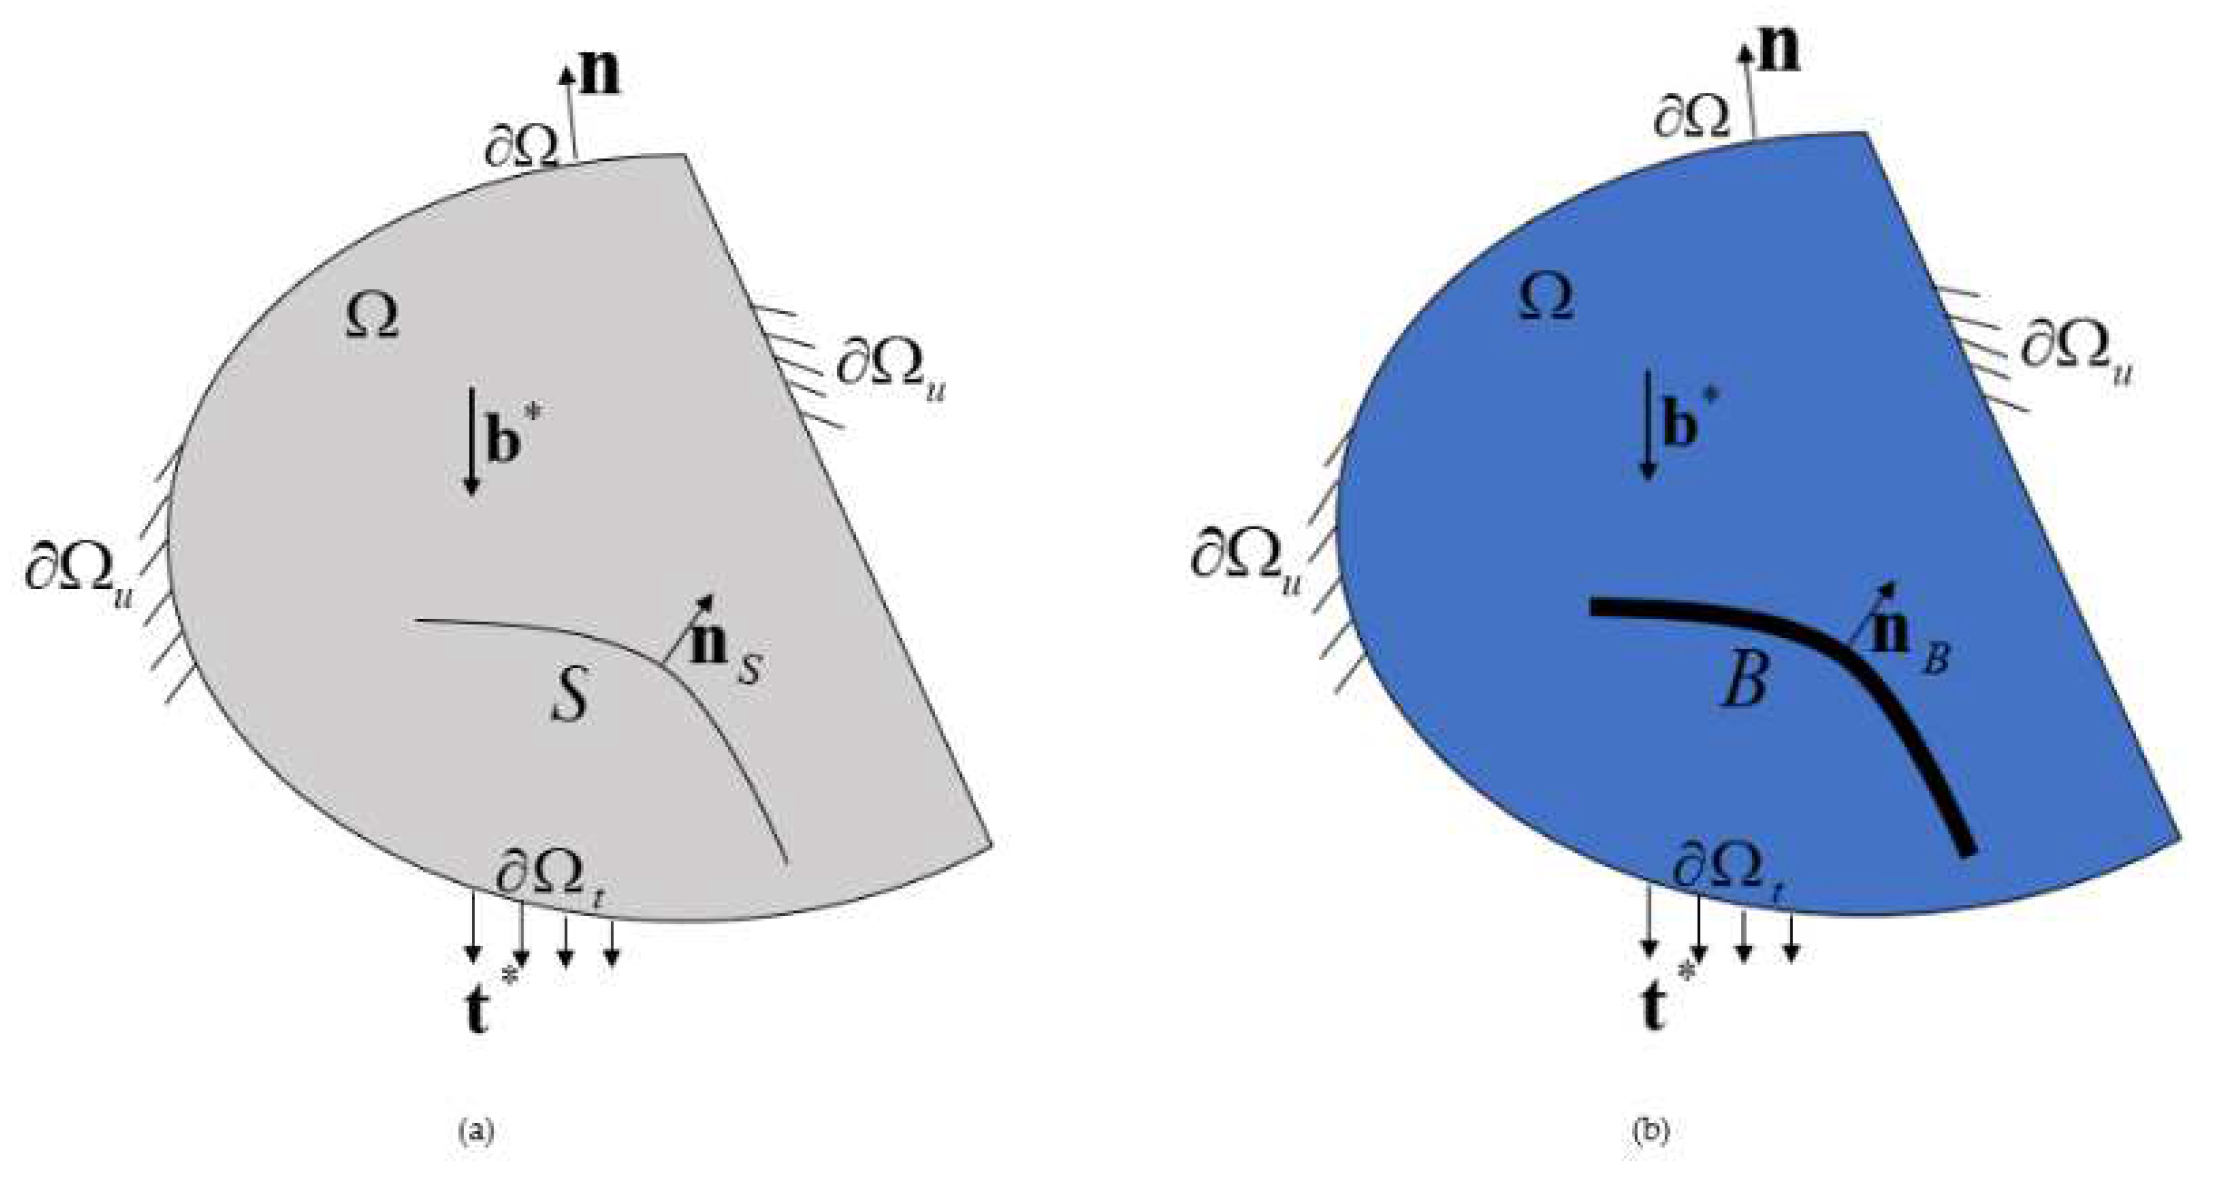
28]. 0(a) illustrates the solid domain
of the embedded crack. Within this context, we denote the external boundary as
and the outward normal vector as
n The deformation of the solid primarily results from both body forces
distributed in the cracking solid
and tractions
applied to the boundary
. This deformation state is characterized by the displacement field
and infinitesimal strain field
, where x represents the spatial coordinate system and
is the symmetric gradient operator. For a well-posed boundary value problem, the external boundary ∂Ω is divided into two complementary segments, denoted as
and
. We then apply a given displacement boundary
and force boundary
to their respective segments.
Figure 1.
(a) A solid domain with sharp cracks; (b) Geometric regularition.
Figure 1.
(a) A solid domain with sharp cracks; (b) Geometric regularition.
The sharp crack is dispersed into a crack band of a finite scale and a crack phase field is introduced to describe the crack state. The crack phase field adheres to the irreversibility condition , which satisfies for elastic domains and for cracks. It is imperative to underscore that the crack band is not predetermined or held fixed throughout solid damage destruction, but is automatically updated during crack propagation.
2.1. Governing equations
The phase field fracture theory is underpinned by the coupled damage-displacement problem [
38]. These governing equations are derived from the energy minimization principle [
39,
40].
Where the damage flux
is conjugated to the damage gradient
, and the divergence is balanced by the damage source
.
where the finite length scale
represents the width of the crack band. When
, it corresponds to a sharp crack. We introduce the scaling constant
to reproduce the fracture energy
during full failure. These governing equations are characterized by a monotonically increasing crack geometry function
and a monotonic decreasing energy degradation function
, both of which fulfill the following conditions.
The term
is introduced to mitigate the issue of spurious damage expansion observed in the gradient-enhanced damage model [
41,
42].
2.2. Constitutive theory
This paper focuses solely on the cracking behavior under monotonic loading conditions, with the simplest constitutive relations [
38] shown as follows:
where represents the effective stress tensor and can be expressed as:
where is Young’s modulus; denotes the principal value of the effective stress tensor ; is connected to the Poisson’s ratio and depends on the stress state, i.e., in the case of uniaxial stress, , for plane stress; in other cases, .
2.3. Optimal characteristic functions
To maintain generality, the general expression satisfying condition (4) is as follows [
38].
With the parameters
,
and
require to be determined. To ensure that the resulting crack geometry function
strictly falls within the range of
, we set the parameter
. It is worth noting that numerous studies [
43] have employed similar energy degradation functions.
2.4. Phase-field models for brittle fractures
Several popular brittle fracture phase-field models [
39,
44,
45] are present as follows:
For the above brittle fracture phase-field models, the calculation equation for the critical (peak) stress
is given in [
27,
45].
The critical stress
is tied to the length parameter
. Consequently, the entire load-displacement curve proves to be exceedingly sensitive to the length scale parameter
[
46]. To address these challenges, in the phase-field model of brittle fractures, a common strategy is often employed. This involves treating the length scale
as a material property and rather than merely a numerical parameter [
40]. A prevalent approach is to equate the critical stress with the failure strength
.
In brittle fracture phase-field models, the internal length serves to determine the dimensions of the fracture process zone, and a smaller internal length signifies the material’s greater susceptibility to brittleness.
2.5. Phase-field regularized cohesive zone model
Comparatively, for any parameter
, the energy degradation function (7) of rational type leads to a set of phase-field damage models, with the following non-vanishing failure strength [
47].
In other words, parameter
is no longer a constant
, as typically seen in the brittle fracture phase-field model. Instead, it becomes a function related to parameter
. This adjustment ensures that the failure
remains constant. Thus, the predicted global load-deformation response is insensitive to the length scale [
38,
45,
48]. Consequently, maintaining favorable Γ-convergence is achievable by minimizing the regularization length scale
. Notably, when this length scale approaches zero, i.e.,
, generalized softening law. Wu et al.’s work [
47] illustrates more details.
In this paper, we refer to Wu et al.’s research [
38] for the suggestion of using the crack geometry function of
, i.e.,
The ratio of and depends on the initial slope and the limit crack opening .
Based on the linear softening curve, it can be deduced that .
The resulting PF-CZM is considered optimal since it accommodates a wide range of softening laws commonly employed for brittle and quasi-brittle materials, including linear equations, exponential equations, hyperbolic equations, and the approach proposed by Sarac et al. [
49]. Brittle fractures and the approach by Cornelissen et al. are a popular choice for linear softening curves, aligning with Wu et al.’s findings [
38].
The mentioned parameters
, and
are calibrated from Type I failure mode. However, it is important to note that the PF-CZM can effectively handle mixed mode failure, with corresponding details shown in [
47].
For PF-CZM, i.e., , we can draw the following conclusions based on Equations (7) and (13).
Once the crack nucleates, i.e., , the evolution equation for the crack phase field becomes:
Or, equivalently,
Therefore, as the maximum principal stress reaches the failure strength , the crack nucleation commences, indicating that the PF-CZM harmoniously incorporates a strength-based crack nucleation criterion, an energy-based crack propagation criterion, and a variational crack path selector into a single framework.
3. Simulation of Rock Fractures and Experimental Verification
In this section, we employ the PF-CZM for numerical simulation and experimental verification on rocks. We conducted two sets of experiments, namely the SCB monotonic fracture test [
40] and the granite tensile fracture test [
1], on the rocks. By comparing the experimental results with those from the numerical simulation, we substantiate the precision of the PF-CZM in predicting rock crack propagation.
3.1. SCB monotonic fracture test
Zhang et al. [
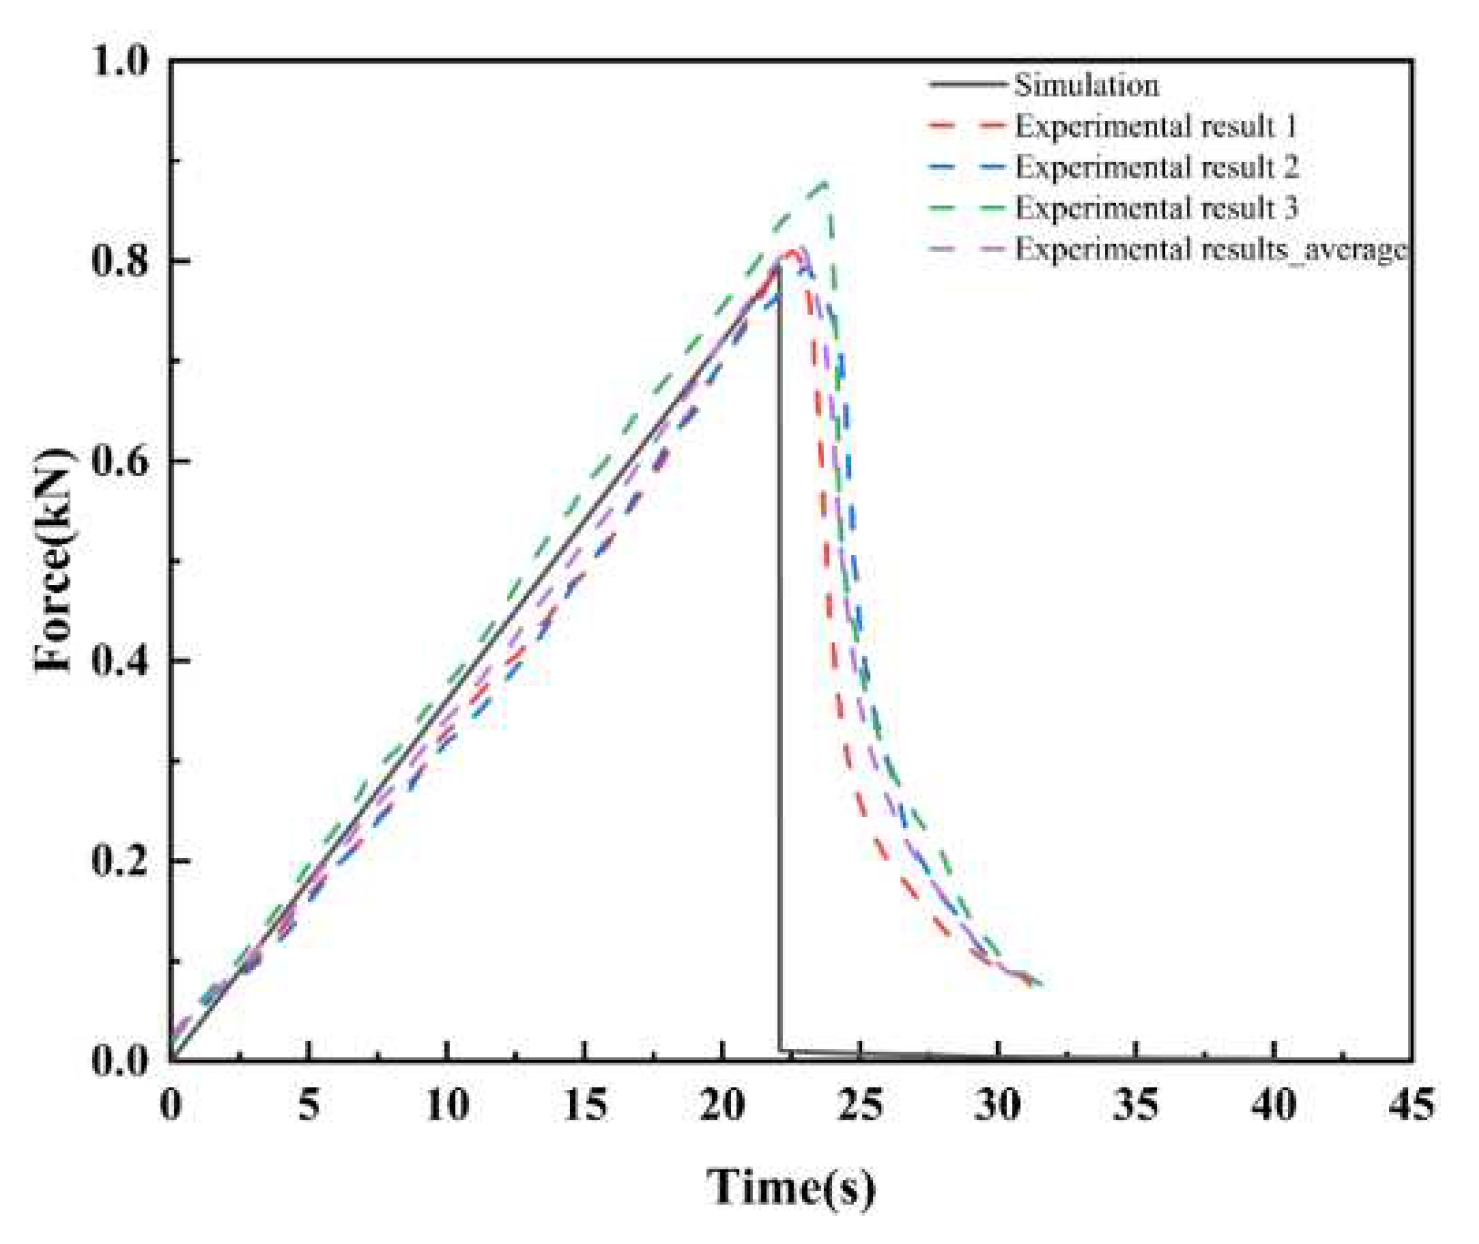
40] employed the MTS monotone fracture experiment design for the SCB disk with the following specifications: a diameter (D) of 150 mm, a thickness of 60 mm, and an initial crack length (L) of 5 mm. The displacement rate was set at 1.0 mm/min, and the SCB fracture test was conducted at this constant rate, repeated three times. 0(a) illustrates the SCB crack propagation and the results of three sample tests. Using an MTS fatigue device, the crack in the SCB disk extends vertically upward to the top along the prefabricated crack direction. For finite element simulations of the SCB disk, the PF-CZM was applied, ensuring that the geometry, boundary conditions, and loading rate matched those of the experimental setup. 0(b) and 0 depict the crack propagation diagram and load-displacement curves of the SCB disk, respectively. Notably, a strong agreement is observed between simulation results in 0(b) and experimental findings in 0(a) [
40] obtained from the monotonic SCB fracture test.
Figure 2.
(a) experimental results and (b) (PF-CZM) simulation results.
Figure 2.
(a) experimental results and (b) (PF-CZM) simulation results.
Figure 3.
Load-displacement curves of the SCB disk.
Figure 3.
Load-displacement curves of the SCB disk.
3.2. Granite tensile test
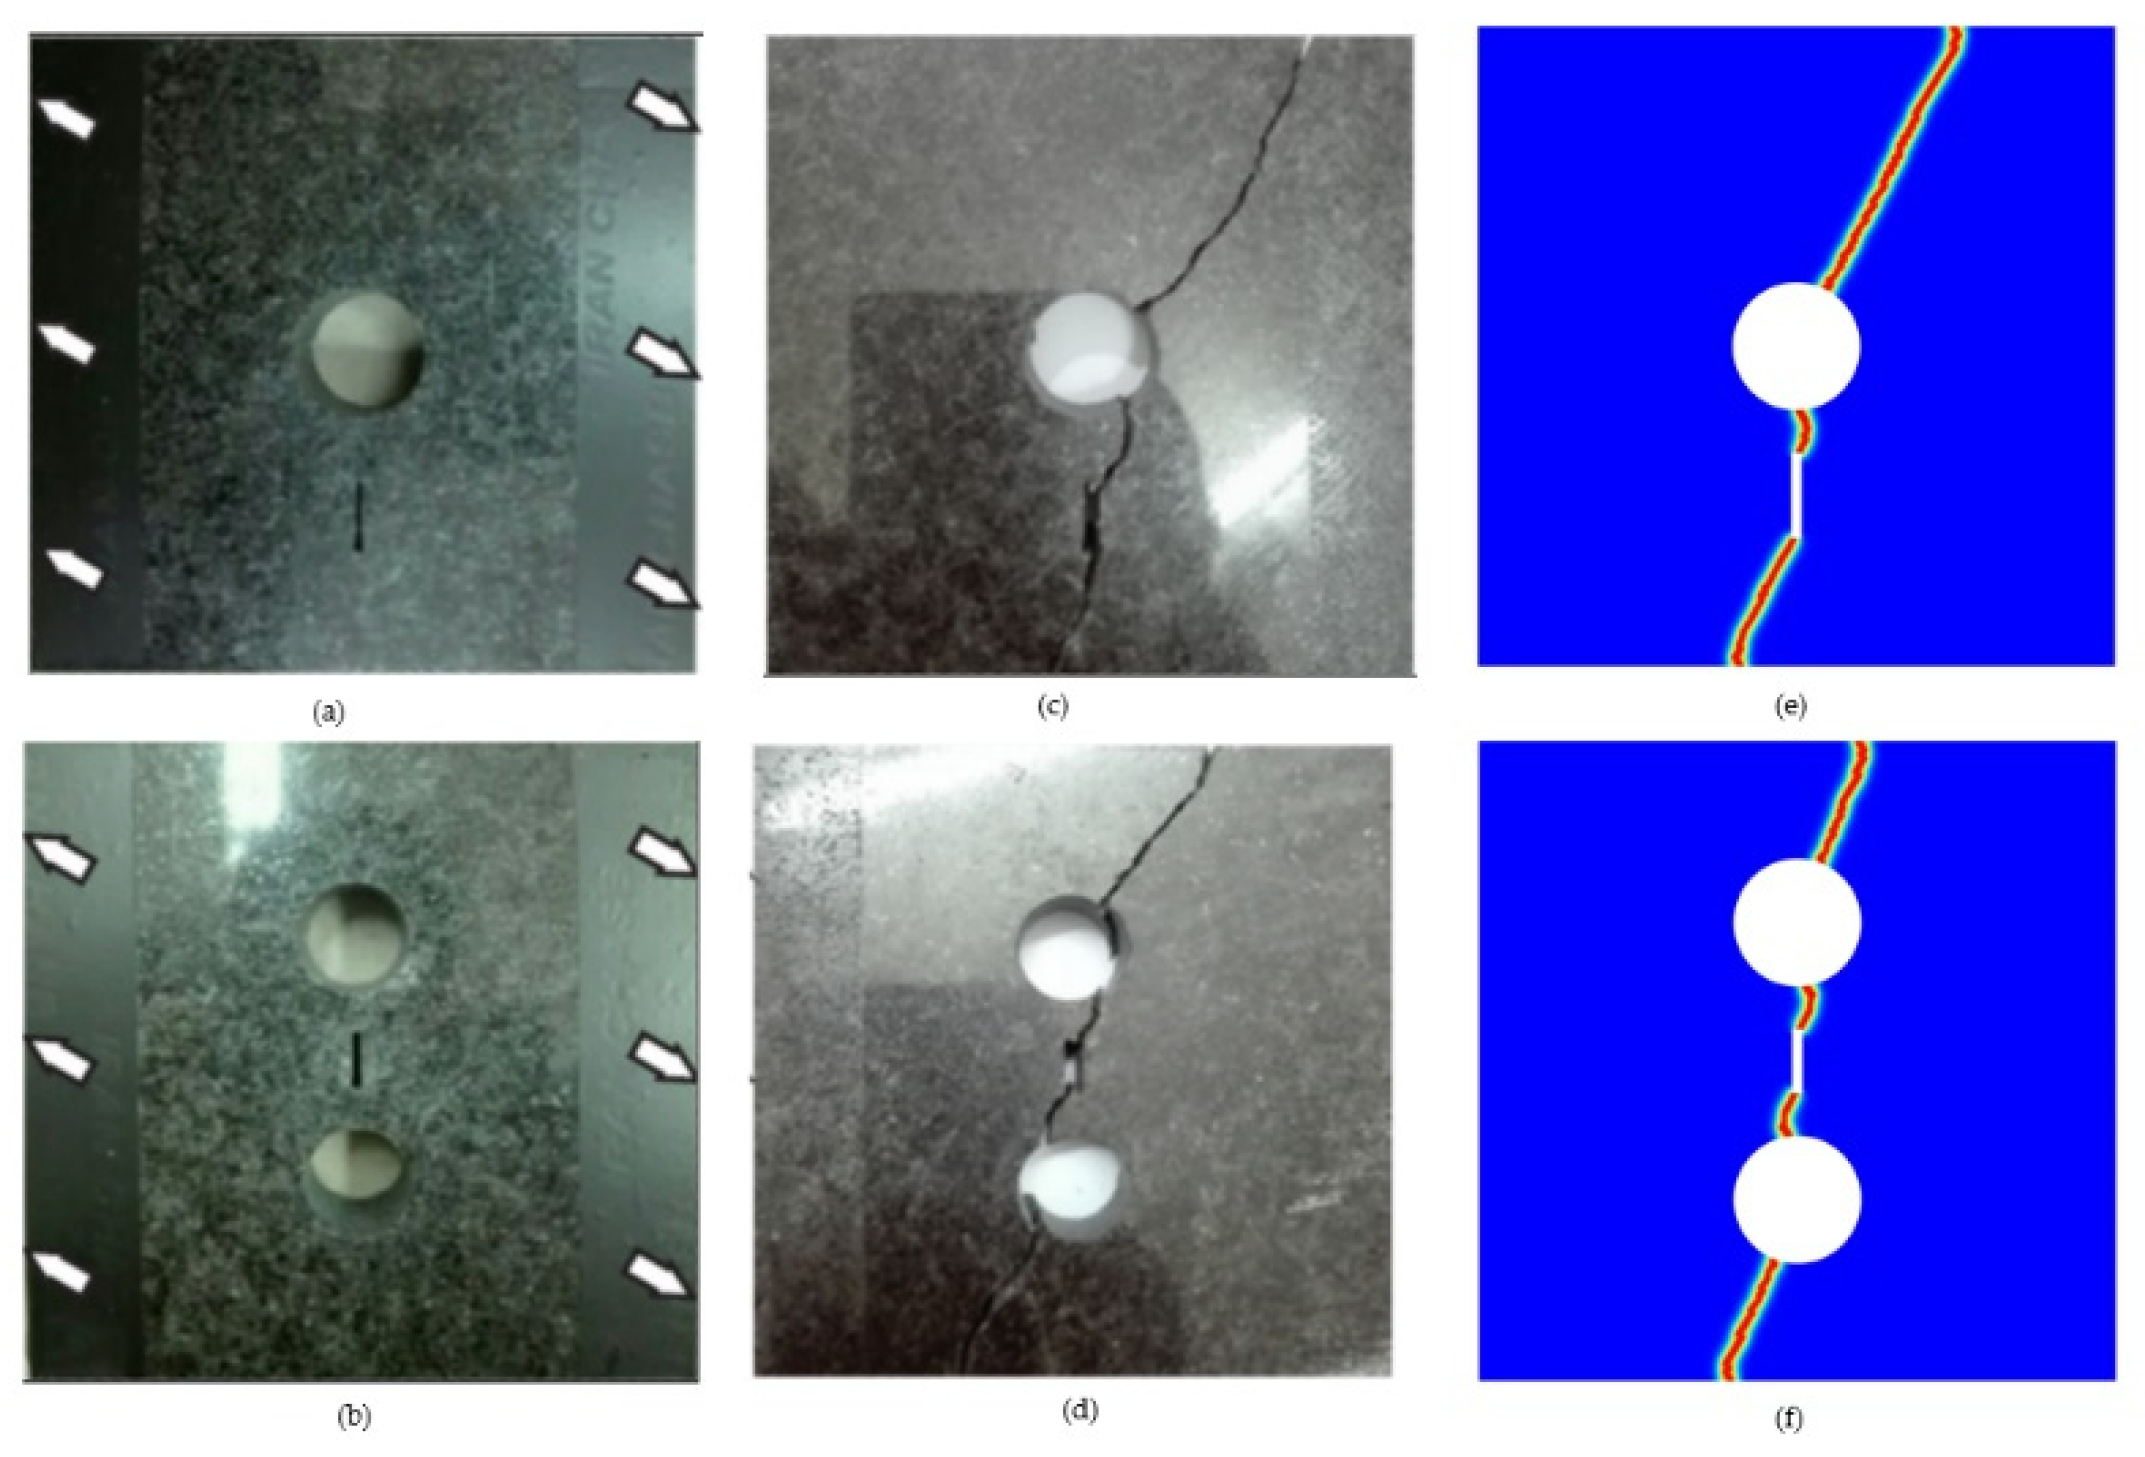
The propagation of cracks in porous granite structures is visualized in 0 Rezanezhad et al. [
1] employed a waterjet to create pre-existing holes and cracks in granite slabs. These specimens were pulled away by a uniform load, with an angle of 30° from both sides, utilizing an STM-250 tensile device. The experimental crack path is depicted in 0(c) and 0(d). To replicate these experimental results, the PF-CZM was utilized, with the granite’s geometry, boundary conditions, and loading method aligning with the experimental setup, where the elastic modulus
, Poisson‘s ratio
, and fracture energy density
. 0(e) and 0(f) present the numerical outcomes of the PF-CZM, demonstrating a remarkable alignment with the experimental results. Consequently, the PF-CZM proves to be highly dependable for simulating fractures in porous structures.
Figure 4.
Two granite specimens (
a) one hole and one crack, (
b) Two holes and a crack, (
c,d) Experimental results, (
e,
f) Simulation results (Figure 4 (
a), (
b), (
c), and (
d) are the results from Rezanezhad et al.’s work [
1]).
Figure 4.
Two granite specimens (
a) one hole and one crack, (
b) Two holes and a crack, (
c,d) Experimental results, (
e,
f) Simulation results (Figure 4 (
a), (
b), (
c), and (
d) are the results from Rezanezhad et al.’s work [
1]).
4. Numerical Simulation
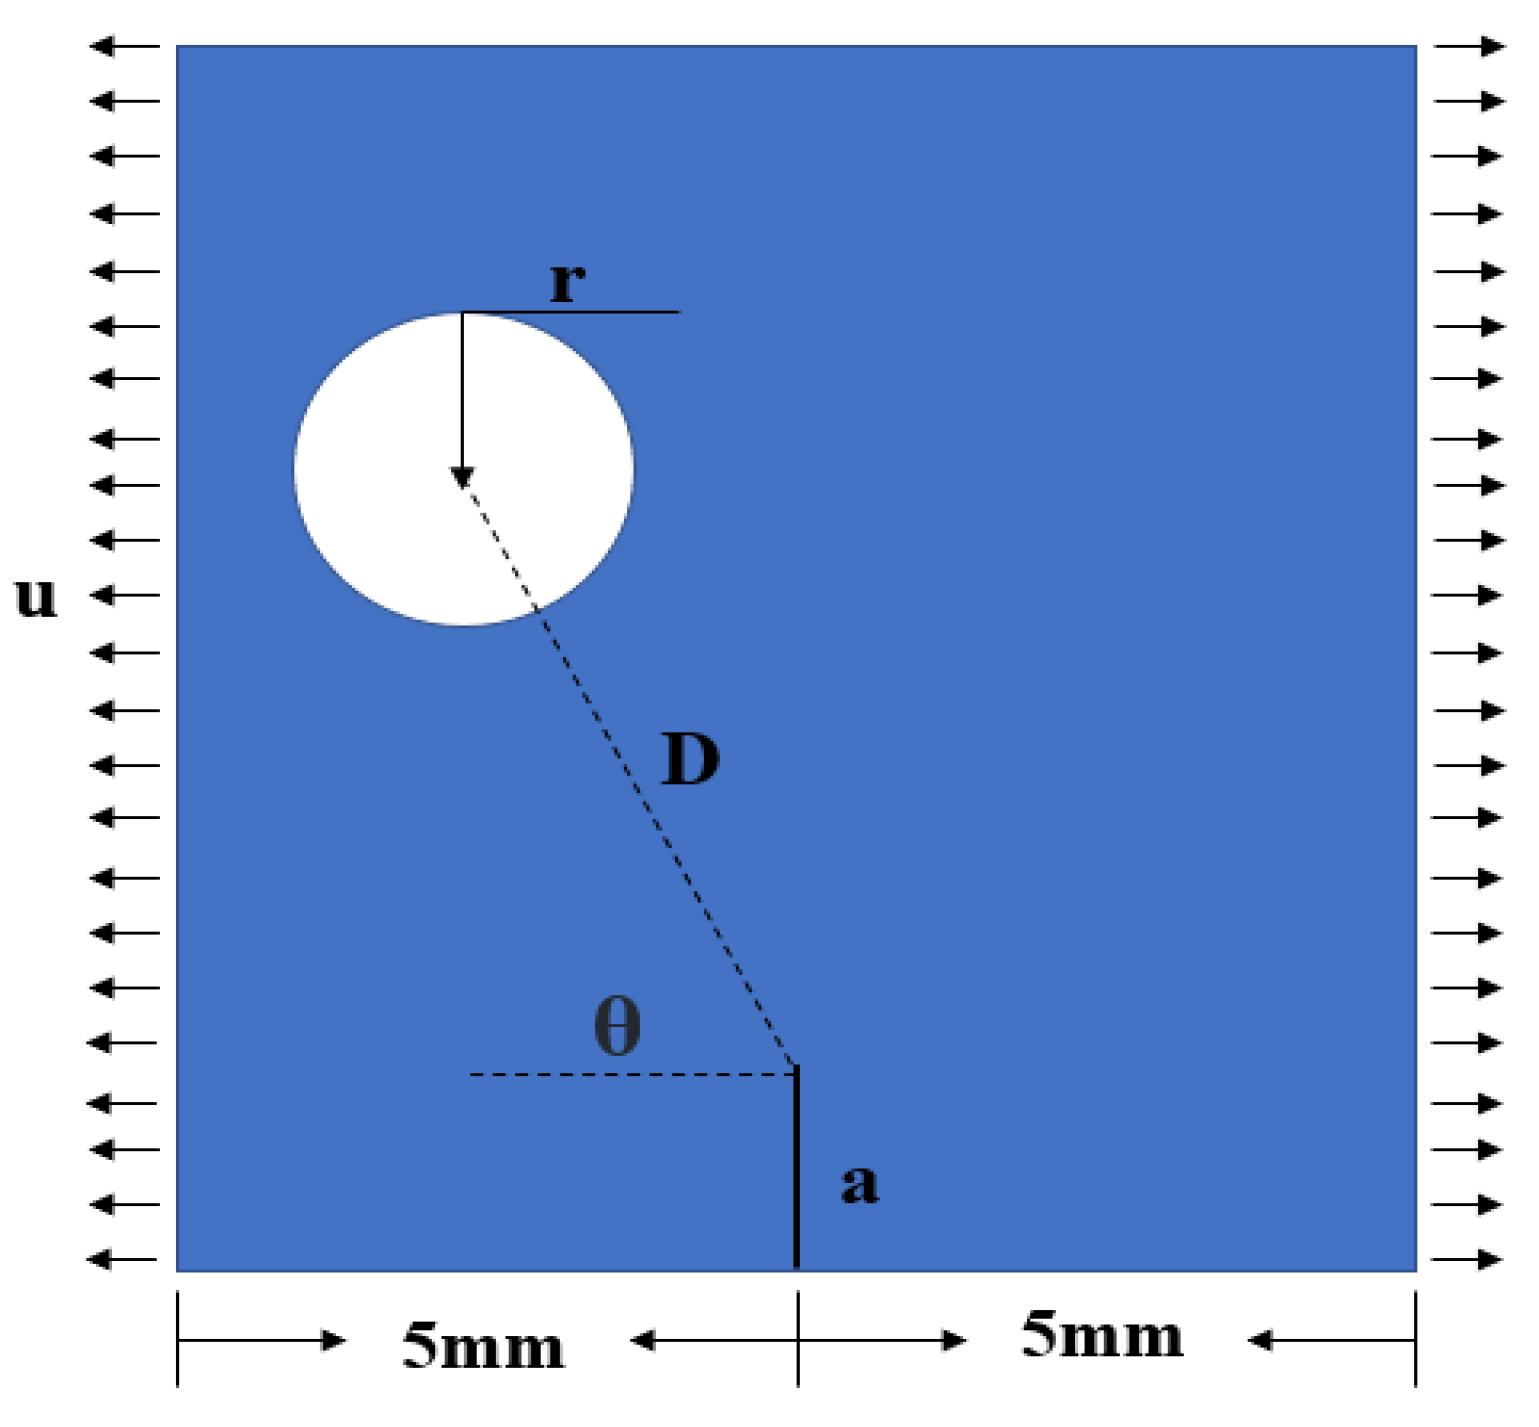
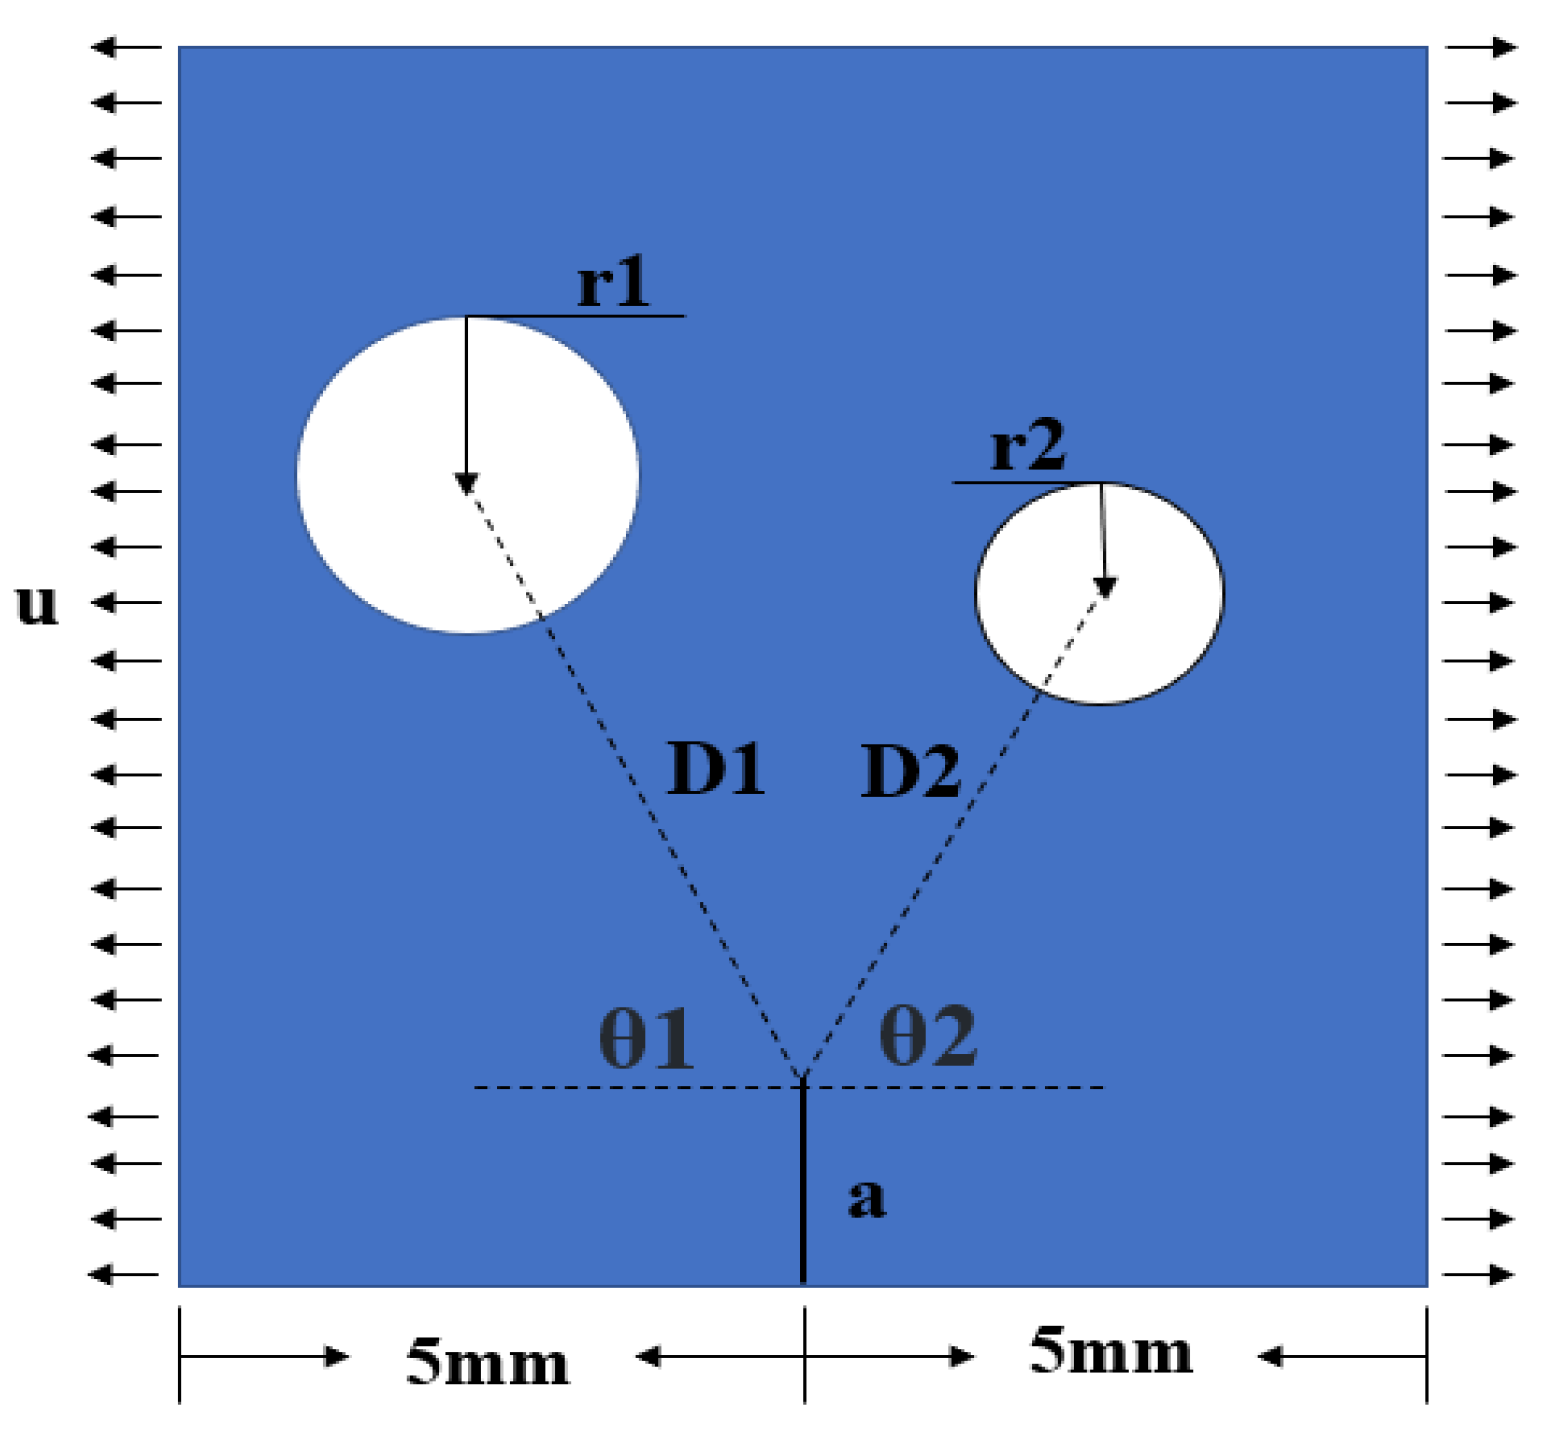
In this section, we utilize the PF-CZM to numerically simulate the relative location of rock pores and initial cracks. Pores and cracks are typical defect patterns found in rocks. This model enables us to analyze phenomena such as crack propagation and rock deformation in the rock, thus enhancing our understanding of the mechanisms governing rock failure by simulating the crack evolution under varying conditions. The relative location of pores and initial cracks are shown in 0.
Figure 5.
The relative location of pores and initial cracks.
Figure 5.
The relative location of pores and initial cracks.
The initial crack length (a), the rock slab length (L), and the rock slab width (W) are 1 mm, 15 mm, and 10 mm, respectively. Our investigation will primarily focus on three key aspects: (1) We explore the impact of varying pore sizes (r) on crack propagation. This variation allows us to observe how pore size influences rock fracture and strength. (2) Considering the variation of different pore-to-crack distances (D) on crack propagation, we gain insights into the varying D interaction effects on crack propagation by adjusting the value of D. (3) The pore-crack angle (θ) describes the deflection of the pore position relative to the crack tip. Varying the value of θ enables us to assess the impact of the relative position of pores in the rock on the crack path propagation and velocity.
4.1. Effects of pore size (r)
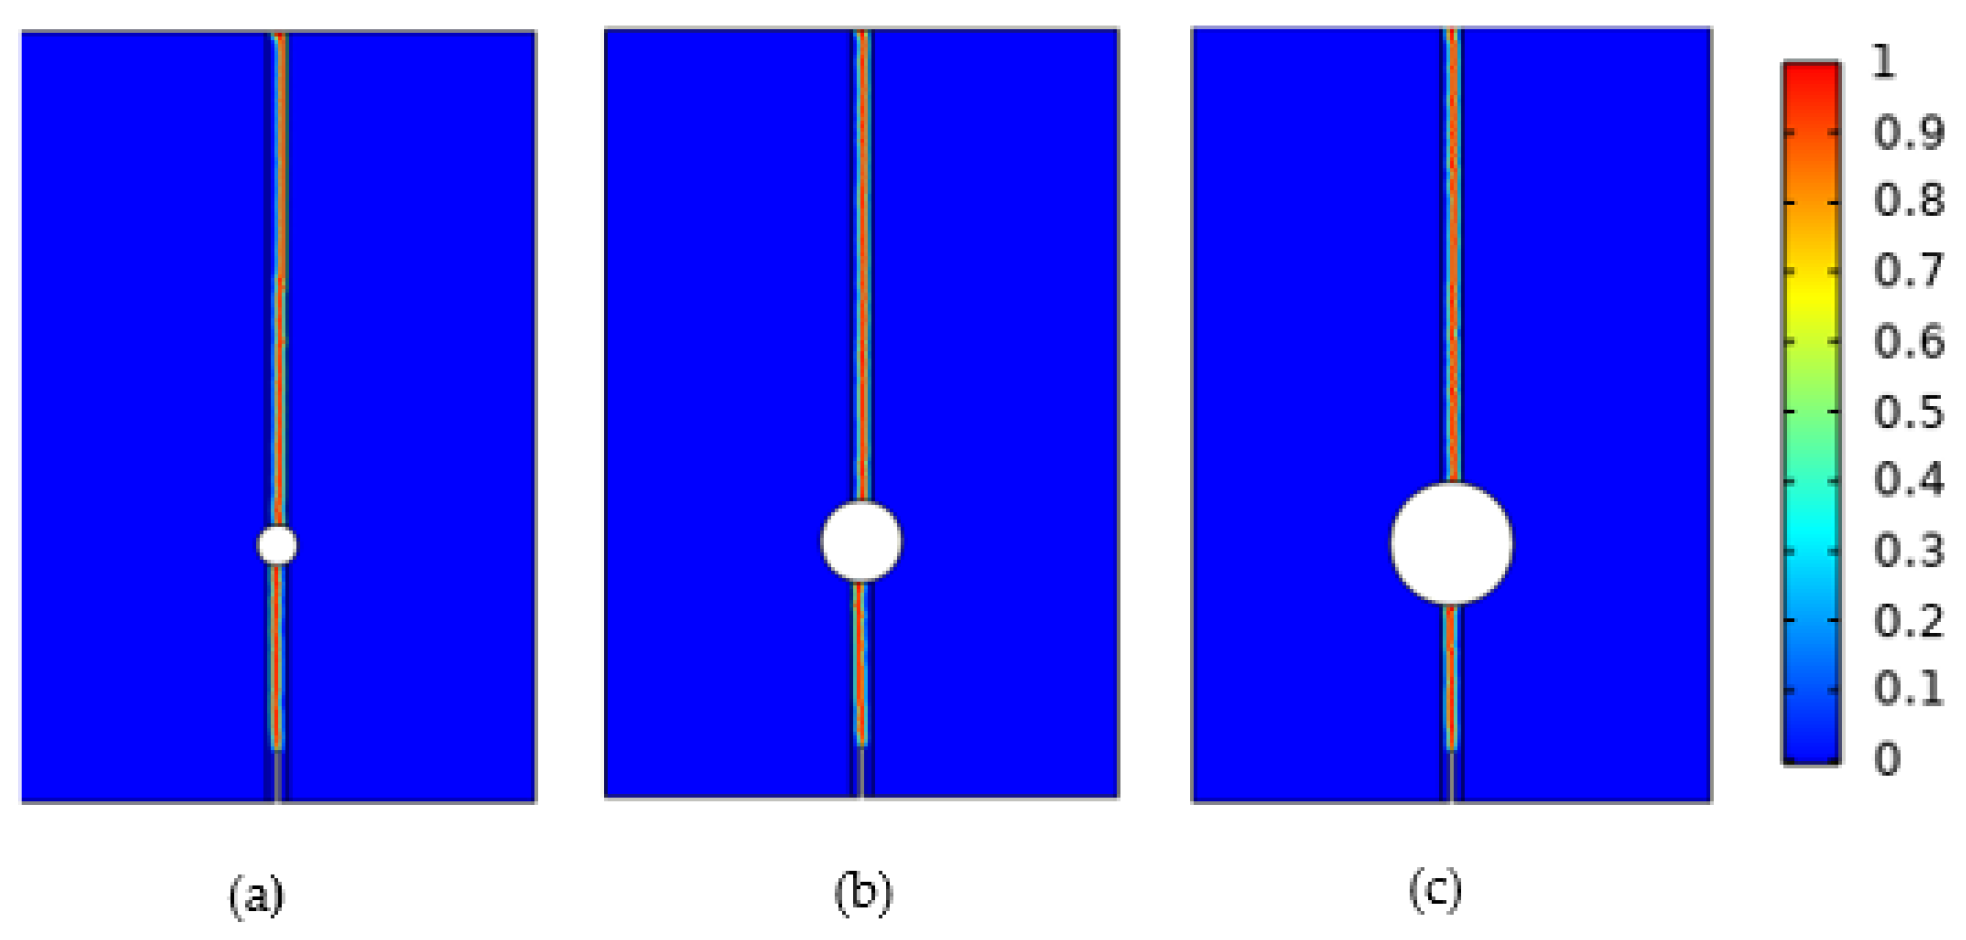
To investigate the influence of varying r on crack propagation, we maintain certain parameters constant: D = 4 mm, θ = 90°, and a = 1 mm. We explore different pore sizes, specifically r values of 0.2 mm, 0.8 mm, and 1.2 mm. A uniform displacement of 0.001 mm/s is applied to both the left and right sides of the model, simulating the crack propagation process, which allows us to determine the influence of different pores on rock failure.
The fracture diagrams for crack propagation with different pore sizes are illustrated in 0. The crack path is a straight line, originating from the upper end of the initial crack and extending upward through the pores to the highest point of the model.
Figure 6.
Crack propagation diagrams for different pore sizes (a) 0.4 mm (b) 0.8 mm (c) 1.2 mm.
Figure 6.
Crack propagation diagrams for different pore sizes (a) 0.4 mm (b) 0.8 mm (c) 1.2 mm.
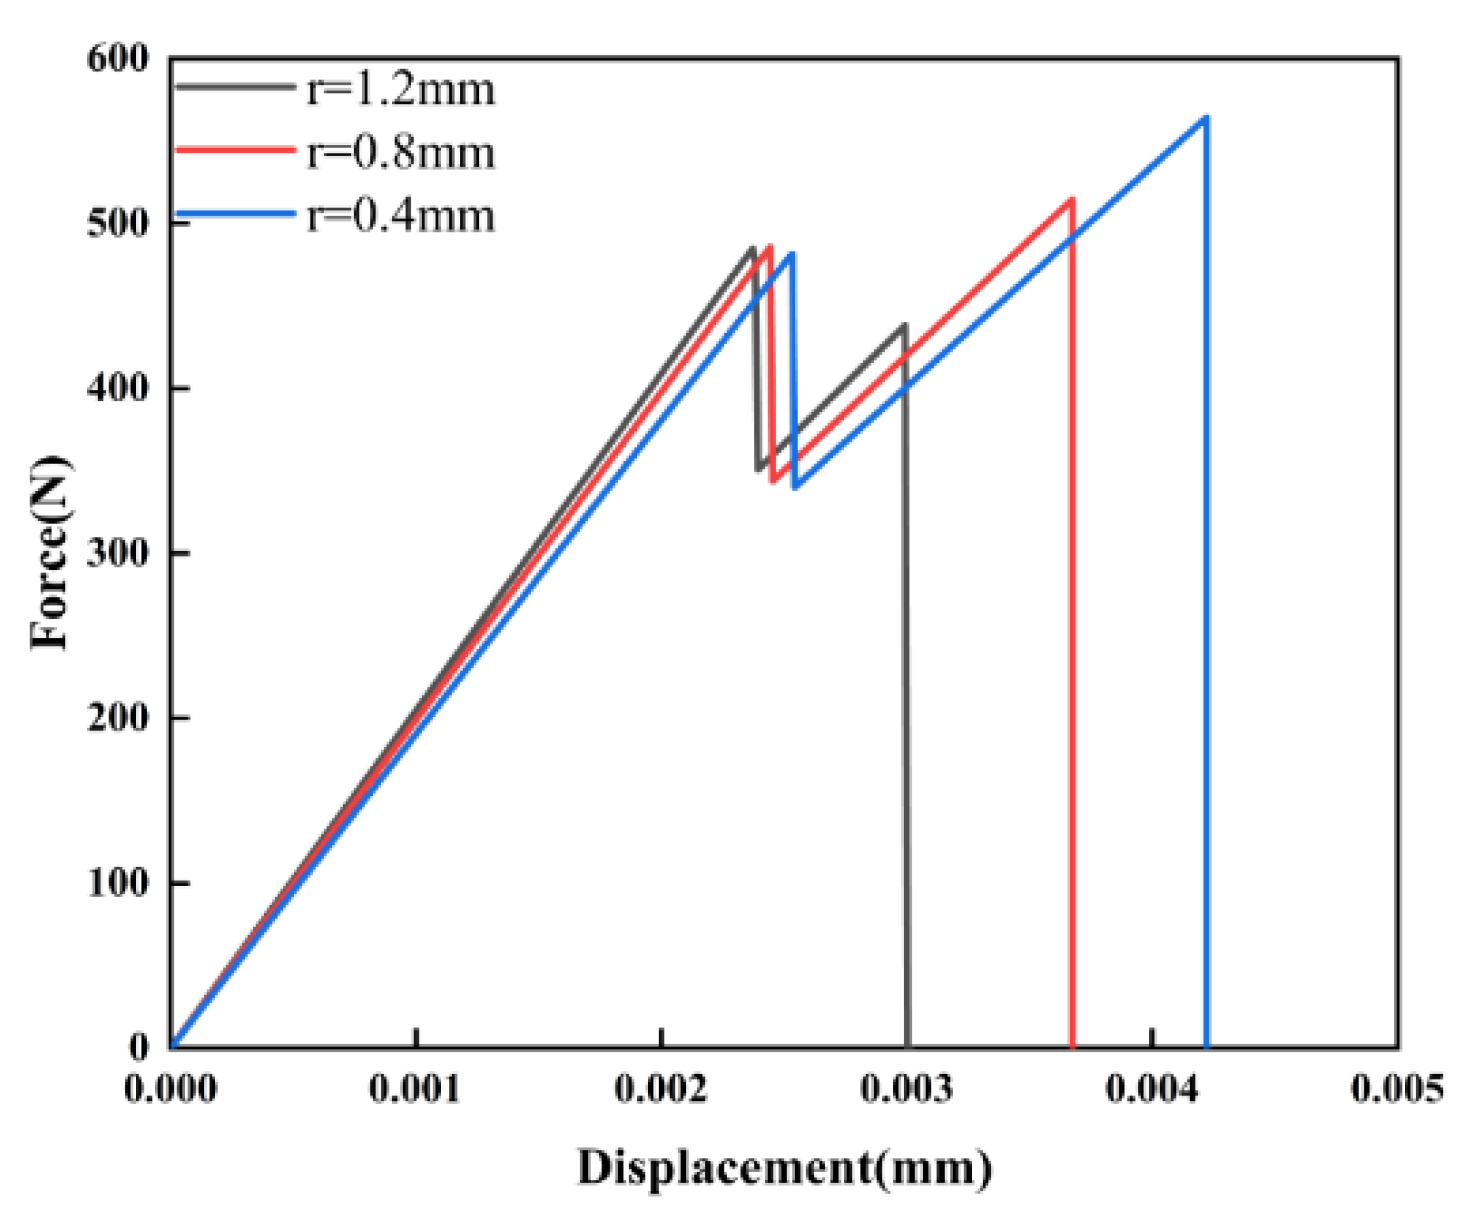
From the load-displacement curves shown in 0, it is evident that pore radii of 0.4 mm, 0.8 mm, and 1.2 mm correspond to maximum reaction forces of 564 N, 514 N, and 484 N, respectively. Notably, as r increases, the maximum reaction force decreases by 8% and 14%, indicating that compared to smaller pore structures, larger ones pose greater challenges in resisting crack propagation and are more prone to inducing crack initiation under identical loading conditions. Larger pore structures tend to result in stress concentration, elevating the probability of crack formation and propagation. However, smaller pore structures restrict crack propagation and offer increased resistance to this process.
Figure 7.
Load-displacement curves for different pore sizes.
Figure 7.
Load-displacement curves for different pore sizes.
4.2. Effect of the pore-crack distance (D)
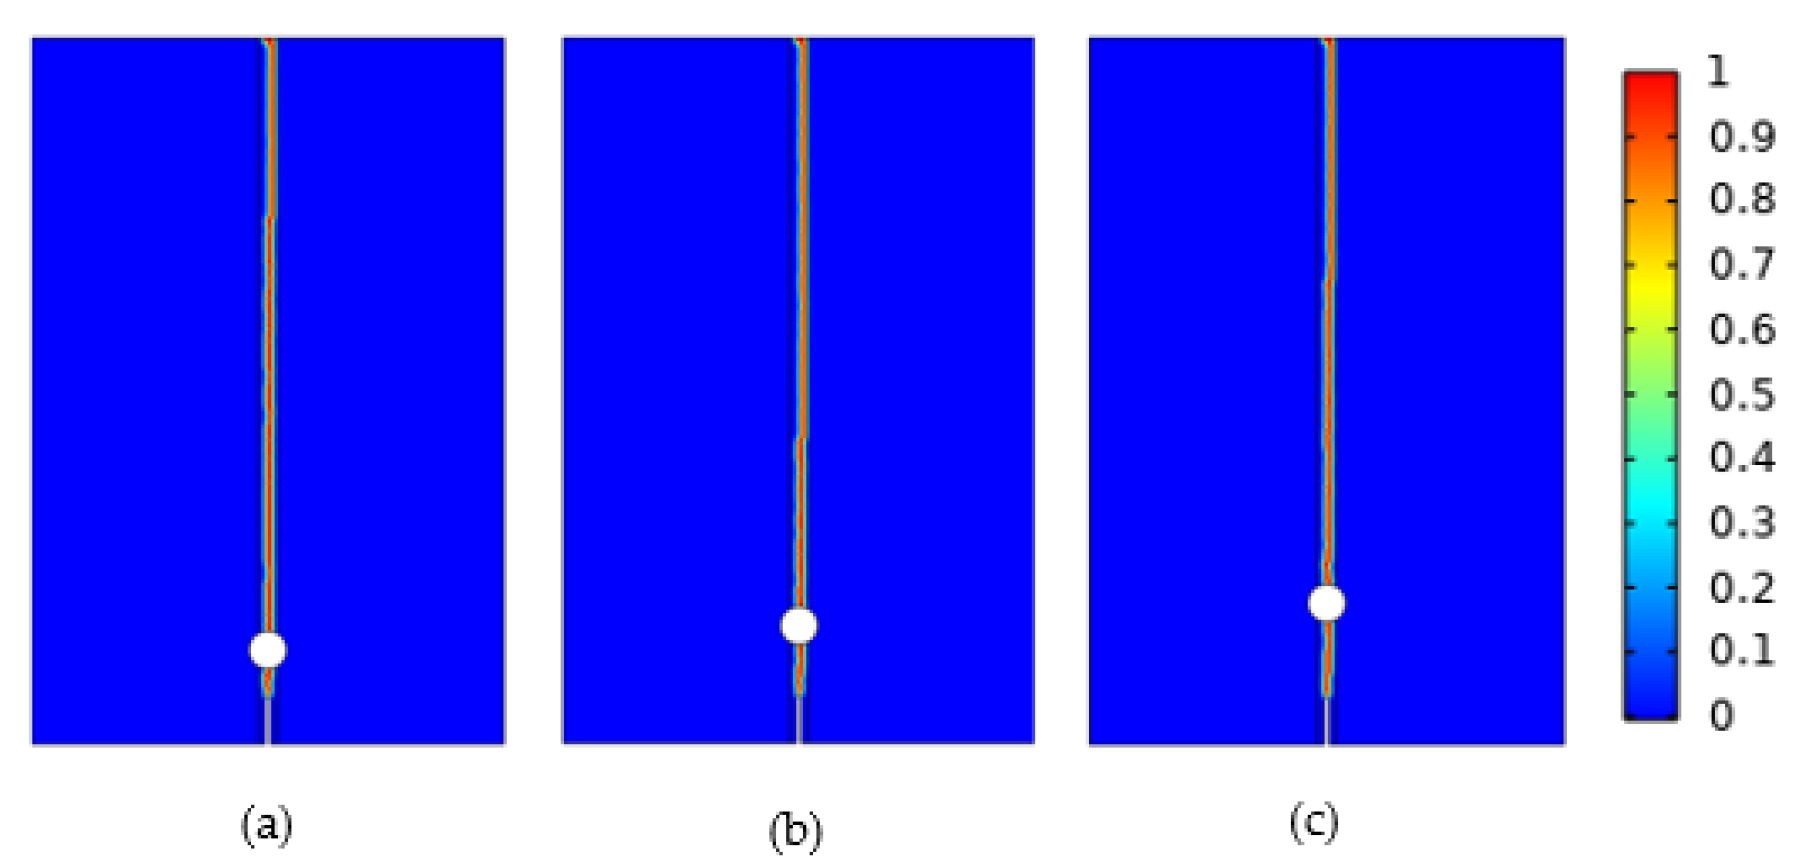
In this section, we delve into the impact of the pore-to-crack distance (D) on crack propagation. Referring to the schematic diagram of the relative positions of pores and cracks in 0, D represents the distance between the crack tip and the center of the pore circle. To facilitate our investigation, we keep other parameters constant and focus solely on varying the size of D. We establish three models with fixed values: r=0.4 mm, a=1 mm, θ=90°, and D =1 mm, 1.5 mm, and 2 mm, respectively. These models are employed to simulate the crack propagation under a constant acceleration rate of 0.001 mm/s.
0 provides a schematic representation of the crack propagation with varying D, which is similar to the r expansion, starting from the upper end of the initial crack and expanding vertically upwards through the pore until reaching the upper boundary of the model.
Figure 8.
Crack propagation diagrams for different distances (a) 1 mm (b) 1.5 mm (c) 2 mm.
Figure 8.
Crack propagation diagrams for different distances (a) 1 mm (b) 1.5 mm (c) 2 mm.
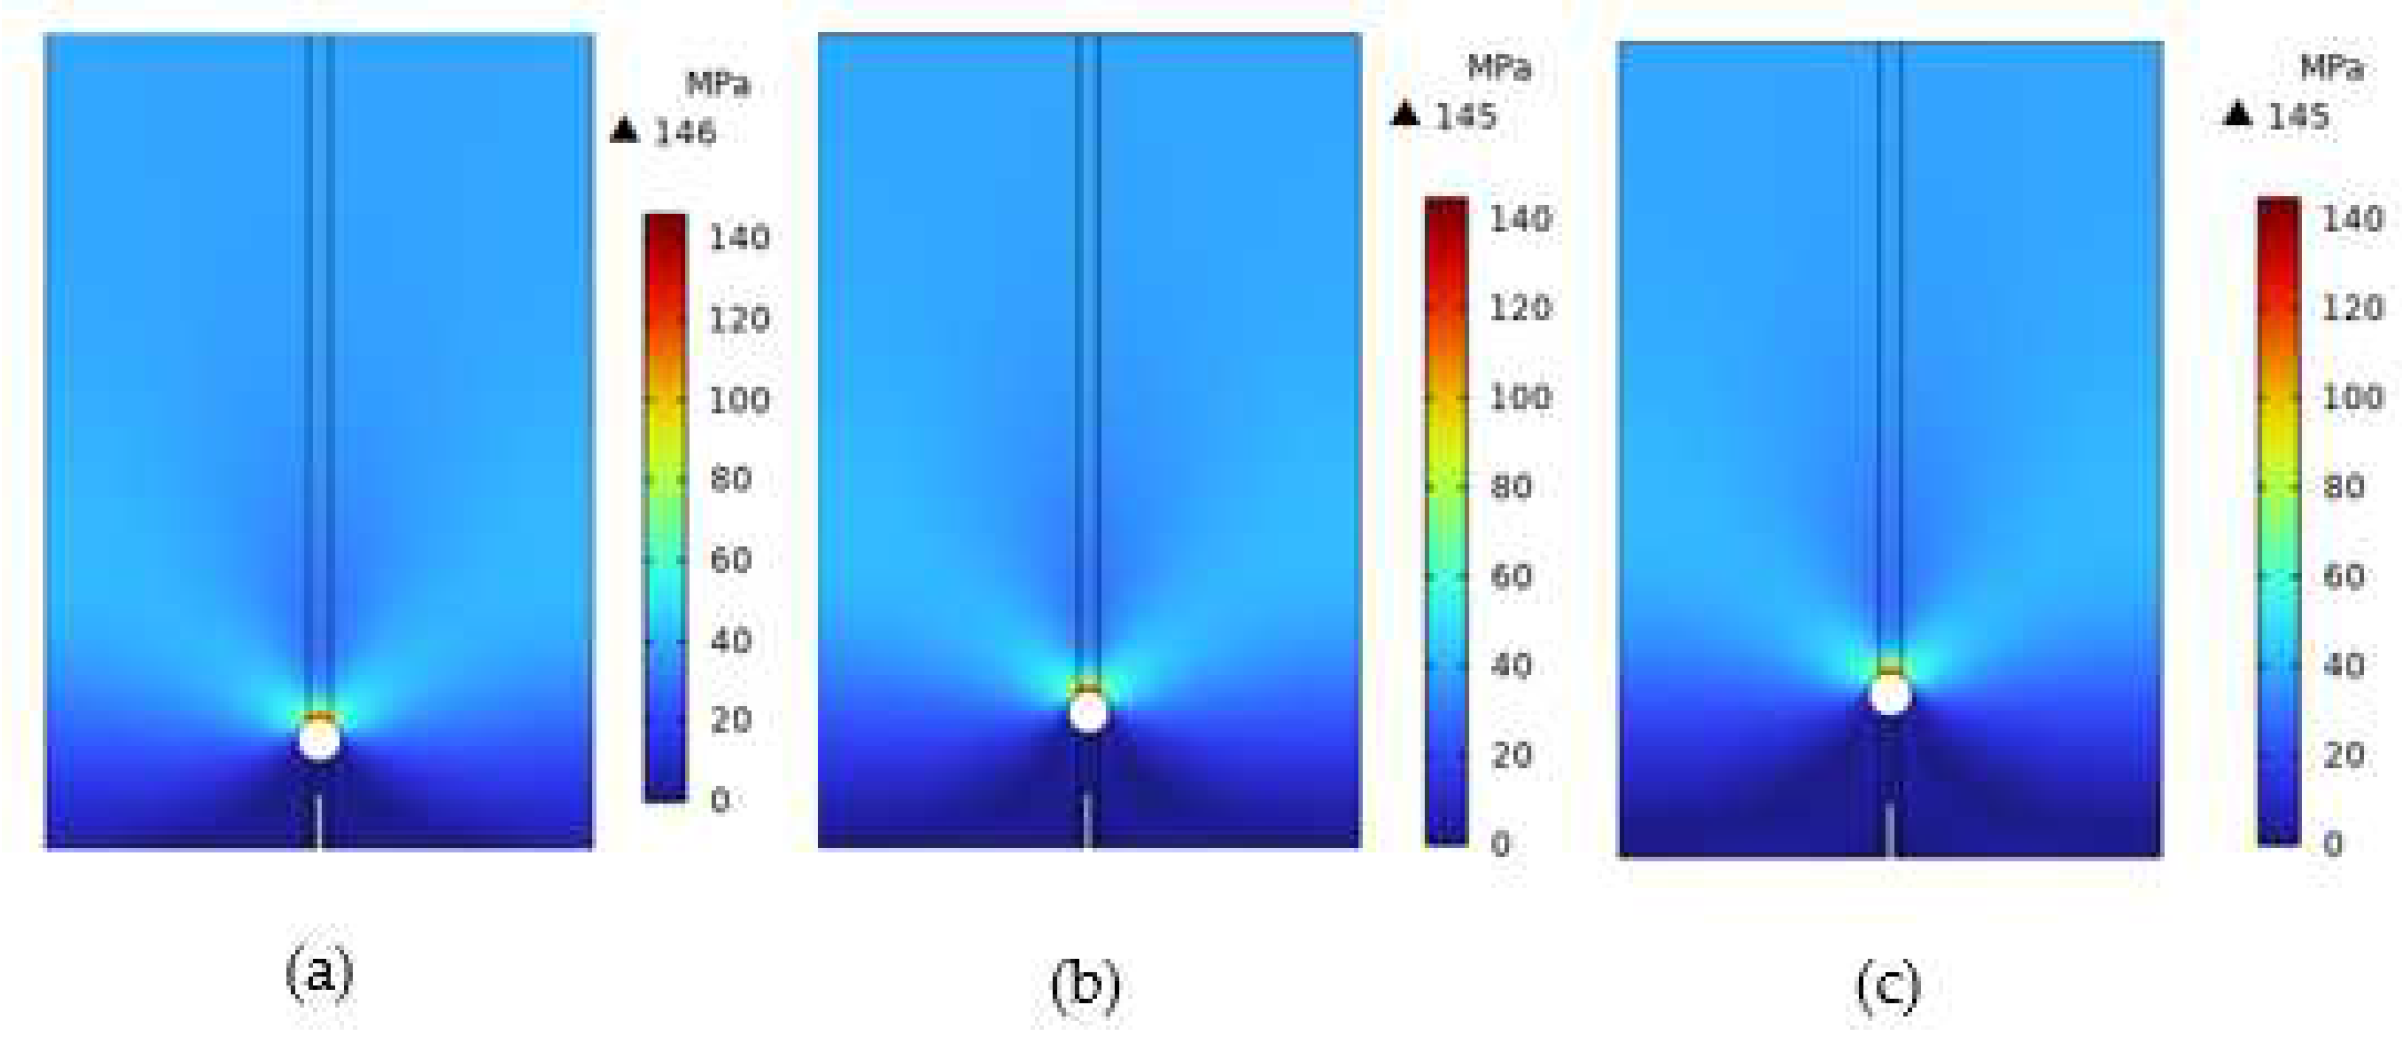
0 depicts the Mises stress distribution at different distances. Interestingly, the Mises stress distribution exhibits similarity across different pore radii. Especially at the crack tip, when D is small, there is a pronounced stress concentration at the tip. However, as D increases, the stress gradually disperses and diminishes, with stress levels in the tip region gradually decreasing as well. 0 displays the load-displacement curves, which can be divided into two stages: First, crack initiation begins to extend to the lower edge of the pore; Second, the crack, having initiated at the lower edge of the pore, proceeds to extend upward until it reaches the upper boundary of the model.
Throughout the process, from the crack initiation to its expansion towards the lower edge of the pore, the reaction force steadily increases. In this first stage, the maximum reaction force reaches 440 N, 472 N, and 482 N for D of 1 mm, 1.5 mm, and 2 mm, respectively, and rises slightly by 7% and 9%. As the crack continues to expand from the lower edge to the upper edge, higher loads are applied compared to the previous stage. In the second stage, the maximum reaction force is 566 N, 543 N, and 522 N for D of 1 mm, 1.5 mm, and 2 mm, respectively, and decreases slightly by 4% and 7%. These results demonstrate that resistance to crack extension demands higher loads as the crack spreads from the lower edge to the upper edge. However, within the same stage, a larger D value may result in higher reaction forces.
Figure 9.
The Von Mises stress distribution diagrams (a) 1 mm (b) 1.5 mm (c) 2 mm.
Figure 9.
The Von Mises stress distribution diagrams (a) 1 mm (b) 1.5 mm (c) 2 mm.
Figure 10.
Load-displacement curves for different distances D.
Figure 10.
Load-displacement curves for different distances D.
4.3. Effect of Double Pores on Crack Extension
In the previous section, we explore various several scenarios where θ is 90°. In such cases, we observe that the typical pattern of crack growth involved a straight-line extension through the pore, reaching the upper edge. Meanwhile, the stress distribution in the crack tip region is usually symmetrical. However, when the angle between the pore and the crack is not 90°, crack propagation often deflects from a straight path toward the direction of pores at a specific angle, and the stress distribution in the crack tip region is no longer symmetrical. It should be noted that not all pores exhibit this effect, and only pores located at critical angles related to the crack tip can cause such crack deflection.
To visually illustrate the positional relationship between the angle θ of double pores and fractures, we have created a simplified model, as depicted in 0. We increase the angle θ to induce a deflection in the crack propagation path and study how the propagation path of the crack deviates from its original straight path due to the influence of angle θ. To accomplish this, we have developed three series of models, each comprising five models, as detailed in
Table 1. The pore radius of each series is 0.4 mm, 0.8 mm, and 1.2 mm, respectively. By altering the ratio between D and r (D/r), we achieve a range of variations between 2 and 6 in each series.
Building upon the findings from
Section 4.1 and
Section 4.2, where we investigate the influence of r and D on crack extension, we now discuss the combined effect of r, D, and θ on crack deflection and extension. As shown in 0, we construct a model featuring double pores alongside an initial crack. These pores can induce crack deflection, but it is imperative to identify which of these pores plays the decisive role in deflecting the cracks. According to 0, we simply divide the models into two types: those with different deflection angles and those with equal deflection angles.
Figure 11.
The relative position of double pores and the initial crack.
Figure 11.
The relative position of double pores and the initial crack.
4.3.1. Effect of different deflection angles on crack extension
To simulate the influence of different deflection angles on crack propagation, we employ four models, namely Model *2, Model *3, Model *5, and Model *8, as listed in 0. This approach allows us to accurately understand how each pore affects the path of crack growth. It is important to note that the length, position, and material properties of the initial crack remain constant. According to 0, the deflection angles of Model *2 and Model *3 are 30° and 35°, respectively. The crack propagation and Von Mises stress distribution for these models are presented in 0(a). Evidently, the crack deflects towards the direction with a smaller deflection angle, and when the crack initiates deflection, the stress between the closer pores is significantly higher than that between the more distant pores. In regions with high stress, the crack exhibits a faster growth rate, while in areas with low stress, the crack growth rate is slower. Therefore, the crack tends to deflect towards the high-stress region, i.e., towards the closer pore, which is the preferred path for crack propagation.
Continuing the simulations for Models *5 and *8, which, as shown in 0, have deflection angles of 50° and 60°, respectively, we adhere to the established rule. Accordingly, the crack will deflect towards the closer pore. 0(b) presents the crack propagation diagram and Von Mises stress distribution cloud diagram for Models *5 and *8. Notably, the crack indeed deflects towards the closer pore, and the stress between the crack tip and the closer pore is significantly higher than that of the more distant pore, which conforms to the same rule observed in the previous simulation.
Based on the previous simulation results, we can draw the following conclusions. When r remains constant and D varies, the crack deflects towards the closer pore, indicating that D is the most influential parameter affecting crack deflection. Alterations in D give rise to changes in stress distribution, which, in turn, affect the crack propagation rate between regions of high and low stress and then determine the crack deflection direction.
Figure 12.
(a) Models *2, *3 and (b) Models *5, *8 Crack propagation and Von Mises stress.
Figure 12.
(a) Models *2, *3 and (b) Models *5, *8 Crack propagation and Von Mises stress.
4.3.2. Effect of equal deflection angles on crack extension
In
Table 1, there are multiple models featuring the same deflection angle, which can be categorized into two groups. One group comprises models with an identical D/r ratio, while the other contains models with differing D/r ratios. We first investigate the models with similar D r/ ratios, such as Models *11 and *12 with a deflection angle of 70° and Models *13 and *14 with a deflection angle of 75°. This examination aims to determine which pore exerts a more pronounced and influential role in deflecting the crack. As illustrated in 0, the simulation results show that the crack deflects towards the nearby pore, highlighting the pivotal role of the nearby pore in driving crack deflection. The figure also reveals the Mises stress distribution between the crack tip and the pore region. A high-stress region is evident between the crack tip and the nearby pore, which is the primary factor contributing to crack deflection.
The second type of simulation adopts Models *6 and *7 (θ=55°) and Models *9 and *10 (θ=65°) with the varying ratio D/r. With crack propagation and Von Mises stress distribution shown in 0, it is obvious that the crack deflects toward a larger pore. These two types of simulations demonstrate that the deflection behavior of cracks exhibits a consistent law. In cases featuring various D/r ratios among the pores, the cracks will deflect toward the pores with smaller D/r ratios. Specifically, when the pores share the same r, the crack will deflect in the direction closer to D. Conversely, when the pore has the same D, the crack tends to deflect towards the pores with a larger r. This rule can be simply described as follows: In such scenarios, the crack path inclines towards pores with smaller D/r ratios. This principle remains applicable across diverse instances, encompassing varying D/r ratios and pore radii, regardless of whether the θ is equal.
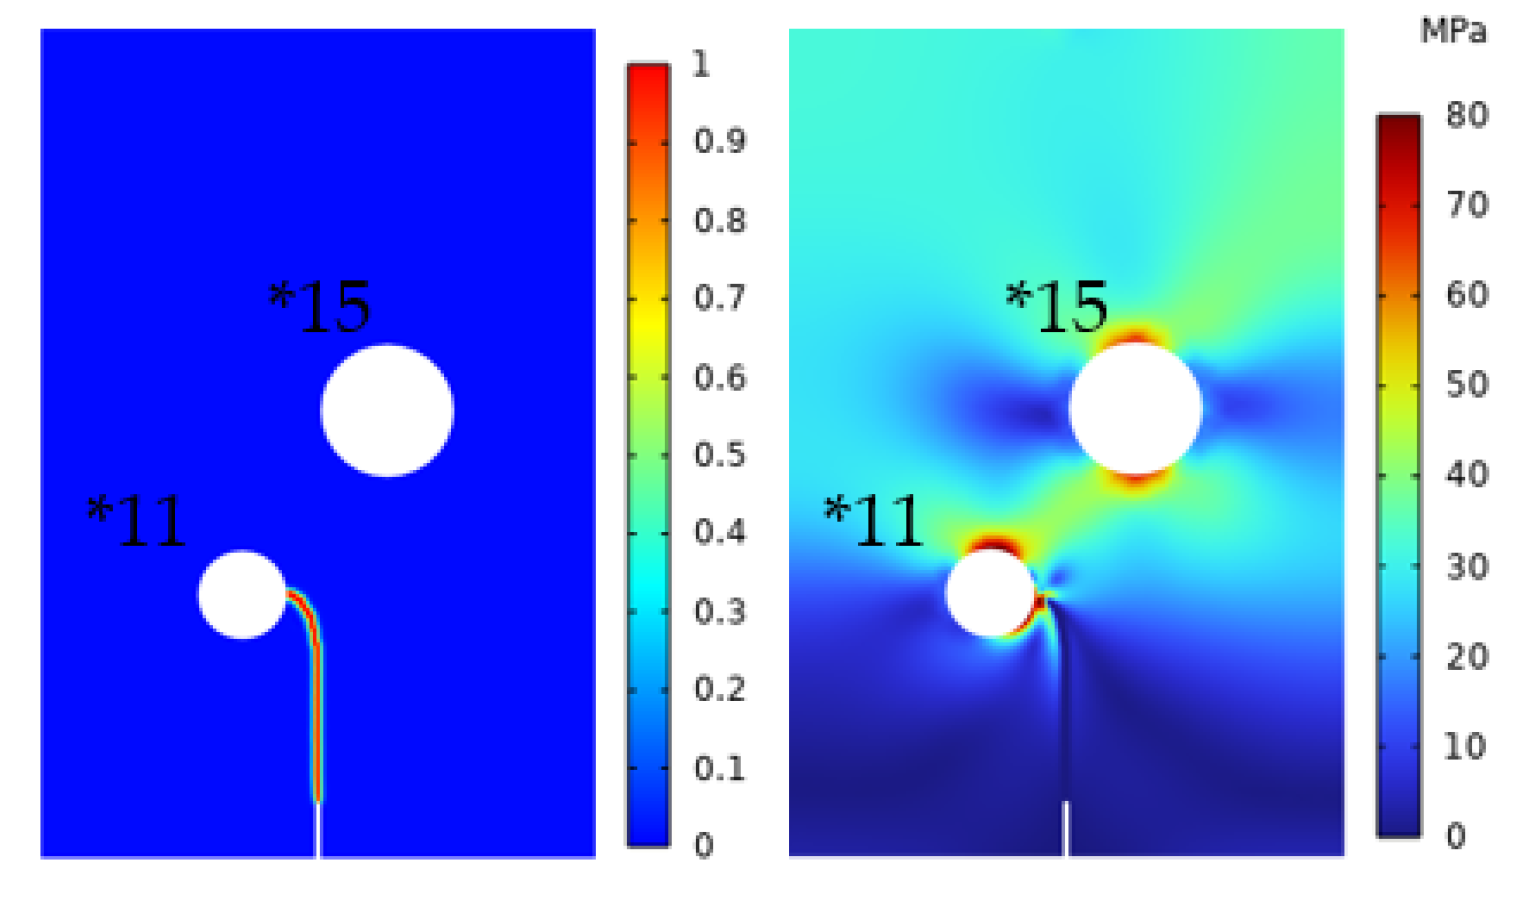
In order to verify the correctness of this principle, models *11 and *15 are simulated in
Table 1. Crack extension and Von Mises stress distribution are shown in 0. As it is observed that the crack also deflects toward pore with smaller D/r ratios
Figure 13.
(a) Models *11, *12 and (b) Models *13, *14 Crack extension and Von Mises stress.
Figure 13.
(a) Models *11, *12 and (b) Models *13, *14 Crack extension and Von Mises stress.
Figure 14.
(a) Models *6, *7 (b) Models *9, *10 Crack extension and Von Mises stress.
Figure 14.
(a) Models *6, *7 (b) Models *9, *10 Crack extension and Von Mises stress.
Figure 15.
Crack extension and Von Mises stress.
Figure 15.
Crack extension and Von Mises stress.
5. Conclusions
This study employed the PF-CZM to verify the SCB disk fracture test, revealing a strong concurrence between our simulations and experimental results. Additionally, we apply this model to analyze porous granite and compare the simulation results with previously studied experimental results, which demonstrates an extremely high agreement between these results. This underscores the remarkable effectiveness of the PF-CZM as a numerical tool for precisely forecasting porous rock crack propagation. This study offers a dependable numerical tool, enhancing our comprehension of porous rock characteristics and damage across diverse conditions.
To investigate the effects of pores and initial cracks on crack propagation, three different simulations are carried out.
(1) When considering a fixed D and a deflection angle of 90°, we conduct a detailed study on the effect of varying pore radii (r) (0.4 mm, 0.8 mm, and 1.2 mm, respectively) on the crack propagation. The findings reveal that, as r increases, the maximum reaction force gradually diminishes from 564 N to 514 N and 484 N, decreasing by 8% and 14%, respectively. This suggests that larger pore structures are less effective in impeding crack propagation compared to smaller pore structures. In other words, under identical loading conditions, larger pore structures are more likely to cause the generation and propagation of cracks.
(2) With a fixed r and a deflection angle of 90°, we study and discuss the crack propagation at different distances (D=1 mm, 1.5 mm, and 2 mm, respectively). Our analysis revealed two distinct states in the load-displacement curves. The first stage comprises crack propagation from its initiation to the lower edge of the pore, while the second stage involves crack propagation from the lower edge of the pore to the upper boundary of the model. In the first stage, as the crack extends towards the lower edge of the pore, the reaction force steadily increases. For D of 1 mm, 1.5 mm, and 2 mm, the maximum reaction forces are 440 N, 472 N, and 482 N, respectively, reflecting a respective 7% and 9% increase. However, after entering the second stage, where the crack spreads from the lower edge towards the upper boundary, a greater load is required to push the crack further. In this stage, the maximum reaction forces are 566 N, 543 N, and 522 N for D of 1 mm, 1.5 mm, and 2 mm, respectively, indicating a decrease of 4% and 7%. In summary, the resistance against crack growth gradually intensifies as the crack expands, and a larger pore-crack distance may lead to slightly higher reaction forces.
(3) We also delve into the effect of the pore-crack angle on crack propagation. In this study, we introduce the deflection angle as an evaluation index and conduct tests and analyses on 15 different models, resulting in multiple numerical combinations of the D/r ratio and the r value. The results demonstrate that, with a constant r, cracks tend to deflect towards the circular pore closer to the initial crack. When maintaining a constant D, the crack exhibits a preference for deflecting toward the circular pore with a larger r. However, a consistent rule emerges across all simulations: the crack consistently tends to deflect towards the circular pore with a smaller D/r ratio.
Author Contributions
Conceptualization, Q.S. and S.Z. (Shiyi Zhang); methodology, Q.S; software, S.Z. (Shiyi Zhang).; resources, Q.S.; writing—original draft preparation, (Shiyi Zhang).; writing—review and editing, Q.S.; funding acquisition, Q.S. All authors have read and agreed to the published version of the manuscript
Funding
This work was supported by the National Natural Science Foundation of China (Grant Nos. 12002230).
Institutional Review Board Statement
Not applicable.
Informed Consent Statement
Not applicable.
Data Availability Statement
The data presented in this study are available on request from the corresponding author.
Conflicts of Interest
The authors declare no conflict of interest.
References
- Rezanezhad, M.; Lajevardi, S. A.; Karimpouli, S. Effects of pore-crack relative location on crack propagation in porous media using XFEM method. Theoretical and Applied Fracture Mechanics. 2019, 103, 102241. [CrossRef]
- Basu, A.; Mishra, D. A. A method for estimating crack-initiation stress of rock materials by porosity. Journal of the Geological Society of India. 2014,84(4), 397–405. [CrossRef]
- Verma, A. K.; Saini, M. S.; Singh, T. N.; Dutt, A.; Bajpai, R. K. Effect of excavation stages on stress and pore pressure changes for an underground nuclear repository. Arabian Journal of Geosciences. 2013, 6(3), 635–645. [CrossRef]
- Chang, X.; Wang, S.; Li, Z.; Chang, F. Cracking behavior of concrete/rock bi-material specimens containing a parallel flaw pair under compression. Construction and Building Materials. 2022, 360, 129440. [CrossRef]
- Lisjak, A.; Kaifosh, P.; He, L.; Tatone, B. S. A.; Mahabadi, O. K.; Grasselli, G. A 2D, fully-coupled, hydro-mechanical, FDEM formulation for modelling fracturing processes in discontinuous, porous rock masses. Computers and Geotechnics. 2017 ,81, 1–18. [CrossRef]
- Jia, H.; Ding, S.; Zi, F.; Dong, Y.; Shen, Y. Evolution in sandstone pore structures with freeze-thaw cycling and interpretation of damage mechanisms in saturated porous rocks. CATENA. 2020,195, 104915. [CrossRef]
- Wu, Z.; Wong, L. N. Y. Frictional crack initiation and propagation analysis using the numerical manifold method. Computers and Geotechnics. 2012, 39, 38–53. [CrossRef]
- Haeri, H.; Sarfarazi, V.; Ebneabbasi, P.; Nazari Maram, A.; Shahbazian, A.; Fatehi Marji, M.; Mohamadi, A. R. XFEM and experimental simulation of failure mechanism of non-persistent joints in mortar under compression. Construction and Building Materials. 2020, 236, 117500. [CrossRef]
- Zhang, Y.; Yu, S.; Deng, H. Peridynamic model of deformation and failure for rock material under the coupling effect of multi-physical fields. Theoretical and Applied Fracture Mechanics. 2023, 125, 103912. [CrossRef]
- Mu, D.; Wen, A.; Zhu, D.; Tang, A.; Nie, Z.; Wang, Z. An improved smoothed particle hydrodynamics method for simulating crack propagation and coalescence in brittle fracture of rock materials. Theoretical and Applied Fracture Mechanics. 2022, 119, 103355. [CrossRef]
- Cen, D.; Liu, C.; Liu, C.; Huang, D. Crack propagation mechanism of single- and double-flawed rock specimens under tension–shear stress condition. Arabian Journal of Geosciences. 2022, 15(11), 1062. [CrossRef]
- Wang, W.; Zhu, Q.-Z.; Ni, T.; Vazic, B.; Newell, P.; Bordas, S. P. A. An extended peridynamic model equipped with a new bond-breakage criterion for mixed-mode fracture in rock-like materials. Computer Methods in Applied Mechanics and Engineering. 2023, 411, 116016. [CrossRef]
- Mohtarami, E.; Baghbanan, A.; Eftekhari, M.; Hashemolhosseini, H. Investigating of chemical effects on rock fracturing using extended finite element method. Theoretical and Applied Fracture Mechanics. 2017, 89, 110–126. [CrossRef]
- Li, P.; Li, W.; Fan, H.; Wang, Q.; Zhou, K. A phase-field framework for brittle fracture in quasi-crystals. International Journal of Solids and Structures. 2023, 279, 112385. [CrossRef]
- Francfort, G. A.; Marigo, J.-J. Revisiting brittle fracture as an energy minimization problem. Journal of the Mechanics and Physics of Solids. 1998, 46(8), 1319–1342. [CrossRef]
- Bourdin, B.; Francfort, G. A.; Marigo, J.-J. The Variational Approach to Fracture. Journal of Elasticity. 2008, 91(1–3), 5–148. [CrossRef]
- Wu, J.-Y.; Nguyen, V. P. A length scale insensitive phase-field damage model for brittle fracture. Journal of the Mechanics and Physics of Solids. 2018, 119, 20–42. [CrossRef]
- Duan, J.; Zhou, S.; Xia, C.; Xu, Y. A dynamic phase field model for predicting rock fracture diversity under impact loading. International Journal of Impact Engineering. 2023, 171, 104376. [CrossRef]
- Liu, S.; Wang, Y.; Peng, C.; Wu, W. A thermodynamically consistent phase field model for mixed-mode fracture in rock-like materials. Computer Methods in Applied Mechanics and Engineering. 2022, 392, 114642. [CrossRef]
- Li, H.; Wang, W.; Cao, Y.; Liu, S.; Zeng, T.; Shao, J. A hybrid phase-field method for modeling mixed-mode fractures in elastoplastic rock-like materials. Computers and Geotechnics. 2023, 160, 105523. [CrossRef]
- Xu, Y.; Zhou, S.; Xia, C.; Hu, Y. A new phase field model for mixed-mode brittle fractures in rocks modified from triple shear energy criterion. Acta Geotechnica. 2022, 17(12), 5613–5637. [CrossRef]
- Wu, J.-Y. A geometrically regularized gradient-damage model with energetic equivalence. Computer Methods in Applied Mechanics and Engineering. 2018, 328, 612–637. [CrossRef]
- Wu, J.-Y. Robust numerical implementation of non-standard phase-field damage models for failure in solids. Computer Methods in Applied Mechanics and Engineering. 2018, 340, 767–797. [CrossRef]
- Feng, D.-C.; Wu, J.-Y. Phase-field regularized cohesive zone model (CZM) and size effect of concrete. Engineering Fracture Mechanics. 2018, 197, 66–79. [CrossRef]
- Borden, M. J.; Hughes, T. J. R.; Landis, C. M.; Anvari, A.; Lee, I. J. A phase-field formulation for fracture in ductile materials: Finite deformation balance law derivation, plastic degradation, and stress triaxiality effects. Computer Methods in Applied Mechanics and Engineering. 2016, 312, 130–166. [CrossRef]
- Pham, K. H.; Ravi-Chandar, K. The formation and growth of echelon cracks in brittle materials. International Journal of Fracture. 2017, 206(2), 229–244. [CrossRef]
- Tanné, E.; Li, T.; Bourdin, B.; Marigo, J.-J.; Maurini, C. Crack nucleation in variational phase-field models of brittle fracture. Journal of the Mechanics and Physics of Solids. 2018, 110, 80–99. [CrossRef]
- Wu, J.-Y.; Nguyen, V. P. A length scale insensitive phase-field damage model for brittle fracture. Journal of the Mechanics and Physics of Solids. 2018, 119, 20–42. [CrossRef]
- Borden, M. J.; Verhoosel, C. V.; Scott, M. A.; Hughes, T. J. R.; Landis, C. M. A phase-field description of dynamic brittle fracture. Computer Methods in Applied Mechanics and Engineering. 2012, 217–220, 77–95. [CrossRef]
- Schlüter, A.; Willenbücher, A.; Kuhn, C.; Müller, R. Phase field approximation of dynamic brittle fracture. Computational Mechanics. 2014, 54(5), 1141–1161. [CrossRef]
- Lee, S.; Wheeler, M. F.; Wick, T. Pressure and fluid-driven fracture propagation in porous media using an adaptive finite element phase field model. Computer Methods in Applied Mechanics and Engineering. 2016, 305, 111–132. [CrossRef]
- Miehe, C.; Mauthe, S. Phase field modeling of fracture in multi-physics problems. Part III. Crack driving forces in hydro-poro-elasticity and hydraulic fracturing of fluid-saturated porous media. Computer Methods in Applied Mechanics and Engineering. 2016, 304, 619–655. [CrossRef]
- Areias, P.; Rabczuk, T.; Msekh, M. A. Phase-field analysis of finite-strain plates and shells including element subdivision. Computer Methods in Applied Mechanics and Engineering. 2016, 312, 322–350. [CrossRef]
- Mandal, T. K.; Nguyen, V. P.; Wu, J.-Y. A length scale insensitive anisotropic phase field fracture model for hyperelastic composites. International Journal of Mechanical Sciences. 2020, 188, 105941. [CrossRef]
- Miehe, C.; Schänzel, L.-M. Phase field modeling of fracture in rubbery polymers. Part I: Finite elasticity coupled with brittle failure. Journal of the Mechanics and Physics of Solids. 2014, 65, 93–113. [CrossRef]
- Wong, L. N. Y.; Einstein, H. H. Crack Coalescence in Molded Gypsum and Carrara Marble: Part 1. Macroscopic Observations and Interpretation. Rock Mechanics and Rock Engineering. 2009, 42(3), 475–511. [CrossRef]
- Wong, L. N. Y.; Einstein, H. H. Crack Coalescence in Molded Gypsum and Carrara Marble: Part 2—Microscopic Observations and Interpretation. Rock Mechanics and Rock Engineering. 2009, 42(3), 513–545. [CrossRef]
- Wu, J.-Y., Mandal; T. K.; Nguyen, V. P. A phase-field regularized cohesive zone model for hydrogen assisted cracking. Computer Methods in Applied Mechanics and Engineering. 2020, 358, 112614. [CrossRef]
- Bourdin, B.; Francfort, G. A.; Marigo, J.-J. Numerical experiments in revisited brittle fracture. Journal of the Mechanics and Physics of Solids. 2000, 48(4), 797–826. [CrossRef]
- Zhang, J.; Sudo Lutif Teixeira, J. E.; Little, D. N.; Kim, Y.-R. Prediction of fatigue crack growth behavior of chemically stabilized materials using simple monotonic fracture test integrated with computational cohesive zone modeling. Composites Part B: Engineering. 2020, 200, 108367. [CrossRef]
- Simone, A. Partition of unity-based discontinuous elements for interface phenomena: Computational issues. Communications in Numerical Methods in Engineering. 2004, 20(6), 465–478. [CrossRef]
- De Borst, R.; Verhoosel, C. V. Gradient damage vs phase-field approaches for fracture: Similarities and differences. Computer Methods in Applied Mechanics and Engineering. 2016, 312, 78–94. [CrossRef]
- Lu, G.; Chen, J. A new nonlocal macro-meso-scale consistent damage model for crack modeling of quasi-brittle materials. Computer Methods in Applied Mechanics and Engineering. 2020, 362, 112802. [CrossRef]
- Liu, Z.; Ma, C.; Wei, X.; Xie, W. Experimental study on mechanical properties and failure modes of pre-existing cracks in sandstone during uniaxial tension/compression testing. Engineering Fracture Mechanics. 2021, 255, 107966. [CrossRef]
- Wu, J.-Y. A unified phase-field theory for the mechanics of damage and quasi-brittle failure. Journal of the Mechanics and Physics of Solids. 2017, 103, 72–99. [CrossRef]
- Mandal, T. K.; Nguyen, V. P.; Wu, J.-Y. Length scale and mesh bias sensitivity of phase-field models for brittle and cohesive fracture. Engineering Fracture Mechanics. 2019, 217, 106532. [CrossRef]
- Wu, J.-Y.; Nguyen, V. P.; Zhou, H.; Huang, Y. A variationally consistent phase-field anisotropic damage model for fracture. Computer Methods in Applied Mechanics and Engineering. 2020, 358, 112629. [CrossRef]
- Loew, P. J.; Peters, B.; Beex, L. A. A. Fatigue phase-field damage modeling of rubber using viscous dissipation: Crack nucleation and propagation. Mechanics of Materials. 2020, 142, 103282. [CrossRef]
- Sarac, B.; Schroers, J. Designing tensile ductility in metallic glasses. Nature Communications. 2013, 4(1), 2158. [CrossRef]
|
Disclaimer/Publisher’s Note: The statements, opinions and data contained in all publications are solely those of the individual author(s) and contributor(s) and not of MDPI and/or the editor(s). MDPI and/or the editor(s) disclaim responsibility for any injury to people or property resulting from any ideas, methods, instructions or products referred to in the content. |
© 2023 by the authors. Licensee MDPI, Basel, Switzerland. This article is an open access article distributed under the terms and conditions of the Creative Commons Attribution (CC BY) license (http://creativecommons.org/licenses/by/4.0/).
