Submitted:
31 October 2023
Posted:
31 October 2023
You are already at the latest version
Abstract
Keywords:
1. Introduction
2. Materials and Methods
2.1. Selection of Genotypes and Seed Collection
2.2. Solution Preparation and Plant Growth
2.3. Statistical Analysis
3. Results
3.1. High SAR Reduced Seedling Emergence
3.2. Root Length, Root Mass and Shoot Mass Were Also Reduced
3.3. Elemental concentrations in root tissues
3.4. Elemental concentrations in the YML tissues
3.5. Relationship between Root and Shoot DM and Root Length
3.6. Comparison between Traits
4. Discussion
4.1. Ca deficiency in the roots contributed to reduced growth at high SAR
4.2. Nutritional imbalances in the shoot
4.3. Is growth in sodic soils related to tolerance to ion imbalances?
5. Conclusions
Supplementary Materials
Author Contributions
Funding
Data Availability Statement
Acknowledgments
Conflicts of Interest
References
- Rengasamy, P.; Olsson, K.A. Sodicity and soil structure. Australian Journal of Soil Research 1991, 29, 935-952. [CrossRef]
- Orton, T.G.; Mallawaarachchi, T.; Pringle, M.J.; Menzies, N.W.; Dalal, R.C.; Kopittke, P.M.; Searle, R.; Hochman, Z.; Dang, Y.P. Quantifying the economic impact of soil constraints on Australian agriculture: A case-study of wheat. Land Degradation & Development 2018, 29, 3866-3875.
- Rengasamy, P. Transient salinity and subsoil constraints to dryland farming in Australian sodic soils: an overview. Animal Production Science 2002, 42, 351-361. [CrossRef]
- Houghton, P.D.; Charman, P.E.V. Glossary of terms used in soil conservation; Soil Conservation Service of NSW: 1986.
- Läuchli, A.; Epstein, E. Plant responses to saline and sodic conditions. Agricultural Salinity Assessment and Management 1990, 71, 113-137. [CrossRef]
- Thimmappa, K.; Singh, Y.P.; Raju, R. Reclamation of sodic soils in India: An economic impact assessment. In Bioremediation of Salt Affected Soils: An Indian Perspective., Arora S., Singh A., Y., S., Eds.; Springer, Cham: 2017. [CrossRef]
- Agassi, M.; Morin, J.; Sheinberg, I. Effect of raindrop impact energy and water salinity on infiltration rates of sodic soils. Soil Science Society of America Journal 1985, 49, 186-190. [CrossRef]
- Rao, P.; Mishra, B.; Gupta, S. Effects of soil salinity and sodicity on grain quality of tolerant, semi-tolerant and sensitive rice genotypes. Rice Science 2013, 20, 284-291. [CrossRef]
- Reuter, D.; Robinson, J.B. Plant Analysis: An Interpretation Manual; CSIRO publishing: 1997.
- Wakeel, A. Potassium–sodium interactions in soil and plant under saline-sodic conditions. Journal of Plant Nutrition and Soil Science 2013, 176, 344-354. [CrossRef]
- Rochester, I. Phosphorus, and potassium nutrition of cotton: interaction with sodium Crop and Pasture Science 2010, 61, 821-834. [CrossRef]
- Dodd, K.; Guppy, C.; Lockwood, P.; Rochester, I. The effect of sodicity on cotton: Plant response to solutions containing high sodium concentrations. Plant and Soil 2010, 330, 239-249. [CrossRef]
- Porcelli, C.A.; Flavio, H.G.B.; Raul, S.L. The K/Na and Ca/Na ratios and rapeseed yield, under soil salinity or sodicity. Plant and Soil 1995, 175, 251-255. [CrossRef]
- Dang, Y.; Mehla, A.; Chhabra, R.; Kumar, S. Sodicity induced yield losses and changes in mineral concentration of sugarcane genotypes. In Proceedings of the International Society of Sugar Cane Technologists XXIII Congress, 1999; pp. 89-97.
- Qadar, A. Potassium and sodium contents of shoot and lamine of rice cultivars and their sodicity tolerance. Journal of Plant Nutrition 1995 18, 2281-2290. [CrossRef]
- Rahi, T.S.; Singh, K.; Singh, B. Screening of sodicity tolerance in aloe vera: An industrial crop for utilization of sodic lands. Industrial Crops and Products 2013, 44, 528-533. [CrossRef]
- Dang, Y.P.; Christopher, J.; Dalal, R.C. Genetic diversity in barley and wheat for tolerance to soil constraints. Agronomy Journal 2016, 6. [CrossRef]
- Chhipa, B.; Lal, P. Na/K ratios as the basis of salt tolerance in wheat. Australian Journal of Agricultural Research 1995, 46, 533-539. [CrossRef]
- Wright, D.; Rajper, I. An assessment of relative effects of adverse physical and chemical properties of sodic soil on the growth and yield of wheat (Triticum aestivum L.). Plant and soil 2000, 223, 277-285. [CrossRef]
- Naidu, R.; Rengasamy, P. Ion interactions and constrains to plant nutrition in Australian sodic soils Soil Research 1993, 31, 801-819. [CrossRef]
- Curtin, D.; Naidu, R. Fertility constraints to plant production. In Sodic Soils: Distribution, Properties, Management and Environmental Consequences, Sumner, M.E., Naidu, R., Eds.; Oxford University Press: New York, 1999.
- Jayawardane, N.; Chan, K. The management of soil physical properties limiting crop production in Australian sodic soils-a review. Soil Research 1994, 32, 13-44. [CrossRef]
- Chartres, C.J. Sodic Soils: an introduction to their formation and distribution in Australia. Australian Journal of Soil Research 1993, 31, 751-760. [CrossRef]
- Richard, R. Current, and emerging environmental challenges in Australian agriculture - The role of plant breeding. Crop and Pasture Science 2002, 53, 881-892.
- Dang, Y.; Dalal, R.C.; Routley, R.; Schwenke, G.D.; Daniel, I. Subsoil constraints to grain production in the cropping soils of the north easter region of Australia: an overview. Australian Journal of Experimental Agriculture 2006, 46, 19-35.
- Gorham, J.; Bridges, J.; Dubcovsky, J.; Dvorak, J.; Hollington, P.; Luo, M.C.; Khan, J. Genetic analysis and physiology of a trait for enhanced K+/Na+ discrimination in wheat. New Phytologist 1997, 137, 109-116. [CrossRef]
- Anzooman, M.; Christopher, J.; Mumford, M.; Dang, Y.P.; Menzies, N.W.; Kopittke, P.M. Selection for rapid germination and emergence may improve wheat seedling establishment in the presence of soil surface crusts. Plant and Soil 2018, 426, 227-239. [CrossRef]
- Anzooman, M.; Dang, Y.P.; Christopher, J.; Mumford, M.H.; Menzies, N.W.; Kopittke, P.M. Greater emergence force and hypocotyl cross sectional area may improve wheat seedling emergence in sodic conditions Plant Science 2018, 277, 188-195. [CrossRef]
- Sumner, M.E.; Miller, W.P. Cation-exchange capacity and exchange coefficients. In Methods of Soil Analysis, Sparks, D.L., Ed.; American Society of Agronomy, Madison, WI: 1996.
- Patterson, H.; Thompson, R. Recovery of inter-block information when block sizes are unequal. Biometrika 1971, 58, 545-554. [CrossRef]
- Butler, D.; Ciullis, B.; Gilmour, A.; Gogel, B. ASReml-R reference manual; The State of Queensland, Department of Primary Industries and Fisheries, Brisbane: 2009.
- R Core Team. R: A Language and Environment for Statistical Computing. 2017.
- Kopittke, P.M.; Blamey, F.P.C.; Kinraide, T.B.; Wang, P.; Reichman, S.M.; Menzies, N.W. Separating multiple, short-term, deleterious effects of saline solutions on the growth of cowpea seedlings. New Phytologist 2011, 189, 1110-1121. [CrossRef]
- Anzooman, M.; Christopher, J.; Dang, Y.P.; Taylor, J.; Menzies, N.W.; Kopittke, P.M. Chemical and physical influence of sodic soils on the coleoptile length and root growth angle of wheat genotypes. Annals of Botany 2019, 124, 1043-1052. [CrossRef]
- Grattan, S.R.; Grieve, C.M. Mineral nutrient acquisition and response by plants grown in saline environments In Handbook of Plant and Crop Stress, Pressarakli, M., Ed.M.Dekker, Ed.; 1993.
- Grattan, S.R.; Grieve, C.M. Salinity–mineral nutrient relations in horticultural crops. Scientia horticulturae 1998, 78, 127-157. [CrossRef]
- Huang, J.; Redmann, R. Responses of growth, morphology, and anatomy to salinity and calcium supply in cultivated and wild barley. Canadian Journal of Botany 1995, 73, 1859-1866. [CrossRef]
- Peverill, K.; Sparrow, L.; Reuter, D. Soil analysis: an interpretation manual; CSIRO publishing: 1999.
- Kurth, E.; Cramer, G.R.; Läuchli, A.; Epstein, E. Effects of NaCl and CaCl2 on cell enlargement and cell production in cotton roots. Plant Physiology 1986, 82, 1102-1106. [CrossRef]
- Munns, R. Comparative physiology of salt and water stress. Plant, Cell, and Environment 2002, 25, 239-250. [CrossRef]
- Cramer, G.R.; Läuchli, A. Ion activities in solution in relation to Na+− Ca2+ interactions at the plasmalemma. Journal of Experimental Botany 1986, 37, 321-330.
- Dang, Y.P.; Dalal, R.C.; Buck, S.R.; Harms, B.; Kelly, R.; Hochman, Z.; Schwenke, G.D.; Biggs, A.; Ferguson, N.; Norrish, S. Diagnosis, extent, impacts, and management of subsoil constraints in the northern grains cropping region of Australia. Soil Research 2010, 48, 105-119. [CrossRef]
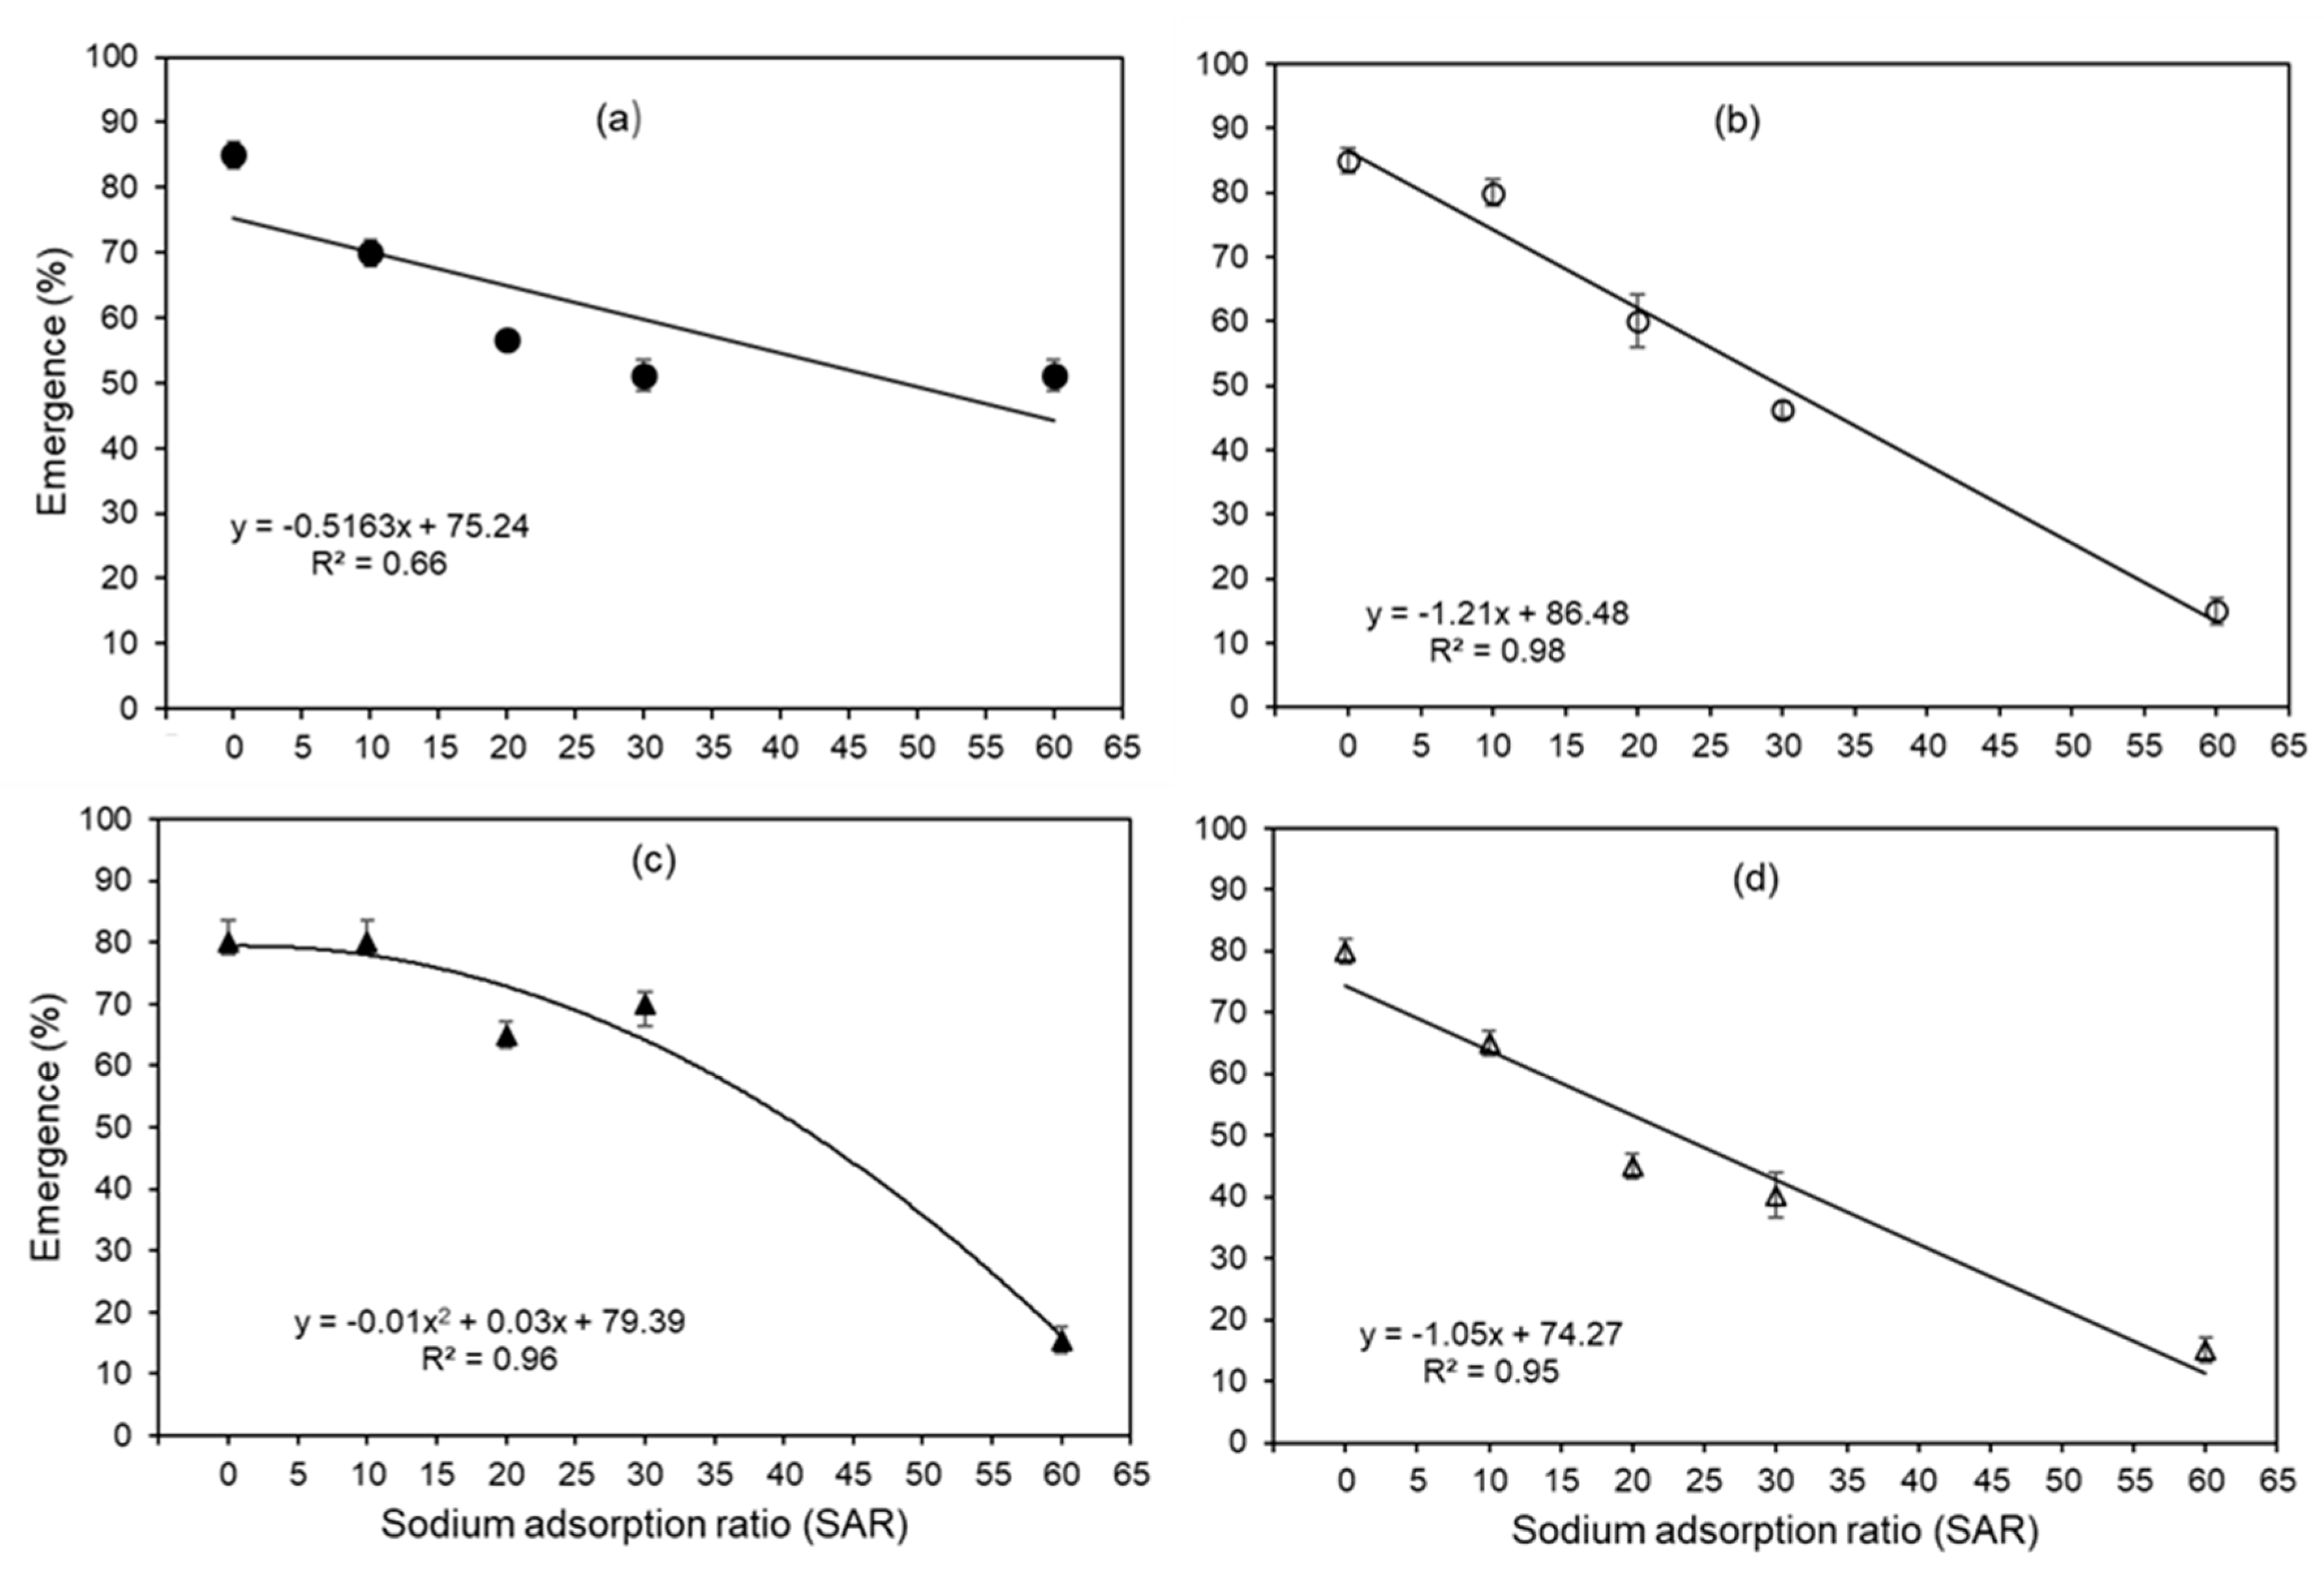
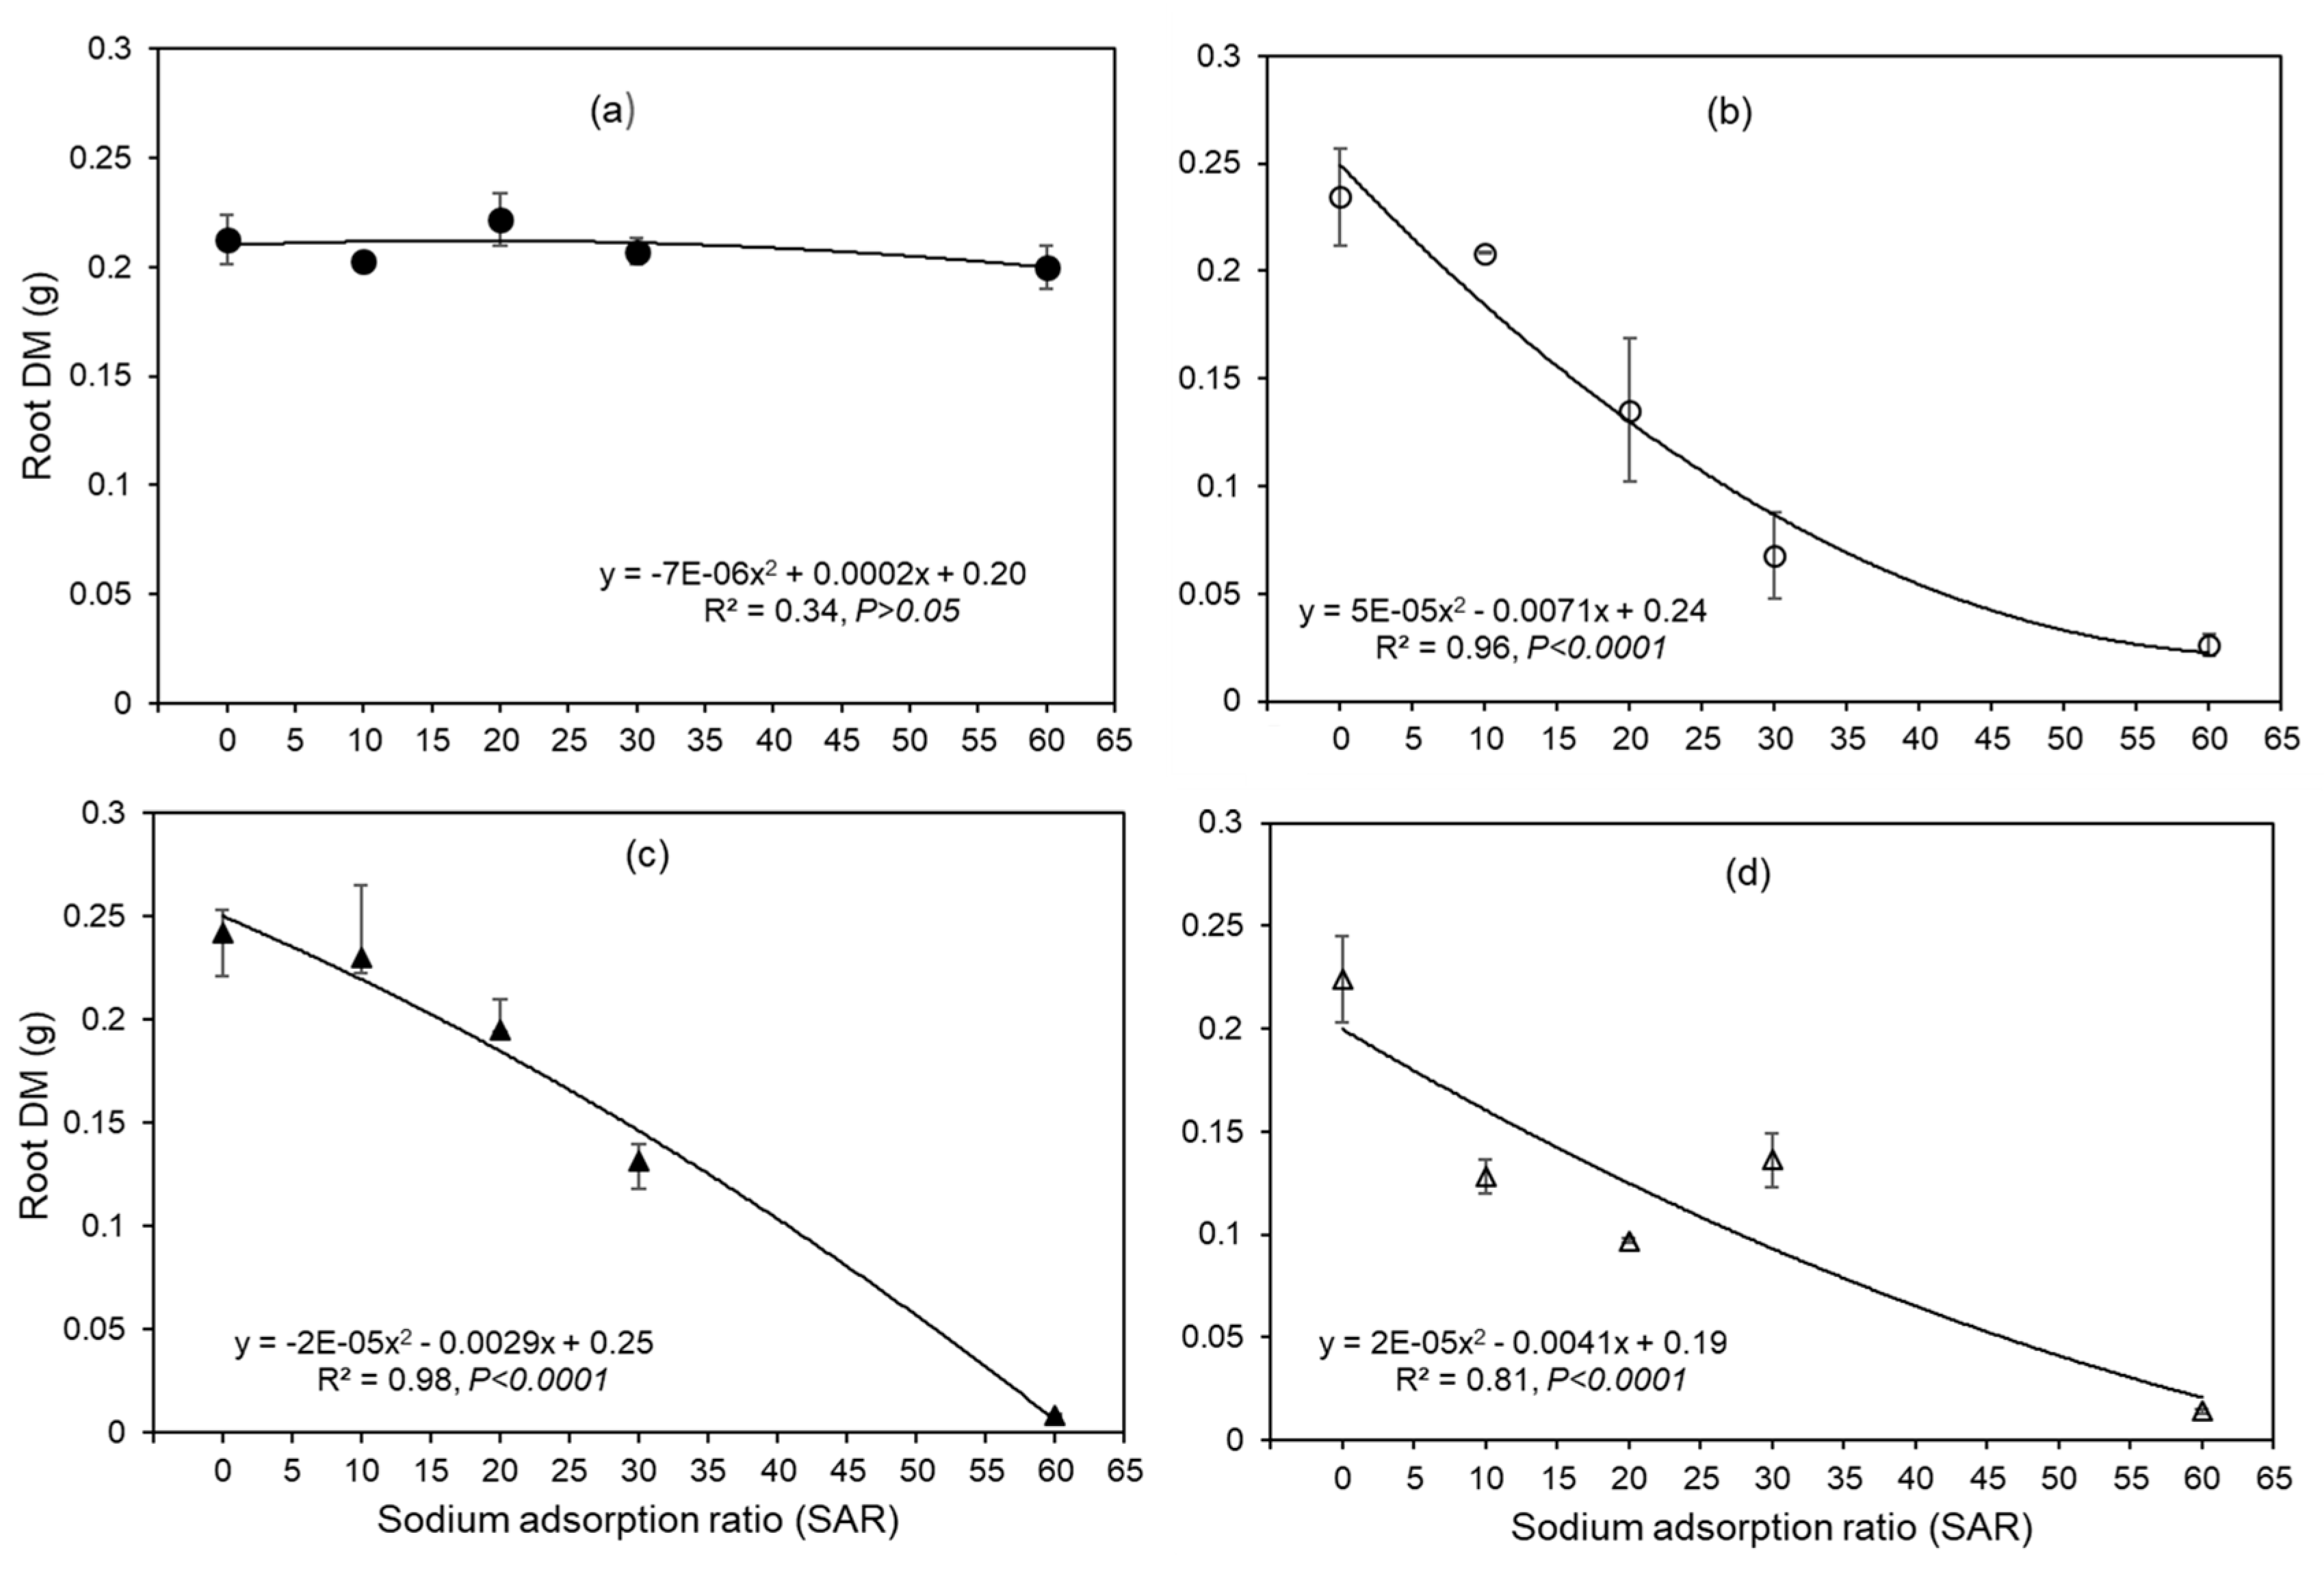
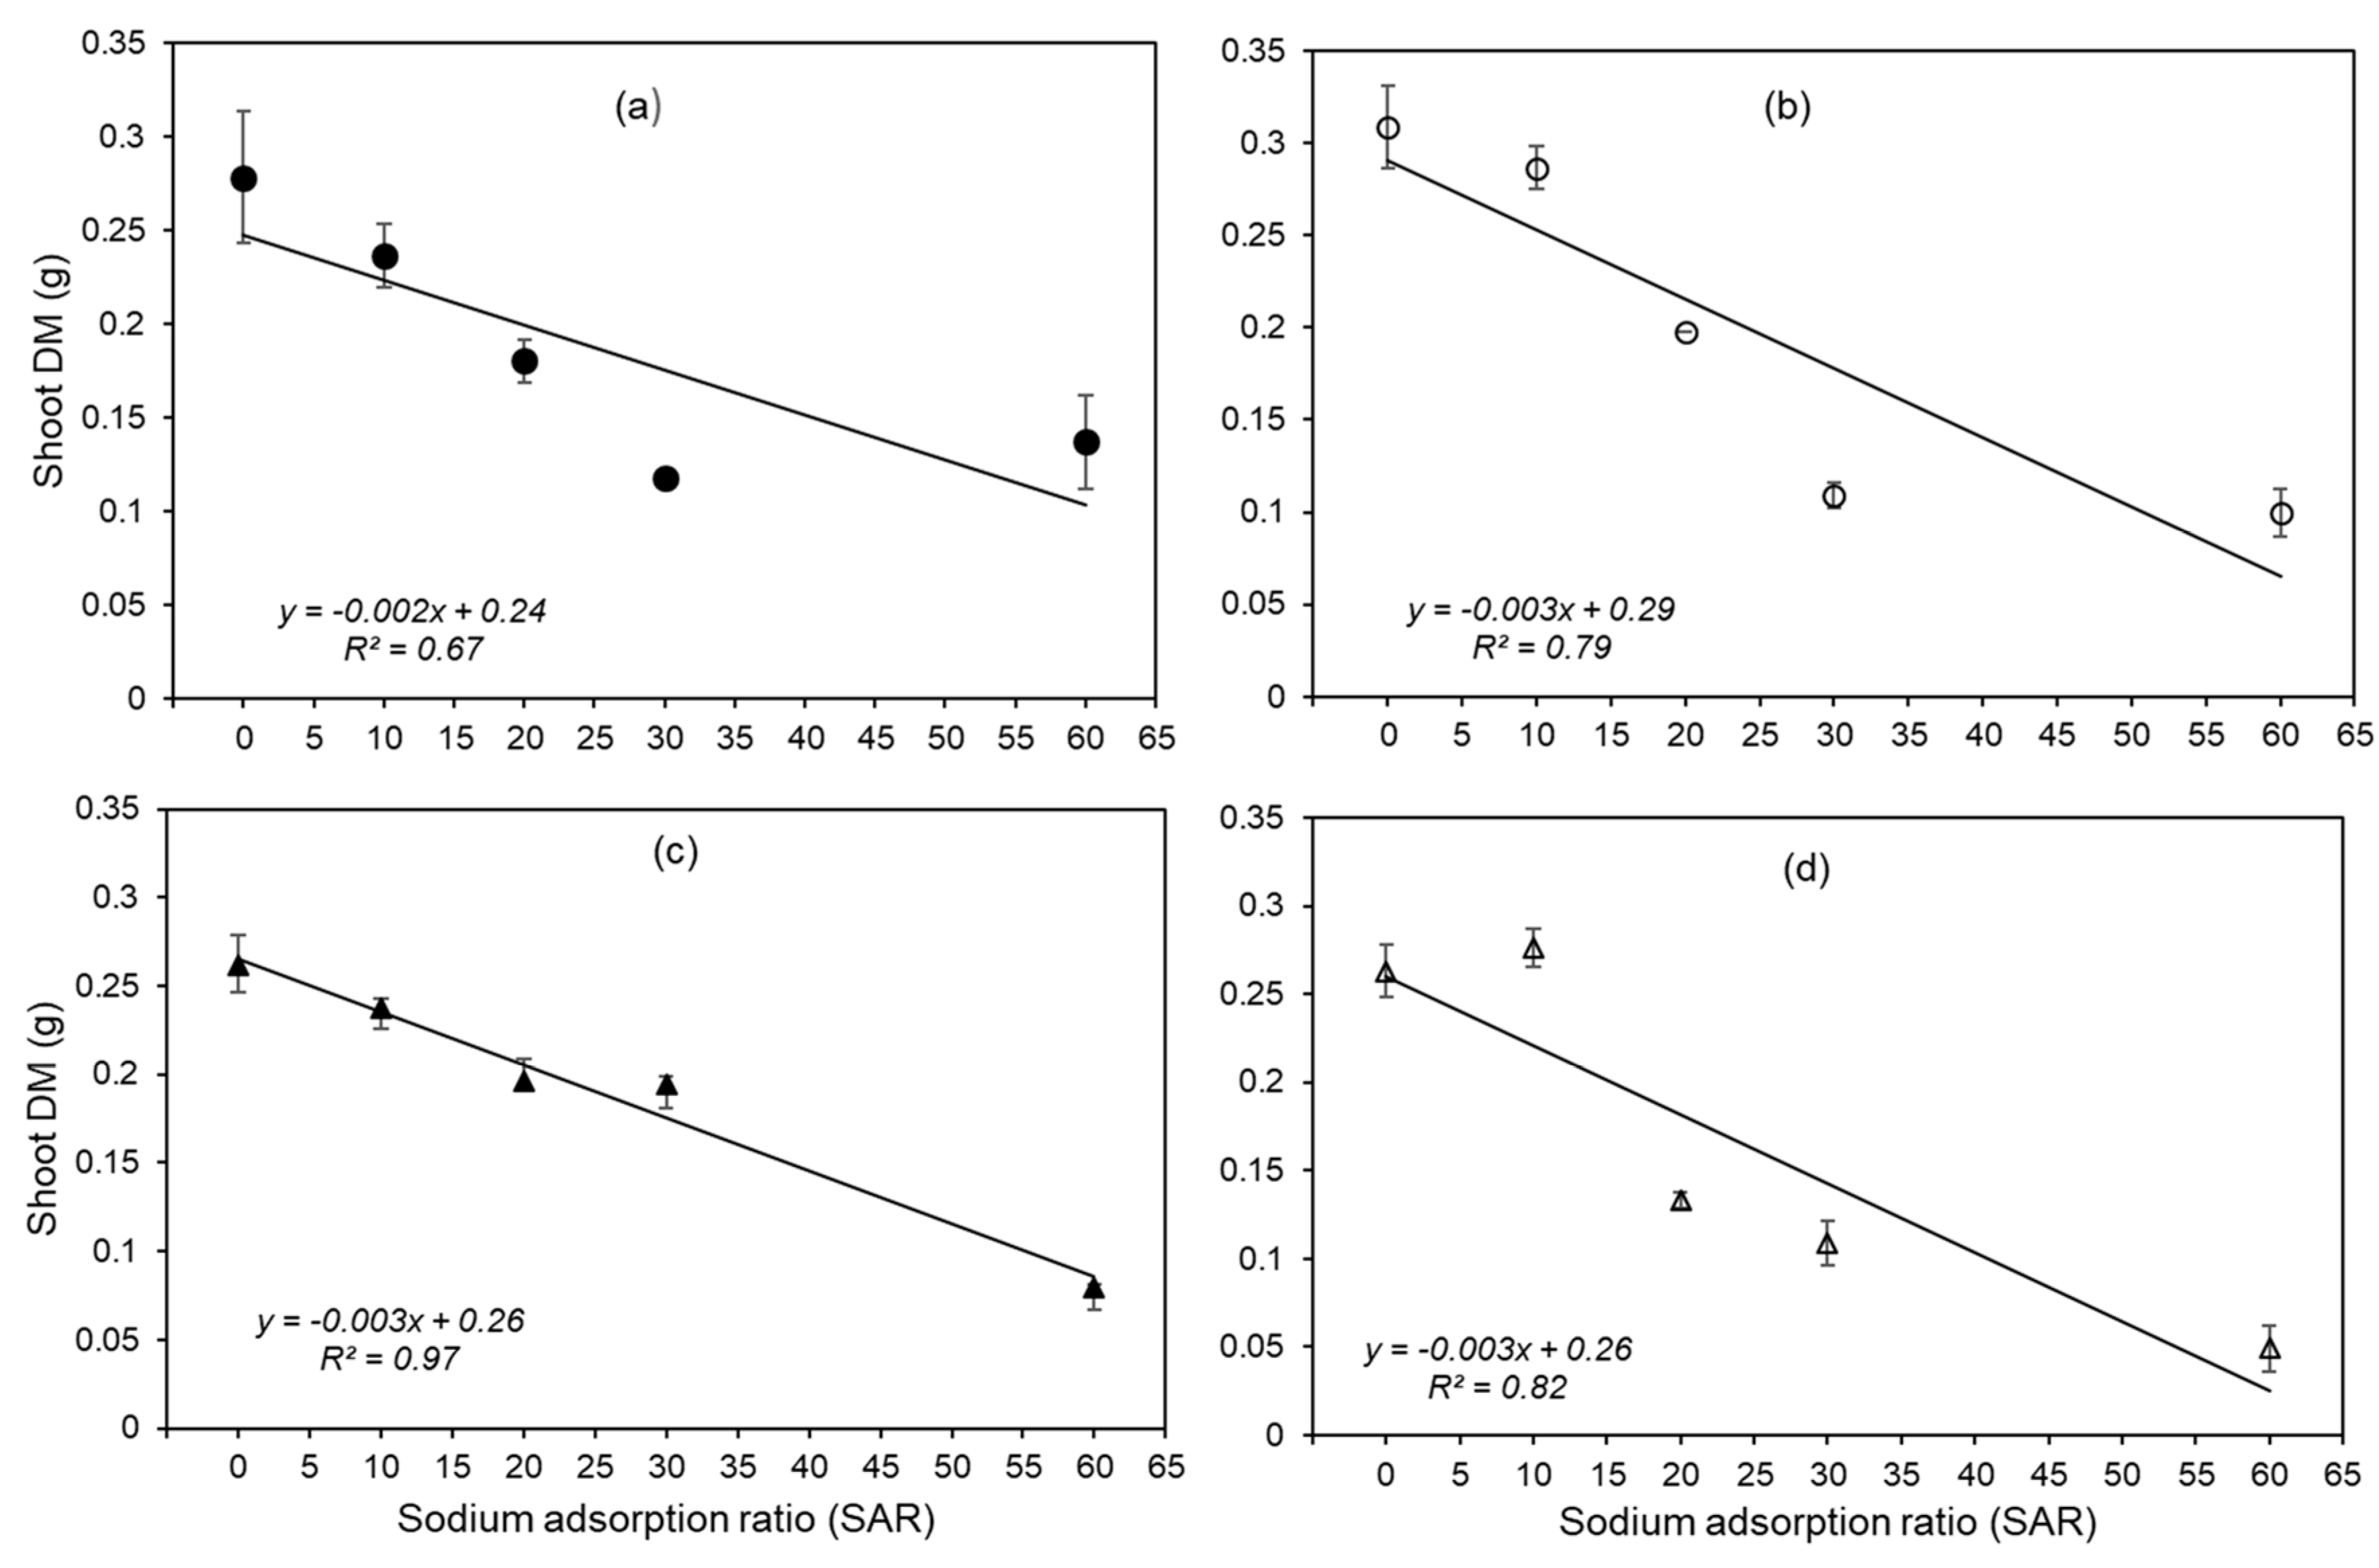
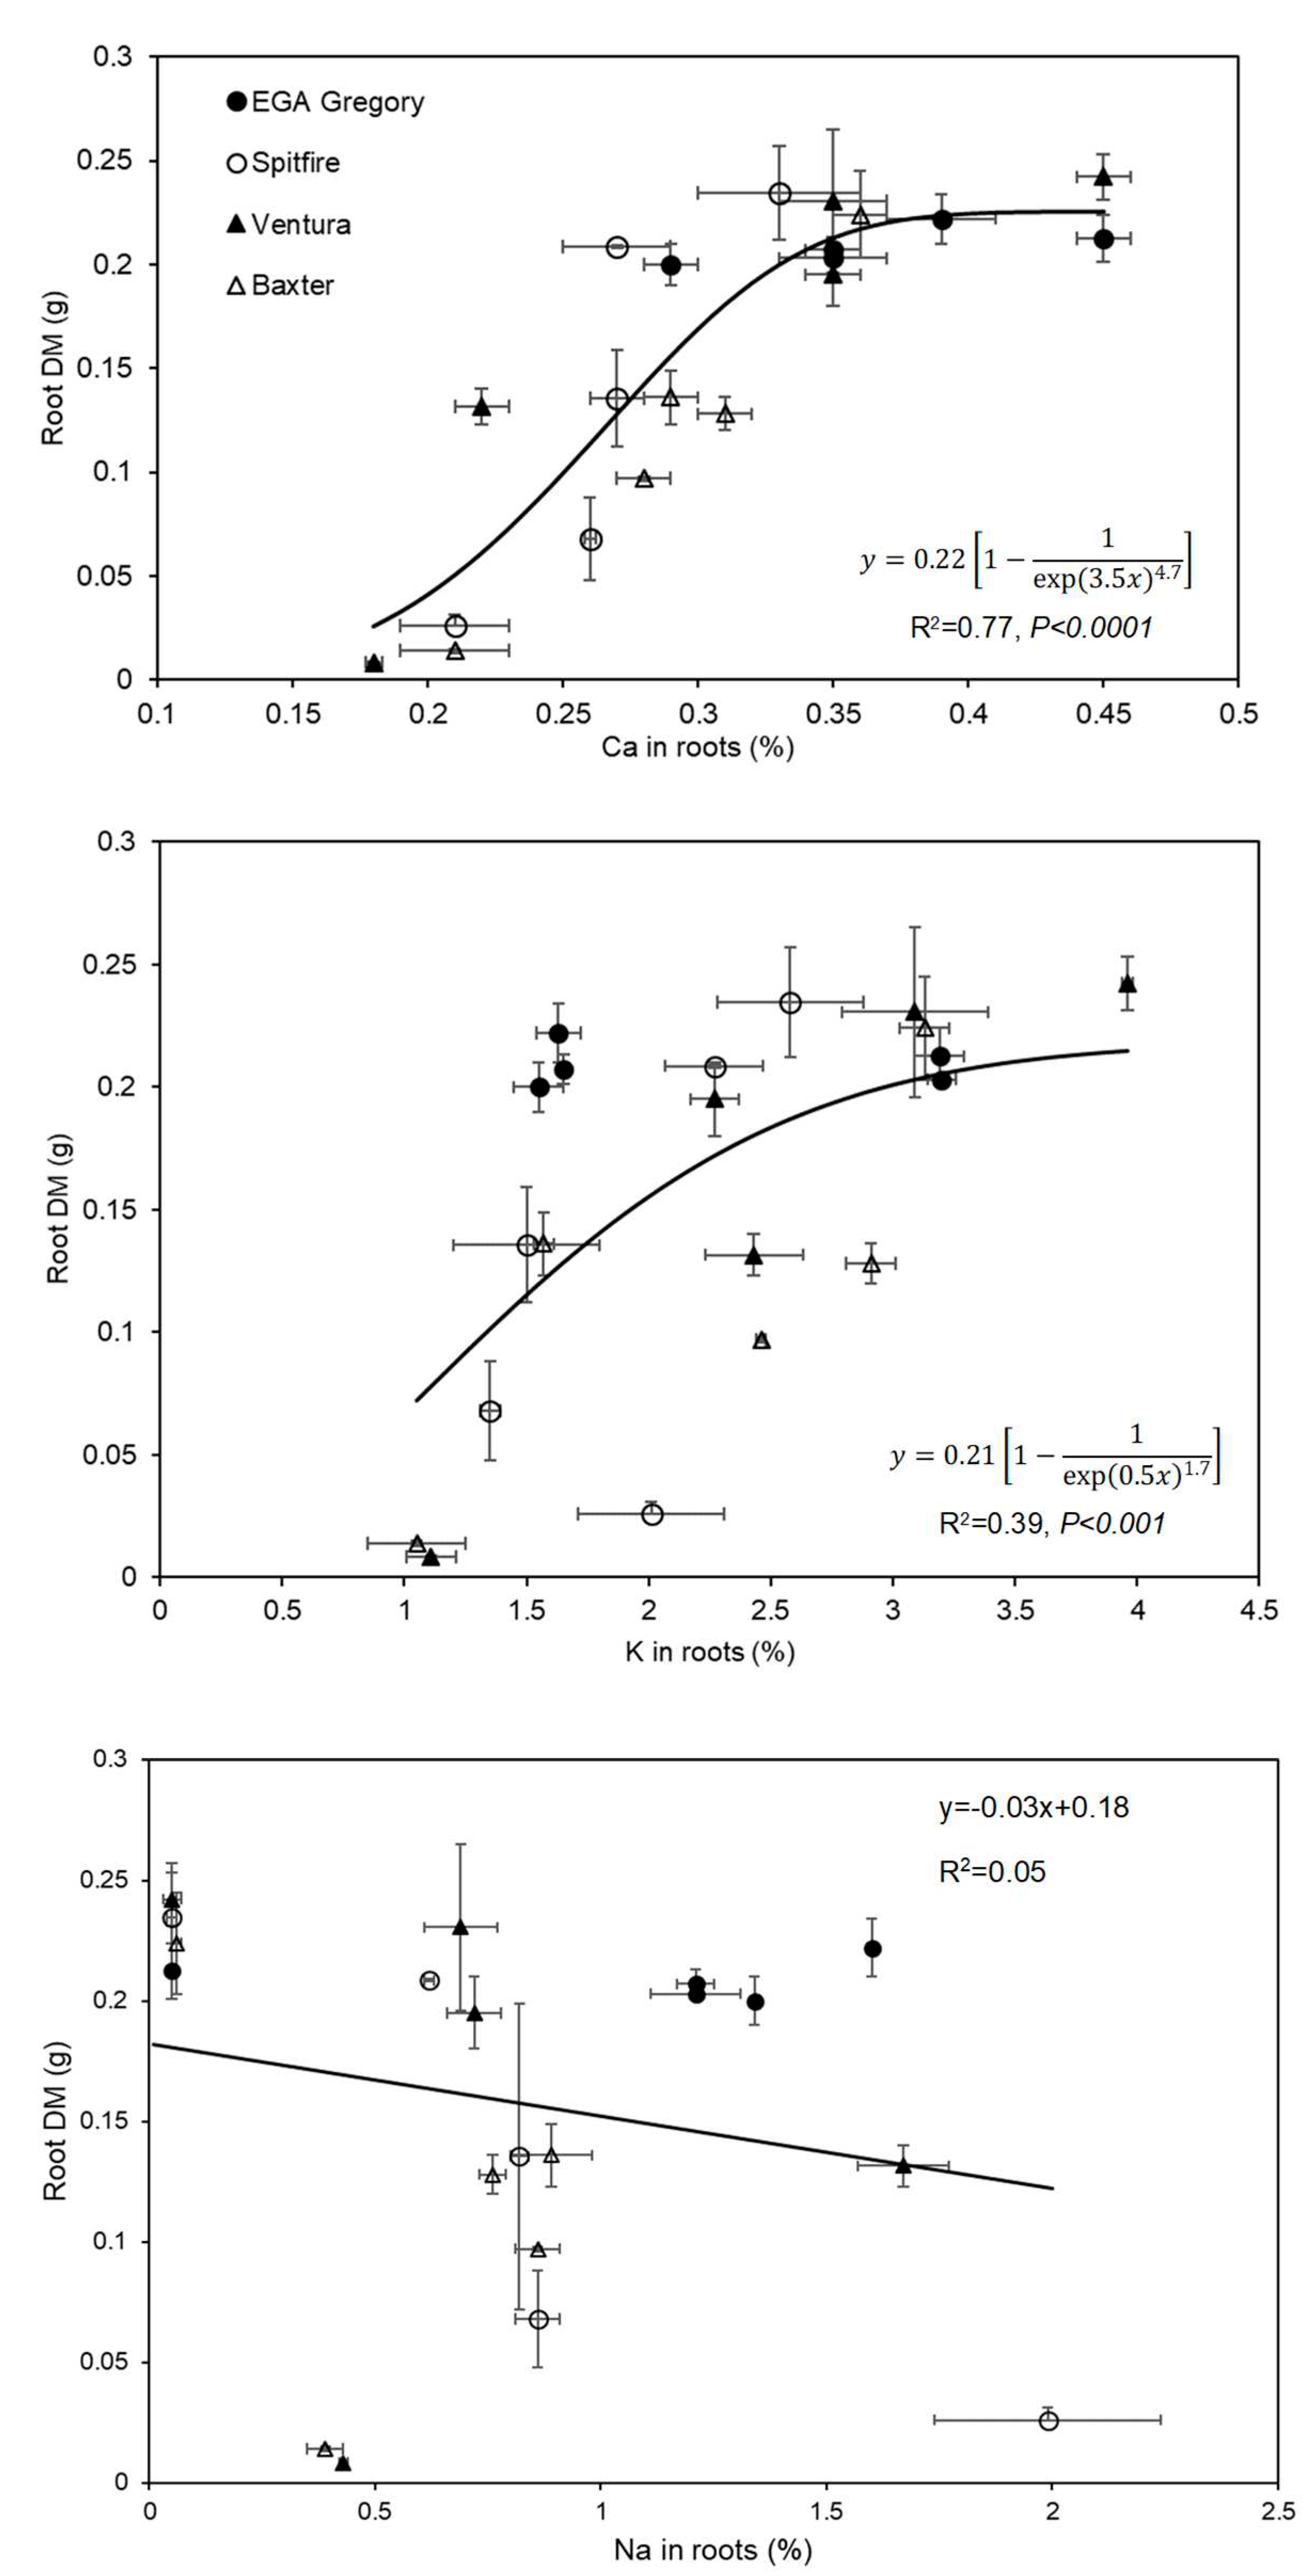
| SAR |
I mM |
NaCl mM |
Na2SO4 mM |
CaCl2.2H2O mM |
CaSO4.2H2O mM |
|---|---|---|---|---|---|
| 0 | 31 | 0.10 | 0.10 | 4.00 | 7.00 |
| 10 | 31 | 5.80 | 5.80 | 1.50 | 1.50 |
| 20 | 31 | 7.00 | 7.00 | 0.55 | 0.55 |
| 30 | 31 | 7.70 | 7.70 | 0.30 | 0.30 |
| 60 | 31 | 8.00 | 8.00 | 0.08 | 0.08 |
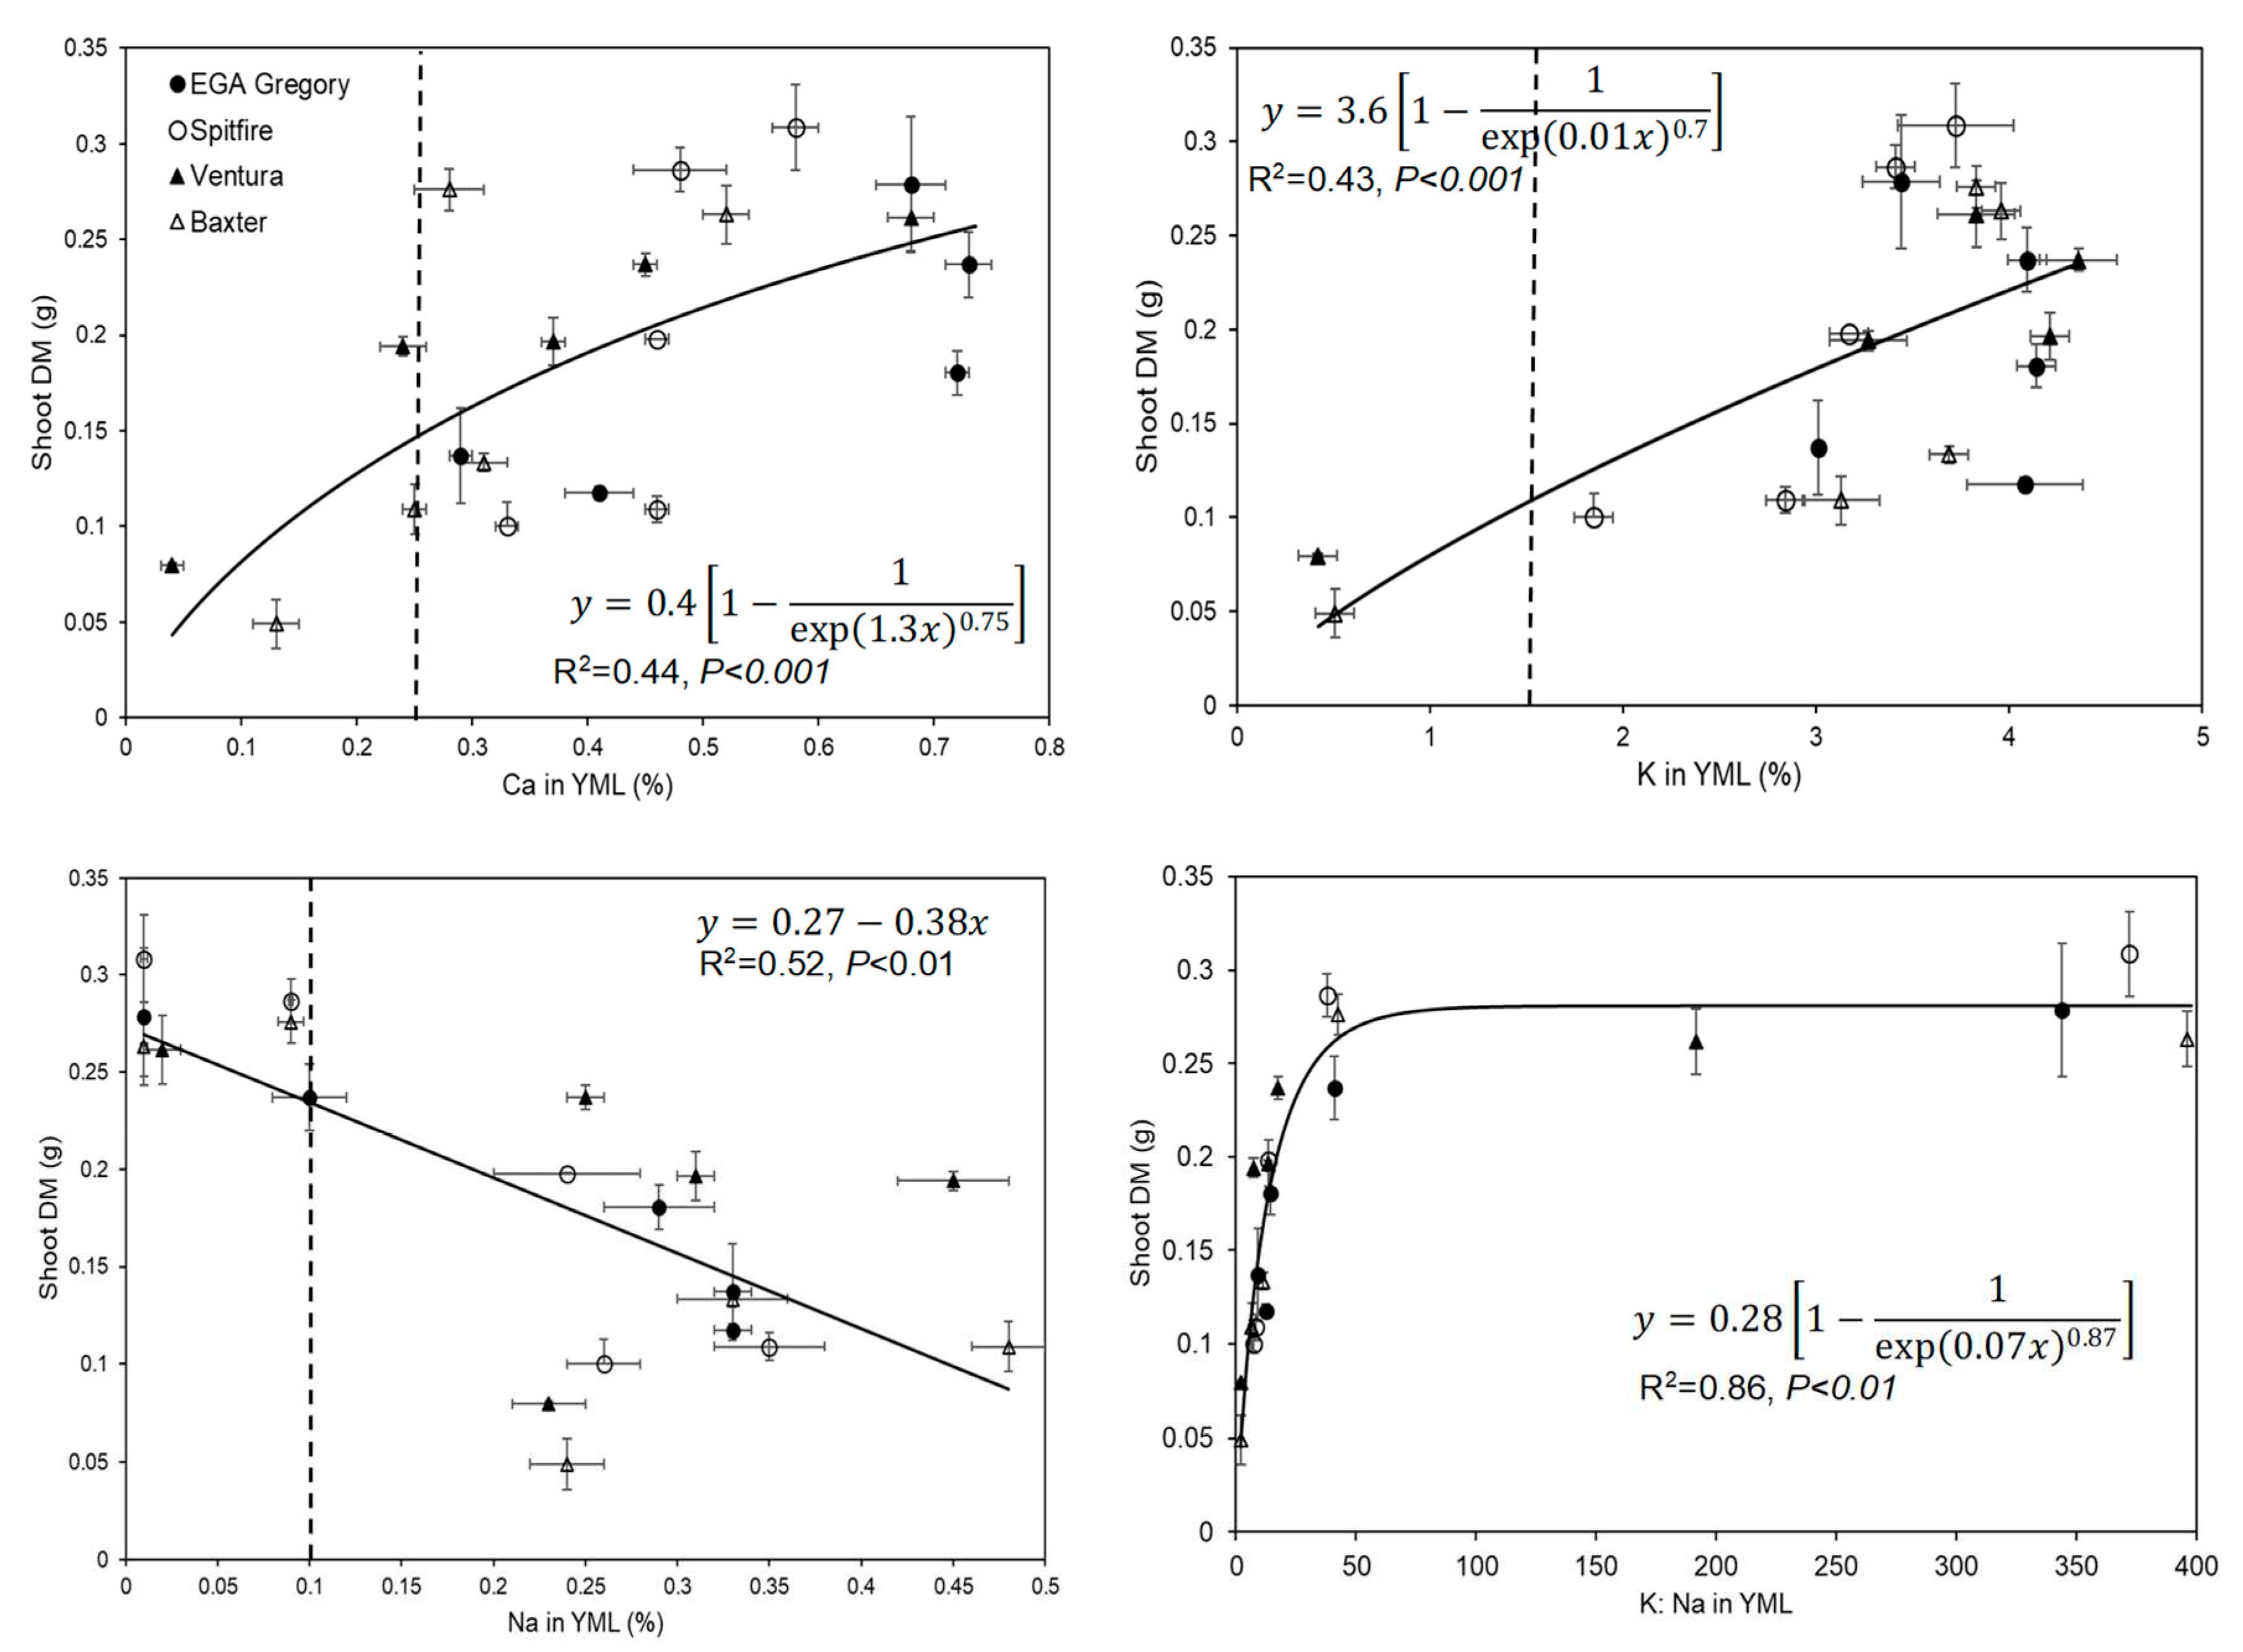
| Genotypes | SAR | K: Na | LSD |
|---|---|---|---|
| EGA Gregory | 0 | 344 | aA |
| 10 | 40.9 | bB | |
| 20 | 14.3 | cC | |
| 30 | 12.4 | cdCD | |
| 60 | 9.12 | cC | |
| Spitfire | 0 | 372 | aA |
| 10 | 37.9 | bcB | |
| 20 | 13.2 | cdCD | |
| 30 | 8.11 | cdCD | |
| 60 | 7.12 | cdCD | |
| Ventura | 0 | 192 | aB |
| 10 | 17.4 | bcBC | |
| 20 | 13.6 | cC | |
| 30 | 7.27 | cC | |
| 60 | 1.83 | fE | |
| Baxter | 0 | 396 | aA |
| 10 | 42.6 | bAE | |
| 20 | 11.2 | cC | |
| 30 | 6.52 | cdCD | |
| 60 | 2.13 | fEF | |
| P between treatments | <0.0001 | ||
| P between genotypes | 0.17 | ||
| Interaction between genotypes and treatments | 0.15 | ||
| Genotype | Relative Seedling Emergence in Soila | Rapid Germinationa | Seedling Emergence Forceb | Root Anglec | Ca Concentration in YML (SAR 30 and above)d | K Concentration in YML (SAR 60)d | Ca Concentration in Root (SAR 60)d | K Concentration in Root (SAR 60)d |
|---|---|---|---|---|---|---|---|---|
| EGA Gregory | Sensitive | L | L | L | H (>) | H (>) | H (>) | H (>) |
| Baxter | Sensitive | M | L | L | L (<) | L (<) | L (<) | M (>) |
| Ventura | Tolerant | H | H | H | L (<) | L (<) | L (<) | M (>) |
| Spitfire | Tolerant | H | H | H | H (>) | H (>) | H (>) | H (>) |
Disclaimer/Publisher’s Note: The statements, opinions and data contained in all publications are solely those of the individual author(s) and contributor(s) and not of MDPI and/or the editor(s). MDPI and/or the editor(s) disclaim responsibility for any injury to people or property resulting from any ideas, methods, instructions or products referred to in the content. |
© 2023 by the authors. Licensee MDPI, Basel, Switzerland. This article is an open access article distributed under the terms and conditions of the Creative Commons Attribution (CC BY) license (http://creativecommons.org/licenses/by/4.0/).


