1. Introduction
The use of composite structures in a wide range of fields is still increasing, thanks to their high specific strength and stiffness over metals. The significant weight reduction of the structures translates into a benefit for the industry in terms of cost savings and environmental benefits, especially in terms of fuel savings [
1]. However, it is well known that the mechanical properties of fibre-reinforced composites can be very sensitive to environmental parameters. Temperature, humidity, light, or environmental impact phenomena such as rain, lightning or hail affect the durability of composite materials becoming a crucial issue when they are used as structural materials [
2]. These severe environmental conditions can limit the use of polymeric composites, especially for applications in which high performances are required. In an aircraft, some primary structures are always subjected to varying temperature and moisture exposures throughout their entire service life. Continuous exposure to high temperature and moisture levels may lead to a change in the mechanical behaviour of the aircraft’s structural components [
3,
4]. Furthermore, cyclic thermal, moisture and mechanical loadings could even further deteriorate the performance of the structures leading to premature failure. These environmental conditions, especially temperatures and moisture exposures, vary widely during a flight from the take-off to the landing.
Specifically, Kevlar-reinforced composites are prone to moisture uptake, due to the strong hygroscopic nature of both the resin and the fibre. Epoxy resins are strongly sensitive to water absorption because of large amounts of polar OH groups in the networks which facilitate attractive interactions with polar molecules of water [
5,
6,
7]. It was found that the maximum moisture absorption for epoxy is 2% at 70 °C and 100% RH [
8] and 6% for Kevlar 49 aramid fibres when they are exposed to a high-humidity environment (96% RH) [
9]. The absorbed moisture leads to the plasticization phenomenon in the matrix resin, decreasing the glass transition temperature and also generating changes in the state of stress in favour of cracking through swelling [
10,
11,
12], degrading the mechanical properties of the material [
2,
3,
4]. As a consequence, the stress transfer at the fibre-matrix interphase is compromised and the overall behaviour of the composite becomes more brittle: the impact strength and fracture toughness can even drop by 50% [
13].
In aerospace applications, the use of Kevlar honeycomb sandwiches is widespread, thanks to their excellent mechanical performances, i.e., high bending stiffness to weight ratio [
14]. Nevertheless, the honeycomb core absorbs water by capillary phenomenon [
15,
16]. The moisture locally accumulated inside the honeycomb cells, thereby jeopardising the original purpose of adopting sandwich structures for weight reduction and seriously affecting the integrity of composite structures and aircraft safety [
17,
18]. The solution currently used to resist water adsorption is based on metallic paints, applied through flame spray [
19,
20,
21], which has some drawbacks, i.e., weight, and fragility [
22]. Among a variety of options, polymer-based films, such as polyvinyl fluoride (PVF) films, are extensively used in aerospace applications thanks to the low permeability for vapours and low ignition time [
23,
24]. These hydrophobic films are usually co-bonded to surfaces of the glass, carbon, and Kevlar composite structures.
In the last decade, it has been investigated the possibility of using graphite nanoplatelets (GNPs) to improve the barrier properties of polymers [
25]. These nanoparticles are promising nanomaterials in gas or liquid-barrier applications because perfect graphene sheets do not allow the diffusion of small gases or liquids through their plane. To fulfil this function, films with special architecture can be employed as protective coatings for composites [
26]. Nanoarchitectures with a high level of nanoplatelet orientation and high nanofiller content (>50 vol%) ensure a high tortuosity factor resulting in high barrier and low permeability properties [
27,
28].
In this work, the authors investigated the possibility of employing high-content nanocomposites made with GNPs as a protective layer for reducing moisture absorption. Graphene films with high filler content have been integrated into Kevlar/Epoxy panels in a one-step manufacturing process. Panels have been fabricated with protective layers at different filler content (70, 80, 90 wt%). The effectiveness of protection against water uptake has been investigated through moisture uptake and GAG tests in the environmental chamber and the level of damage in the panels has been investigated with non-destructive inspection (NDI). Results indicate that graphene films are effective in protecting the panel from moisture, with a reduction of the maximum absorption after 40 days of 30%. The easy integration of the films in the manufacturing process of composites in a co-curing process ensures a reduction in the processing time and improves energy saving.
2. Materials and Methods
2.1. Materials and manufacturing procedure
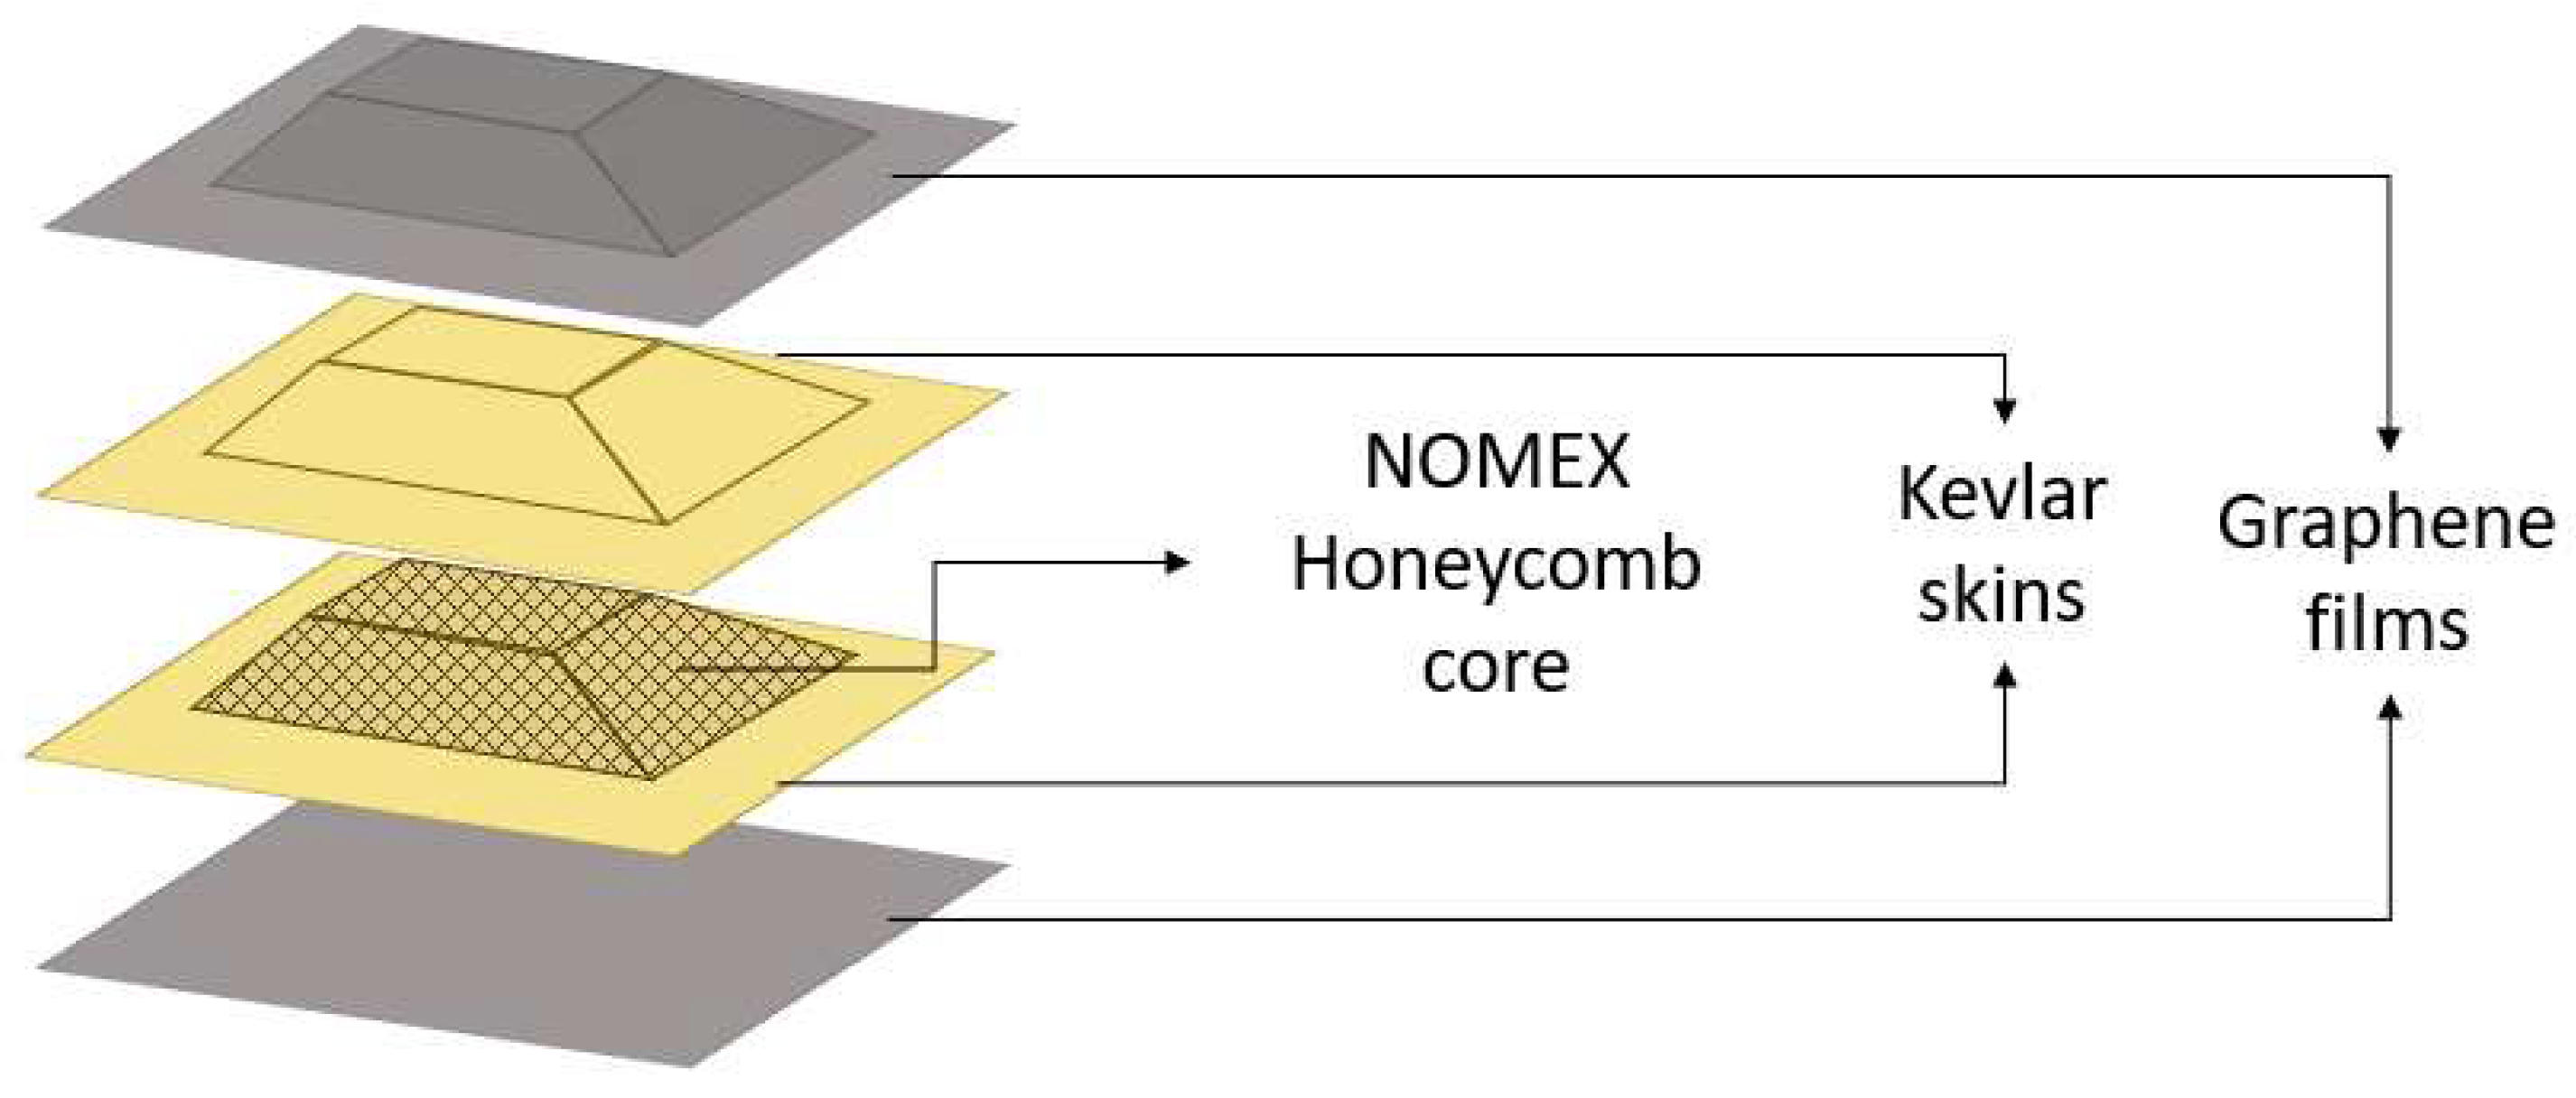
Kevlar/Nomex sandwich panels were selected since they are commonly employed in the construction of an engine nacelle. Square samples of 180 mm side were fabricated, with a tapered core with an angle of 18°± 3°, such that the footprint varies from 140 x 140 mm
2 to 50 x 50 mm
2 on the lower and upper surfaces, respectively (
Figure 1).
The GNP-rich films were fabricated following a top-down approach, based on a spray deposition process. These self-standing films are pre-impregnated with an epoxy resin (Hexcel RTM6) at different contents (10, 20, 30 wt%). Details of the fabrication process are reported in previous work [
29]. Films have a thickness of 70±6 μm and a weight of 80-90 g/m
2.
To evaluate the effectiveness of the GNP layer in reducing the water uptake uncoated and coated Kevlar sandwich panel samples were fabricated. Seven panels were manufactured including three couple of panels coated with films with different graphene content (70%, 80%, 90%) and one reference sample without protection, and are listed in
Table 1.
The manufacturing process was carried out by the following steps:
- i.
Stacking of the lower skin according to the layout sequence (0/90)4.
- ii.
Core positioning, the core was prepared according to the final geometry before lamination.
- iii.
Stacking by prepregs the core contour (0/90)6.
- iv.
Stacking the upper skin (0/90)4.
- v.
Curing in an oven for 2h at 120 °C in a vacuum bag.
Finally, panels are trimmed and sealed on the edges. The GNP films on both the lower and upper surfaces were considered as additional layers in the stacking (i.e., tool side layer in the lower skin, last layer in the upper skin).
Figure 2 shows the panels’ manufacturing process.
2.2. Experimental characterization
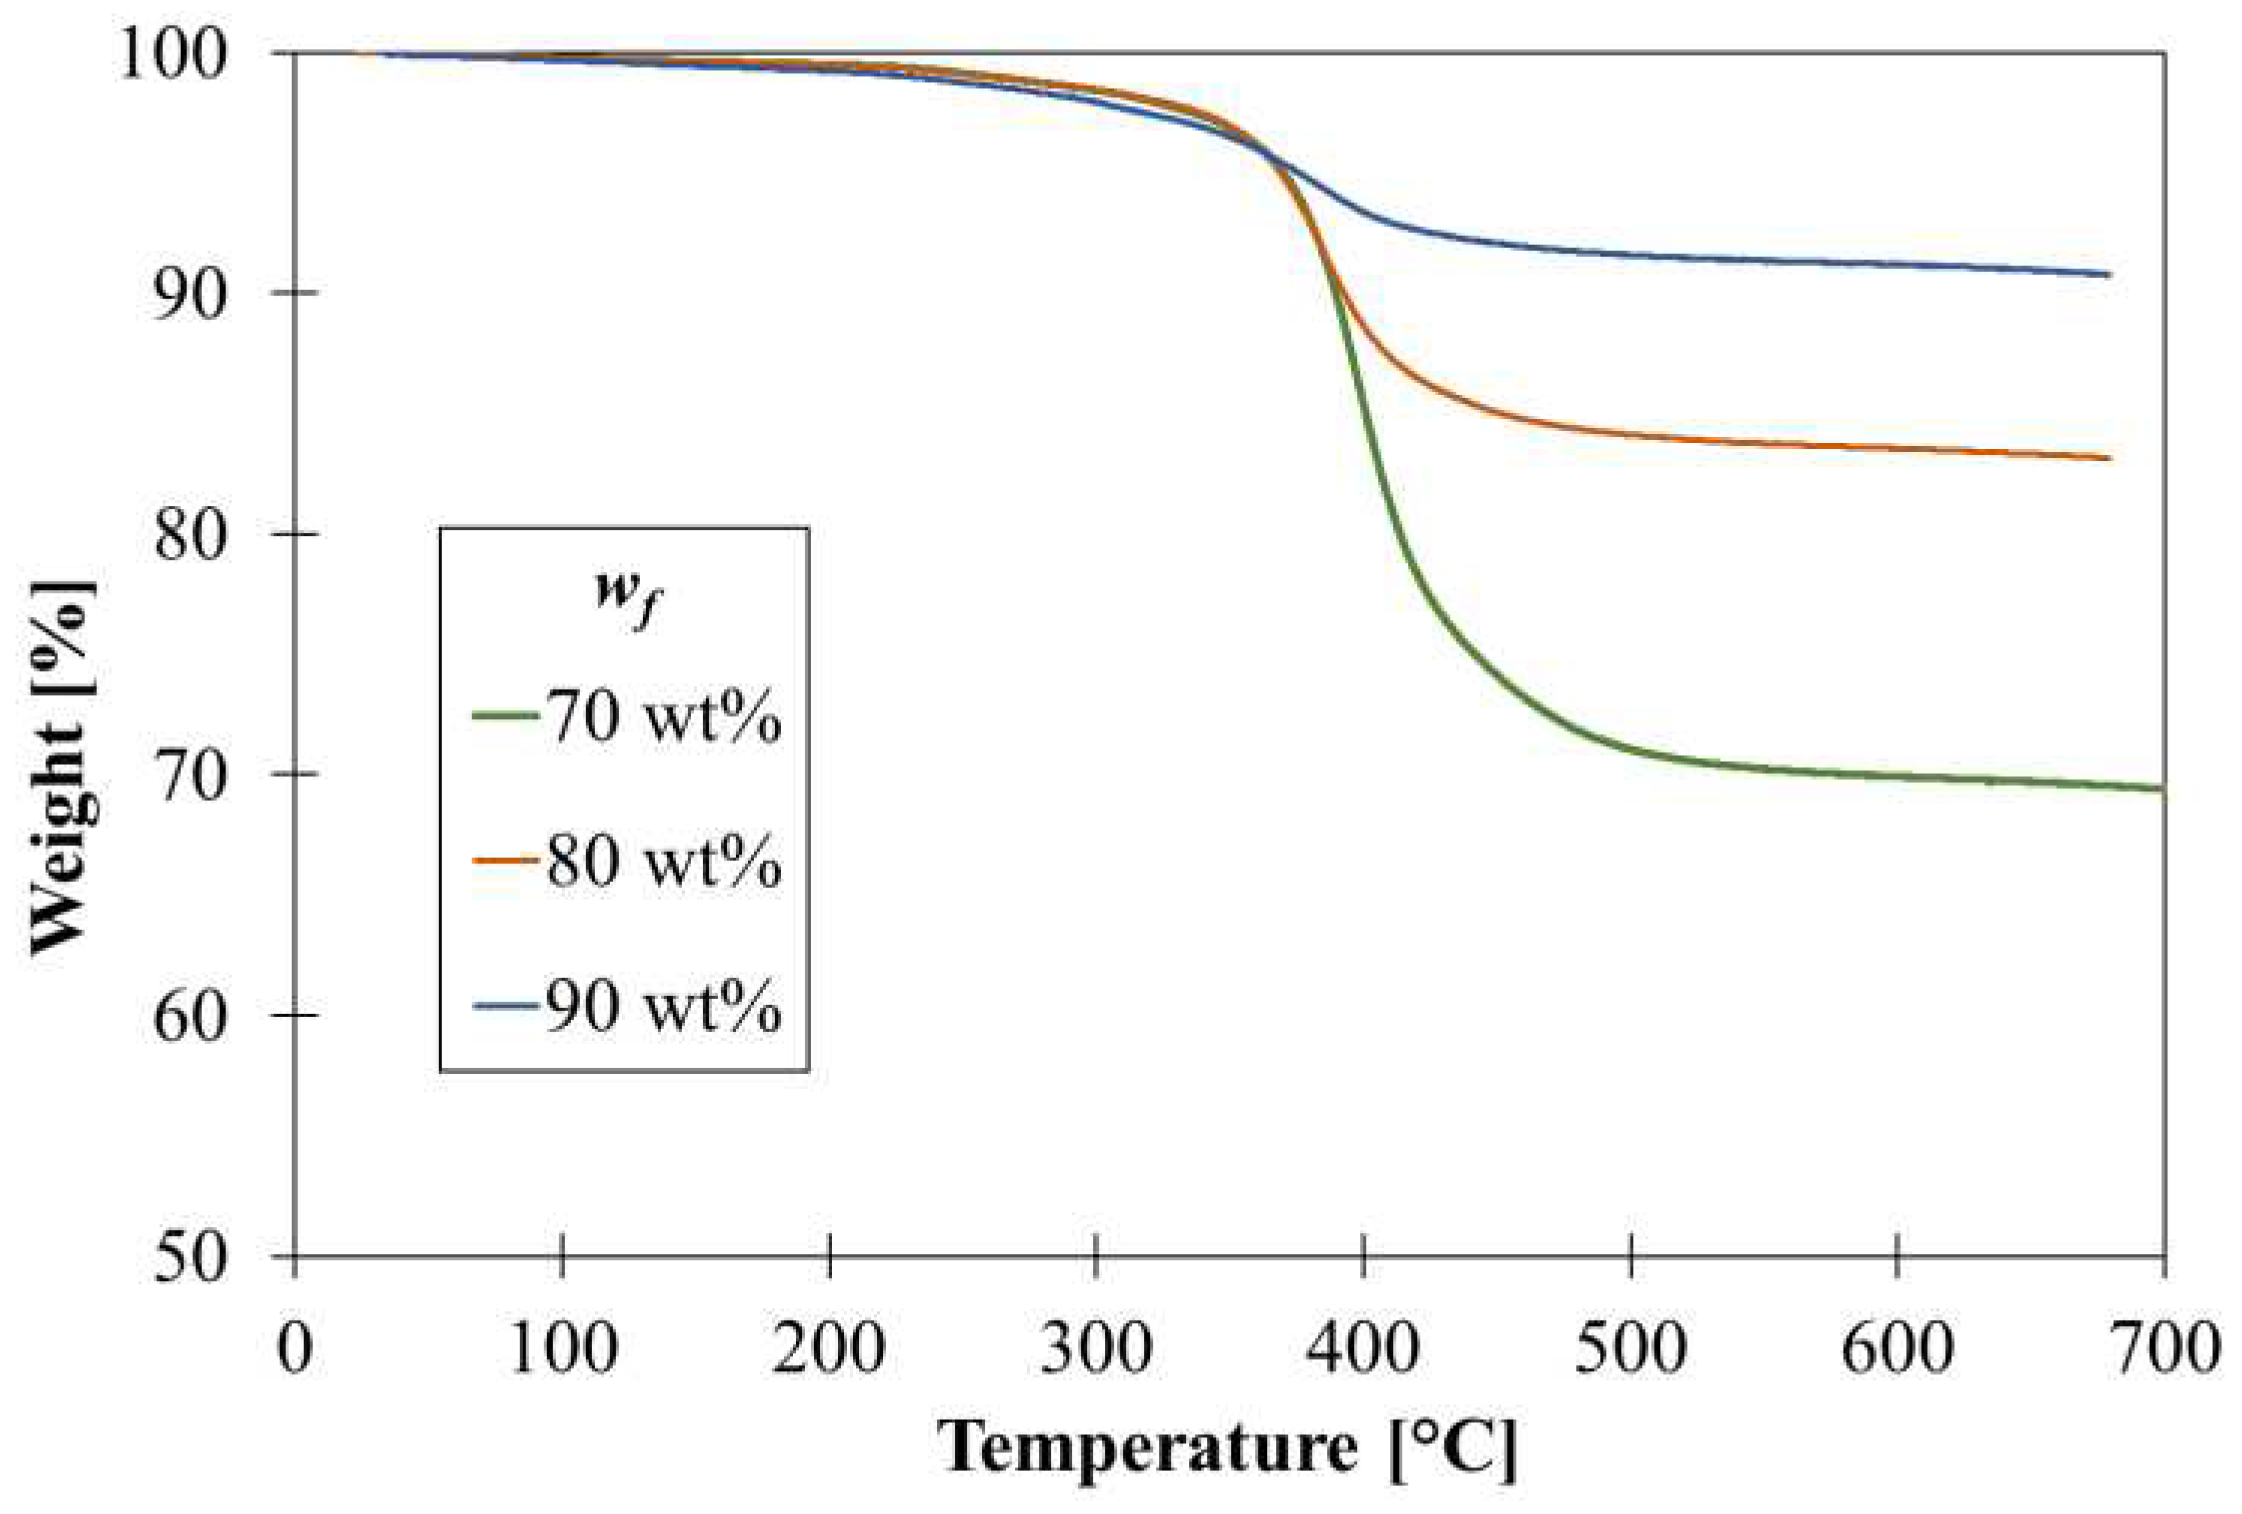
Thermogravimetric analysis (TGA) (TA Instruments Q500) was conducted to evaluate the real filler/matrix composition of GNP-rich films. Measurements were performed in an inert atmosphere, using nitrogen gas, with a temperature ramp of 10 °C/min from room temperature to 800 °C. The weight loss is evaluated at 600 °C, the temperature at which the resin residue is 10.3%.
The electrical resistivity of the graphene films was assessed using the Keithley 6221 picoammeter and the Metex M3850D digital multimeter. The picoammeter was used to generate currents with different densities, in the 1-100 mA range, while the multimeter was used to monitor the voltage. The measurement was conducted on rectangular samples of 5 cm x 1 cm size and a silver conductive paste was used to facilitate the measure. To prevent the samples from breaking during the measurements, they were reinforced with transparent adhesive tape.
To assess the effect of protection of GNP films, a moisture uptake test was performed according to ASTM D5229 [
30]. All samples listed in
Table 1, were placed in a climatic chamber (Angelantoni CH 2000) at a controlled temperature of 70 °C, with a relative humidity of 85% for 40 days. The increase of weight with time was measured by weighting the panels at different time steps. To avoid undesired movements of the specimens during the test, the panels were fixed on a metallic grid using four bolts accurately covered with tape, as shown in
Figure 3. Before starting the test, the panels were conditioned in a vacuum oven at 80 °C for 3 weeks in order to remove any traces of moisture and fix the same starting point. The samples were weighed every 3 days in the first week and then every week as indicated in
Table 2. Before each weighing, samples were dried with a paper towel to eliminate the excess water. The measurements were repeated three times, and the average value was computed and registered.
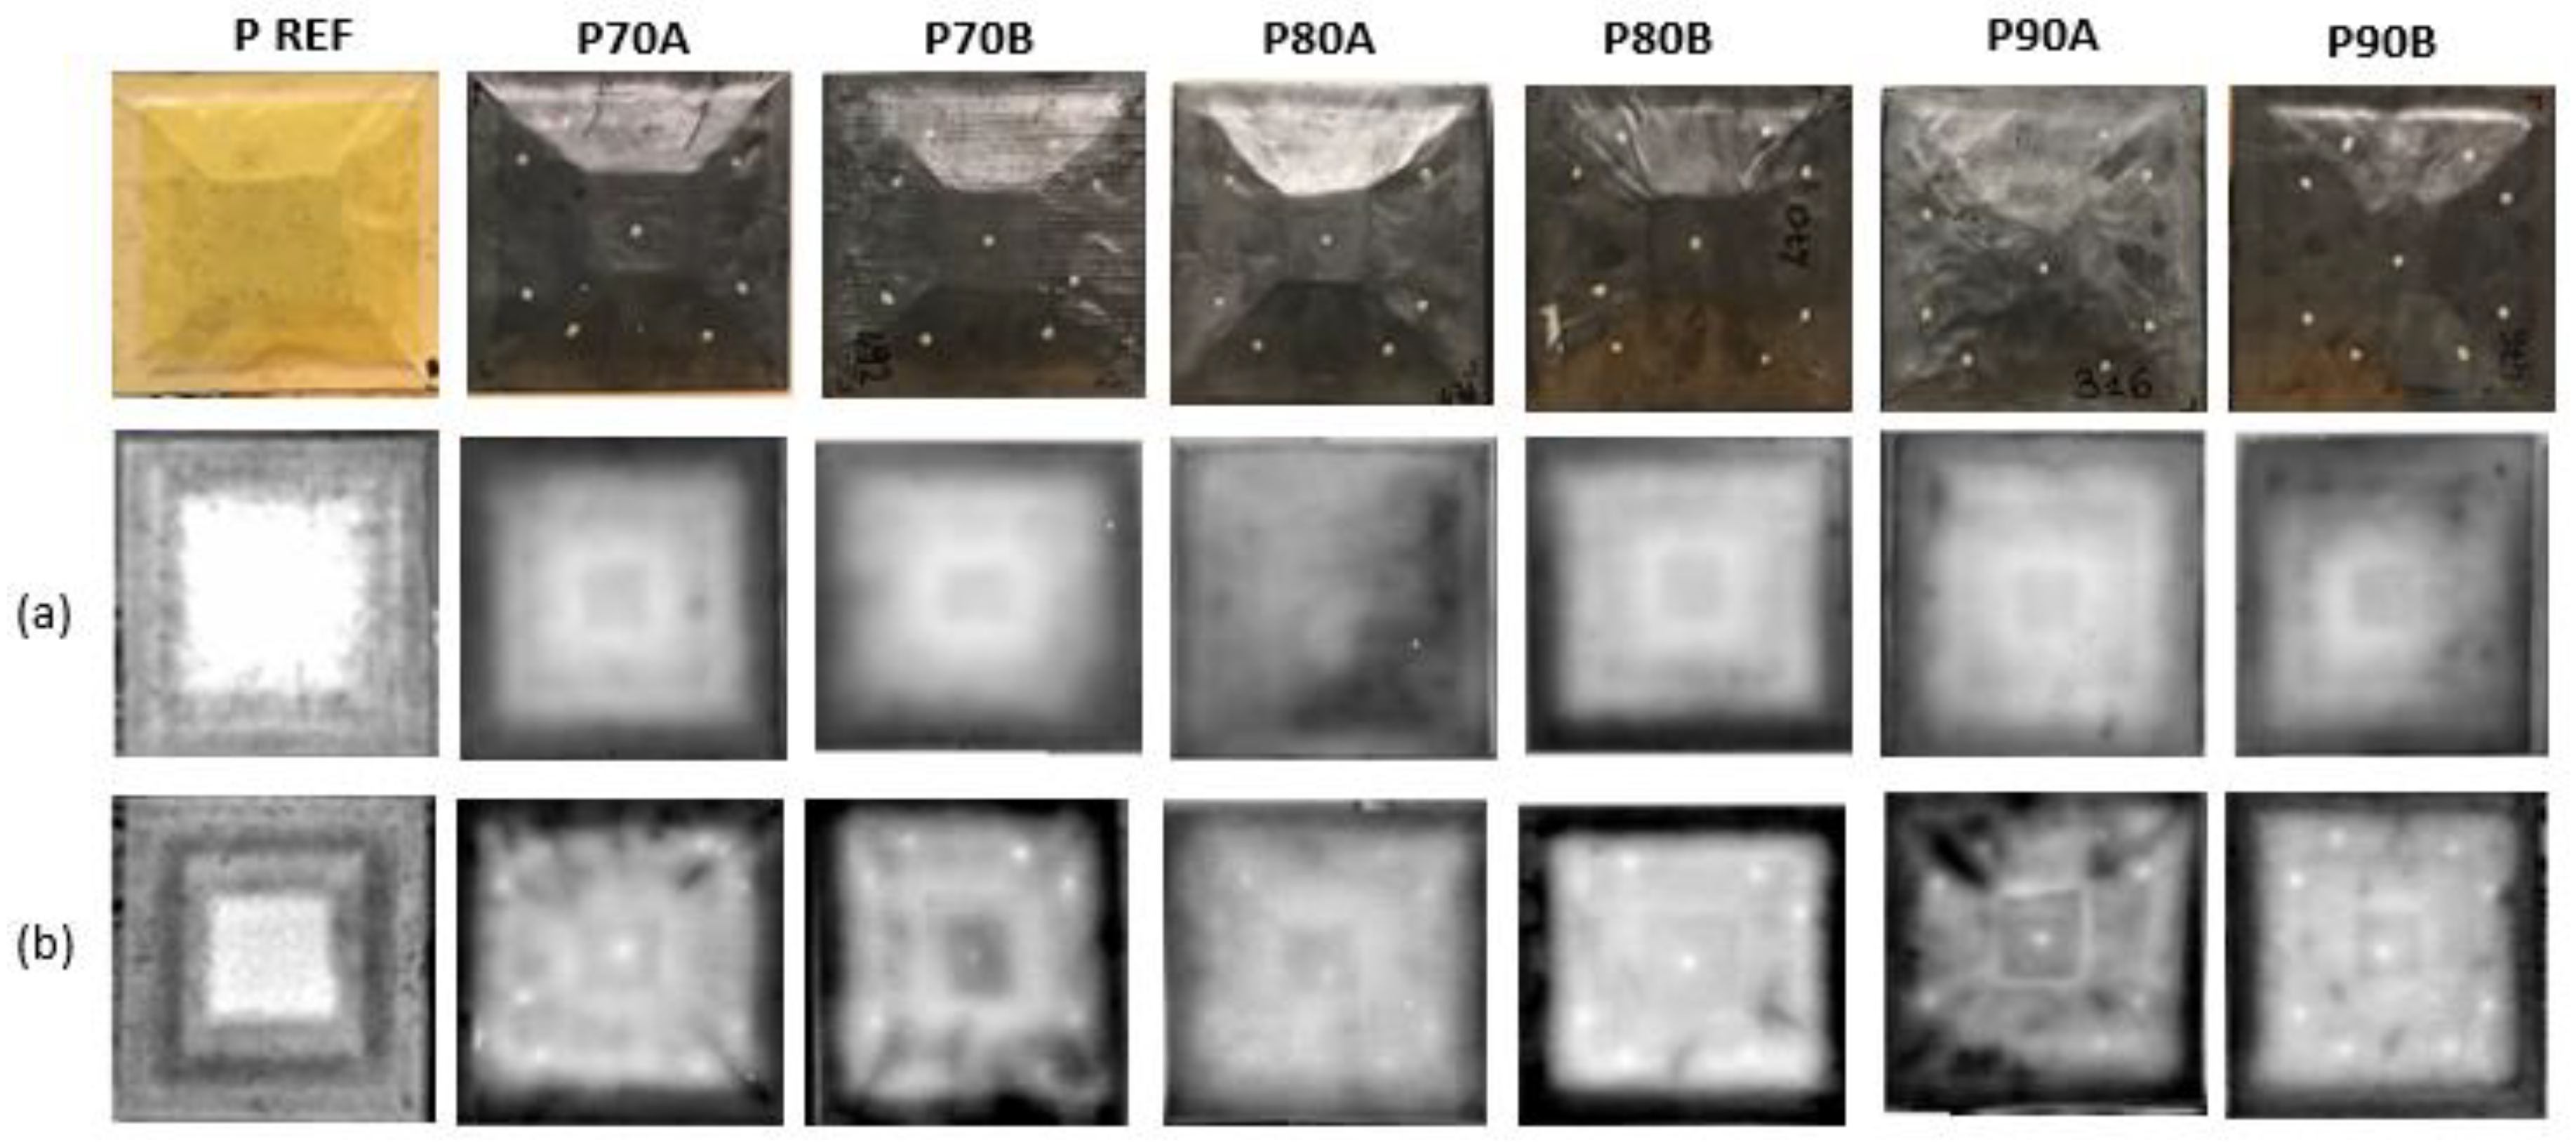
Finally, non-destructive inspections (NDI) were conducted to investigate the internal structure of the panels. Analyses were conducted before and after the test, to assess the potential damage of the samples when placed in a moist environment. Lock-in thermography has been employed and images of the samples at 0.1 Hz and 0.04 Hz were acquired.
3. Results
3.1. GNPs-protective coating functional properties
The real GNPs content has been assessed by TGA analysis. The thermograms reported in
Figure 4 confirmed the correspondence between nominal and actual GNPs content in the films. The real filler content,
wf,real, is computed according to Equation (1):
where
Ri is the residue from TGA at 600 °C of the sample and
Rm is the residue of the pure epoxy resin equal to 10%.
Table 3.
Results of TGA and values of filler content.
Table 3.
Results of TGA and values of filler content.
wf,nominal
[wt%] |
Ri
[wt%] |
wf,real
[wt%] |
| 70 |
72 |
69 |
| 80 |
86 |
84 |
| 90 |
91 |
90 |
The electrical resistance (
R) of GNP-rich films with different filler contents was measured with the Volt amperometric test. The resistivity
ρ is computed according to Equation (2), where
R is the measured resistance and
w and
L are the width and length of the sample.
The films exhibit low electrical resistivity, which slightly decreases with increasing filler content as reported in
Table 4. Also, these values are compatible with the electrical resistivity of graphite (1.3 x 10
-5), which represents the theoretical natural limit [
31]. Graphene coating also improves the panels’ electrical conductivity, providing as an additional feature, the dissipation of the electrostatic discharge (ESD) that can accumulate on the surface [
32,
33].
3.2. Moisture diffusion in sandwich plates
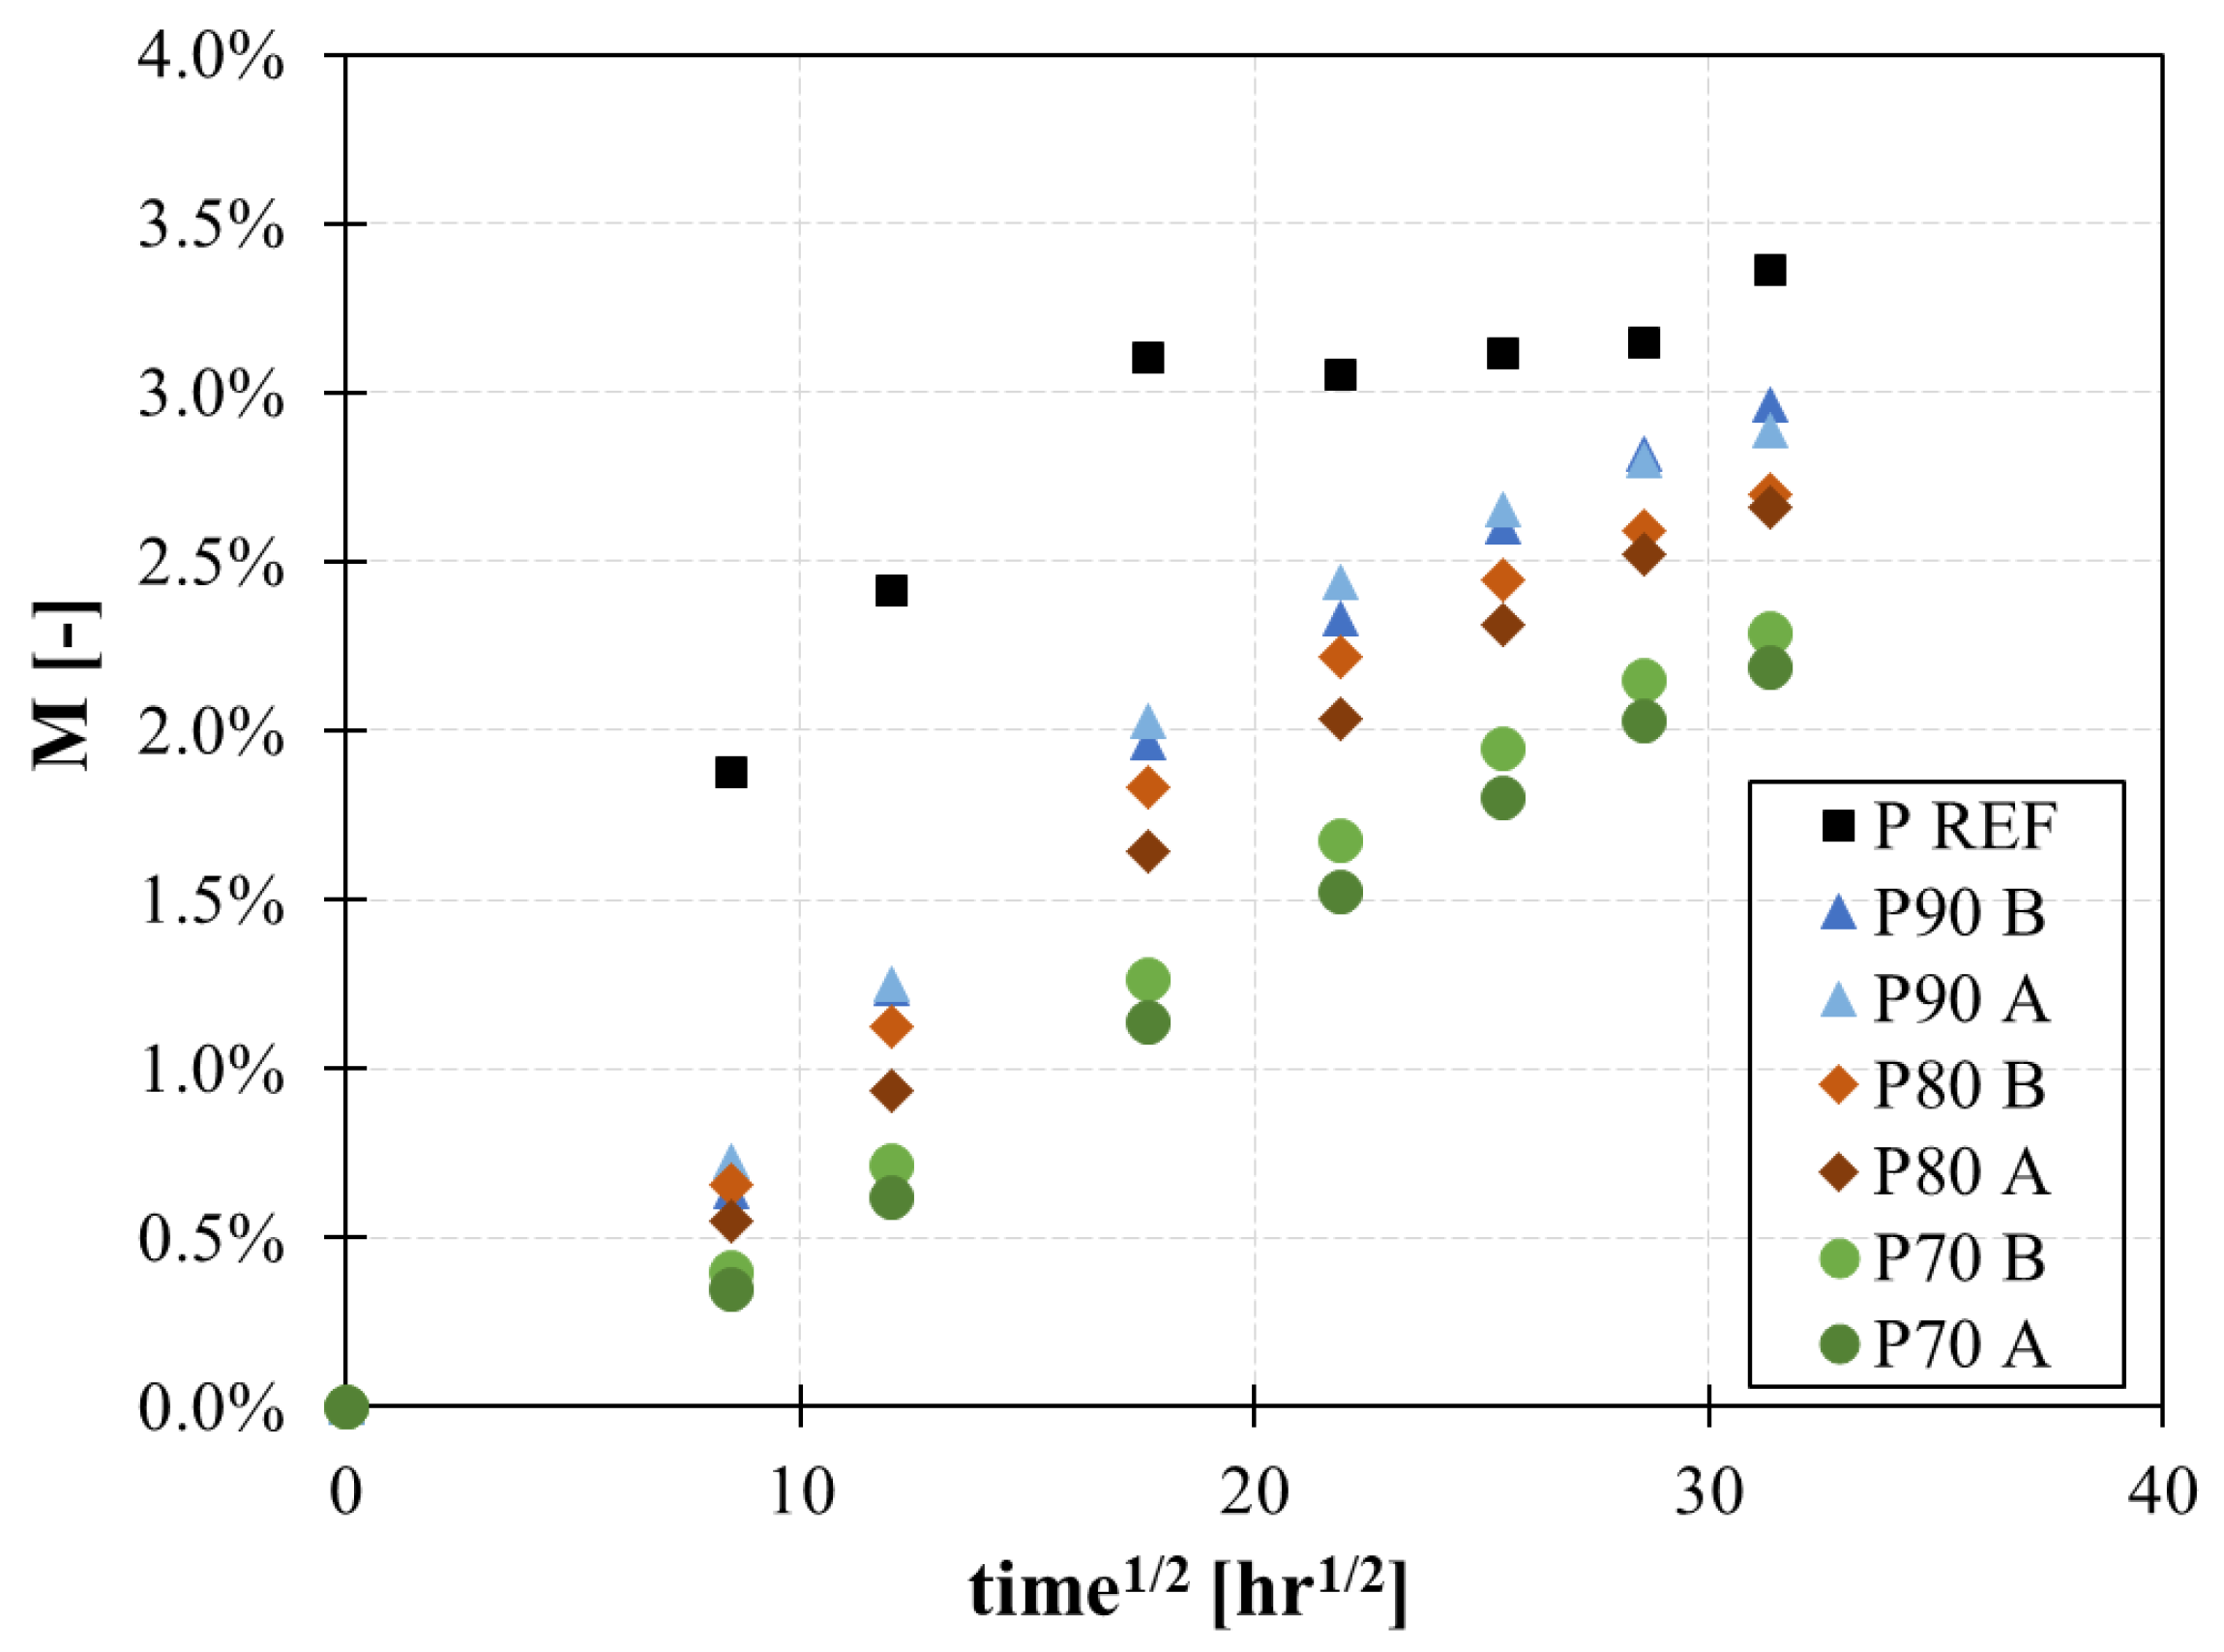
The sorption curves of the Kevlar/epoxy sandwich with and without the protection are shown in
Figure 5, where moisture uptake is plotted against the square root of time. The moisture uptake,
M, is evaluated according to Equation (3) [
30]:
where
W0 is the panel weight at time t=0, before starting the test, and
W(t) is the weight of the panel at each weighing step of
Table 2.
Results show that the graphene layer improves the resistance to moisture uptake, both in terms of maximum absorbance and diffusion rate. A reduction of 30% of the maximum moisture absorption has been observed in protected samples with respect to the reference Kevlar/epoxy sandwich (
Table 5). The graphene layer also modifies the absorption curve. In the uncoated panel, the absorption rate is higher, and the saturation is reached earlier compared to coated panels. The presence of the graphene films lowers the absorption rate, thanks to the tortuous path created by the well-oriented nanoparticles.
Furthermore, the material’s diffusivity (
D) has been calculated from the results of moisture uptake test as a function of time, according to Fick’s second law. It describes the time-dependent absorption of a gas or liquid into a sheet by accounting for accumulation into the material. If a gas or liquid is absorbed in a homogeneous and infinitely long sheet, an increase in mass (Δ
M) occurs as a function of time (
t) until saturation (Δ
Mmax). At short times (
Dt/h2 < 0.06, or equivalently Δ
M/Δ
Mmax < 0.55), Fick’s second law can be approximated to a linear relationship between the relative mass gain and the square root of time (Equation (4)) [
34].
where Δ
M/Δ
Mmax is the relative change in mass, and
t and
h are the time and the thickness of the sample respectively.
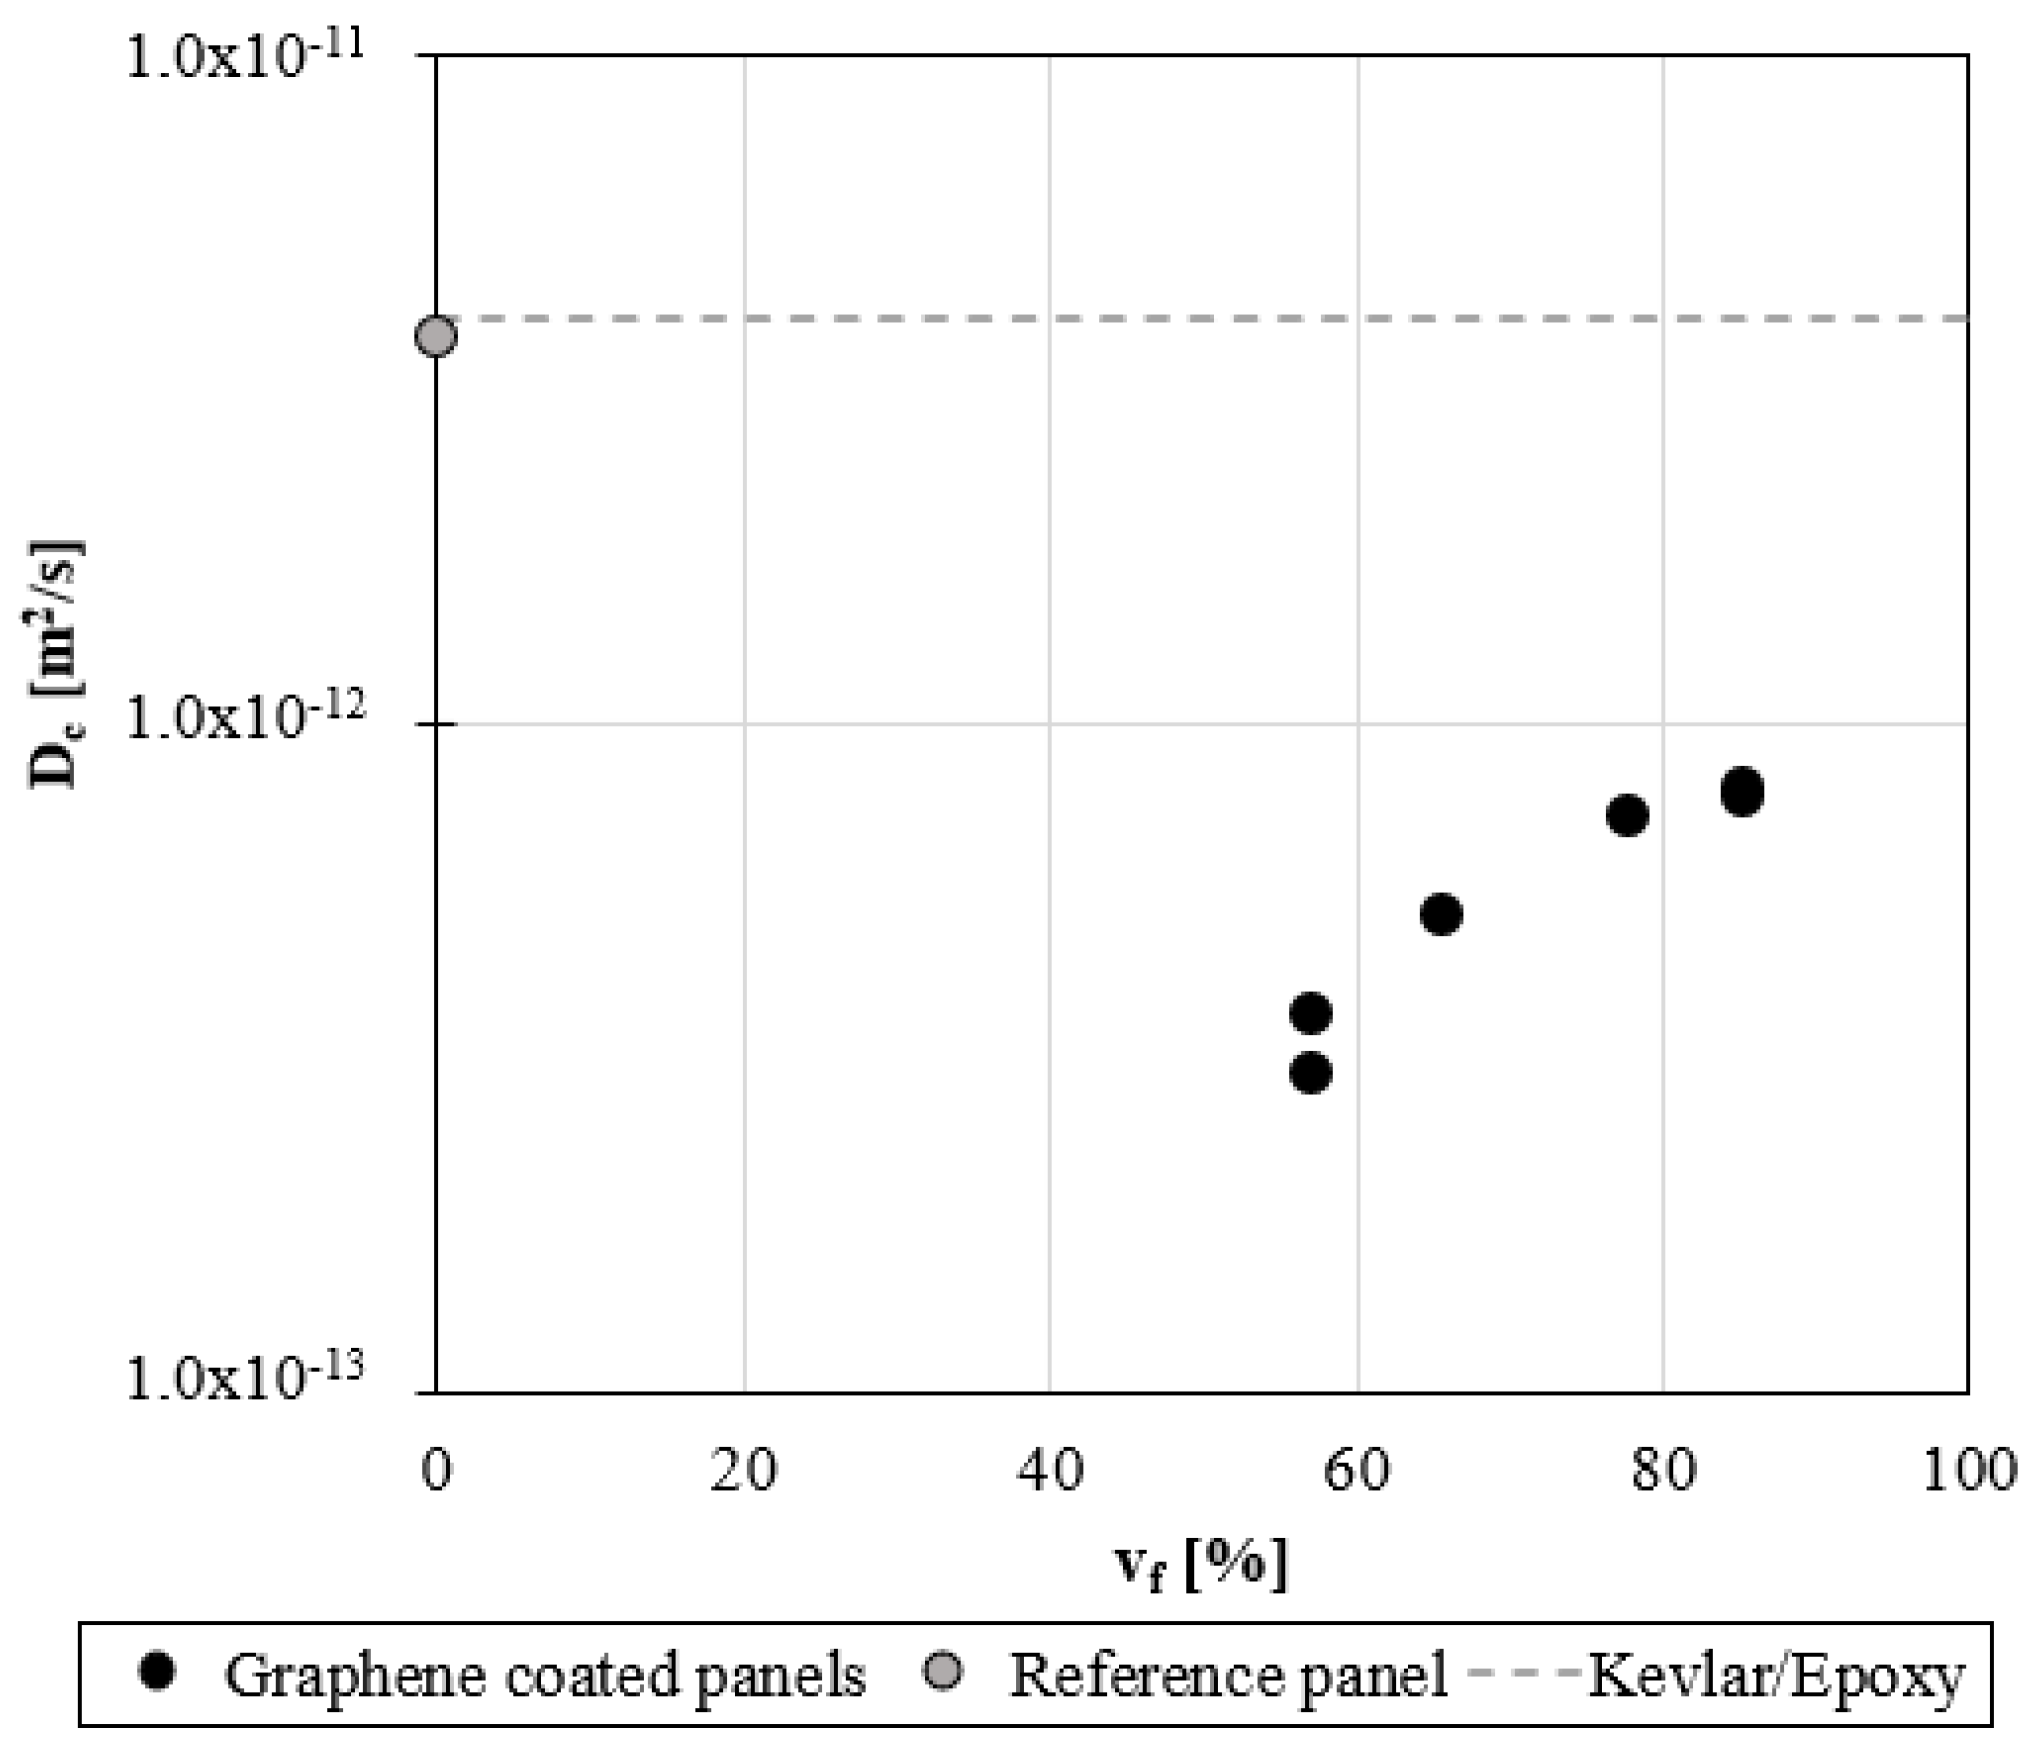
A sensible reduction of the water diffusivity is found for protected panels, as shown in
Figure 6. In the case of the unprotected panel, the diffusivity is 3.8 x 10
-12 m
2/s, consistent with data reported in the literature [
35]. When graphene coating is applied, the diffusivity reduces of an order of magnitude, as shown in
Figure 6. This reduction depends on the GNPs content: a minimum value is observed in the case of P70 with a −90% reduction compared to P REF. By increasing the GNP content, the efficiency of protection of the coating reduces; the diffusivity in P90 reduces by −80% compared to the reference.
4. Discussion
4.1. Influence of filler content on water uptake
Once the moisture is absorbed on the upstream surface of the material, it diffuses across the thickness of the protective films and penetrates the panel, accumulating in it. The use of protective coating with nanolamellar architecture showed a significant reduction of the moisture uptake and the absorption rate. The hydrophobic nature of GNPs combined with the very high in-plane orientation of nanoplatelets and the low matrix content, create an impervious path for vapour and gases [
36].
For a material filled with impenetrable nanoplatelets, oriented perpendicular to the diffusion direction, the diffusivity depends on the matrix diffusivity and on the path that the molecules follow when they cross the two phases [
37]. The longer the distance travelled by the diffusing molecule across the film thickness, the more tortuous the pathway.
A tortuosity factor (τ) is defined ed described by Equation (4) for nanocomposites reinforced with lamellar-oriented nanoplatelets, which depends on the filler aspect ratio (
AR) and volume fraction (
vf) [
37]. It increases with the volumetric filler fraction, reducing asymptotically to zero.
According to Equation (4), the tortuosity factor in the case of graphene films loaded with 70, 80, and 90 wt% of GNPs are computed and listed in
Table 6. By increasing the nanofiller content, the nanoarchitecture of the films, composed of highly oriented nanoplatelets should force the water molecules to move in an increasingly tortuous path, resulting in a reduction of diffusion through the protective film.
On the contrary, experimental data showed that in panels coated with GNP films, the absorption depends on the coating composition and increases with the increasing nanofiller content. The lowest absorption is found in the panel protected with graphene film @70 wt% of GNP.
A rationale for this behaviour is found in the material’s inner architecture. Morphological observations of previous works have revealed a maximum level of compaction in graphene nanocomposites with 70 wt% of GNPs [
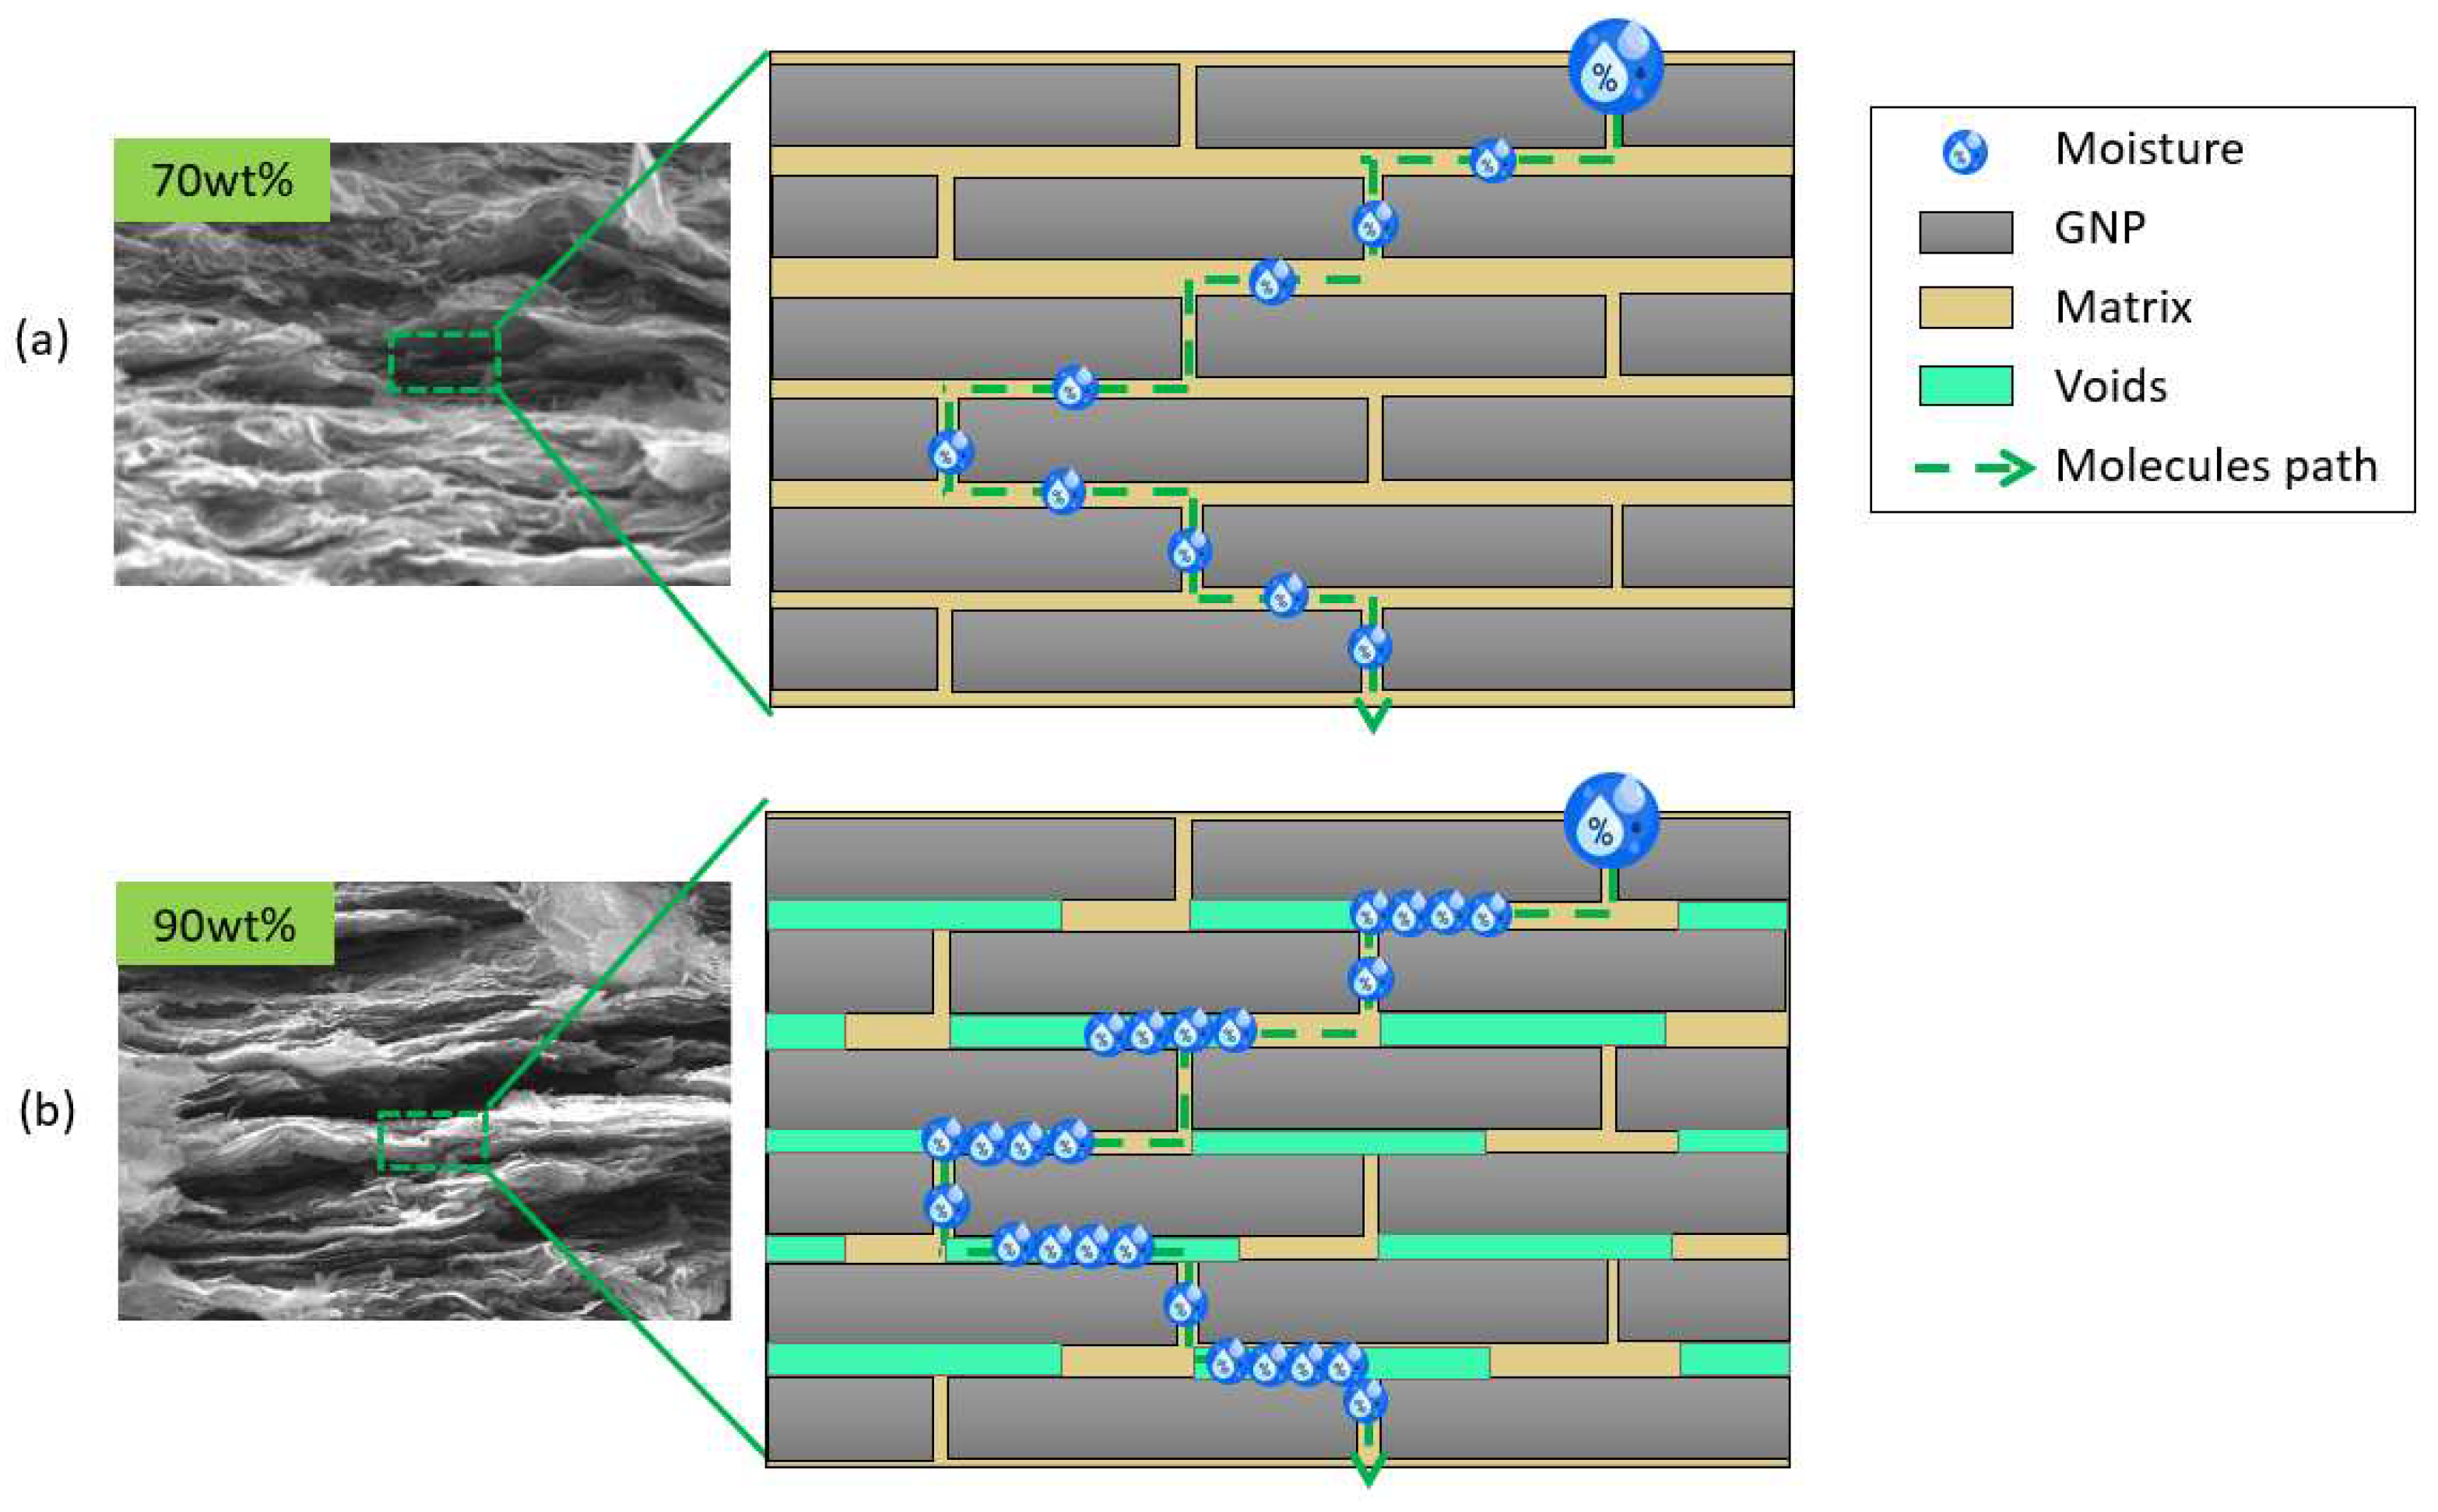
38]. By increasing the filler content up to 90 wt%, the nanostructure modifies being affected by dry spots and voids, as shown in SEM images of
Figure 7. The matrix phase at high filler contents appears to be discontinuous by partially covering the nanoplatelets’ surface [
29,
39]. These uncovered areas may be detrimental to the barrier effect. Although the water molecules travel a more impervious path, they cross areas with different diffusivities (air and matrix) resulting in a higher absorption (
Figure 7).
Therefore, the moisture uptake in panels protected with graphene films with 90 wt% filler content is higher than that of panels coated with graphene film with 70 wt% filler content. However, this value is significantly lower than that of the uncoated panel (3.4%).
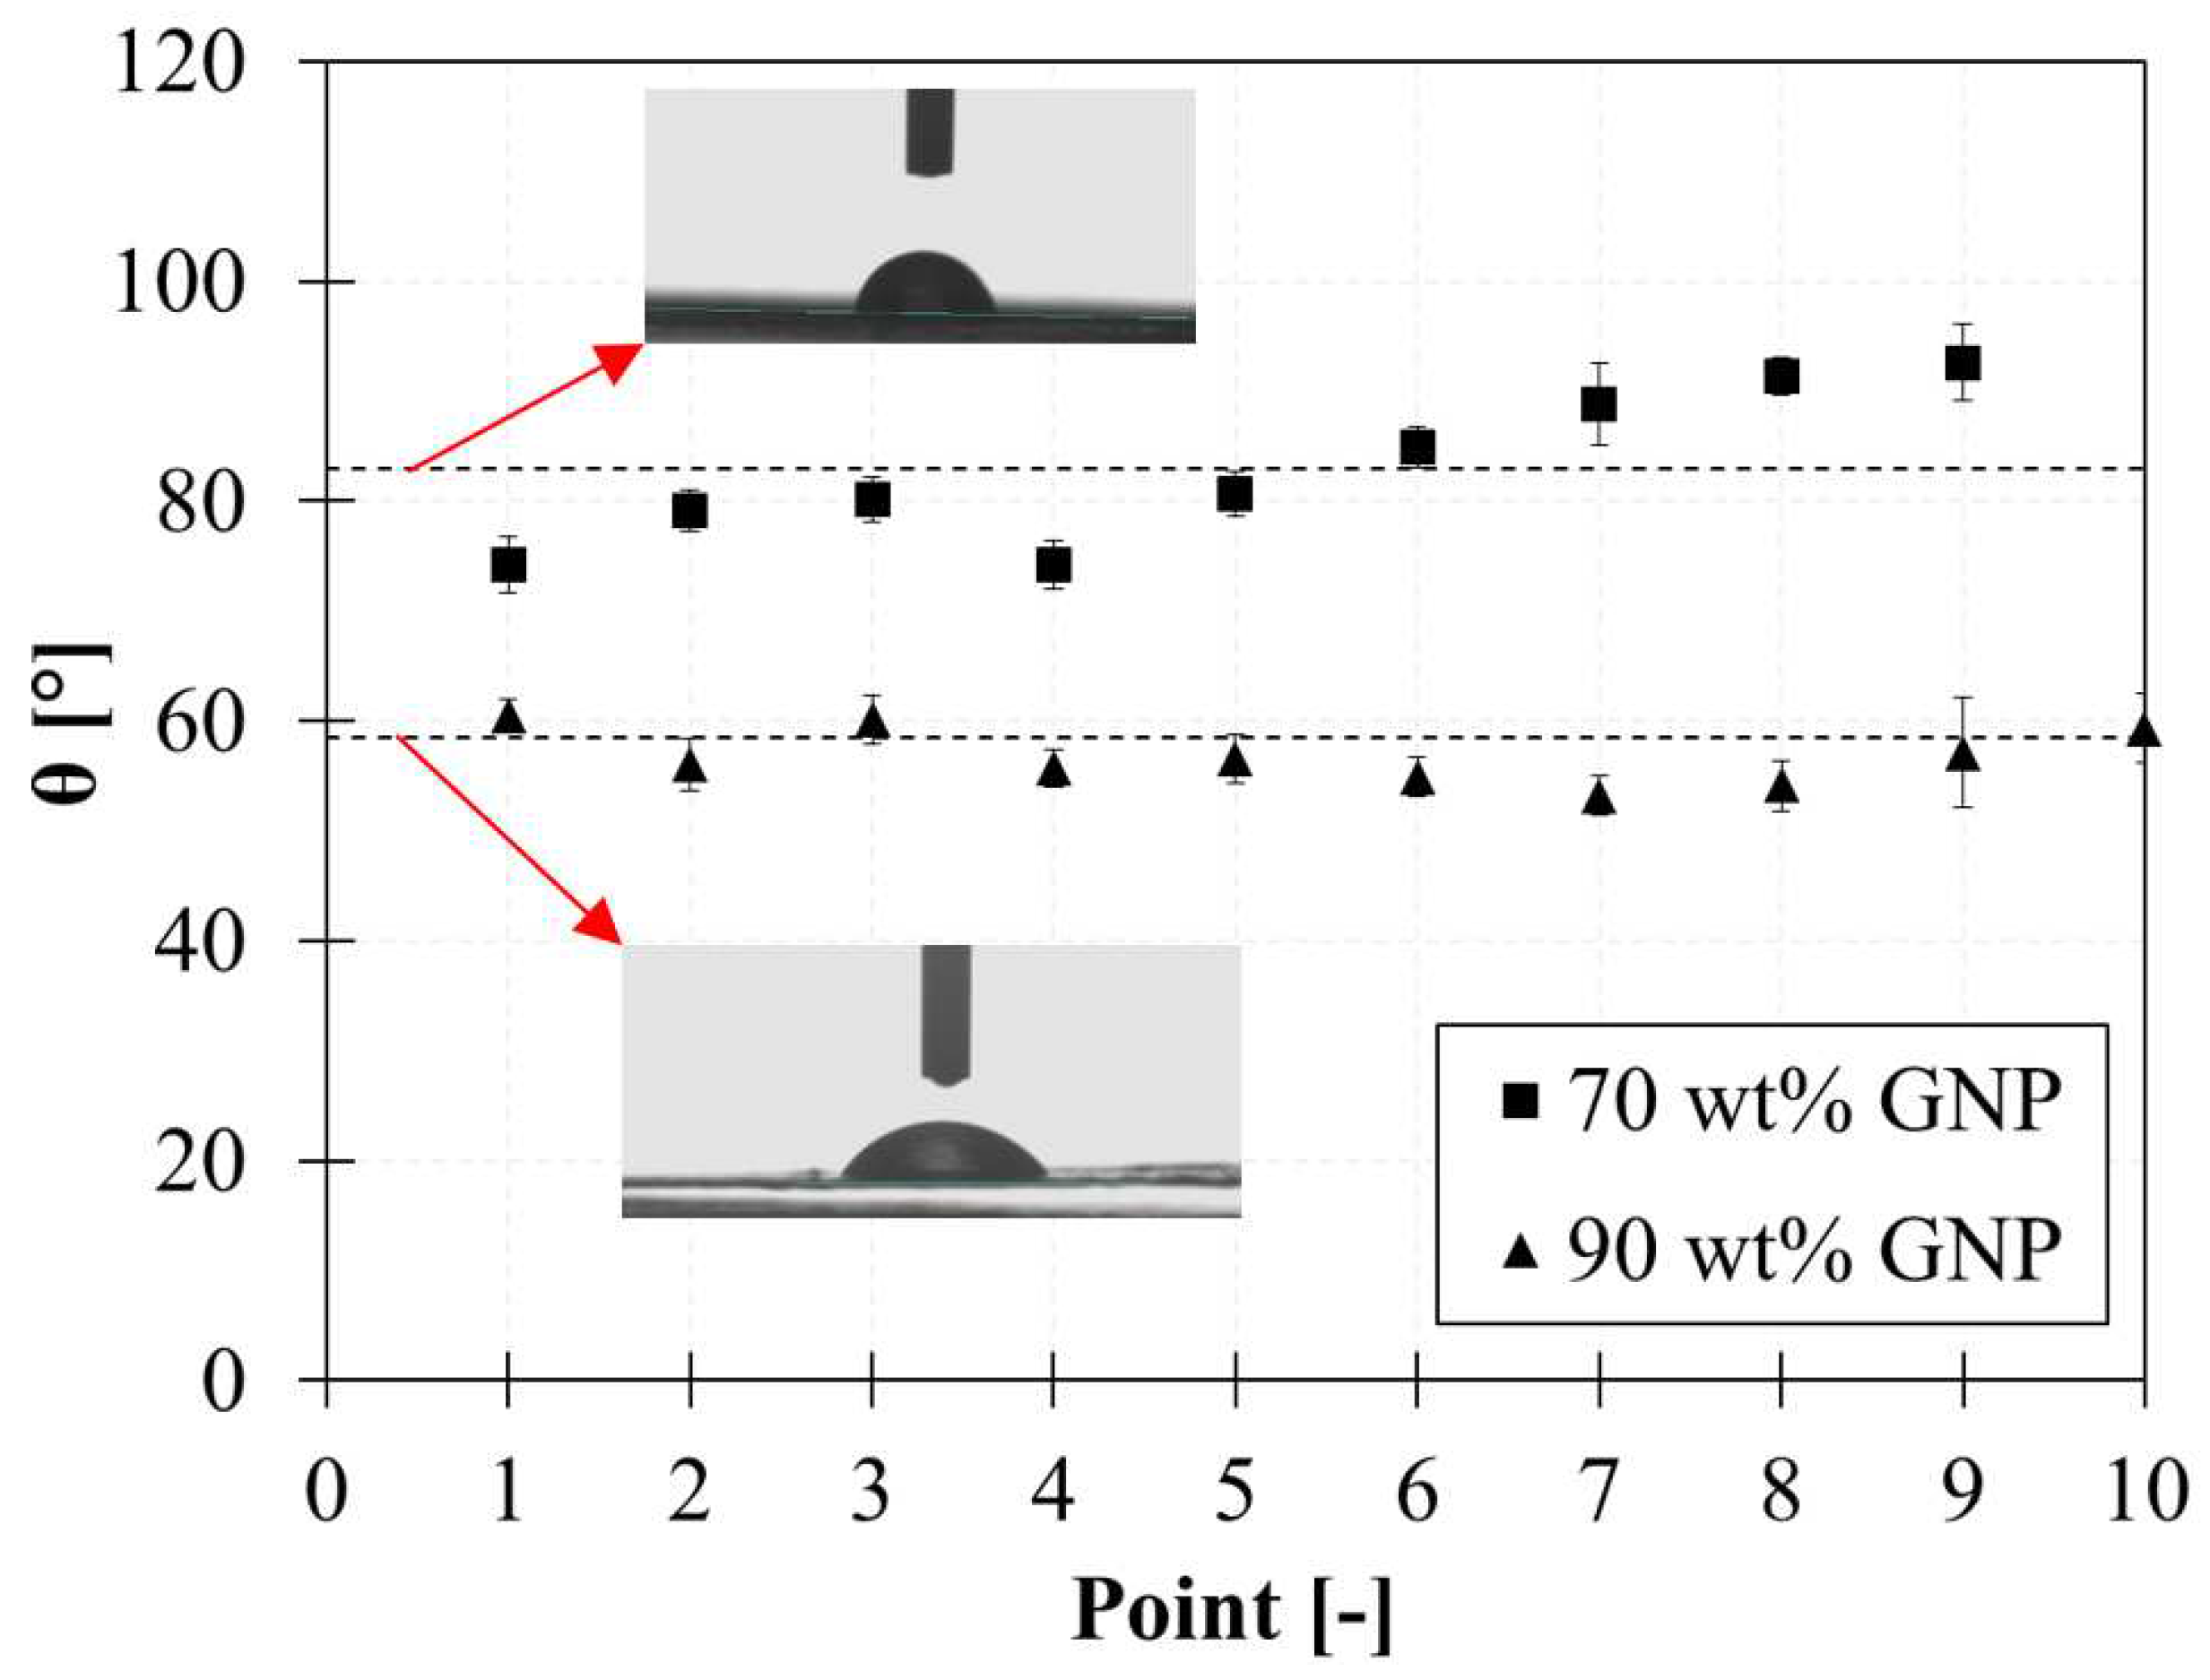
Further investigations based on contact angle measurements demonstrated that graphene films @90wt% of GNP have a more hydrophilic behaviour compared to graphene films @70 wt% as shown in
Figure 8. Analyses are conducted using optical contact angle measuring (OCA 20 DataPhysics) and contour analysis systems and using distilled water drops of 1 mL.
Figure 8 reports the contact angle (θ) geometrically defined as the angle formed by the liquid with the solid surface.
An average contact angle of 83° and 59° is found for films with 70 wt% and 90 wt% of GNPs, confirming that by increasing the nanofiller content [
40,
41]. These results indicate that the wetting states of membranes influence their permeability and corroborates the hypothesis that nanocomposites become more inclined to water absorption with increasing GNPs content.
4.2. Ground Air Ground (GAG)
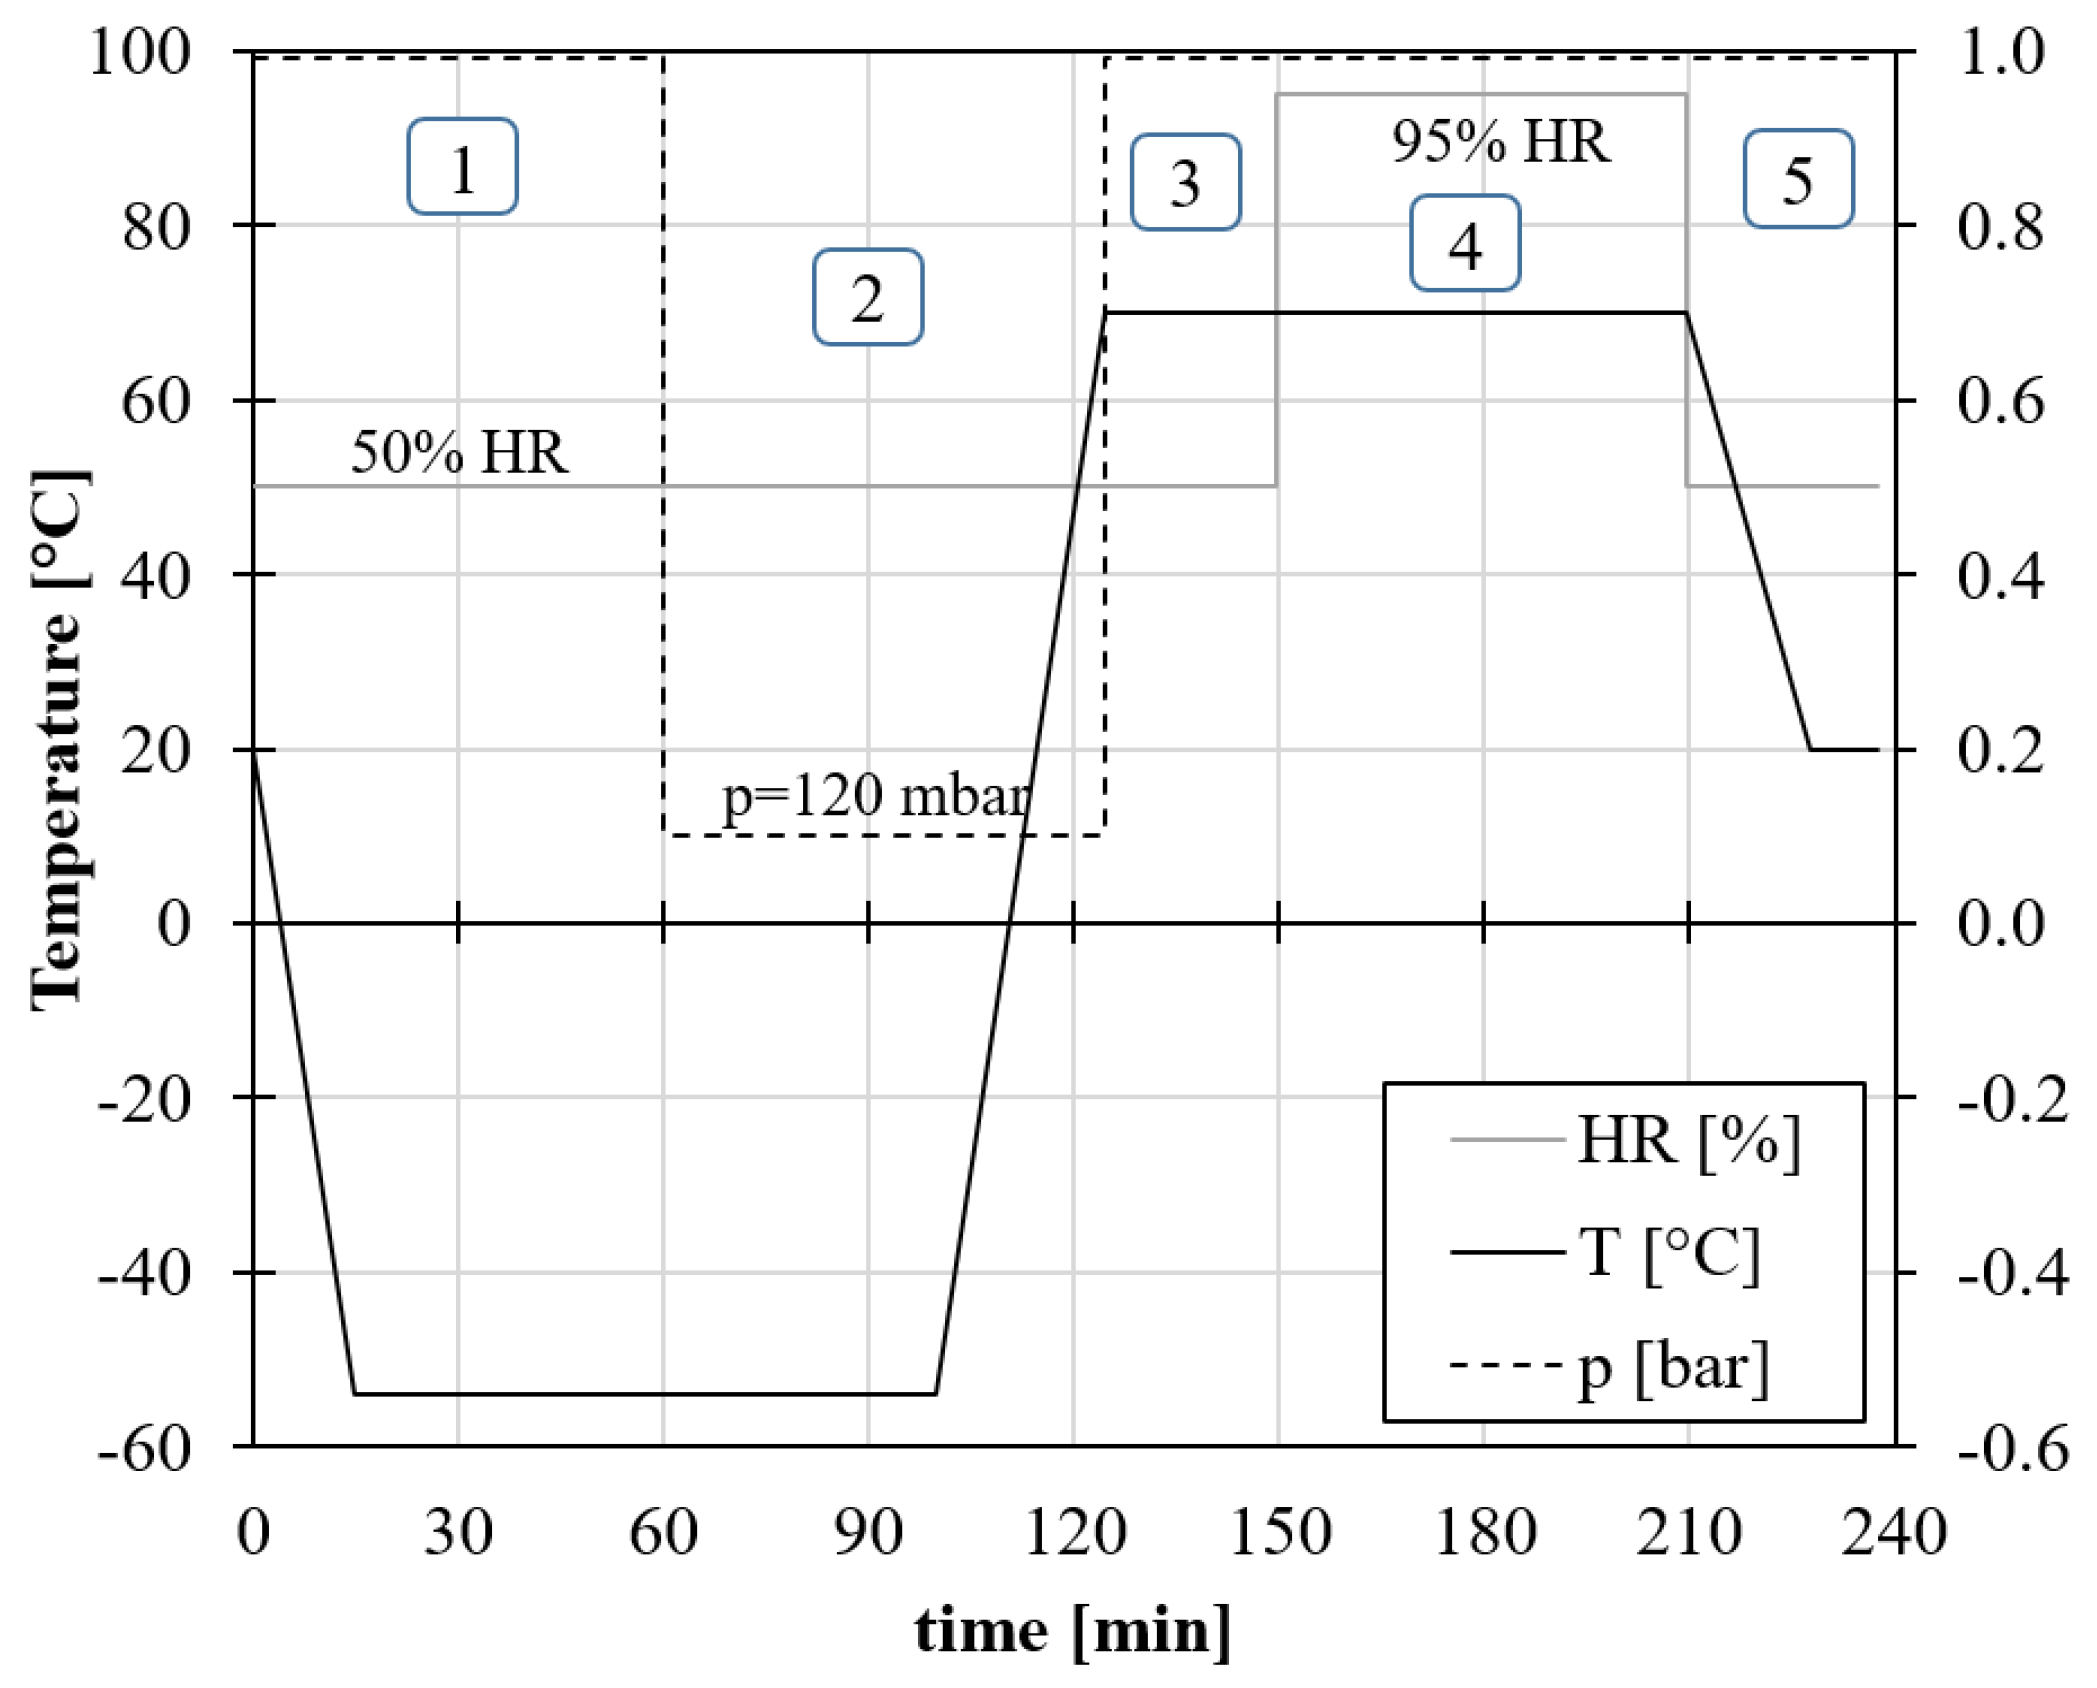
The Ground Air Ground (GAG) test was performed to assess the performance of the material during the flight. The test consists of subjecting the specimens to the combined effects of temperature, pressure, and relative humidity, thus reproducing the flight conditions. The GAG test was conducted using the same combined environmental chamber used for the moisture uptake test and samples were tested for 10 repeated cycles. The test procedure is shown in
Figure 9. According to ASTM D5229 [
30], samples were subjected to a rapid temperature drop to –54 °C, followed by a rapid temperature rise to 70 °C, under conditions of maximum moisture saturation (95% RH). Specifically, each cycle has a duration of 240 minutes and follows the following steps:
Parking the aircraft on the ground in a cool environment: lower the chamber temperature to -54 C° at a rate of 5 °C/min and keep these conditions for 45 minutes.
Lowering the chamber pressure to 120 mbar with a minimum temperature of -54 °C. This condition represents the take-off up to 15000 metres with a maximum ascent rate. Keep these conditions for 40 minutes.
Increase the pressure to 1013 mbar and raise the temperature to 70 °C simulating landing in a warm environment and parking on the ground at 70 °C for 25 minutes.
Increase relative humidity to 95% and remain in this condition (70 °C and RH 95%) for 60 minutes (park on the ground in a hot, humid environment).
Return chamber conditions to 20 °C and 50% and remain for 10 minutes.
All panels were subjected to the GAG test. Before starting the test, all samples were dried in a vacuum oven at 80 °C for 3 weeks and weighed. Further weighing was done after the first and tenth cycles.
After ten cycles, the maximum absorption in panels coated with the graphene layer is sensibly reduced as well as the absorption rate. The barrier effect decreases with increasing graphene content: sample P70 shows the lowest value of absorption. Results of the GAG test conducted on panels are reported in
Table 7 in terms of moisture uptake.
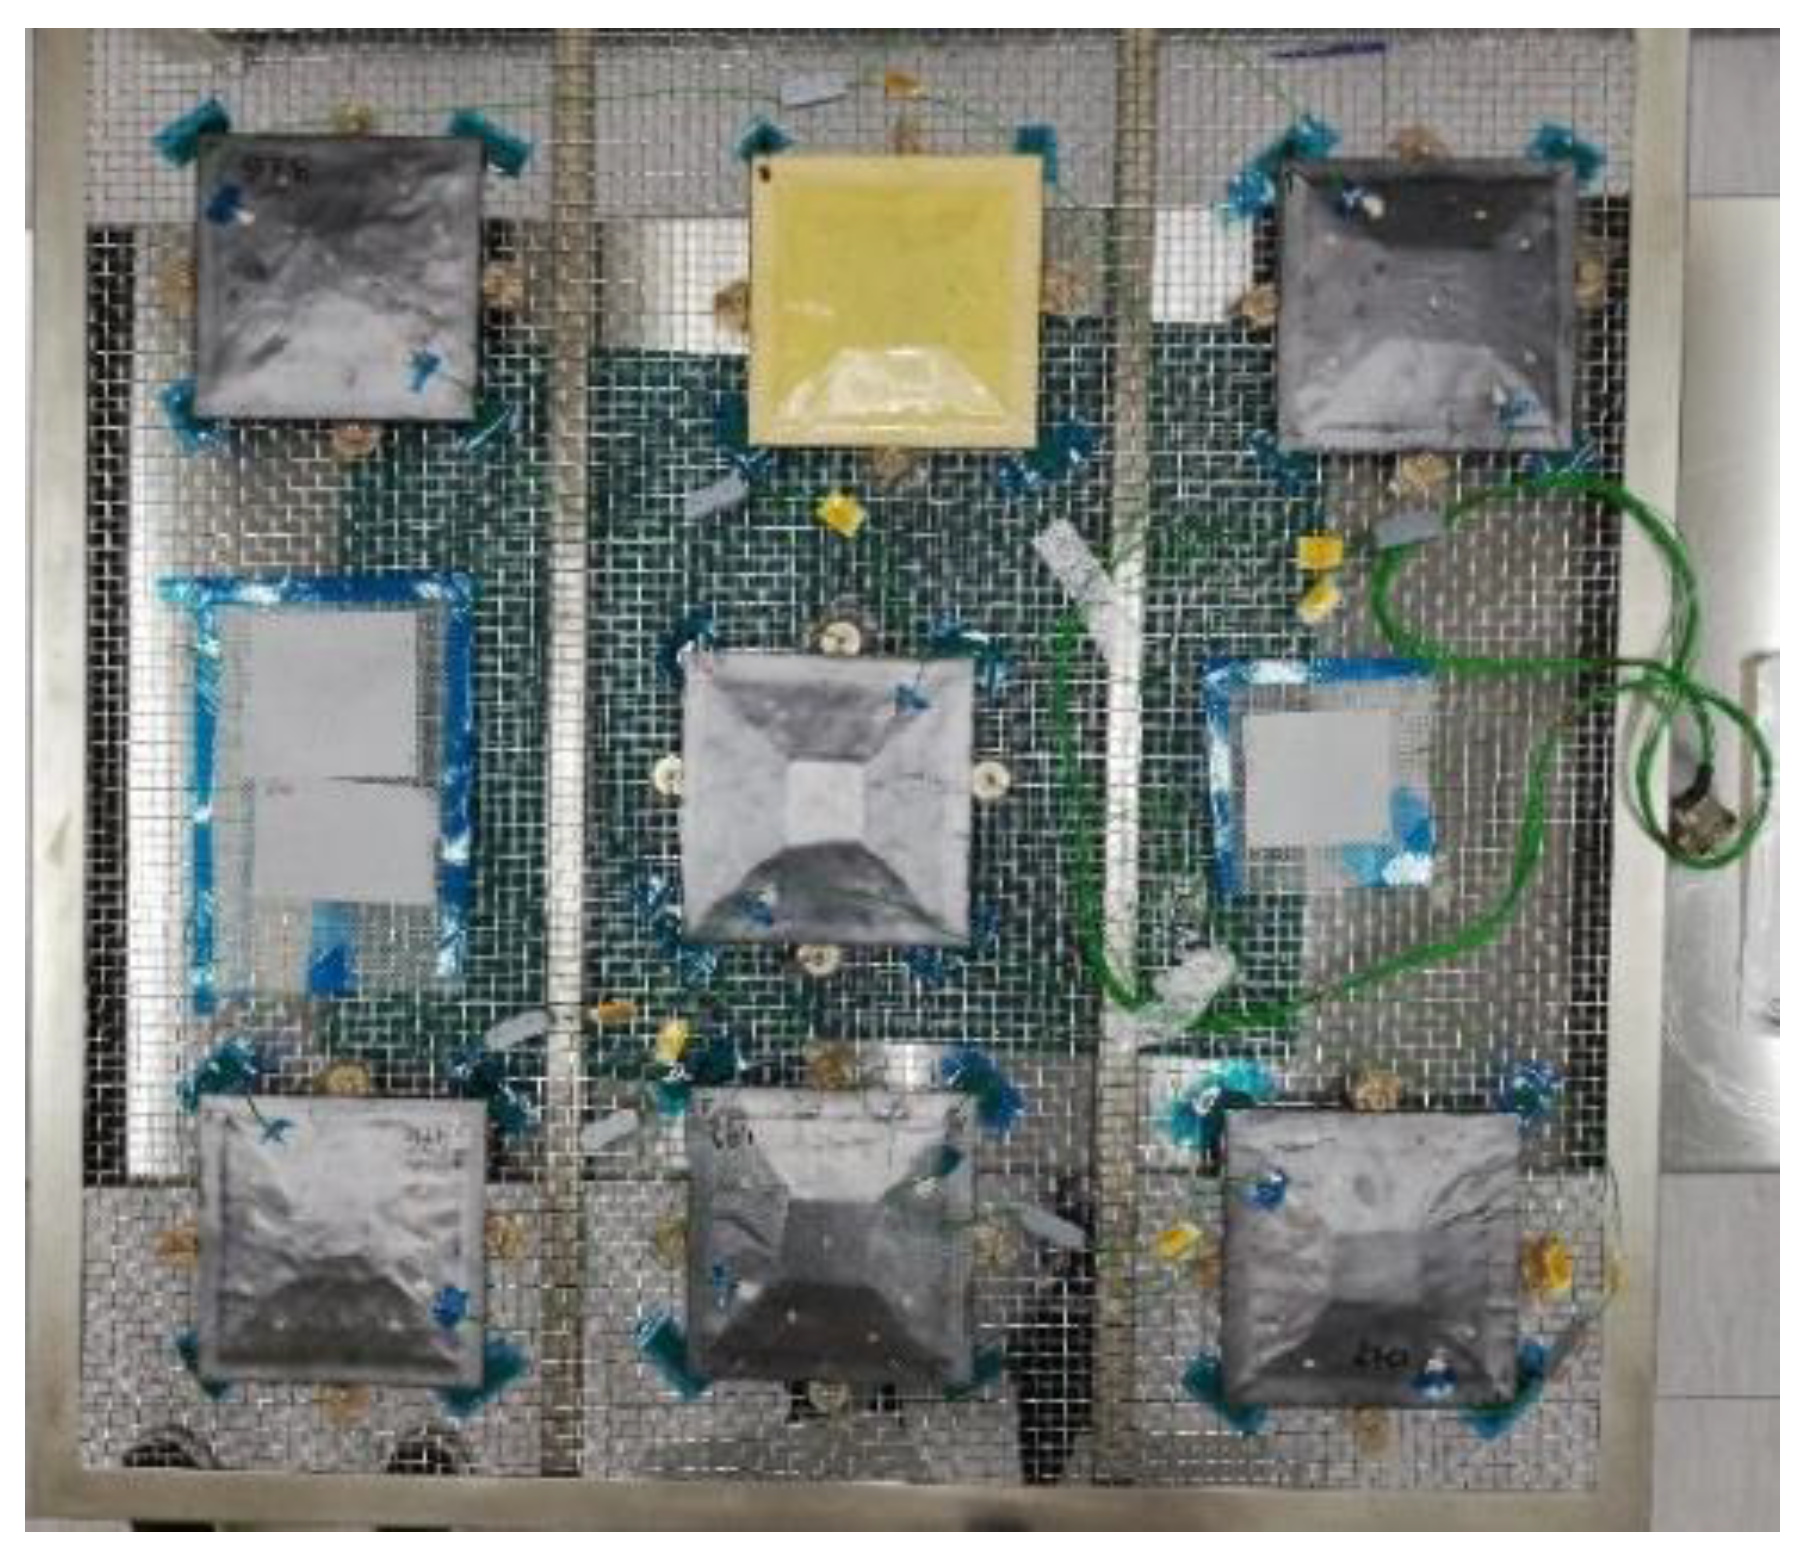
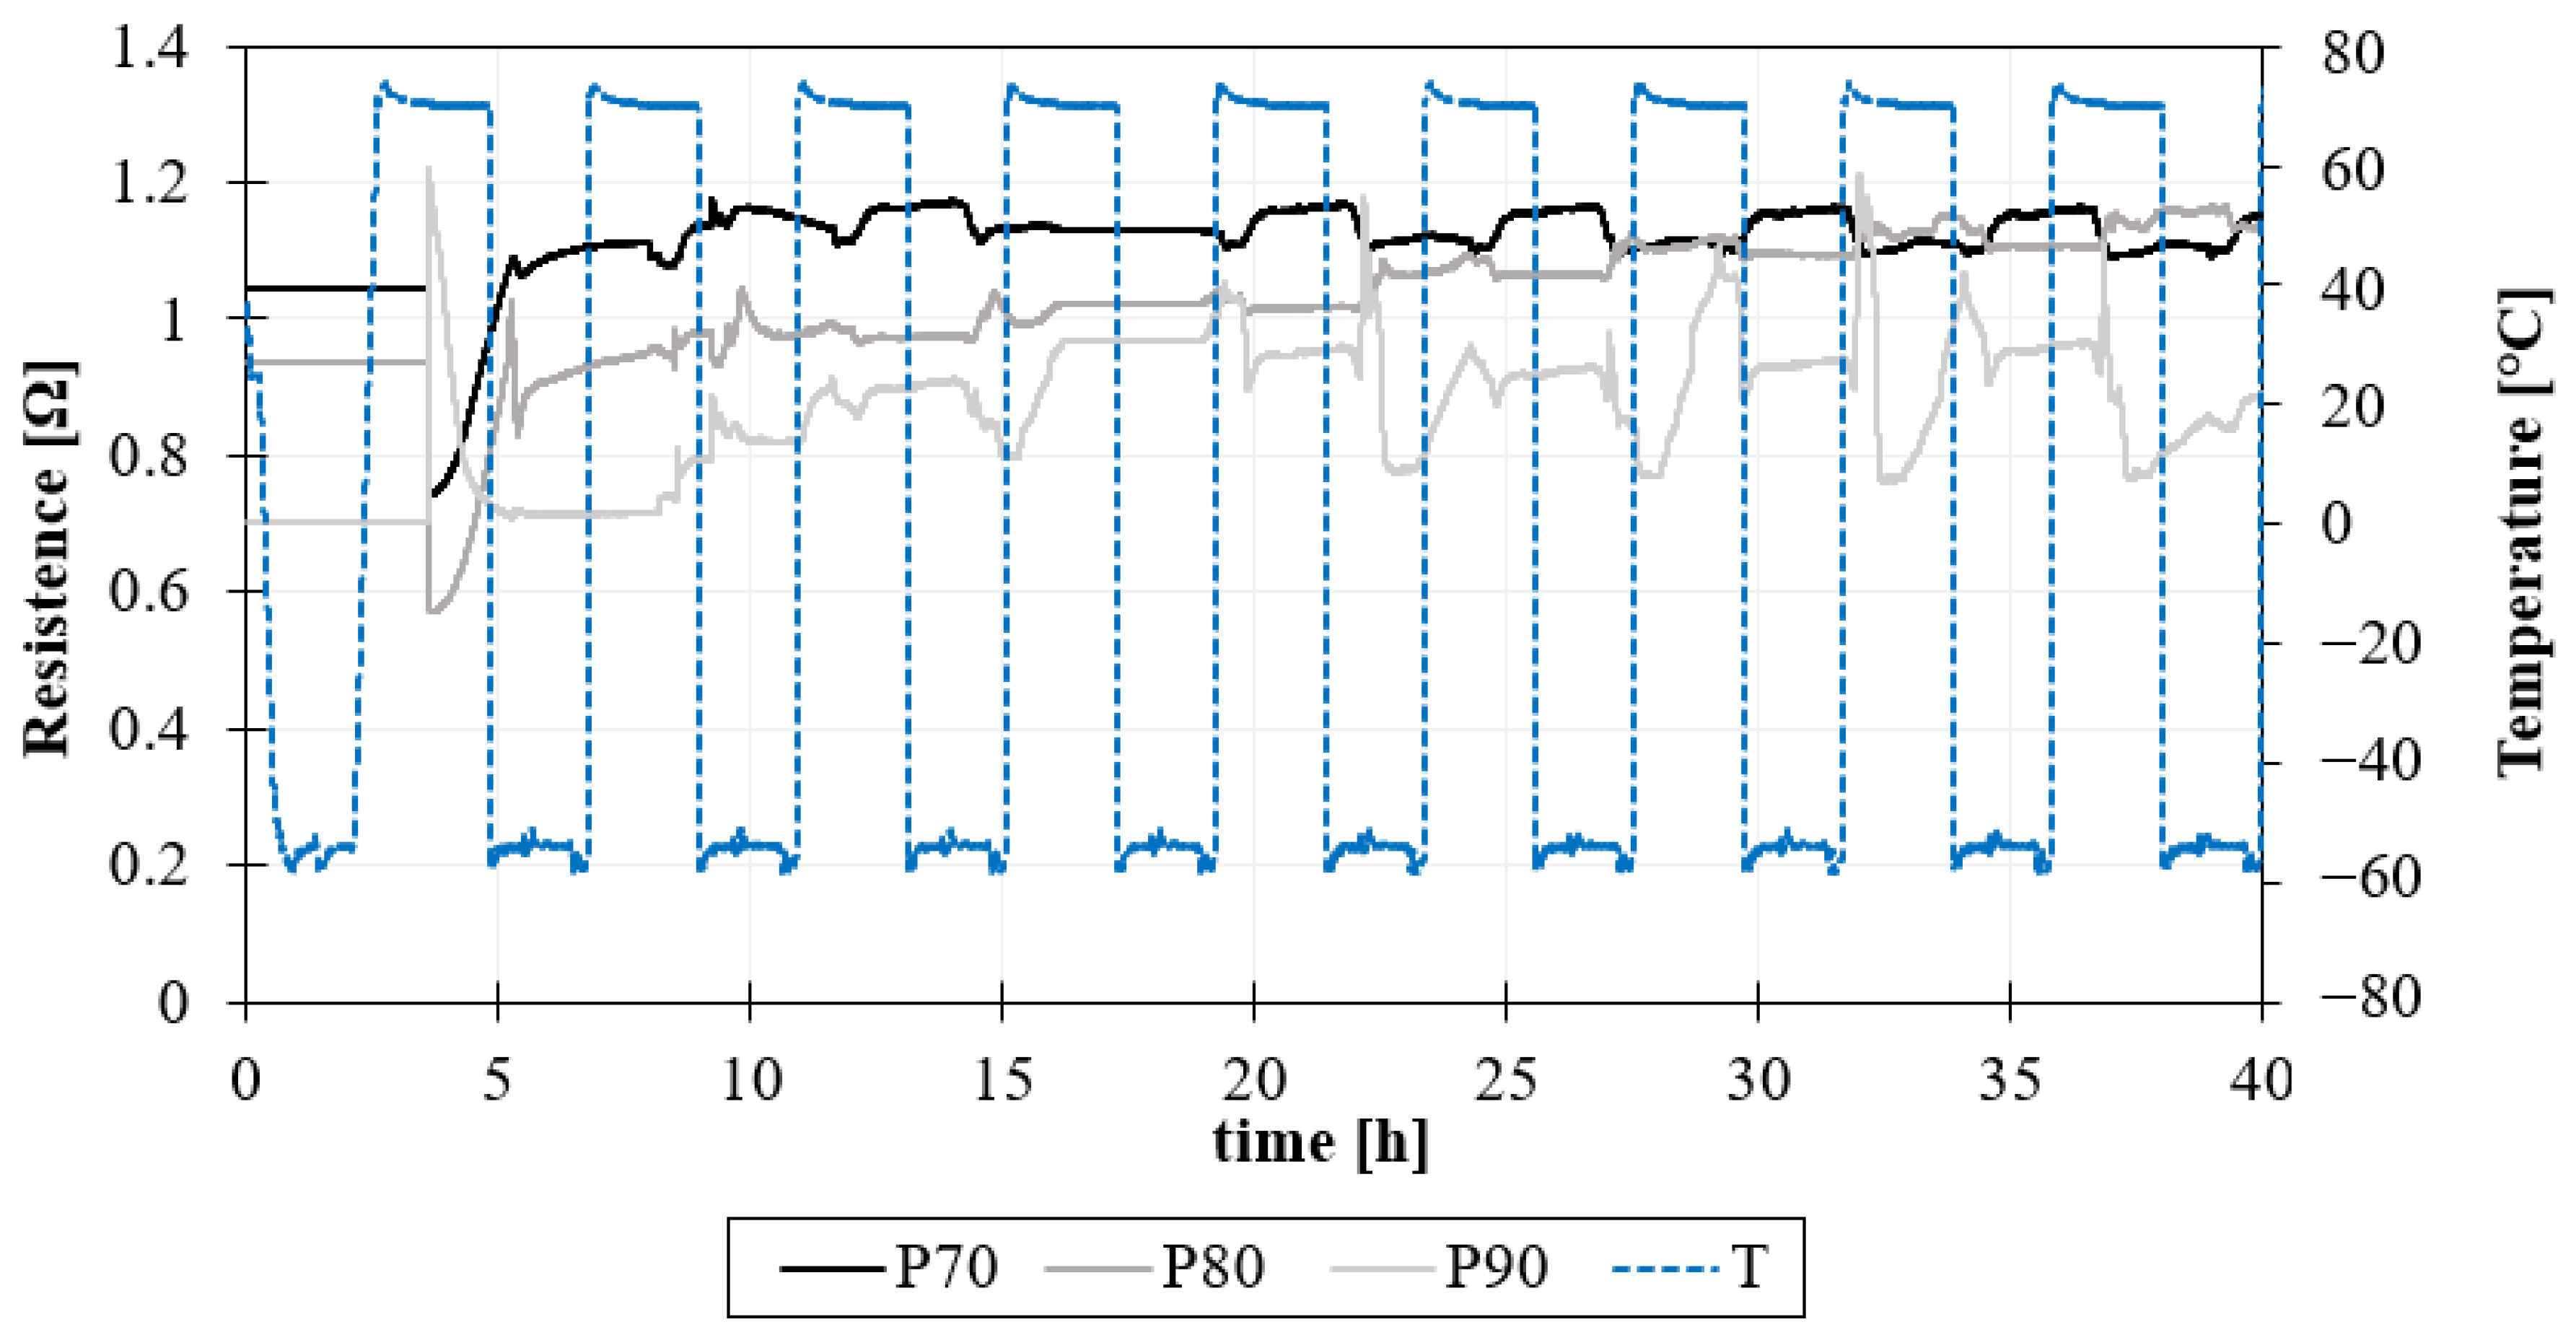
During the GAG test, the integrity of the graphene layer on the surface was monitored by measuring the electrical conductivity of the layer. Two electric wires were fastened with a conductive paste on the diagonal of each specimen and the different specimens were connected in series, as shown in
Figure 10. The samples were fed with a 100 mA current, and voltage was recorded across each sample.
The results of the surface resistance measurements of specimens during the GAG test, until the 10th cycle, are reported in
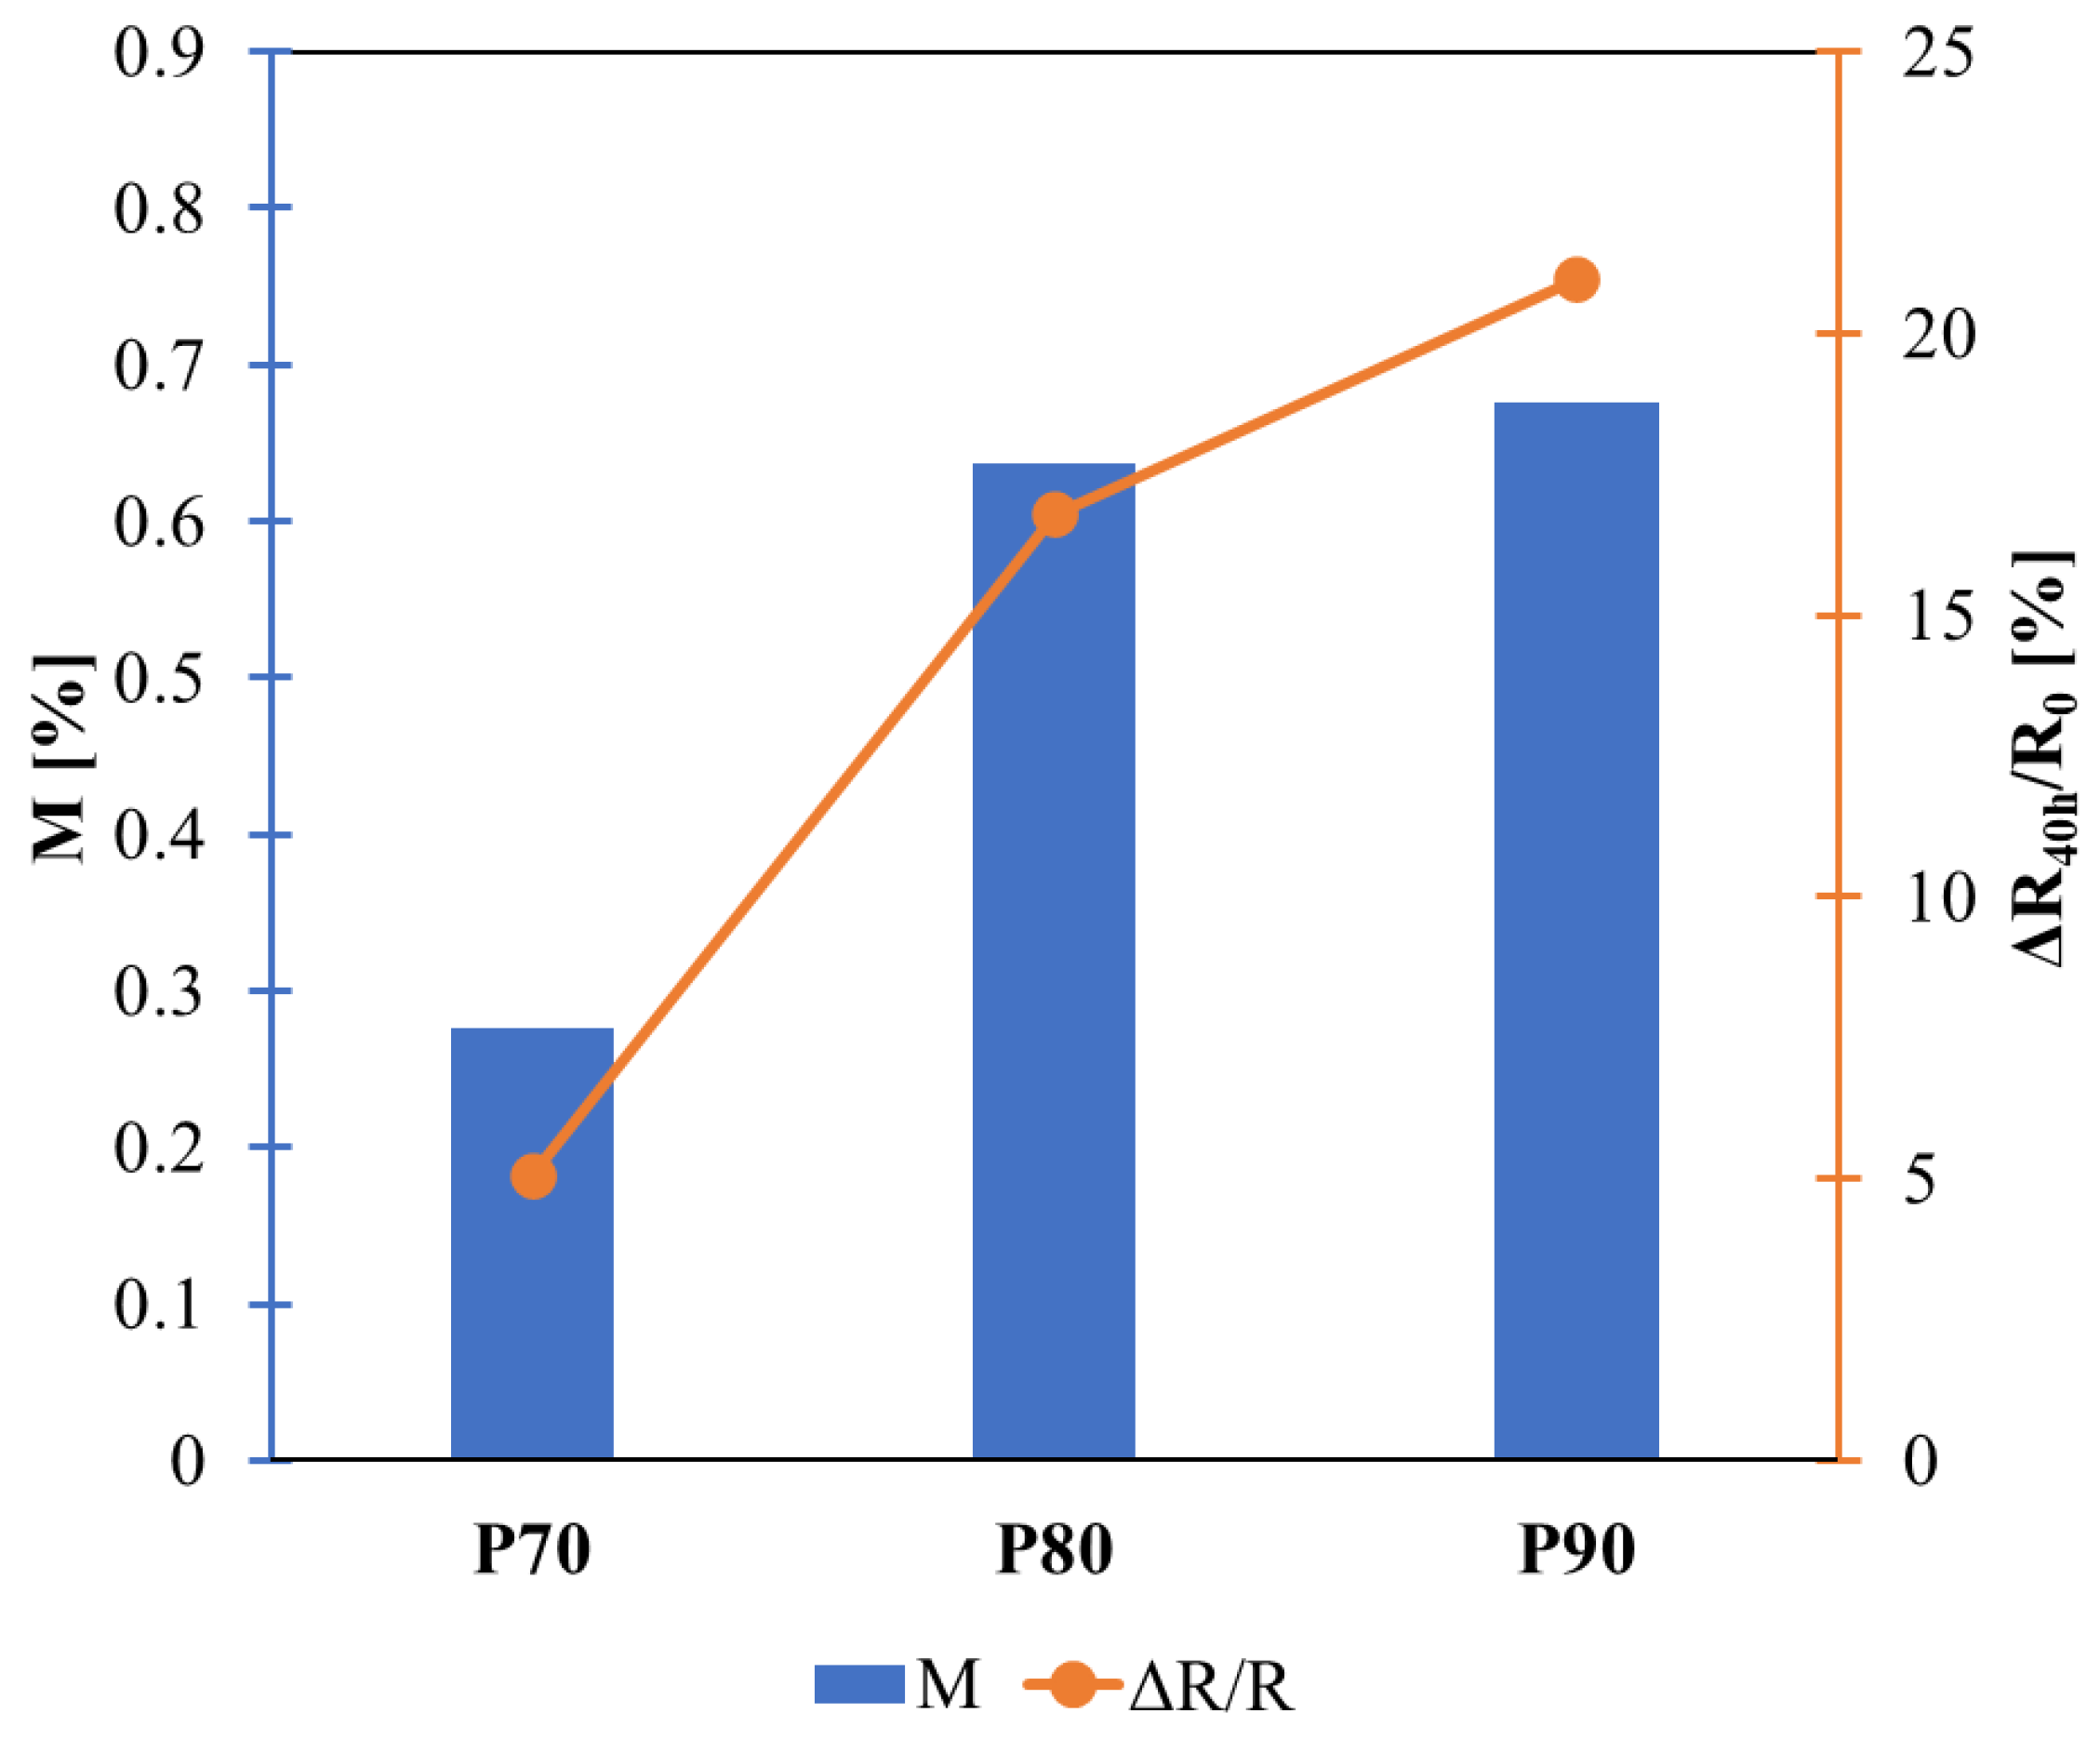
Figure 11. The resistance slightly increases during the test for all samples due to water absorption, as reported in
Figure 12.
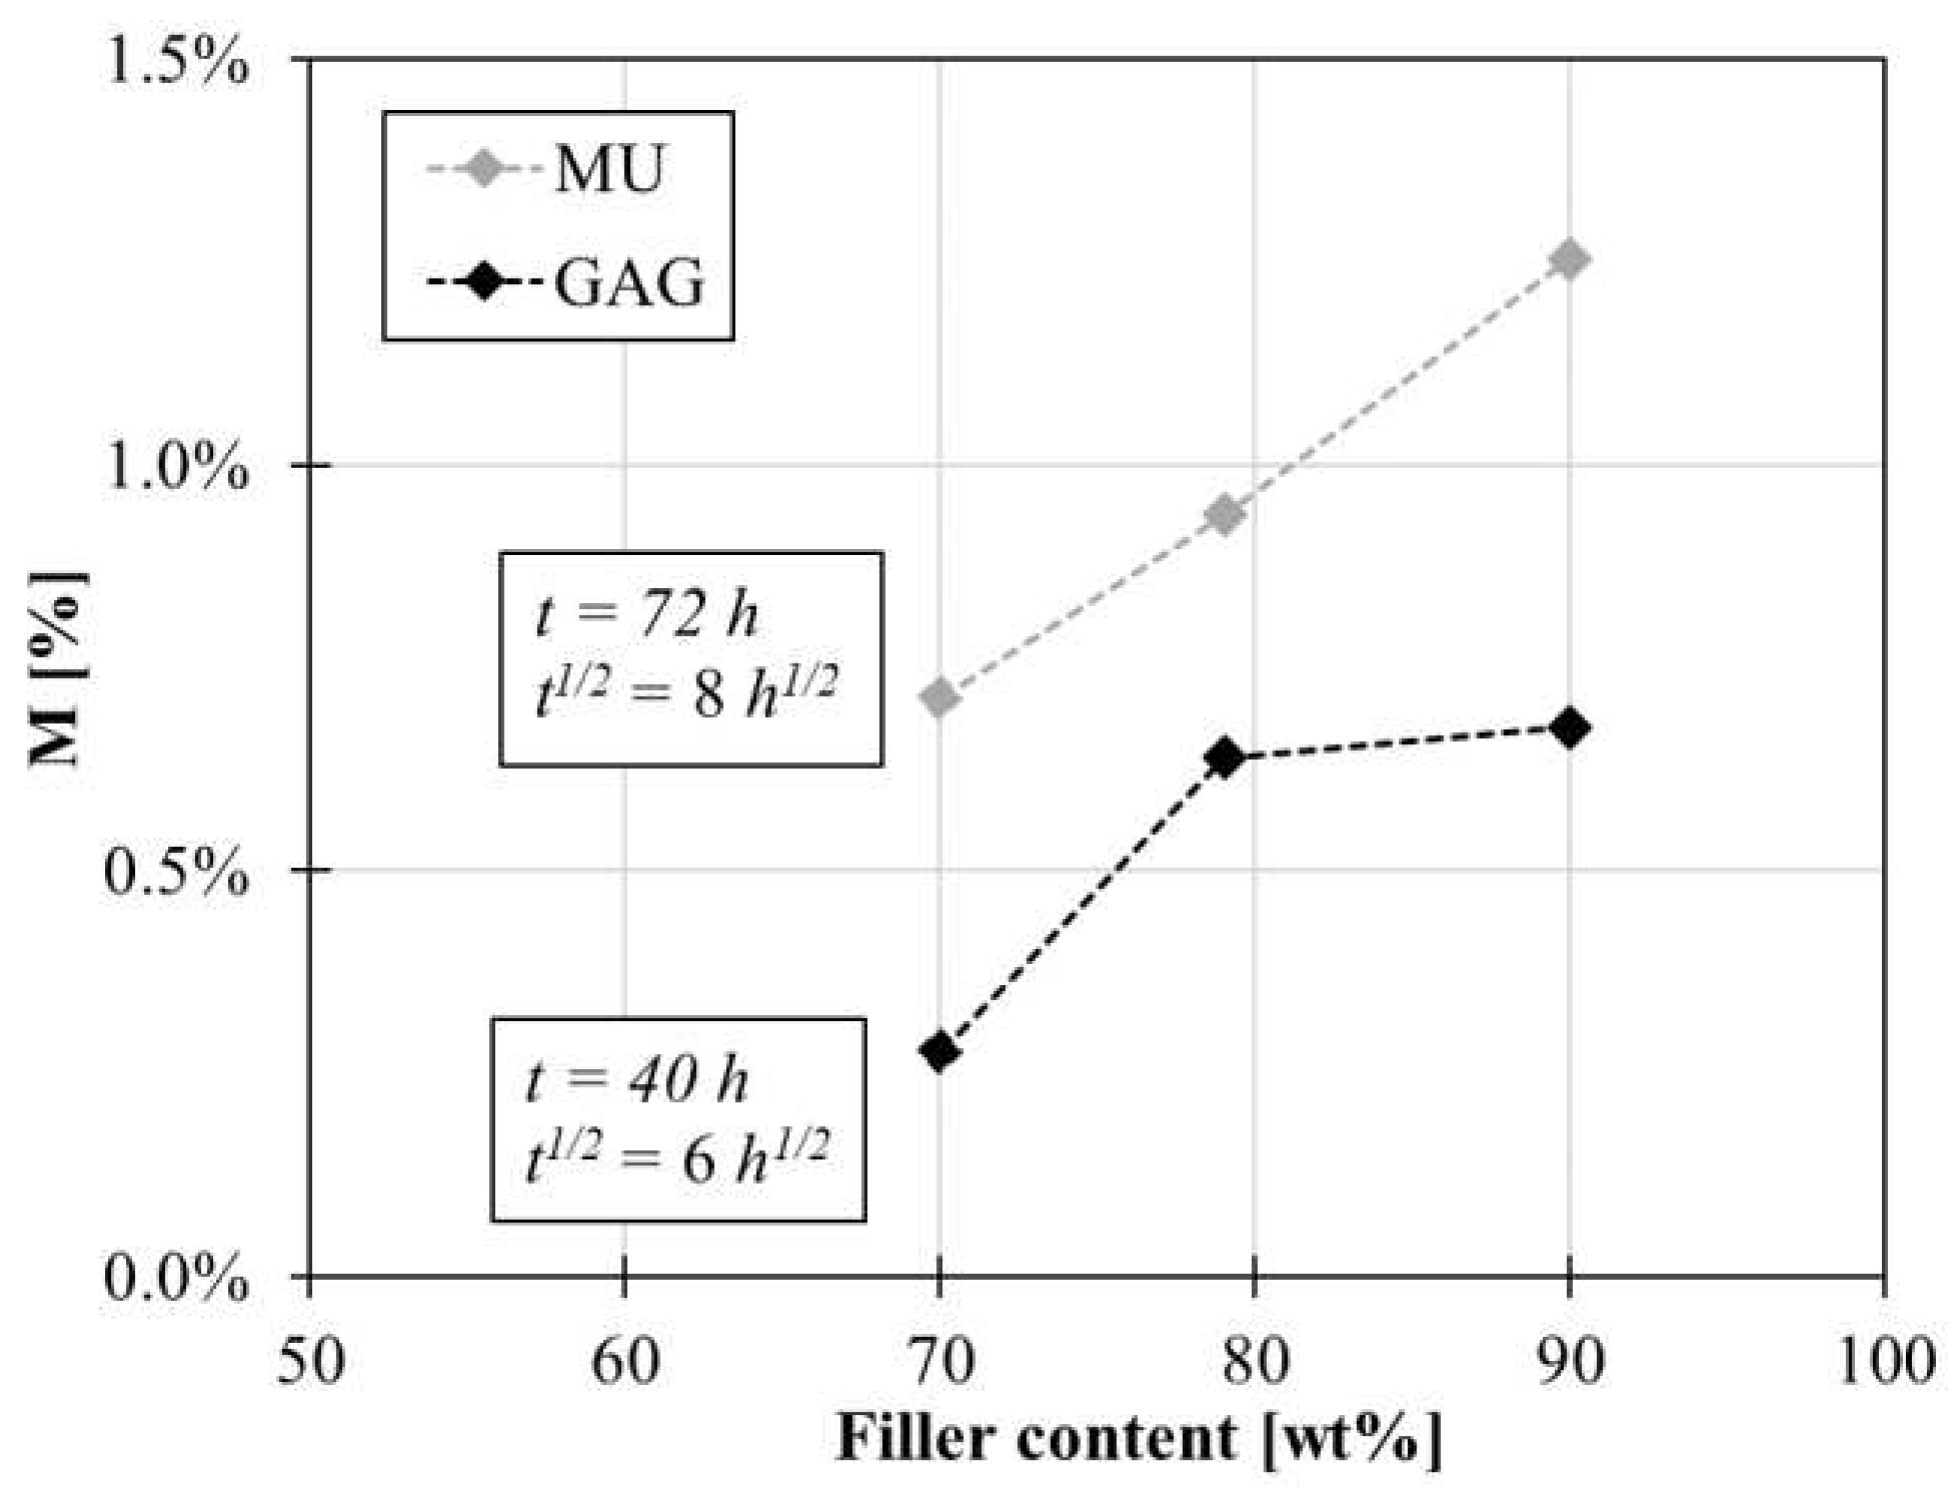
By comparing the results of the moisture uptake and GAG test, similar behaviours with graphene coating composition are found, as shown in
Figure 13. In the case of the MU test after 72h the absorption sensible reduces in the panels coated with graphene layers compared to the uncoated panel by −71% for P70, −61% for P80 and −41% @90wt% for P90. Likewise in the case of the GAG test after 40h the panel absorption reduces by −85% for P70, −65% for P80 and −63% for P90 compared to P REF.
4.2. Non-destructive inspection of sandwich plates
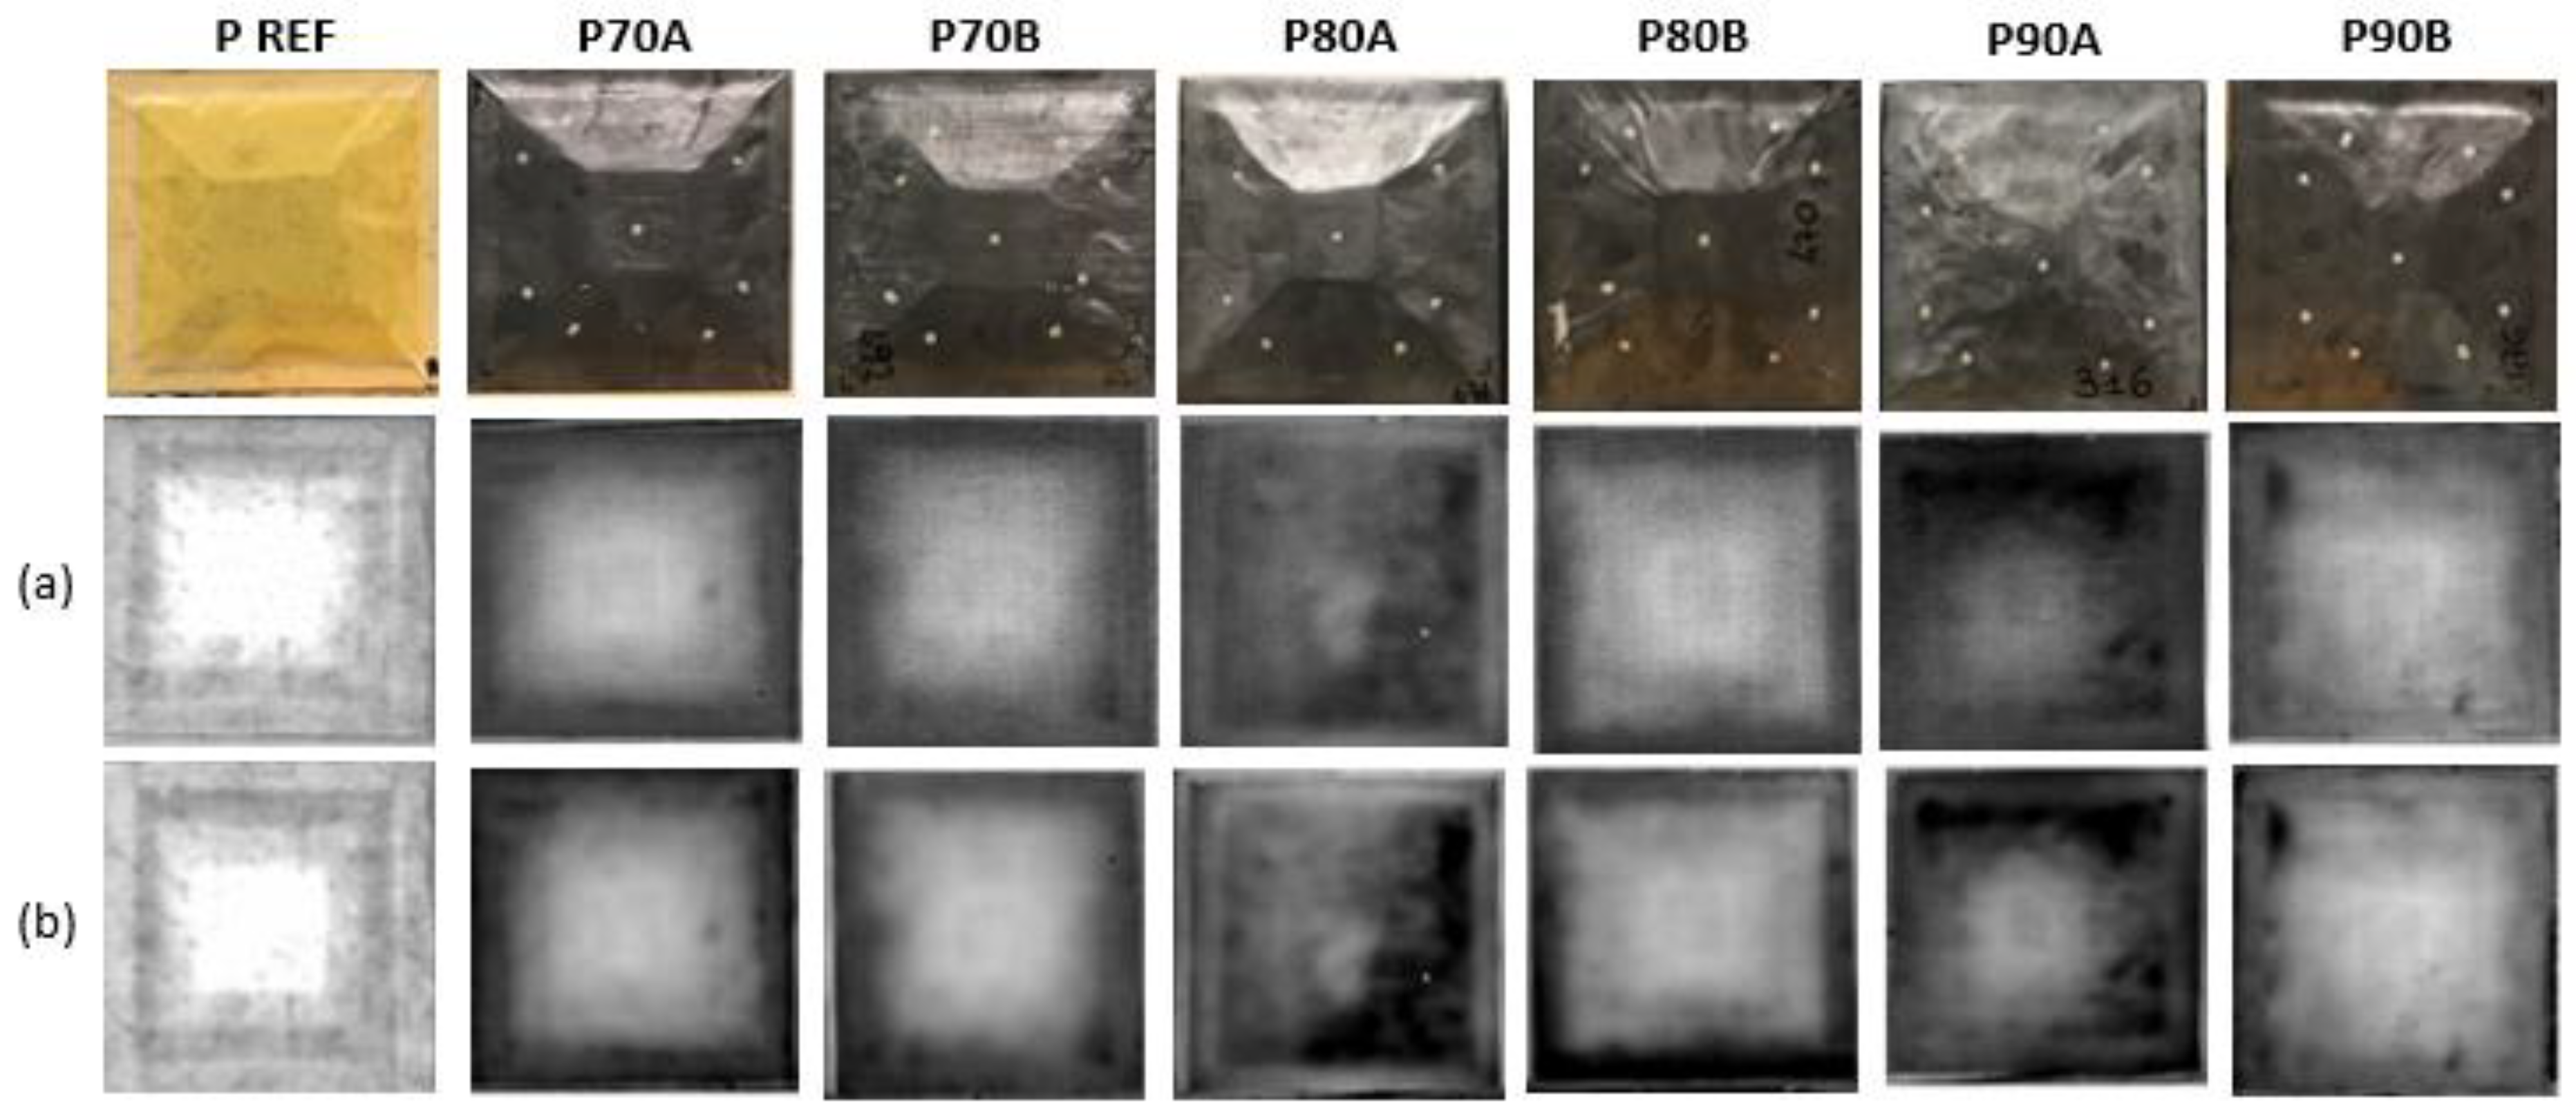
Non-destructive inspections on specimens before and after the moisture uptake test revealed that the panels did not experience damage.
Figure 14 and
Figure 15 show the results of the NDI analysis conducted on the lower surface of the samples at different frequencies of 0.1 Hz and 0.04 Hz. By decreasing the frequency, different depths of the samples are investigated, at 0.04 Hz it is even possible to observe the taper of the inner core. By comparing the images of samples before and after the test, for both sampling frequencies, it appears that the induced stress of the moisture uptake test does not produce any damage. Analogous results are obtained from the NDI after the GAG test. The induced stress of flight cycle simulations did not cause internal damage.
5. Conclusions
The effectiveness of protection against moisture uptake of graphene-rich films has been investigated through a moisture uptake test in an environmental chamber. The behaviour of Kevlar sandwich panels, representative of a regional aircraft composite part, in a humid environment, has been investigated, and the ability of graphene films to protect Kevlar/Epoxy panels from water absorption has been demonstrated.
After 40 days in a humid environment, the maximum sorption is reduced by −30% in samples protected with films @70 wt% of GNPs. Also, an evident delay in the absorption rate into the composite panels due to the presence of the protective layer has been observed. Similarly, the GAG test showed that after 10 cycles, the maximum sorption of the panel coated with films @70 wt% of GNPs is about 70% lower than that of the uncoated one. NDI analysis with lock-in thermography revealed the absence of damage in all panels after the test.
Thanks to the nanoplatelet alignment and the intrinsic hydrophobicity of GNPs, the film acts as a barrier to moisture. The effect of graphene film architecture has been investigated, showing that the nanocomposite inner architecture plays an important role in the barrier properties. Although with the increasing filler content the tortuosity factor of nanolamellar nanocomposites increases, the nanocomposite nanostructure is affected by dry areas, which promotes moisture absorption. In addition, a more hydrophilic behaviour is found for nanocomposites with 90 wt% compared to those with 70 wt%.
Experimental findings suggested that graphene films @70 wt% of GNPs represent a promising technology to be employed as lightweight barrier coating in the aeronautics field, thanks to the significant reduction of the moisture’s permeation inside a composite panel and the easy integration in the manufacturing processes. In addition, thanks to the low electrical resistivity, the rich graphene films provide additional functionality, extending their application to shielding against electrostatic discharges and electromagnetic waves.
Author Contributions
Conceptualization FC and AM; methodology BP, GB and RV; Investigation FC, GB, CCT and CT; data curation FC, BP and CT; writing-original draft preparation FC, BP and RV; writing-review and editing AM, GG and MG; supervision AM, MG and GG; funding acquisition MG, AM and GG. All authors have read and agreed to the published version of the manuscript.
Funding
This work has been supported by the Research Project AMICO (code ARS01_00758) funded by the Italian Ministry of Education, University and Research.
Institutional Review Board Statement
Not applicable.
Informed Consent Statement
Not applicable.
Data Availability Statement
The data presented in this study are available in the article.
Acknowledgements
The authors would like to thank Mr. Nicola Gallo and Mr. Giovanni Barletta for their precious advice and discussions.
Conflicts of Interest
The authors declare no conflict of interest.
References
- Soutis, C. Carbon fiber reinforced plastics in aircraft construction. Mater. Sci. Eng. A 2005, 412, 171–176. [Google Scholar] [CrossRef]
- Kim, K.S. Hygroscopic Effects in Aramid Fiber / Epoxy Composite. 2017, 110, 153–157.
- Xiao, G.Z.; Shanahan, M.E.R. Water absorption and desorption in an epoxy resin with degradation. J. Polym. Sci. part B Polym. Phys. 1997, 35, 2659–2670. [Google Scholar] [CrossRef]
- Wan, Y.Z.; Wang, Y.L.; Huang, Y.; Luo, H.L.; He, F.; Chen, G.C. Moisture absorption in a three-dimensional braided carbon/Kevlar/epoxy hybrid composite for orthopaedic usage and its influence on mechanical performance. Compos. Part A Appl. Sci. Manuf. 2006, 37, 1480–1484. [Google Scholar] [CrossRef]
- Eckstein, B.H. Moisture absorption by epoxy laminating resins. In Proceedings of the ABSTRACTS OF PAPERS OF THE AMERICAN CHEMICAL SOCIETY; AMER CHEMICAL SOC 1155 16TH ST, NW, WASHINGTON, DC 20036, 1978; Vol. 175, p. 98.
- Olmos, D.; López-Morón, R.; González-Benito, J. The nature of the glass fibre surface and its effect in the water absorption of glass fibre/epoxy composites. The use of fluorescence to obtain information at the interface. Compos. Sci. Technol. 2006, 66, 2758–2768. [Google Scholar] [CrossRef]
- Velmurugan, G.; Natrayan, L. Experimental investigations of moisture diffusion and mechanical properties of interply rearrangement of glass/Kevlar-based hybrid composites under cryogenic environment. J. Mater. Res. Technol. 2023, 23, 4513–4526. [Google Scholar] [CrossRef]
- Verpoest, I.; Springer, G.S. Moisture Absorption Characteristics of Aramid-Epoxy Composites. J. Reinf. Plast. Compos. 1988, 7, 2–22. [Google Scholar] [CrossRef]
- Gopalan, R.; Rao, R. m. v. g. k.; Murthy, M.V.V.; Dattaguru, B. Diffusion Studies on Advanced Fibre Hybrid Composites. J. Reinf. Plast. Compos. 1986, 5, 51–61. [Google Scholar] [CrossRef]
- McKague Jr, E.L.; Reynolds, J.D.; Halkias, J.E. Swelling and glass transition relations for epoxy matrix material in humid environments. J. Appl. Polym. Sci. 1978, 22, 1643–1654. [Google Scholar] [CrossRef]
- Mijović, J.; Lin, K. The effect of hygrothermal fatigue on physical/mechanical properties and morphology of neat epoxy resin and graphite/epoxy composite. J. Appl. Polym. Sci. 1985, 30, 2527–2549. [Google Scholar] [CrossRef]
- Xiao, G.Z.; Shanahan, M.E.R. Swelling of DGEBA/DDA epoxy resin during hygrothermal ageing. Polymer (Guildf). 1998, 39, 3253–3260. [Google Scholar] [CrossRef]
- Yahaya, R.; Sapuan, S.M.; Jawaid, M.; Leman, Z.; Zainudin, E.S. Water absorption behaviour and impact strength of Kenaf-Kevlar reinforced epoxy hybrid composites. Adv. Compos. Lett. 2016, 25, 98–102. [Google Scholar] [CrossRef]
- Yeung, K.K.H.; Rao, K.P. Mechanical Properties of Kevlar-49 Fibre Reinforced Thermoplastic Composites. Polym. Polym. Compos. 2012, 20, 411–424. [Google Scholar] [CrossRef]
- Cise, D.; Lakes, R.S. Moisture ingression in honeycomb core sandwich panels. J. Mater. Eng. Perform. 1997, 6, 732–736. [Google Scholar] [CrossRef]
- Shafizadeh, J.E.; Seferis, J.C.; Chesmar, E.F.; Frye, B.A.; Geyer, R. Evaluation of the mechanisms of water migration through honeycomb core. J. Mater. Sci. 2003, 38, 2547–2555. [Google Scholar] [CrossRef]
- Glass, D.E.; Raman, V. V; Venkat, V.S.; Sankaran, S.N. Honeycomb core permeability under mechanical loads; 1997.
- Choi, H.S.; Jang, Y.H. Bondline strength evaluation of cocure/precured honeycomb sandwich structures under aircraft hygro and repair environments. Compos. Part A Appl. Sci. Manuf. 2010, 41, 1138–1147. [Google Scholar] [CrossRef]
- Sturgeon, A.; Dunn, B.; Celotto, S.; O’Neill, W. Cold sprayed coatings for polymer composite substrate. ESA SP 2006, 616, 1–5. [Google Scholar]
- Edrisy, A.; Perry, T.; Cheng, Y.T.; Alpas, A.T. The effect of humidity on the sliding wear of plasma transfer wire arc thermal sprayed low carbon steel coatings. Surf. Coatings Technol. 2001, 146–147, 571–577. [Google Scholar] [CrossRef]
- Boningari, T.; Inturi, S.N.R.; Suidan, M.; Smirniotis, P.G. Novel one-step synthesis of sulfur doped-TiO2 by flame spray pyrolysis for visible light photocatalytic degradation of acetaldehyde. Chem. Eng. J. 2018, 339, 249–258. [Google Scholar] [CrossRef]
- Gaztelumendi, I.; Chapartegui, M.; Seddon, R.; Flórez, S.; Pons, F.; Cinquin, J. Enhancement of electrical conductivity of composite structures by integration of carbon nanotubes via bulk resin and/or buckypaper films. Compos. Part B Eng. 2017, 122, 31–40. [Google Scholar] [CrossRef]
- Kececi, E.; Asmatulu, R. Effects of moisture ingressions on mechanical properties of honeycomb-structured fiber composites for aerospace applications. Int. J. Adv. Manuf. Technol. 2017, 88, 459–470. [Google Scholar] [CrossRef]
- Kececi, E.; Asmatulu, R. Effects of moisture ingression on polymeric laminate composites and its prevention via highly robust barrier films. Int. J. Adv. Manuf. Technol. 2014, 73, 1657–1664. [Google Scholar] [CrossRef]
- Cui, Y.; Kundalwal, S.I.; Kumar, S. Gas barrier performance of graphene/polymer nanocomposites. Carbon N. Y. 2016, 98, 313–333. [Google Scholar] [CrossRef]
- Cilento, F.; Leone, C.; Genna, S.; Giordano, M.; Martone, A. Graphene NanoPlatelet-based coating as thermal protection from high-power radiative fluxes. Compos. Struct. 2023, 319, 117157. [Google Scholar] [CrossRef]
- Wu, H.; Drzal, L.T. Graphene nanoplatelet paper as a light-weight composite with excellent electrical and thermal conductivity and good gas barrier properties. Carbon N. Y. 2012, 50, 1135–1145. [Google Scholar] [CrossRef]
- Li, X.; Manasrah, A.; Al-ostaz, A.; Alkhateb, H.; Lincoln, D.; Rushing, G.; Cheng, A.H. Preparation and Characterization of High Content Graphene Nanoplatelet-Polyetherimide Paper. J. Nanosci. Nanoeng. 2015, 1, 252–258. [Google Scholar]
- Cilento, F.; Martone, A.; Pastore Carbone, M.G.; Galiotis, C.; Giordano, M. Nacre-like GNP/Epoxy composites: Reinforcement efficiency vis-à-vis graphene content. Compos. Sci. Technol. 2021, 211, 108873. [Google Scholar] [CrossRef]
- ASTM-D5229 Standard Test Method for Moisture Absorption Properties and Equilibrium Conditioning of Polymer Matrix Composite Materials 2020.
- Tyler, W.W.; Wilson Jr, A.C. Thermal conductivity, electrical resistivity, and thermoelectric power of graphite. Phys. Rev. 1953, 89, 870. [Google Scholar] [CrossRef]
- Carter, S. Electrostatic Discharge (ESD) Properties of Plastic Packaging: Terminology. Stand. Meas. Tek Pak Tech. Bull.
- Cilento, F.; Curcio, C.; Martone, A.; Liseno, A.; Capozzoli, A.; Giordano, M. Effect of Graphite Nanoplatelets Content and Distribution on the Electromagnetic Shielding Attenuation Mechanisms in 2D Nanocomposites. J. Compos. Sci. 2022, 6, 257. [Google Scholar] [CrossRef]
- van Es, M.A. Polymer-clay nanocomposites : the importance of particle dimensions. Thesis 2001, 252. [Google Scholar]
- Aronhime, M.T.; Neumann, S.; Marom, G. The anisotropic diffusion of water in Kevlar-epoxy composites. J. Mater. Sci. 1987, 22, 2435–2446. [Google Scholar] [CrossRef]
- Li, J.; Wang, S.; Lai, L.; Liu, P.; Wu, H.; Xu, J.; Severtson, S.J.; Wang, W.-J. Synergistic enhancement of gas barrier and aging resistance for biodegradable films with aligned graphene nanosheets. Carbon N. Y. 2021, 172, 31–40. [Google Scholar] [CrossRef]
- Nielsen, L.E. Models for the Permeability of Filled Polymer Systems. J. Macromol. Sci. Part A - Chem. 1967, 5, 37–41. [Google Scholar] [CrossRef]
- Cilento, F.; Martone, A.; Cristiano, F.; Fina, A.; Giordano, M. Effect of Matrix Content on Mechanical and Thermal Properties of High Graphene Content Composites. MATEC Web Conf. 2019, 303, 01002. [Google Scholar] [CrossRef]
- Cilento, F.; Martone, A.; Giordano, M. Insights on Shear Transfer Efficiency in “ Brick-and-Mortar ” Composites Made of 2D Carbon Nanoparticles. Nanomaterials 2022. [Google Scholar] [CrossRef] [PubMed]
- Miao, A.; Wei, M.; Xu, F.; Wang, Y. Influence of membrane hydrophilicity on water permeability: An experimental study bridging simulations. J. Memb. Sci. 2020, 604, 118087. [Google Scholar] [CrossRef]
- Pandit, S.; Gaska, K.; Mokkapati, V.R.S.S.; Celauro, E.; Derouiche, A.; Forsberg, S.; Svensson, M.; Kádár, R.; Mijakovic, I. Precontrolled Alignment of Graphite Nanoplatelets in Polymeric Composites Prevents Bacterial Attachment. Small 2020, 16, 1–11. [Google Scholar] [CrossRef]
Figure 1.
Geometry of the Kevlar sandwich panel.
Figure 1.
Geometry of the Kevlar sandwich panel.
Figure 2.
Panel manufacturing, stacking and vacuum bagging cure (a); External surfaces both uncoated and coated samples (b,c).
Figure 2.
Panel manufacturing, stacking and vacuum bagging cure (a); External surfaces both uncoated and coated samples (b,c).
Figure 3.
(a) Panels positioning on the metallic grid; (b) Uncoated panel; (c) GNP coated panel.
Figure 3.
(a) Panels positioning on the metallic grid; (b) Uncoated panel; (c) GNP coated panel.
Figure 4.
TGA curves of graphene films at different GNPs content.
Figure 4.
TGA curves of graphene films at different GNPs content.
Figure 5.
Moisture uptake with time of uncoated and coated panels.
Figure 5.
Moisture uptake with time of uncoated and coated panels.
Figure 6.
Water diffusivity in the panels at 3 days.
Figure 6.
Water diffusivity in the panels at 3 days.
Figure 7.
SEM images of graphene films and sketch their nanoarchitecture at the various filler content: (a) 70 wt% and (b) 90 wt%.
Figure 7.
SEM images of graphene films and sketch their nanoarchitecture at the various filler content: (a) 70 wt% and (b) 90 wt%.
Figure 8.
Contact angle measurements on graphene films @70 wt% and 90 wt%.
Figure 8.
Contact angle measurements on graphene films @70 wt% and 90 wt%.
Figure 9.
GAG test: temperature, humidity, and pressure profiles.
Figure 9.
GAG test: temperature, humidity, and pressure profiles.
Figure 10.
Kevlar sandwich panel samples: positioning in the chamber and set up for electrical conductivity measurements.
Figure 10.
Kevlar sandwich panel samples: positioning in the chamber and set up for electrical conductivity measurements.
Figure 11.
Electrical resistance vs. time for each panel during the 10 cycles (40 h) of the GAG test.
Figure 11.
Electrical resistance vs. time for each panel during the 10 cycles (40 h) of the GAG test.
Figure 12.
Trend of moisture uptake and variation of resistance at the end of the GAG test.
Figure 12.
Trend of moisture uptake and variation of resistance at the end of the GAG test.
Figure 13.
Comparison between MU and GAG tests.
Figure 13.
Comparison between MU and GAG tests.
Figure 14.
Thermal images: (a) before performing the test; (b) after the moisture uptake test at 0.1 Hz.
Figure 14.
Thermal images: (a) before performing the test; (b) after the moisture uptake test at 0.1 Hz.
Figure 15.
Thermal images: (a) before performing the test; (b) after the moisture uptake test at 0.04 Hz.
Figure 15.
Thermal images: (a) before performing the test; (b) after the moisture uptake test at 0.04 Hz.
Table 1.
List of fabricated panels.
Table 1.
List of fabricated panels.
| Panel ID |
Description |
| P-REF |
No coating |
| P70-A; P70-B |
70 wt% GNP coating |
| P80-A; P80-B |
80 wt% GNP coating |
| P90-A; P90-B |
90 wt% GNP coating |
Table 2.
Weighing schedule for moisture uptake test.
Table 2.
Weighing schedule for moisture uptake test.
| Weight |
time (days) |
time (hours) |
| W0
|
0 |
0 |
| W1
|
3 |
72 |
| W2
|
6 |
144 |
| W3
|
13 |
312 |
| W4
|
20 |
480 |
| W5
|
27 |
648 |
| W6
|
34 |
816 |
| W7
|
41 |
984 |
Table 4.
Values of electrical resistivity of graphene papers.
Table 4.
Values of electrical resistivity of graphene papers.
Filler content
[wt%] |
Resistance,
R
[Ω] |
Width,
w
[mm] |
Length,
L
[mm] |
Thickness,
t
[µm] |
Resistivity,
ρ
[Ωm] |
| 80 |
4.70 |
10 |
55 |
72 |
8.54 x 10⁻⁵
|
| 85 |
3.49 |
11 |
57 |
71 |
6.75 x 10⁻⁵
|
| 90 |
1.82 |
16 |
40 |
73 |
4.96 x 10⁻⁵
|
Table 5.
Maximum moisture uptake after 41 days and water diffusivity at 3 days (t=259200 s) for tested panels.
Table 5.
Maximum moisture uptake after 41 days and water diffusivity at 3 days (t=259200 s) for tested panels.
| Panel ID |
wf, real
[%] |
M @ 41 days
[%] |
ΔM/ΔMmax @ 3days
[-] |
D
[m2/s] |
| P REF |
- |
3.4 |
0.55 |
3.8 x 10⁻¹²
|
| P70 A |
70 |
2.2 |
0.16 |
3.0 x 10⁻¹³
|
| P70 B |
70 |
2.3 |
0.17 |
3.7 x 10⁻¹³
|
| P80 A |
77 |
2.7 |
0.21 |
5.2 x 10⁻¹³
|
| P80 B |
86 |
2.7 |
0.24 |
7.2 x 10⁻¹³
|
| P90 A |
91 |
2.9 |
0.25 |
7.7 x 10⁻¹³
|
| P90 B |
91 |
3.0 |
0.26 |
8.0 x 10⁻¹³
|
Table 6.
Tortuosity factor in graphene films.
Table 6.
Tortuosity factor in graphene films.
wf.real
[wt%] |
vf
[vol%] |
τ
[-] |
| 69 |
56 |
598 |
| 84 |
76 |
810 |
| 90 |
84 |
897 |
Table 7.
Moisture uptake during the GAG test for each panel.
Table 7.
Moisture uptake during the GAG test for each panel.
| Panel ID |
M @ Cycle 1
[%] |
M @ Cycle 10
[%] |
| P REF |
0.59 |
1.81 |
| P70 |
0.07 |
0.28 |
| P80 |
0.18 |
0.64 |
| P90 |
0.17 |
0.68 |
|
Disclaimer/Publisher’s Note: The statements, opinions and data contained in all publications are solely those of the individual author(s) and contributor(s) and not of MDPI and/or the editor(s). MDPI and/or the editor(s) disclaim responsibility for any injury to people or property resulting from any ideas, methods, instructions or products referred to in the content. |
© 2023 by the authors. Licensee MDPI, Basel, Switzerland. This article is an open access article distributed under the terms and conditions of the Creative Commons Attribution (CC BY) license (http://creativecommons.org/licenses/by/4.0/).
