1. Introduction
Non-destructive evaluation of ballistic body armor plates is an emerging need both in the manufacturing processes and in service because it is the last defense of life saving in a battle field. Issues involved in the integrity and reliability evaluation of these plates include defects, delamination, cracks, and other structural integrity that make an armor plate to be defective. Occurrence of defective plate can be resulted in a number of circumferences such as from manufacturing processes, through rough service, and mishandling [
1,
2]. The existence of defects will lessen the ability of ballistic protection that armor plates may become compromised. In cases where the compromised plates may have shown that they are able to resist a threat [
3], the level of protection is very difficult to determine therefore any damage to armor plates results in its withdrawal from service [
4].
Body armor plates used in the field are classified in the forms of soft armors (Type I & II), hard armor (Type III), and multilayer armor (Type IV) [
5]. Types I and II are mainly Kevlar based structures, which is a heat-resistant para-aramid synthetic fiber with a molecular structure of many inter-chain bonds that make it incredibly strong. They can protect against the threats of bullets with velocity < 350 m/s, which includes most of handguns and some rifles. Type III has mixed structures of material layers with Kevlar and metals, which could resist bullets at a velocity up to 847 m/s. Type IV is made of ceramic, Kevlar, metal, and composites with armor-piercing which can resist bullets at a velocity of 878 m/s or higher, which are thus widely used in the military. In the present work, we will concentrate on damage detection and evaluation of Type IV body armor plates.
For years, various nondestructive methods were explored. X-ray [
6,
7,
8], acoustic emission (AE) [
9,
10], ultrasonics [
7,
9,
11,
12], infrared thermal imaging [
13,
14], and microwave scanning [
15]. Numerical simulation was shown to be useful as well [
16]. Of the listed techniques, X-ray, AE, and ultrasonics have been used extensively and reported widely. Ellingson et al conducted 84 experiments with samples made of ceramic composite. They fabricated their samples with various hidden defects. The authors tested the sample plates using several different nondestructive techniques including immersion phased array ultrasonics, transmission direct digital X-Ray imaging, scanning microwave, immersion single transducer scanning, ultrasound, and air coupled ultrasonics. They found phased array ultrasonic pulsing and X-Ray imaging to be the most cost and time effective [
17]. Weight assembled the drawbacks and benefits of nondestructive techniques for testing armor for the techniques of acoustics/ultrasonics, thermography, holography and shearography, radiography, microwave, and computed tomography. They concluded that computed tomography to be the most advanced in comparison to the other types, but indicated these two advanced techniques are time consuming and expensive [
18]. Margetan et al. manufactured their own armor plate prototypes (consisting of graphite epoxy, rubber, glass composite, ceramic, and then another glass composite) and tested them using a two transducer immersion pitch and catch system. They found that acoustic emission is effective at both finding and sizing delamination [
11,
19]. Richter et al. used time of flight in ultrasonic inspection to create simulation tools for inspection of multilayer armor [
20]. Using 50 MHz pulse, they found their model could simulate the response of the layers and materials used as well as holding promise for future additions to the model. Grabowski at el. used time-distance transformation to locate an acoustic emission source in thin metallic plates [
21]. The authors validated the ability to locate an AE source by using full AE waveforms and the basic geometry/material properties of the item being tested. A lead zirconate titanate transducers to excite flexural modes of the plates in the order of tens of kilohertz was reported in the work of Meitzler et al. [
22]. The authors showed PZT transducers, in a variant of the impact method can characterize the resonant modes of vibration of a ceramic armor plate.
The usage of Acousto-ultrasonics (AU) to detect damage was reported for various structures and materials in a range of work [
12]. The authors were able to distinguish the hidden defects from the received waveforms. This was because when a defect/damage is present, the wave interacts with the path changes therefore caused wave disruption. As a result, changes in terms of either dispersion or delay in the received waves indicated the presence of damage/defect. The authors showed a great potential for the detection of damage in composite structures and assessment of hard ballistic armor is ultrasonic guided waves.
In summary, there are five major methods used for nondestructive evaluation of body armor plates. The application and major advantages are listed as follows.
Thermography A heat source is applied to the surface of a material and the heat diffusion is tracked. Areas where there are defects or damage will cause the heat to not diffuse uniformly. From this, a schematic of the damage can be created. Temperature sensitivity decreases linearly with depth and deeper defects are not easily detected. Radiography A X-Ray or another energy source is used to create an image from the absorption of the particles. Sensitivity of this method is high and very useful in finding defects. This method can be limited as the fixture and equipment is bulky and not readily field accessible. Microwave Similar to radiography. Microwave energy is beamed onto the material and the backscatter is used to create an image. Microwave technology as a NDT method is rapidly advancing but currently has issues with conductive materials. Computed Tomography Computed Tomography uses either X-Ray or another energy source to scan a small slice of the material which is then digitally assembled to other slices until a model of the entire object is created. Acoustics Emission, Ultrasonic, and Acousto Ultrasonics Although there are many differences when using AE, Ultrasonics, and AU, there is a common scenario such that they, in essence, cope with high frequency signals regardless the signals are artificially applied or generated passively from the tested articles. The signals transmit in the body and propagate through the materials under detection. The artificially applied signals can be either pulse echoed or have an opposing receiver. Many efforts have been reported in the field of damage evaluation of ballistic armor plates.
We tabulated the suitability and application of nondestructive evaluation of ballistic armor plates based on the reported work in
Table 1.
In this table, NDT methods to evaluate armor plate are listed in the category of number of layers, cost effective, portable, micro-level detection, large plate compatible, and effectiveness for various materials. It can be seen that AE and ultrasonics method fit for all the categories. Over the years, AE and ultrasonics have been applied extensively and many successful achievements been reported [
2,
11,
16]. However, waveform evaluation was employed in most AE related work, and ultrasonics studies were more involved in single layer materials. Therefore, the purpose of the present work is to develop a flight time based algorithm and to use commercial multilayered armor plates to demonstrate the proposed algorithm.
2. Materials and Methods
2.1. Test Samples and Instruments
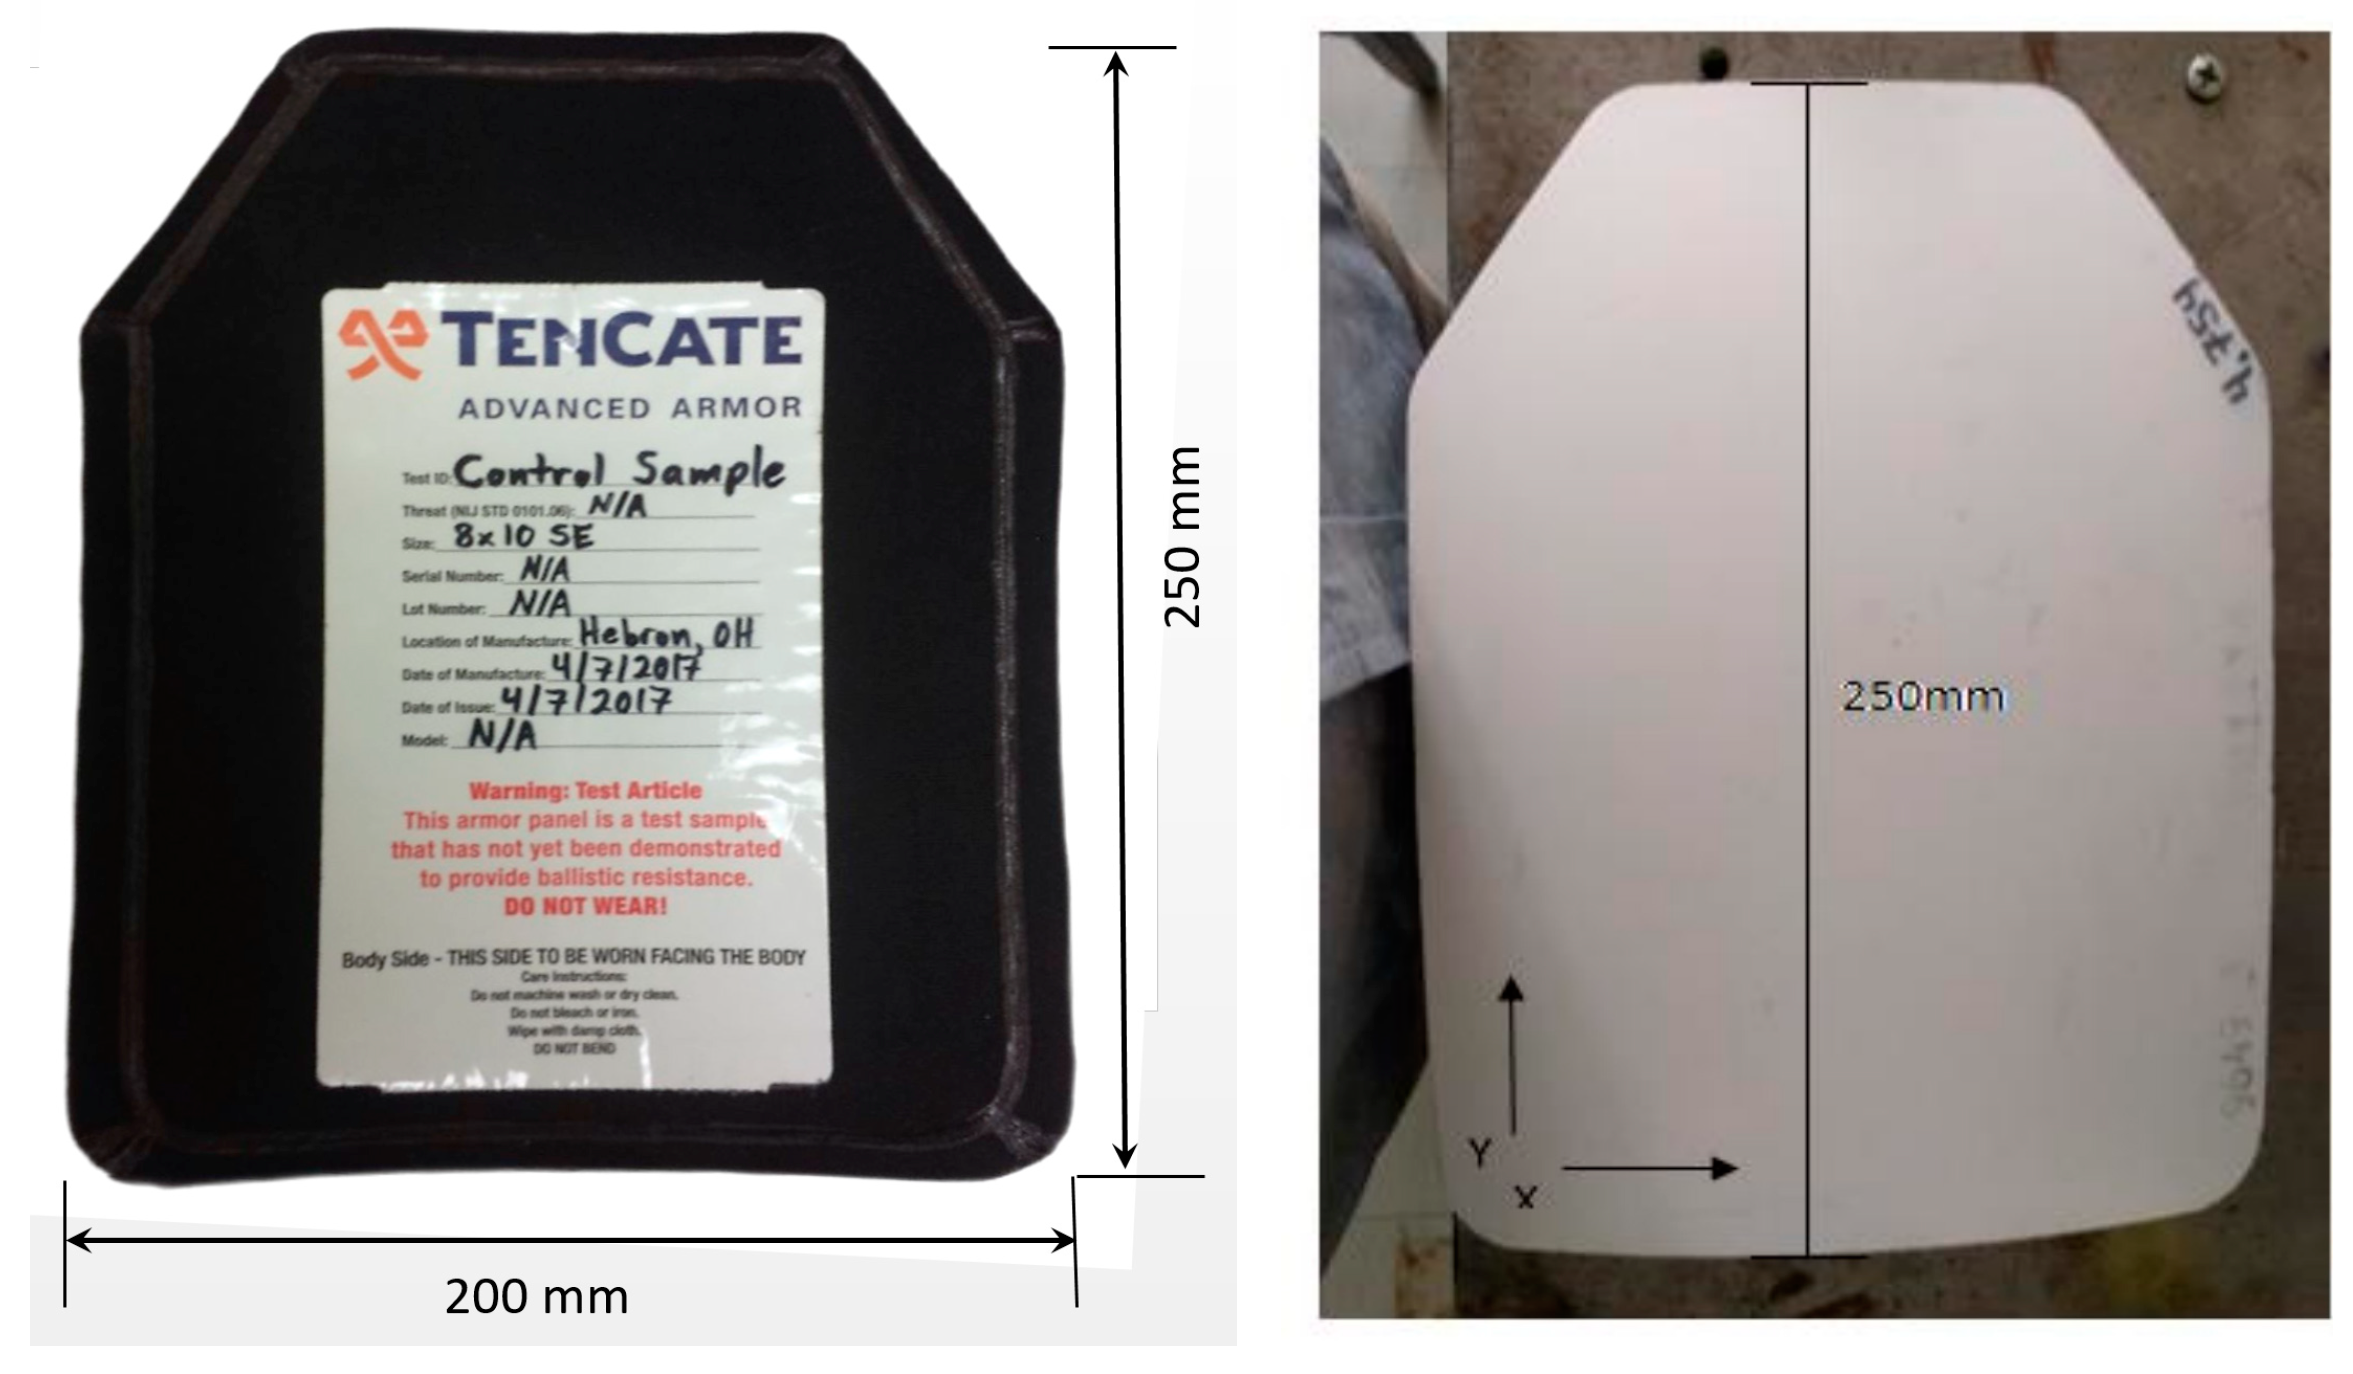
TenCate graciously donated two commercially available body armor plates (Type IV) for our experiments.
Figure 1 is a photo image of our sample test armor plate with dimensions of thickness about 50 mm (with the cover fabrics).
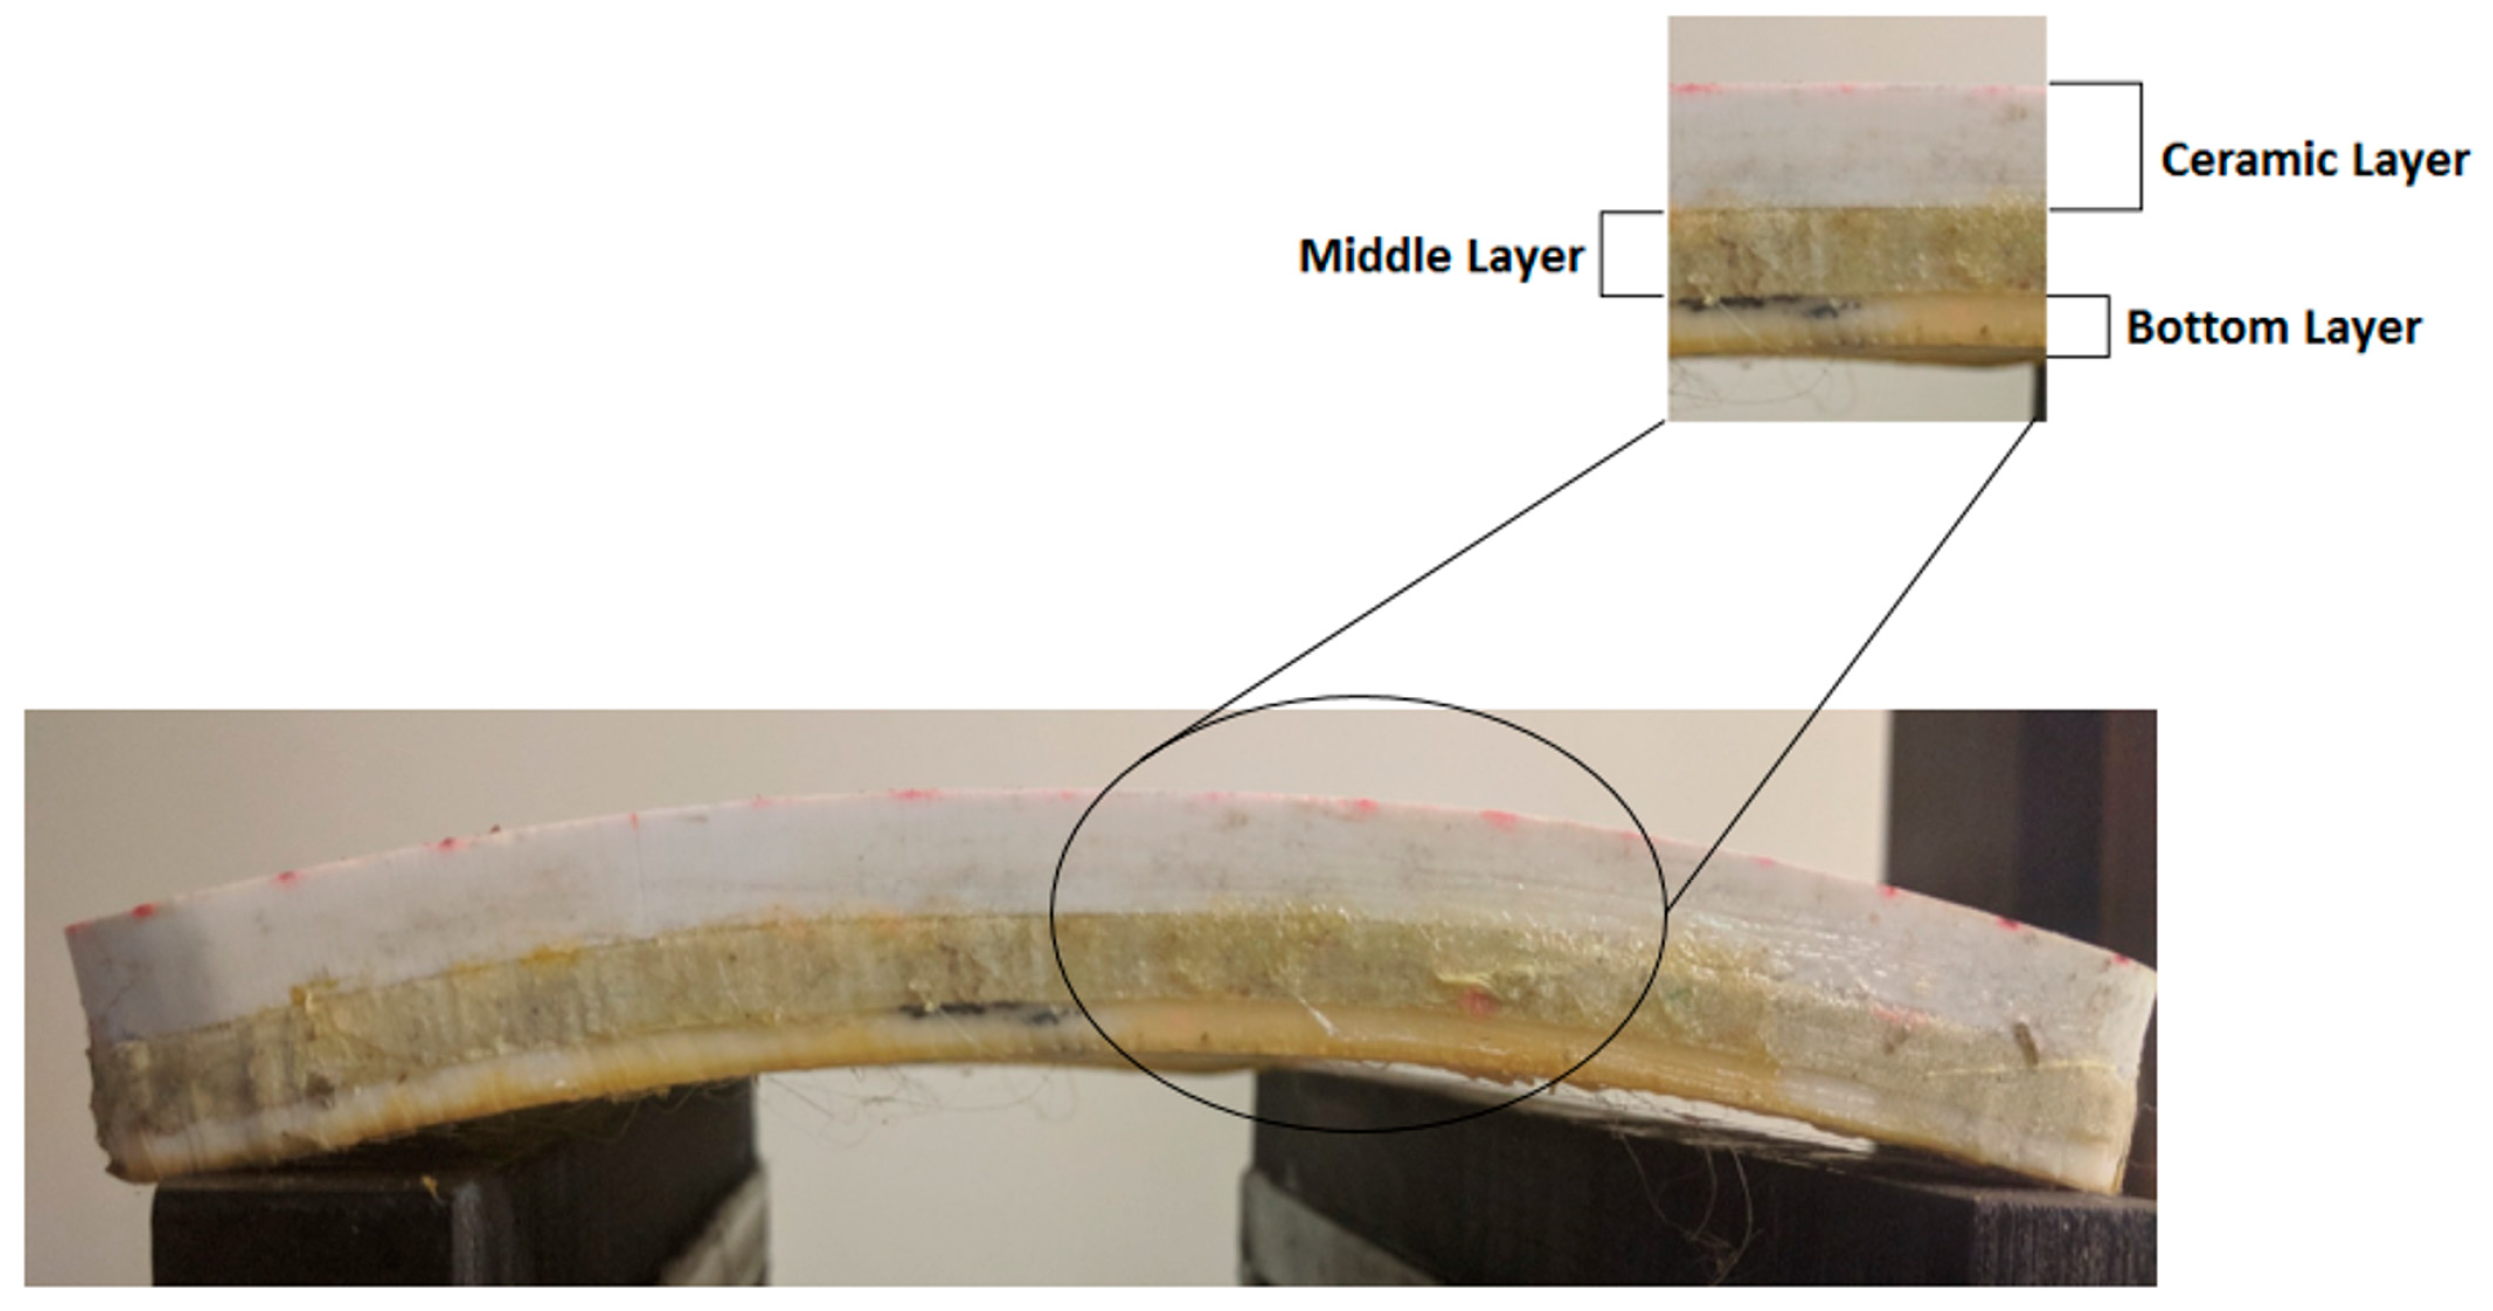
A section view of the three different layers is shown in
Figure 2. The top layer was ceramic, and the middle and bottom layers were made of a fiber/mesh material. The two bottom players are a material similar to Kevlar customarily made by TenCate. The detail compositions of the materials were not disclosed because of the intellectual property.
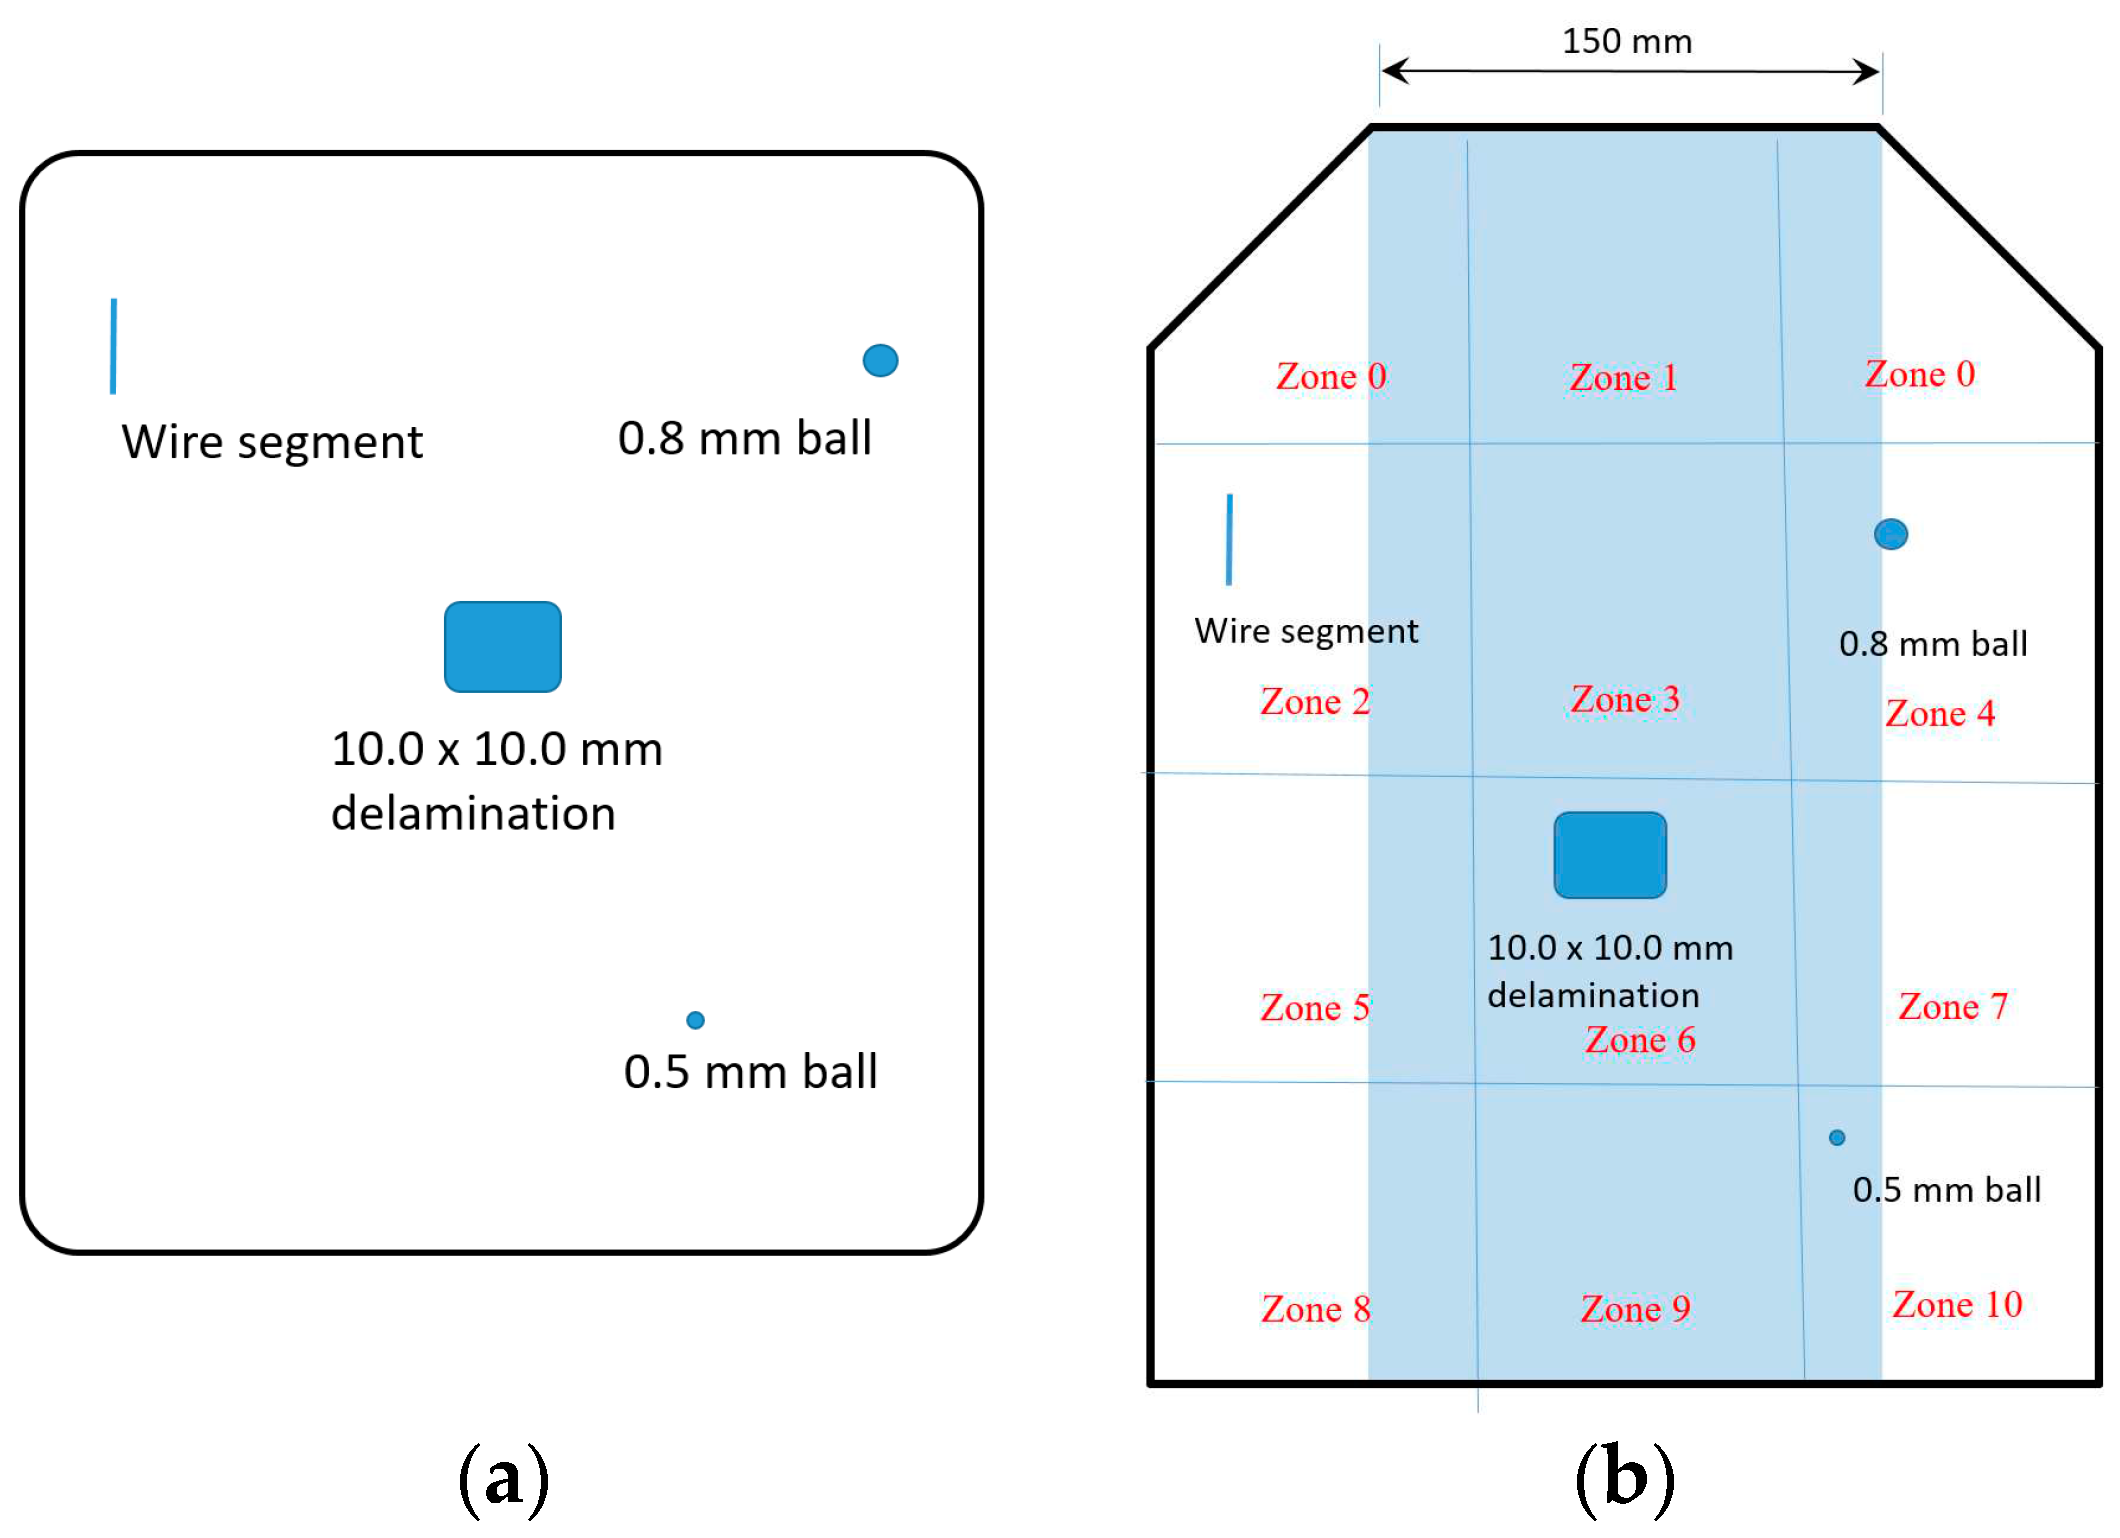
Of the two samples, one was used as the control sample with no defect, and the other had artificial defects built-in. While we provided a preliminary placement (
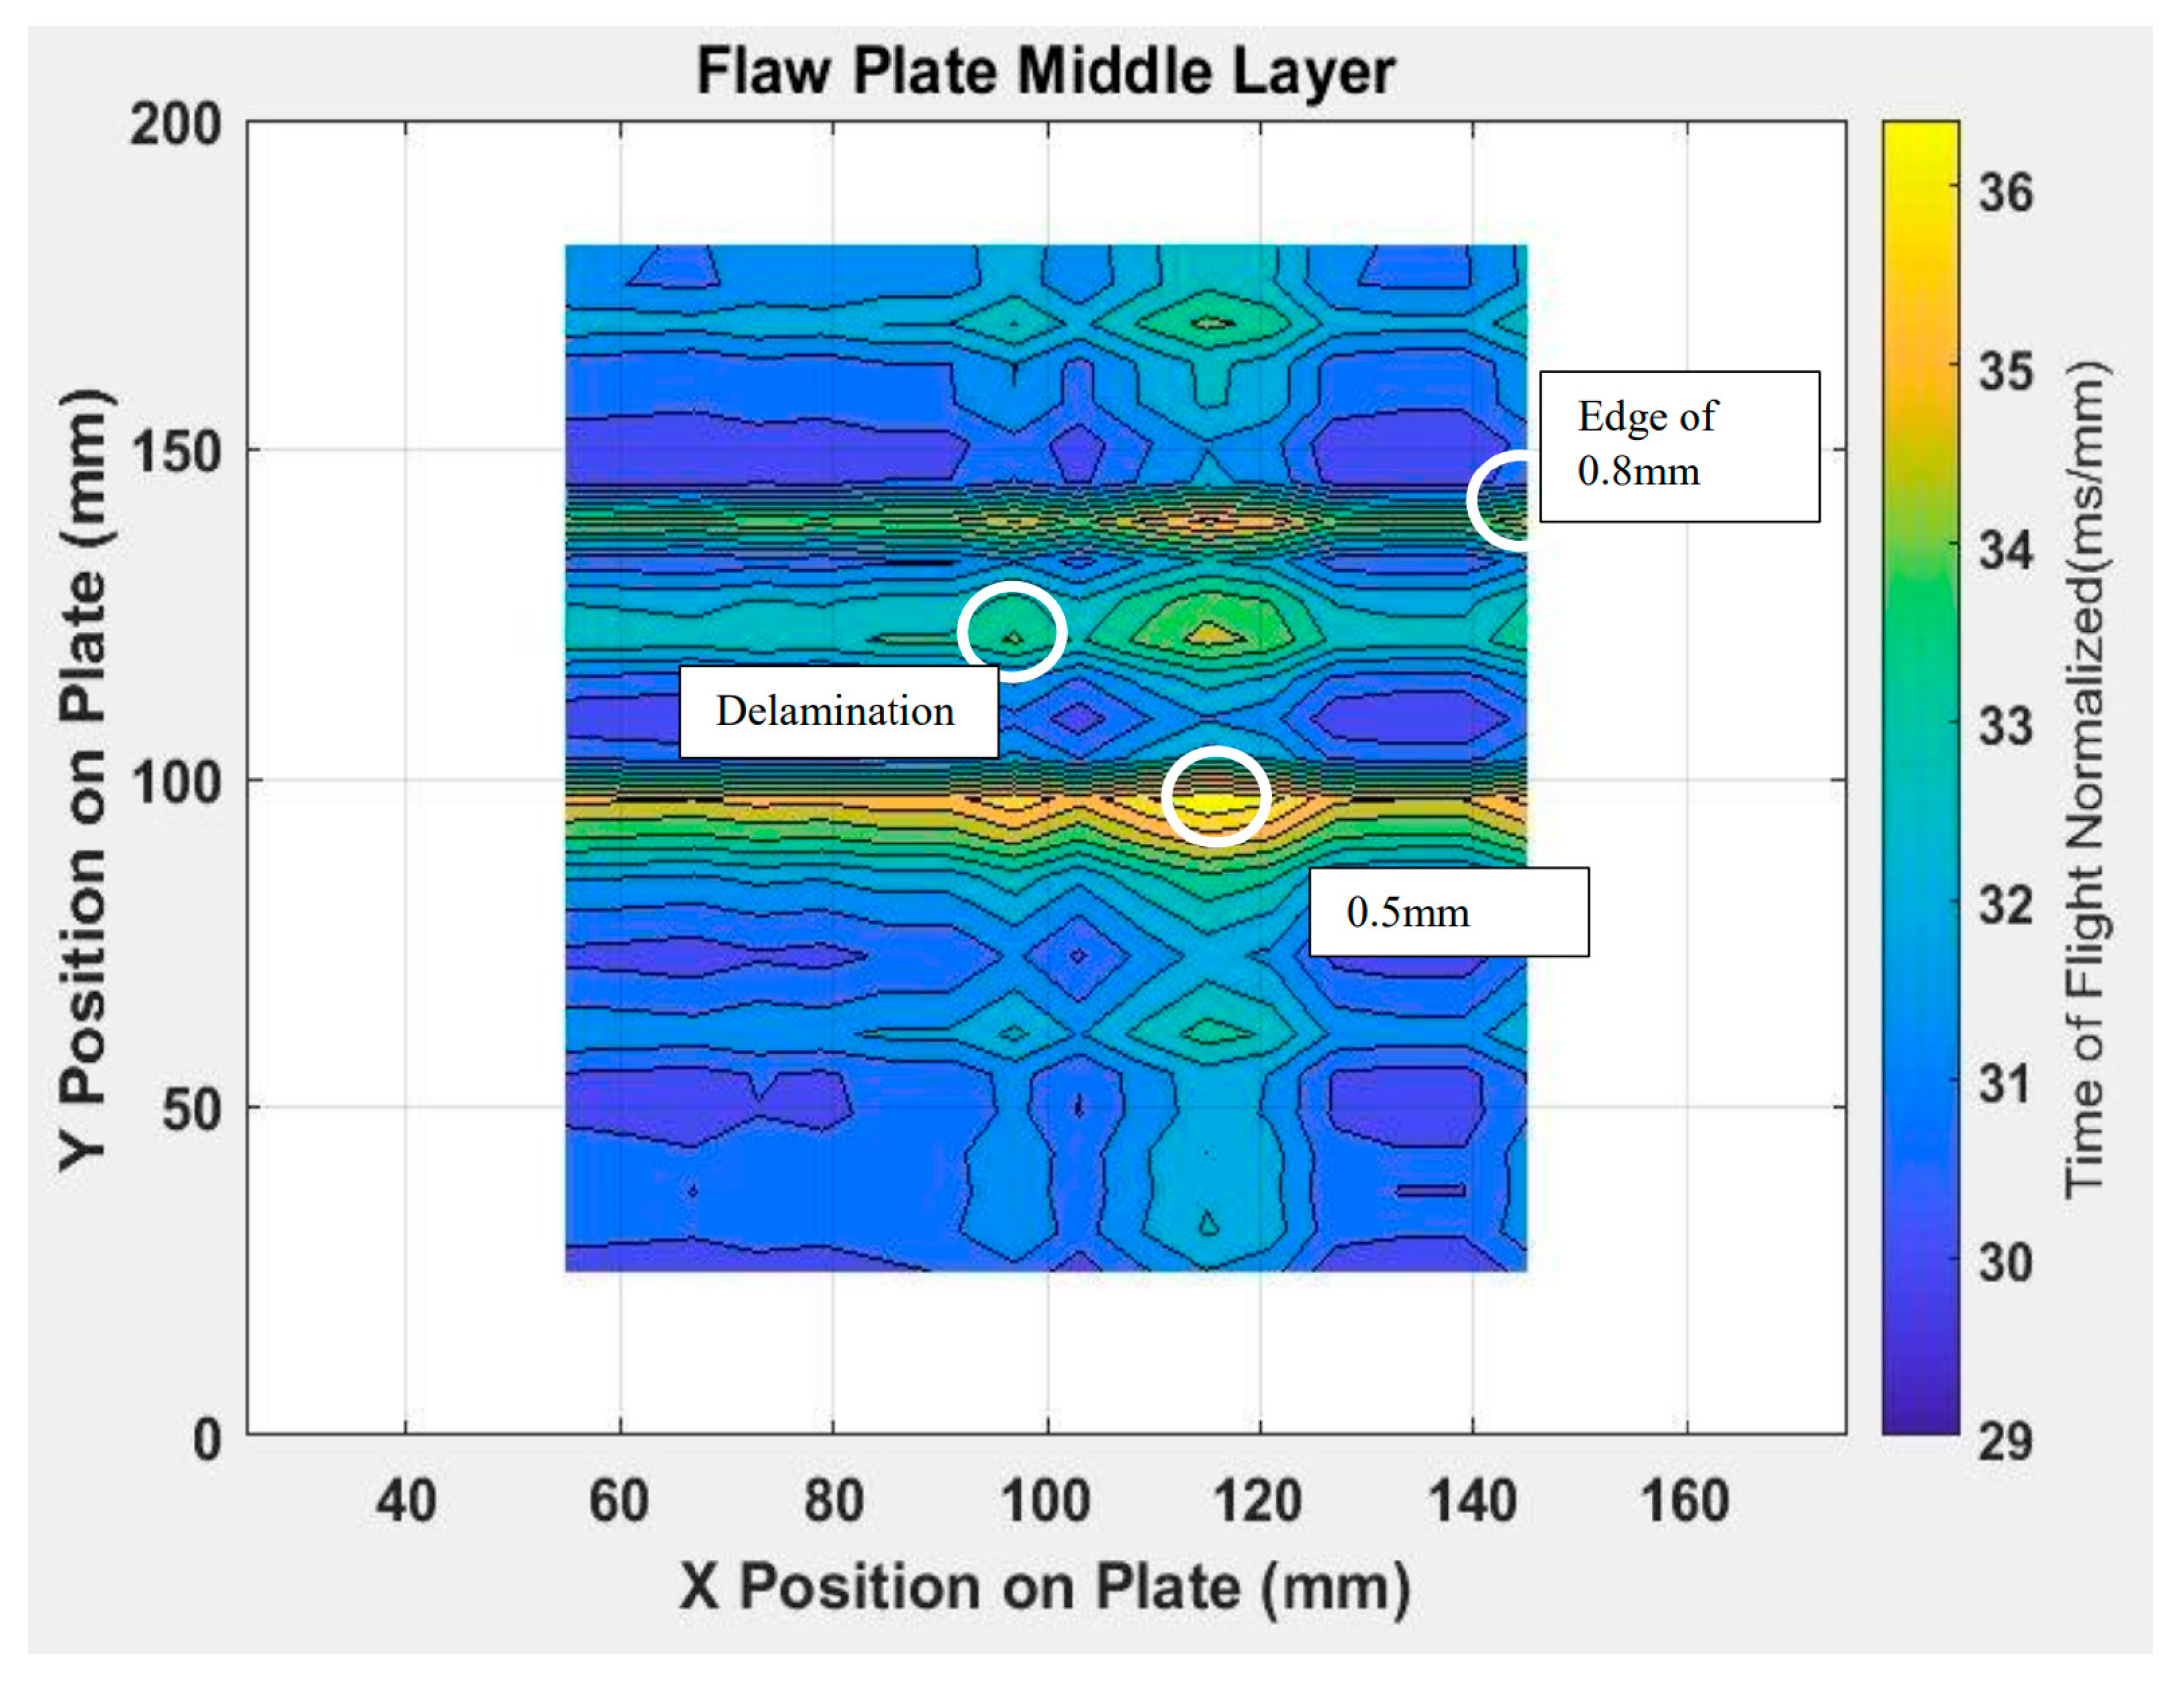
Figure 3a) for TenCate to build the plate with defects on, they provided us the y-coordinates of each defect on the side of the defect sample, whereas the x- and z-coordinates (the layer where the defects were in) were blind to us. These defects were placed at the interfaces and then pressed into the layers during the manufacturing processes. The two balls of different sizes represent void type defects that may be introduced during the manufacturing, the wire segment (diameter around 1.0 mm) simulates a macro crack in the armor, while the 10.0 x 10.0 delaminated section would mimic when the armor layers separated due to improper construction or through usage. This “defective” ceramic armor plate provided items to scan for and allowed assessments to verify the soundness of the proposed algorithm.
For the purposes of comparison whether the artificial defects are visible to X-ray and to get a better idea of what would show up on the X-Ray versus what could be found when AU technique is used. We had both test samples to be subject to X-ray inspection after removing the cover fabrics as shown previously in
Figure 2. An OrthoScan X-Ray low power generator (“OrthoScan: Imaging Excellence,” n.d.) was used. Because the dimension of the X-ray machine is limited, we partitioned the plate into different zones as shown in
Figure 3b in order to map the imbedded defects in X-ray images. In this figure, the x-coordinates of the defects were labeled approximately based on the X-ray images since they were not given.
Notice that this armor plate is not in a full rectangle shape to promote an orthogonal measurements of longitudinal waves because of the chamfers at the top two corners. Because of the chamfers there exists an angle between pulsing and receiving sensors in the longitudinal wave such that orthogonal measurements are limited. The zones that fall completely in the shaded areas, 150 mm x 250 mm, are fully controlled which means orthogonal measurements can be achieved. Whereas zones have portions unshaded, it means that orthogonal measurements cannot be executed and, as a result, defects in these zones may not be detectable or may have false detection. However, this limit is fixable. Further discussions of non-orthogonal measurements are provided in the Discussion Section of this paper.
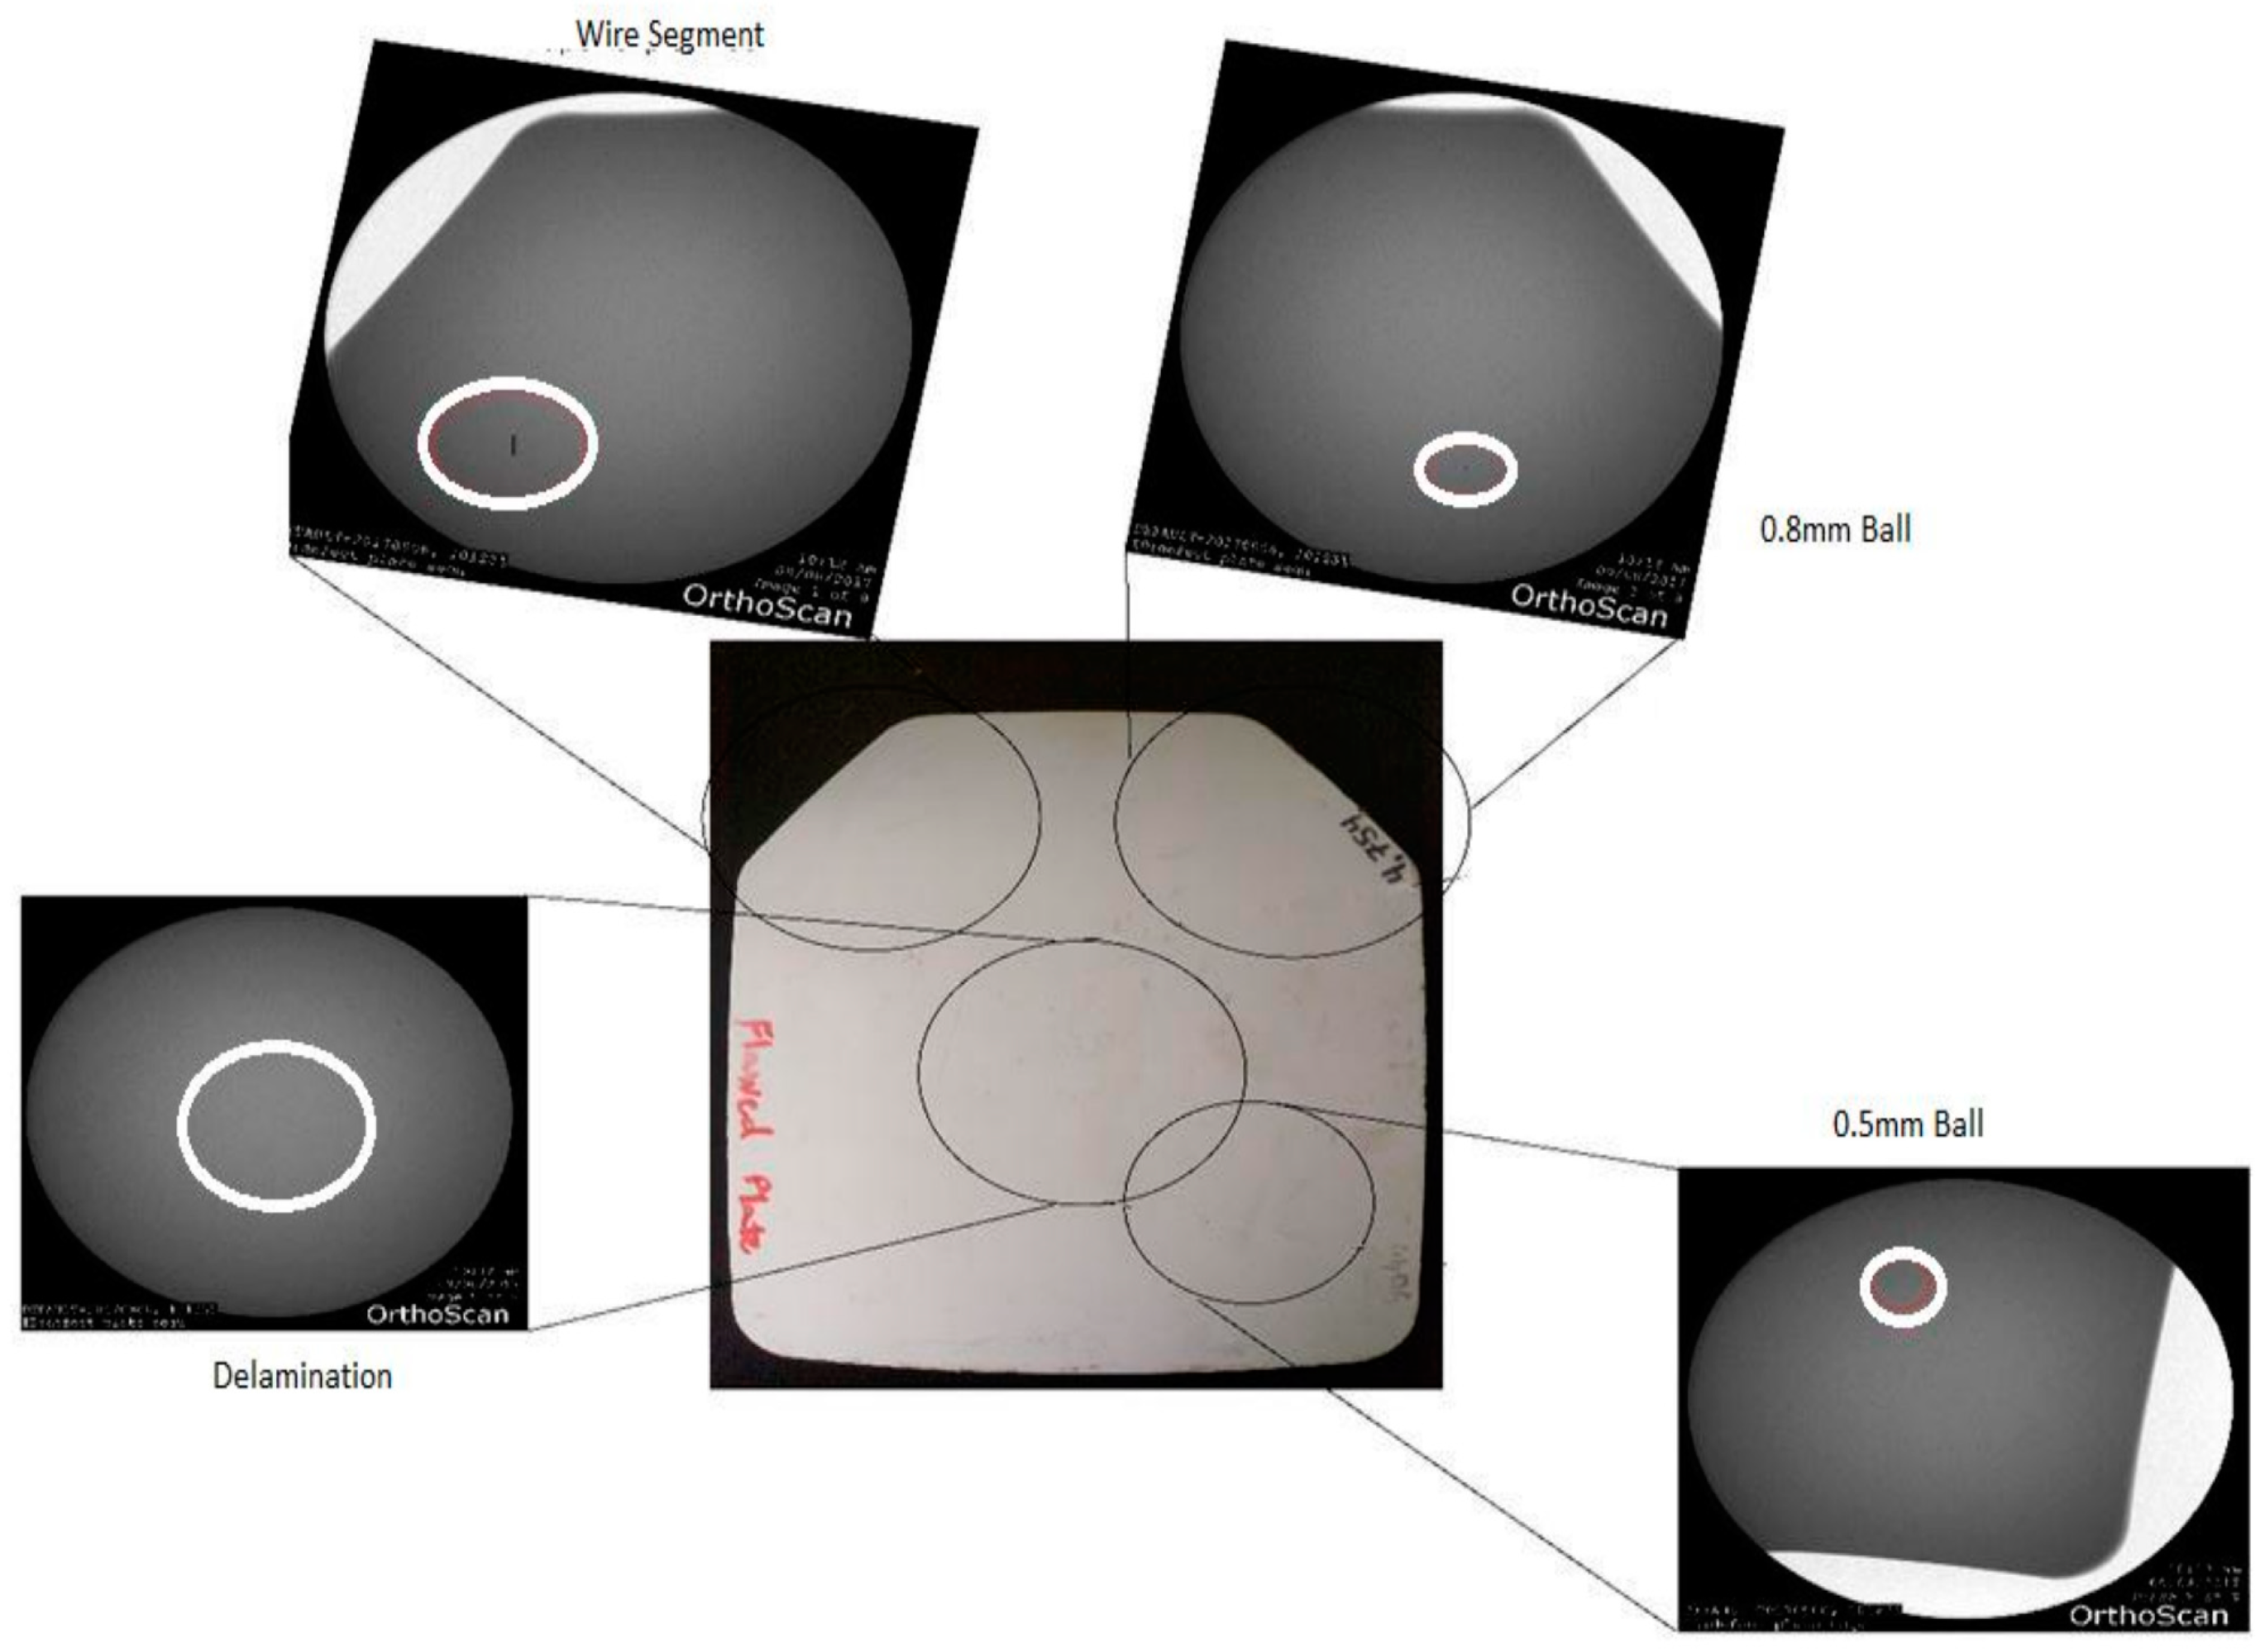
There was no identifiable defect in the control sample as expected. While, in the defective sample, the locations wire segment and 0.8 mm ball in Zones 1 and 3 were clearly seen as indicated in the zoomed windows in the callouts of
Figure 4. However, the location of 0.5 mm was faintly identifiable according to the given y-coordinate, and the delamination was not identifiable.
For acousto-ultrasonics test, a Vallen Acoustic Software System (ASMY-5; Vallen-Systeme GmbH) was used. This system included: ASMY-5 AE data acquisition system and 40 dB pre-amplifier with a bandpass filter between 2.5 kHz and 3.8 MHz (AEP4; Vallen Systeme GmbH, Munich, Germany). To acquire the signals, we used piezoelectric AE sensors (Nano 30, Physical Acoustics, Inc., Princeton, NJ, USA). The resonant frequency and operating frequency range of these sensors are 140 kHz and 125–750 kHz, respectively, although the working frequency ranges anywhere from 30 kHz to over 800 kHz with a side lope covering 900 kHz to 1 MHz. This AE system was optimized to pulse at 10 MHz for our AU test, which allows at least 10-3 mm ideally and provides enough fidelity for the purpose of the present work [
23]. The resultant AE signatures were pre-amplified by a 40 dB pre-amplifier with a bandpass filter between 2.5 kHz and 3.8 MHz (AEP4; Vallen Systeme GmbH, Munich, Germany) before being fed to the AE system. The threshold for the data acquisition was selected to minimize the noise from the testing machine, this being done by installing the specimen on the testing machine with near zero loading and finding that there were no detectable acoustic signals at or below 35.5 dB. Thus, this value was used as the threshold.
2.2. Flight-Time Matrix
Flight time, in this work, is defined as the time needed for a pulsing longitudinal ultrasonic wave to travel from the pulser transducer to the receiver transducer. In a 2D testing object, let
txi and
tyj be the flight time in the x- and y-directions, respectively. They is determined as follows,
where,
tr and
tp are the time at the pulser and receiver transducers, respectively.
xi and
yj are the x- and y-coordinates at which an ultrasonic longitudinal wave is pulsed, and
N and
M are the indices in x- and y-coordinates of the testing objects, respectively.
In Equations (1) and (2), it can been seen that flight time is a difference between the time at the receiver and that at the pulser transducers. When executing
and
, the testing object is in essence partitioned which creates mesh. The measurements of flight times are thus obtained in x- and y-direction accordingly. The results of these measurements are in two arrays:
and
. Similarly, in the cases of 3D object,
is the flight time in z-coordinate. Graphs of
,
, and
are able to show the variations of flight time in the x-, y-, and z-directions individually. These graphs reveal the corresponding linear position of damage/defect that causes the flight time delay, which had been used mostly [
25].
If
and
are used to construct a matrix according to an algorithm, a flight time matrix can be formed. We propose a novel algorithm that can be used to construct such a matrix using the 1D flight time arrays, and define it to be the flight time matrix (FTM) in this work. This proposed algorithm is described in Equation (3) mathematically. Elements of FTM,
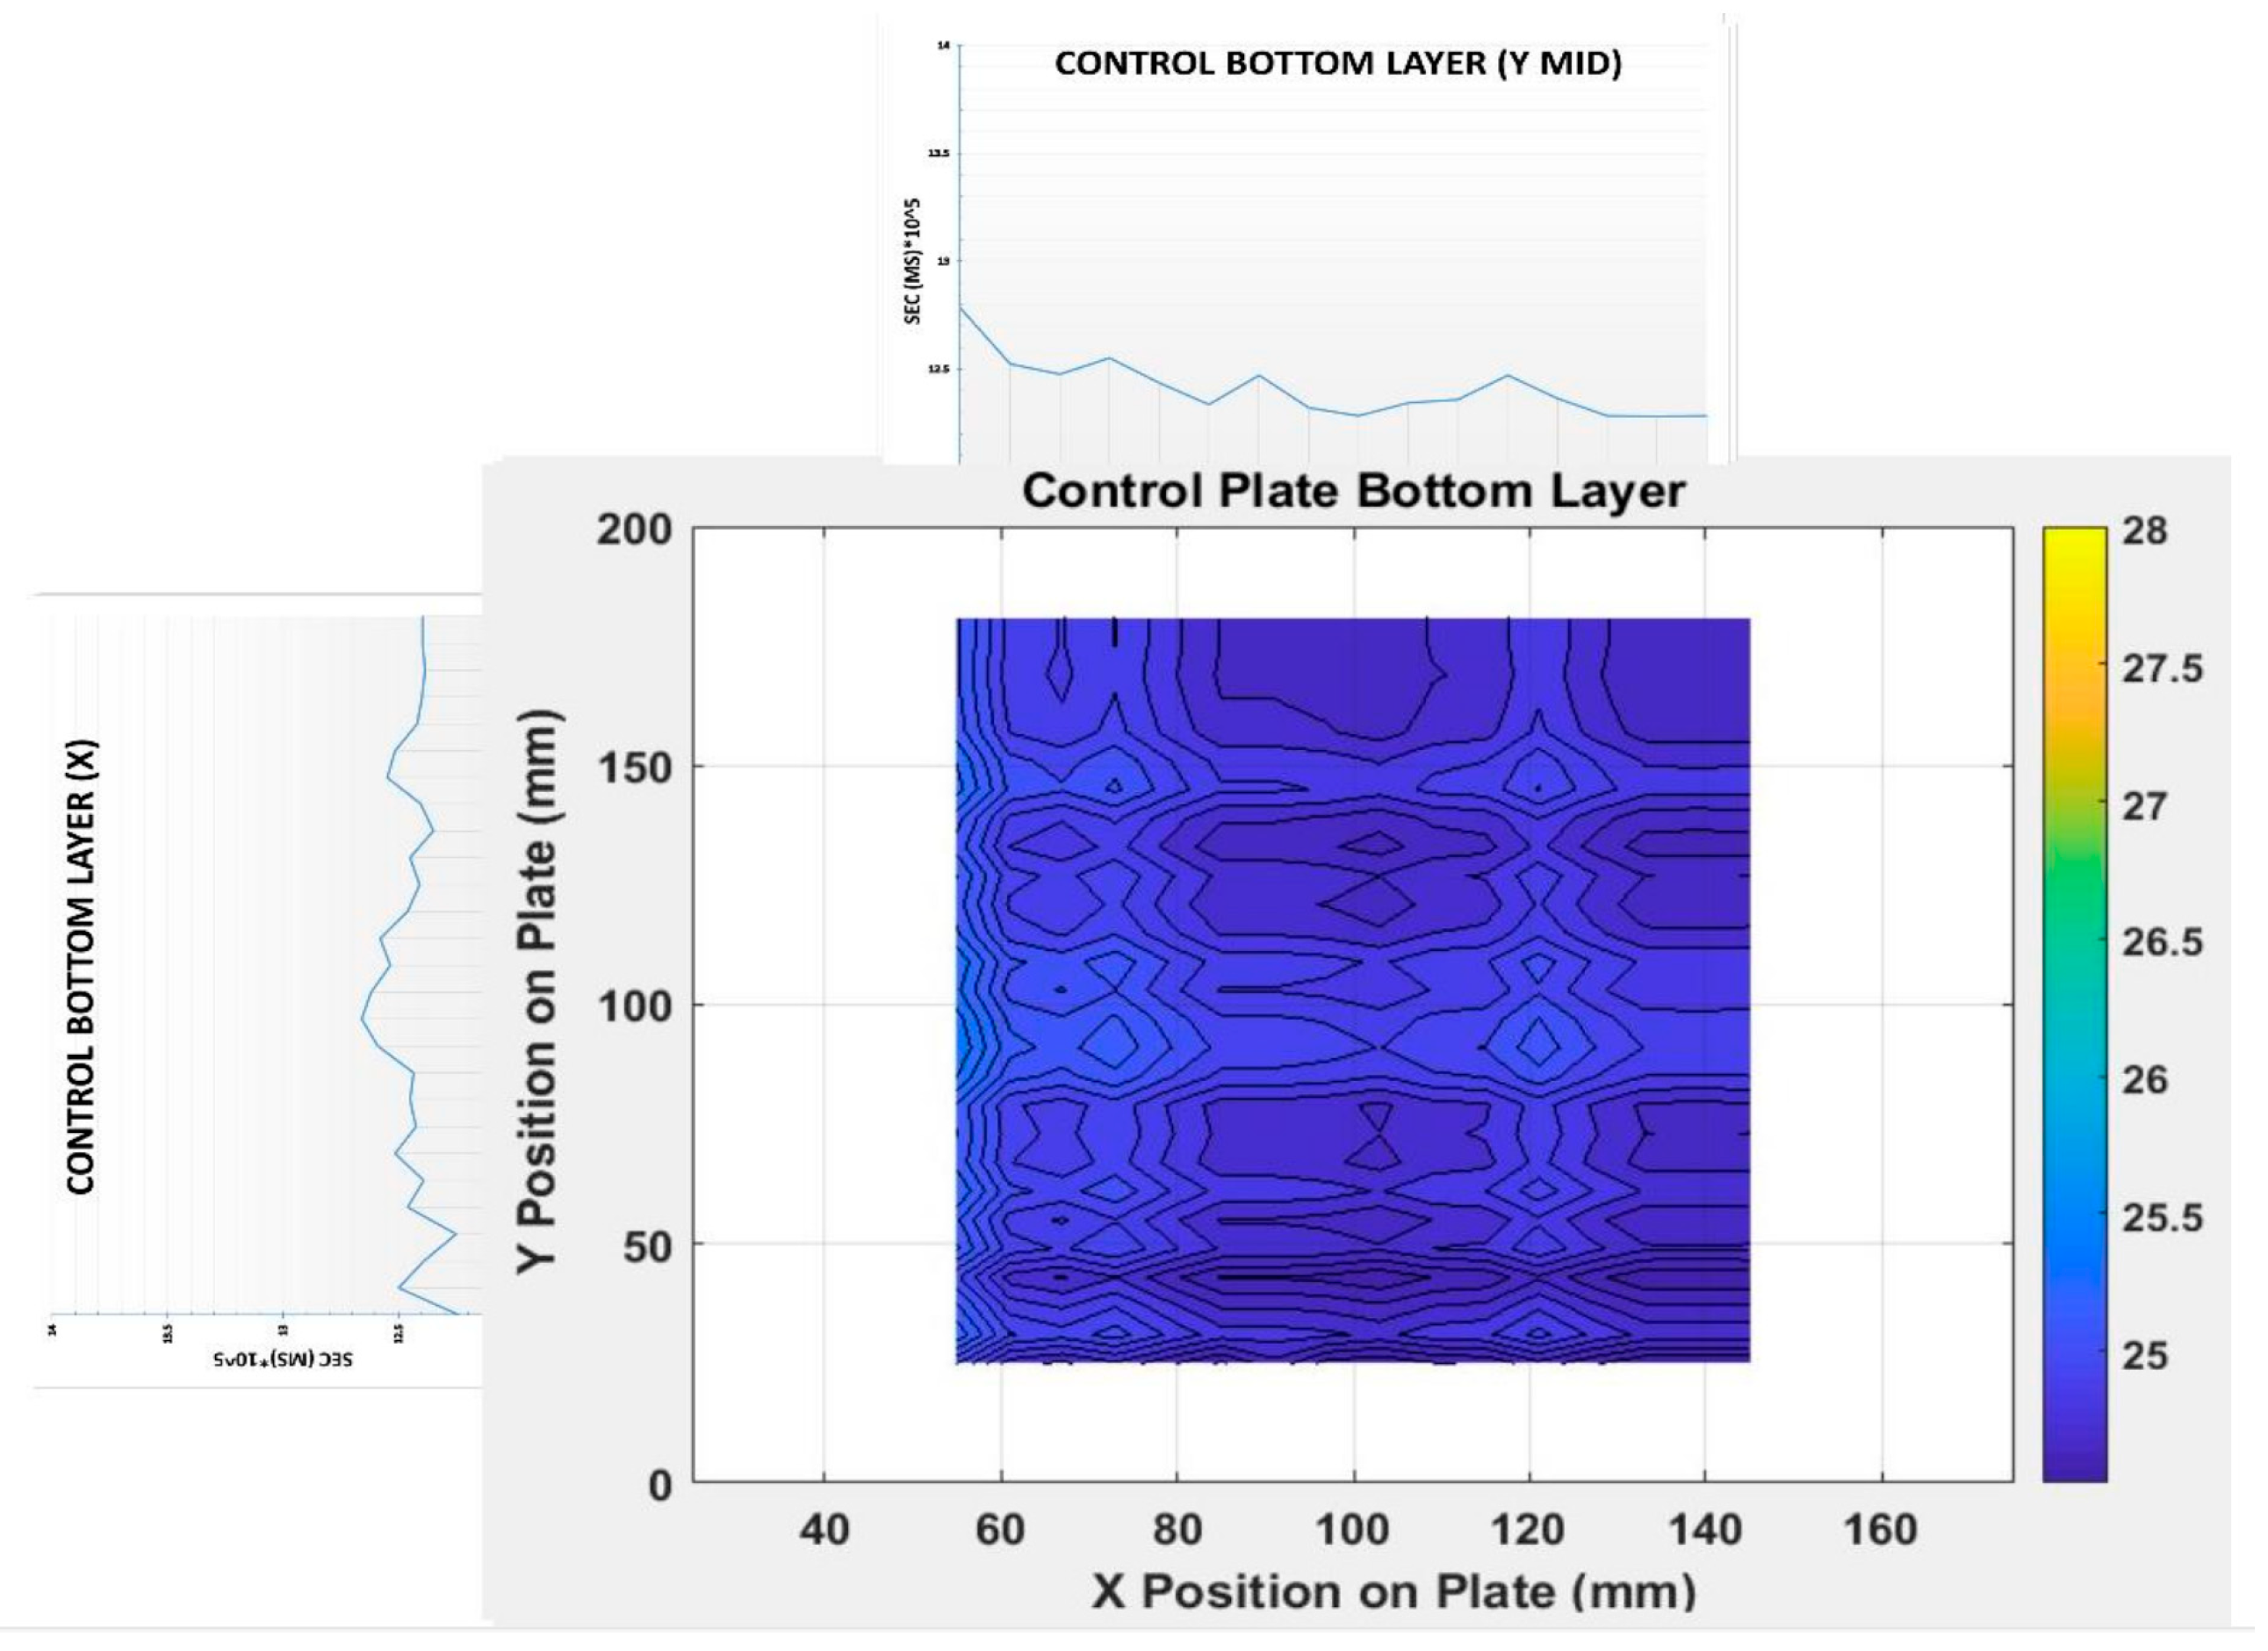
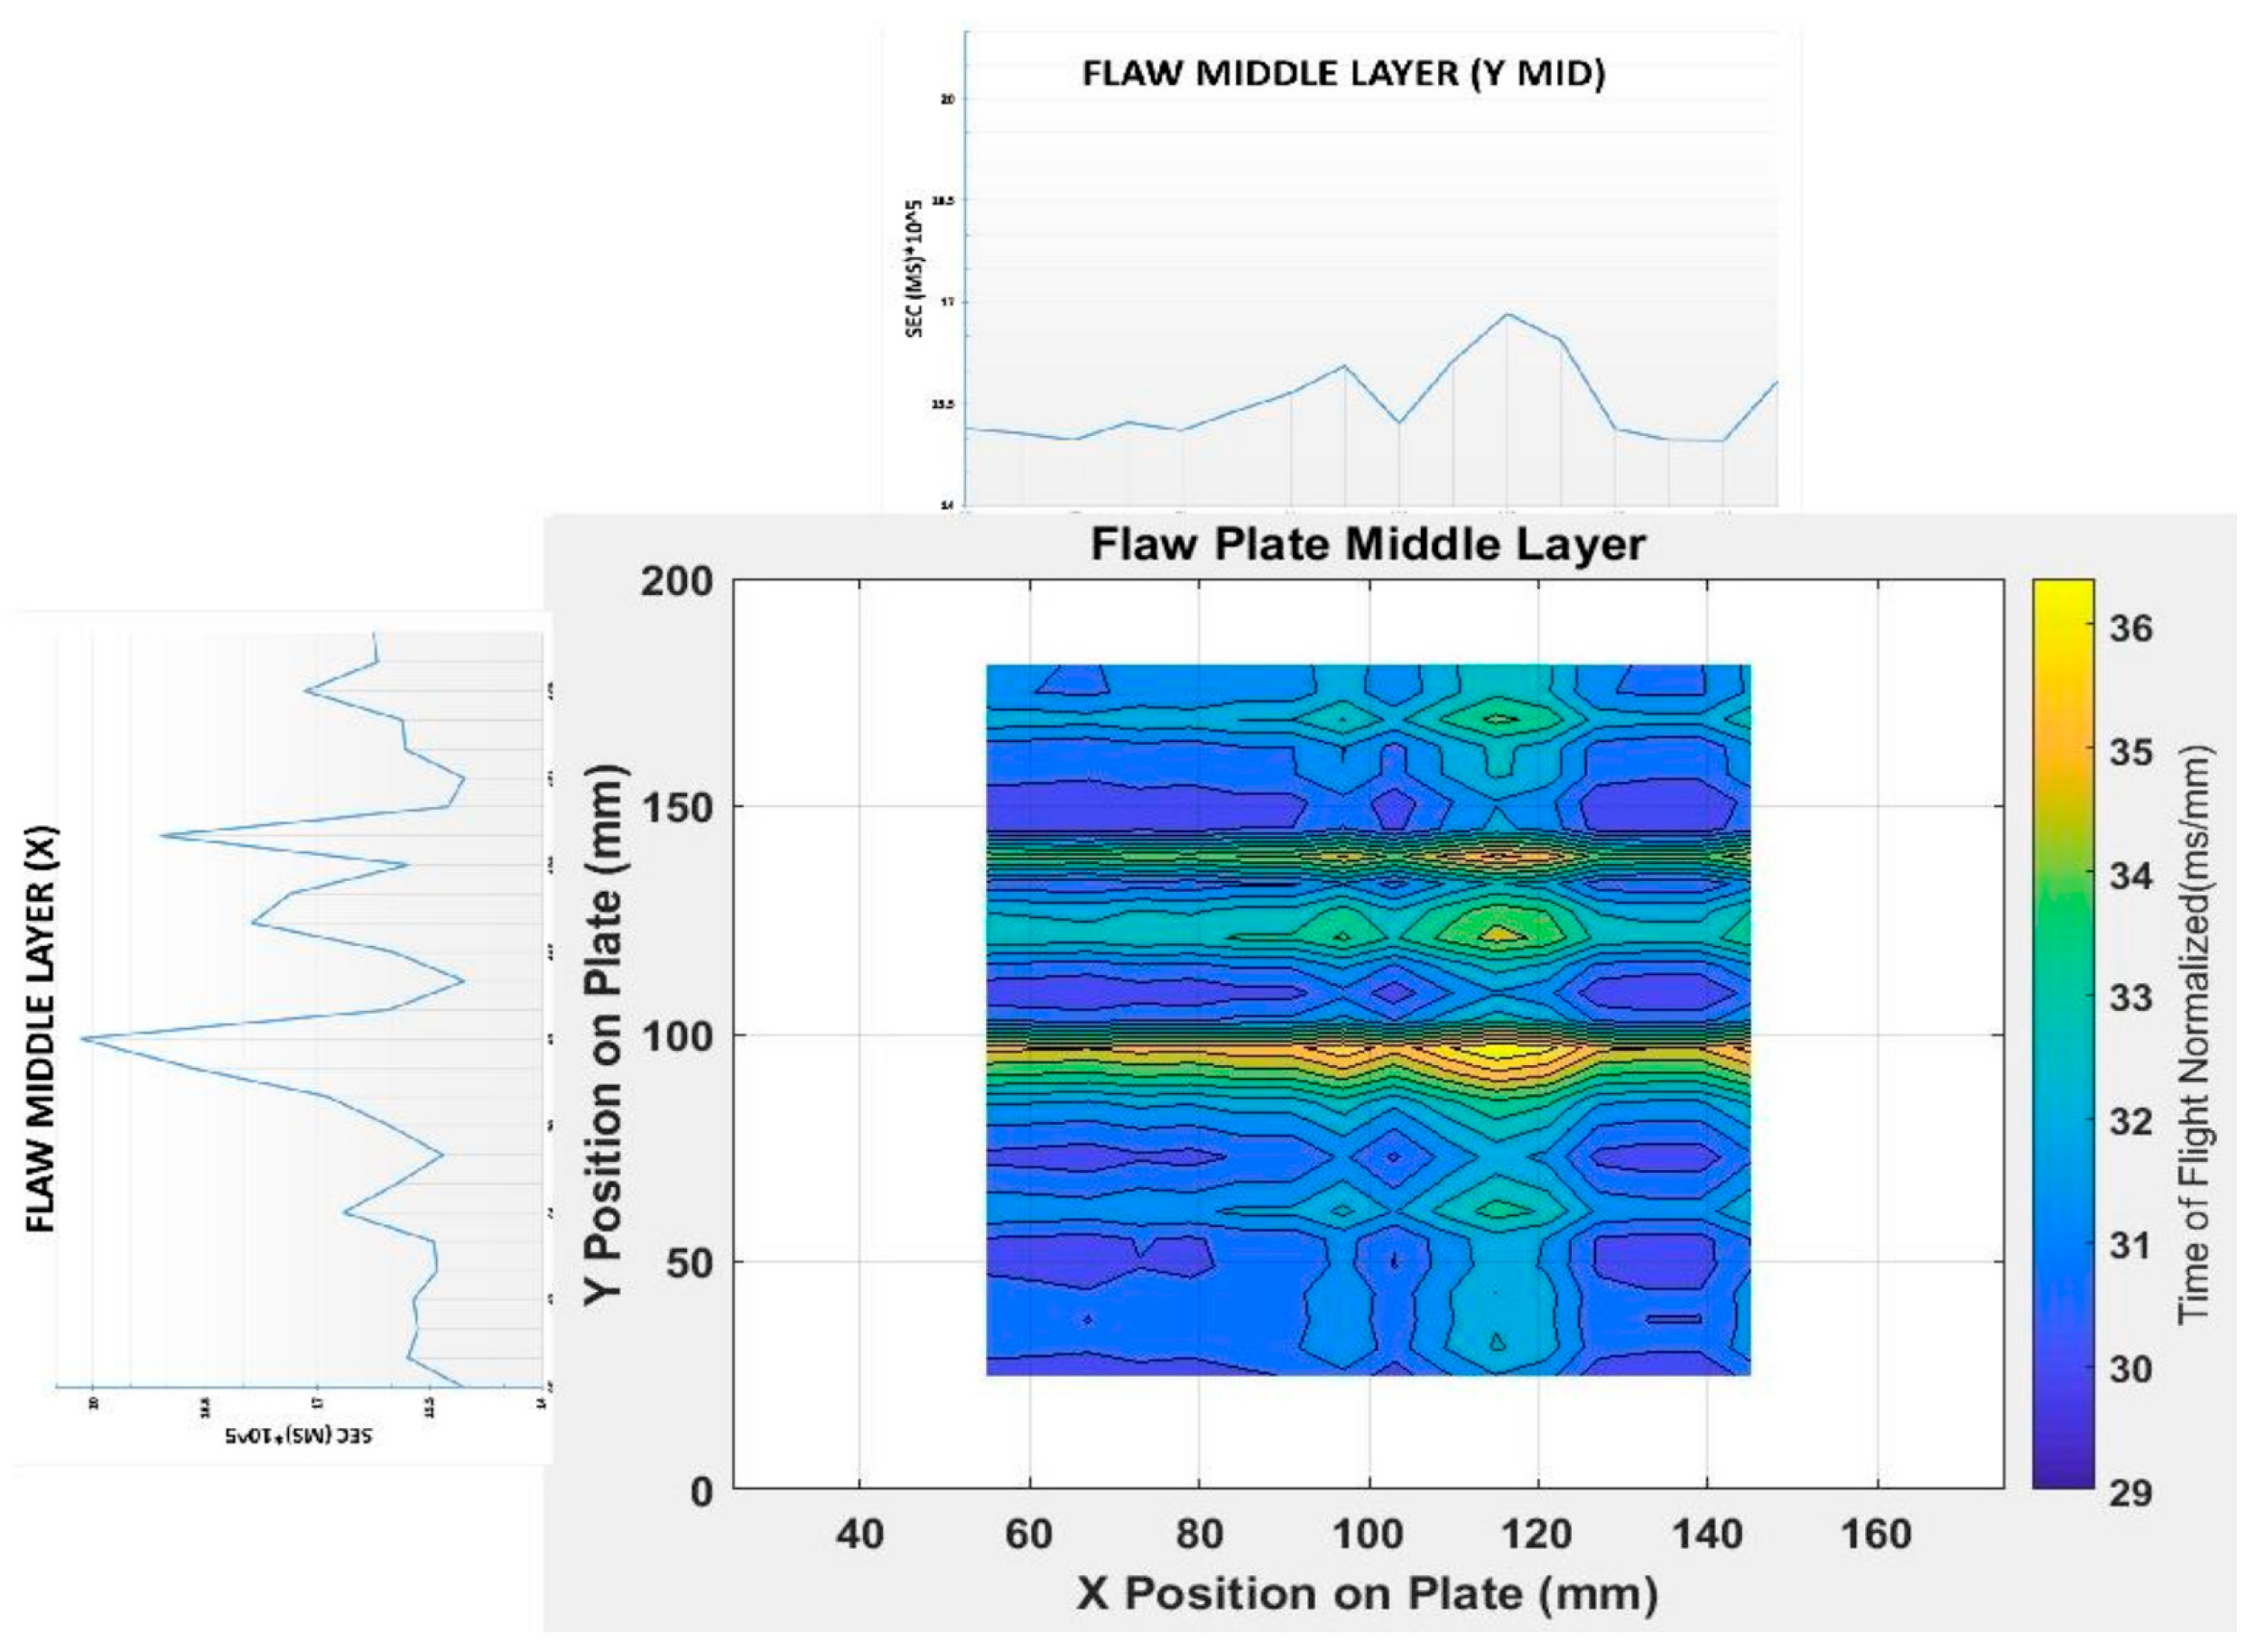
In this matrix, the unit of each element is time, which means the time needed to travel from the pulser to the receiver. FTM is, in essence, a collection of the time needed for the high frequency wave to travel from the pulser to the receiver. The greater the value of an element in FTM, the longer the time that a longitudinal wave travels. The occurrence of a significant large value of flight time can be highly attributed to the facts of the presenting damage/defect that may have changed/altered the passage of an ultrasound wave. Although N and M are the indices of FTM in a 2D testing object, they have physical meanings as the follows. These indices create a grid mesh on the testing body, the finer the mesh, the higher the resolution of the measurements, and the more accurate the results. The determination of N and M is dependent on a number of factors such as the physical size of the pulser and receiver transducer, the physical size of a testing object, the expected resolution, and others like the time period to complete an evaluation. The purpose of constructing a FTM is that the contour graphs of this matrix will provide a better visualization of the damage occurred in an object. The unit of FTM is the time, and depending on the size of a testing object, it can be s, ms, or ns. However, a normalized time is used to be time/length because the physical size of a testing object is often different in x, y, and z directions.
We shall describe means to construct 2D FTM in this work, a 3D FTM can be followed in a similar token. A ballistic armor plate is a typical 2D testing object as the thickness of an armor plate is far less than the length and width of the surface area.
Table 2 shows the construction of a 4x3 FTM.
FTM can be formed in different means, for instance, depending on the pulse orientation, an FTM can be constructed as follows:
Solo-orientation. The pulser and receiver positions are fixed, meaning that the longitudinal wave propagates in a unidirectional way; and,
Dual-orientation. The pulser and receiver positions are exchanged, meaning that longitudinal wave propagates in one direction first, and reversed.
2.3. Numerical Simulation
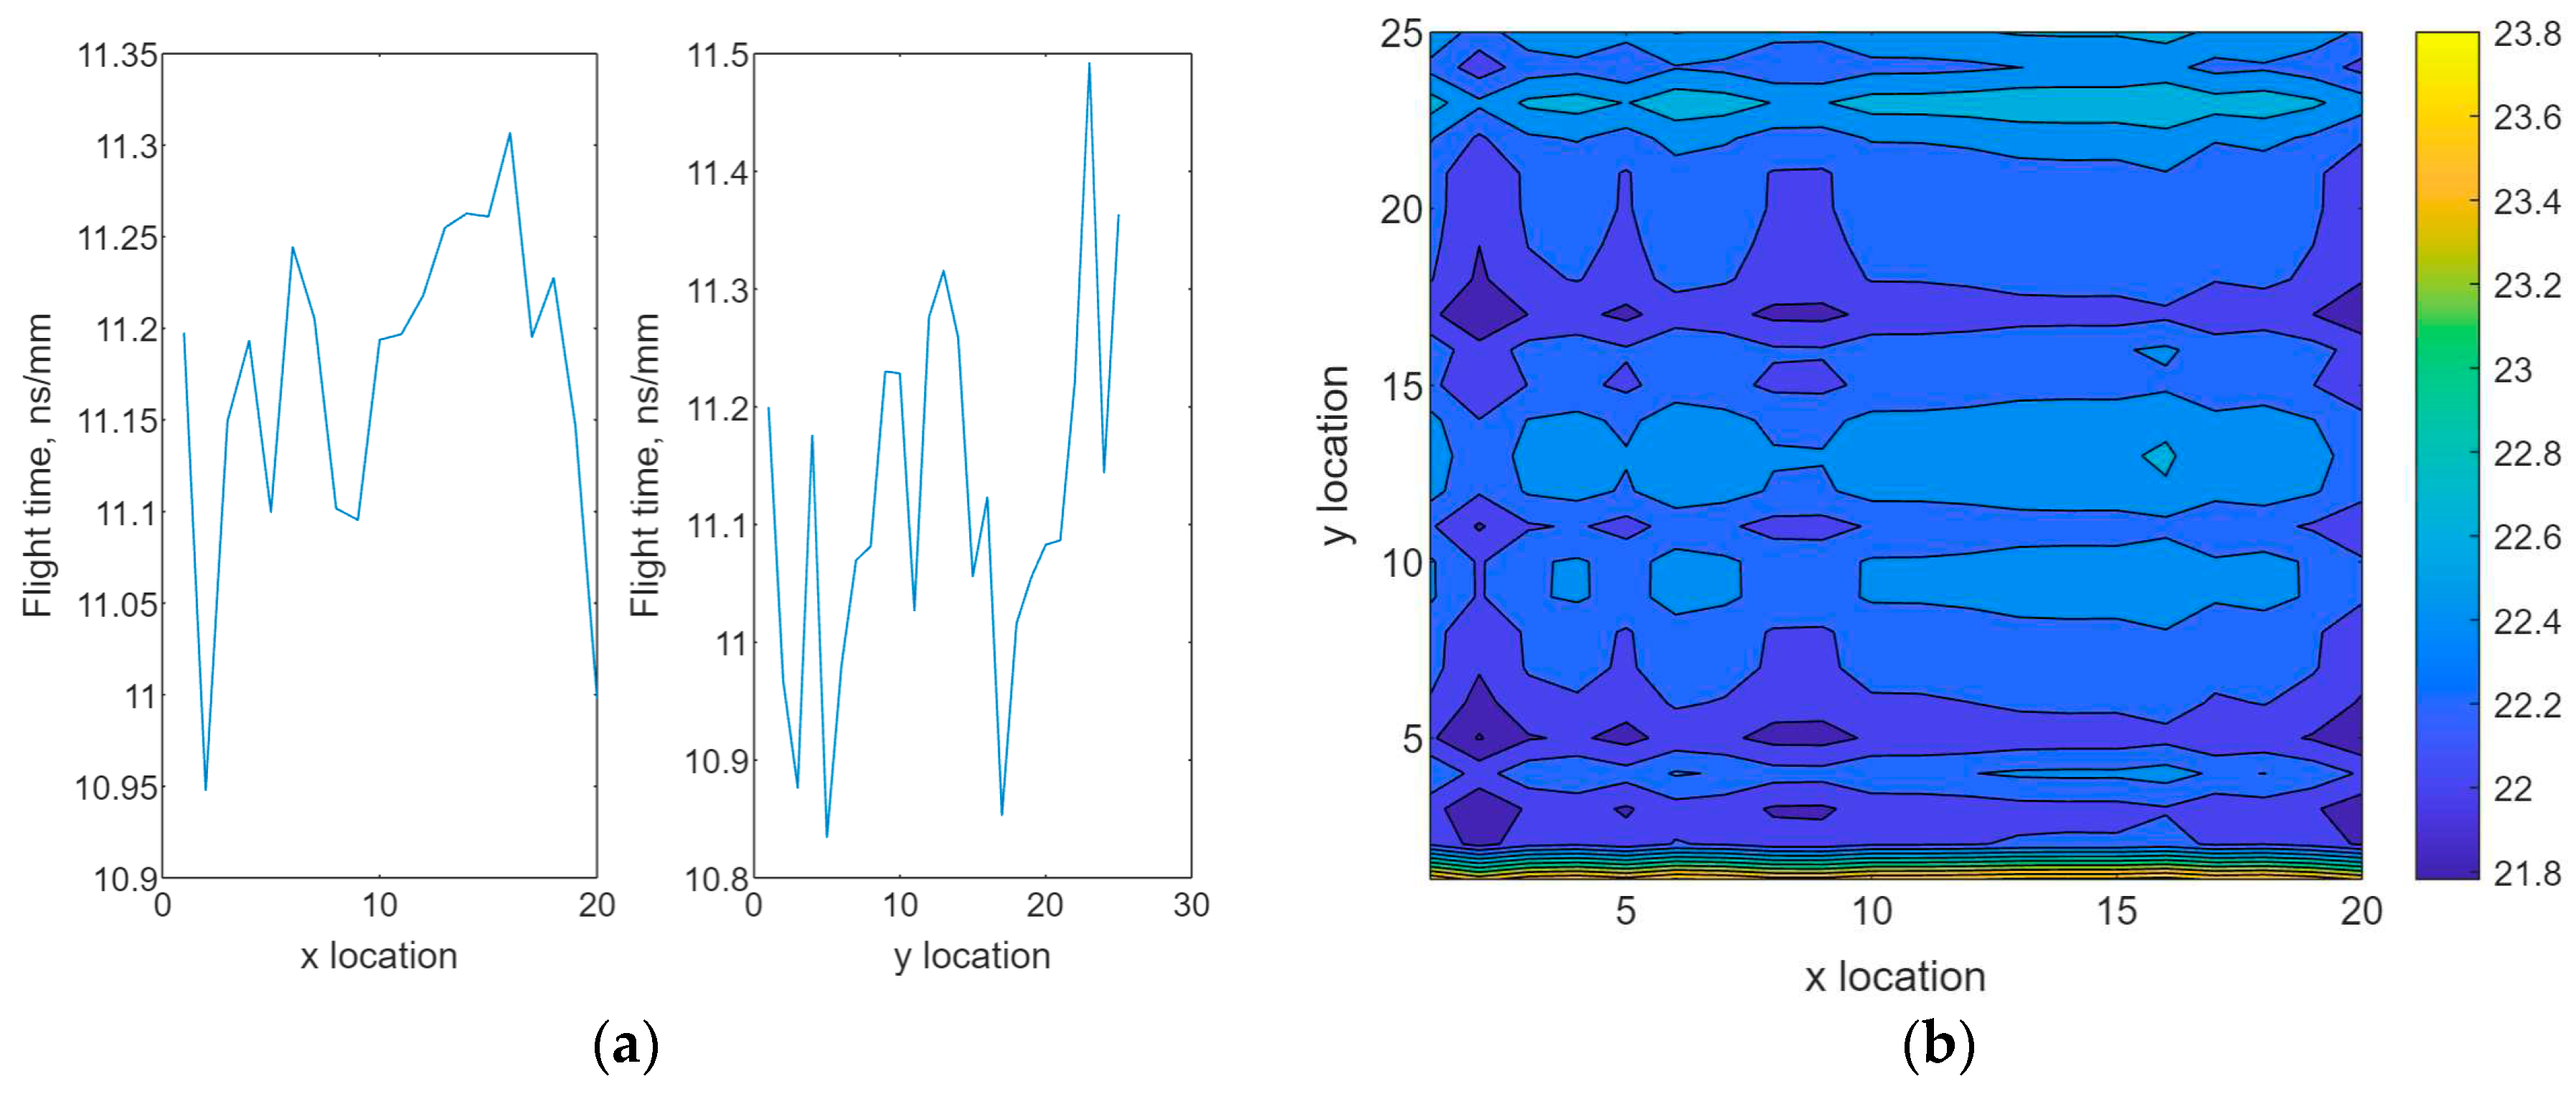
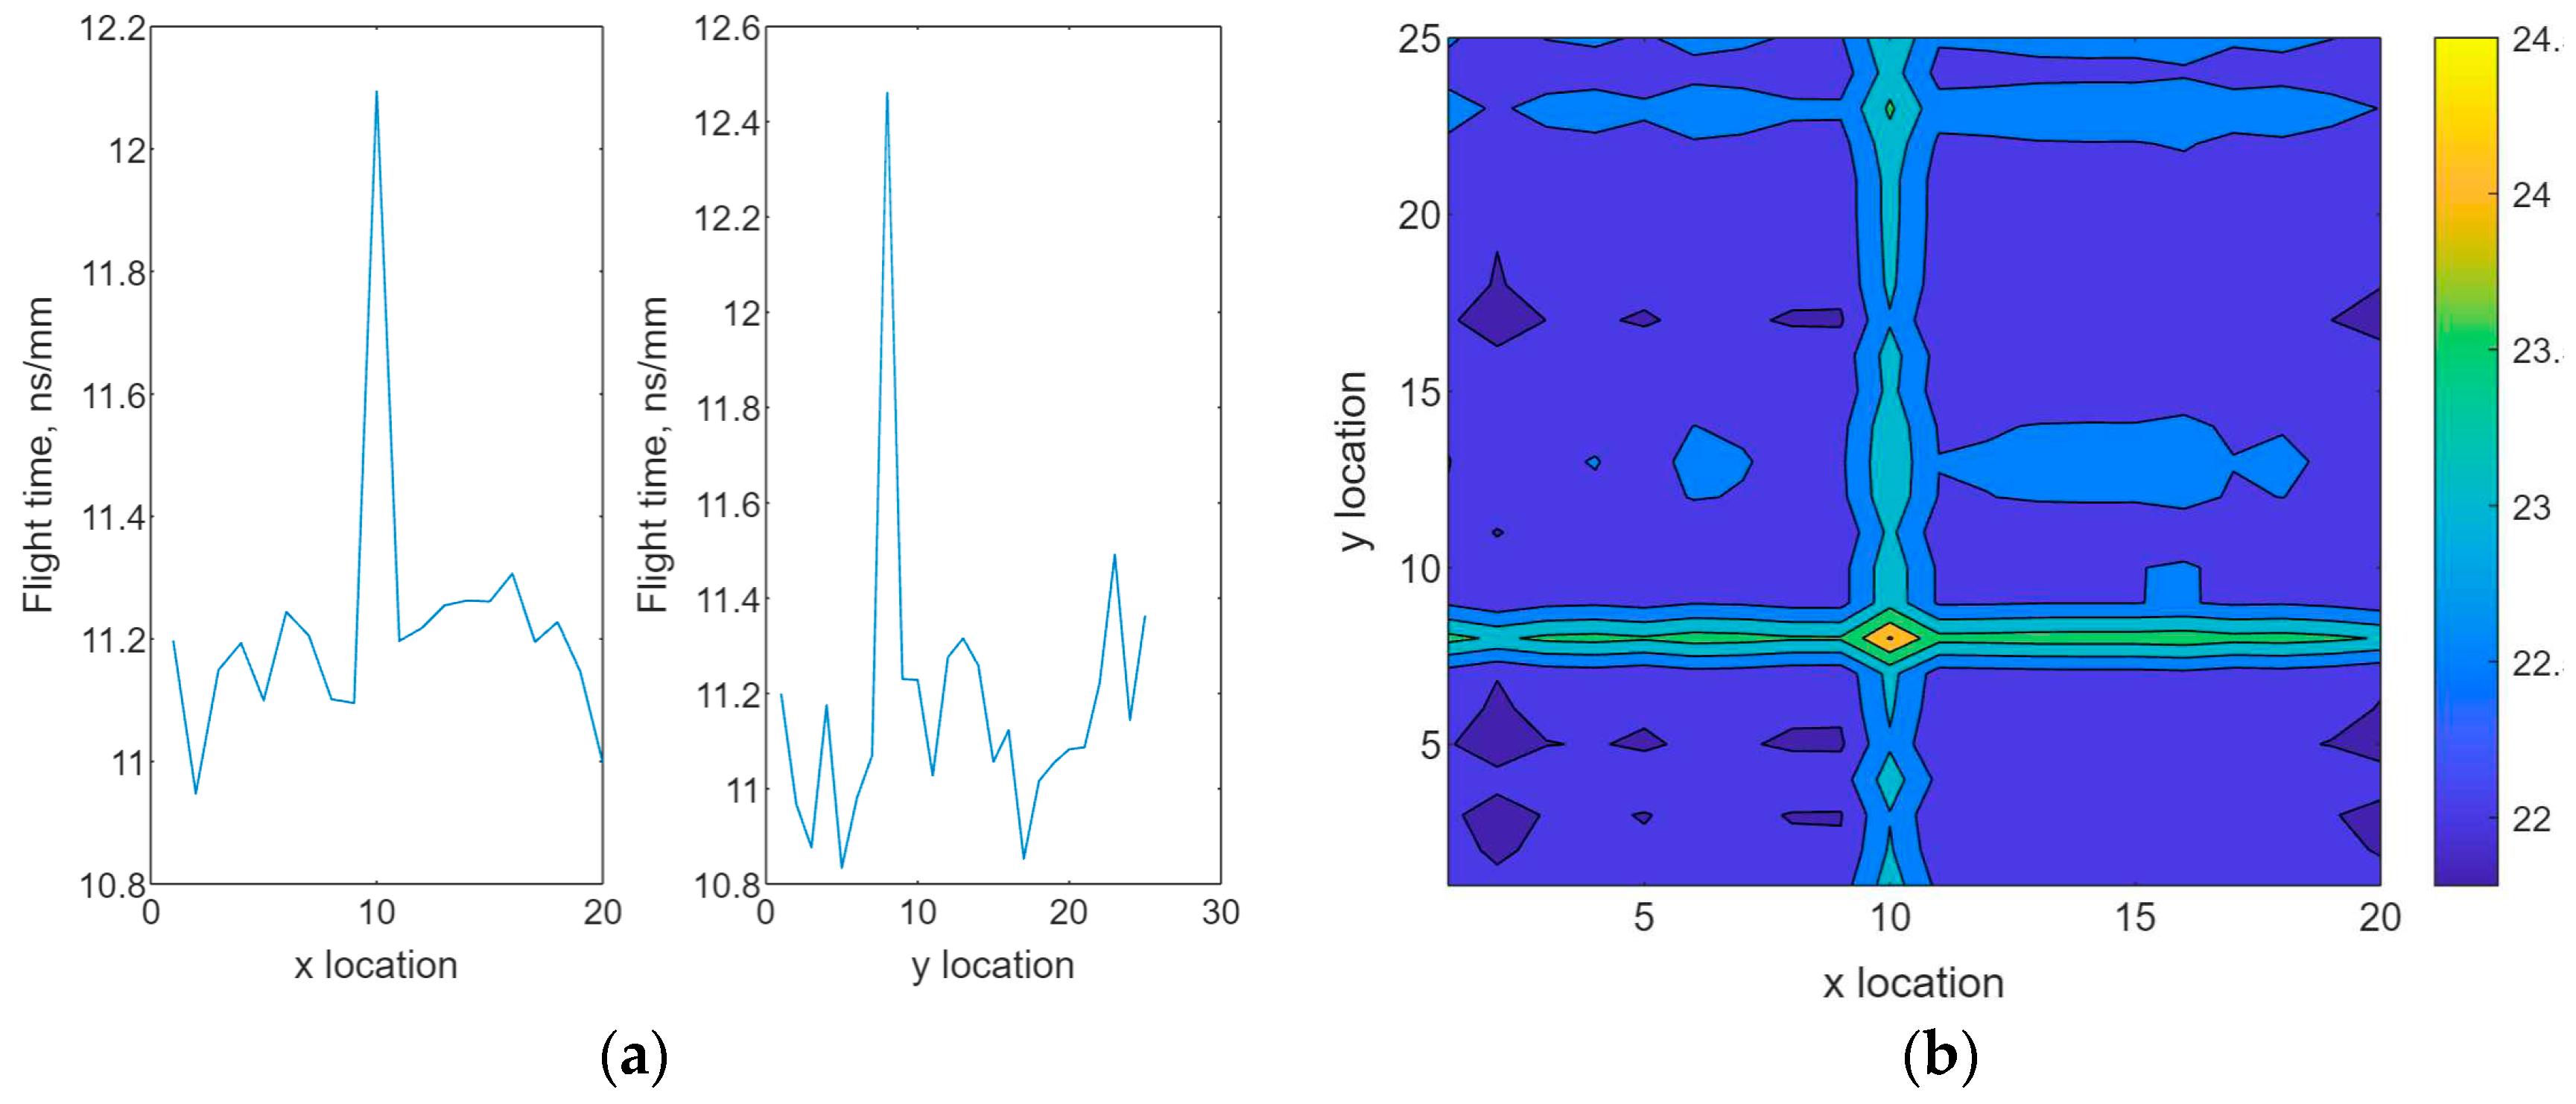
We generated two arrays, and of normal distribution to represent orthogonal measurements of flight time where . FTM was then established based on Equation (3). To simulate and compare the presence of defects, two numerical scenarios were created: measurements with no defects and measurements with defects. Method to create defect was described as follows.
Let the location of a defect be at
and the standard deviations of
and
be
Assume the value of flight time may increase 2 times of its standard deviation at location of (10, 8), such that,
where 2
is used as the increase of the flight time due to the presence of a defect. This value was an estimation for numerical simulation.
2.2. Test Method
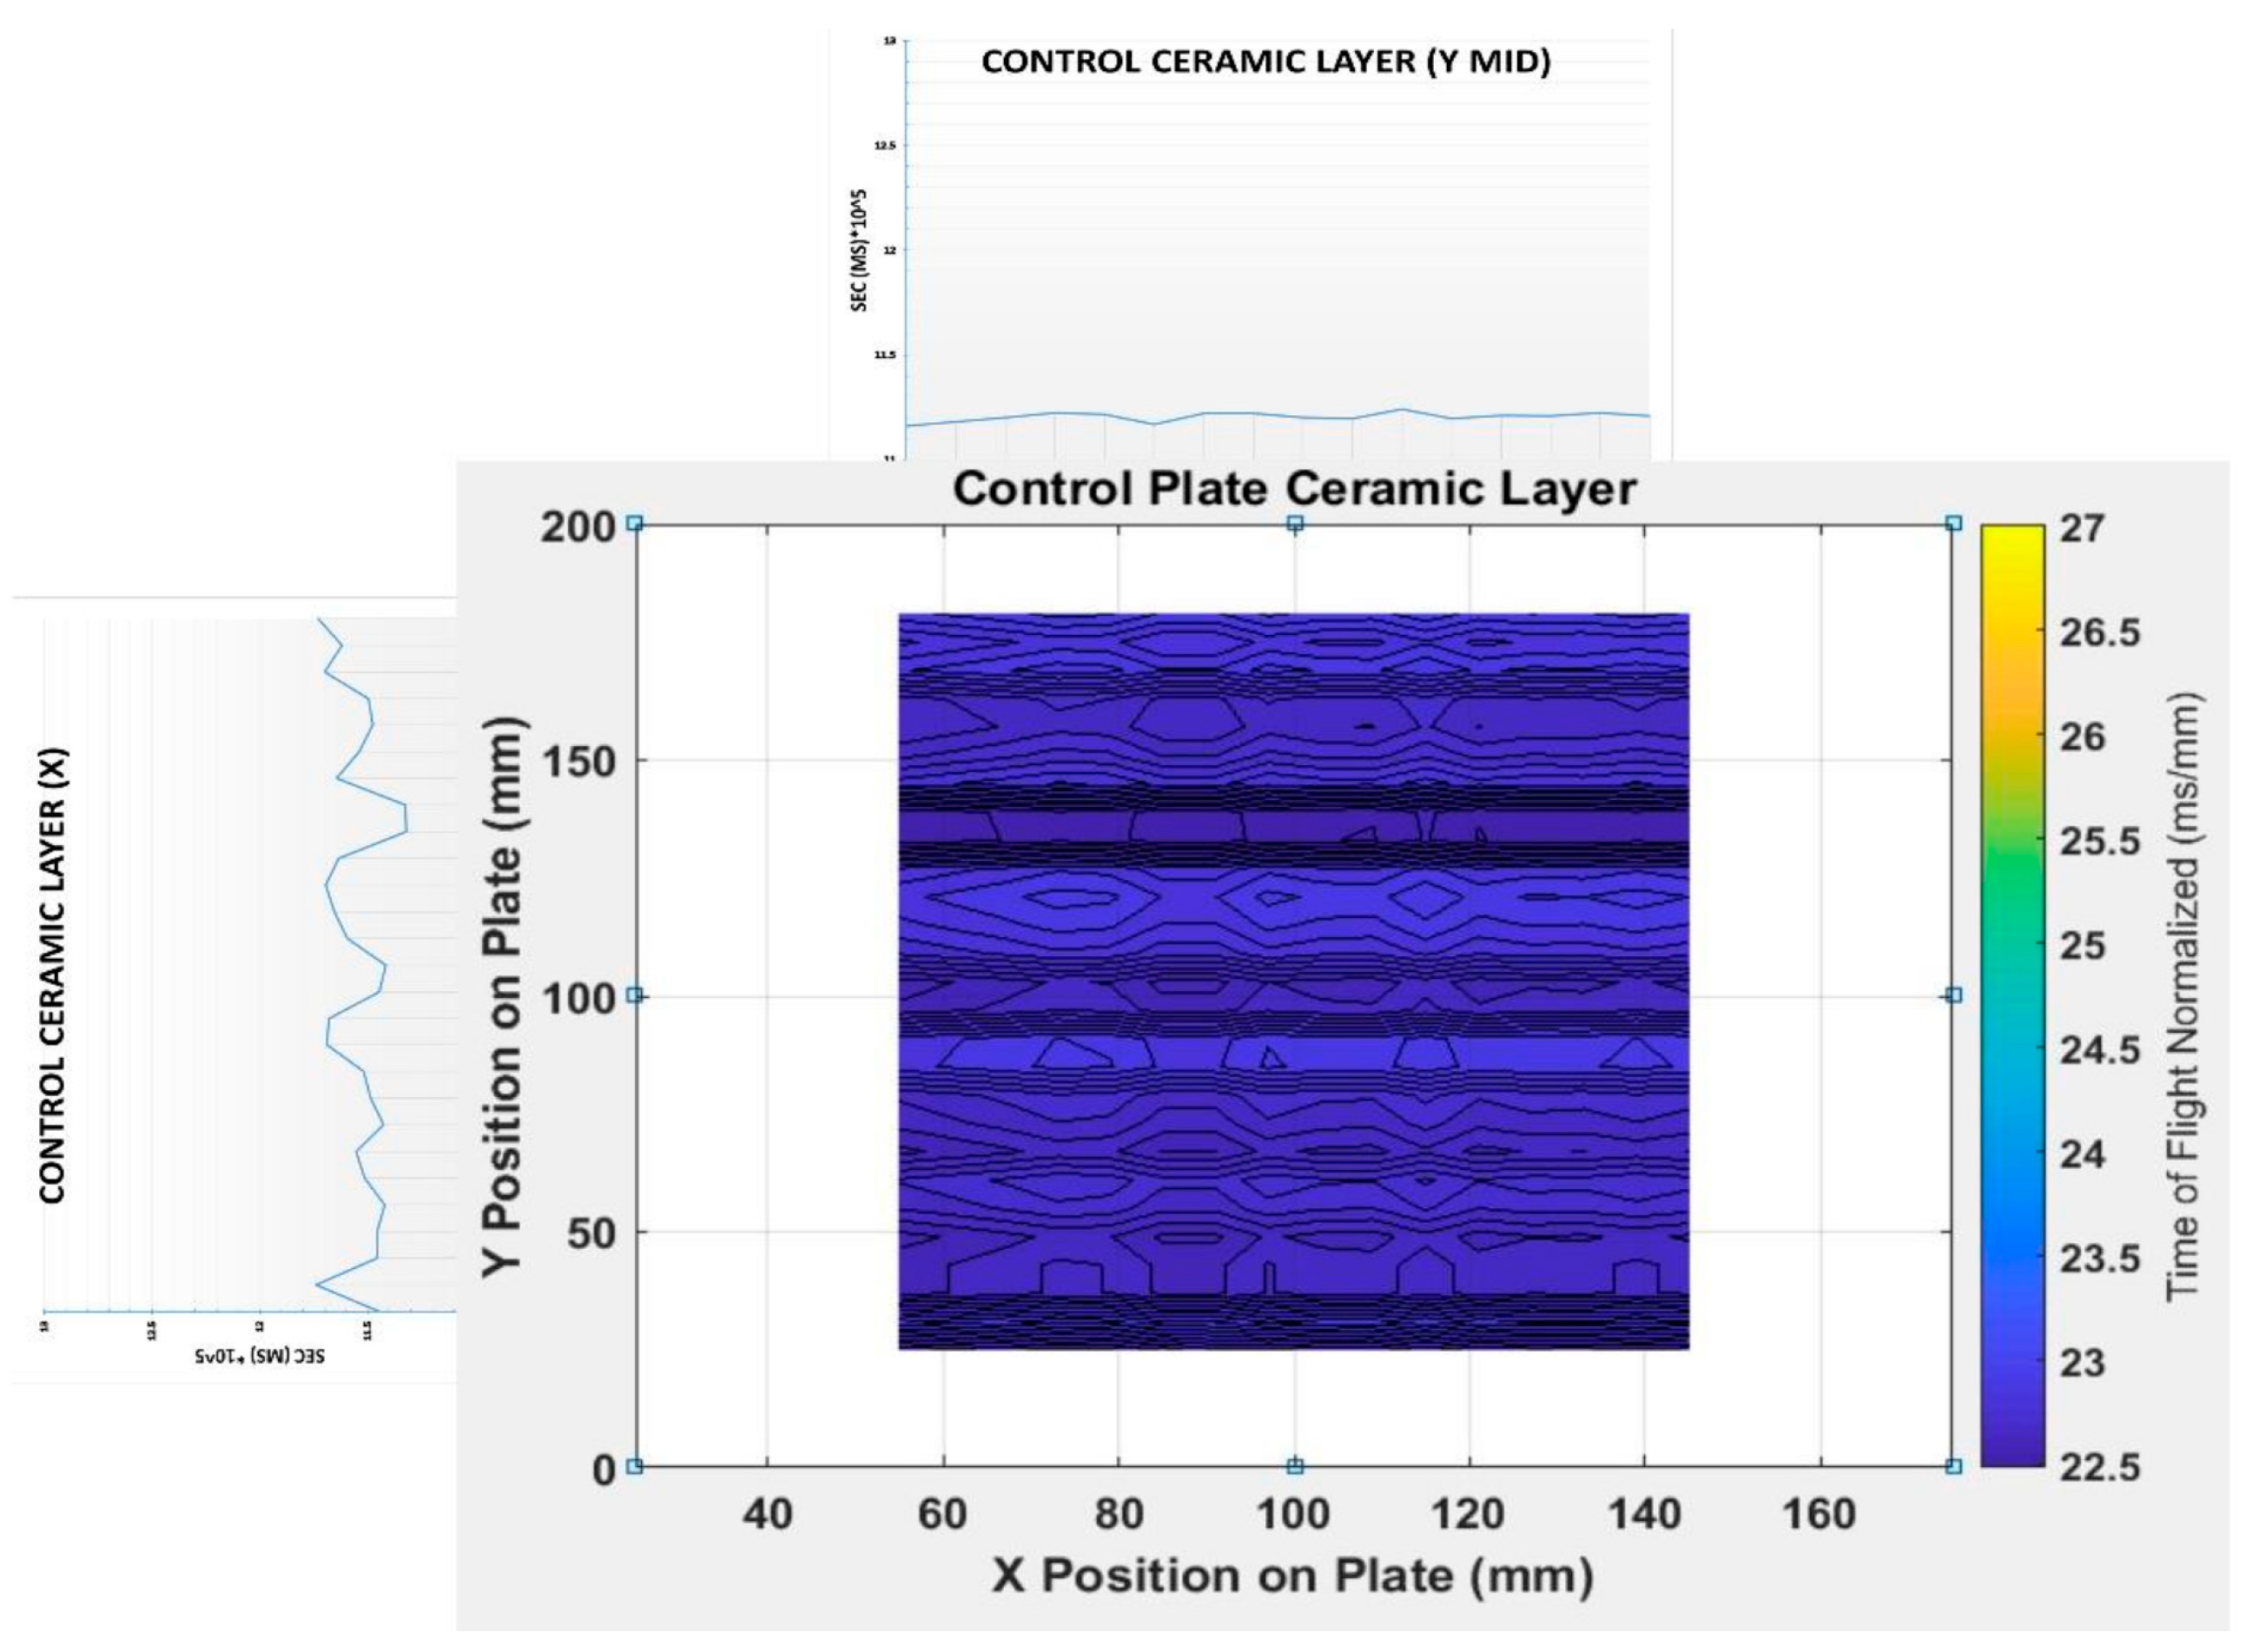
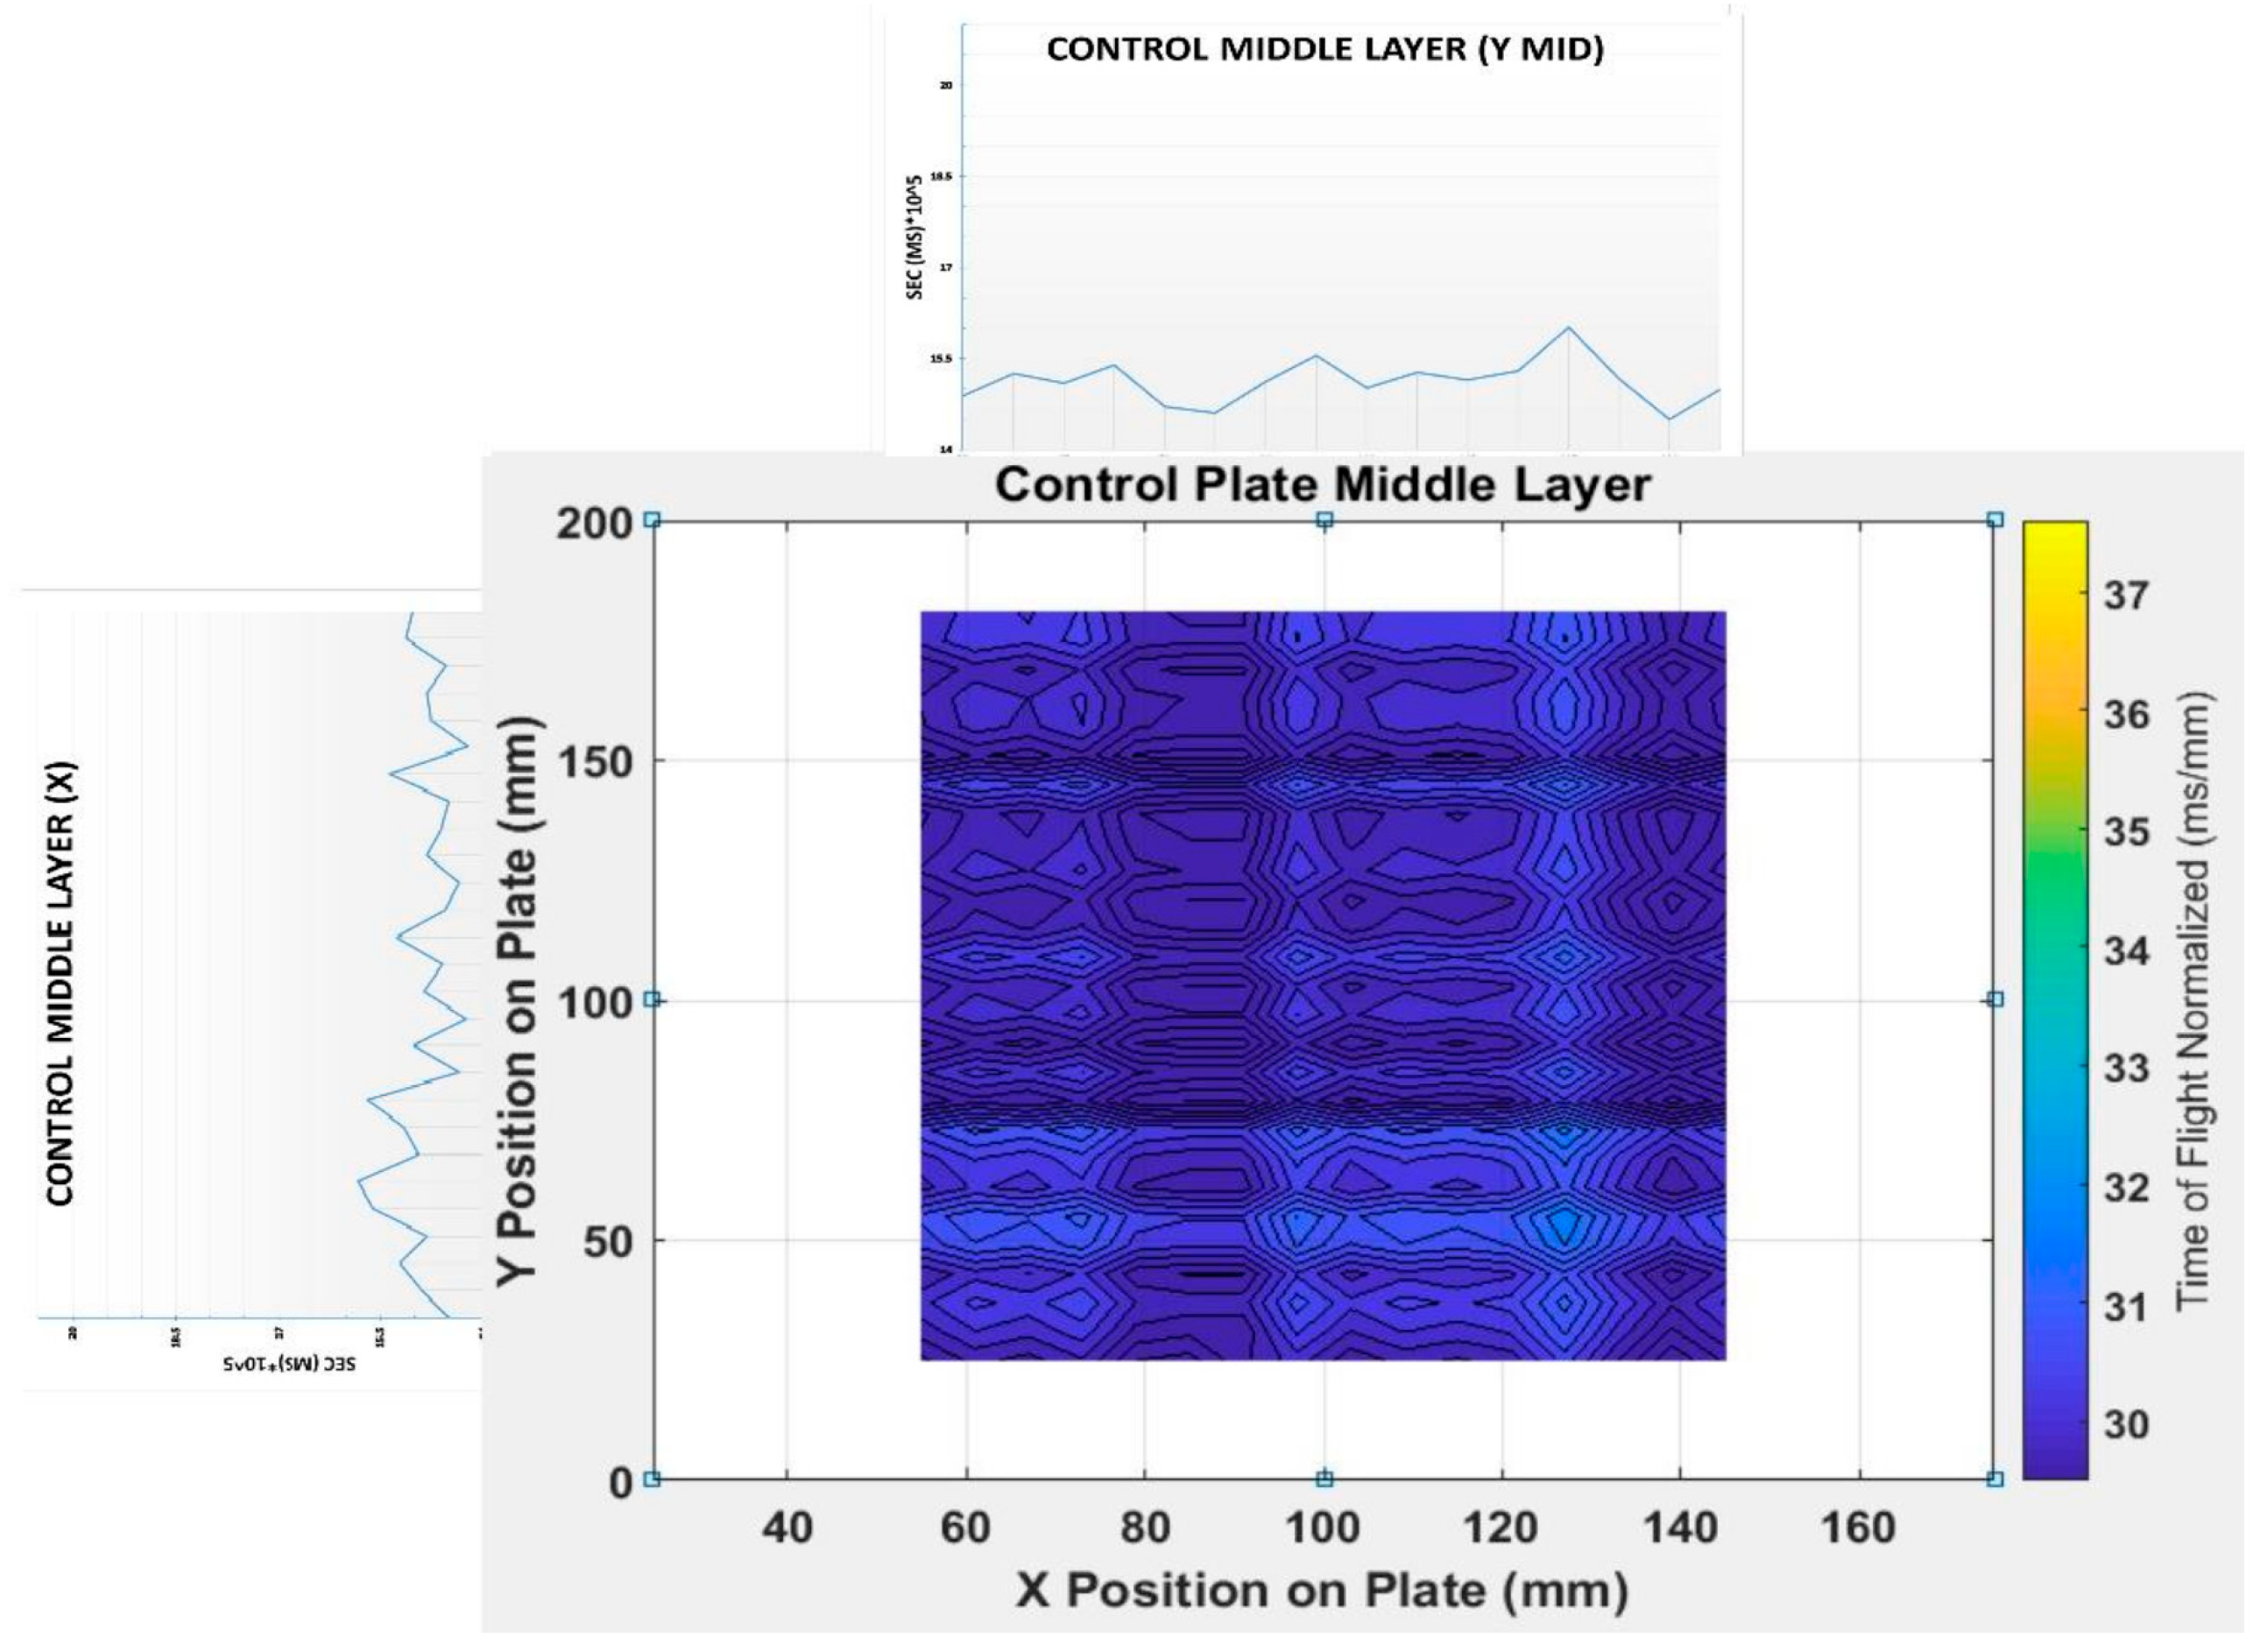
We tested each layer individually as their thickness is sufficient to cope with the transducer. Two transducers were placed face-to-face on the side of each layer in the armor plate: one pulsing and one receiving. However, due to the chamfered edges of the armor plate, as shown in
Figure 5, there are zones where orthonormal longitudinal waves are not applicable. In this figure, areas that can promote orthogonal longitudinal waves are the shaded ones where the transducers are in the line of sight with each other. The zones that are partially shaded will result failures or misdetection of our methods due to the angle of the plate were limited.
The increment of measurement was the size of the transducer diameter, 8.0 mm. We pulsed 10 times at each location and collected the time of flight in both x- and y-directions. Sil-Glyde Lubricating Compound was applied to the face of the transducers to insure a good contact between the transducer/plate interfaces. The steps of testing method is given in the following:
Measurement measure the flight time on x- and y-coordinate, respectively, according to a predetermined the increment of 8.0 mm.
Construction of FTM Construct , , and FTM arrays based on Equations (1)–(3).
Graphic Analysis Analyze the flight time plots and FTM for flight time spikes and color intense locations.
