Preprint
Article

Potential Dam Breach Flood Hazard Assessment of Kulekhani Reservoir Rock Fill Dam Using 2D Diffusion and Full Dynamic Shallow Water Equation Defining Coriolis Effect

Altmetrics

Downloads

107

Views

52

Comments

0

Submitted:

01 November 2023

Posted:

01 November 2023

You are already at the latest version

Alerts
Abstract
Dam breaches have catastrophic consequences, causing severe property damage, life loss, and environmental impact. The Kulekhani reservoir rockfill dam break was studied to evaluate the downstream impact. The appropriate breaching parameter of MacDonald and Langridge (1984) regression equations was selected based on the sixteen observed dam failure cases and cross-sectional geometry of the existing dam of Kulekhani. The 2D Diffusion Wave and Full Dynamic Wave Equation were applied for downstream flood assessment, Full Dynamic Wave was able to capture the physical flow phenomena like river bend effects resulting in higher flow velocity at the outer bend, and formation of eddies considering losses. The application of a Full Dynamic Equation was found to be appropriate for rapidly varying unsteady flow considering steep slopes, and sudden changes in channel geometry. Flood mapping of water depth, flow velocity, flood intensity, and arrival time were carried out for flood hazard assessment classified by the American Society of Civil Engineers (ASCE). Flow depth and extension of the flow area were compared to identify the affected area, higher flow depth and larger extension were observed using a Full Dynamic Wave Equation as a result of less flow velocity considering the losses. Almost 17 minutes of the arrival time of peak difference at the Bagmati River confluence was evaluated between the models which plays an important role in decision-making for selection of the flood model. Flood mitigation with river diversion works through a hydraulic measure of Levee was suggested to protect the highly affected households of Ranche, Nagmar, Khanikhet, and Debaltar towns. Most of the household was found to be safe after the construction of the Levee except for eleven houses that lie along the river below flood elevation of 1269.6 m.a.s.l. This signifies the importance of room for the rivers and the human settlement near the river might be life-threatening.
Keywords: 
Subject: Engineering  -   Civil Engineering

1. Introduction

Over the last decades, multipurpose dams have been built for water supply, flood control, hydropower generation, irrigation, recreation, and tourism. Sadd el-Kafara Dam, Egypt[1], and Jawa Dam, Jordan[1,2] are some of the oldest dams in the world built over 2000 years ago. People have been living near the river for a long time, as the development of human civilizations is closely tied to the availability of water. Rivers are considered a consistent source of fresh water, providing fertile land for agriculture, and inland navigation for trades[3]. Living near a river might be vulnerable due to recurring flooding events, bank erosion, and other natural hazards. The downstream flooding events due to the dam breach have a huge potential for widespread devastation, significant natural hazards, loss of property, and life-threatening to human life[4]. Proper awareness and planning are essential for people living riverfront to ensure safety and resilience against natural hazards. Johnstown Flood (1889)[5,6] due to the South Fork Dam breach, is considered one of the deadliest floods due to dam breaches in U.S. history where nearly two thousand people were killed, and several villages were affected by destroying property. Similarly, Vajont Dam Disaster (1963)[7], Teton Dam failure (1976)[8], Banqiao Dam failure (1975)[9], Taum Sauk Dam failure (2005)[10], Malpasset Dam failure (1959)[11] are some of the dam breaks that have created serious threats to the people and property at the downstream side of the dam. Earthfill dams experience different modes of failure such as overtopping due to insufficient storage capacity and inadequate spillway facilities for excess flow, piping due to internal erosion creating channels within the dam, and seismic response failures are the most common failures[10,12].
Arthur Casagrande[13], Ralph Peck [14], and Karl Emil Hilgard[15] are some of the pioneers who have significant contributions to the dam breach study and modeling. Vaskinn, K. A. and Hassan, M. A. A. M. (2004) [16] conducted a large-scale physical breach formation model test to identify different failure processes such as cracking, arching (pipe formation), head cut formation, and progression of the breach. Kouzehgar. K and Babaeian Amini, A. (2021)[17] carried out a dam-break physical model test due to overtopping considering a homogeneous earth-fill dam to establish a regression equation for peak outflow hydrograph and breach geometry. Ashraf, M.[18] studied the large-scale physical model to establish the relationship between breach parameters considering the breach opening, outflow peak, and breaching time through statistical methods using a regression model. Sammen, S [19] described several regression equations for breach parameters including well-known MacDonald and Langridge-Monopolis (1984), Froehlich (1995a), Froehlich (2008), Von Thun and Gillette (1990), X and Zhang (2009). Zenz, G. (2015) [20] established a new hydrograph approach to compute peak outflow with empirical relationships of reservoir volume and time of the breach.
Pilotti, M., and Maranzoni, A.[21] estimated downstream hydrograph using a 2D Shallow Water Equation with the application of open source solver HECRAS, and TELEMAC. A good match of downstream hydrograph results was obtained and compared with the experimental Cancano dam break test case. Bellos, V [22] studied the uncertainty of the dam breach model parameters for maximum peak flood flow and inundation depth downstream using Monte Carlo simulation considering the Papadiana Dam failure, Greece. Albu, L. M. [23] applied HECRAS 2D simulation to evaluate the impact of dam breach size on flood downstream considering a case study of Dracsani Lake. Psomiadis, E.[24] performed the HECRAS 2D dam breach model of Bramianos Dam to compare the downstream potential flood hazard using the Digital Elevation Model and Digital Surface Model. The flood hydrographs using Diffusion Wave and Full Saint Venant Equation were compared and found to be more or less similar at the downstream side of the dam section. Yilmaz, K.[24] modeled flood hazard assessment of Dalaman Akköprü Dam breach using 2D Diffusion Wave and Shallow Water Equation to compare the change in water depth and flow velocity due to the influence of neglected local acceleration and convective acceleration. Flow velocity decreases, and water depth increases in some of the sections of the river due to the effect of local and convective acceleration using the Full Dynamic Shallow Water Equation. Costabile, P. [25] compared the flow depths considering a case of flow interaction with the blocks using Full Dynamic and Diffusion Wave Equations. The results have shown, that a Full Dynamic Wave successfully captures the reflection of the wave and the wake effects due to the interaction of block as expected. Costabile, P. [25] also, compared the simulated hydrograph results with the experimental data and concluded that the poor prediction was achieved with the Diffusion Wave Equation for all the gauges as it significantly underestimated the fluid block interaction.
This paper studies the possible dam break flood hazard assessment of the Kulekhani reservoir rockfill dam using 2D Diffusion and Full Dynamic Shallow Water Equation. The main objectives of the dam breach study:
-
Specify dam breach parameters considering a suitable dam breach model and evaluate downstream peak flow with an empirical equation.
-
Breach flood hazard assessment considering:
a)
Flow depth mapping
b)
Flow velocity mapping
c)
Flood hazard classification based on flood intensity values
d)
Time of arrival mapping
e)
Area of inundation

2. Materials and Methods

2.1. Area of interest

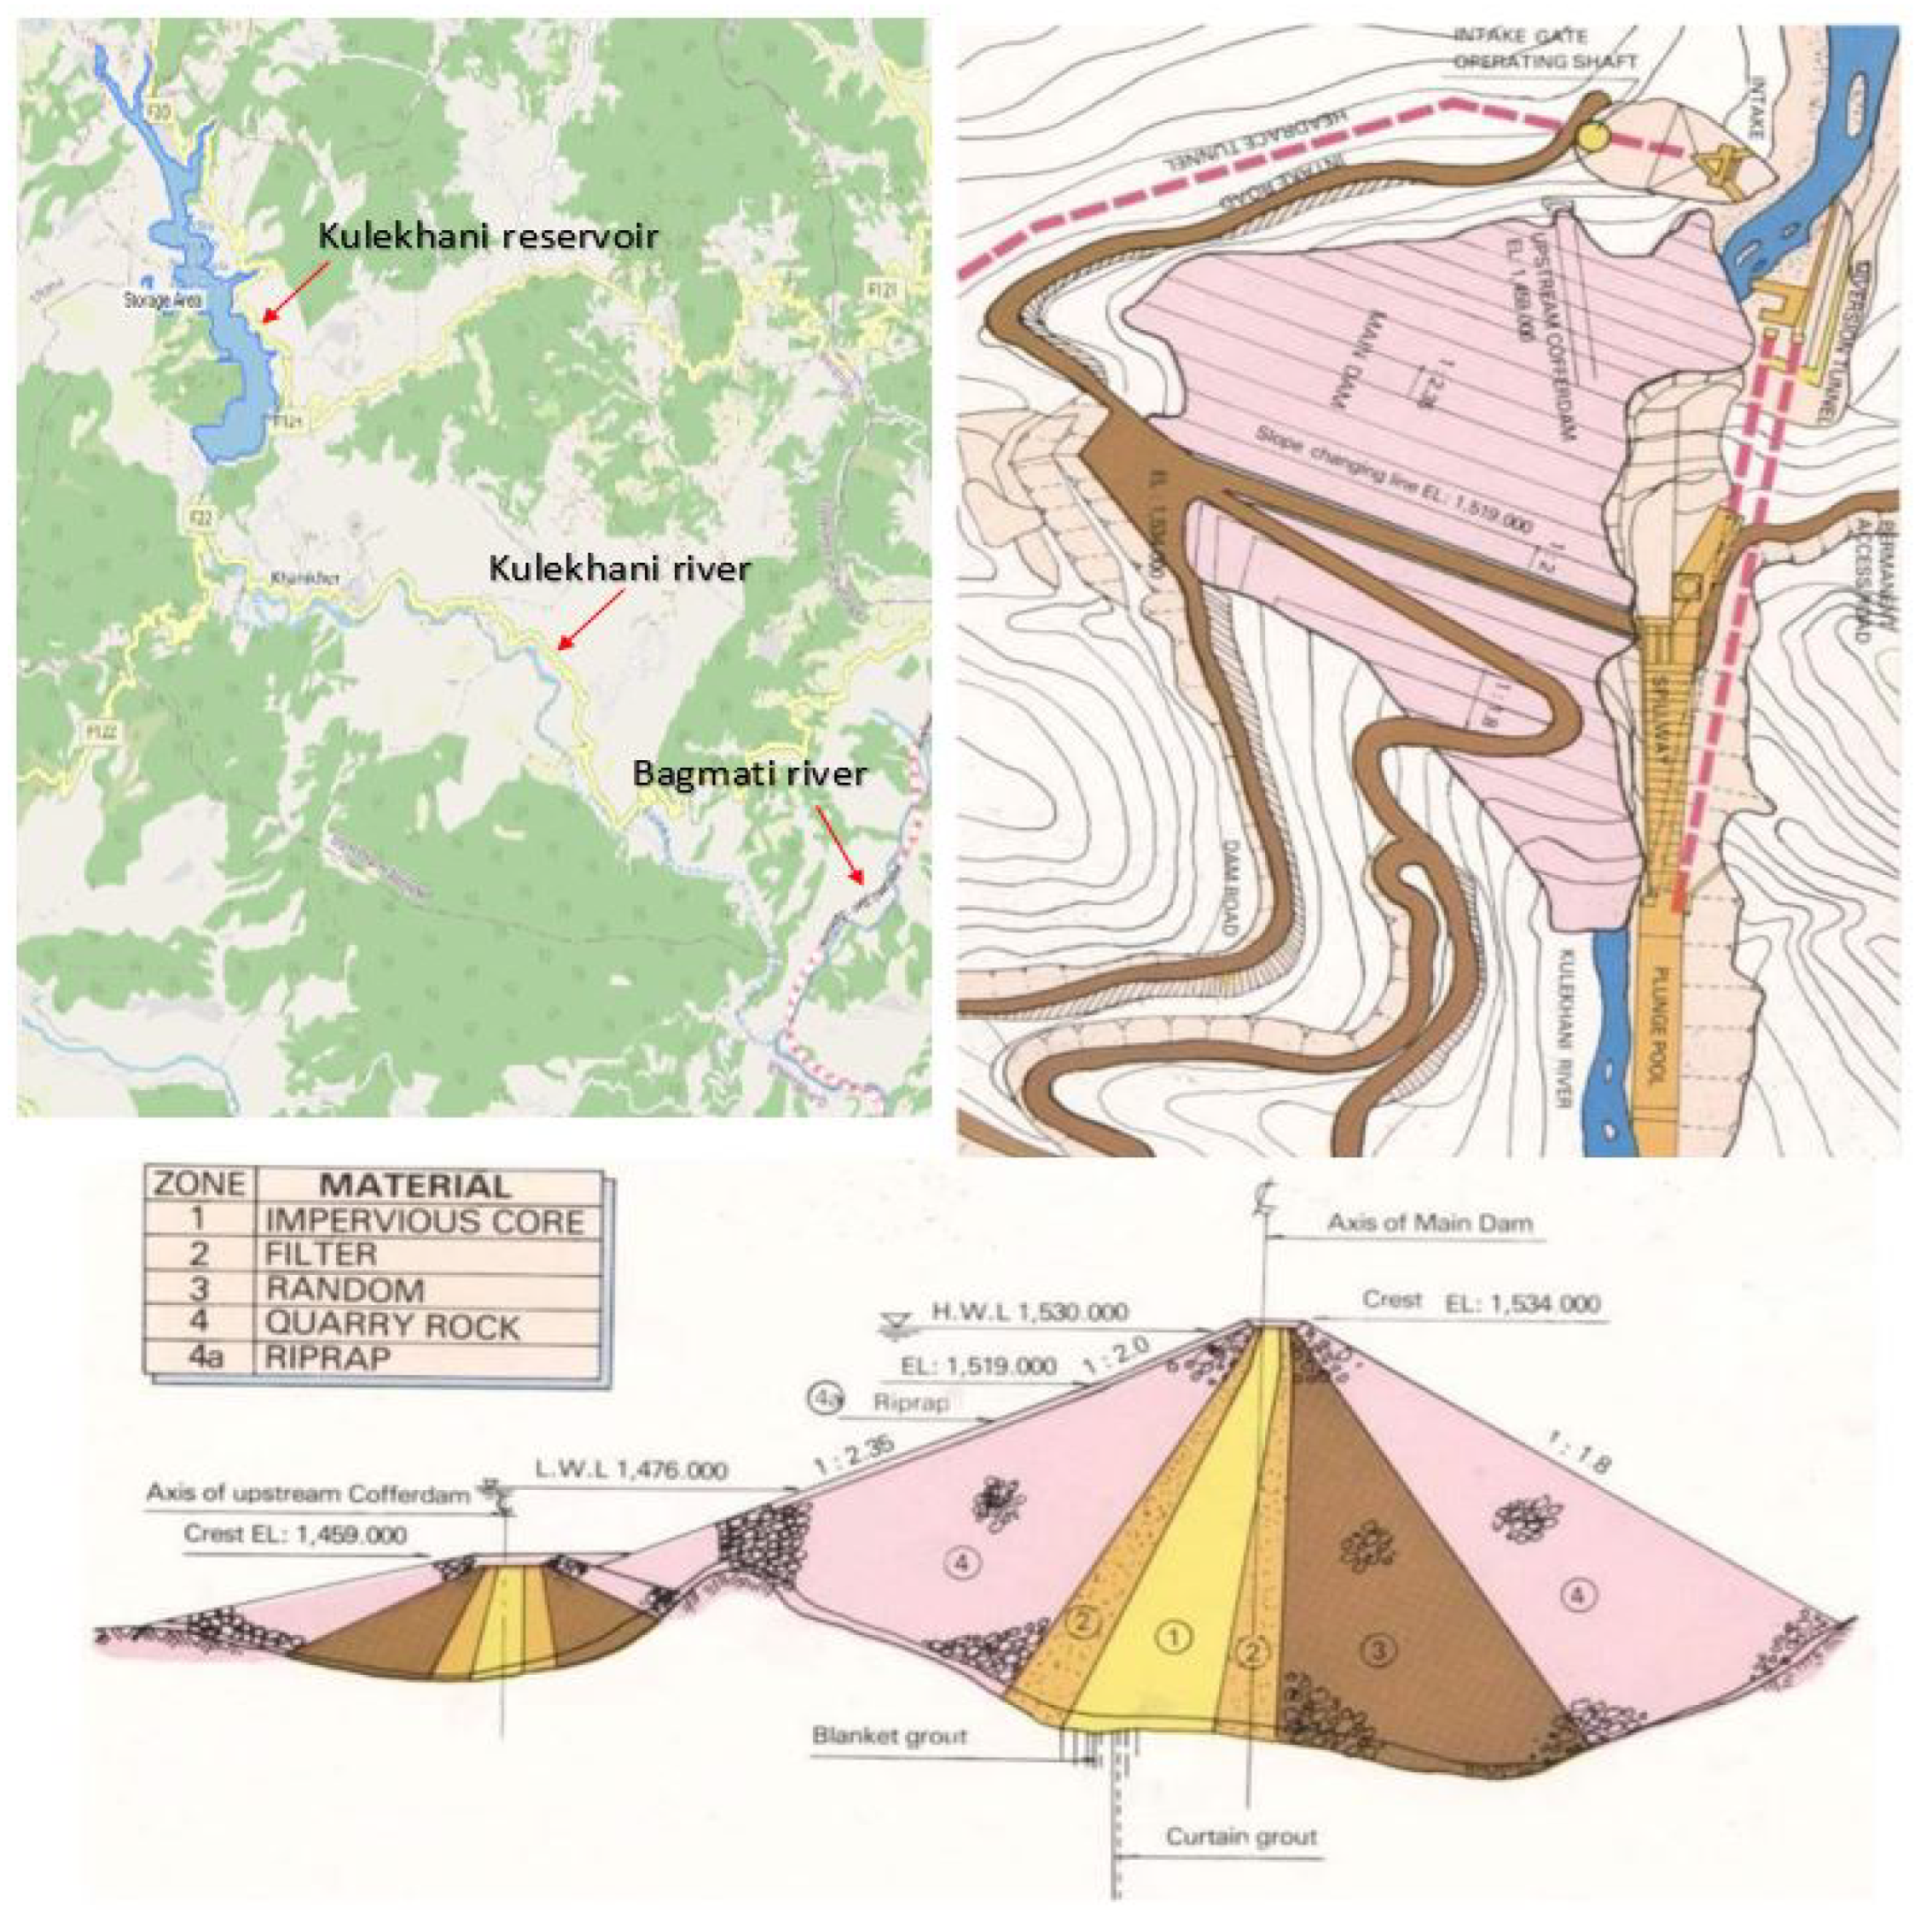
The Kulekhni reservoir dam is the oldest rockfill dam in Nepal located at Dhorsing, Makwanpur [26]. The impounded water of the reservoir has been used to generate electricity by three hydropower stations, Kulekhani I (60MW) commissioned in 1982, Kulekhani II (32MW) commissioned in 1986, and Kulekhani III (14MW) commissioned in 2019 owned by Nepal Electricity Authority[26]. The designed Kulekhani reservoir capacity can withhold Probable Maximum Flood (PMF) up to 2540 m 3 /s considering a watershed area of 126 k m 2 [27]. The zonal rock-fill dam consists of an inclined clay core, coarse and fine filter materials, and boulder rip rap for slope protection. The dam was constructed with an overall upstream slope of 1:2.35 and a downstream slope of 1:1.8. The clay core zone has been excavated until the bedrock, and provided with the grout curtain to prevent flow through seepage [27]. The 10m crest-width dam has a central axis cross-sectional bottom length of 97m and a top length of 397m with a height of 114m. The meandering river of 16km reach length from the downstream of the dam to the confluence of the Bagmati River has a steep overall slope of 1:42 and a narrow valley with a vertical side slope between 45 60 o [27].
Figure 1. Kulekhani reservoir inclined clay core rockfill dam [28].
Preprints 89378 g001
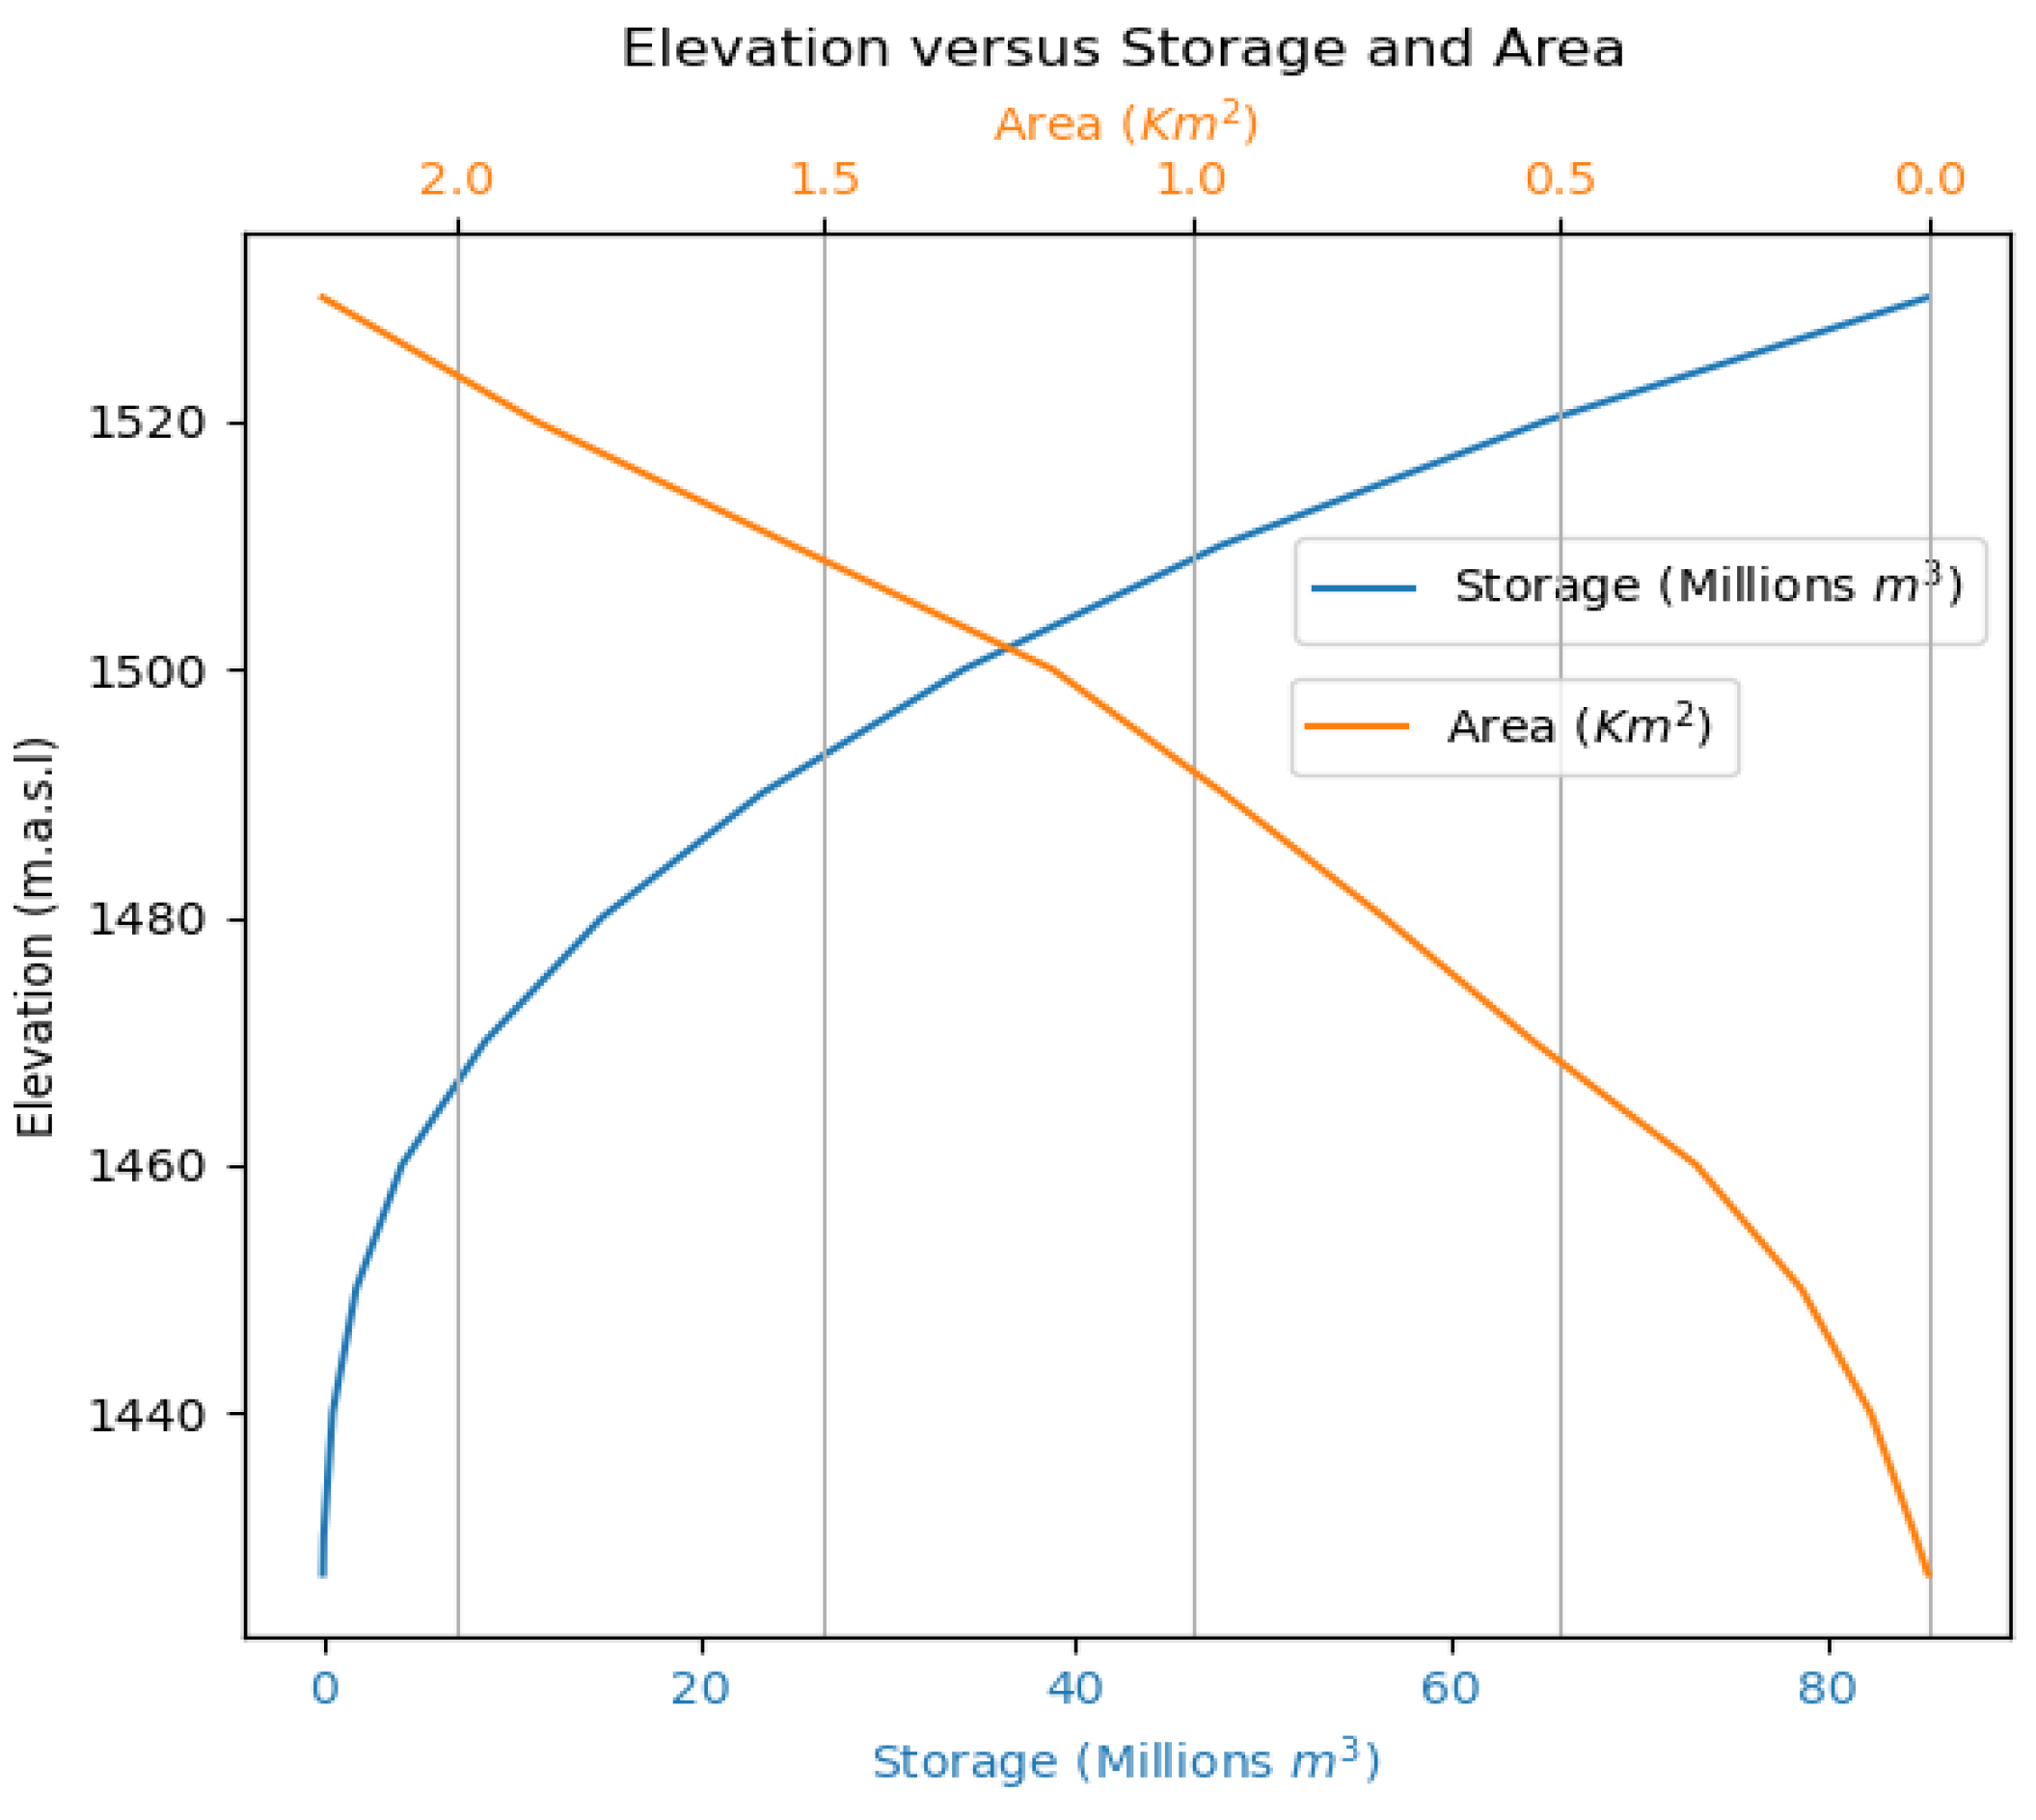
The reservoir volume elevation-area curve is an essential parameter for dam break that determines the change in volume with respect to change in elevation. The curve accurately represents the hydrodynamics of the dam breach to determine the dam release flow rate, often used in dam break simulation to calibrate and validate real case failure results as illustrated by Alcrudo, F. [29].
Figure 2. Kulekhani reservoir elevation volume-area curve [27].
Preprints 89378 g002
The reservoir holds a volume of 85.285 million m 3 with a total dam height of 114m consisting of 397m crest length and 10m width. The reservoir is spread up to 7km with a surface area of 2.2 k m 2 [27].

2.2. Breach model

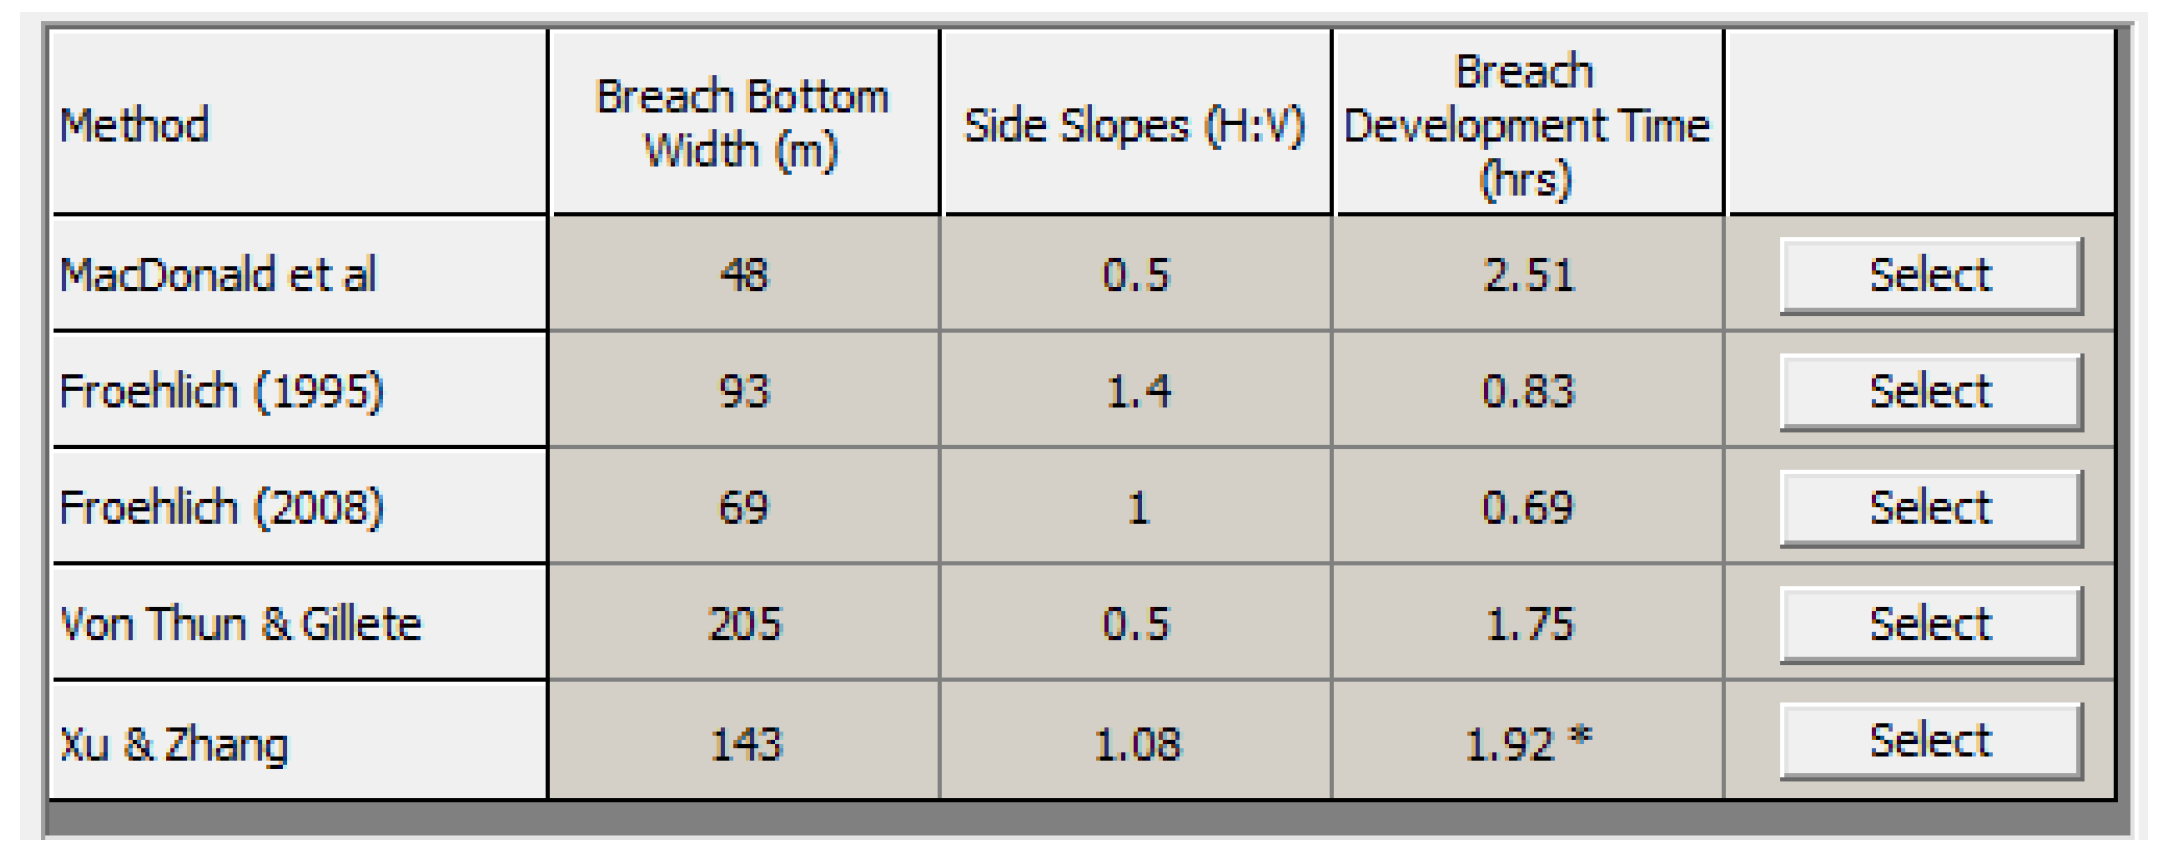
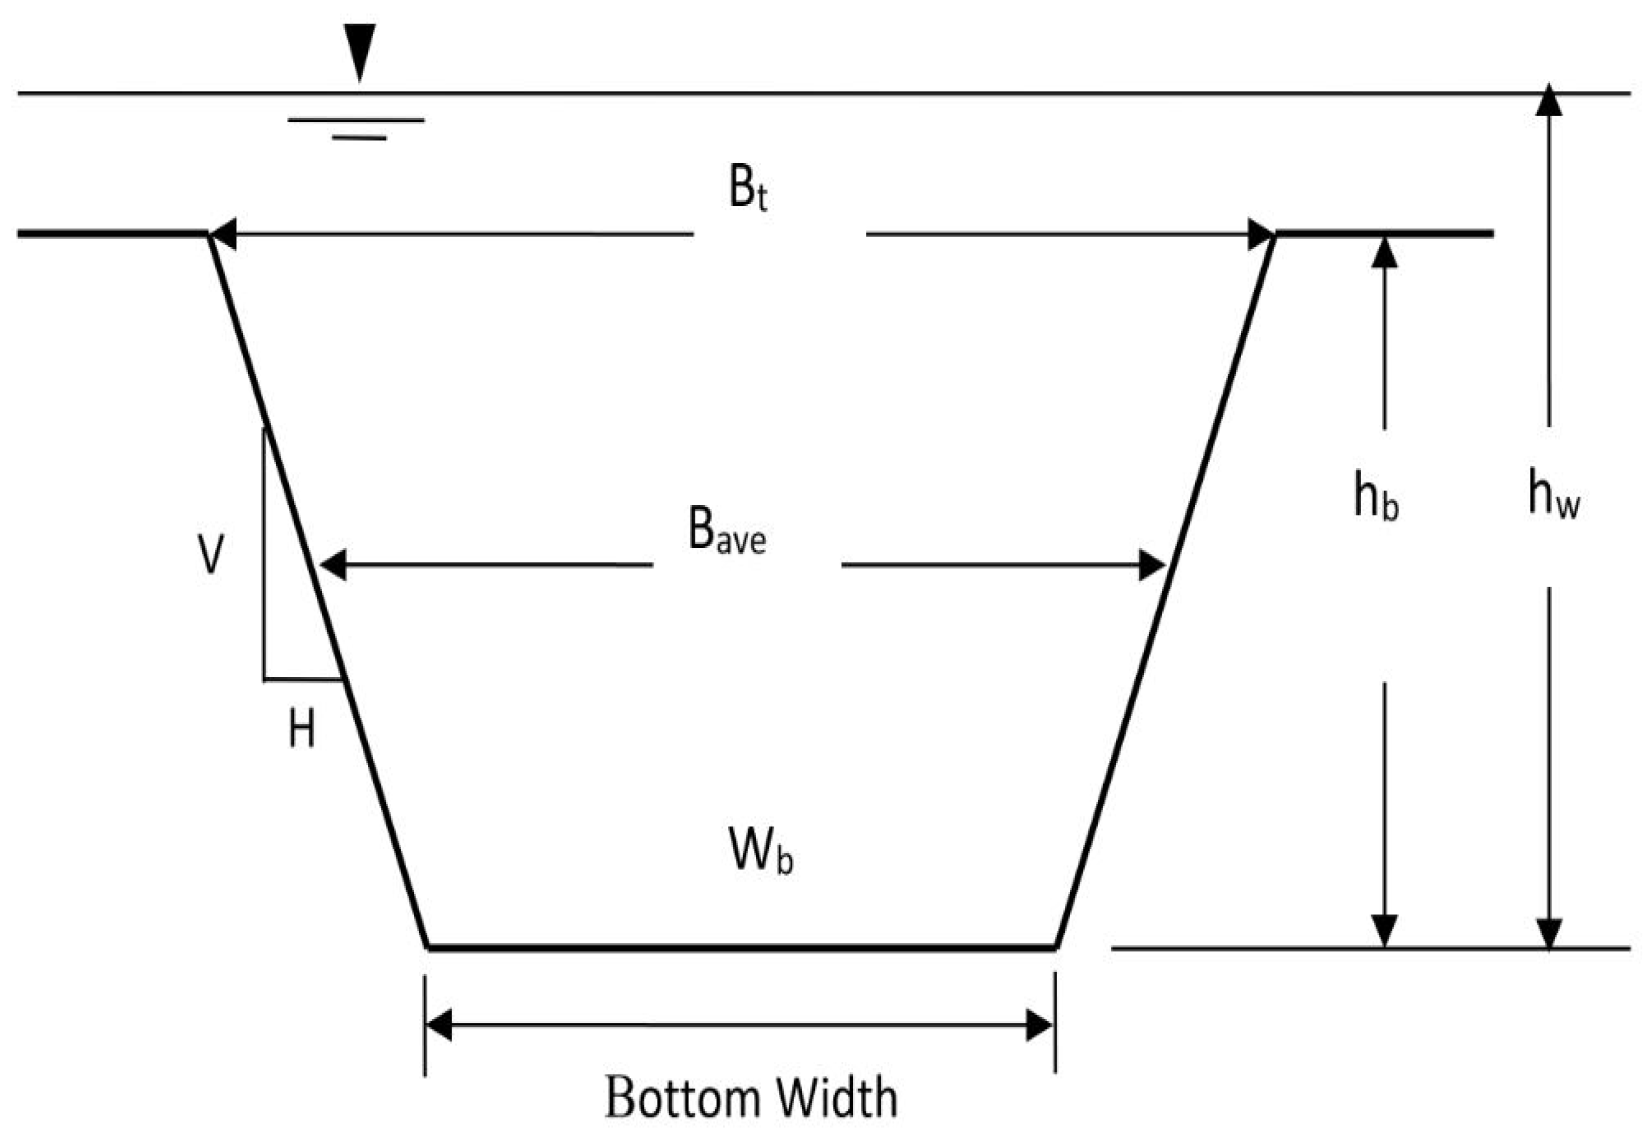
The dam breach modeling process is the mathematical and physical representation of the dam’s failure to release significant flow from the reservoir. The selection of an appropriate dam breach model is often considered a challenging task due to uncertainties of dam failure and resulting downstream peak, which is directly affected by the dam breach parameter[30]. Several validated regression equations have been established to determine the dam breach parameter i.e. average breach width, side slope, volume of erosion, and time of breach based on the dam failure cases. HECRAS implements some well-known regression models such as Froehlich (1995), Froehlich (2008), MacDonald and Langridge-Monopolis (1984), Von Thun and Gillette (1990), and Xu and Zhang (2009) [31]. The breach parameters were estimated, Figure 3 considering the breaching depth up to 75m (1459 m.a.s.l) with a reservoir volume of 85.285 million m 3 .
Figure 3. Dam breach parameters through regression equations.
Preprints 89378 g003
The regression models using Froehlich (1995), Froehlich (2008), and MacDonald and Langridge-Monopolis (1984) were tested using the over-topping scenario excluding Von Thun and Gillette (1990), and Xu and Zhang (2009) as they were providing higher breach bottom width than the existing bottom width geometry of the dam section.
Figure 4. Dam breach section parameters.
Preprints 89378 g004
Table 1. Regression model equations for breach parameter [31].
Regression equation Average breach width ( B a v e ) Breach formation time ( t f )
Froehlich (1995) B a v e = 0.1803 K 0 V w 0.32 h b 0.19 t f = 0.00254 V w 0.53 h b 0.90
Froehlich (2008) B a v e = 0.27 K 0 V w 0.32 h b 0.04 t f = 63.2 V w g h b 2
MacDonald and Langridge-Monopolis (1984) V eroded = 0.00348 V out × h w 0.852 W b = V eroded h b 2 C Z b + h b Z b Z 3 / 3 h b C + h b Z 3 / 2 t f = 0.0179 V eroded 0.364
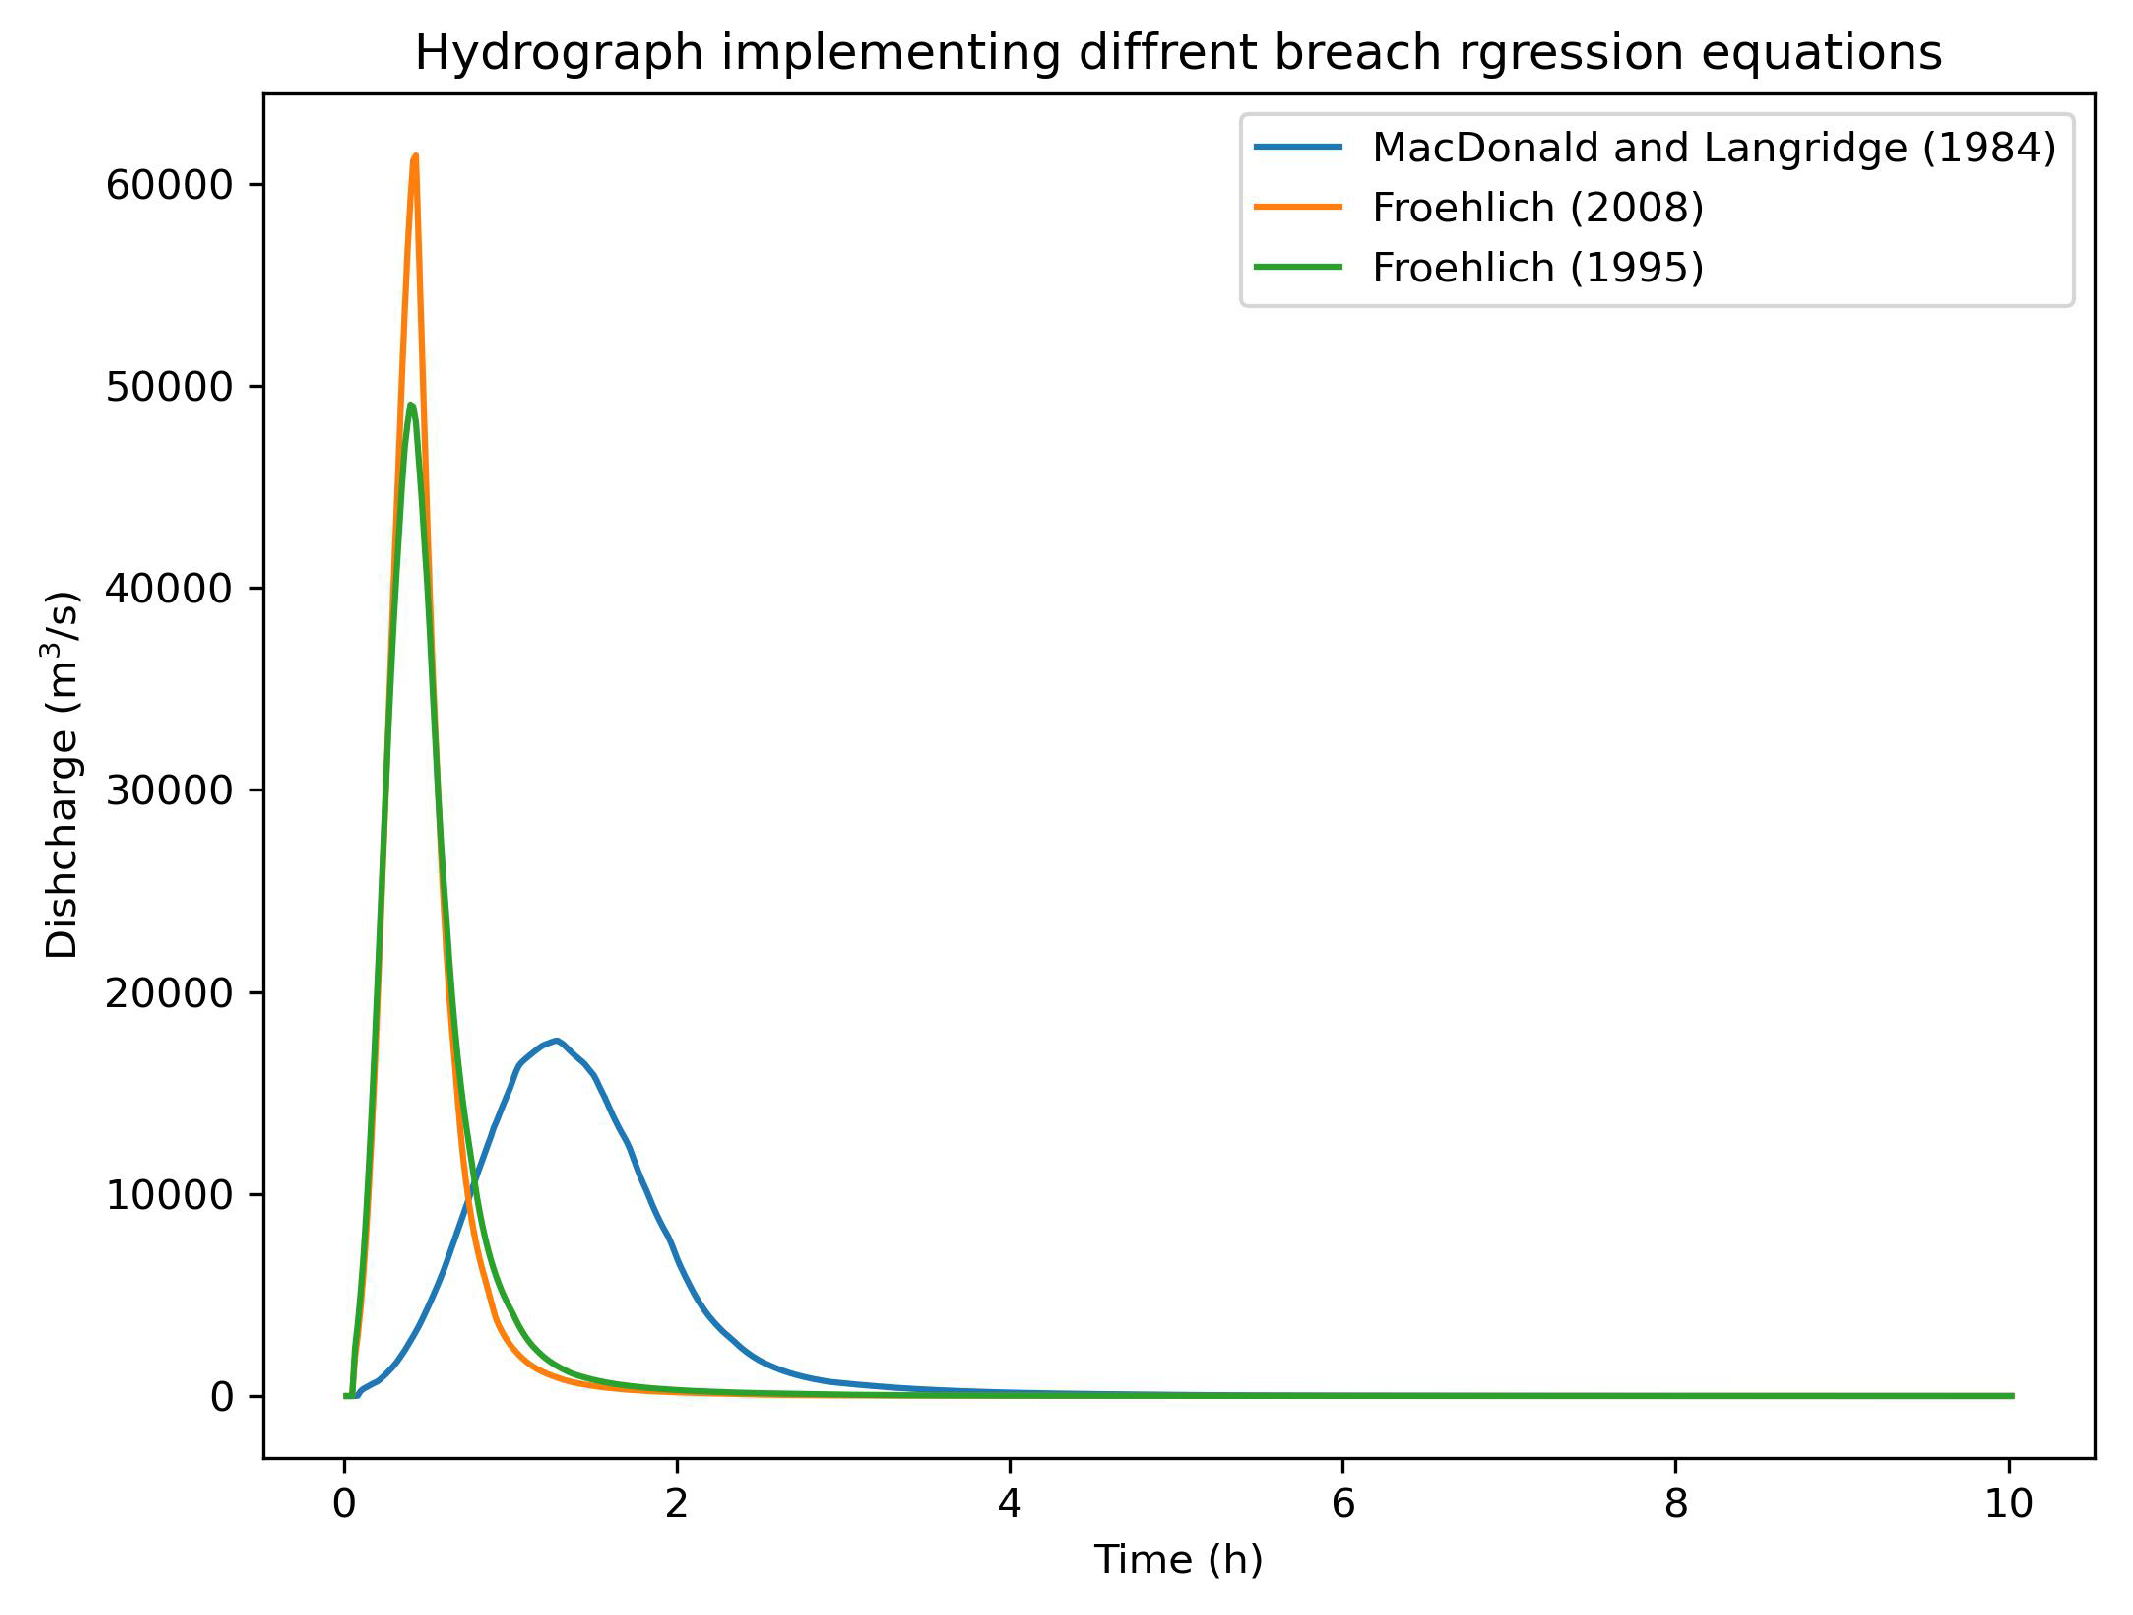
Figure 5. Hydrograph through regression equations, downstream of the dam at Section-0, Figure 12
Preprints 89378 g005
The peak discharge of 61389 m 3 / s using Froehlich (2008), 49066 m 3 / s implementing Froehlich (1995), and 17594 m 3 / s with MacDonald and Langridge (1984) were evaluated downstream of the dam. The time of breaching and bottom width breach progression highly dominate the downstream flow peaks as obtained. Although breaching time and breach width are uncertain, Table 2 shows the breaching time for most of the observed real cases earth fill dams are above 2.51h for large dams. Therefore, MacDonald and Langridge (1984) regression equation was implemented to obtain the breach parameters.
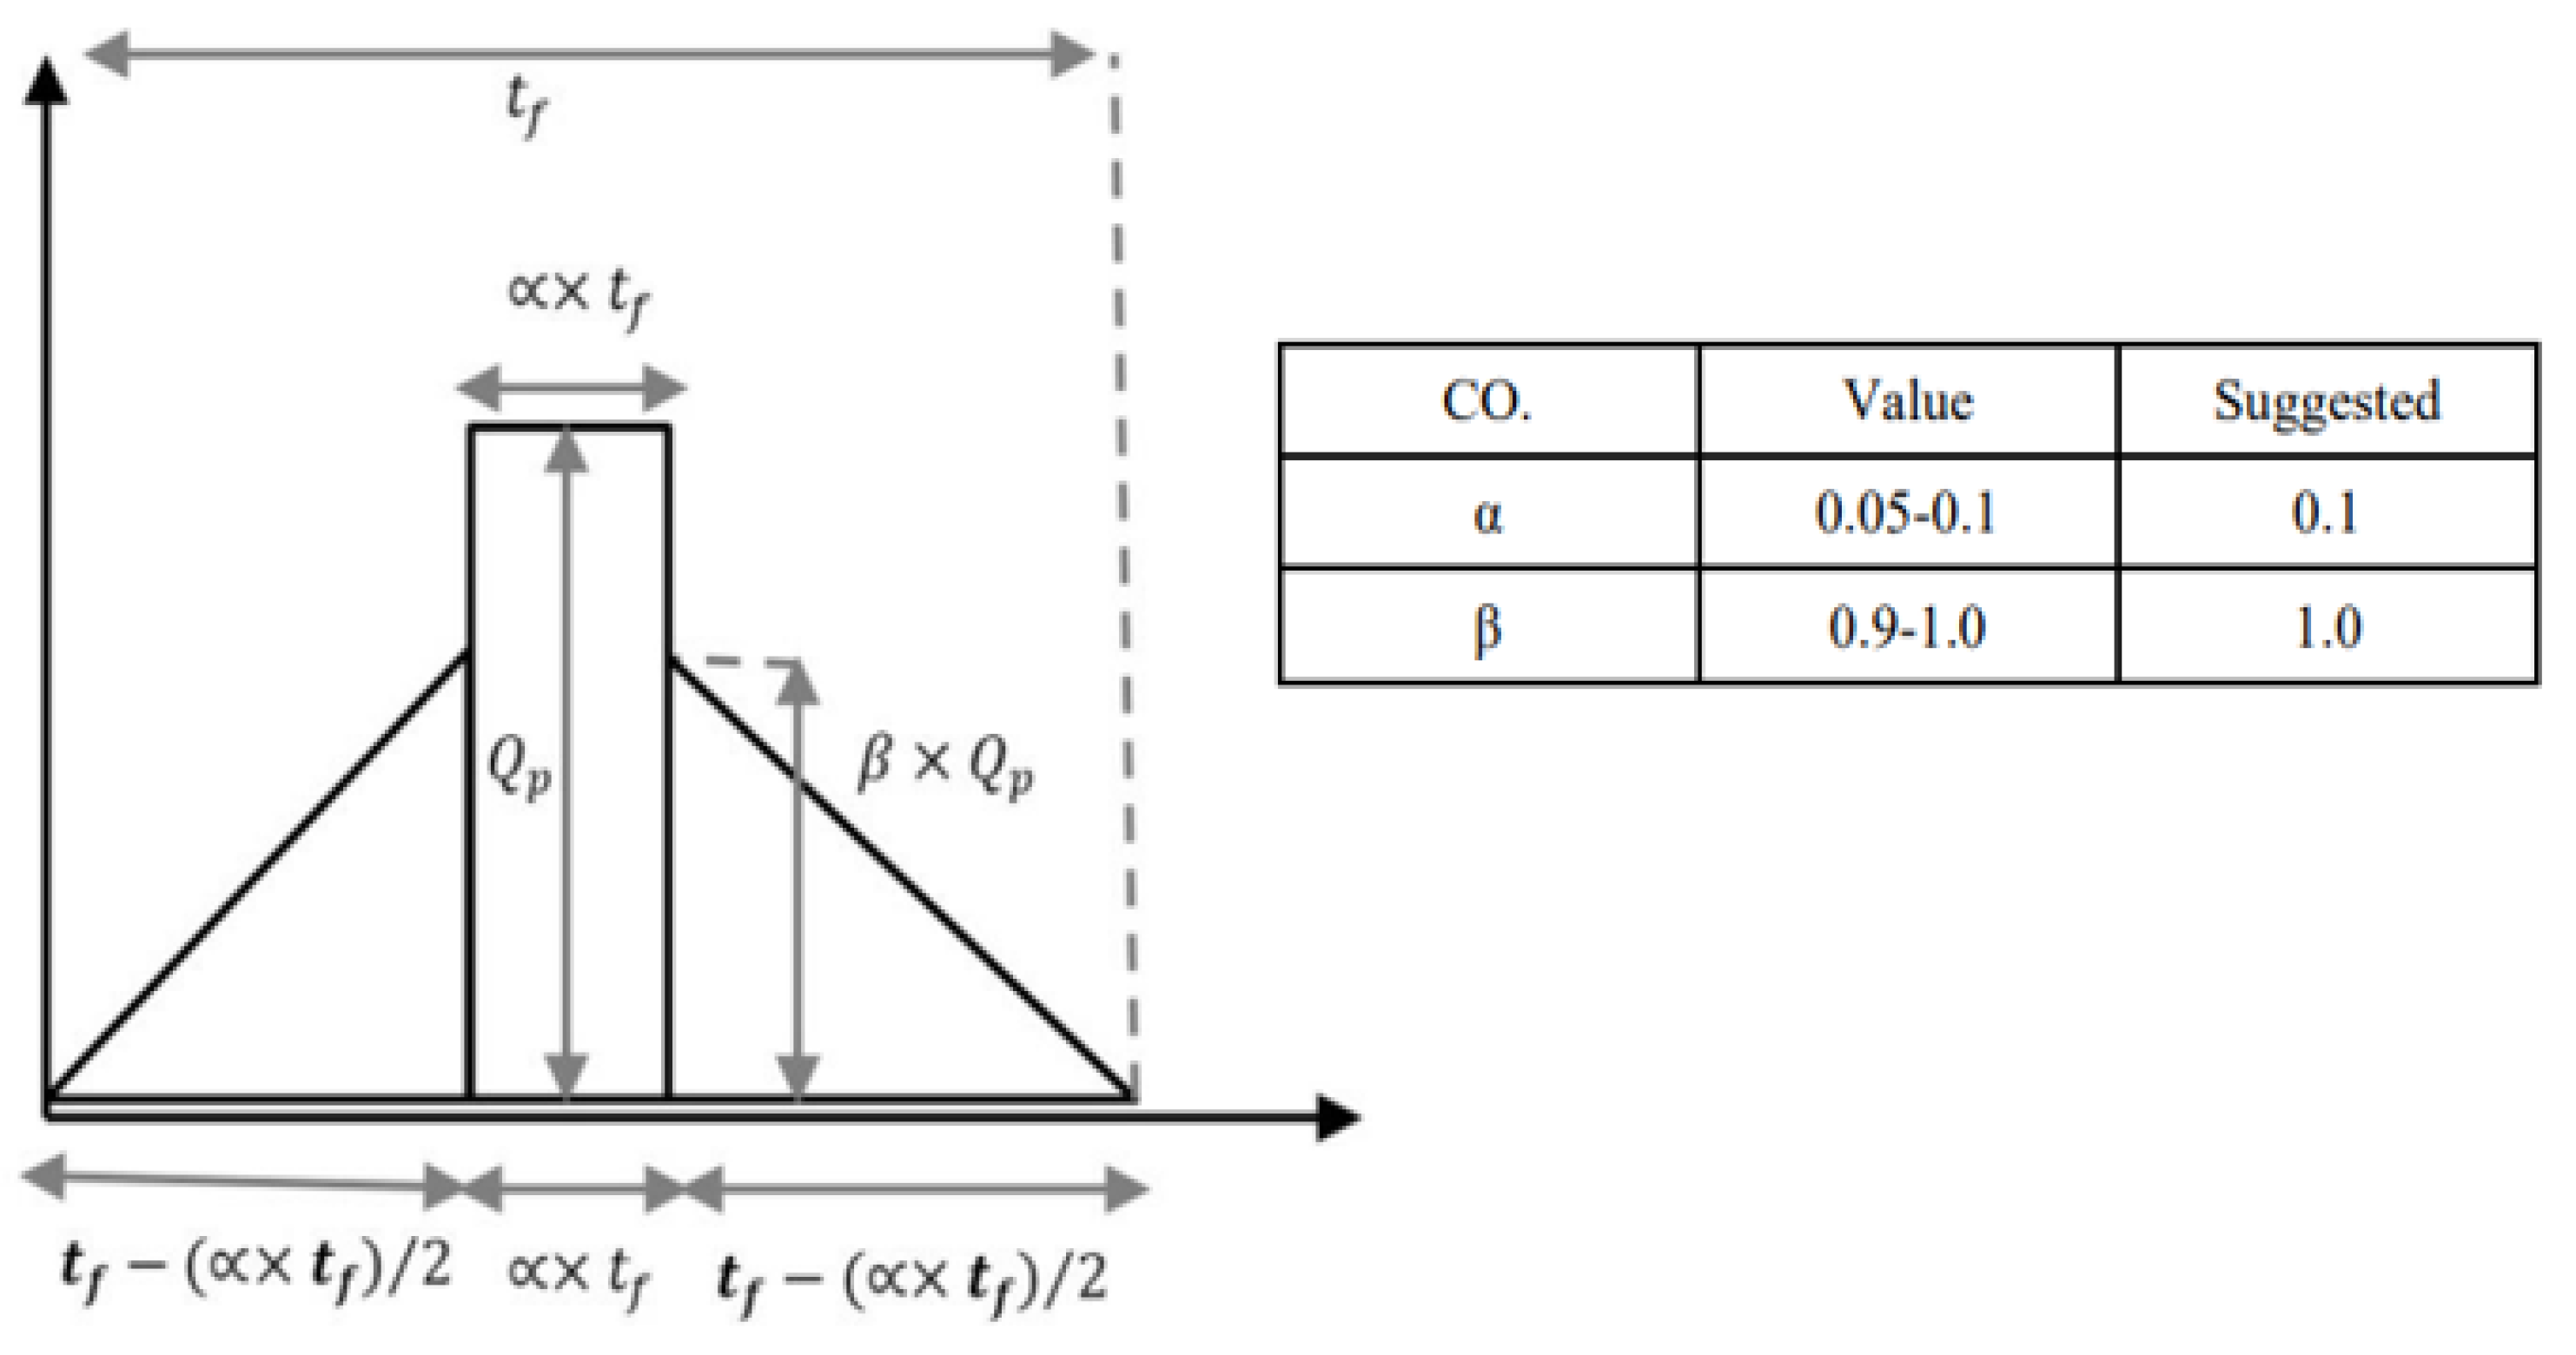
Sixteen dam breaks observed downstream peaks were tested against the hydrograph method suggested by Zenz, G. (2015) [20] for estimation of the breach downstream peak considering reservoir volume and time of the breach to validate the model results.
Q p = 2 V w t f ( 2 α + β α β )
  • Where,
  • Height of rectangle = Q p
  • Height of triangular shape = β × Q p
  • Width of rectangular shape = α × t f
  • Width of triangular shape = t f × t f / 2
Figure 6. Hydrograph method, Zenz, G. (2015) [20] .
Preprints 89378 g006
Table 2. Sixteen dam break cases with observed and estimated peak using hydrograph method [32,33].
Name Height (m) Reservoir volume (Million m3) Duration of failure (h) Observed peak (m3/s) Estimated peak (m3/s)
Teton Dam (1976) 94 356 4 46817 44949
Baldwin Hills Dam (1963) 70.7 1.1 4.5 141 123
Euclides Da Cunha Dam (1977) 53.07 13.56 7.25 1004 945
Mammoth Dam (1943) 21.3 13.56 3 2521 2283
Hatchtown Dam (1914) 19.8 14.8 4 1973 1869
Whitewater Brook Upper Dam (1972) 18.8 0.51 3 70 86
Horse Creek Earth Dam (1914) 16.7 20.96 3 3885 3529
Puddingstone Dam (1926) 15.24 0.61 3 283 103
Wheatland Reservoir No. 1 Dam (1969) 13.7 11.55 1.5 4285 3889
Lake Latonka Dam (1966) 13.1 1.58 3 294 266
Frenchman Dam (1952) 12.1 8.6 3 1603 1448
Frankfurt Dam (1975) 9.75 0.35 2.5 79 71
Elk City Dam (1963) 9.14 0.9 0.83 607 545
Kelly Barnes Lake Dam (1977) 7.92 1.62 1.5 549 545
Hemet Dam (1927) 6.1 28.22 3 1602 4751
Goose Creek Dam (1916) 6.1 68.79 3 3880 11581
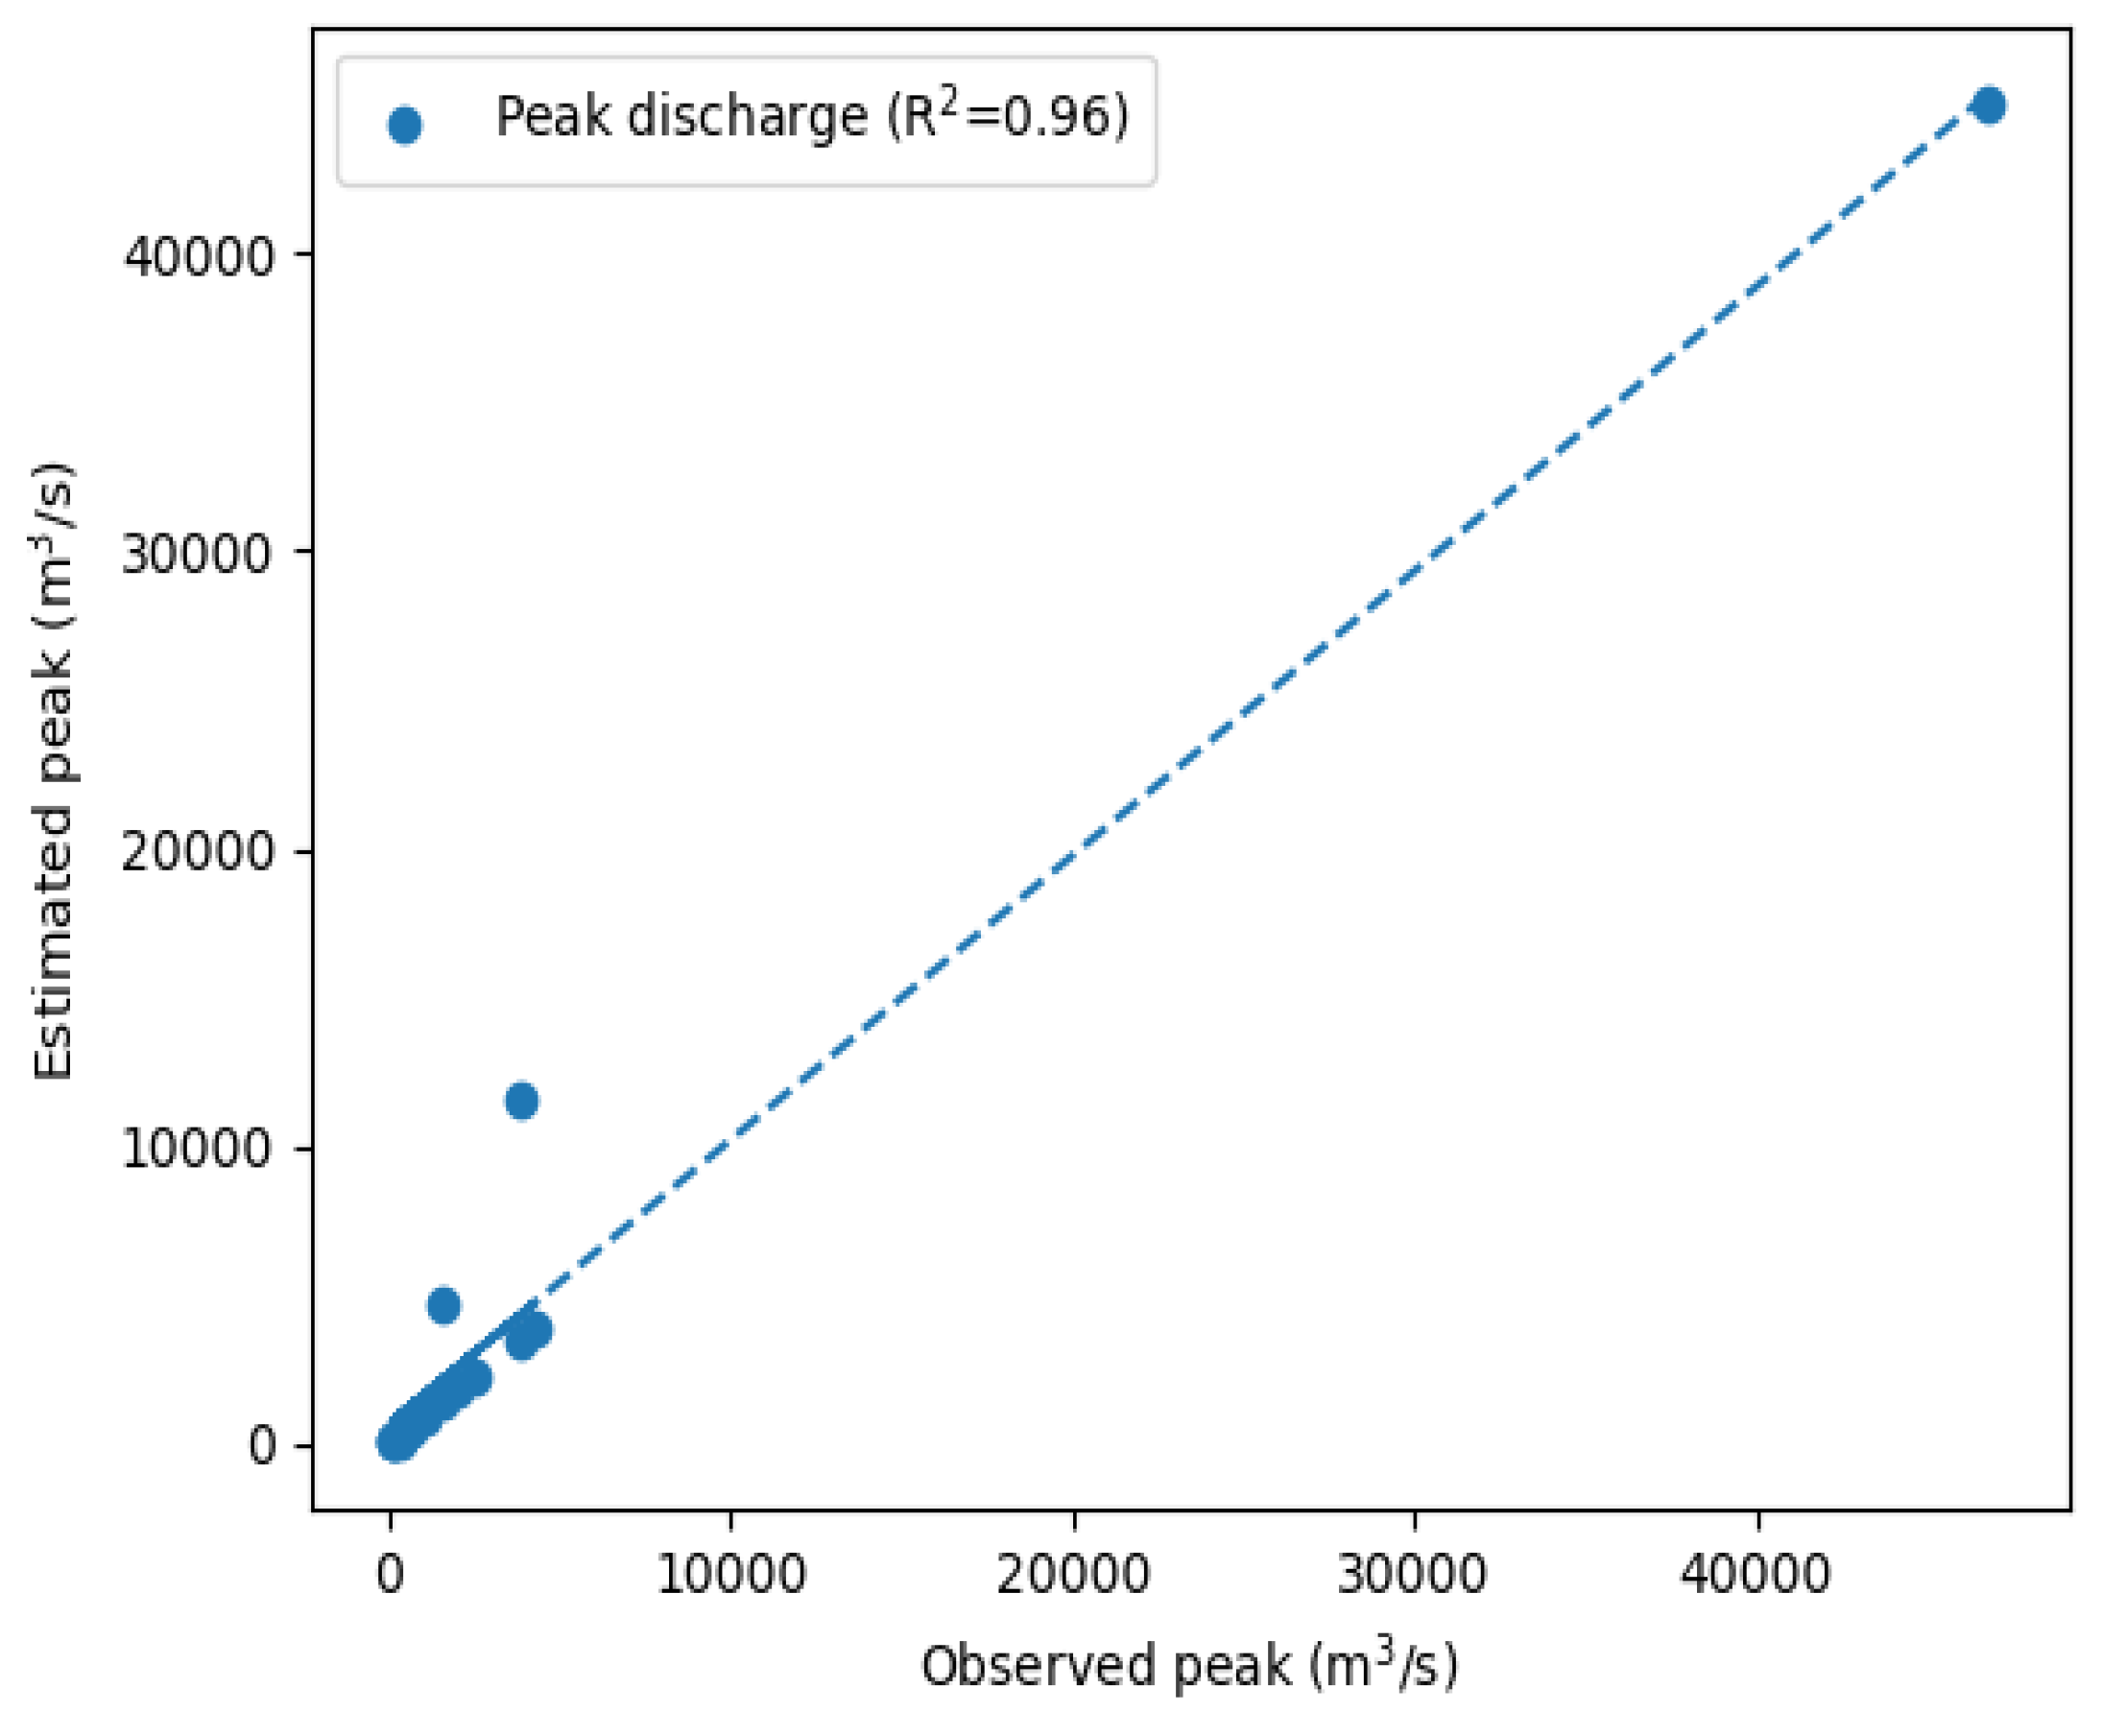
Figure 7. Regression plot between observed and estimated peak values.
Preprints 89378 g007
The regression model shows a good correlation (R2 =0.96) between observed and estimated values from the hydrograph method. The empirical relation was used to evaluate and compare the simulated results considering 2.51h of breach time with 85.285 million m 3 volume.
Table 3. Simulated and estimated peak values downstream of the dam at Section-0, Figure 12.
Simulated peak ( m 3 /s) Estimated peak ( m 3 /s)
17594 17160
The model produces more or less similar peak flow with an error of 2.5%, which is negligible for the flood event of 17594 m 3 /s.

2.3. Data acquisition

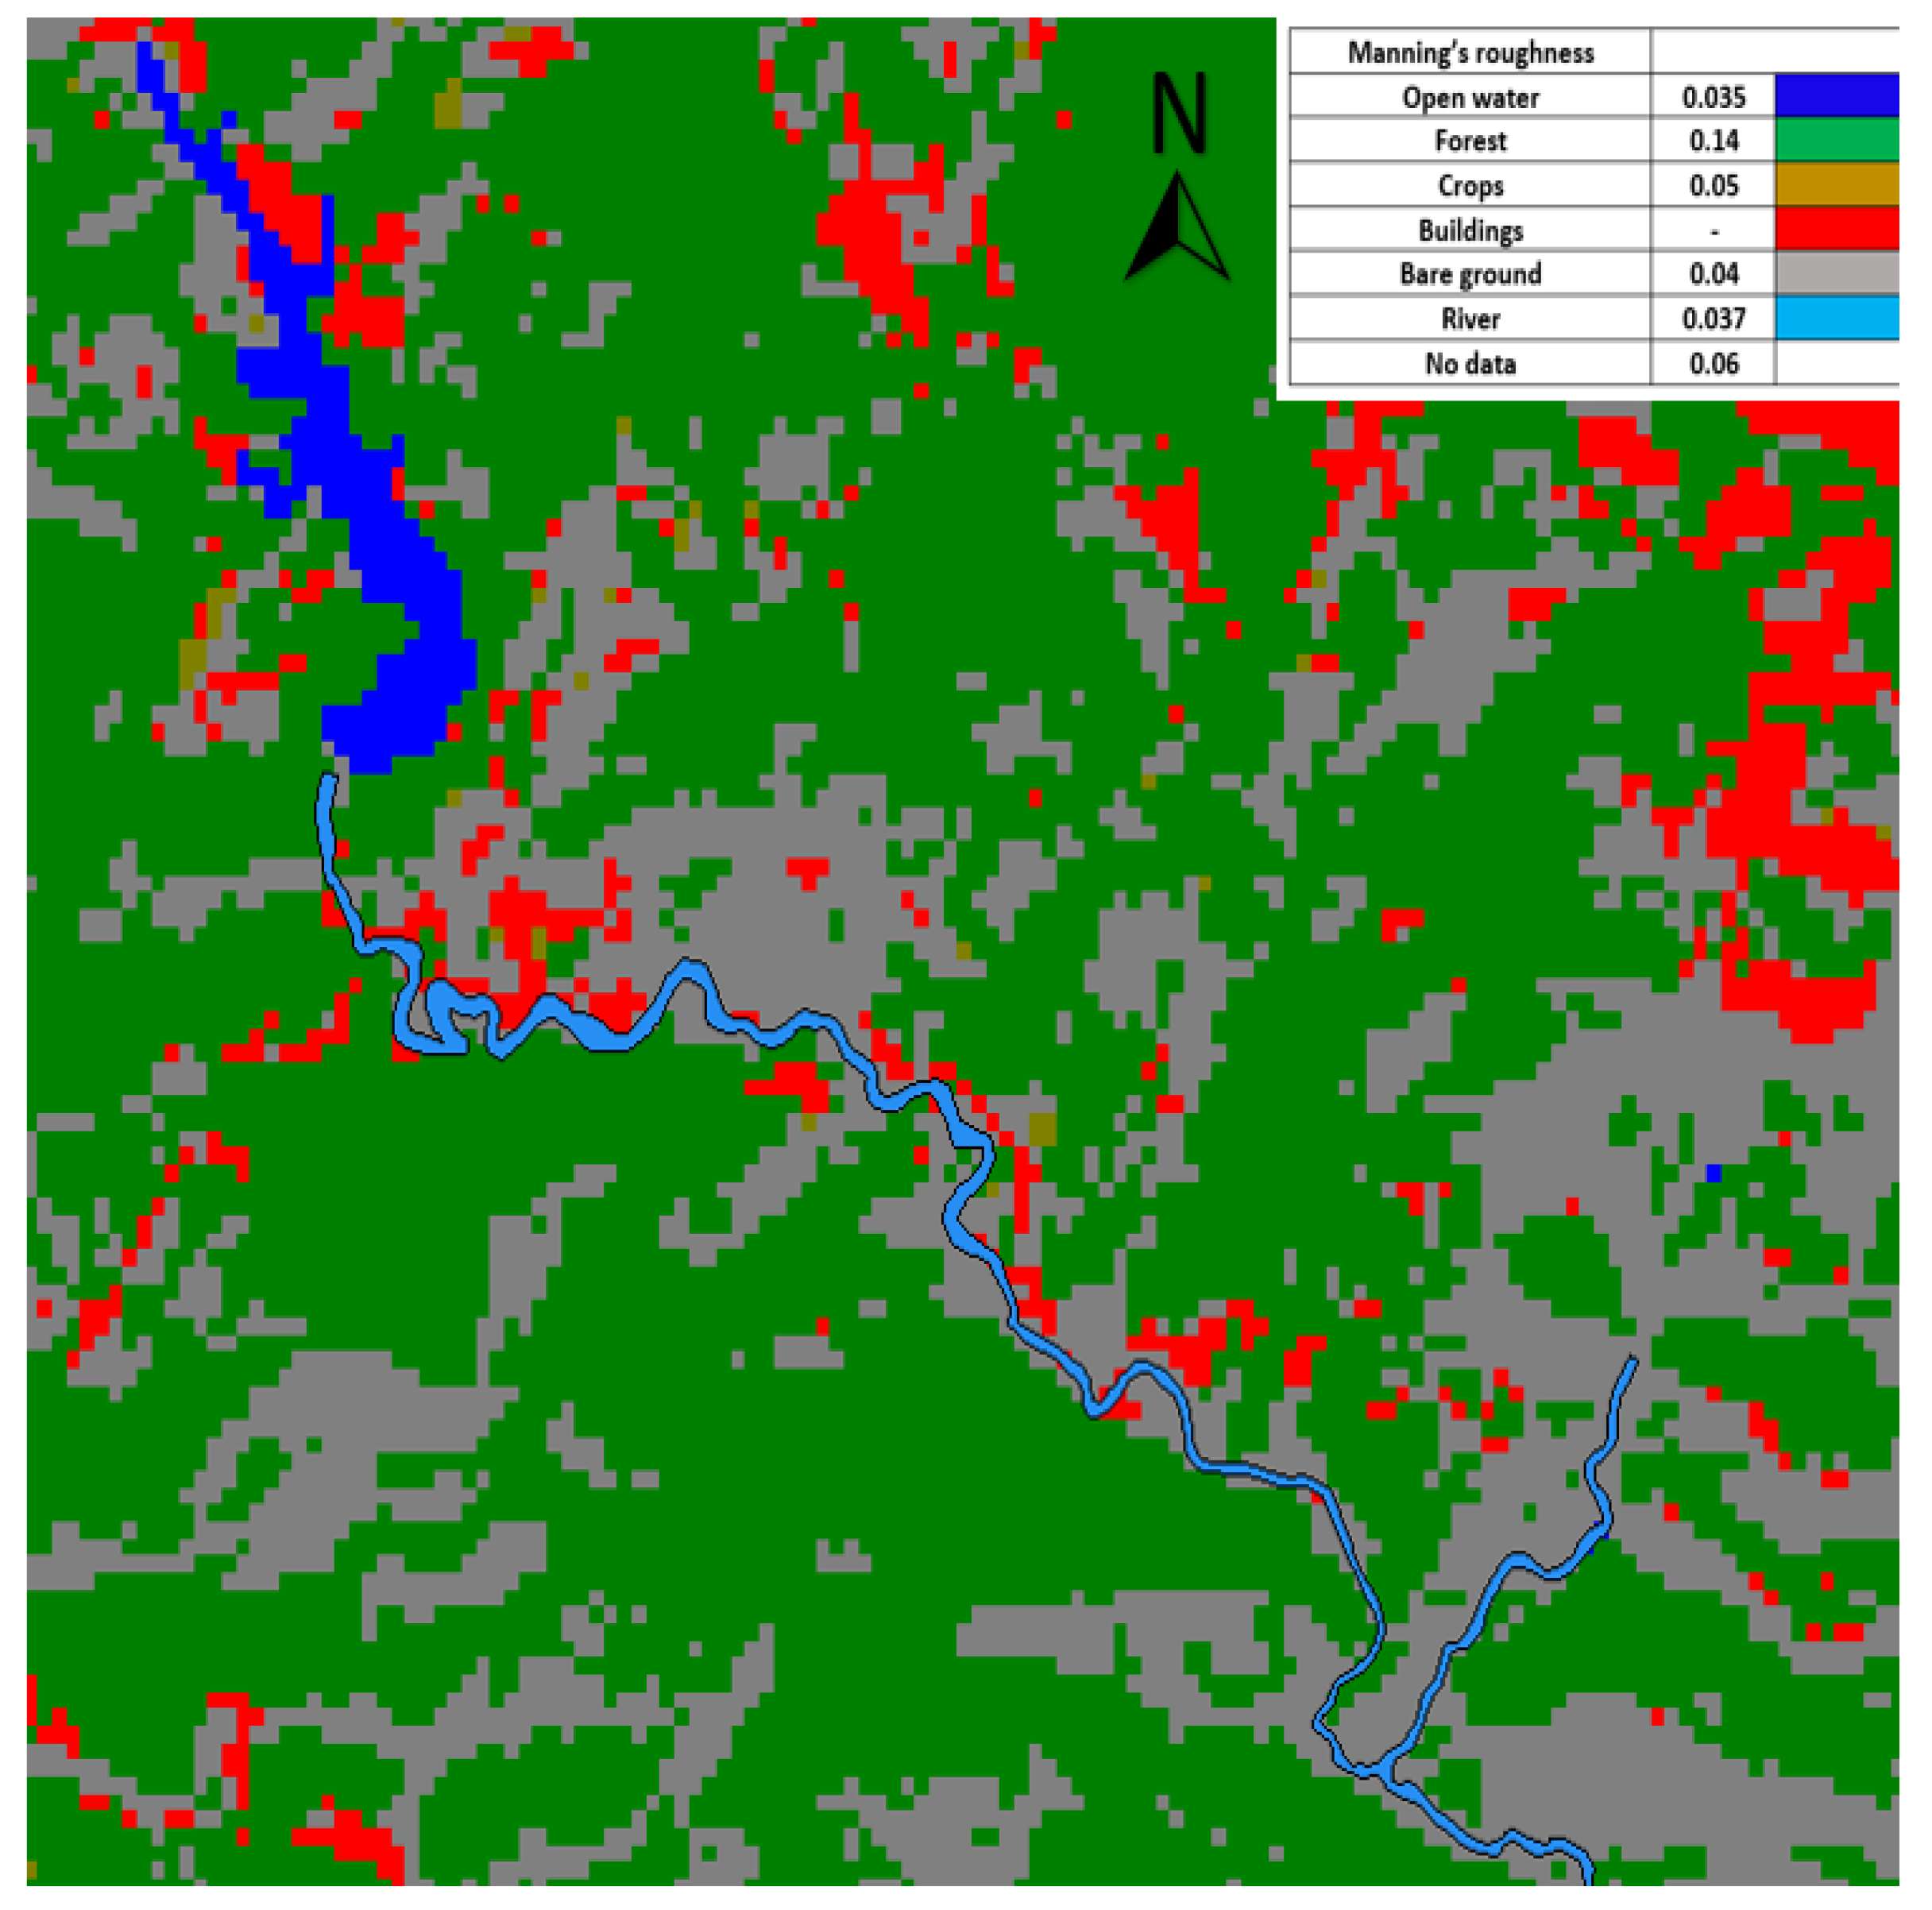
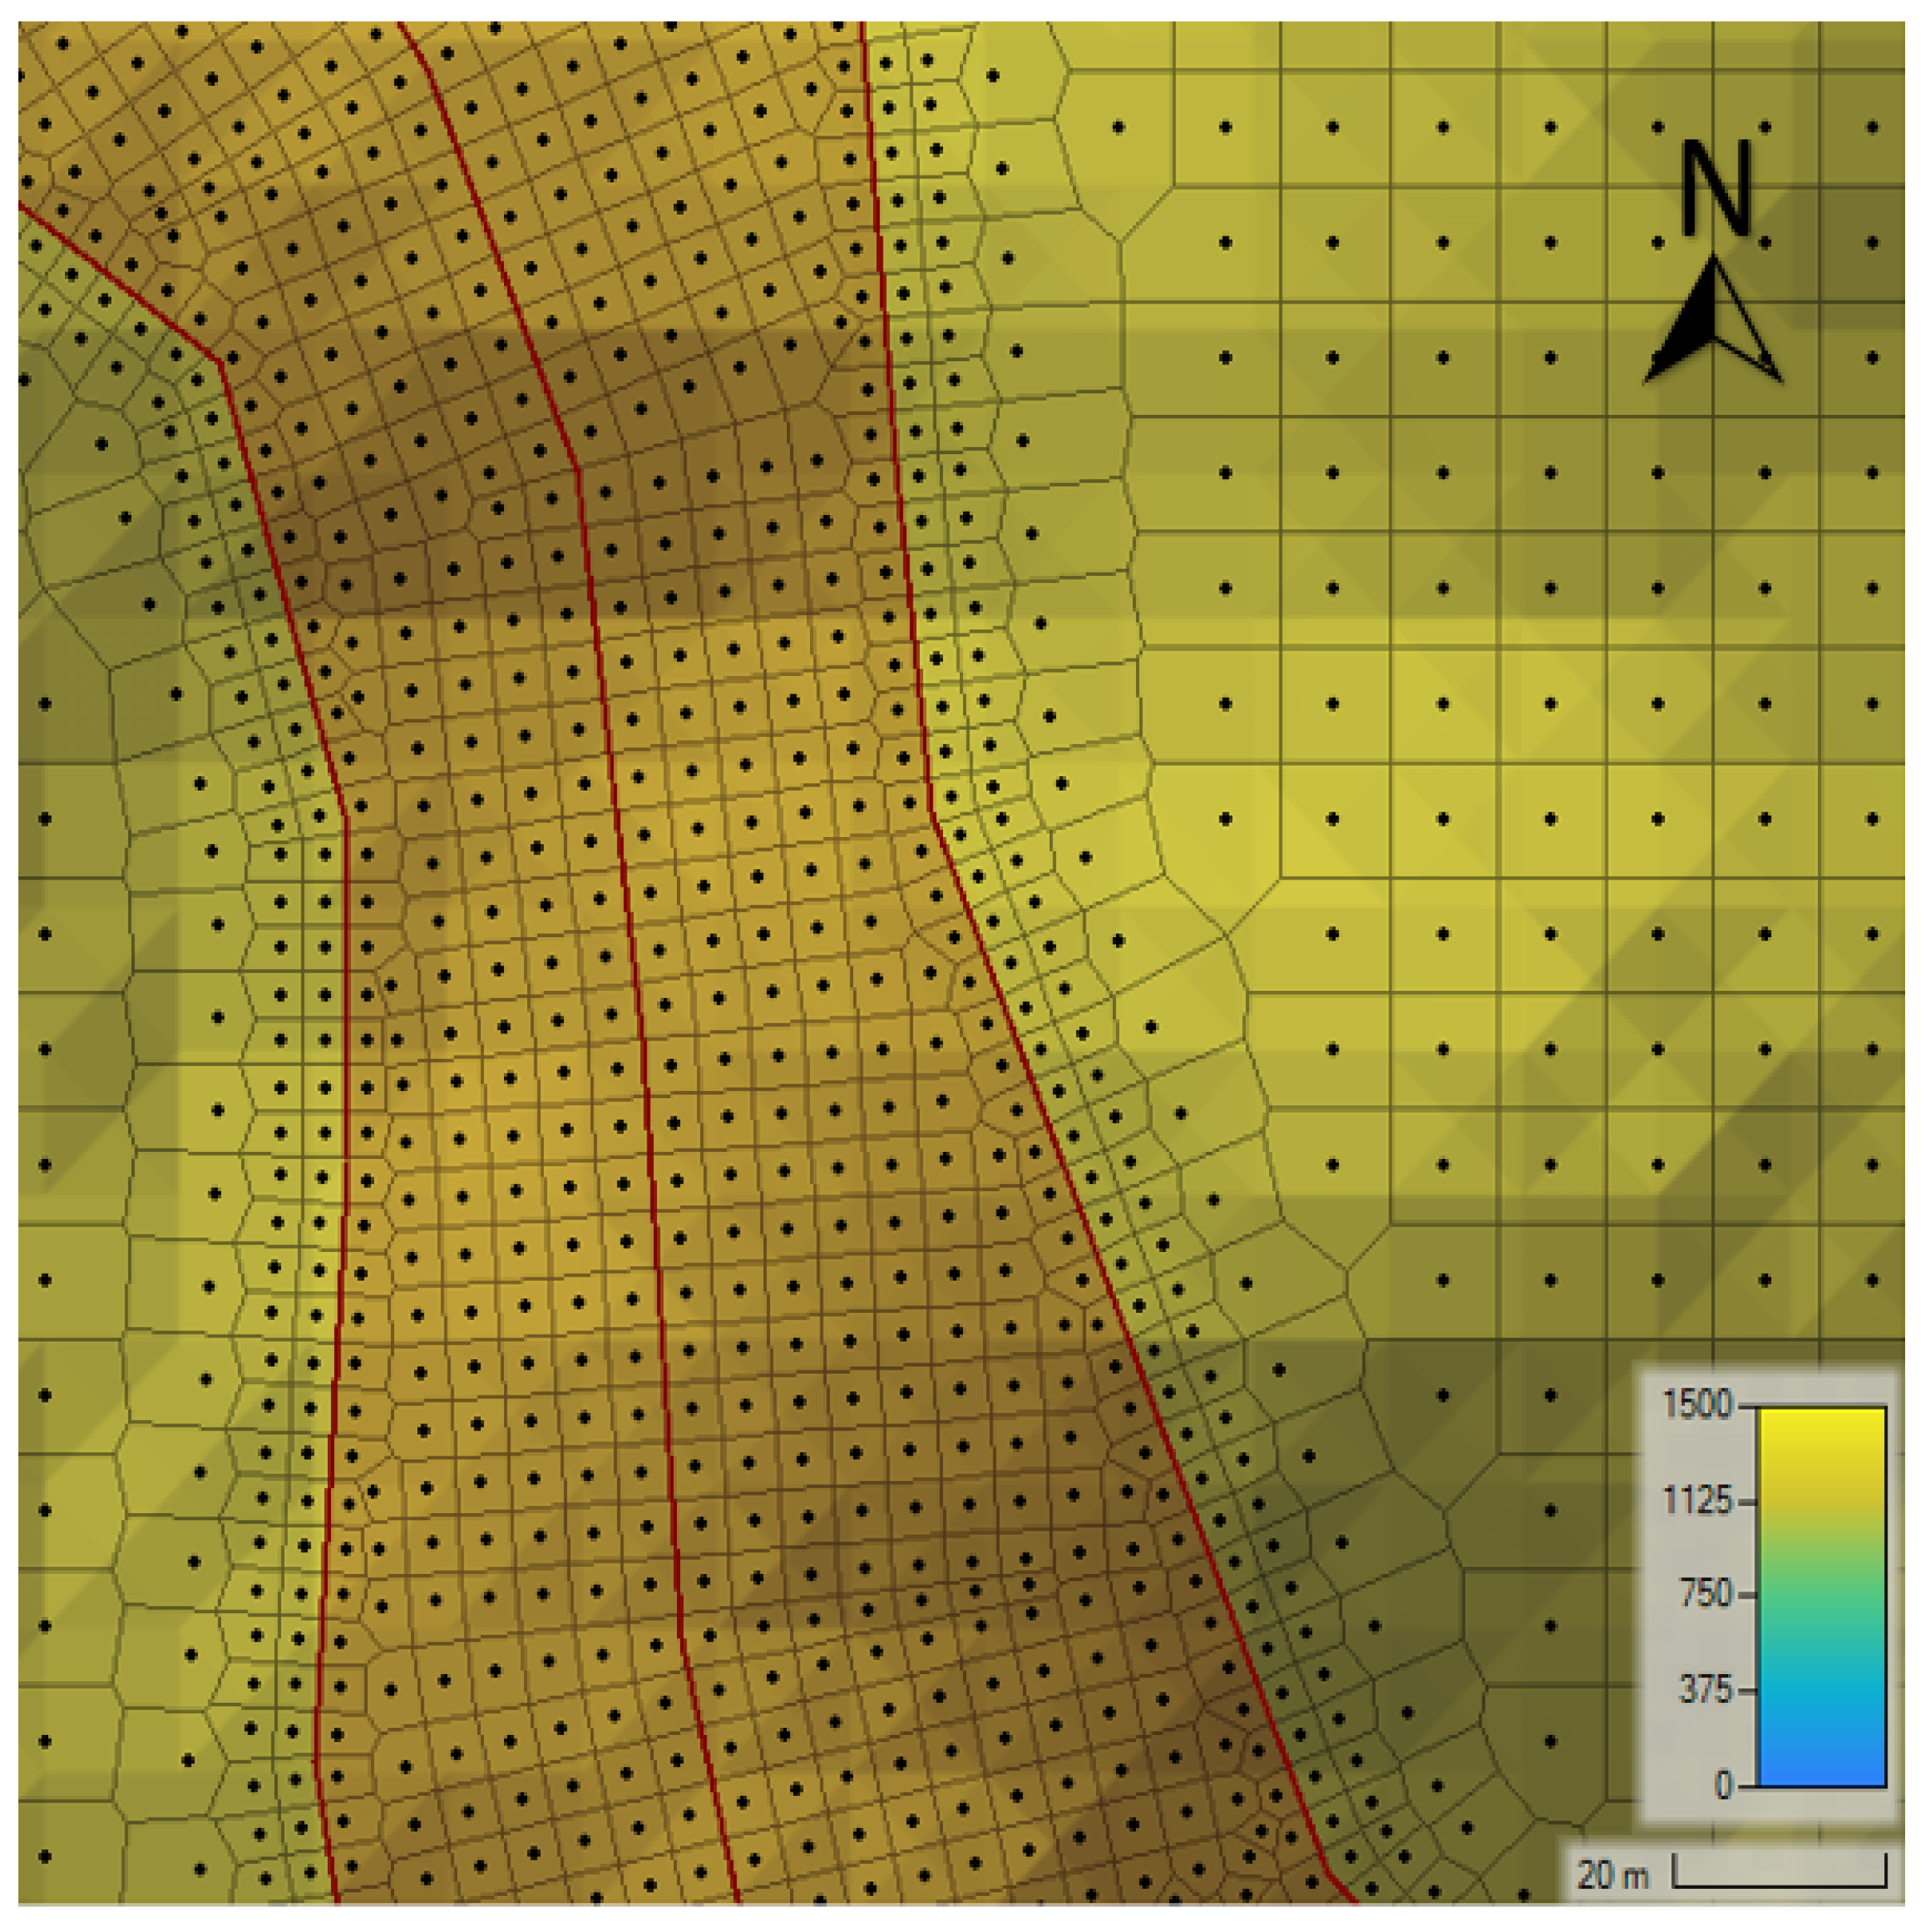
Alaska Satellite Facility (ASF) [34], an available 12.5m resolution data set of Digital Elevation Model (DEM) was considered for defining the terrain up to the confluence of Bagmati River, 16km downstream from the dam site. In order to accurately capture the hydrodynamic behavior in the river channel, the central line and banks were assigned to refine and construct an aligned mesh along the direction of flow using HECRAS. The refining of mesh helps to precisely evaluate the hydraulic parameters like velocity gradient and water surface elevation. Esri Land Cover [35] map was used to define varying Manning’s roughness. The expected river channel flow was drawn to represent the channel roughness precisely due to the poor resolution of the land cover map. The roughness values were assigned based on the Ven Te Chow,1959 [36].
Table 4. Model defined Manning’s roughness
Manning’s roughness
Open water 0.035
Forest 0.14
Crops 0.05
Bare ground 0.04
River 0.037
No data 0.06
Figure 8. Roughness mapping
Preprints 89378 g008
Figure 9. Model mesh
Preprints 89378 g009

2.4. Governing equations

HECRAS implements a hyperbolic partial differential equation of the Shallow Water Equation, derived from the depth average integration of the Navier-Stokes equation assuming the horizontal length scale larger than the vertical length scale [37]. The shallow Water Equation assumes a vertical pressure gradient nearly hydrostatic, with a vertical velocity much smaller than the horizontal velocity [37]. HECRAS uses the Finite Volume Method to solve the Shallow Water Equations by discretizing the computational domain to the grid cells and integrating the conservation equations with different implicit and explicit time integration schemes [31]. The Shallow Water Equation is widely used for solving rapidly varying unsteady flow in open channels problems such as dam break scenarios, change in channel geometry with contraction and expansion, and steep mountain terrain meandering rivers[38].

2.4.1. Mass Conservation Equation

The continuity equation is based on the principle of conservation of mass, which defines the mass of flow into a defined control volume equal to the mass of outflow without an additional external source/sink [31].
H t + ( h u ) x + ( h v ) y + q = 0
  • Where,
  • H = Water surface elevation
  • u and v = Velocity in x direction and y direction
  • q = Flow domain source/sink
  • x and y = Spatial coordinate
  • t = Time

2.4.2. Full Dynamic Momentum Equation

The Full Dynamic Momentum Equation is based on the principle of conservation of momentum, which accounts for the forces acting on the fluid including pressure, gravity, friction, and external force to estimate the flow velocity and water surface elevation at a particular domain[31].
u t + u u x + v u y f c v = g z s x + 1 h x v t , x x h u x + 1 h y v t , y y h u y τ b , x ρ R + τ s , x ρ h 1 ρ p a x
v t + u v x + v v y + f c u = g z s y + 1 h x v t , x x h v x + 1 h y v t , y y h v y τ b , y ρ R + τ s , y ρ h 1 ρ p a y
  • where,
  • v t represents the local acceleration term
  • u v x + v v y represents convective acceleration term
  • f c u represents coriolis effects term , f c = 2 ω sin ( ϕ ) , ϕ = 27 . 5 o for Kulekhani River
  • g z s y represents hydrostatic pressure term
  • 1 h x v t , x x h v x + 1 h y v t , y y h v y represents conservative turbulence viscosity term
  • τ b , y ρ R represents bed shear stress term
  • τ s , y ρ h represents surface wind stress term
  • 1 ρ p a y represents the atmospheric pressure term

2.4.3. Diffusion Wave Equation

The Diffusion Wave Equation neglects the local acceleration, convective acceleration, turbulence viscosity, and Coriolis effects terms. Complex physical flow behavior such as sudden changes in channel geometry defining expansion and contraction losses, meandering effects defining bend losses, and re-circulation defining eddies losses are not captured with the simplified momentum equation, resulting in false flow velocity and water depth[31].
c f u = g z s x 1 ρ p a x + τ s , x ρ h
c f v = g z s y 1 ρ p a y + τ s , y ρ h
  • Where,
  • c f v represents the bed friction term
  • g z s y represents hydrostatic pressure term
  • 1 ρ p a y represents the atmospheric pressure term
  • τ s , y ρ h represents surface wind stress term

2.4.4. Mesh sensitivity analysis

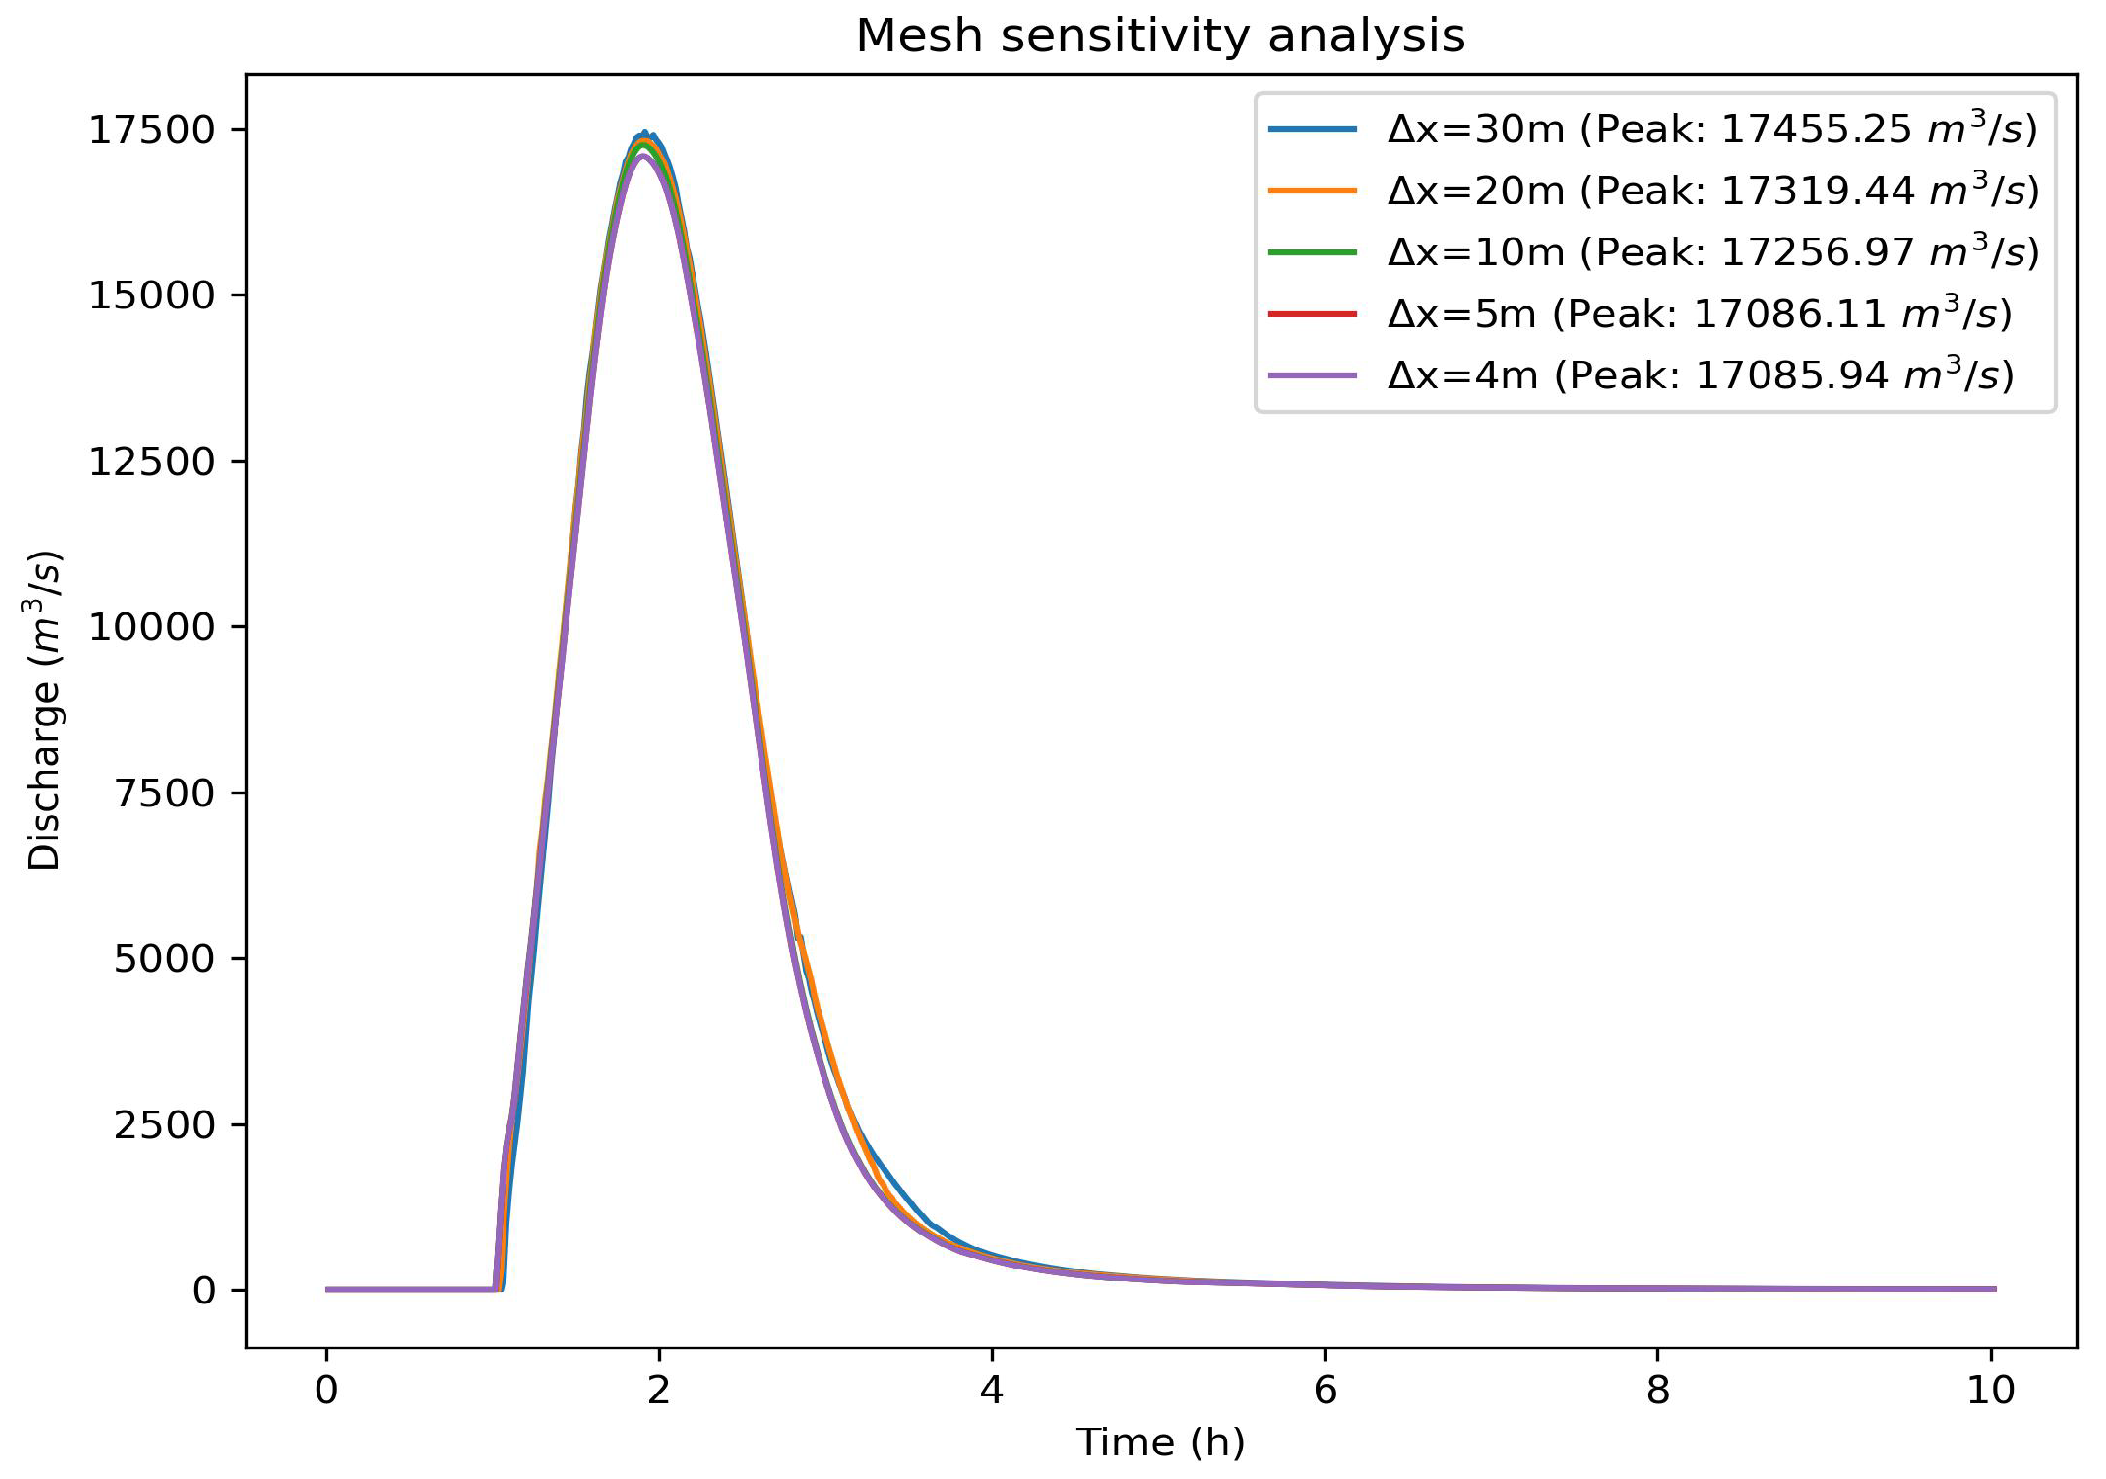
The mesh sensitivity analysis was carried out considering fixed time steps of Δ t = 0.2 s with varying spatial steps of Δ x = 30 m , Δ x = 20 m , Δ x = 10 m , Δ x = 5 m , and Δ x = 4 m to evaluated hydrograph at cross-section II. The spatial step of Δ x = 5 m was selected for the model run as the result starts to converge with the decreasing spatial steps below Δ x = 5 m .
Figure 10. Mesh sensitivity for different spatial steps ( Δ x ), considering section II Figure 12 hydrograph
Preprints 89378 g010
Δ x (m) Peak flow ( m 3 /s)
30 17455.25
20 17319.44
10 17256.97
5 17086.11
4 17085.94

2.4.5. Stability criteria

The courant criterion was satisfied using the fixed time step method to ensure the model’s stability and robustness considering Δ x = 5 m , Δ t = 0.2 s .
Courant Number ( CFL ) = Δ t · V Δ x 1
  • Where,
  • Δ t = Time step
  • Δ x = Spatial step or computational grid cell length
  • V = Flow velocity

3. Result and Discussion

3.1. Model compression

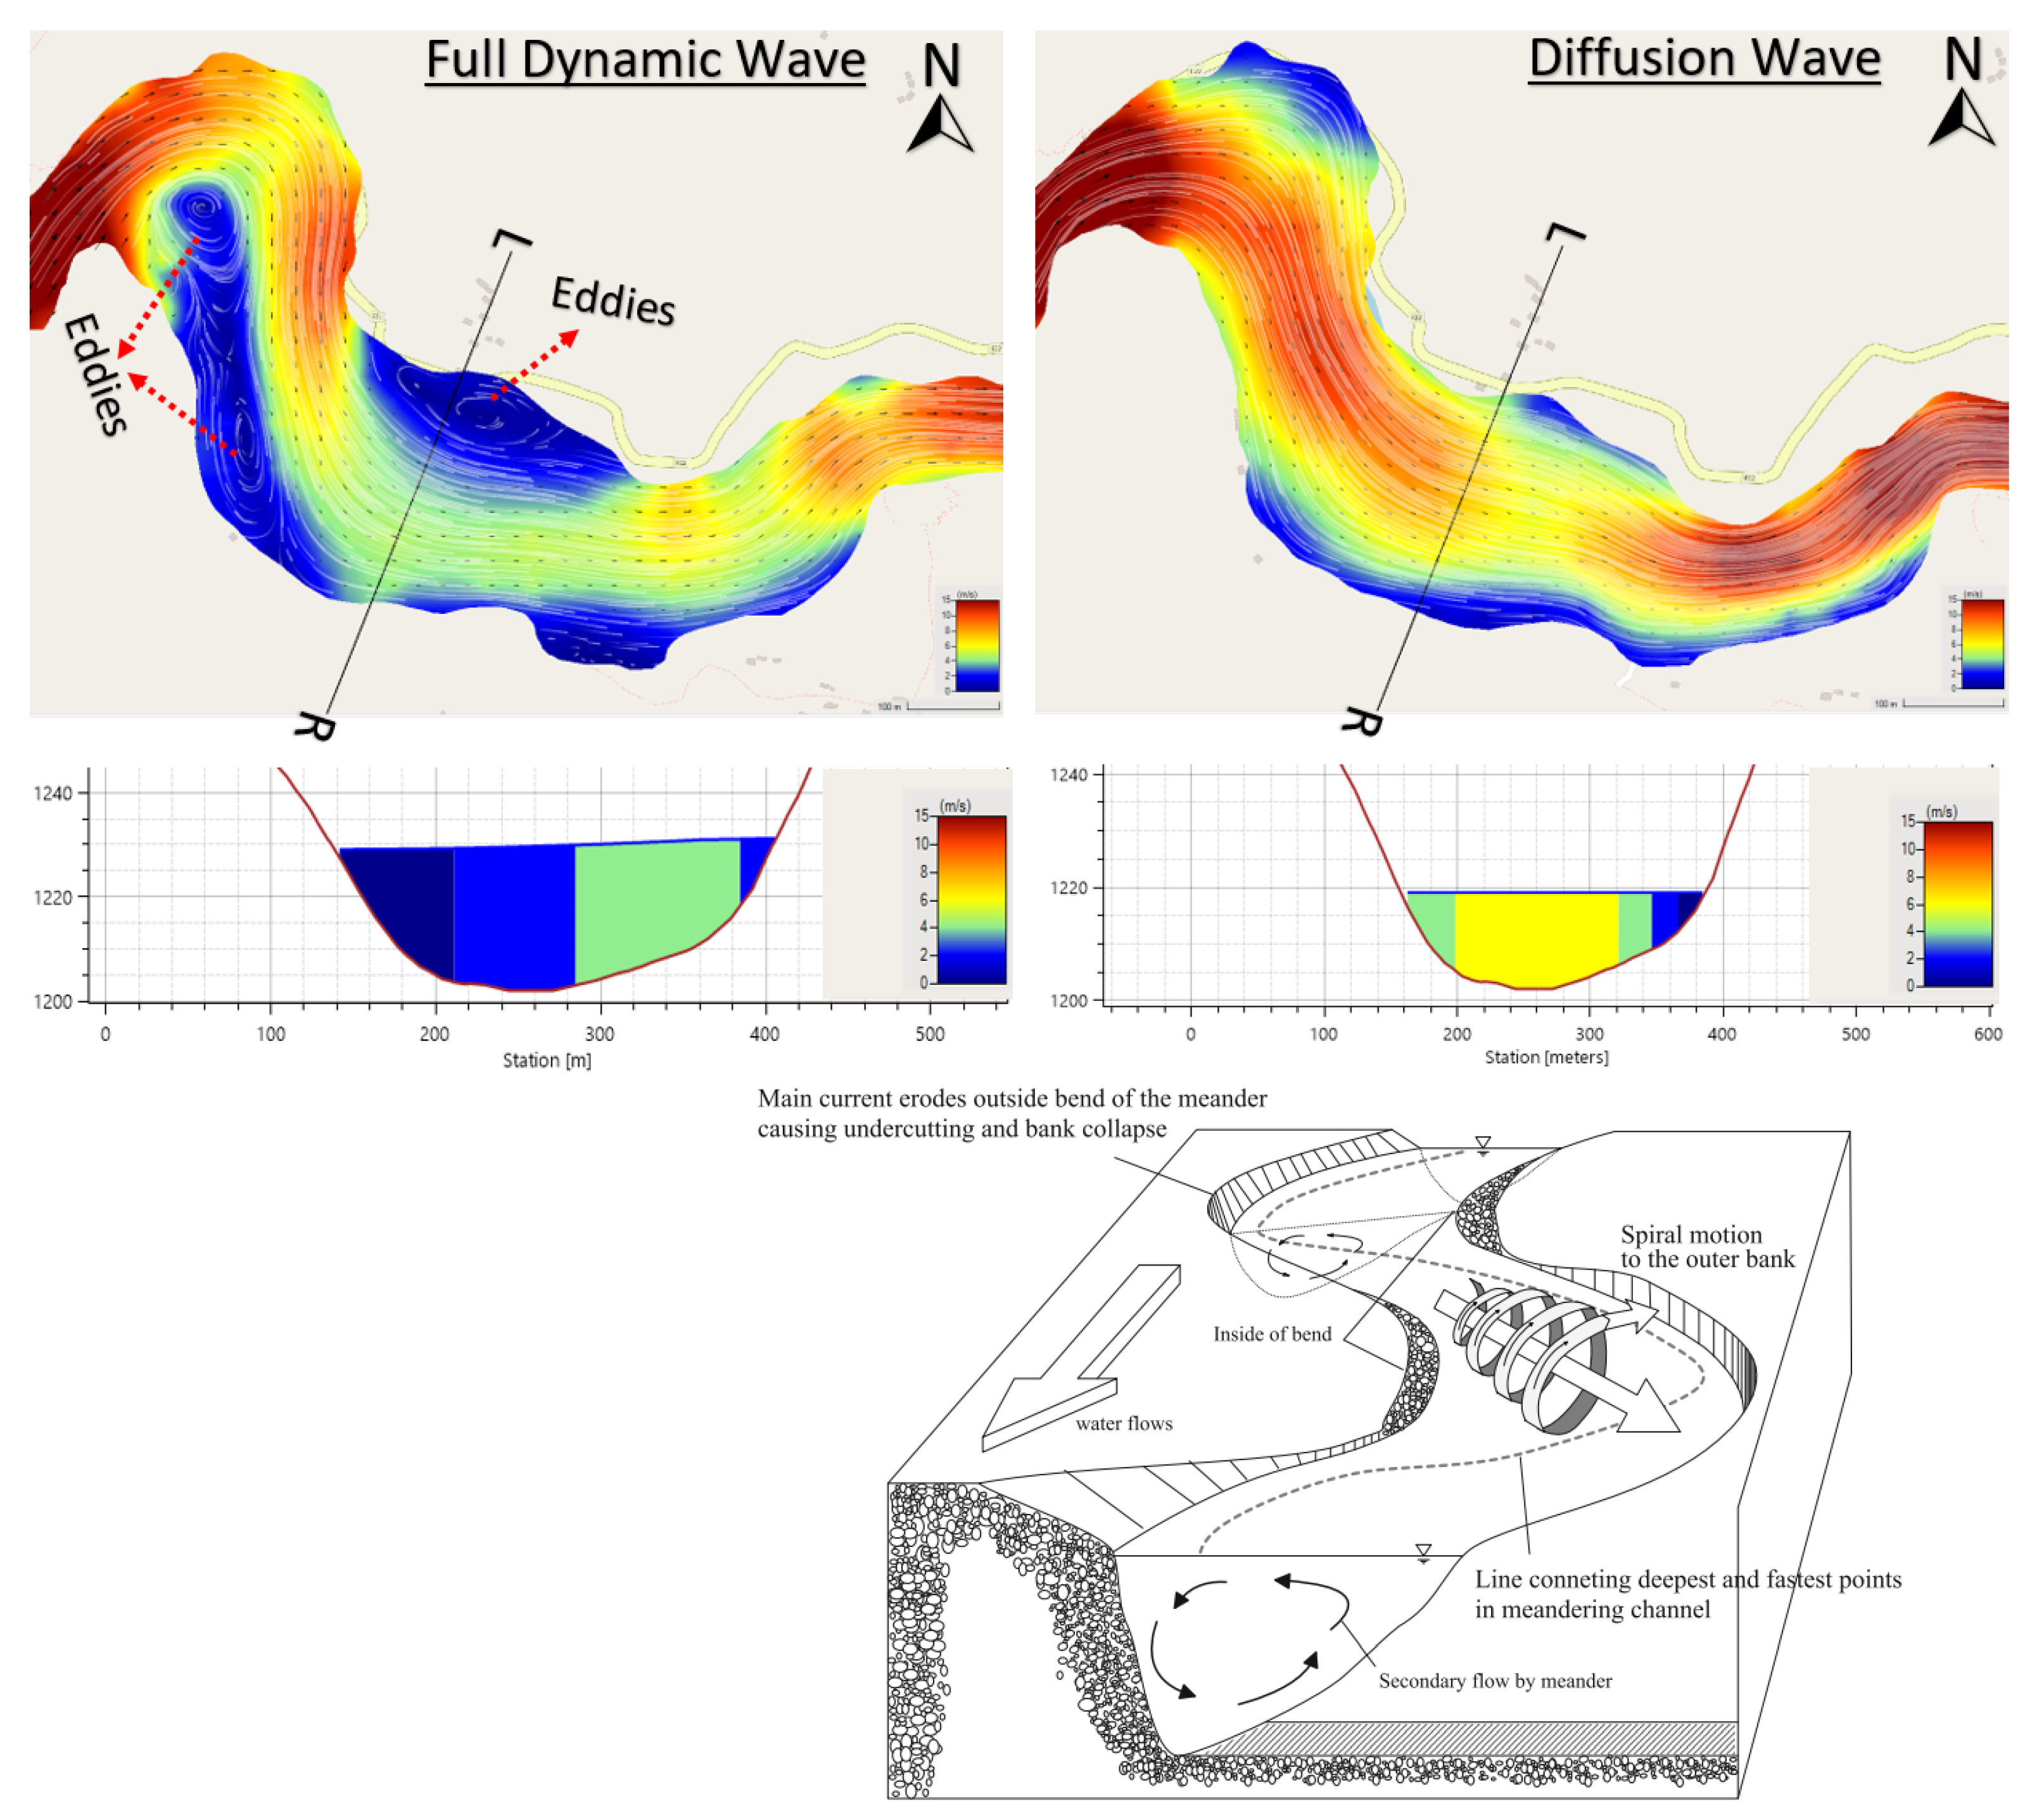
The 2D Diffusion and Full Dynamic Wave Equations were modeled to compare and contrast the results regarding water depth, flow velocity, inundation extent, and peak hydrograph.
Figure 11. Flow behavior in meandering of the river [39]
Preprints 89378 g011
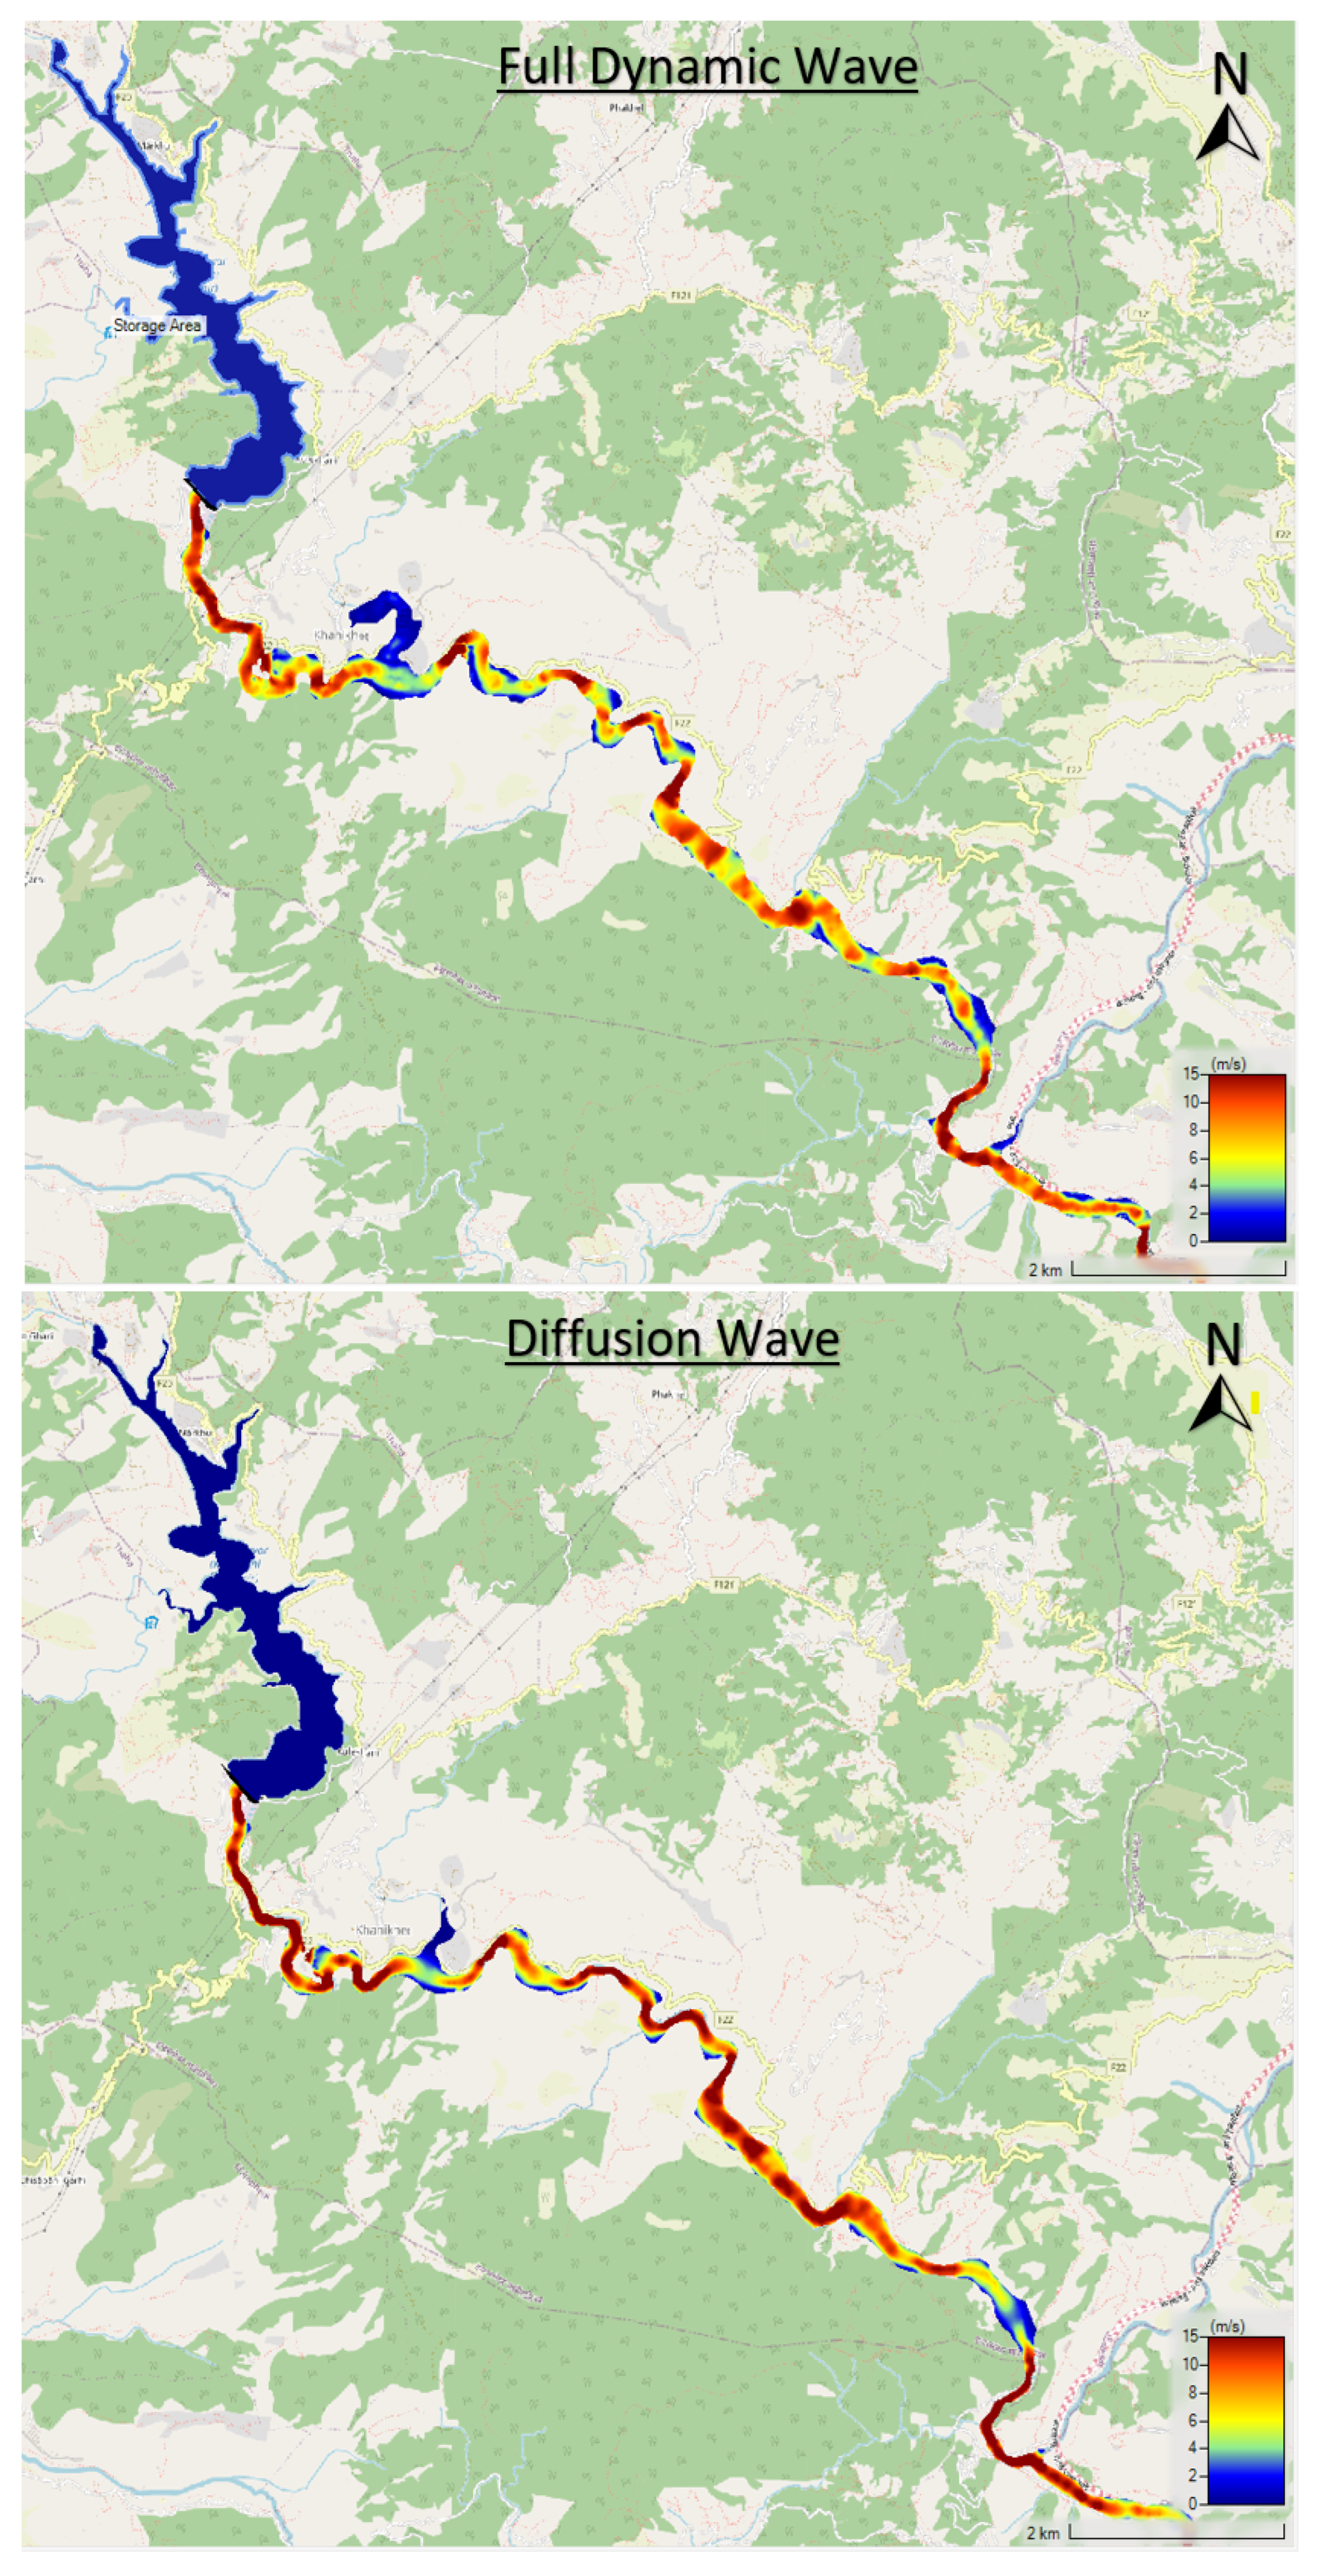
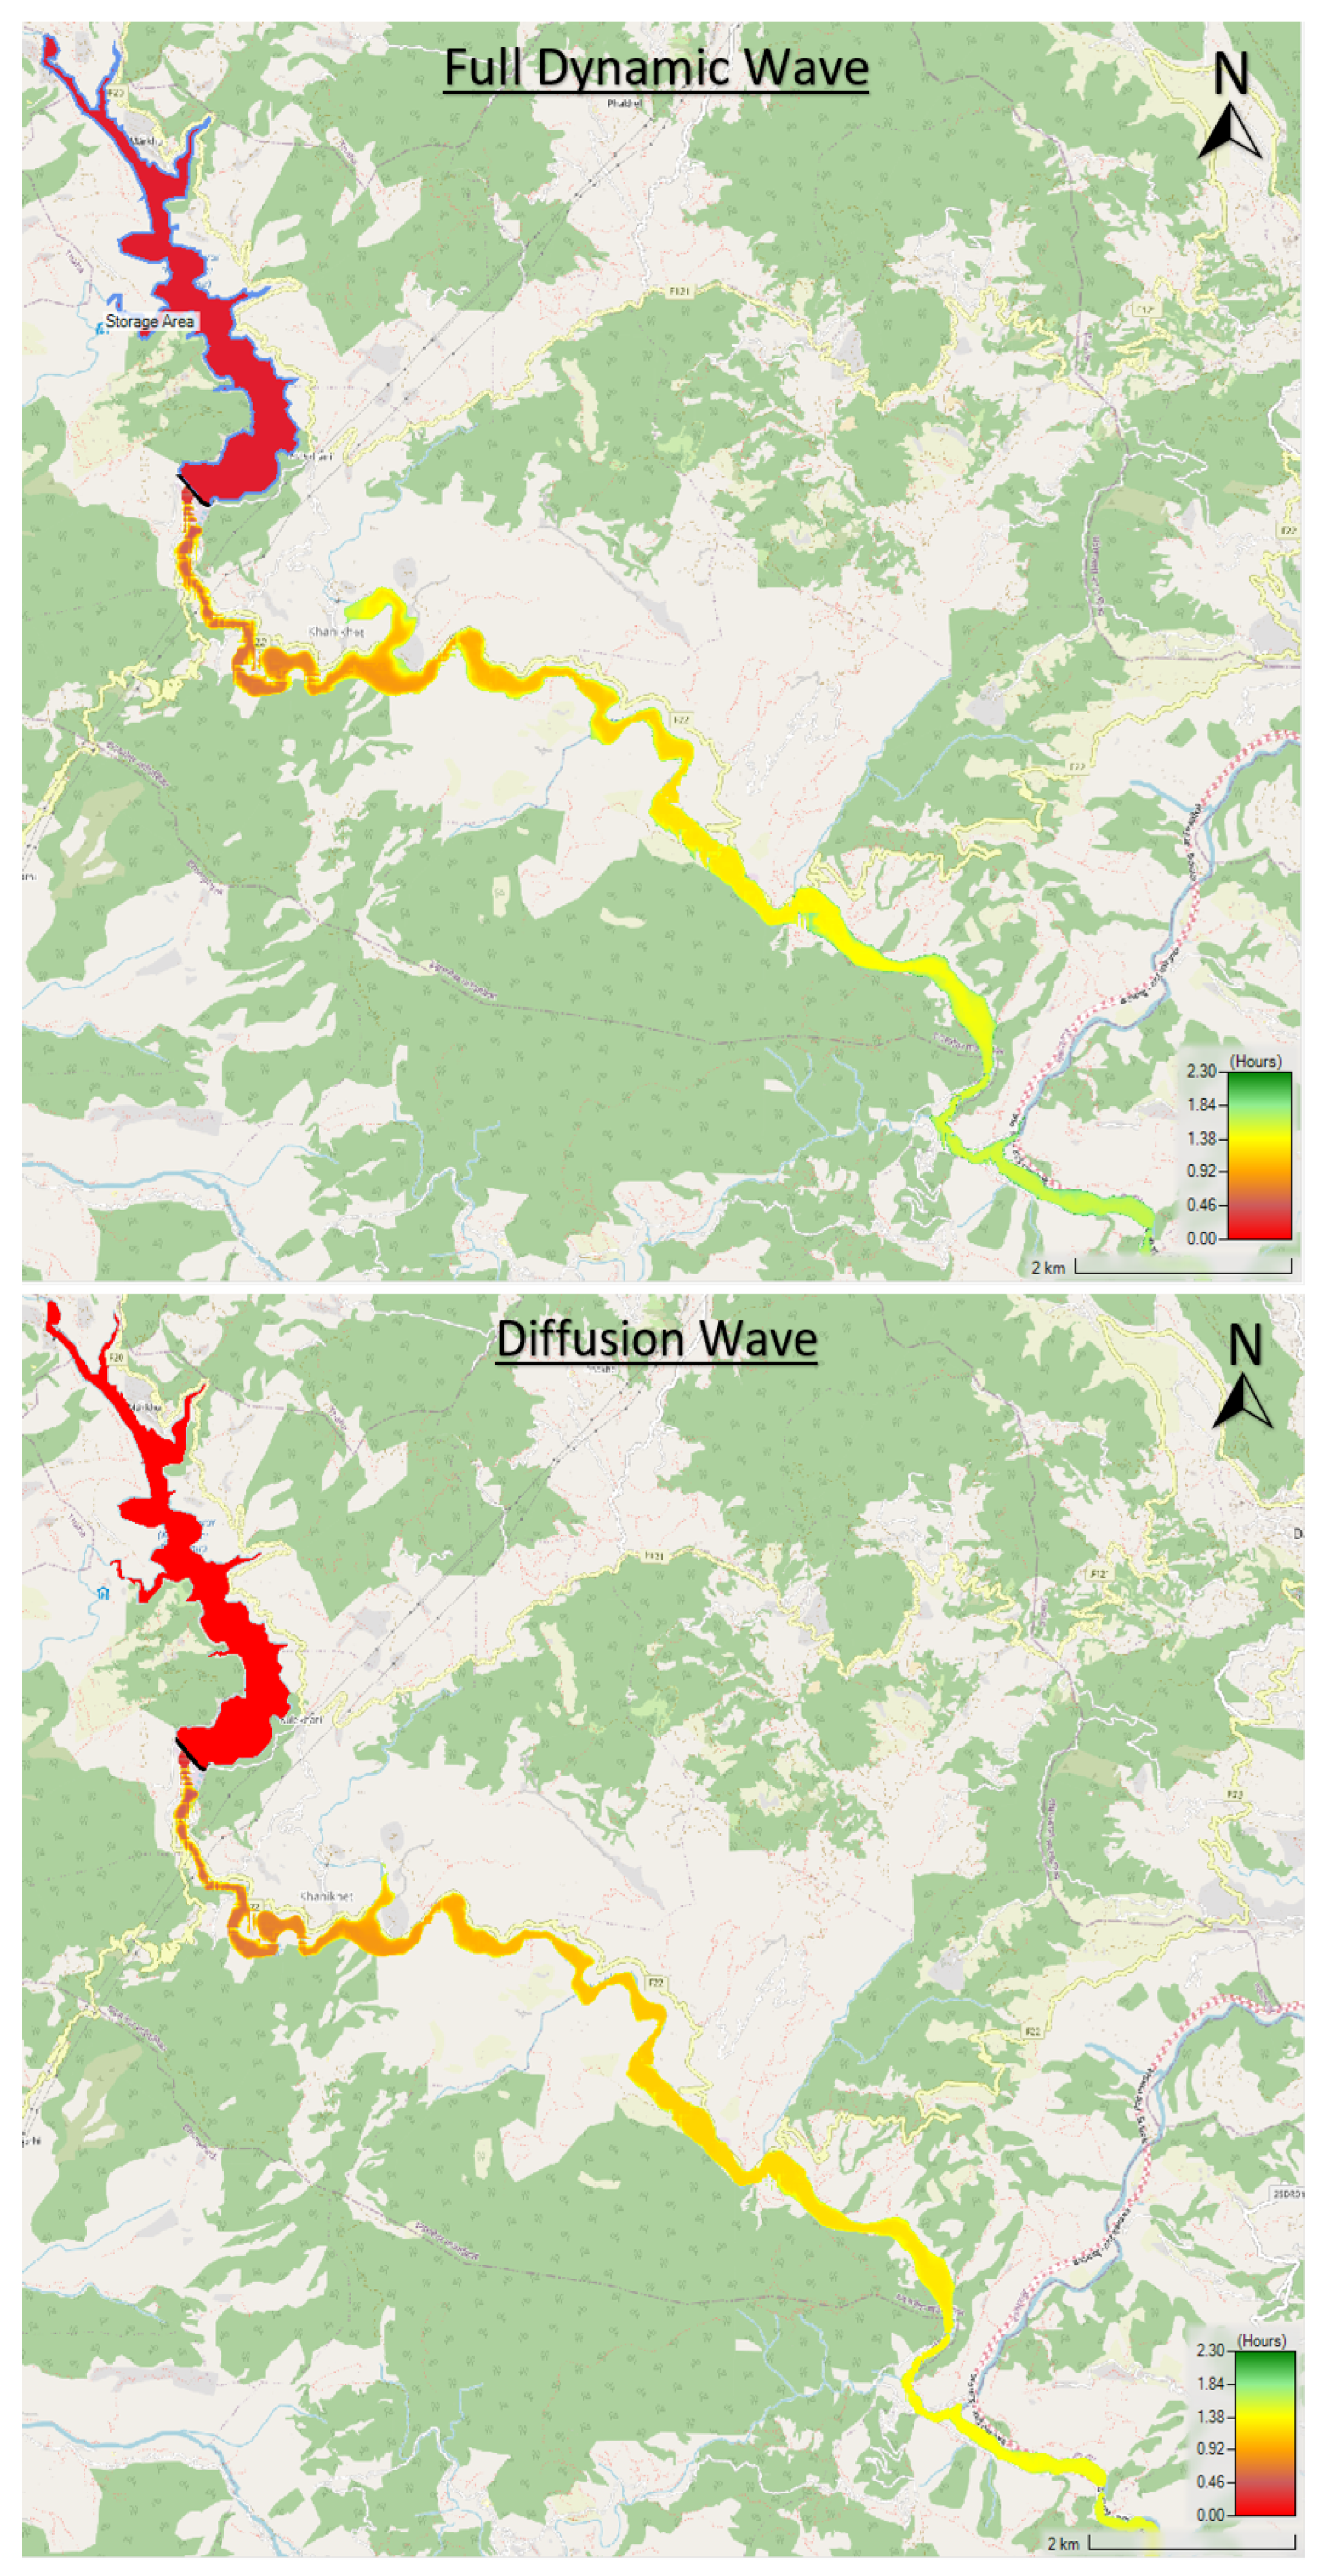
The Full Dynamic Wave Equation captures the physical flow phenomena like the formation of eddies, higher flow velocity at the outer bend adapting centripetal force, and flow depth variation along the cross-section as expected by increasing the flow extension. The secondary flow by meandering is not captured, as it does not account for vertical flow velocity variation [31,37]. The obtained flow results illustrated that there is a higher possibility of deposition of transported sediment and debris at the inner bend of the river resulting point bar, changing a river morphology during flood events. Whereas, the Diffusion Wave Equation does not capture these effects as local acceleration, convective acceleration, and Coriolis effects terms are neglected in the momentum equation, which produces average horizontal water surface elevation, and unrealistic higher central flow velocity resulting in less water depth and less flow extension.
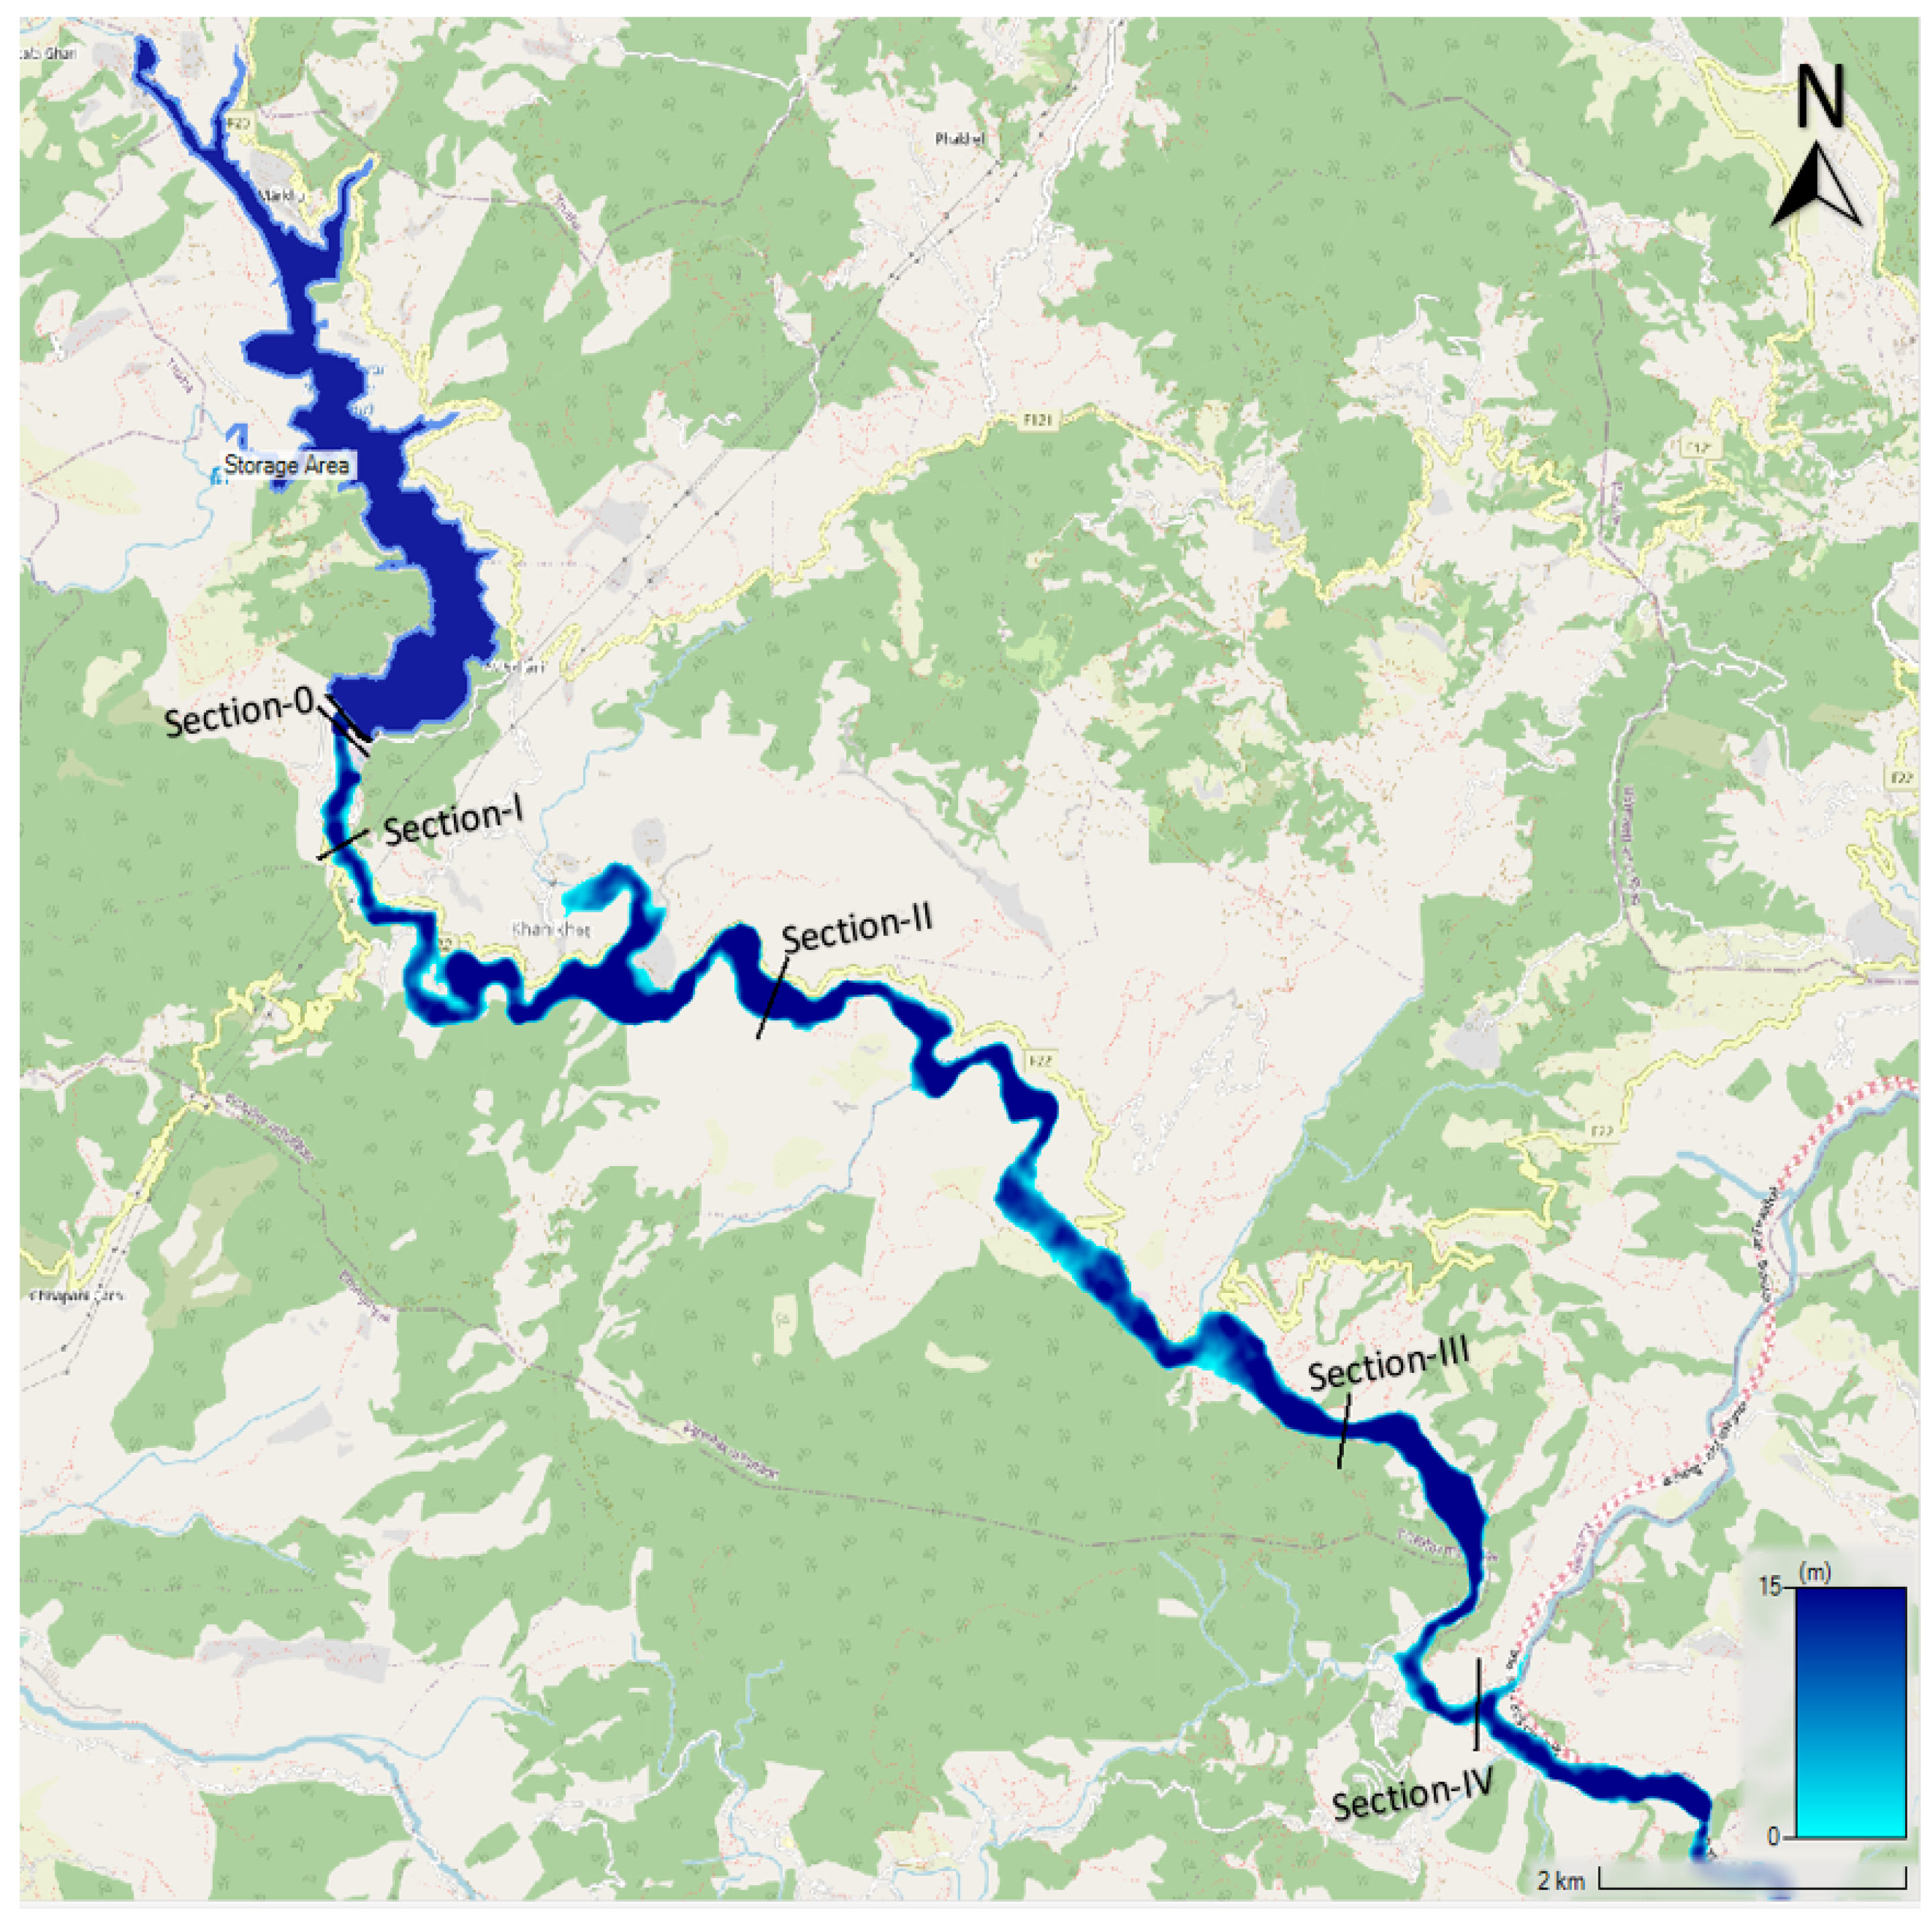
Figure 12. Flow hydrograph from different sections of the Kulekhani River
Preprints 89378 g012
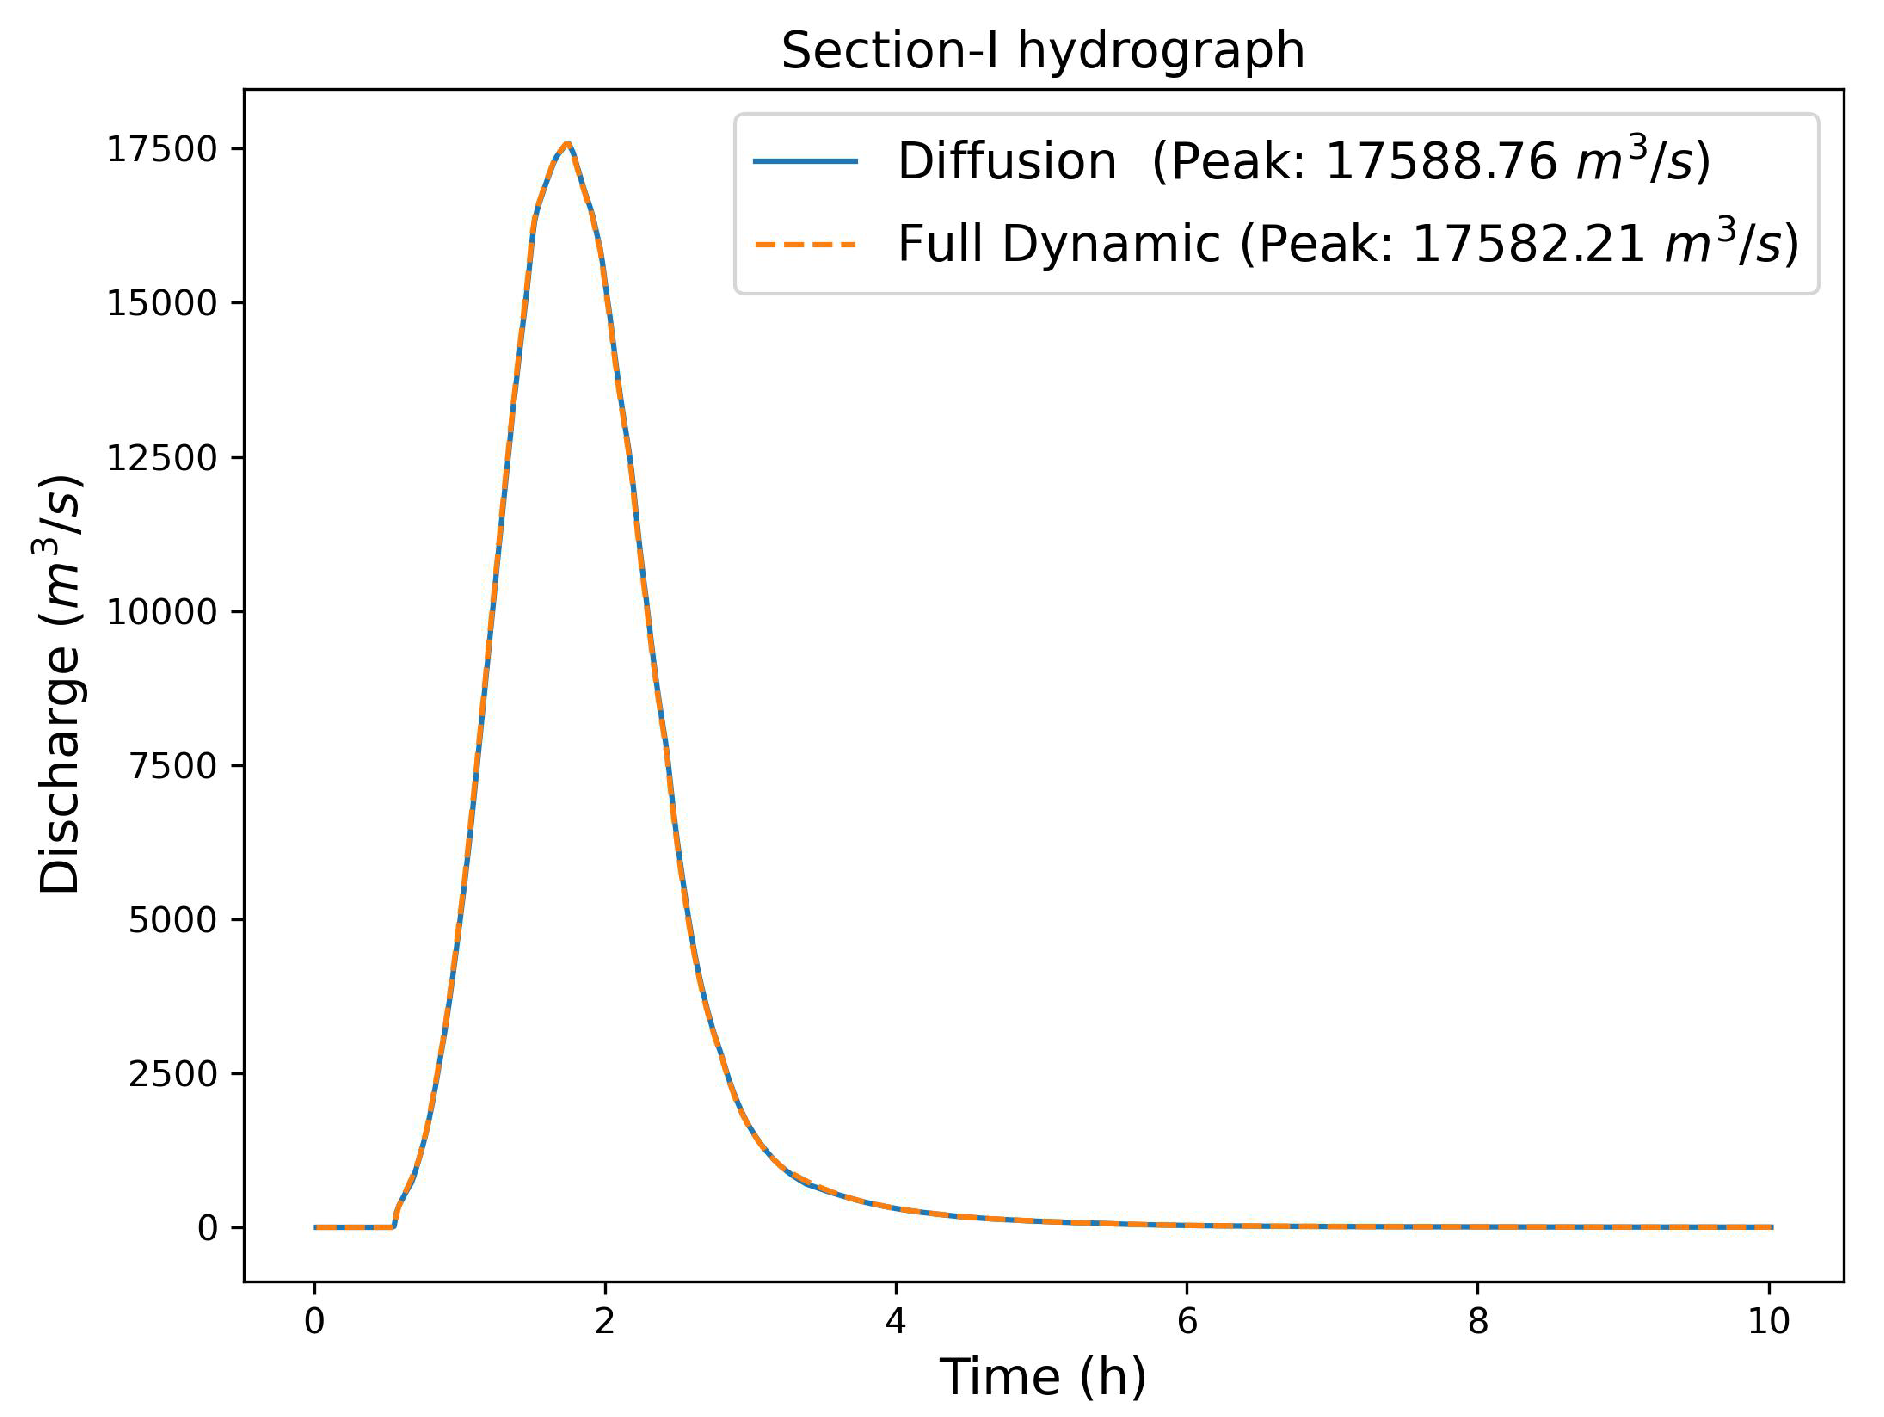
Figure 13. Section-I flow hydrograph
Preprints 89378 g013
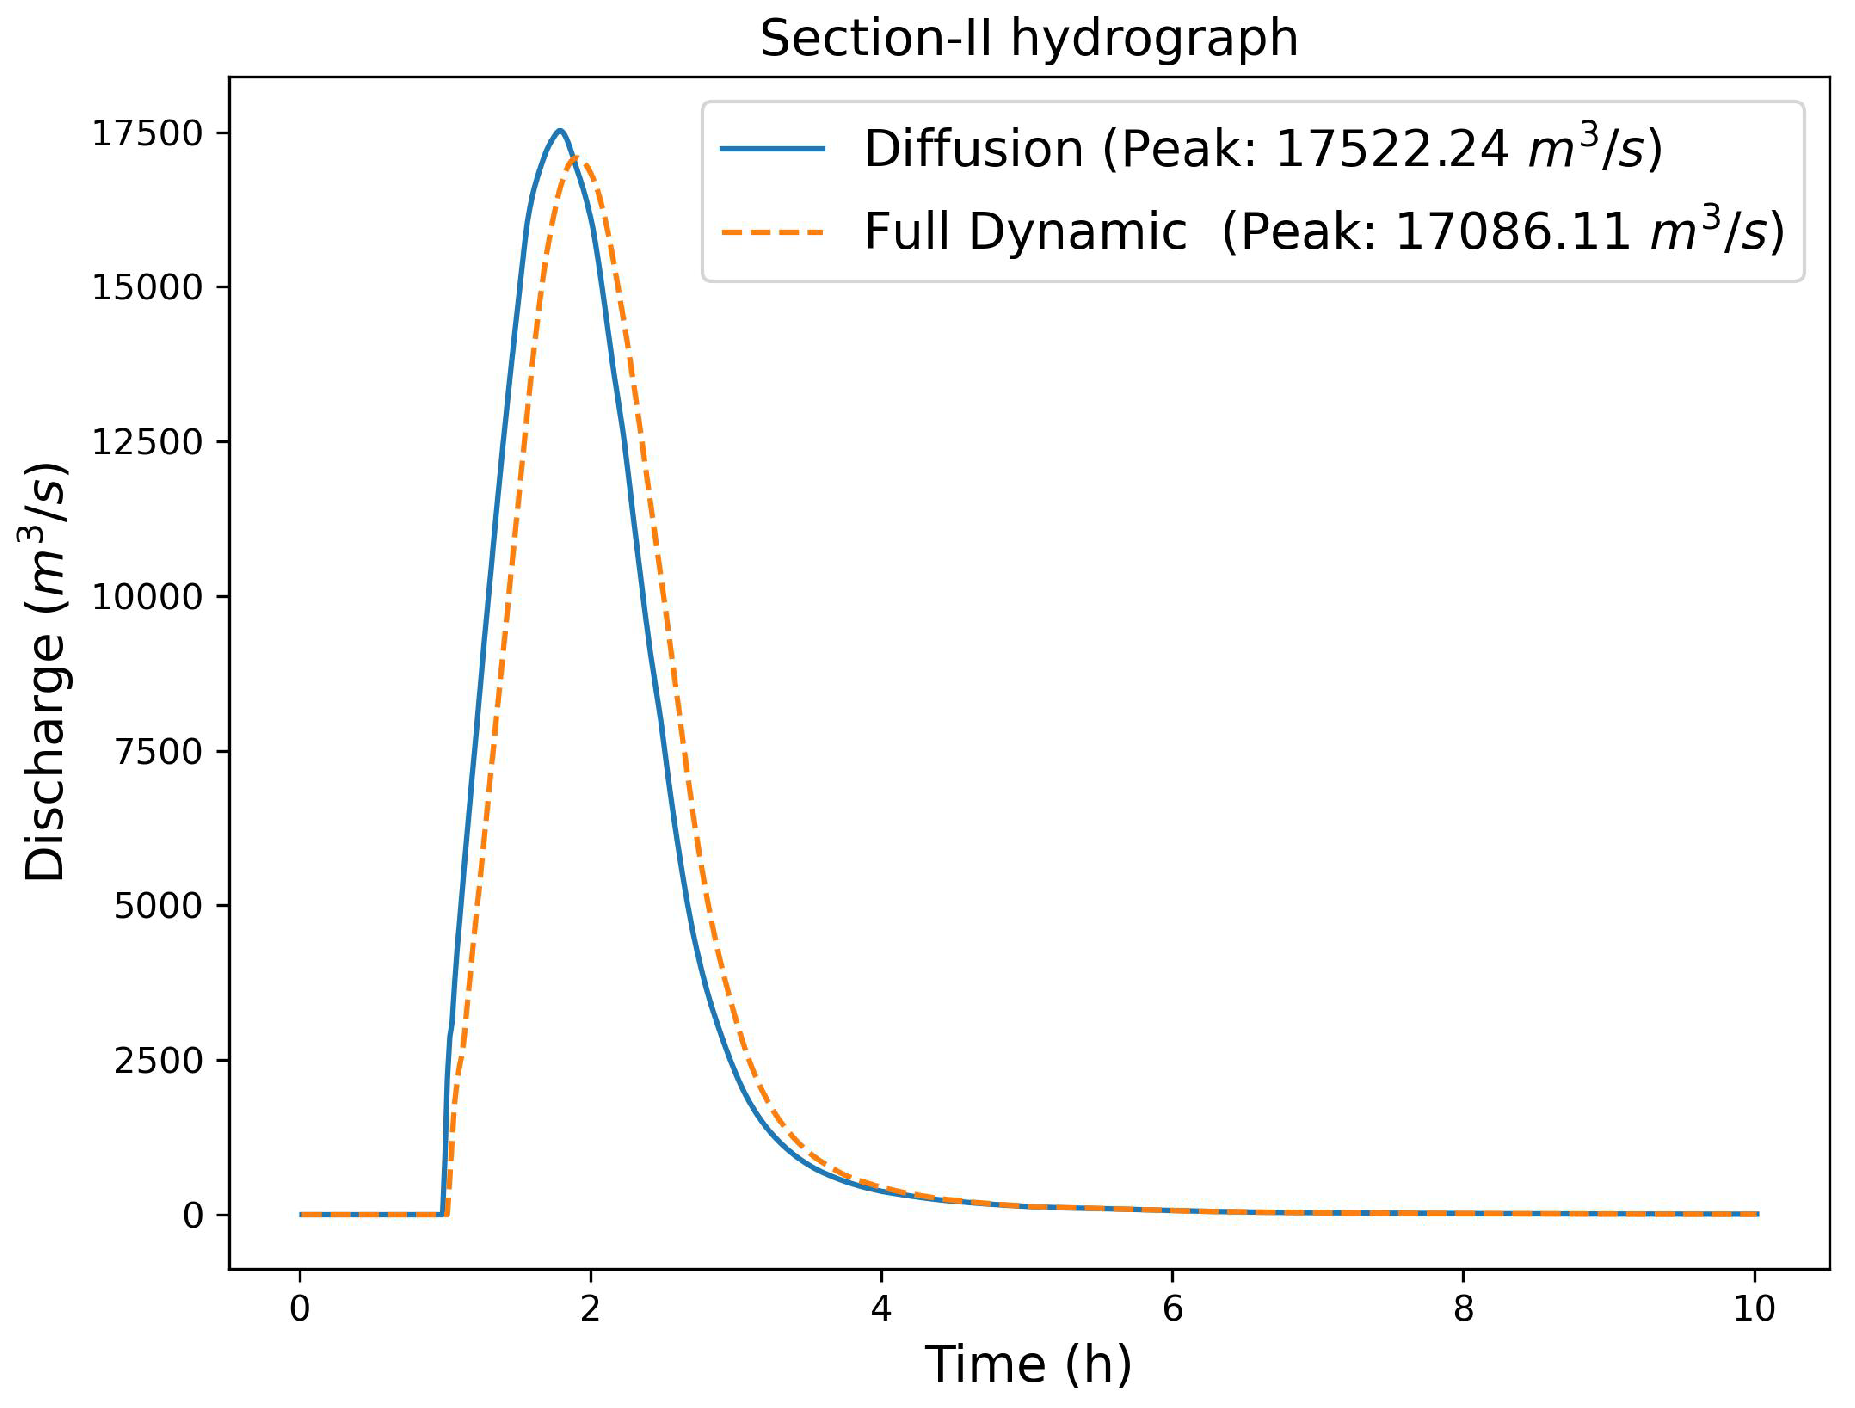
Figure 14. Section-II flow hydrograph
Preprints 89378 g014
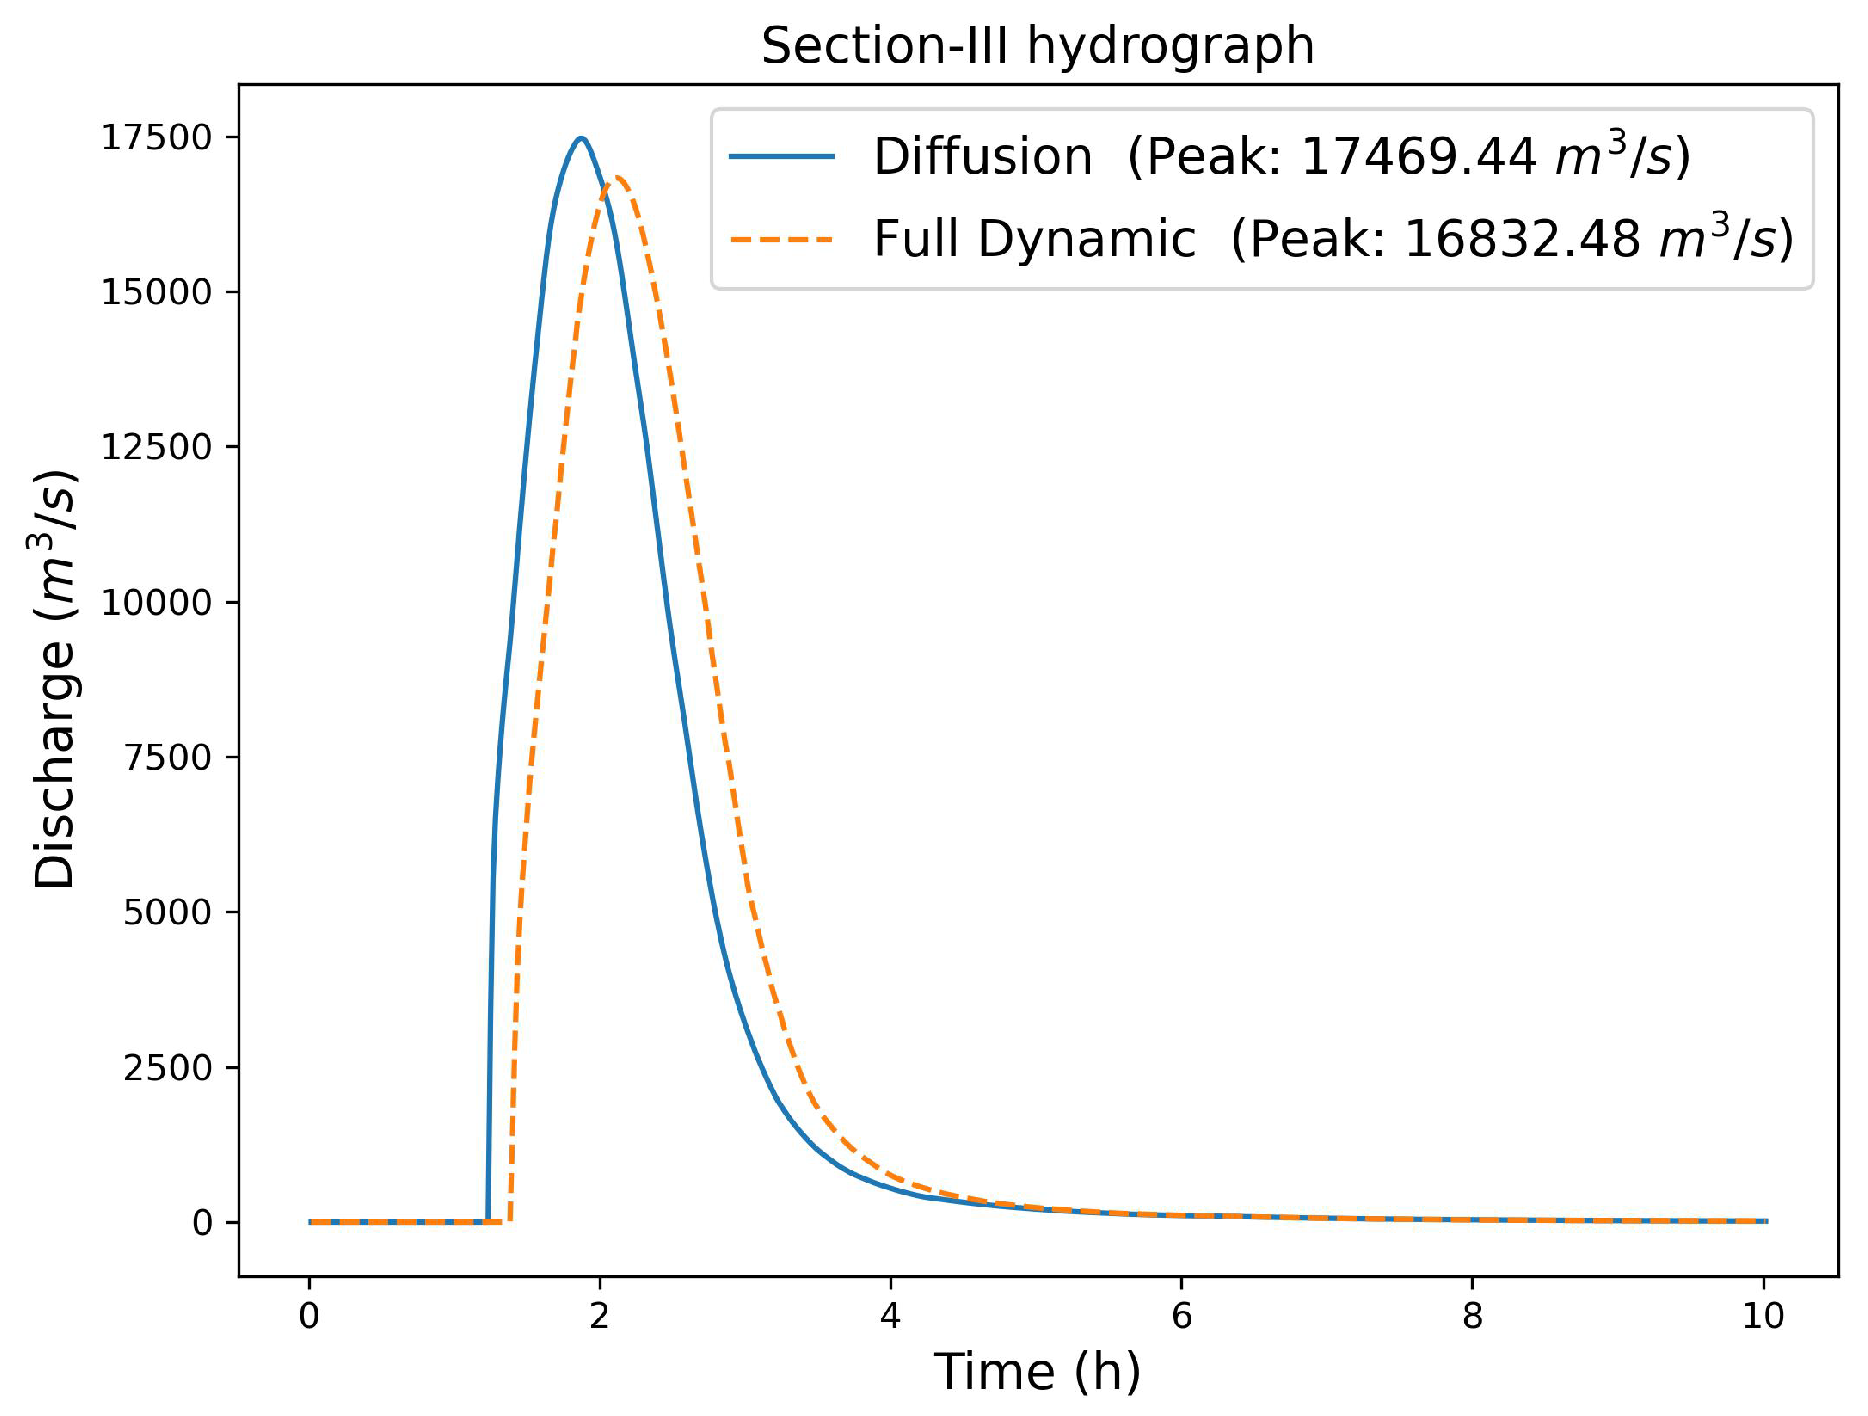
Figure 15. Section-III flow hydrograph
Preprints 89378 g015
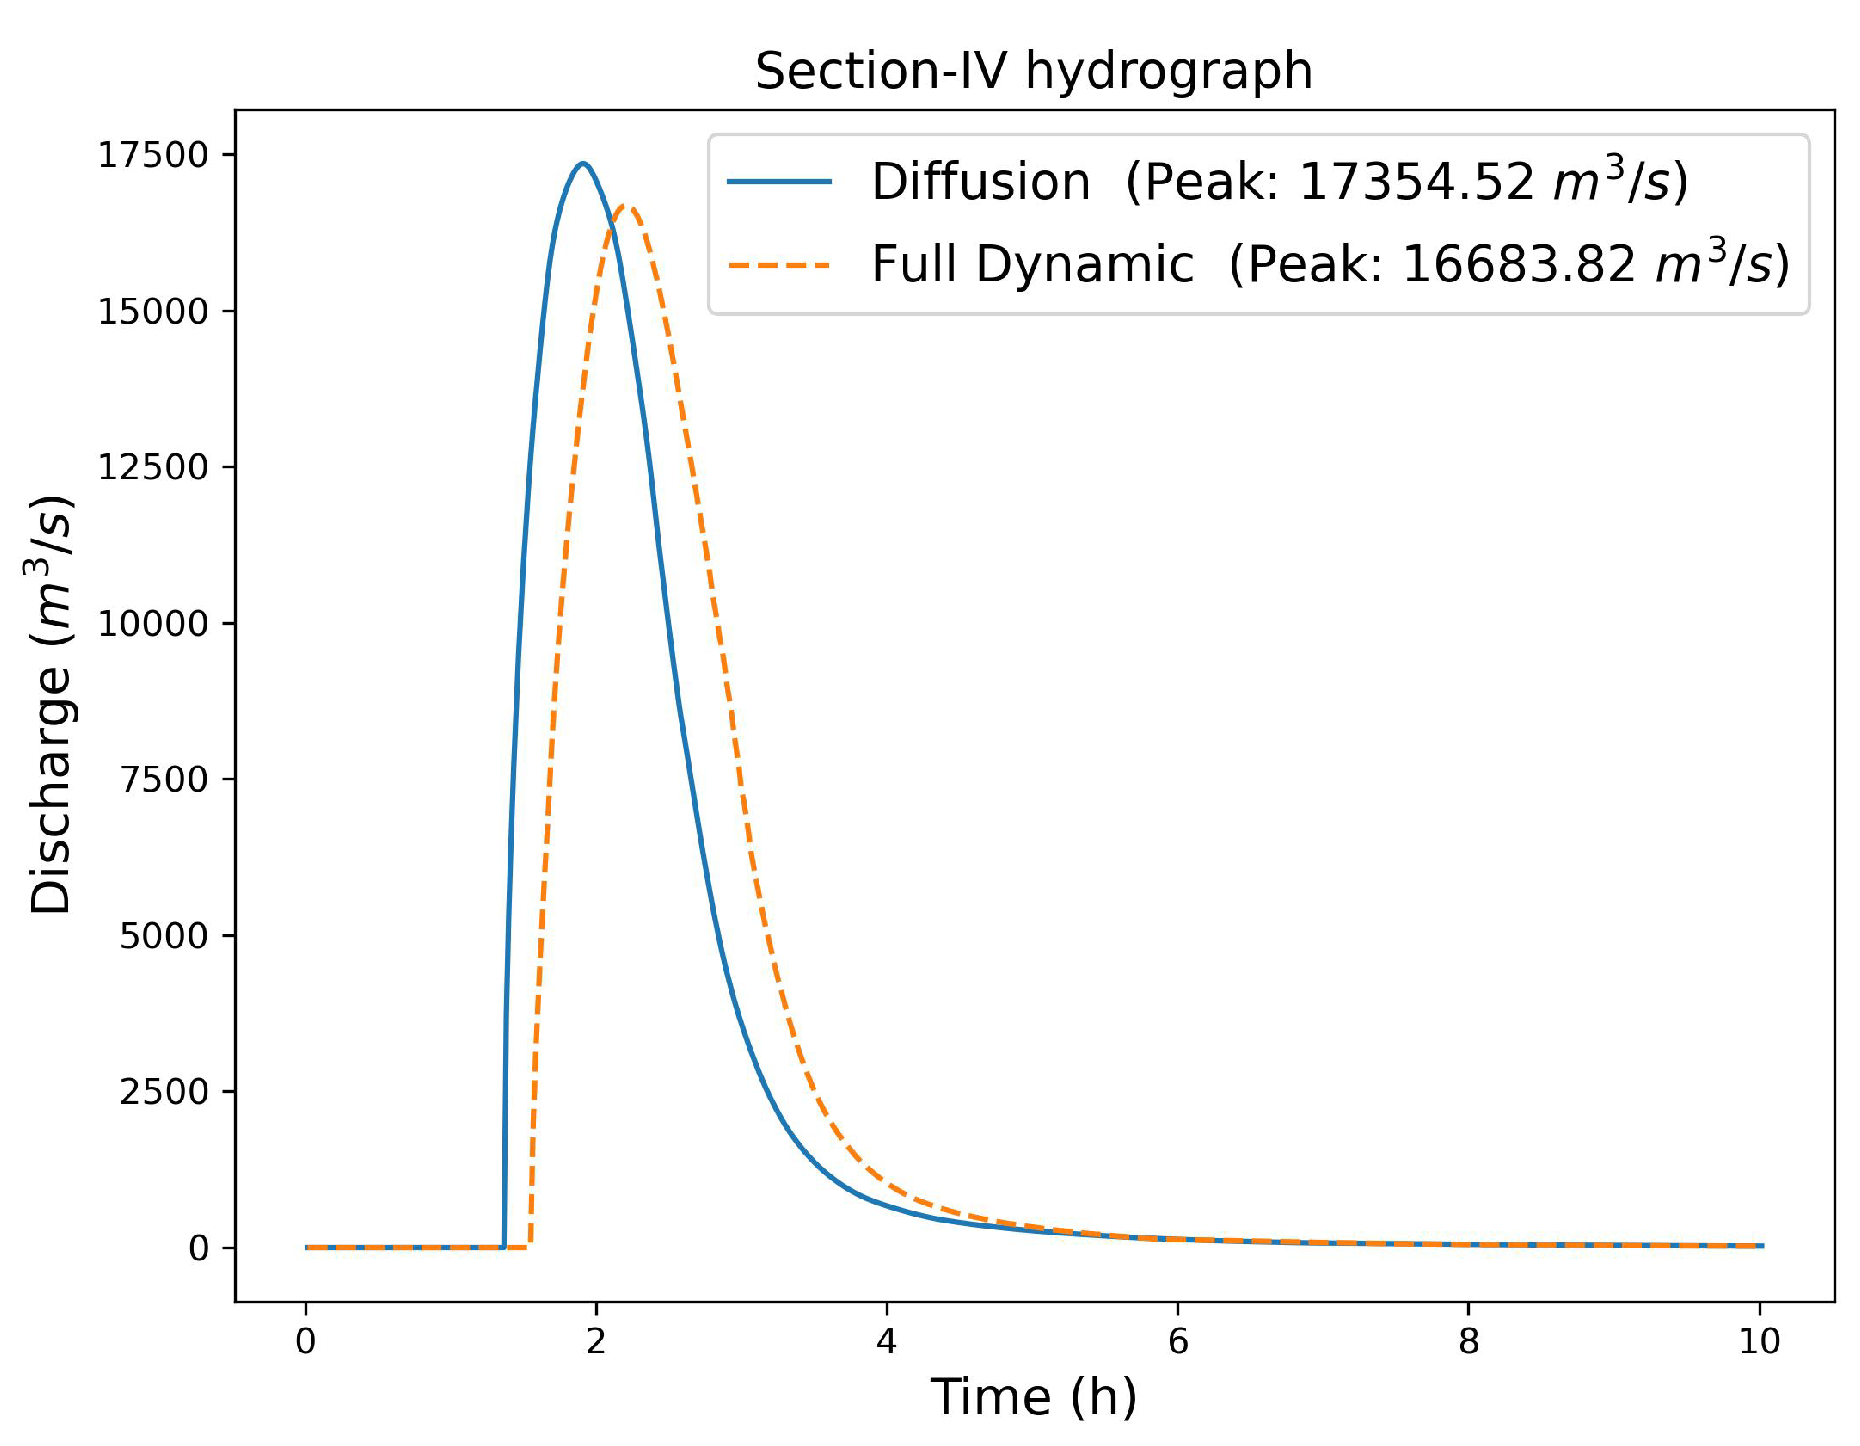
Figure 16. Section-IV flow hydrograph
Preprints 89378 g016
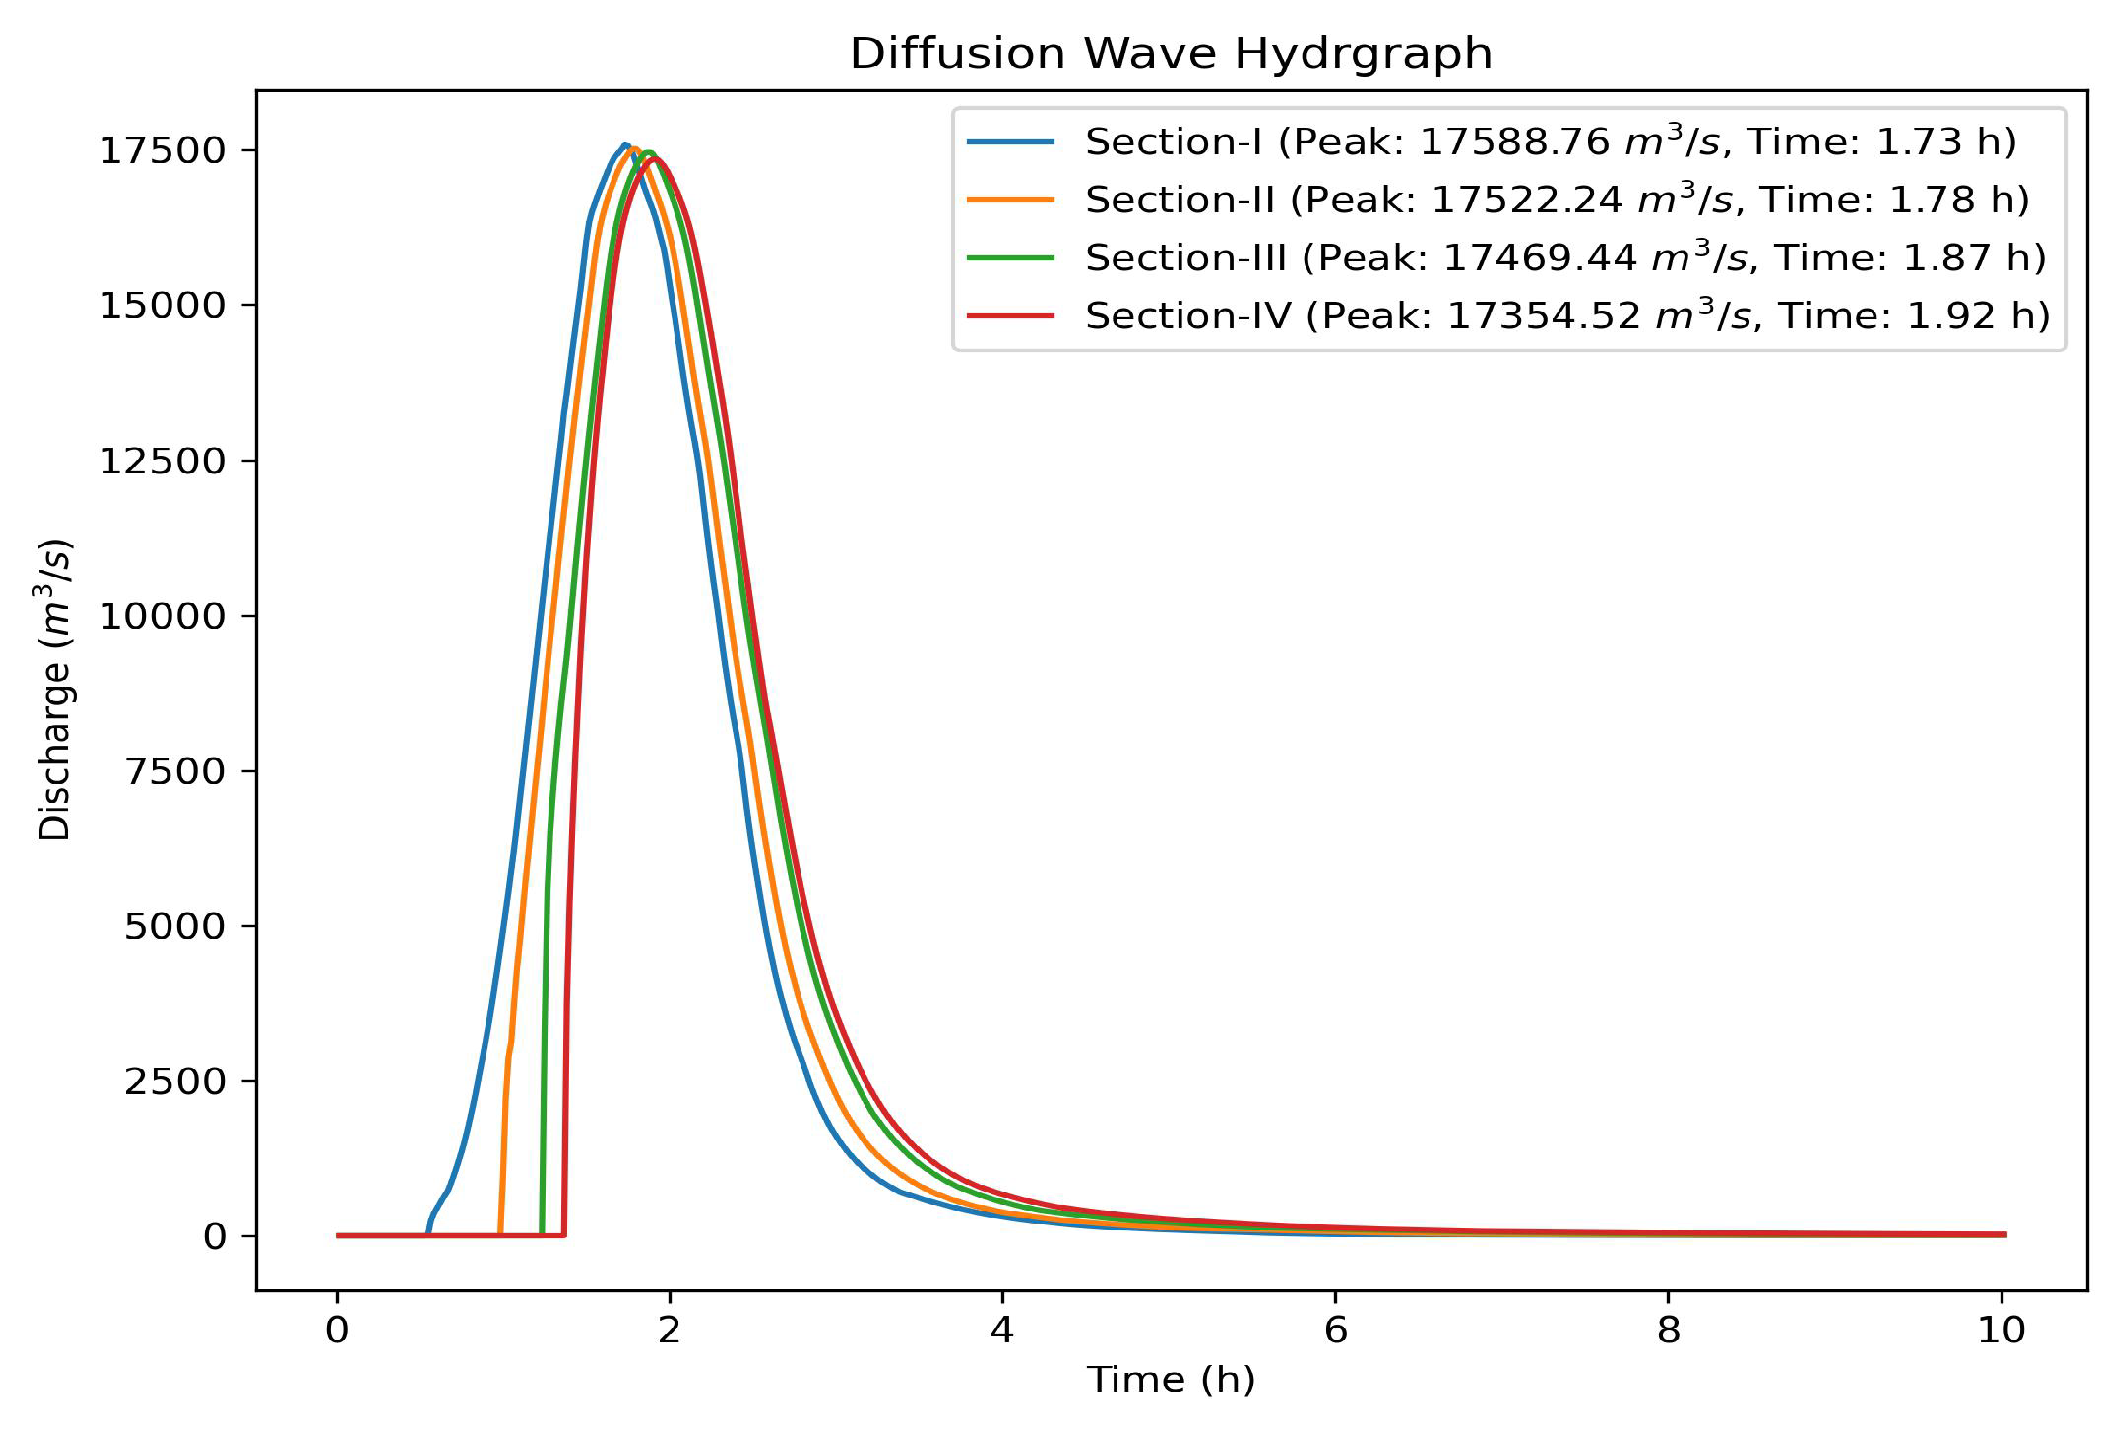
Figure 17. Diffusion Wave Equation hydrograph
Preprints 89378 g017
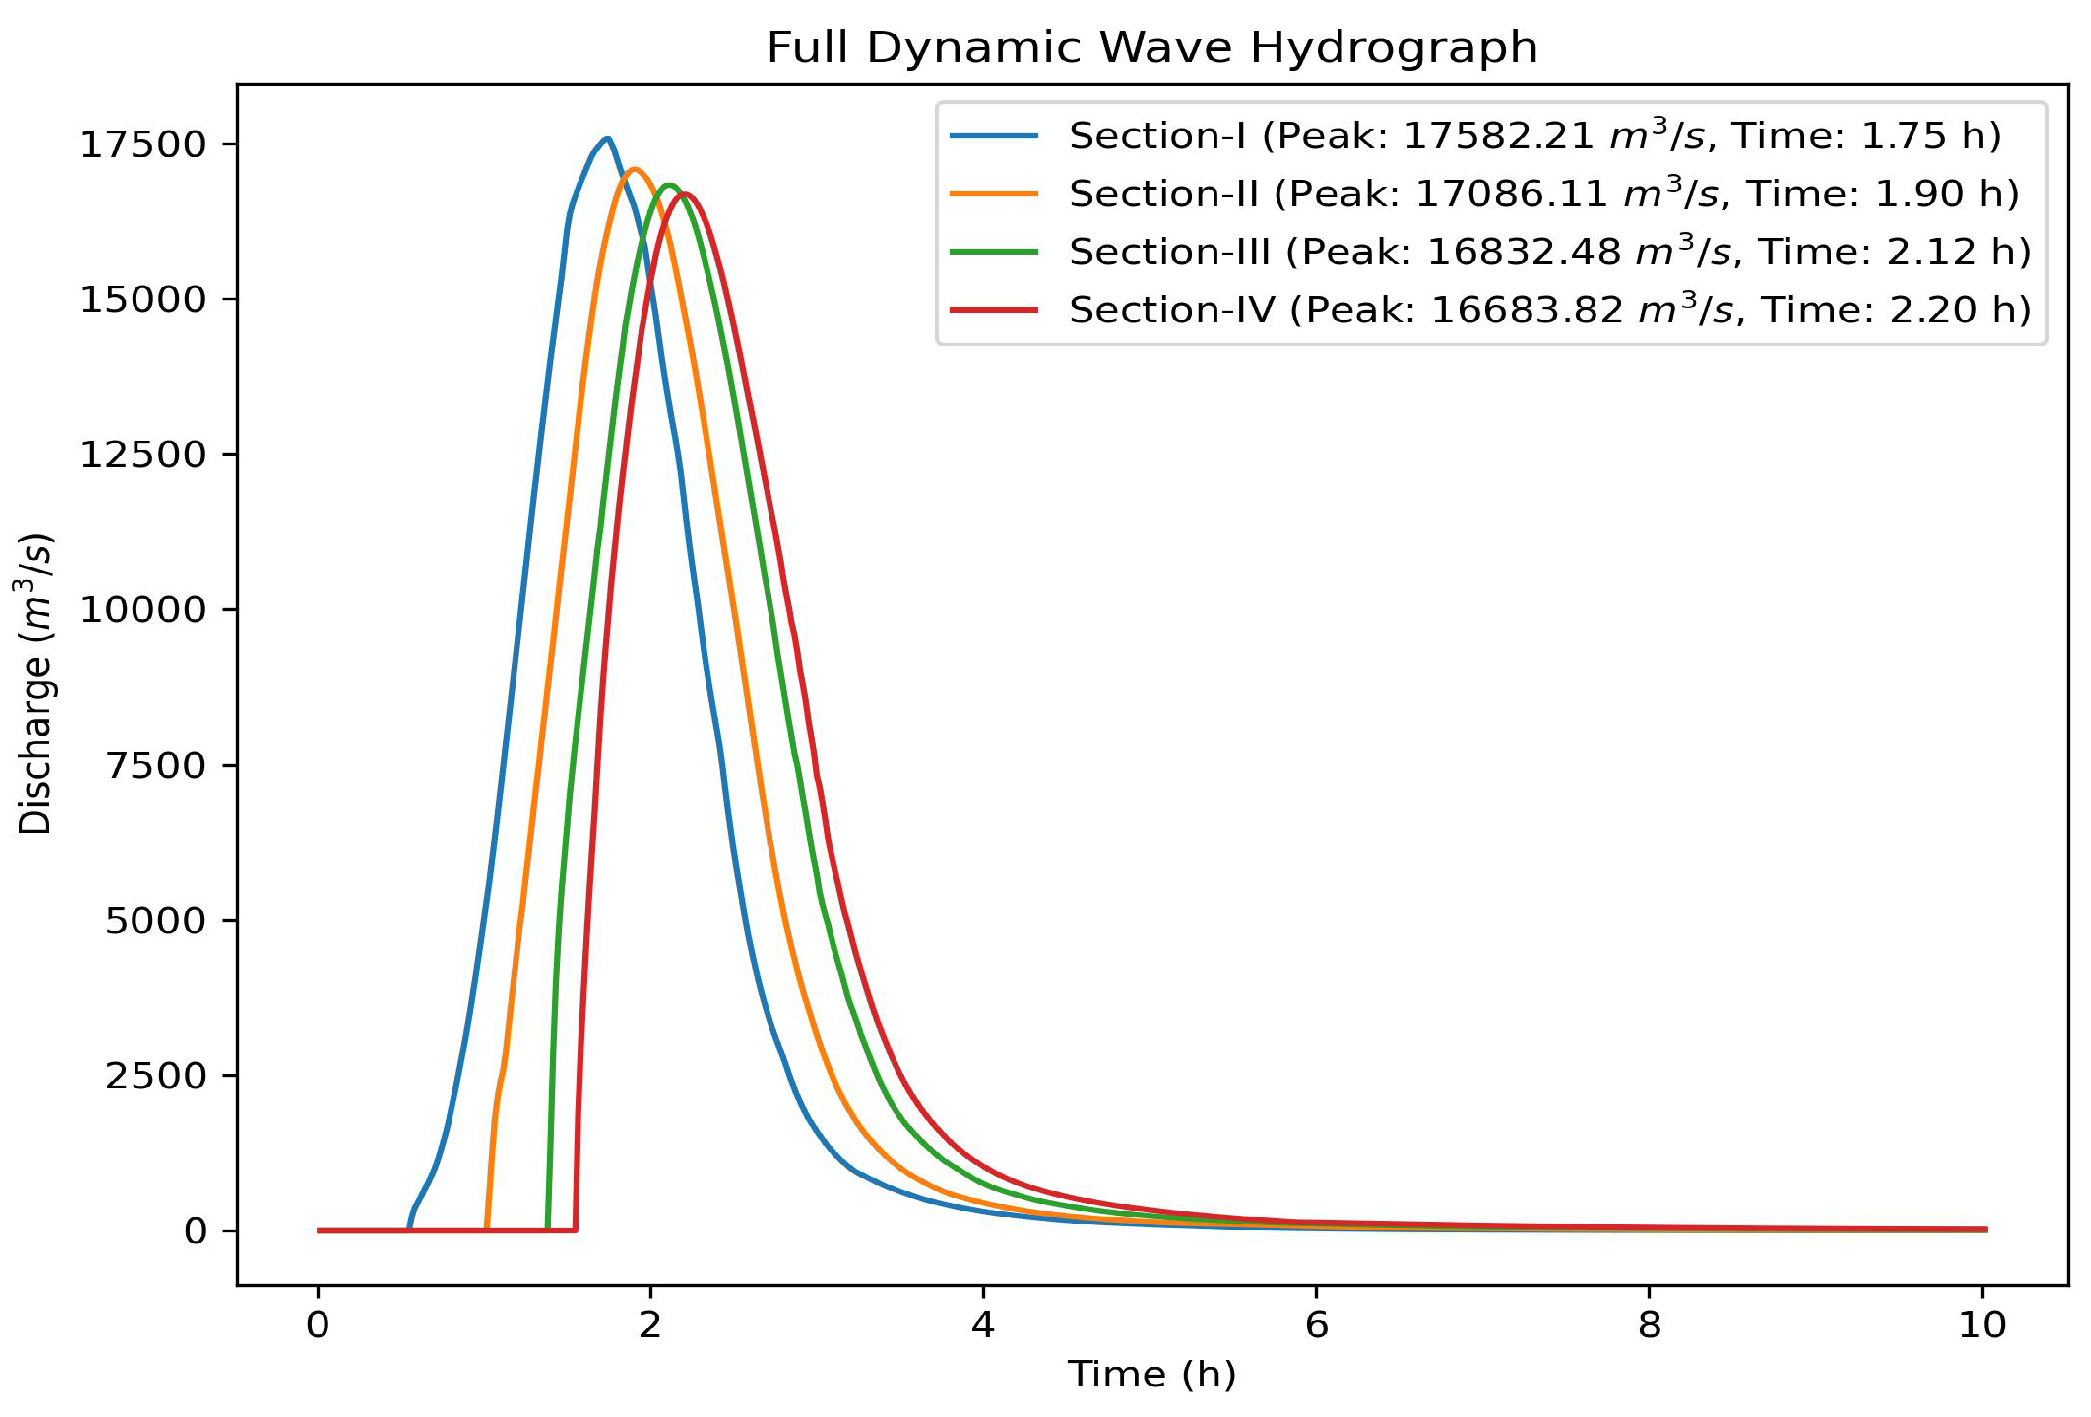
Figure 18. Full Dynamic Wave Equation hydrograph
Preprints 89378 g018
The flow hydrograph at four different river cross sections was evaluated over 16km of river reach downstream of the dam. The flood hydrograph for Diffusion and Dynamic Wave clearly indicated less attenuation in the flow peak due to a steep slope, narrow valley, and less floodplain river. The river reach from the dam to the Bagmati River confluence has an overall slope of 1:42, a side slope of 45 60 o vertical, and a bottom width ranging from 50 to 250m. The results have also shown that there is a time lag in the flow peaks using both models. The Diffusion Wave Equation does not account for the inertial and acceleration effects, resulting in higher flow velocity by increasing the peak. Whereas the Full Dynamic Wave Equation incorporates friction and energy dissipation more accurately, which decreases the flow velocity leading to lower peak flows. However, sometimes numerical dissipation while solving a Full Dynamic Equation might lead to smoothing effects on the peak of the hydrograph by reducing the magnitude[40].
Table 5. Peak flow attenuation and time lag
Section Diffusion peak ( m 3 / s ) Time of Peak (h) Dynamic peak ( m 3 / s ) Time of Peak (h)
Section-I 17588.76 1.73 17582.21 1.75
Section-II 17522.24 1.78 17086.11 1.90
Section-III 17469.44 1.87 16832.48 2.12
Section-IV 17354.52 1.92 16683.82 2.20

3.2. Flood hazard assessment

The flood hazard assessment was carried out by mapping water depth, flow velocity, flood intensity classified by the American Society of Civil Engineers (ASCE) [41], and arrival time to evaluate the flood extension on the affected settlements.
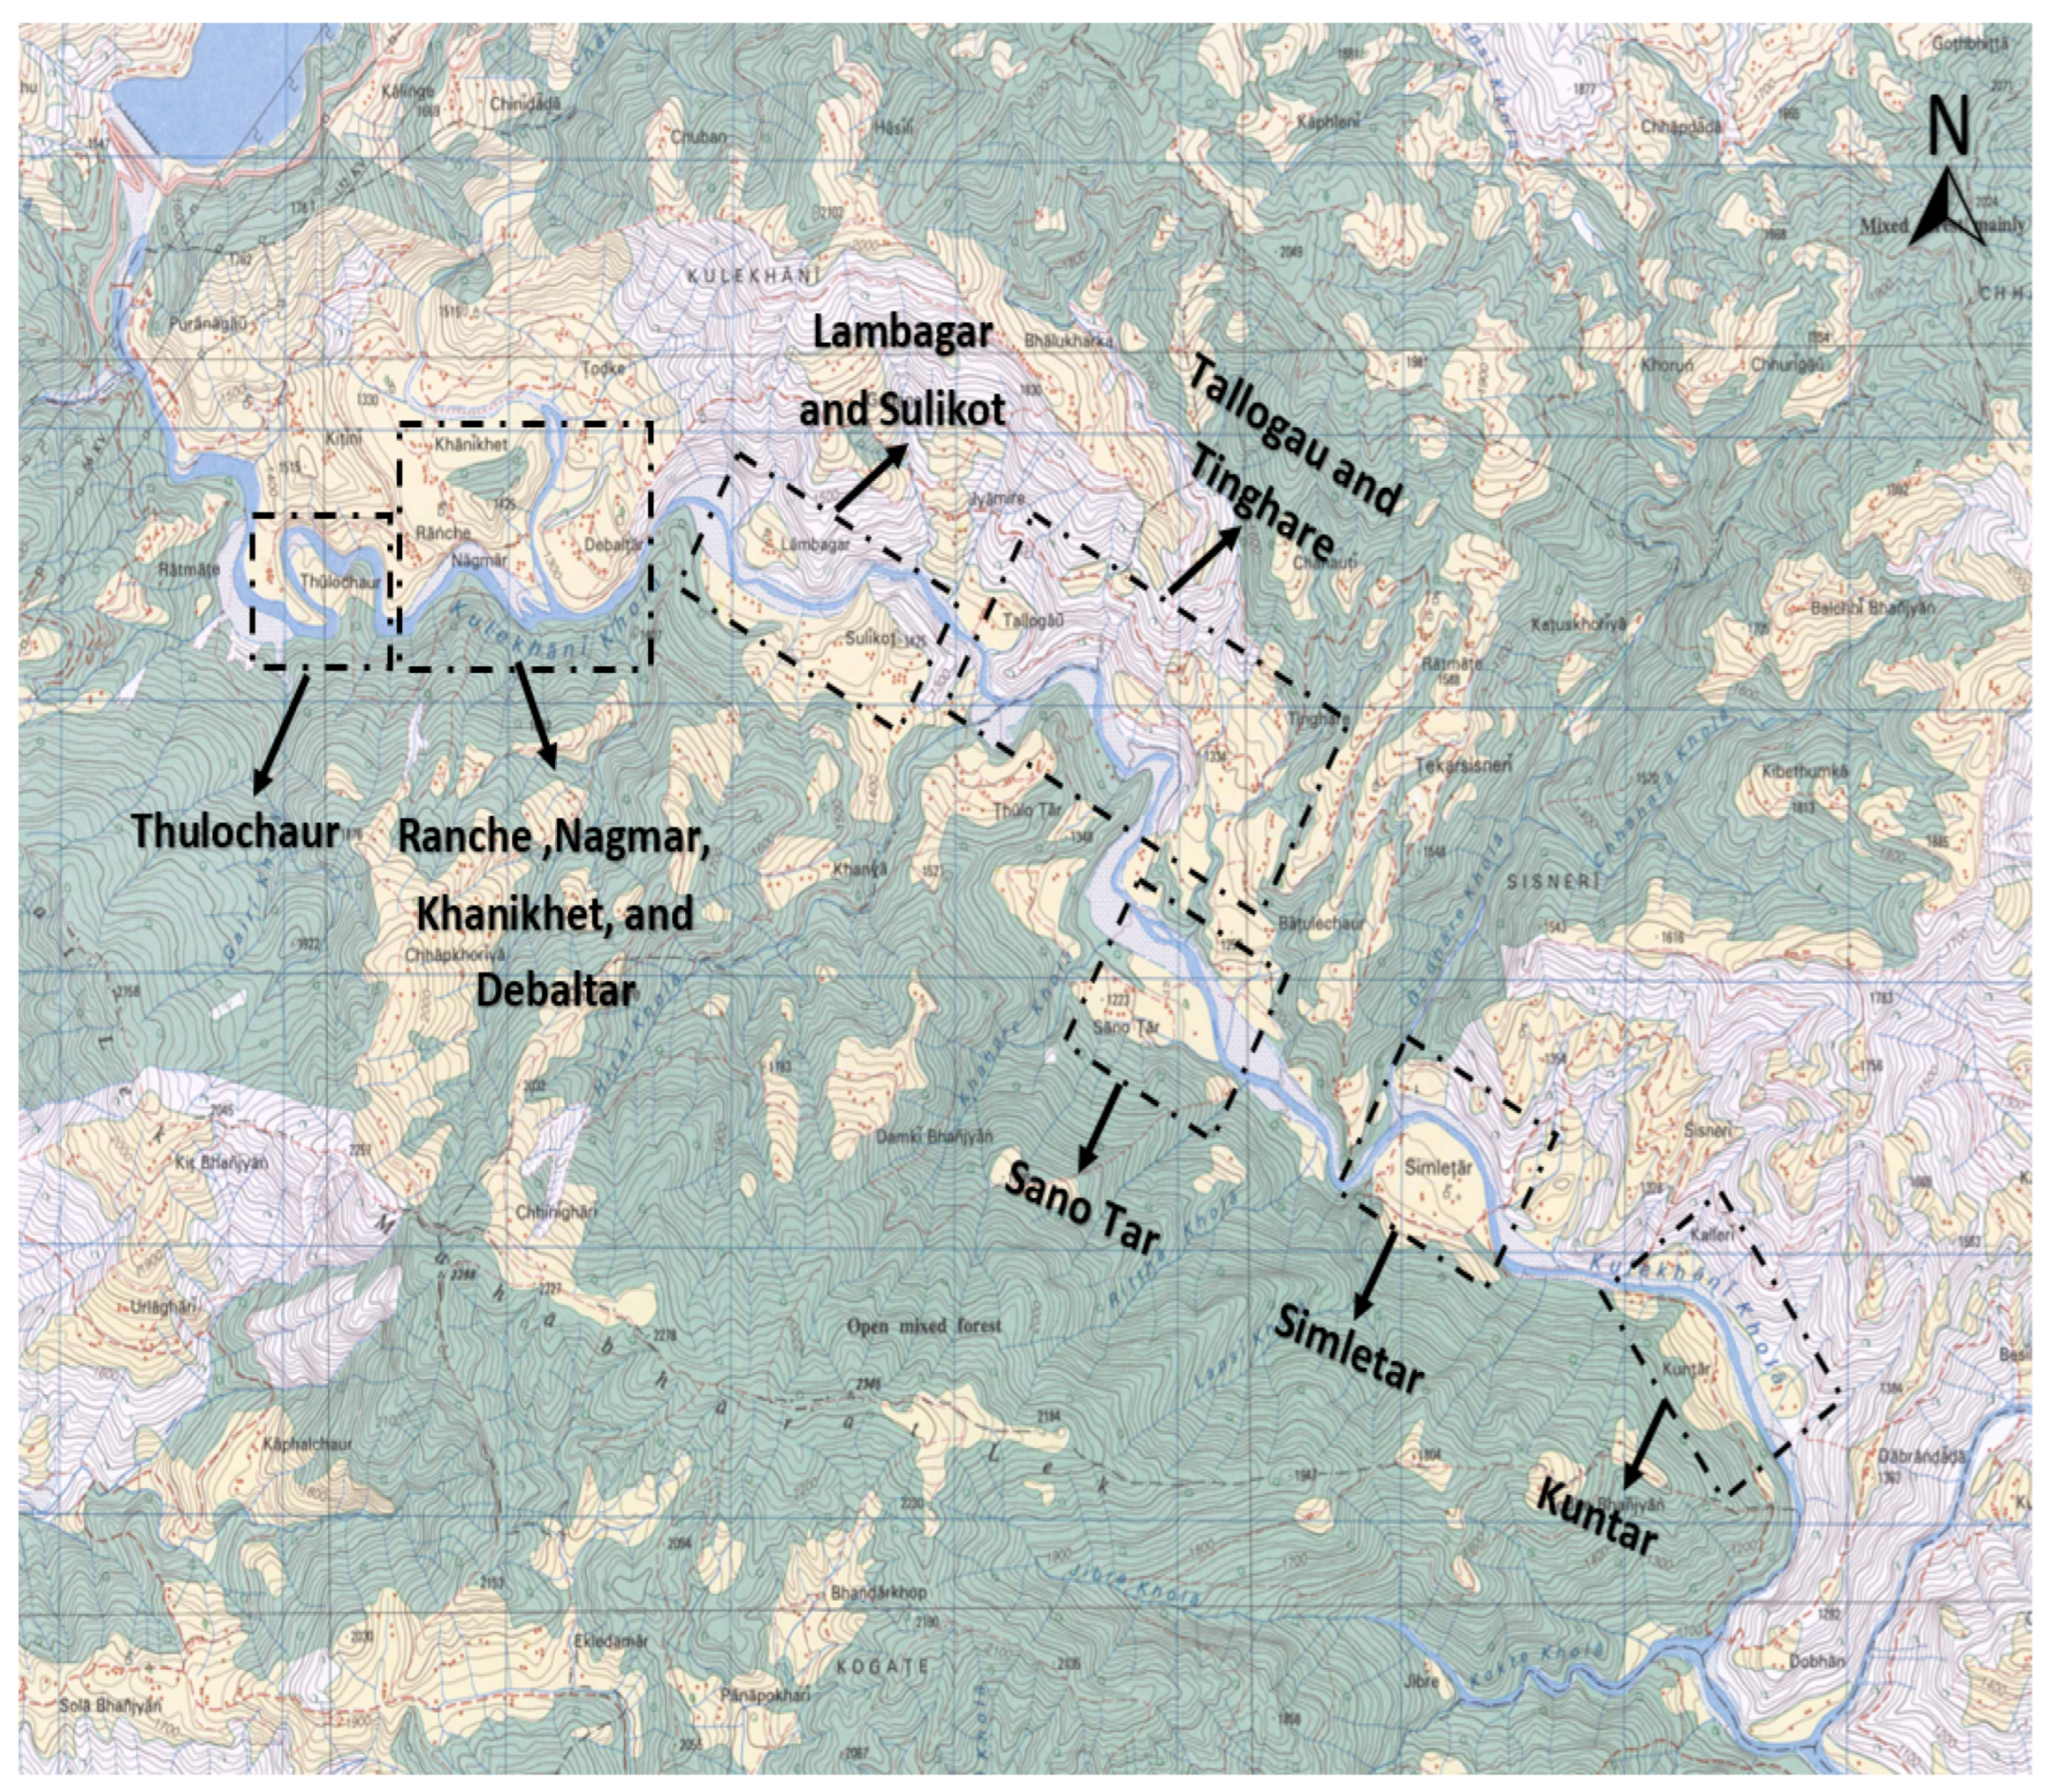
Figure 19. Possible vulnerable areas with the identified town, 2785 05D Bhimphedi [42]
Preprints 89378 g019
Twelve major downstream towns are expected to be flooded due to a dam breach of the Kulekhnai Reservoir dam till the confluence of the Bagmati River as shown in Figure 19. The existing total number of living households in the town was estimated based on the provided number of households on topo map, 2785 05D Bhimphedi [42] and open street map.
Table 6. Expected total number of households along the river to be flooded Figure 19, [42]
Town Households
Thulchaur 13
Ranche,Nagmar,Khanikhet, and Debaltar 71
Lambagr and Sulikot 48
Tallogau, and Tinghare 10
Sano Tar 32
Simletar 20
Kuntar 18

3.2.1. Flow depth mapping

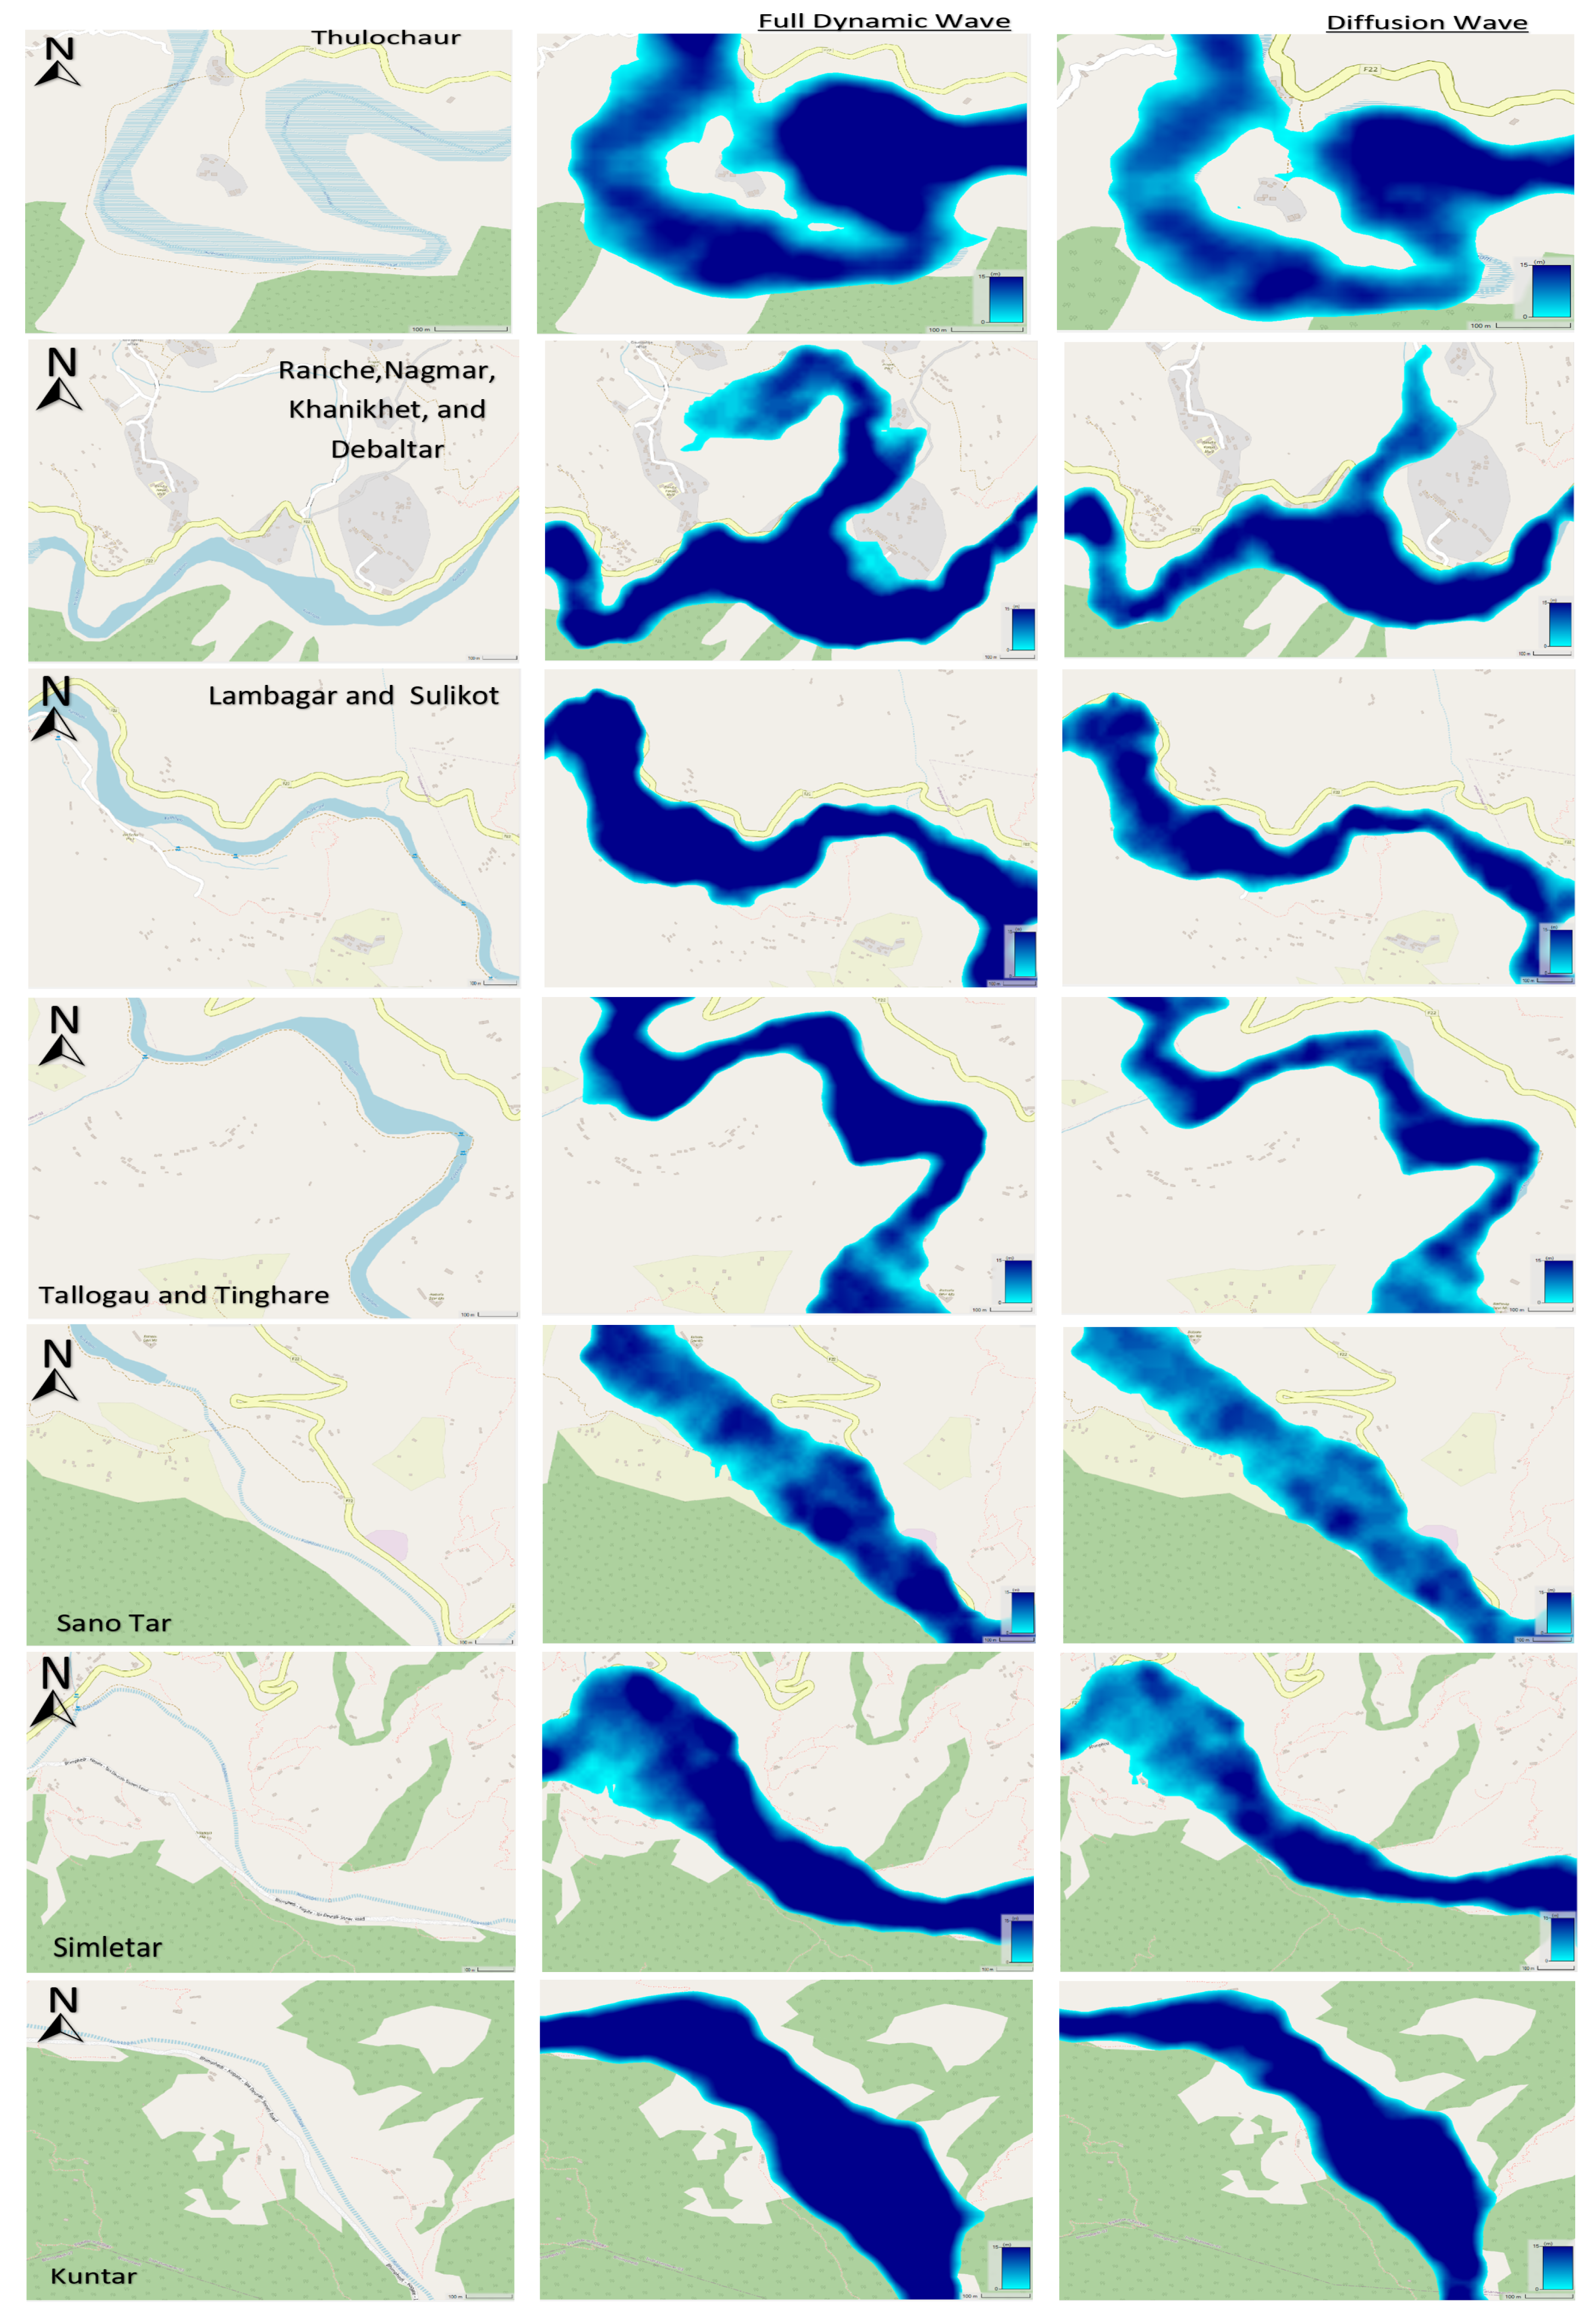
Figure 20. Possible vulnerable areas with flow depth mapping
Preprints 89378 g020

3.2.2. Flow velocity mapping

Figure 21. Possible vulnerable areas with flow velocity mapping
Preprints 89378 g021

3.2.3. Flood intensity mapping (depth x velocity ( m 2 /s) )

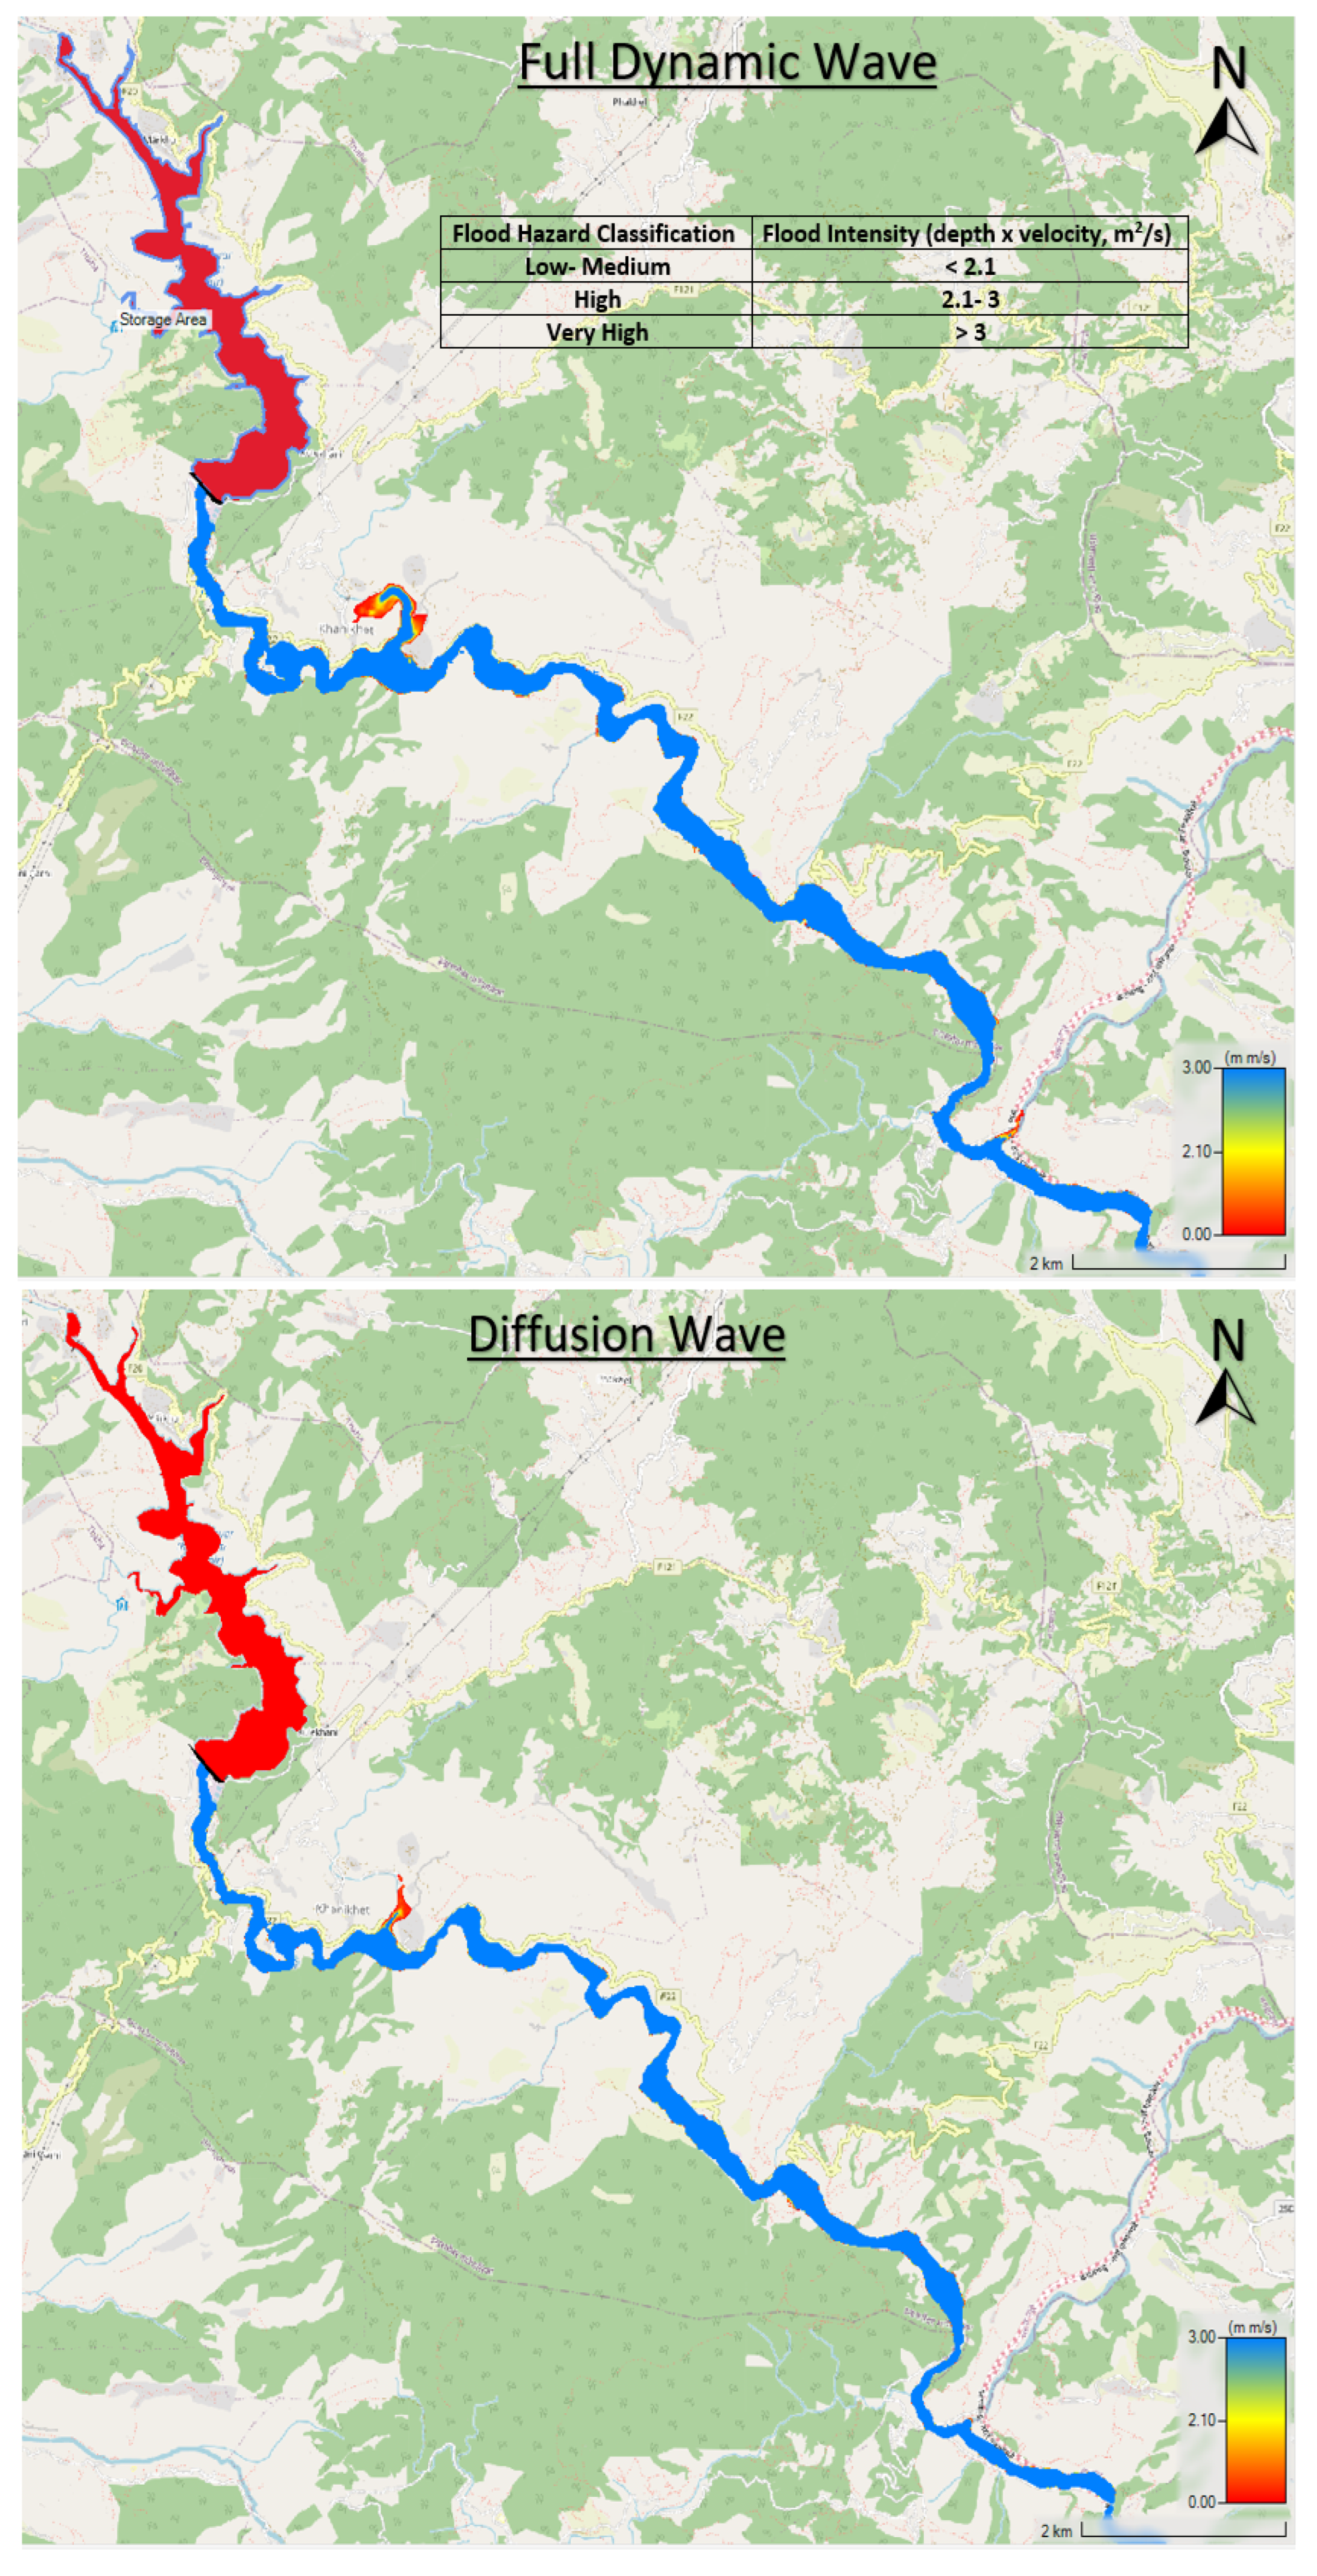
Figure 22. Possible vulnerable areas with flood intensity mapping
Preprints 89378 g022

3.2.4. Time of arrival

Figure 23. Possible vulnerable areas with arrival time mapping
Preprints 89378 g023
The obtained flow depth mapping has shown that all twelve towns will be affected by both models due to the dam breach.
Table 7. Flooded households along the river
Town Expected to be flooded Flooded ( Dynamic Wave ) Flooded ( Diffusion Wave )
Thulchaur 13 7 4
Ranche , Nagmar , Khanikhet , and Debaltar 71 47 21
Lambagr and Sulikot 48 15 11
Tallogau , and Tinghare 10 8 5
Sano Tar 32 14 12
Simletar 20 16 10
Kuntar 18 13 9
Table 8. Total inundation area till the confluence of Bigmati River
Area of inundation ( k m 2 )
Dynamic Wave Diffusion Wave
2.92 2.25
Comparatively, most households are affected using a Full Dynamic Wave rather than a Diffusion Wave Equation which is reasonable, the dynamic wave considers the effect of inertial and convective acceleration losses resulting in less flow velocity by increasing the water depth. The increased water depth increases the flood extension, which can be clearly visualized through flood flow depth mapping, Figure 20. The calculated total extension of the flow area, Table 8 till the Bagmati River confluence has also shown that the flow is likely to be extended using a Full Dynamic Wave Equation. Both the model predicts that most of the households of Ranche, Nagmar, Khanikhet, and Debalta are vulnerable due to dam breach flooding, Figure 20 and Table 7.
The intensity of flood flow due to the dam breach was classified as per the American Society of Civil Engineers (ASCE) flood intensity classification guideline.
Table 9. Flood hazard classification, (ASCE).
Flood Hazard Classification Flood intensity (depth x velocity, m 2 /s)
Low- Medium < 2.1
High 2.1- 3
Very High > 3
The flood intensity map, Figure 22 clearly indicates that flood hazard is "Very High" vulnerable to almost all of the towns with flood intensity above 3 m 2 / s as expected, due to the steep and narrow vertical valley with less floodplain till the confluence of the Bagmati River. The result has shown only some flow area in the towns of Ranche, Nagmar, Khanikhet, and Debaltar lies in the "Low-Medium" and "High" regions.
The flood arrival time mappings Figure 23 have shown, that the flood quickly reaches the confluence of Bagmati River considering Diffusion Wave while Full Dynamic Wave slows down the time of flood as a result of less flow velocity considering losses. The difference in time of peak to reach the confluence between Diffusion and Full Dynamic wave has been found to be 0.28h almost 17 minutes, Table 5.

3.2.5. Flood mitigation measures

Several flood mitigation hydraulic measures such as Levees, Dikes, and vertical Flood walls are essential to prevent the town from flooding [41].
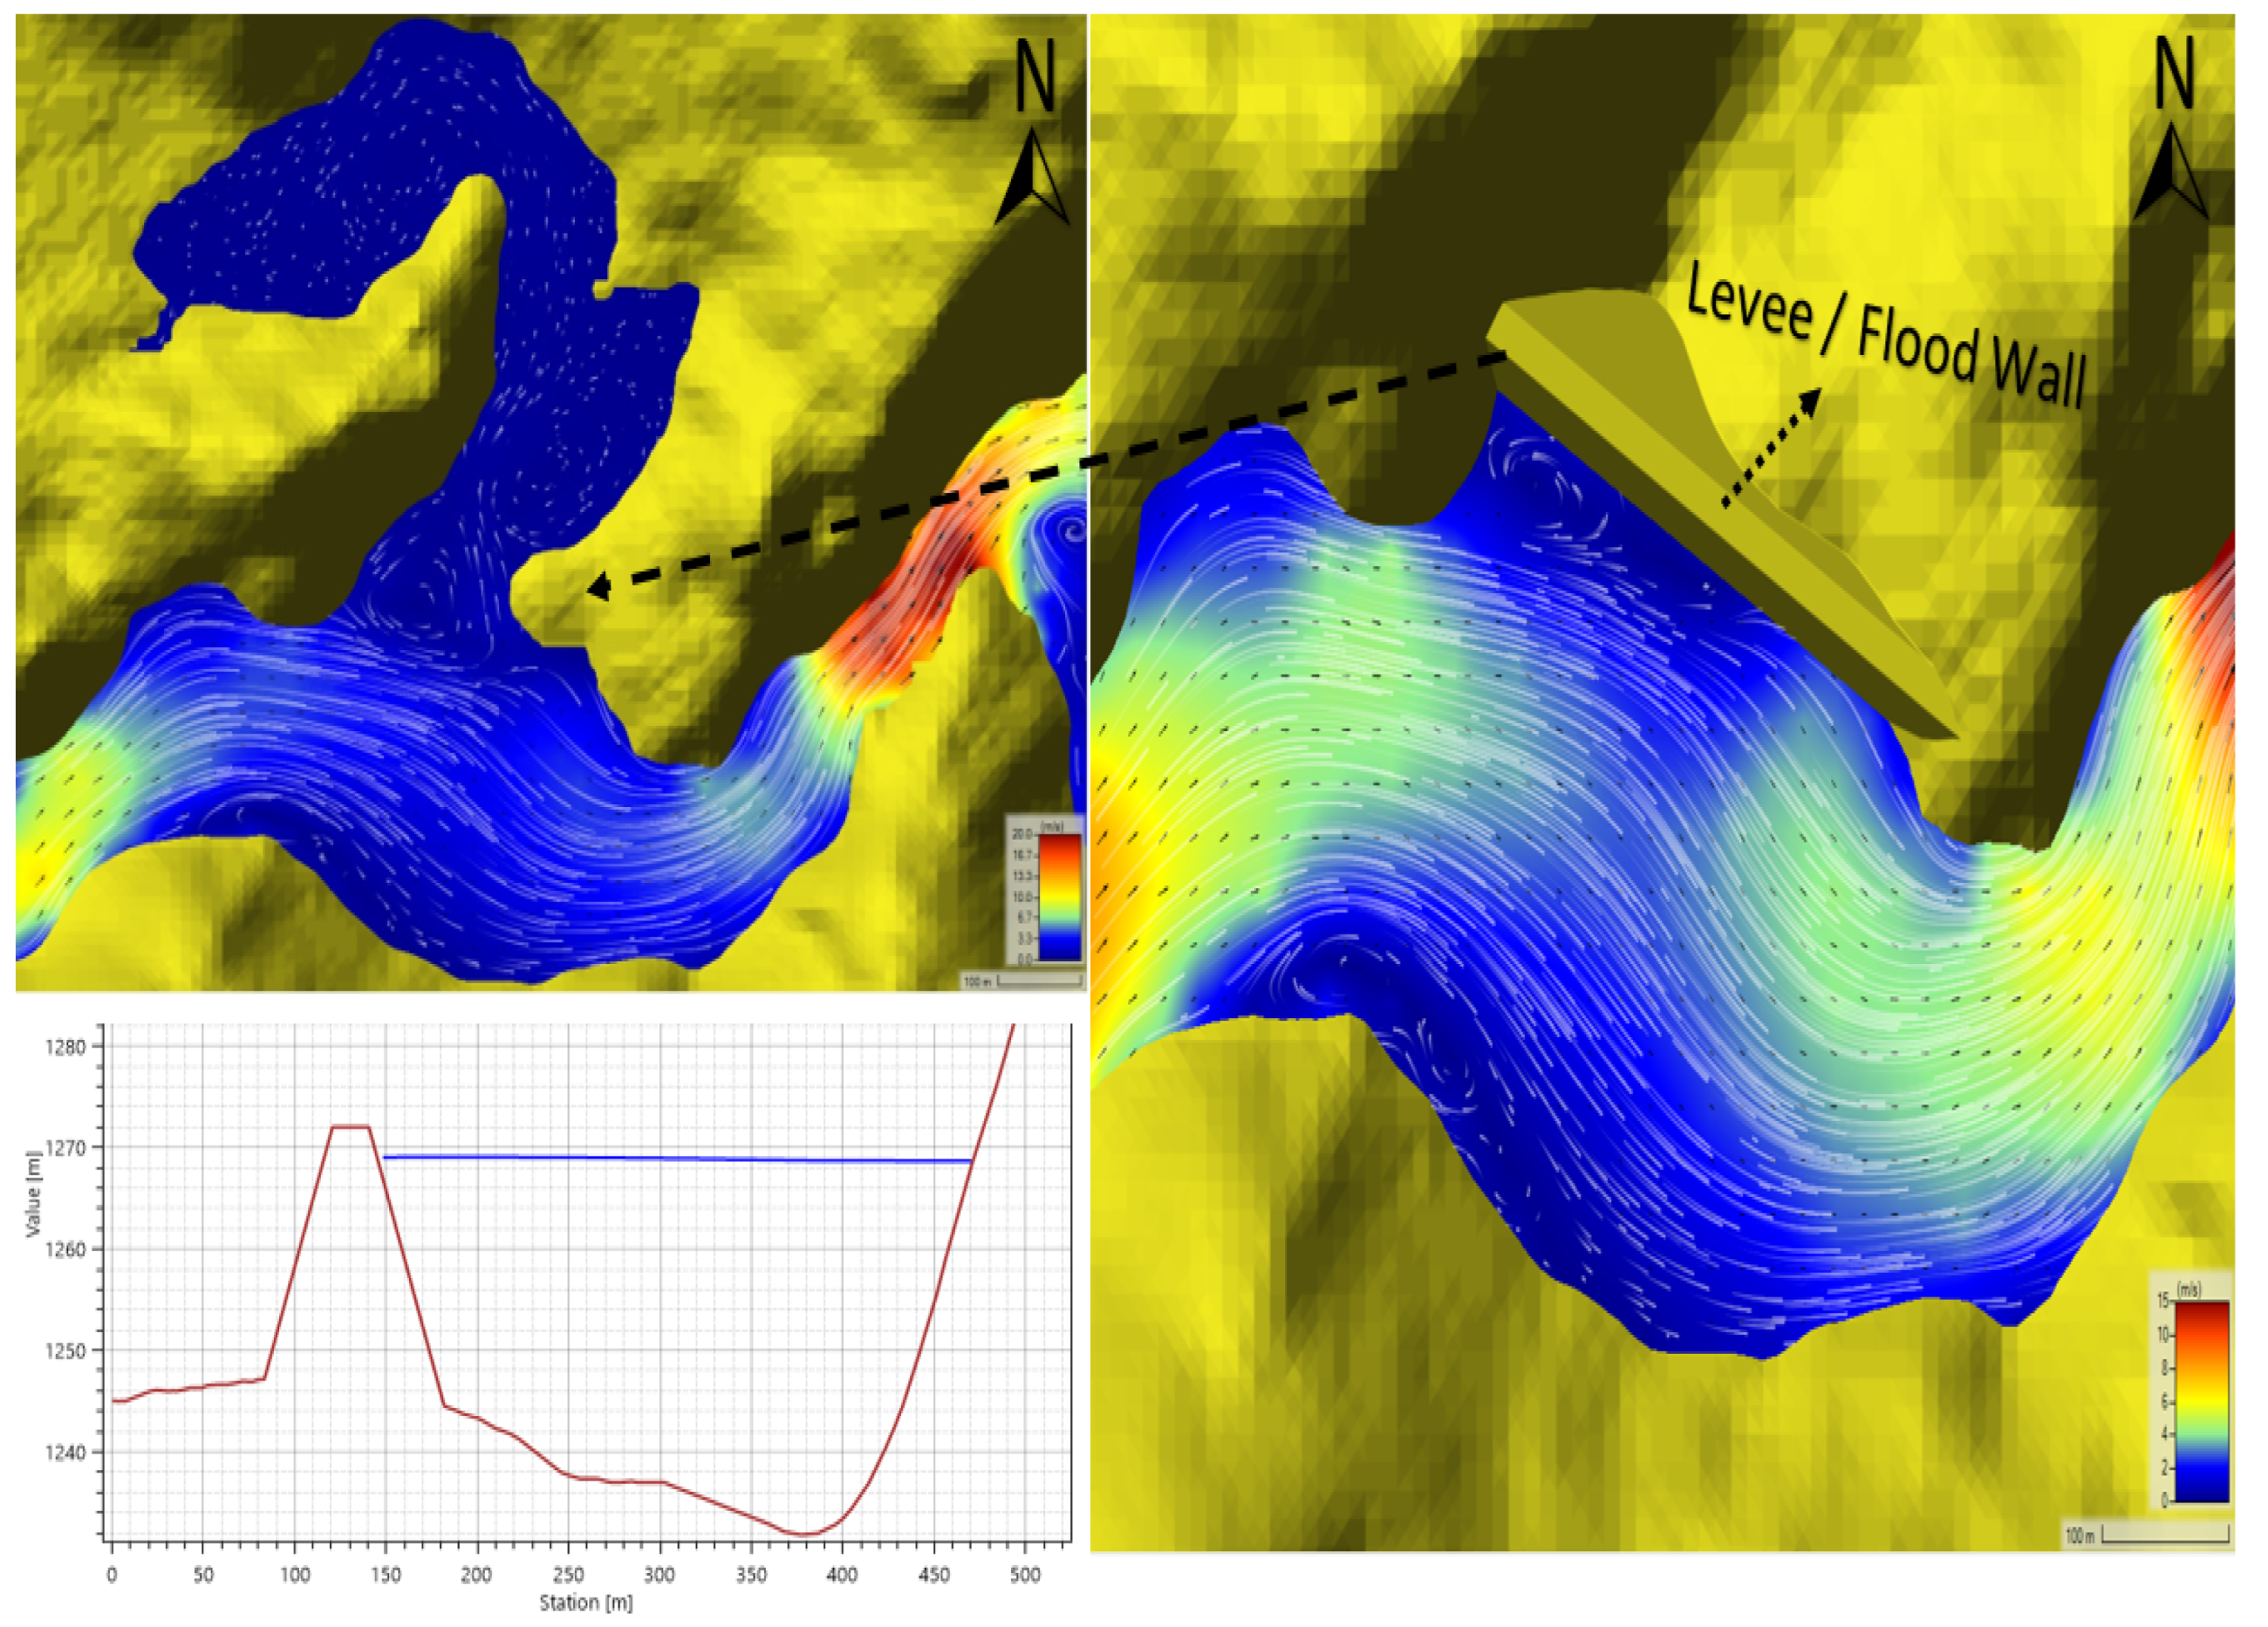
Figure 24. Construction of Levee / Flood wall for the flood protection
Preprints 89378 g024
In order to protect the most affected towns of Ranche, Nagmar, Khanikhet, and Debalta with a higher number of households, the construction of a Levee / Flood wall along the river has been suggested.
Table 10. Earth fill levee geometry
Height 23m
Length 375m
Crest width 8m
Side slope 1:1.5
The river diversion works along the river help to prevent the towns from flooding, Figure 24. This implies the necessity of a Levee / Floodwall along the Kulekhani River in case of a dam breach to prevent towns from flooding. Most of the households could be protected after the construction of the Levee, excluding 11 houses that lie below the maximum inundation elevation of 1269.6 m.a.s.l along the river. Therefore, proper river flood management along the Kulekhani River is needed to prevent the devastating effects of floods on human settlements in flood-prone areas through restricted zones.

4. Conclusion and Recommendation

- The suitable regression breach model of MacDonald and Langridge (1984) for the Kulekhani reservoir dam shows promising results against the validated hydrograph empirical equation suggested by Zenz, G. (2015) [20]. The hydrograph method empirical equation in relation to the time of breach and volume of the reservoir shows a good linear correlation against the sixteen observed dam failure peaks. The simulated downstream peak was found to be more or less similar to the peak obtained through the empirical hydrograph equation with an acceptable 2.5 percent error for large flood discharge.
-The Diffusion Wave Equation was not able to capture the effect of meandering resulting in false flow velocity at the outer bend of the river due to the unrealistic physical flow phenomena neglecting the formation of eddies and convection losses, while the Full Dynamic Wave Equation was able to capture the physical flow phenomena like eddies, higher flow velocity to the outer bend considering centripetal force. The results have shown Full Dynamic Equation is more suitable for a rapidly varied flow than the Diffusion Wave Equation considering steep slopes, sudden change in geometry, and meandering effect.
-All the major twelve towns along the river were affected by the breach flood till the confluence of the Bagmati River. A higher number of households in Ranche, Nagmar, Khanikhet, and Debaltar were affected by "Low-Medium" and "High" hazards, and the rest of the town was found to be extremely vulnerable as flood intensity was above 3 m 2 / s , according to the flood hazard classification guideline of ASCE. The flood flow depth mapping using the Diffusion Wave Equation has shown that the less number of households are affected due to less flow depth compared to the Full Dynamic Wave Equation. There was almost a 17-minute difference in the time of peak between the two models at the confluence of the Bagmati River considering river channel cross-section IV, Figure 12. The arrival time of a flood plays a crucial role in flood early warning systems to safely evacuate the place. Therefore, it is very important to understand the limitations and capabilities of models to solve the specific problem.
-Mitigation measure, construction of Levee for river diversion was modeled to prevent flooding at Ranche, Nagmar, Khanikhet, and Debaltar towns which prevent the town from flooding due to dam breach. The flood flow extension was prevented in the town, except for eleven houses below the maximum flood level of 1269.6 m.a.s.l which lies along the river. The room for the rivers with restricted zones of floodplain for human settlement should be implemented for safety purposes along the Kulekhani River.
-Future works, a higher resolution Digital Elevation Model using drone survey, detailed field study for identifying varying roughness along the river reach till the Bagmati River confluence, implementation of the hydraulics structures such as bridges, coupling model with sediment and debris flow due to dam breach to identify the river morphological changes which influence the peak of the flood might be studied further in detail.
Author Contributions

Pandey, B.:Writing, and editing; Knoblauch, H: Review and editing; Zenz, G: Review and editing. All authors have read and agreed to the published version of the article.

Funding

This research received no external findings.

Data Availability Statement

The data presented in this study are available on request from the corresponding author. Some data are retrieved from open-source platforms while others are not publicly available due to data confidentiality.

Conflicts of Interest

The authors declare no conflicts of interest.

References

  1. Fahlbusch, H. Early dams. Proceedings of the Institution of Civil Engineers-Engineering History and Heritage 2009, 162, 13–18. [Google Scholar] [CrossRef]
  2. El-khateeb, M.; Abu-Dalo, M.; Salih, K.A.; Ayadi, H.; Choura, M. Environmental assessment of the surface sediment in the artificial lake at Jordan University of Science and Technology as a route to sustainable aquaculture. Arabian Journal of Geosciences 2023, 16, 552. [Google Scholar] [CrossRef]
  3. Alcamo, J.; Henrichs, T.; Rosch, T.; others. World water in 2025. World water series report 2000, 2.
  4. Ologunorisa, T.; Abawua, M. Flood risk assessment: a review. Journal of Applied Sciences and Environmental Management 2005, 9, 57–63. [Google Scholar]
  5. Williams, L.L. “The Dam is Becoming Dangerous and May Possibly Go”: The Paleodemography and Political Economy of the Johnstown Flood of 1889. The political economy of hazards and disasters 2009, pp. 31–58.
  6. Kaktins, U.; Davis Todd, C.; Wojno, S.; Coleman, N. Revisiting the timing and events leading to and causing the Johnstown flood of 1889. Pennsylvania History 2013, 80, 335–363. [Google Scholar] [CrossRef]
  7. Petrocelli, C. Stability of the vajont dam: the precision calculations of the Ferranti Mark I. ACM SIGCAS Computers and Society 2022, 50, 9–9. [Google Scholar] [CrossRef]
  8. McDonald, D.J. The Teton Dam Disaster; Arcadia Publishing, 2006.
  9. Si, Y. The world’s most catastrophic dam failures: The August 1975 collapse of the Banqiao and Shimantan dams 2016. pp. 25–38.
  10. Sharma, R.; Kumar, A. Case histories of earthen dam failures 2013.
  11. Boudou, M.; Moatty, A.; Lang, M. Analysis of major flood events: Collapse of the Malpasset Dam, December 1959 2017. pp. 3–19.
  12. Zhang, L.; Xu, Y.; Jia, J. Analysis of earth dam failures: A database approach. Georisk 2009, 3, 184–189. [Google Scholar] [CrossRef]
  13. Wilson, S.; Seed, H.; Peck, R. Arthur Casagrande, 1902–1981 a tribute. Géotechnique 1982, 32, 87–94. [Google Scholar] [CrossRef]
  14. Miedema, D. Selected Case Histories of Dam Failures and Accidents Caused.
  15. Hager, W.H. Fascinations of hydraulic research. Journal of Hydraulic Research 1998, 36, 3–18. [Google Scholar] [CrossRef]
  16. Vaskinn, K.A.; Løvoll, A.; Höeg, K.; Morris, M.; Hanson, G.; Hassan, M. Physical modeling of breach formation: Large scale field tests. Proceedings of Dam Safety 2004, pp. 1–16.
  17. Kouzehgar, K.; Hassanzadeh, Y.; Eslamian, S.; Yousefzadeh Fard, M.; Babaeian Amini, A. Physical modeling into outflow hydrographs and breach characteristics of homogeneous earthfill dams failure due to overtopping. Journal of Mountain Science 2021, 18, 462–481. [Google Scholar] [CrossRef]
  18. Ashraf, M.; Soliman, A.H.; El-Ghorab, E.; El Zawahry, A. Assessment of embankment dams breaching using large scale physical modeling and statistical methods. Water Science 2018, 32, 362–379. [Google Scholar] [CrossRef]
  19. Sammen, S.S.; Mohamed, T.; Ghazali, A.; Sidek, L.; El-Shafie, A. An evaluation of existent methods for estimation of embankment dam breach parameters. Springer, 2017, Vol. 87, pp. 545–566. [CrossRef]
  20. Saberi, O.; Zenz, G. Empirical relationship for calculate outflow hydrograph of embankment dam failure due to overtopping flow. Technical Report 3, 2015.
  21. Pilotti, M.; Milanesi, L.; Bacchi, V.; Tomirotti, M.; Maranzoni, A. Dam-break wave propagation in alpine valley with HEC-RAS 2D: experimental cancano test case; American Society of Civil Engineers, 2020; Vol. 146, p. 05020003.
  22. Bellos, V.; Tsakiris, V.K.; Kopsiaftis, G.; Tsakiris, G. Propagating dam breach parametric uncertainty in a river reach using the HEC-RAS software. Hydrology 2020, 7, 72.
  23. Albu, L.M.; Enea, A.; Iosub, M.; Breabăn, I.G. Dam breach size comparison for flood simulations. A HEC-RAS based, GIS approach for Drăcșani Lake, Sitna River, Romania.
  24. Yilmaz, K.; Darama, Y.; Oruc, Y.; Melek, A.B. Assessment of flood hazards due to overtopping and piping in Dalaman Akköprü Dam, employing both shallow water flow and diffusive wave equations. Natural Hazards 2023, 117, 979–1003. [Google Scholar] [CrossRef]
  25. Costabile, P.; Costanzo, C.; Macchione, F. Performances and limitations of the diffusive approximation of the 2-d shallow water equations for flood simulation in urban and rural areas. Applied Numerical Mathematics 2017, 116, 141–156. [Google Scholar] [CrossRef]
  26. Authority, N.E. 12th Issues Generation Magazine, 2020.
  27. UN. Kulekhani Dam break study 2012.
  28. Shrestha, H.S. Sedimentation and sediment handling in Himalayan reservoirs; Norges teknisk-naturvitenskapelige universitet, Fakultet for …, 2012.
  29. Alcrudo, F.; Mulet, J. Description of the Tous Dam break case study (Spain). Journal of Hydraulic Research 2007, 45, 45–57. [Google Scholar] [CrossRef]
  30. Wahl, T.L. Uncertainty of predictions of embankment dam breach parameters. Journal of hydraulic engineering 2004, 130, 389–397. [Google Scholar] [CrossRef]
  31. Brunner, G.W. HEC-RAS River Analysis System: Hydraulic Reference Manual, Version 6.3. US Army Corps of Engineers–Hydrologic Engineering Center 2023, 547. [Google Scholar]
  32. Ponce, V.M.; Jiang, S. DOCUMENTED CASES OF EARTH DAM BREACHES 1956.
  33. MacDonald, T.C.; Langridge-Monopolis, J. Breaching characteristics of dam failures. Journal of Hydraulic Engineering 1984, 110, 567–586. [Google Scholar] [CrossRef]
  34. TheUniversityOfAlaskaFairbanks. Alaska Satellite Facility 2023.
  35. ArcGIS. Esri Land Cover 2023.
  36. Te Chow, V. OPEN-CHANNEL HYDRAULICS, 1959.
  37. Dellar, P.J.; Salmon, R. Shallow water equations with a complete Coriolis force and topography. Physics of fluids 2005, 17. [Google Scholar] [CrossRef]
  38. Aureli, F.; Maranzoni, A.; Mignosa, P. ; others. Two-dimensional modeling of rapidly varying flows by finite volume schemes. River Flow, 2004, Vol. 2004, pp. 837–847.
  39. Park, S.W.; Ahn, J. Experimental and numerical investigations of primary flow patterns and mixing in laboratory meandering channel. Smart Water 2019, 4, 1–15. [Google Scholar] [CrossRef]
  40. Kian, R.; Horrillo, J.; Zaytsev, A.; Yalciner, A.C. Capturing physical dispersion using a nonlinear shallow water model. Journal of Marine Science and Engineering 2018, 6, 84. [Google Scholar] [CrossRef]
  41. ASCE. Flood resistant design and construction. Am Soc Civil Eng, 2014.
  42. (MCADD), M. Topo map of Nepal, 2023.
Disclaimer/Publisher’s Note: The statements, opinions and data contained in all publications are solely those of the individual author(s) and contributor(s) and not of MDPI and/or the editor(s). MDPI and/or the editor(s) disclaim responsibility for any injury to people or property resulting from any ideas, methods, instructions or products referred to in the content.
Copyright: This open access article is published under a Creative Commons CC BY 4.0 license, which permit the free download, distribution, and reuse, provided that the author and preprint are cited in any reuse.
Prerpints.org logo

Preprints.org is a free preprint server supported by MDPI in Basel, Switzerland.

Subscribe

© 2024 MDPI (Basel, Switzerland) unless otherwise stated