Preprint
Article

Implication of Galectin-3 for Neuroinflammation in the Visual Pathway of the Experimental Optic Neuritis

Altmetrics

Downloads

96

Views

31

Comments

0

Submitted:

01 November 2023

Posted:

01 November 2023

You are already at the latest version

Alerts
Abstract
Although multiple sclerosis (MS) is an inflammatory demyelinating disease of the central nervous system (CNS) that results in many neurological disabilities, optic neuritis (ON) is developed in some MS patients. However, the molecular mechanism of ON remains unknown. Galectins, β-galactoside-binding lectins, are involved in various pathophysiology. We have previously shown that galectin-3 (gal-3) is associated with the pathogenesis of experimental autoimmune encephalomyelitis (EAE), its animal model for human MS. In the current study, the expression of gal-3 was explored in the visual pathway of the EAE mice to clarify the pathogenesis of ON. Immunohistochemical analysis demonstrated that expression of gal-3 was increased in the visual pathway of the EAE mice during the peak disease, compared with naïve and EAE mice during the chronic disease. Expression of gal-3 was observed in mainly microglia/macrophages and astrocytes in the visual pathway of the EAE mice. In addition, gal-3+Iba-1+ cells with the phagocytic activities reflected by immunostaining with cathepsin-D were accumulated at demyelinating lesions in the visual pathway during peak disease of EAE. Moreover, NLRP3 expression was also detected in most gal-3+Iba-1+ cells. These results indicate a considerable possibility that gal-3 regulates the NLRP3 signaling in microglia/macrophages, followed by neuroinflammatory demyelination in ON. By contrast, astrocytic expression of gal-3 was also observed from the peak to the chronic disease. Taken together, the current study suggests a critical role of gal-3 in the pathogenesis of ON and proposes gal-3 in glial cells as a potential therapeutic target for ON.
Keywords: 
Subject: Medicine and Pharmacology  -   Neuroscience and Neurology

1. Introduction

Multiple Sclerosis (MS) is an immune-mediated demyelinating disease of the central nervous system (CNS) [1,2]. Besides MS, optic neuritis (ON) is also an inflammatory demyelinating disease of the optic nerve that is highly associated with MS. ON can be the first indication and the most common symptom of MS [3]. About 50% of people who have MS will develop ON. It’s also linked to neuromyelitis optica (NMO) or Devic’s disease [4]. The most common cause of ON is inflammatory demyelination of the optic nerve [5]. However, there is no clear reason why the optic nerve is suddenly inflamed by the immune attack.
Experimental autoimmune encephalomyelitis (EAE) is the most intensively investigated experimental animal model of the human inflammatory demyelinating disease such as MS [6,7,8]. Since EAE has some aspects of the pathogenesis of MS and its related diseases likely to ON and NMO, EAE can be applied to a disease model of ON [9,10]. In fact, accumulating evidence suggests that EAE induces significant retinal ganglion cell (RGC) loss [11,12,13]. Interestingly, Quinn et al. have previously reported that RGC loss was observed in EAE eyes. In addition, RGC loss occurred more than 25 days after immunization to induce EAE [11]. These observations indicate that EAE develops ON with the relatively slow degeneration of RGCs. However, the molecular mechanism of developing ON in EAE/human MS remains still unknown.
Galectins, a β-galactosidase lectin consisting of 15 members in mammals, recognize β-linked galactose (Gal), such as N-acetyllactosamine (LacNAc), consisting of Gal β1-3/4 linked to N-acetylglucosamine (GlcNAc), in cell surface glycoproteins and glycolipids, as well as proteoglycans in the extracellular matrix. Among the family members, galectin-3 (gal-3) is expressed in the CNS and regulates various physiological and pathological events [14]. A previous report has shown that auto-antibodies against gal-3 are present in sera of patients with secondary progressive MS and contribute to the persistent BBB breakdown [15]. It has been supposed that the role of gal-3 is controversial in demyelinating animal models [16]. However, gal-3 knockout mice developed a significantly milder EAE and exhibited less inflammatory infiltrates in the spinal cord and a reduction of demyelination during EAE [17]. In addition, the cuprizone-induced CNS demyelination model exhibited that pro-inflammatory cytokines such as TNF-α were not increased in gal-3 knockout mice. In the diabetic model, gal-3 knockout mice also reduced neuroinflammation by decreasing the number of Iba-1-positive cells in the optic nerve [18]. Besides this evidence, our previous report has demonstrated that gal-3 is expressed on activated microglia in the spinal cord, infiltrating macrophages in the spinal parenchyma and pia mater and Schwann cells in the ventral nerve roots in EAE [16]. It was also briefly noted that gal-3 was expressed in F4/80(+) macrophages/microglia during EAE [19,20]. While accumulating evidence indicates a considerable possibility that gal-3 is involved in neuroinflammation during the EAE and ON pathogenesis, little is known about the association of gal-3 with EAE-induced ON.
In the current study, the expression and distribution of gal-3 were explored in the visual pathway during EAE. Our finding emerged the timing and distribution of gal-3 expression in the visual pathway in the acute and chronic phase of EAE-induced ON.

2. Material and Methods

2.1. Animals

Adult female C57BL/6J mice (6-8 weeks old) were purchased from SLC (Shizuoka, Japan) and used in all experiments. The experimental procedure was approved by the Institutional Committee for Experimental Animals (#a-1-0294, Akita University, Japan).

2.2. EAE Induction

EAE induction was performed as previously described [6,21,22]. In brief, myelin protein peptide including MOG35-55 (MEVGWYRSPFSRVVHLYRNGK) was synthesized (Scrum, Tokyo, Japan). Mice were immunized s.c. in the flank with the emulsion made of 75μL of complete Freund’s adjuvant (Sigma Aldrich, St. Louis, MO, USA) containing 0.4mg of heat-inactivated Mycobacterium tuberculosis (H37Ra; BD/Difco Laboratories, Franklin Lakes, NJ, USA). Each animal also received 200ng of pertussis toxin (Sigma Aldrich, St. Louis, MO, USA) through i.p. induction on days 0 and 2 post-immunization. EAE clinical score was recorded as described previously [6,21,22].

2.3. Immunohistochemistry

Animals under deep anesthesia were sacrificed and perfused with normal saline followed by 4% paraformaldehyde (PFA) in 0.1M phosphate buffer (PB) [6,9,21,22,23]. The brain including the optic nerve, optic chiasm, and the optic tract was removed and immersed in 30% sucrose in PBS (-) for 1-2 days. Tissues were then frozen in OCT medium. Frozen longitudinal 20 μm sections were prepared on a cryostat (Leica 3050; Leica, Germany), and then stored at -30℃ until use. In some experiments, the sections were stained with Fluoromyelin Red (FM; a lipophilic stain for compact myelin, Molecular Probes/Invitrogen/ThermoFischer scientific, Eugene, OR, USA) to assess demyelination as described previously [6,23]. For immunohistochemistry, sections were pretreated with blocking solution including 5% albumin, 2% normal goat serum, and 0.3% tritonX-100 for 30 min at room temperature (RT) [6,9,21,22,23]. Sections were then incubated with primary antibodies overnight at 4℃. In the current study, the following antibodies were used as primary antibodies: anti-galectin-3 antibody (1:200, Santacruz biotechnologies, Dallas, TX, USA), anti-Iba-1 polyclonal antibody (1:2000, WAKO, Osaka, Japan), anti-Iba-1 monoclonal antibody (1:200, WAKO, Osaka, Japan), anti-GFAP antibody (1:2000, Sigma Aldrich, St. Louis, MO, USA), anti-Cathepsin-D antibody (1:200, R&D Systems, Minneapolis, MN, USA), anti-NLR family, pyrin domain containing 3 (NLRP3) antibody (1:1000, adipogen life sciences, Switzerland). After washing the sections with PBS (-), the sections were incubated with a mixture of appropriate sets of secondary antibodies (Alexa Fluoro; Molecular Probes/Invitrogen/Thermo Fisher Scientific, Eugene, OR, USA) for 90 min at RT. For most double immunofluorescence, DAPI-Fluoromount-G (SouthernBiotech, Birmingham, AL, USA) was used as a mounting medium. The sections were further analyzed with a confocal laser microscope (LSM-780 and LSM-510; Carl Zeiss, Germany) or a fluorescence microscope (BZ-X800; Keyence, Tokyo, Japan).

2.4. Immunoblotting

Animals under deep anesthesia were sacrificed and perfused with normal saline [6,9,21,22,23]. The optic nerve, chiasm, and tract were taken out of the brain. Tissues were then lysed in cell lysis buffer (Cell lytic M lysis buffer; Sigma Aldrich, St. Louis, MO, USA). After determination of the protein concentration (DC protein assay kit; Bio-Rad laboratories, Hercules, CA, USA), 6µg of protein extract was separated by 15% sodium dodecyl sulfate-polyacrylamide gel electrophoresis (SDS-PAGE), transferred to PVDF paper (Millipore, Darmstadt, Germany) and immunostained with either anti-gal-3 antibody (1:500, Santacruz biotechnologies, Dallas, TX, USA) or anti-GAPDH antibody (1:5000, Sigma Aldrich, St. Louis, MO, USA). HRP-conjugated secondary antibodies (GE Healthcare Systems, Sunnyvale, CA, USA) were suitably used followed by ECL chemiluminescence development (GE Healthcare Systems, Sunnyvale, CA, USA). Chemiluminescence was detected using a Luminoimage Analyzer system (ChemiDoc Touch MP; Bio-Rad Hercules, CA, USA).

2.5. Statistical Analysis

Three to nine animals per group were used in most experiments except for specific explanations. For histochemical analysis, sections obtained from more than three animals per group were used for analysis. The sections were randomly chosen and analyzed using Image J software (National Institute of Health, USA). All data are presented as mean + SEM. Pairwise comparisons were analyzed using Unpaired t-tests, and multiple comparisons were analyzed using one-way ANOVA followed by Bonferroni tests. P<0.05 was considered statistically significant [6,9,21,22,23].

3. Results

3.1. EAE Induces Inflammation in the Visual Pathway

Female C57BL/6J mice (Six to eight-week-old) were immunized with MOG35-55 peptide to induce EAE (MOG-EAE). These mice showed typical symptoms such as hindlimb paralysis, likely to reach the acute phase (peak disease) at days 16-20 and the chronic phase at days 38-41 days after MOG immunization [6,21,22]. Compared to naive mice (Figure 1A), DAPI staining clearly demonstrated that EAE developed inflammation during the peak disease in the visual pathway including the optic nerve (Figure 1B, square labeled 1), optic chiasm (Figure 1B, square labeled 2), and optic tract (Figure 1B, square labeled 3). In addition, MOG-EAE induced mainly meningeal inflammation of the pia matter in the visual pathway (Figure 1B). This observation indicates the possibility of gliosis and infiltration of peripheral immune cells into the visual pathway, resulting in association of meningeal inflammation with demyelination and neurodegeneration in ON induced by MOG-EAE (MOG-induced ON).

3.2. MOG-EAE Induces gal-3 Expression in Microglia and Macrophages in the Visual Pathway.

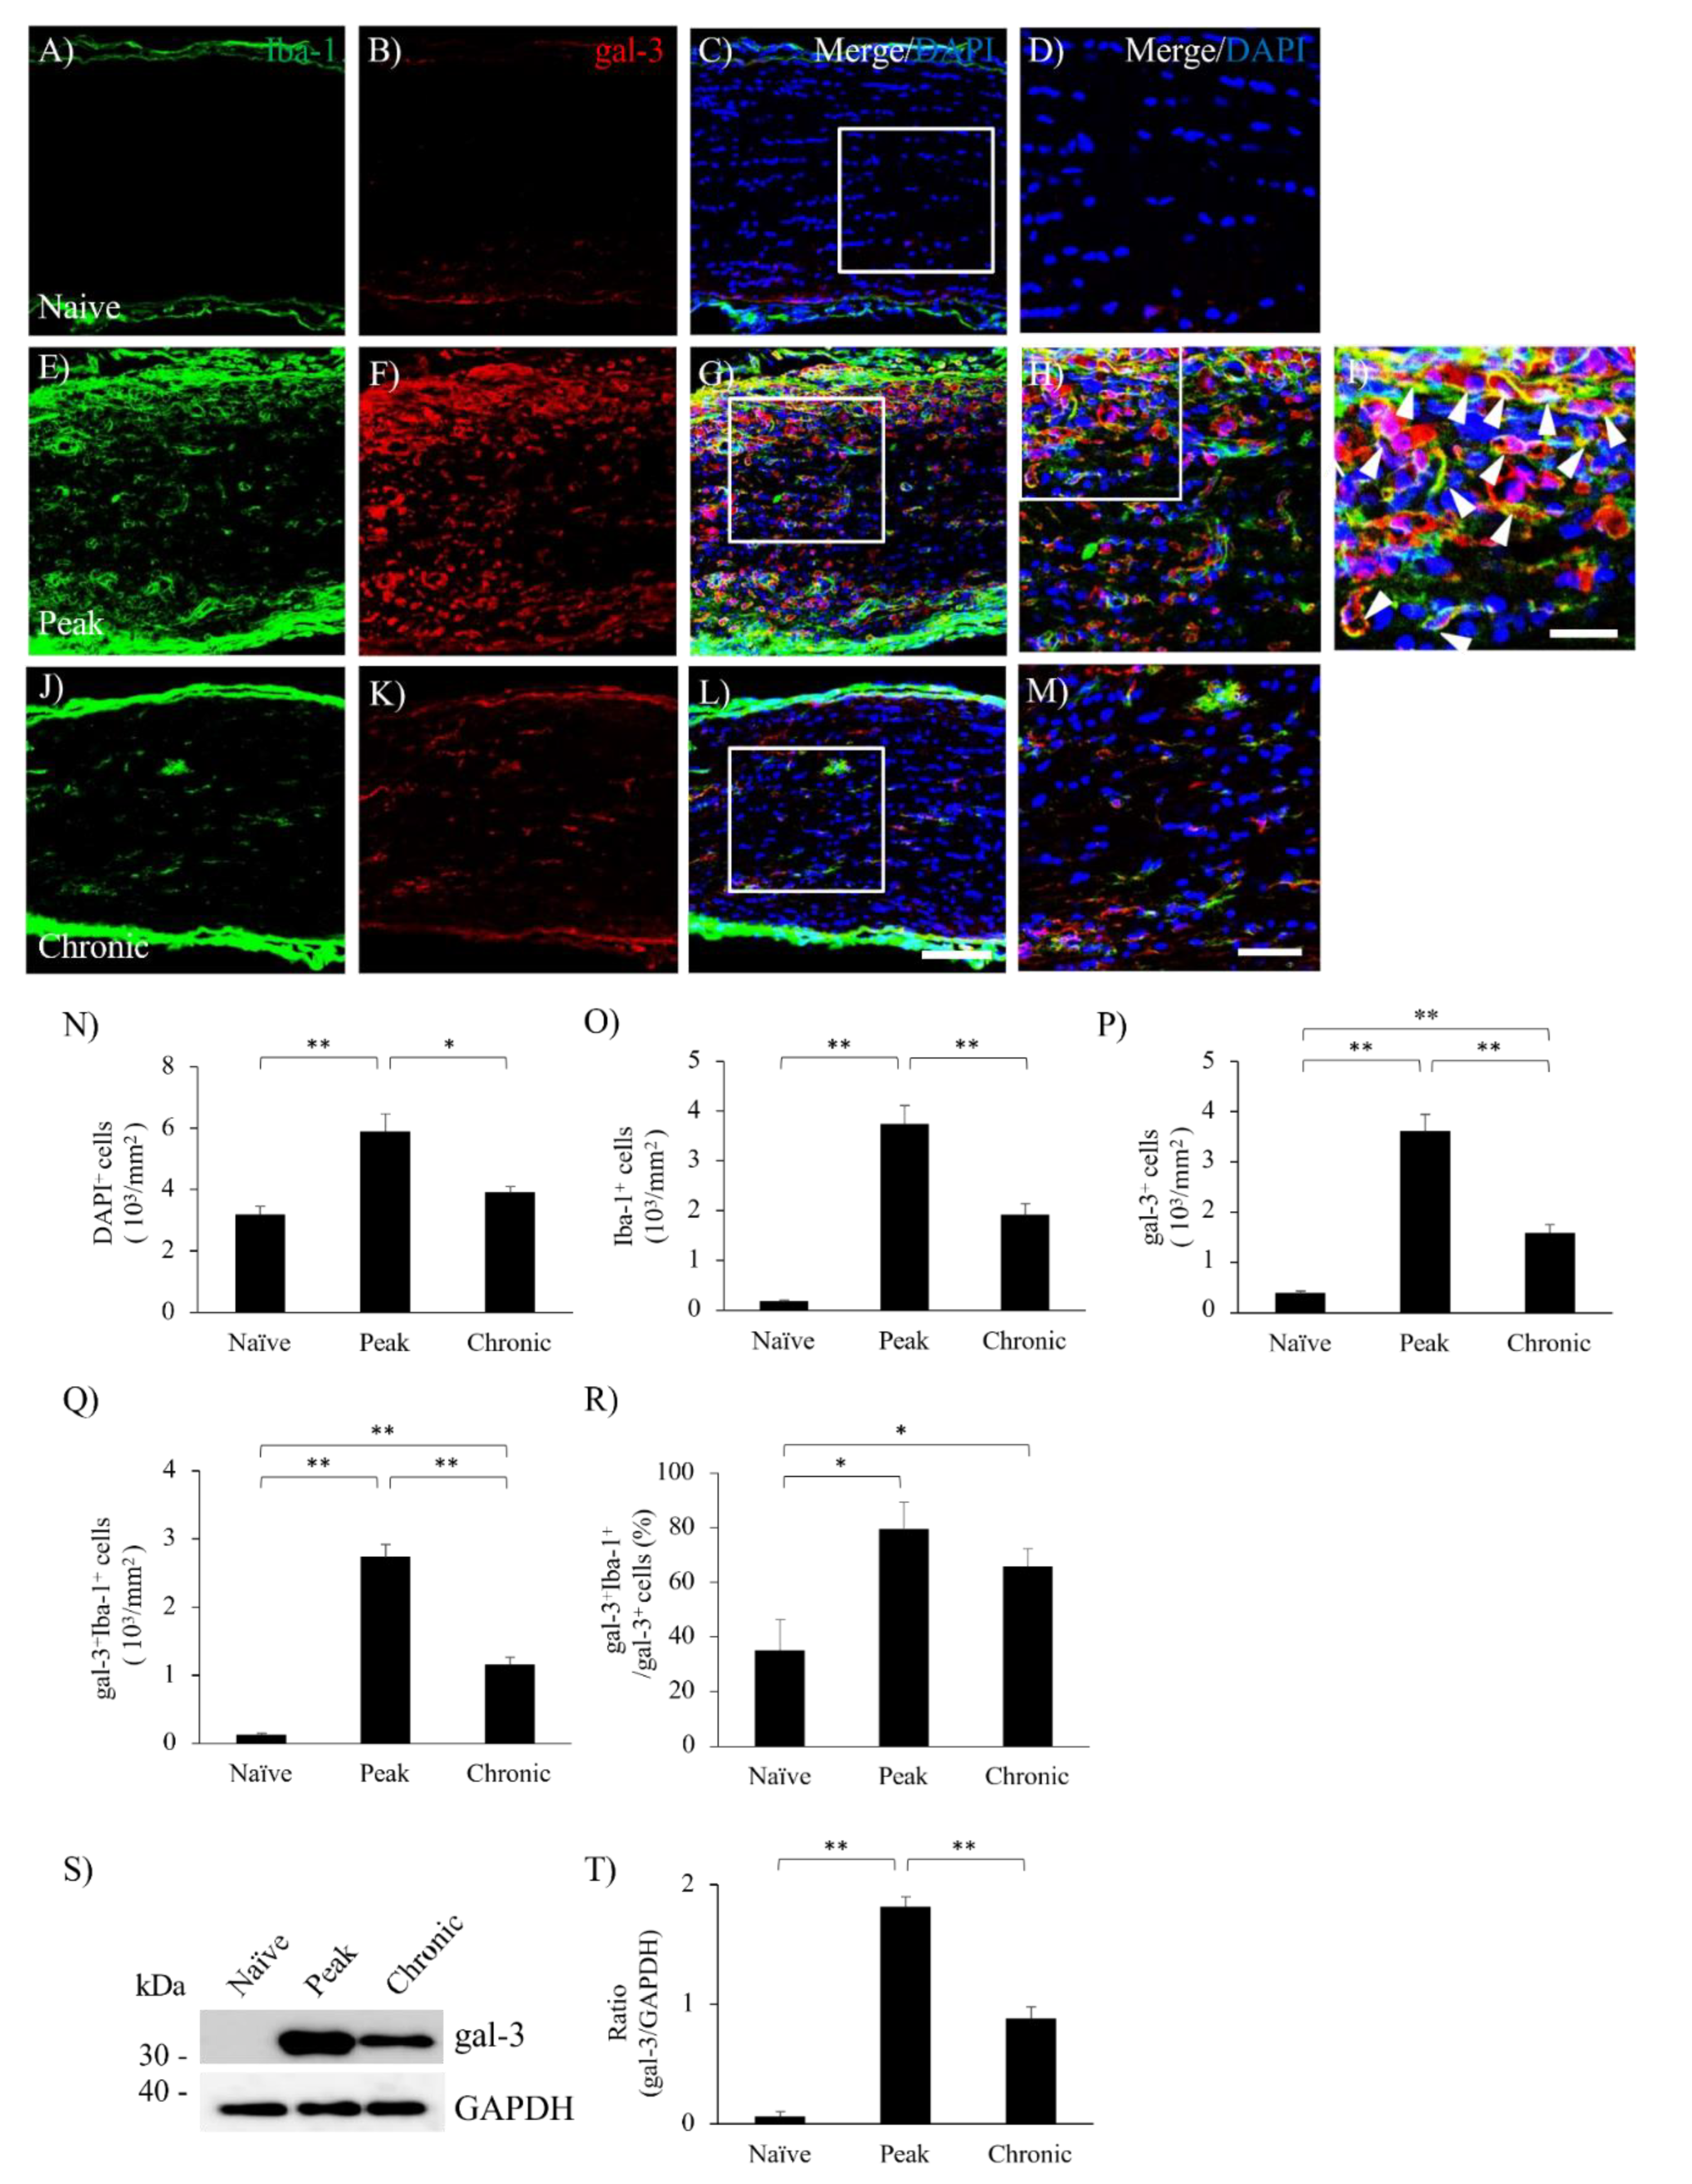
Our previous study has demonstrated that the adaptive transfer model of EAE induces gal-3 expression in activated microglia/macrophages in the white matter of the spinal cord [16]. To identify whether gal-3 expression in MOG-induced ON, the gal-3 expressing cells were investigated during disease progression in the visual pathway exposed to MOG-induced ON. Anti-Iba-1 antibody was used for a marker of both microglia and infiltrating peripheral macrophages into the CNS. As shown in Figure 1B, the cell number of DAPI-positive (DAPI+) cells in the optic nerve was significantly increased at the peak disease (Figure 2N). Besides this observation, the cell number of Iba-1+ microglia/macrophages was dramatically increased in the optic nerve during the peak disease (Figure 2E,O), compared with naïve mice (Figure 2A,O). Consistent with these observations, naïve mice had little expression of gal-3 in the optic nerve due to a possibility of below detection sensitivity (Figure 2B,P). On the other hand, the number of gal-3+ cells also increased during the peak disease (Figure 2F,P). Further analysis demonstrated that about 80% of Iba-1+ microglia/macrophages expressed gal-3 (Figure 2H–I and Figure 2Q–R). Even though at 42 days after MOG immunization which is the chronic disease phase, about 65% of Iba-1+ microglia/macrophages expressed gal-3 (Figure 2J–M and Figure 2Q–R). Immunoblot analysis also showed that the expression level of gal-3 was significantly increased during the peak disease compared to naïve mice (Figure 2S–T). These results indicate that the expression of gal-3 in microglia/macrophages is associated with the pathogenesis in the optic nerve with EAE-induced neuroinflammation. Similar results were basically observed in the optic chiasm (Figure 1B, square labeled 2 and Figure S1) and the optic tract (Figure 1B, square labeled 3 and Figure S2). Therefore, the gal-3 expression in the optic nerve as the representative result was further shown in the current study.

3.3. Astrocytic Expression of gal-3 in the Optic Nerve during EAE

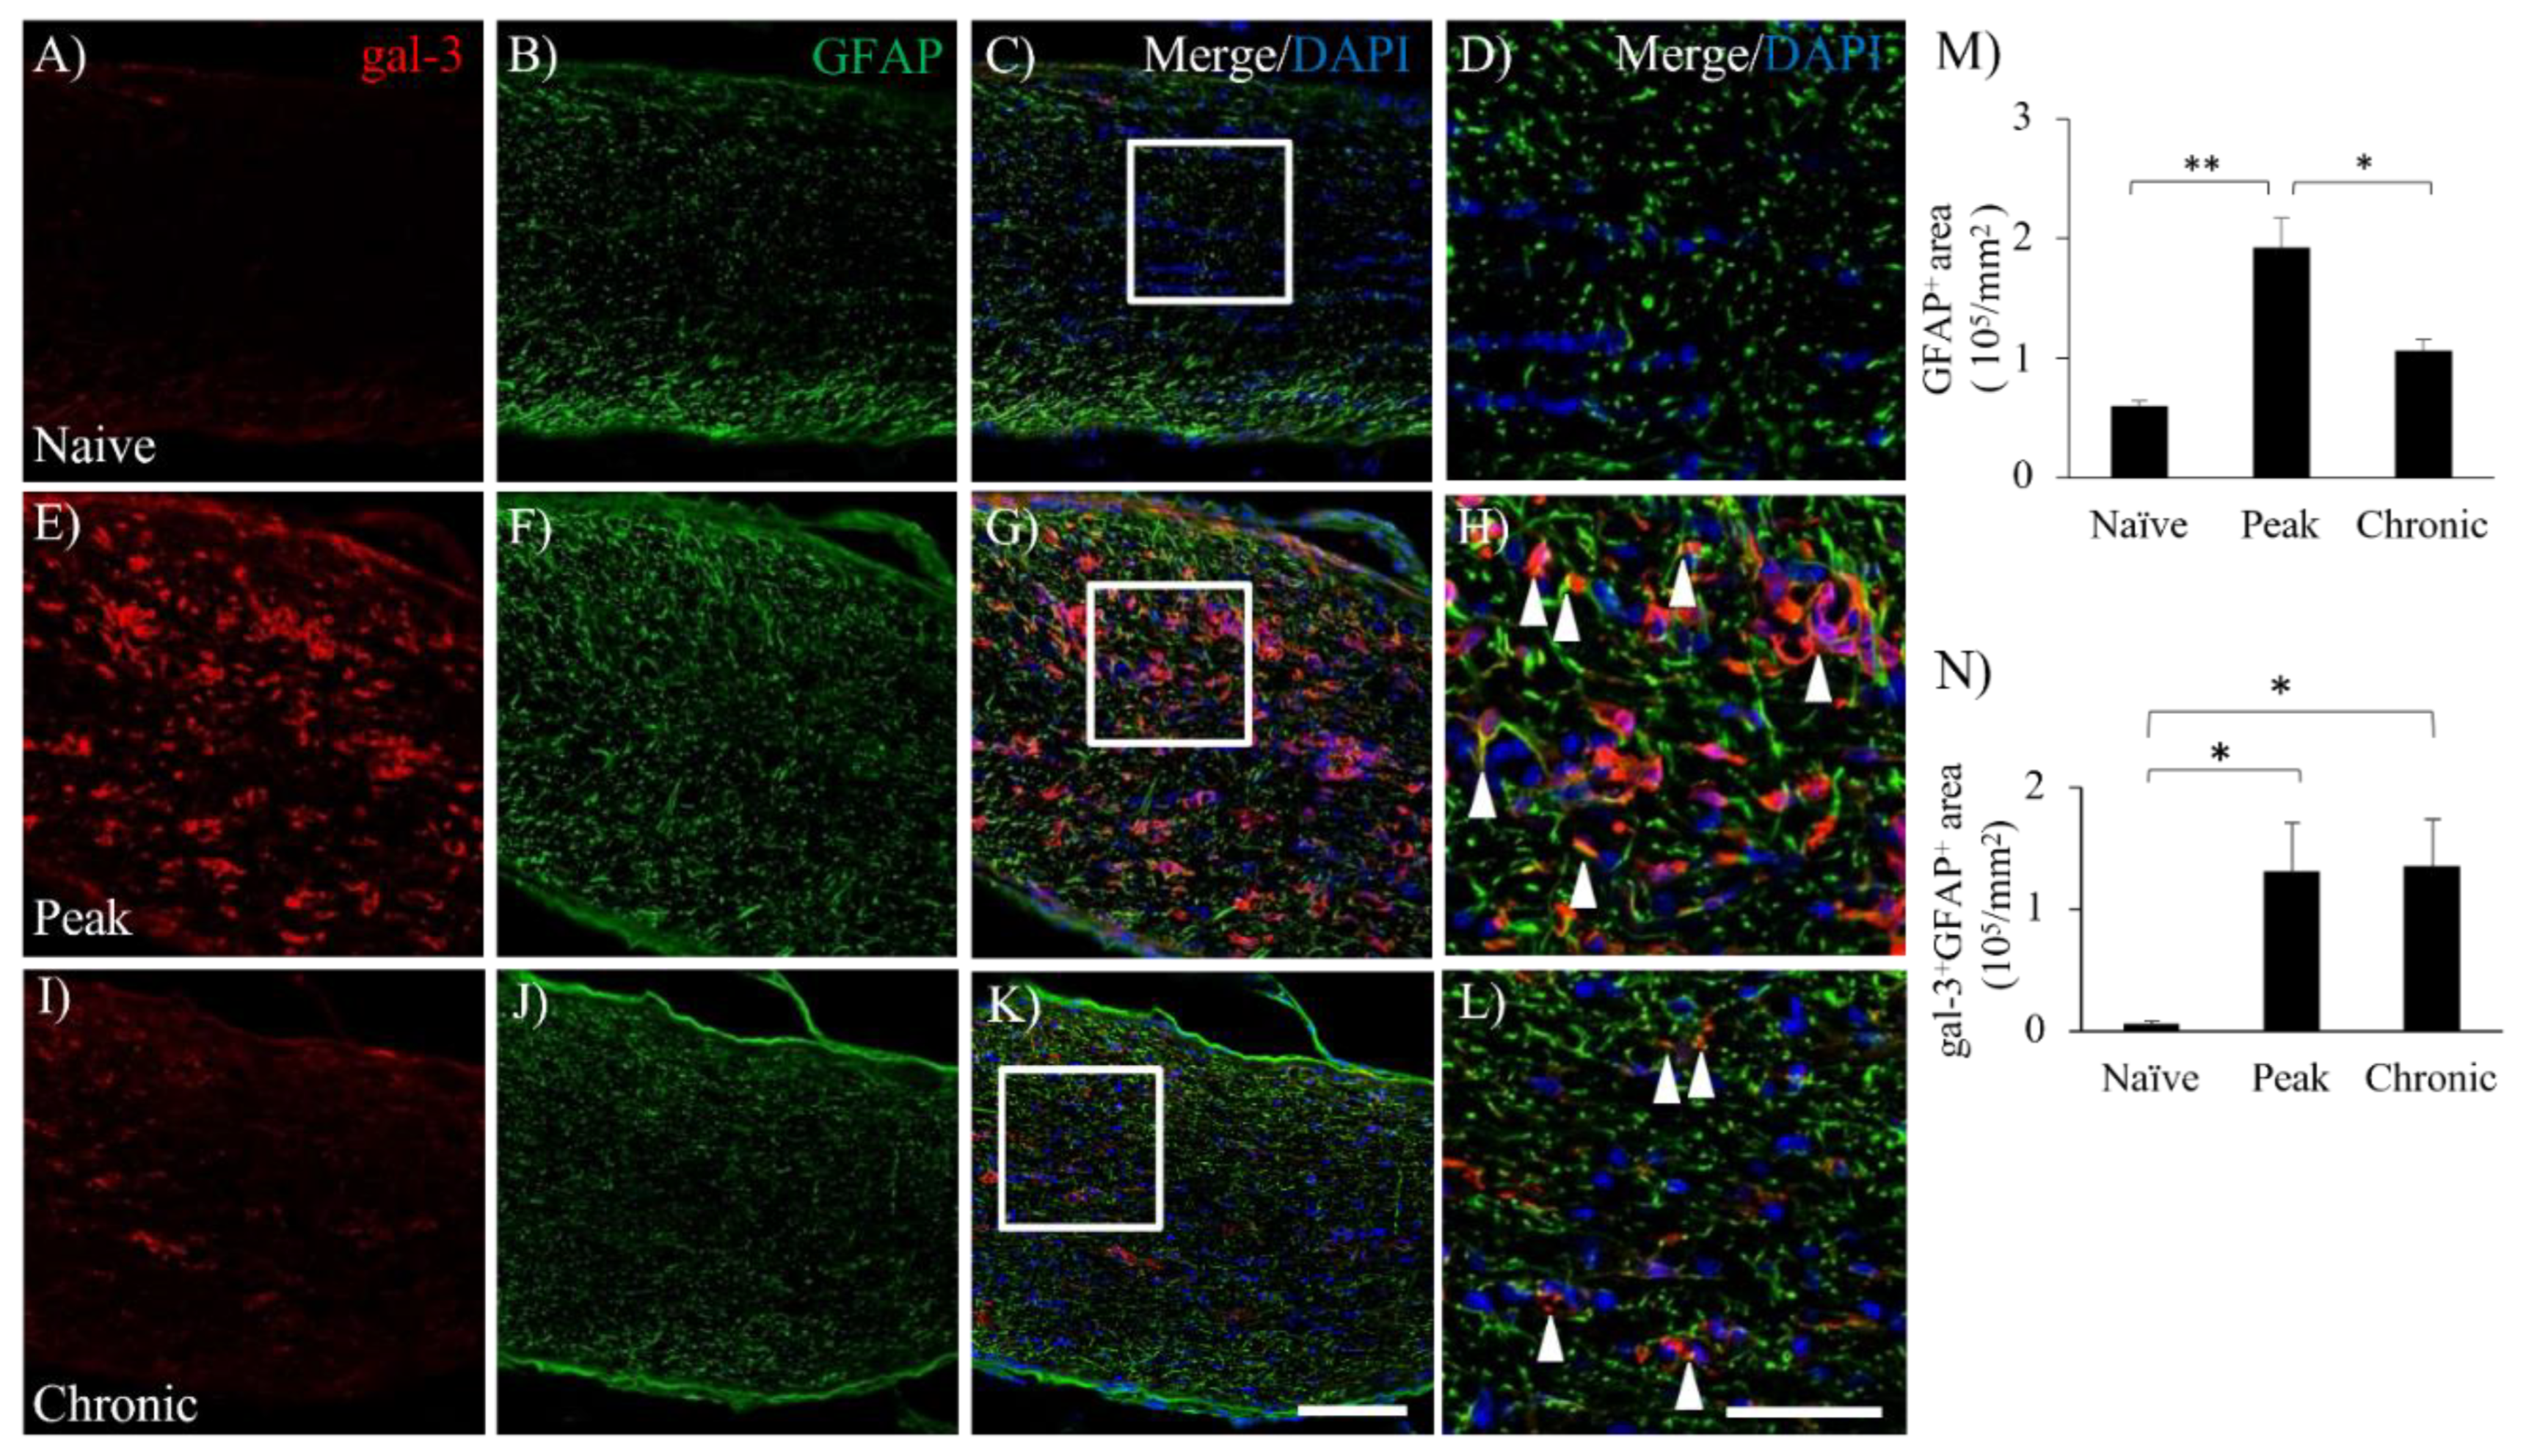
Since astrocytes are also involved in the pathogenesis of EAE, the expression of gal-3 in astrocytes was then examined. Consistent with previous reports in the EAE spinal cord [6,22], EAE induced accumulation of GFAP+ astrocytes in the optic nerve during the peak disease (Figure 3). While little expression of gal-3 in astrocytes due to a possibility of below sensitivity of GFAP was observed in naïve mice (Figure 3A), increased expression of gal-3 was observed at the peak disease and the chronic phase of EAE-induced ON (Figure 3F,J). Consistent with this observation, immunohistochemical analysis also showed an increased level of gal-3 expression at the peak disease and the chronic phase of EAE-induced ON (Figure 3E,I) compared to naïve mice (Figure 3A). Further, the cell number of gal-3+GFAP+ cells was significantly increased during the peak disease and the chronic phase of EAE compared to naïve mice (Figure 3D,H,L,M,N).

3.4. Accumulation of gal-3+cells was Observed in the Lesion of Demyelination with EAE.

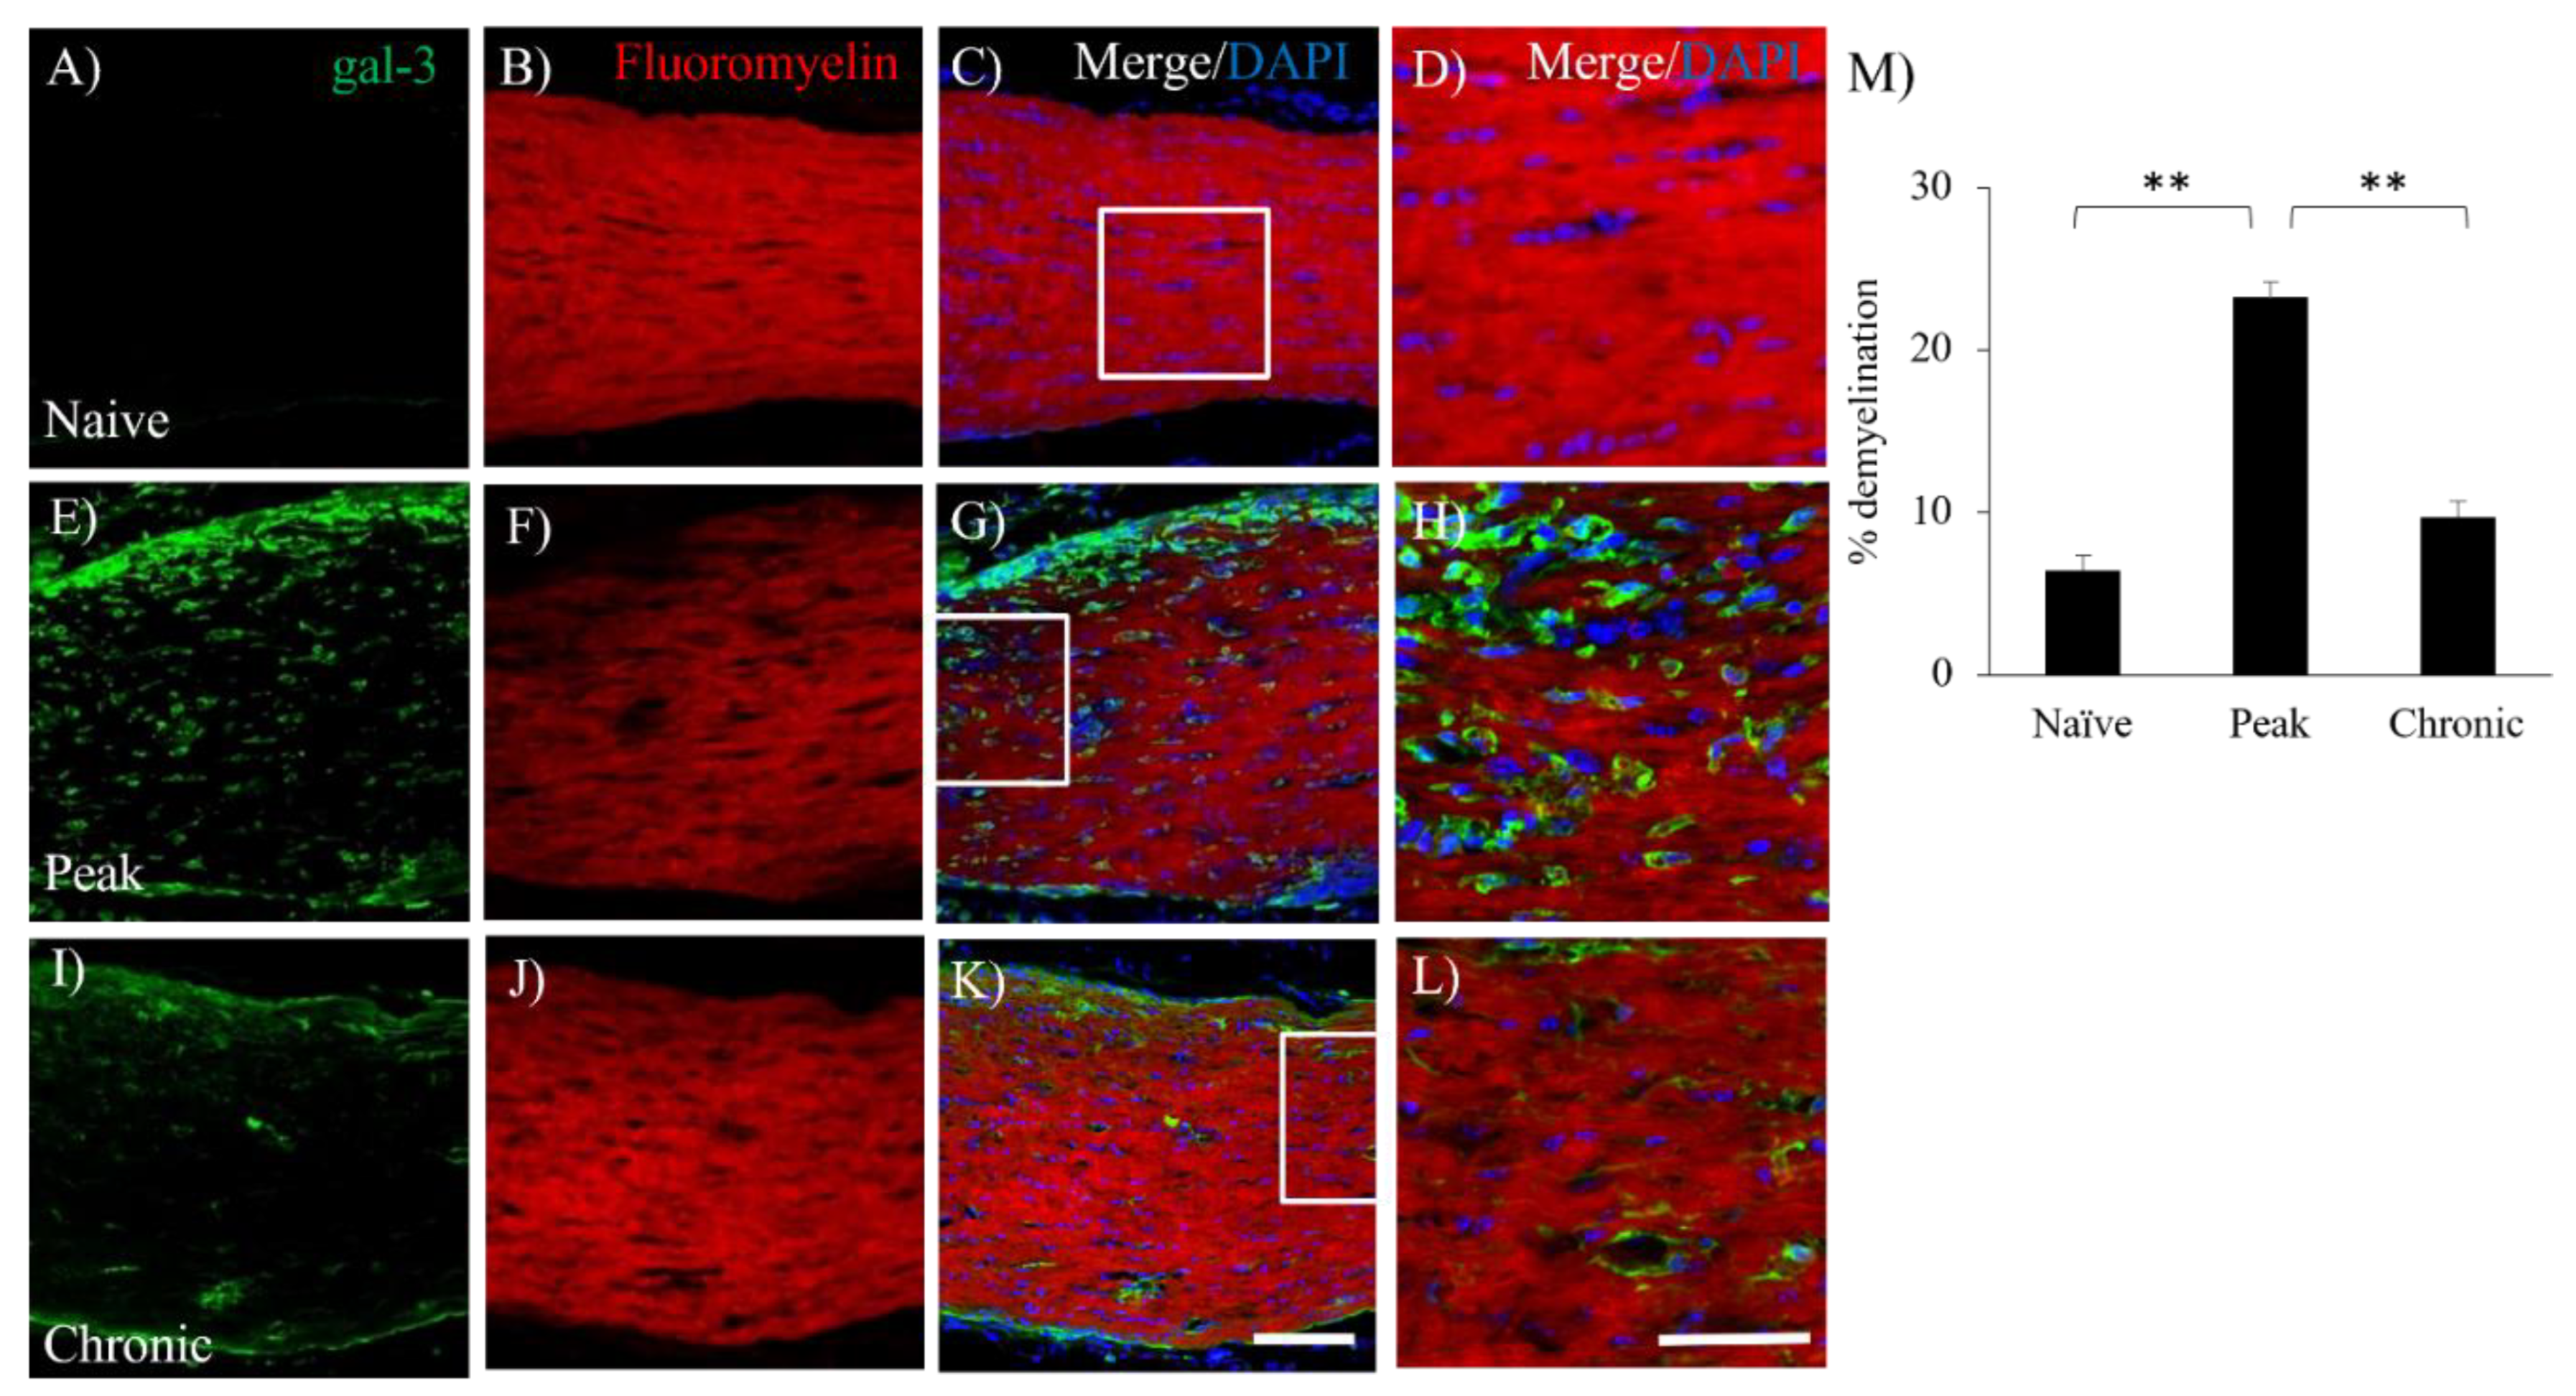
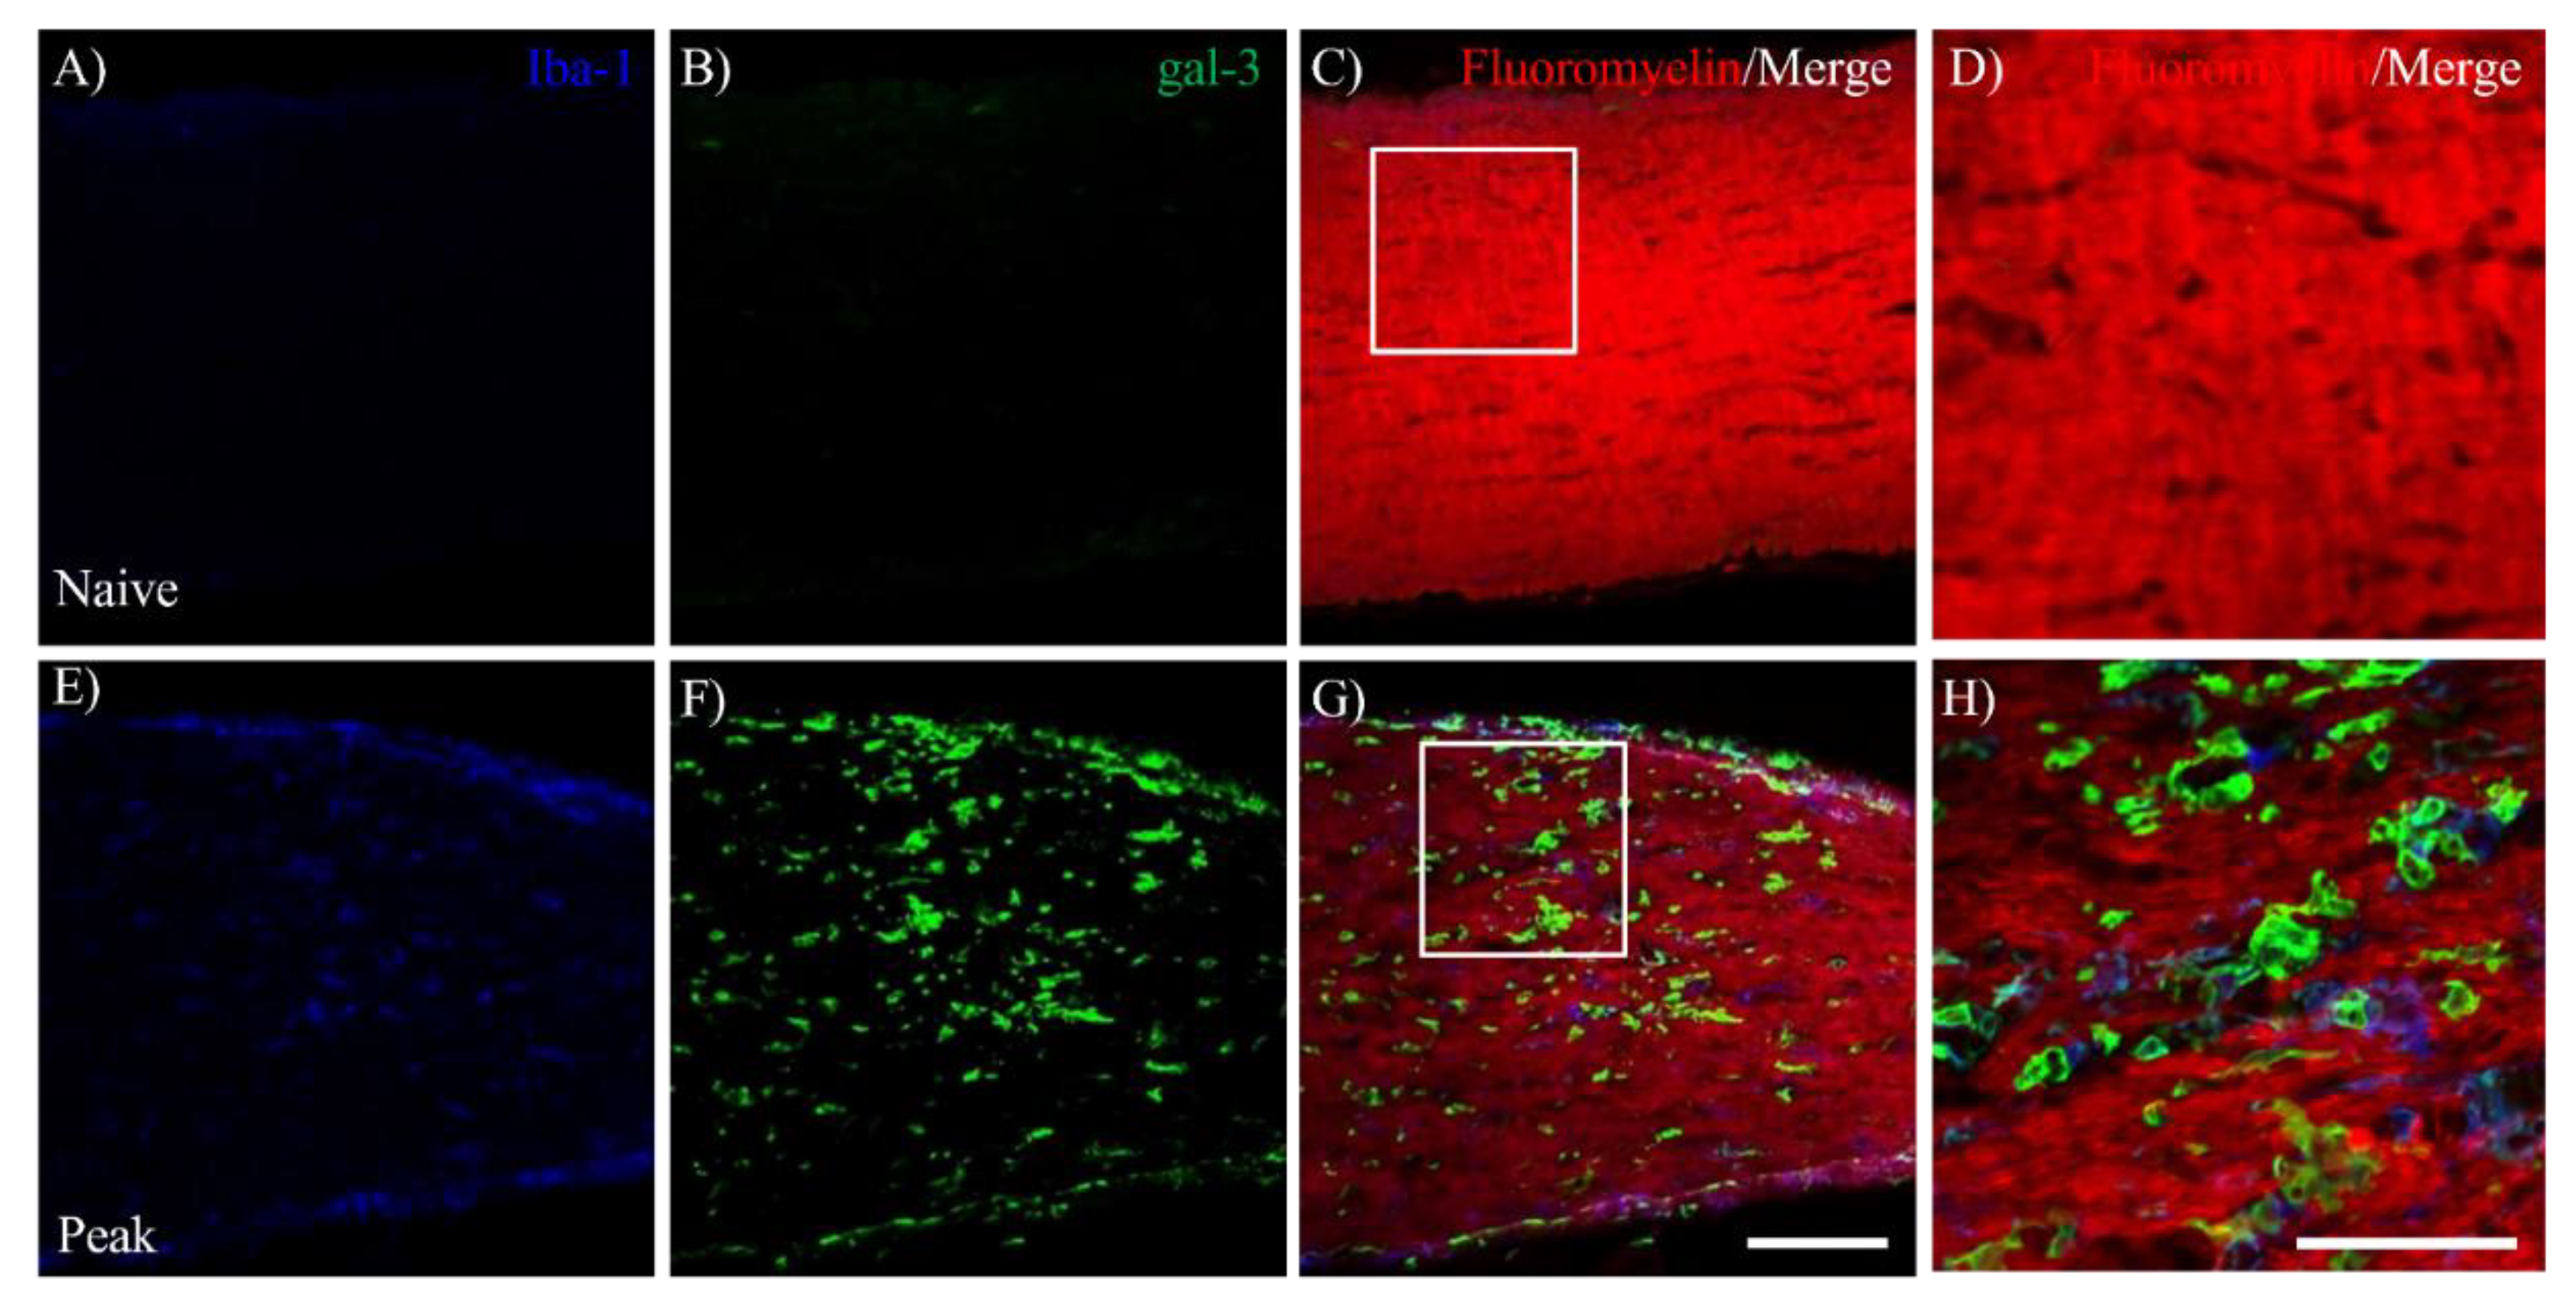
To assess whether the involvement of gal-3 expressing cells in EAE-induced demyelination in the optic nerve, immunohistochemical analysis combined with fluoromyelin staining was further performed. Compared to naïve mice (Figure 4B), fluoromyelin staining showed that EAE developed demyelination in the optic nerve during the peak disease (Figure 4F,M). On the other hand, remyelination was observed at the chronic phase (Figure 4J,M). As shown in Figure 4E–H, immunohistochemistry clearly demonstrated the accumulation of gal-3 expressing cells in the demyelinating lesion in MOG-induced ON (Figure 4E,G,H). Further study revealed that the distribution of gal-3+Iba-1+ microglia/macrophages was observed in the lesion of demyelination during the peak disease (Figure 5G,H). These results indicate the implication of gal-3+ microglia/macrophages for EAE-induced demyelination in the optic nerve.

3.5. Expression of gal-3 in Cathepsin D-expressing Activated Microglia/Macrophages.

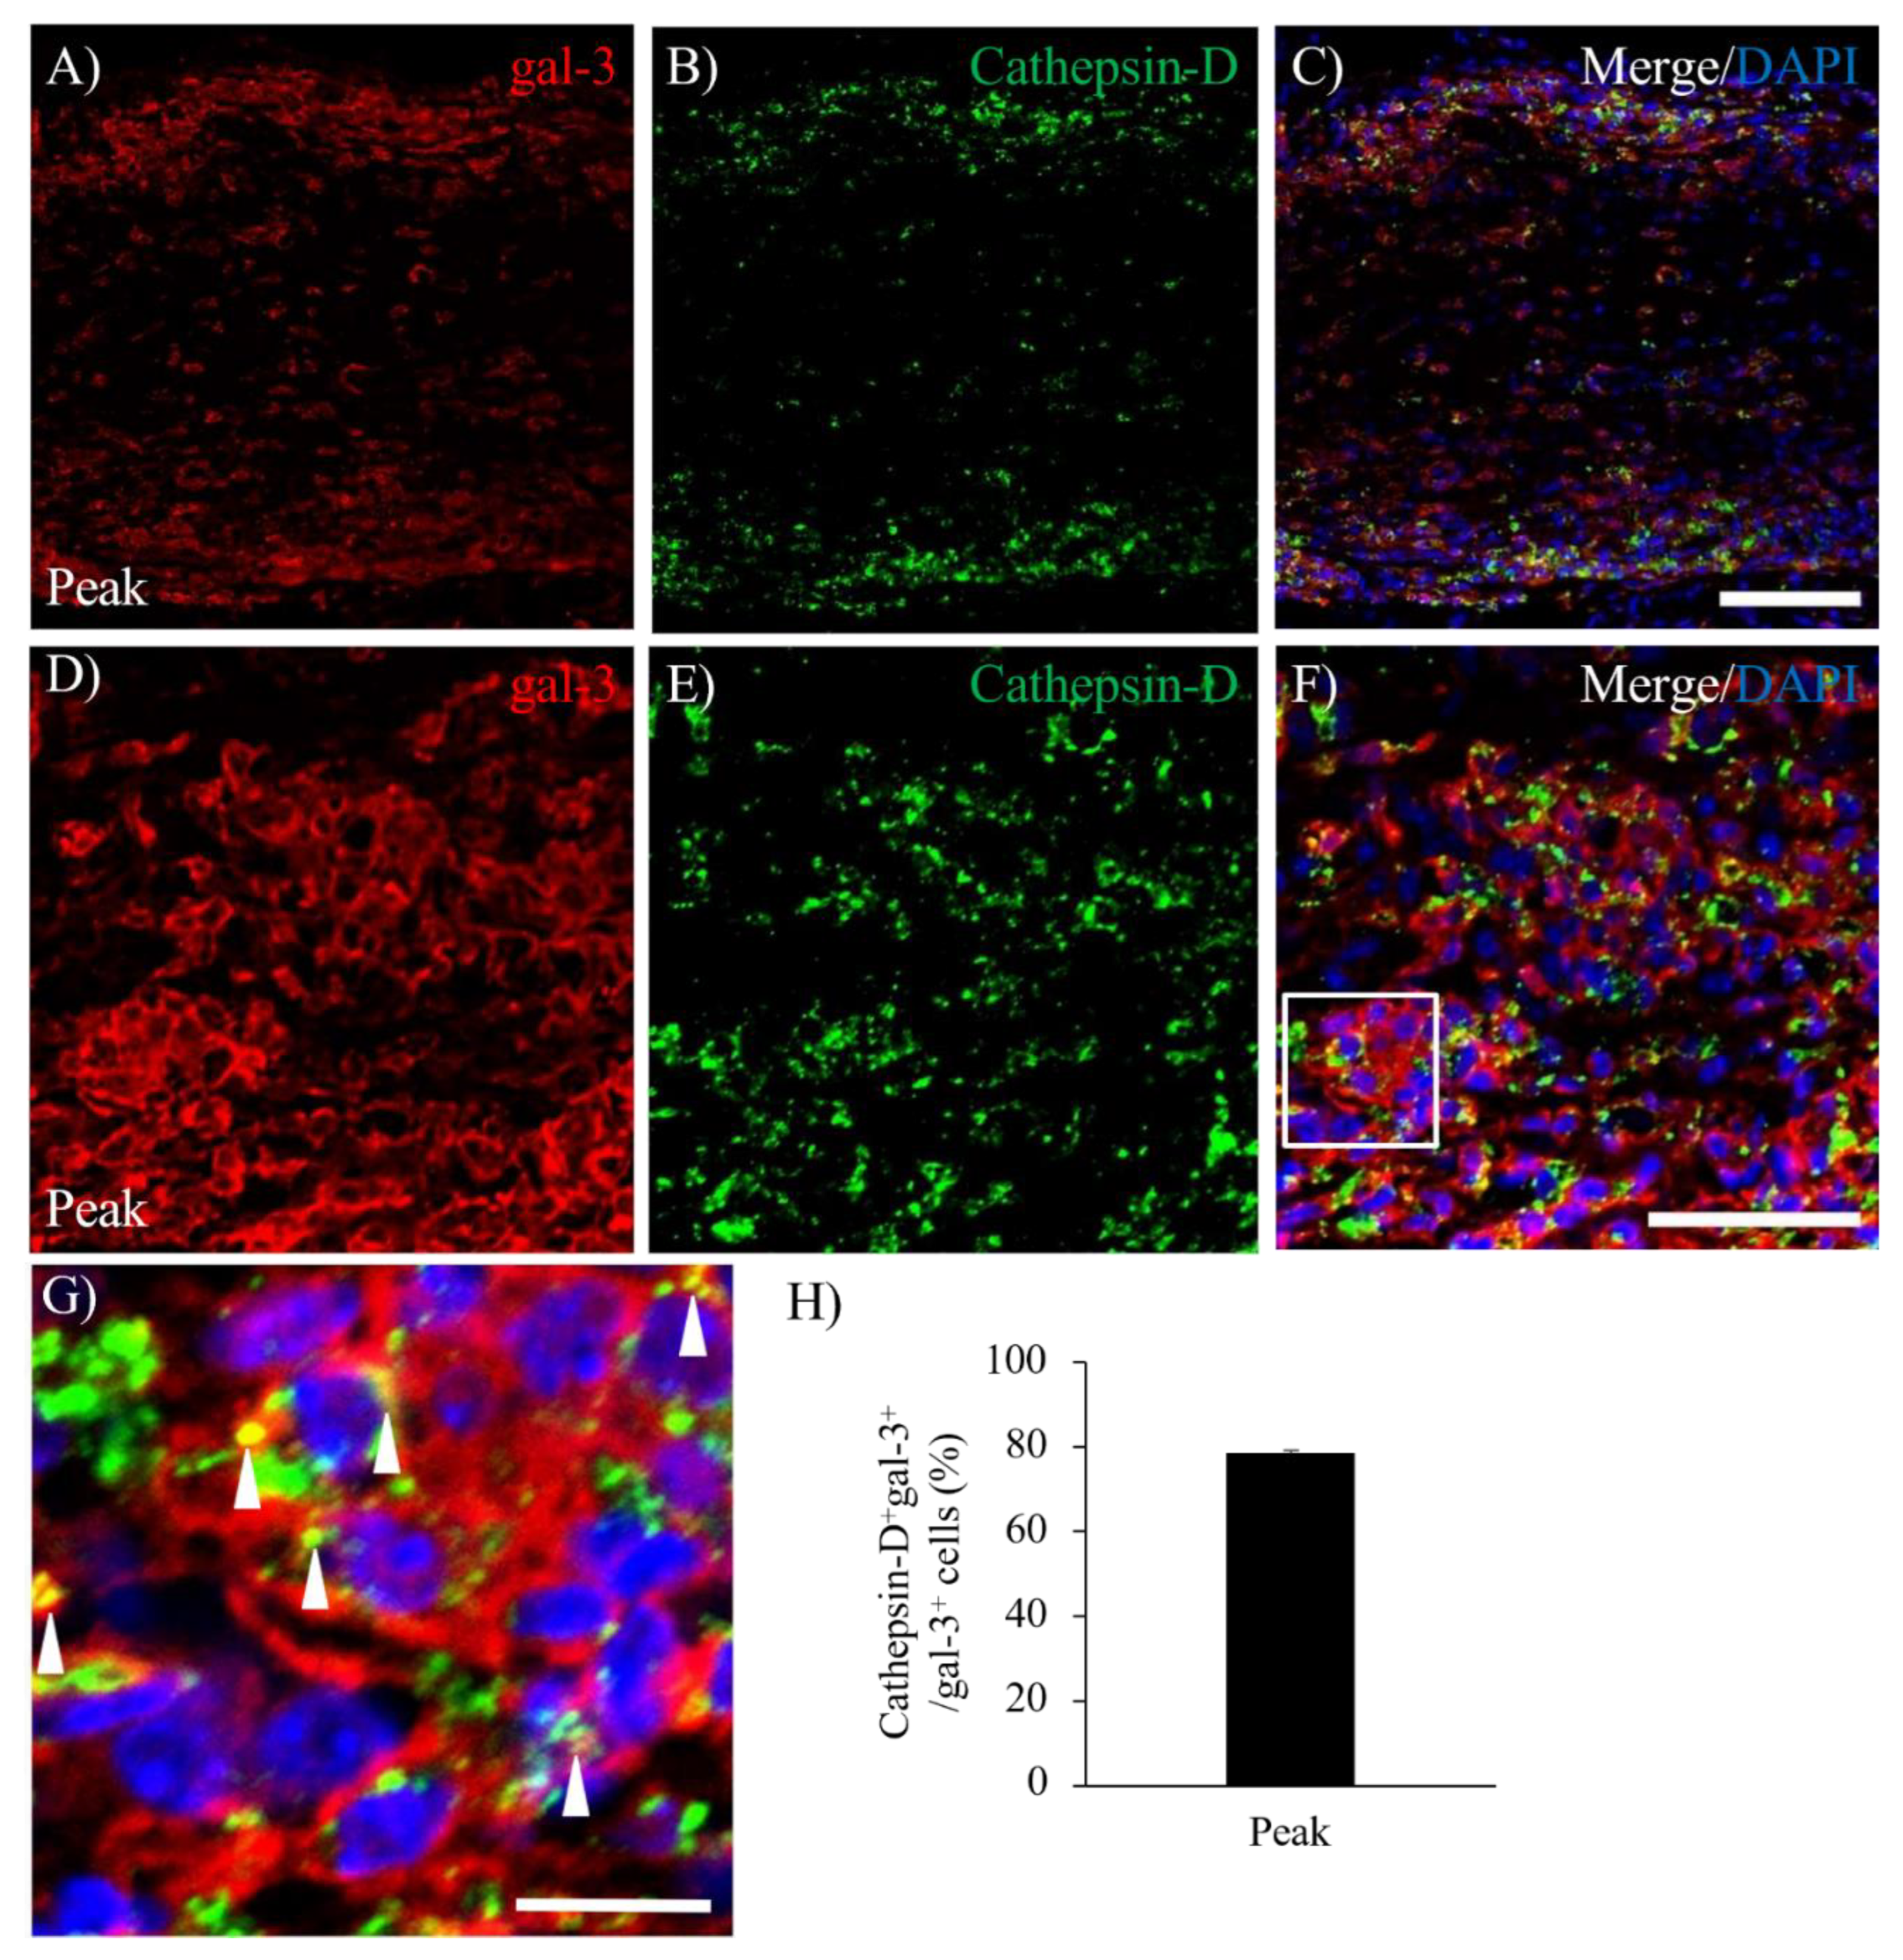
To elucidate the pathophysiological function of gal-3 expressing microglia/macrophages in the lesion of demyelination during MOG-induced ON, immunohistochemistry with anti-cathepsin-D antibody was further performed [16]. Immunohistochemistry revealed about 80% of gal-3+ cells were expressed cathepsin-D (Figure 6C,H), indicating the association of gal-3 activating microglia/macrophages with phagocytosis in the lesion of EAE-induced inflammatory demyelination at the peak disease (Figure 6A–C) and the chronic phase (Figure 6D–G). Cathepsin D+ cells were relatively accumulated in the inflammatory sites of the meninges during the peak disease of MOG-ON (Figure 6C,F,G)

3.6. Activation of Inflammasome Induces Galectin-3 in EAE-induced Microglia/Macrophages.

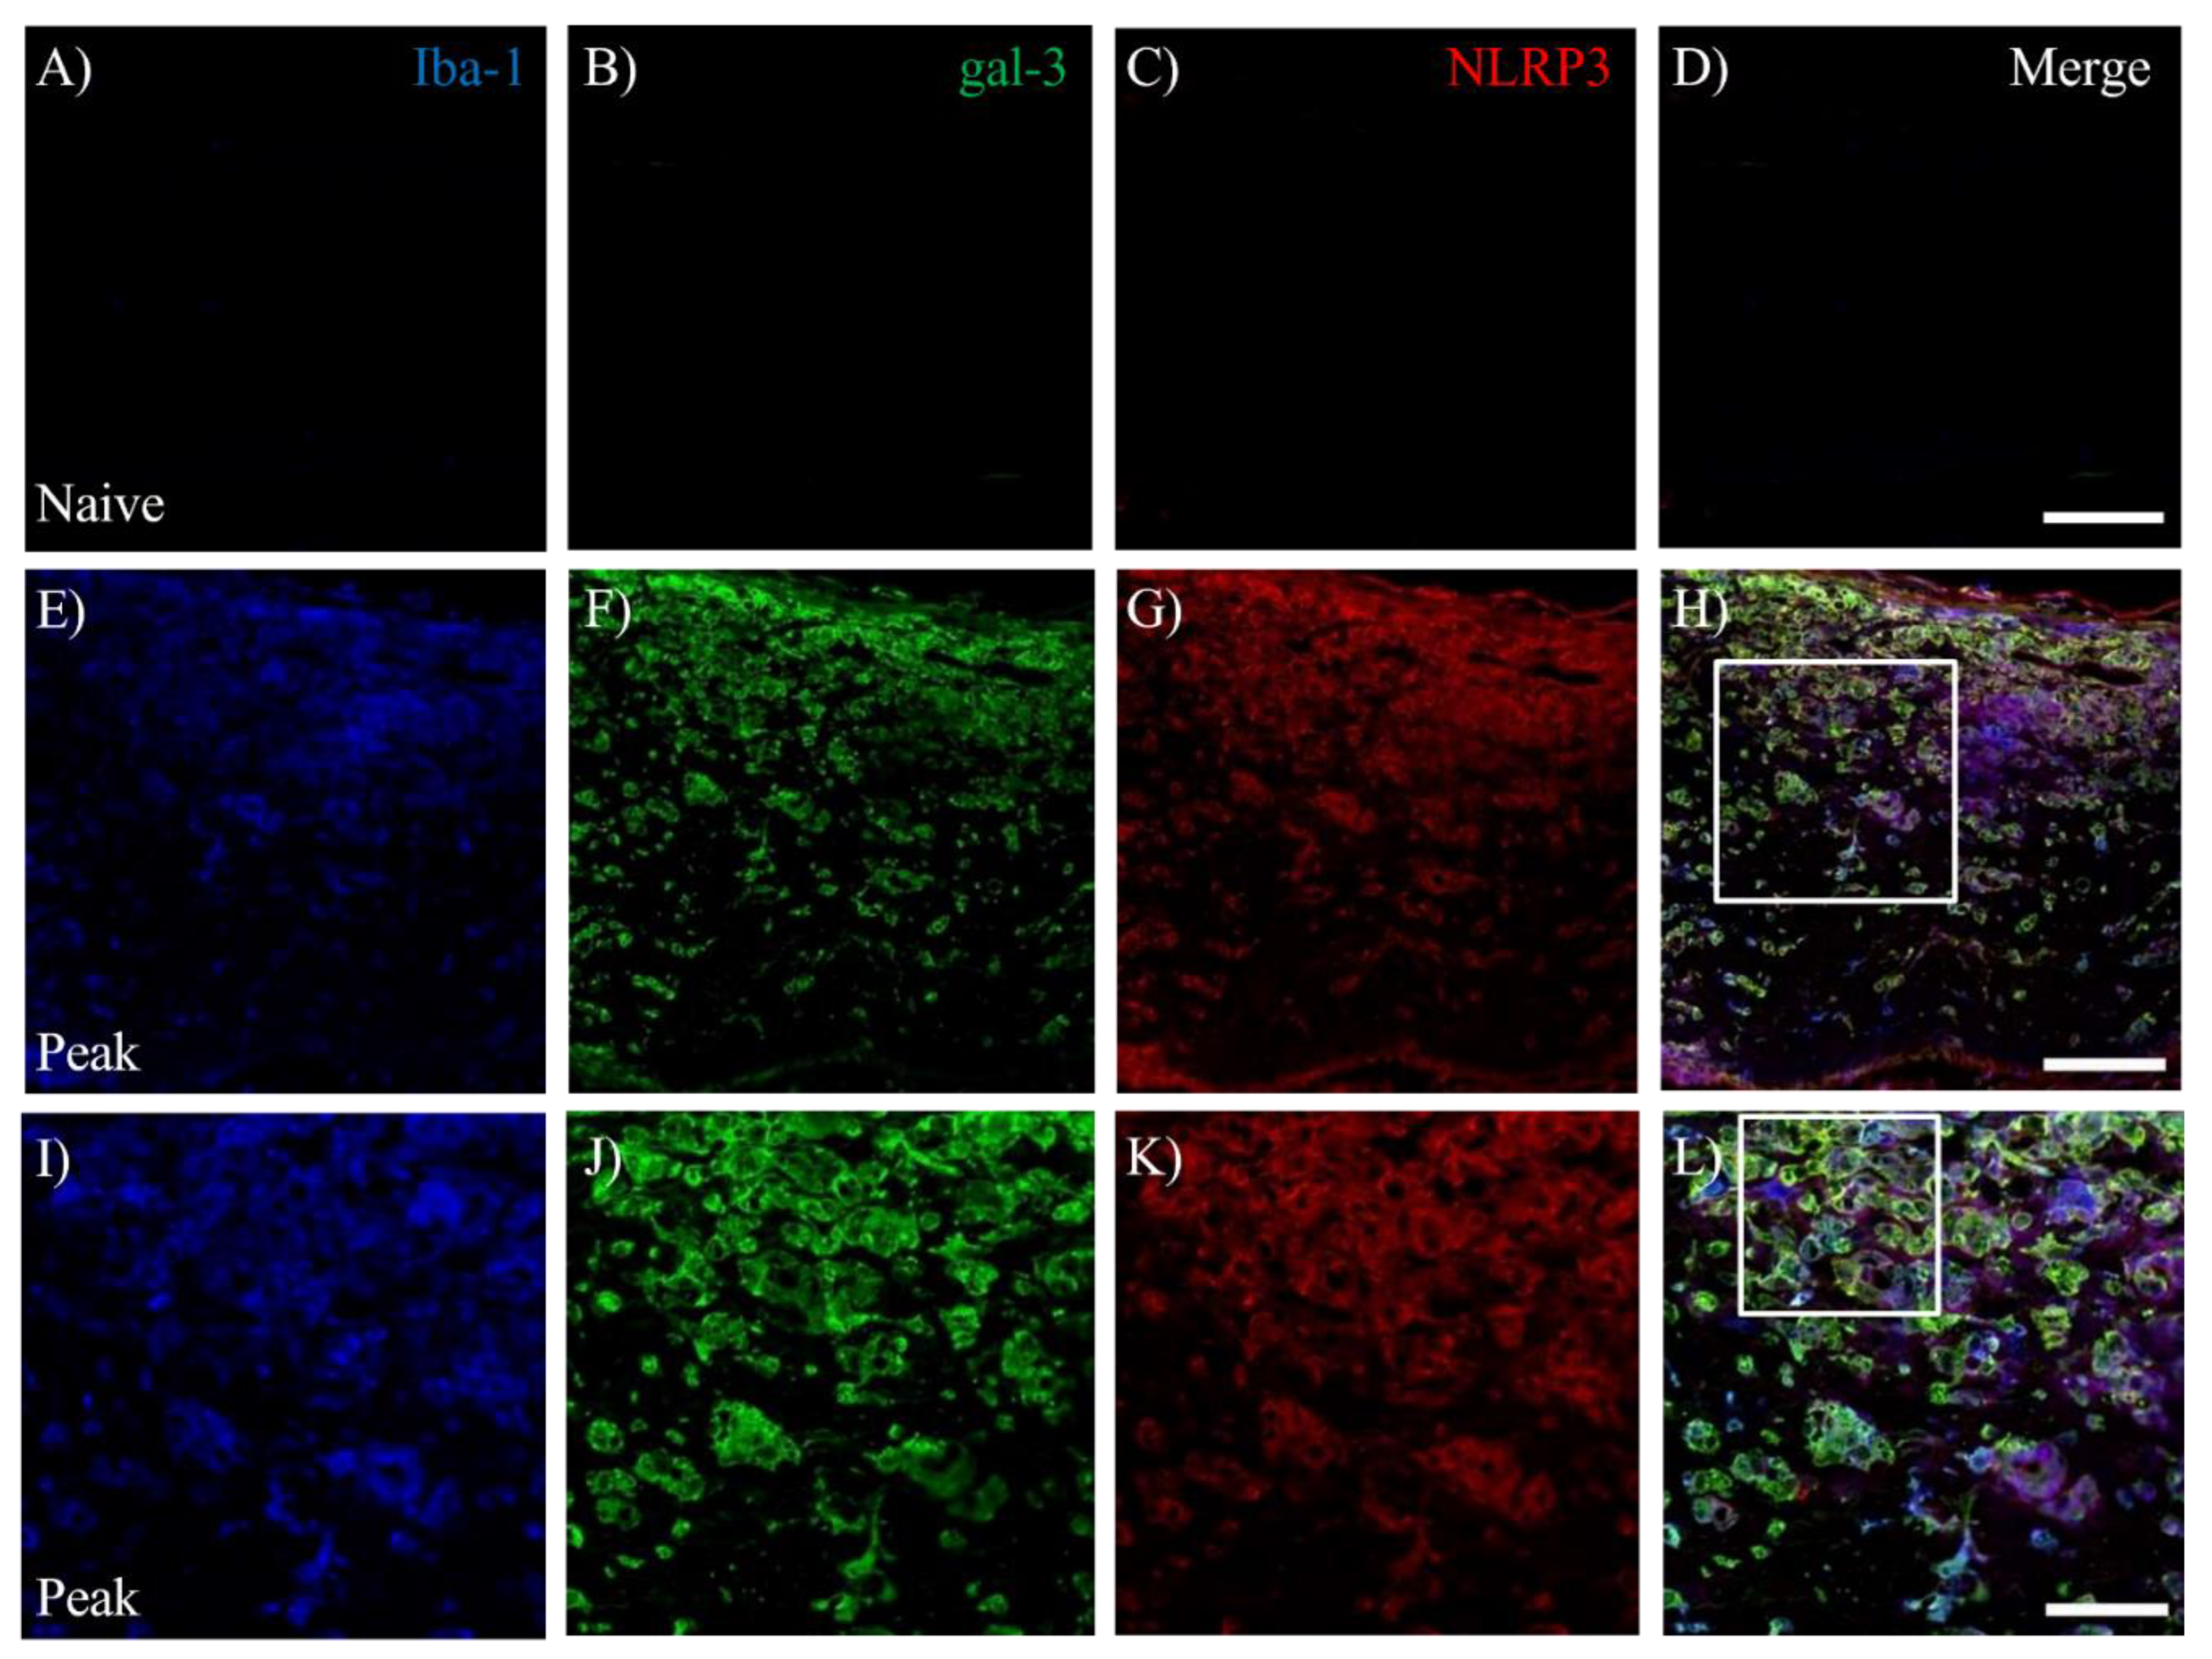
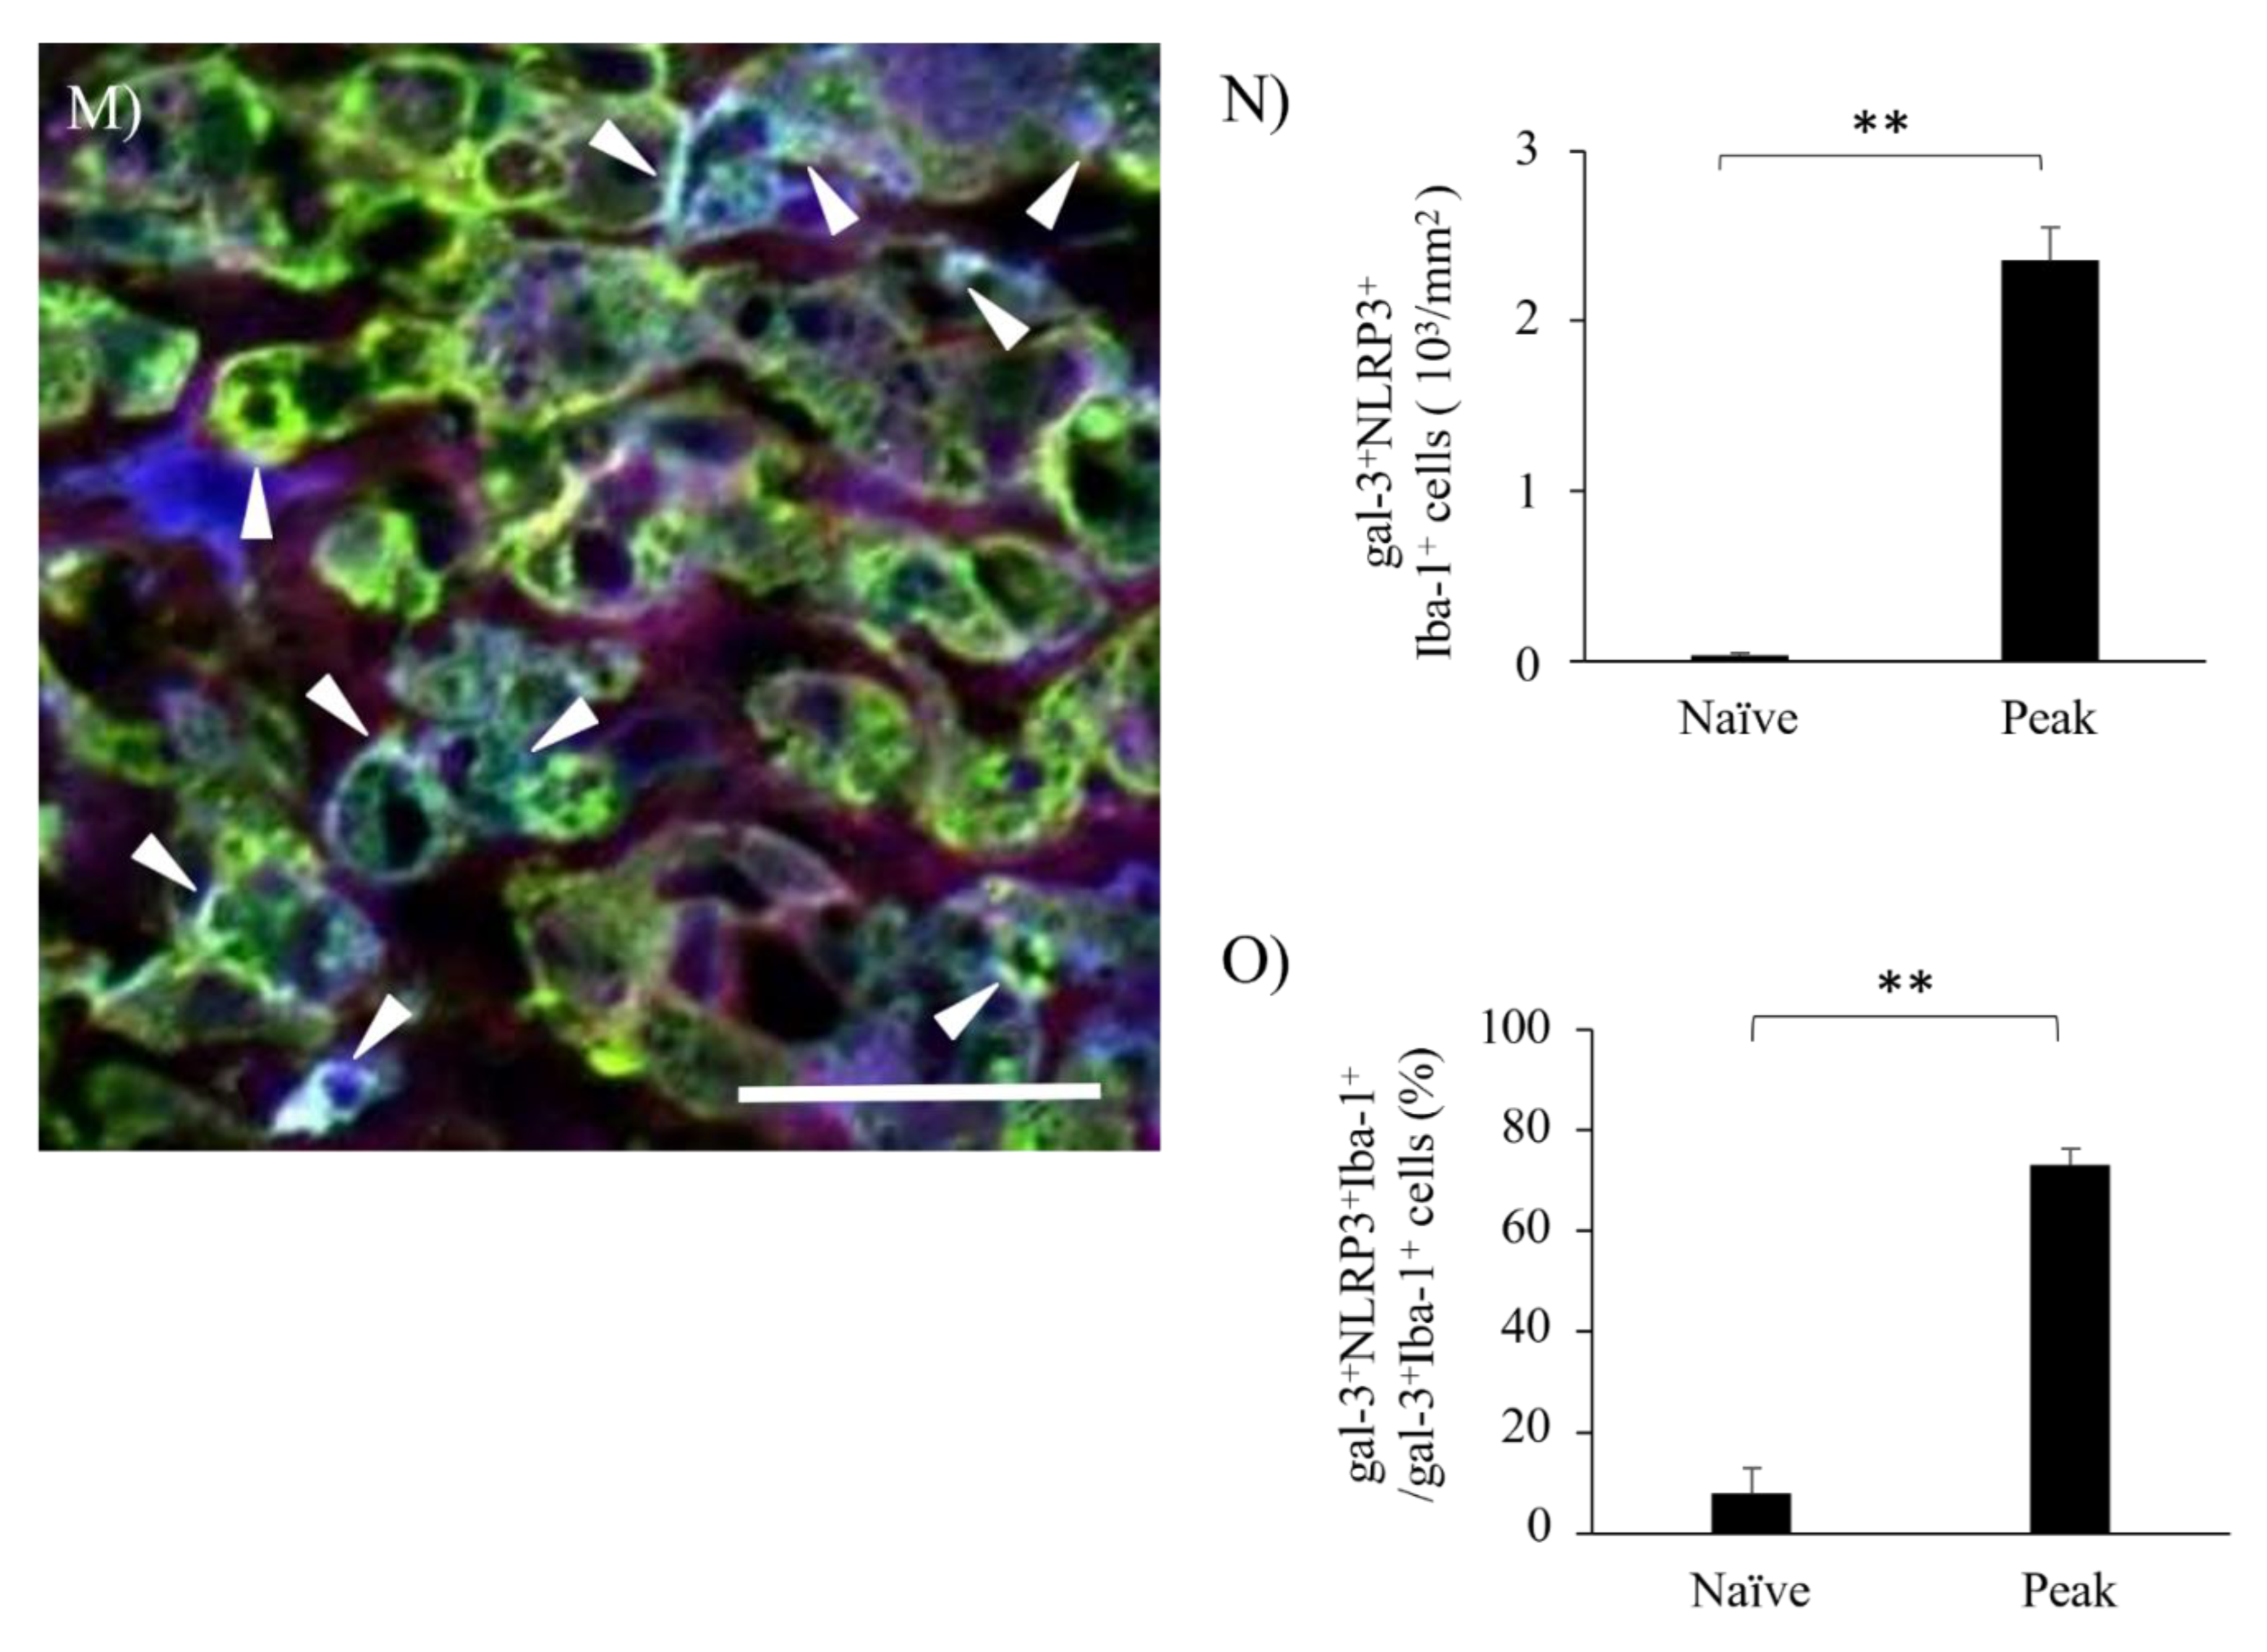
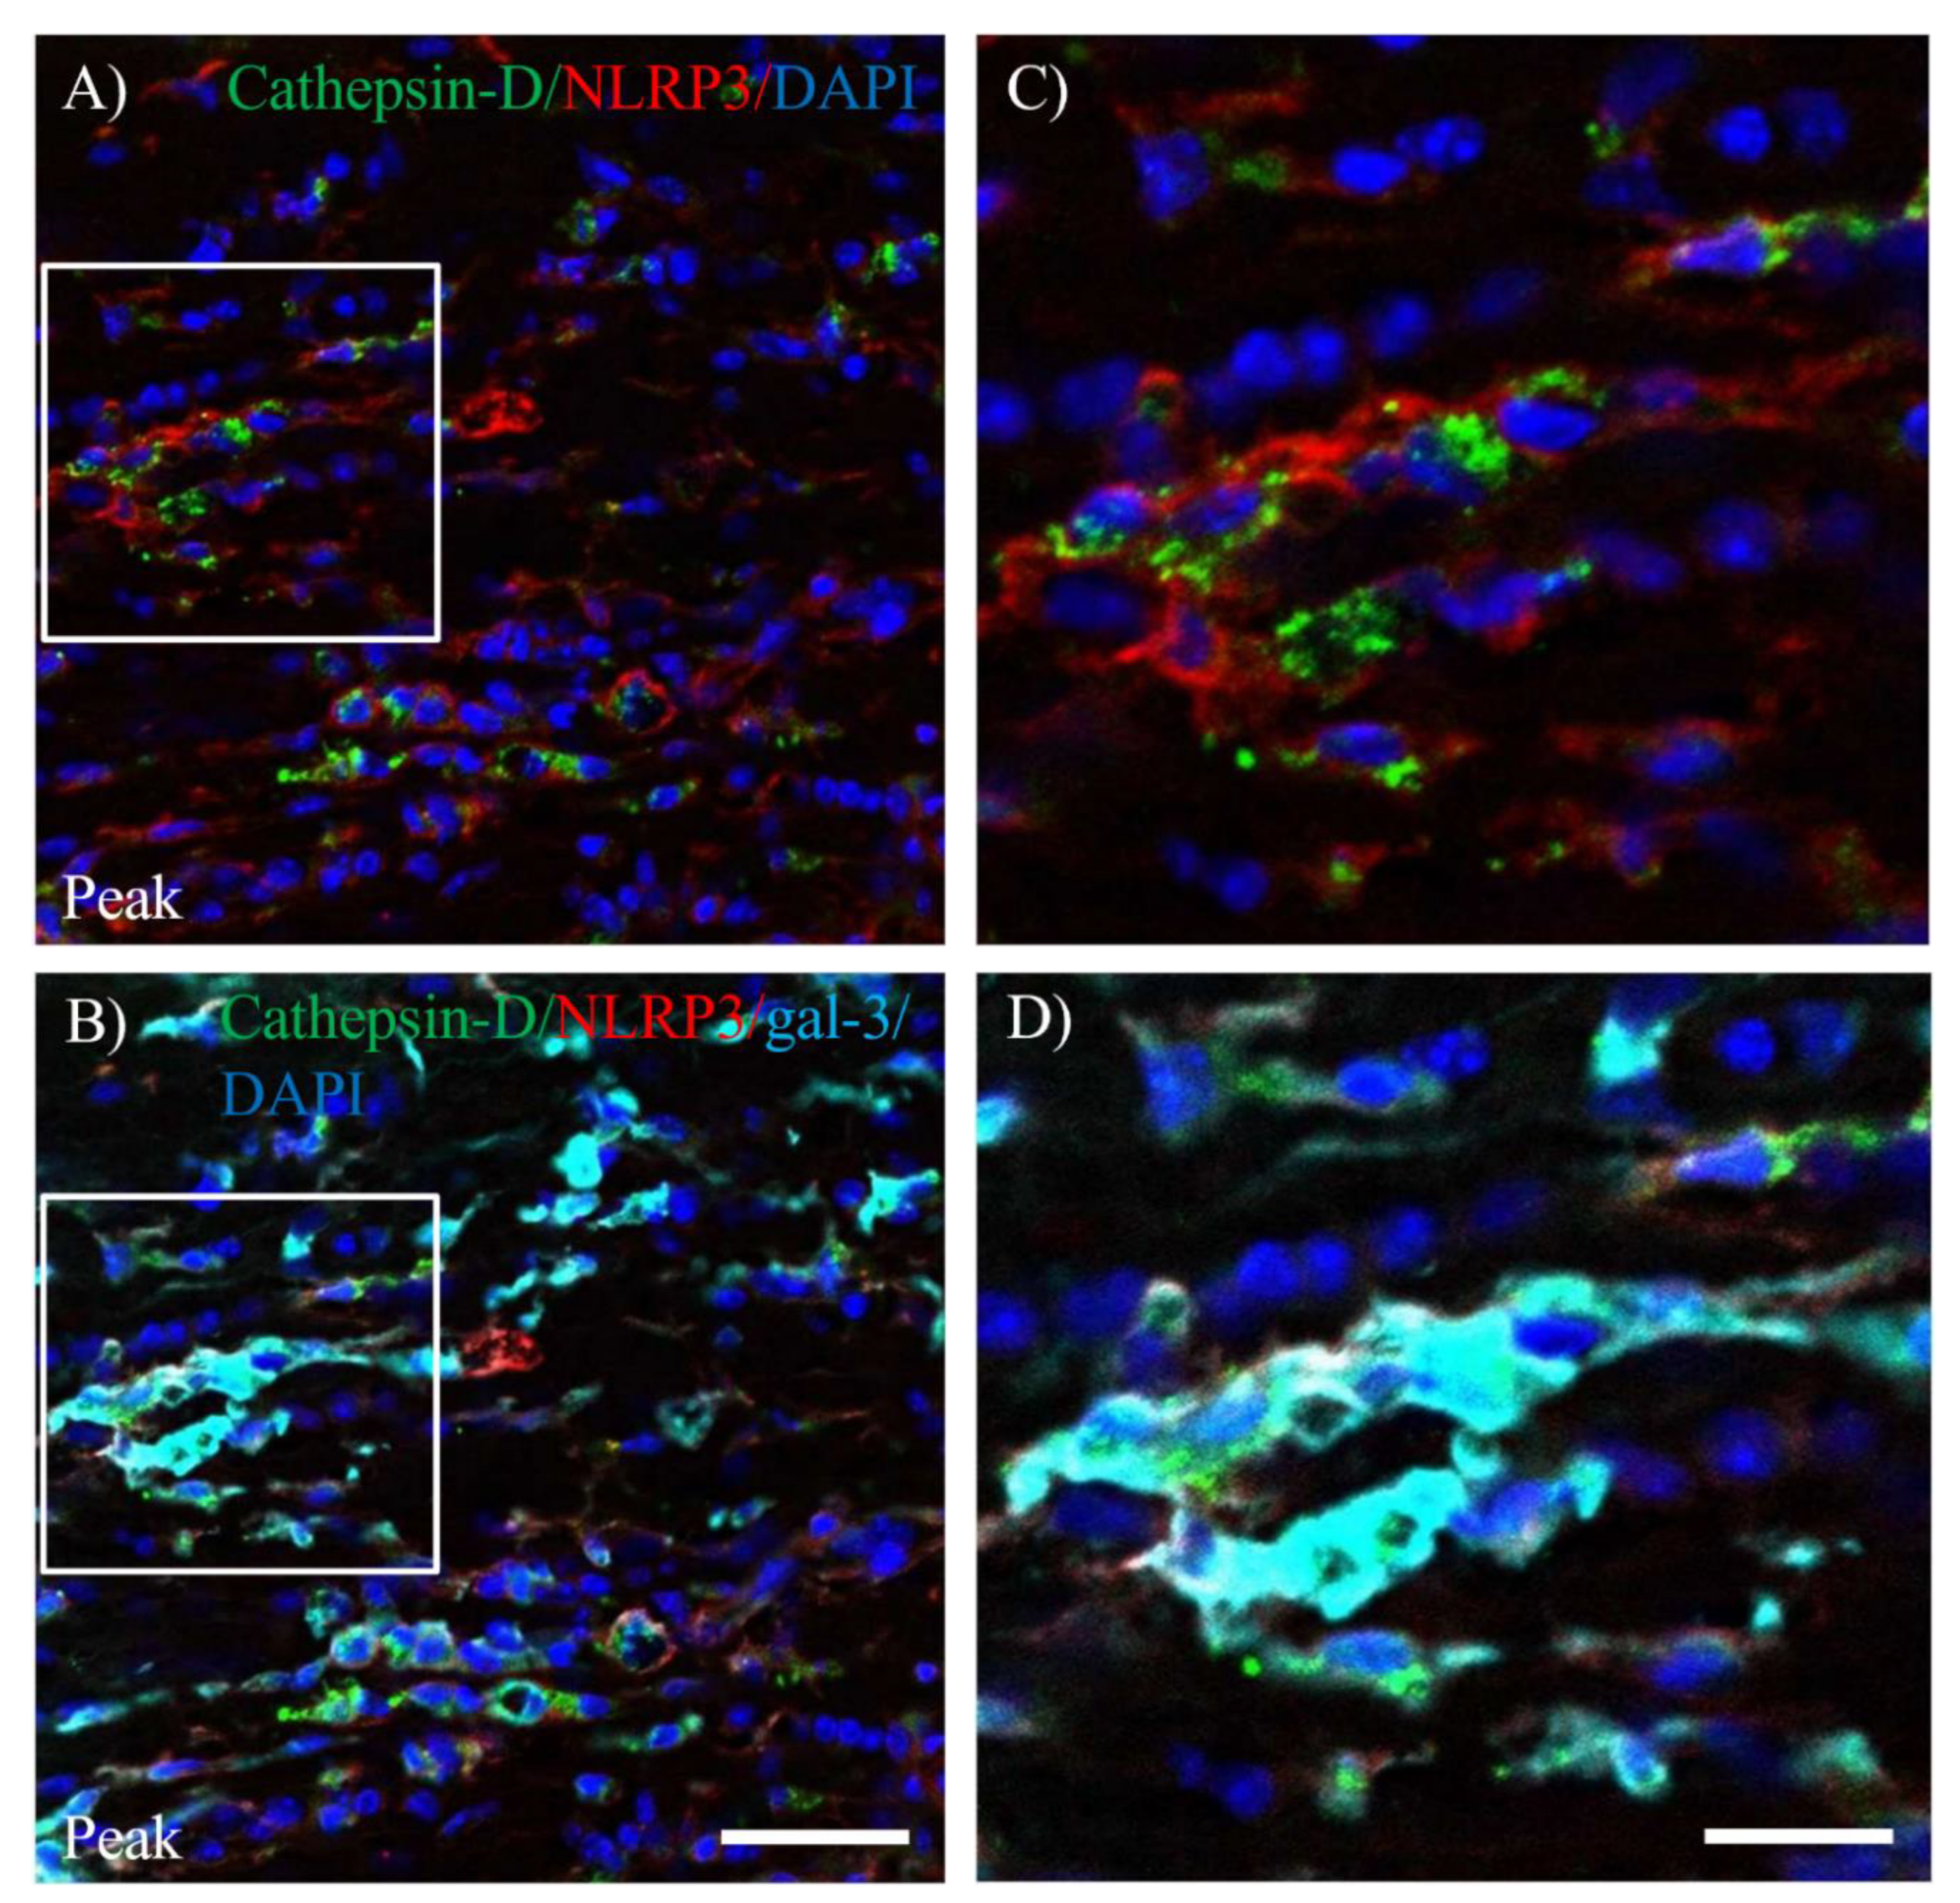
EAE induces gliosis and infiltrating peripheral inflammatory cells into the CNS, followed by inflammatory demyelination. We next examined whether inflammasome was activated in gal-3+ microglia/macrophages during the peak disease. Immunohistochemistry with triple staining demonstrated that gal-3+Iba-1+ activated microglia/macrophages were also expressed Nod-, LRR-, and pyrin domain-containing 3/Nod-like receptor protein 3 (NLRP3), which is a marker for inflammasome (Figure 7). NLRP3 on gal-3+Iba-1+ cells was also significantly induced in the inflammatory sites of the optic nerve at peak disease (Figure 7H,L,M–N). In addition, further analysis showed about 80% of gal-3+Iba-1+ cells expressed NLRP3 (Figure 7O). These observations suggest the possibility of the implication of gal-3 expression for inflammasome-related NLRP3 signaling pathway in microglia/macrophages during MOG-induced ON. To assess the function of gal-3+NLRP3+Iba-1+ cells during MOG-induced ON, immunohistochemistry with anti-cathepsin-D antibody was then performed. Cathepsin- D was observed in most gal-3+NLRP3+ cells during the peak disease, indicating that gal-3+NLRP3+Iba-1+ cells have phagocytotic properties at the inflammatory sites of the meninges of the optic nerve in MOG-induced ON (Figure 8).

4. Discussion

While the clinical importance of encephalomyelitis in ON is well documented [10], the molecular mechanisms of ON are not yet well known. In the current study, we clarified that gal-3 expression was observed mainly in inflammation-mediated activating microglia/macrophages in the visual pathway including the optic nerve, the optic chiasm, and the optic tract during MOG-induced ON. These results suggest that gal-3 plays an important role in the pathogenesis of MOG-EAE-induced ON.
MOG-EAE, a classical animal model of MS, was used mainly for investigating the neuropathological mechanisms in the spinal cord, because MOG-EAE develops severe cell-mediated organ-specific neuroinflammation followed by paralysis of hindlimbs. However, optic nerves express higher levels of MOG than the spinal cord [13] and 30% of MOG-specific TCR transgenic mice have spontaneous development of optic neuritis [24]. In addition, some previous reports have documented that MOG-induced EAE can induce ON [12,13,25,26] and that H&E staining exhibited a possibility of infiltration of peripheral immune cells into the EAE optic nerves [11,26]. Therefore, the current study shed light on the pathogenesis of MOG-EAE-mediated ON.
Our results, in fact, demonstrated that MOG-EAE could induce neuromyelitis optica (ON) after 16-20 days of MOG immunization (Figure 1), as previously reported [11,26]. Similar to the pathological feature in the visual pathway in human NMOSD [27], C57BL/6J mice showed accumulation of inflammatory cells in the bilateral optic nerves, the optic chiasm and the bilateral optic tracts during MOG-EAE development (Figure 1B). The pathological features in EAE-induced ON were similar in all lesions including the optic nerve, the optic chiasm (Figure S1) and the optic tracts (Figure S2) in the visual pathway. Therefore, the present study exhibited the optic nerve as a representative lesion in EAE-induced ON. Although the present study did not examine the pathological changes of retinal ganglion cells (RGC) in the retina, the previous report has demonstrated that RGC loss occurred more than 25 days after immunization to induce EAE [11], suggesting a considerable possibility that RGC loss in the retina may be undergoing anterograde degeneration in a progressive manner.
Accumulation of inflamed cells was also observed along the meninges in the optic nerve (Figure 1), indicating the association of the perichondrium vascular network with pathological change likely to angiogenesis to promote infiltration of immune cells into the visual pathway. The pathology of MS was also characterized by perivascular infiltration of immune cells and macrophages [28]. Our study also demonstrated that an increased number of Iba-1+ microglia/macrophages and GFAP-positive astrocytes were observed at the inflammatory sites including meninges in the EAE optic nerves, indicating an association of microgliosis and astrogliosis with the ON pathology (Figure 2 and Figure 3). Our results indicate that meningeal inflammation plays a key role in the pathogenesis of EAE-induced ON. In addition, meningeal inflammation in MS and ON may induce microglial and astroglial phenotypic alterations with gal-3 induction that reflect disease progression. A previous report has demonstrated that the inflammatory infiltrates in the meninges, especially the pia matter, produce a soluble factor, which induces demyelination and axonal degeneration either directly or indirectly through microglial activation [29].
The current study also showed that EAE-induced gal-3 on microglia/macrophages plays an important role in neuroinflammation in the visual pathway. While little to no gal-3 expression in the visual pathway such as the optic nerve was observed in the naïve condition, the number of gal-3 expressing on Iba-1+ microglia/macrophages was significantly increased in the visual pathway during EAE-induced ON, especially the peak disease (Figure 2). About 80% of gal-3-positive cells in the EAE optic nerve were Iba-1+ macrophages/microglia at the peak disease (Figure 2). Distribution of gal-3 expressing microglia/macrophages referred to gal-3+Iba-1+ cells in the optic nerve was observed mainly at the pia matter and surrounding the pia matter rather than the middle part of the optic nerve (Figure 2). This observation indicates that peripheral immune cells infiltrate into the optic nerve from the pia matter, where the round shape of these cells was mainly observed. Since it has been well known that the morphological feature of activated microglial/macrophages is ameboid which retracts their processes and develops large soma [30], these gal-3+Iba-1+ microglia/macrophages in the EAE optic nerve seem to be activated during the peak disease. The important role of gal-3 in macrophage M1/M2 polarization and function also has been reported [31].
The current study revealed a considerable possibility of the implication of gal3+Iba-1+cathepsin D+ microglia/macrophages for demyelination in the EAE-induced ON during the peak disease. During the peak disease, the current results revealed that gal-3+ microglia/macrophages expressed cathepsin-D (Figure 6). In general, activated microglia/macrophages play an important role in neuroinflammation and phagocytosis in the CNS [32]. Cathepsin D can be secreted by microglia that are associated with phagocytosis in activated microglia/macrophages [33,34]. Consist of our previous report in the acute phase of the EAE spinal cord [16], the current study exhibited that at least part of gal-3+Iba-1+ microglia/macrophages also showed to increase immunoreactivity for cathepsin D in the EAE optic nerves (Figure 6 and Figure 7). In addition, most cathepsin D-expressing microglia/macrophages with a round shape were activated (Figure 6, arrowheads). By contrast, the cells with a ramified shape exhibited low expression of cathepsin D (Figure 6, arrows). Moreover, these microglia/macrophages accumulated demyelinating lesions in the optic nerve (Figure 5).
In addition to these observations, most gal-3+Iba-1+ cells expressed NLRP3 (Figure 7). NLRP3 is considered the key mediator of neuroinflammation in immune sensing by initiating the assembly of an inflammasome. The NLRP3 inflammasome triggers caspase-1 activation and IL-1β cytokine secretion, resulting in pyroptosis, recently identified as a programmed cell death regulated by the activation of caspase-1-canonical signaling pathway [35]. The outcome of an M1 polarizing event is dependent upon a number of features including the production of iNOS, reactive oxygen species (ROS), or activation of NLRP3 inflammasome complex [36,37,38]. There is also emerging evidence to suggest the importance of gal-3 for promoting of activation of NLRP3 inflammasome in M1-polarized macrophages [39]. Interestingly, gal-3 promotes inflammatory response by directly binding to NLRP3 [39]. These results suggest a possibility that gal-3 as an upstream protein of NLRP3 regulates NLRP3 signaling in microglia/macrophages followed by neuroinflammation in phagocytic activity during EAE. Therefore, it is considerable that NLRP3-expressing gal-3+Iba-1+ cells as pro-inflammatory M1-polarized microglia/macrophages serve as the first line of defense in the EAE-induced ON. According to previous reports, NLRP3 inflammasome is involved in EAE and MS in humans [40,41,42].
By contrast, gal-3 was still expressed on Iba-1+ microglia/macrophages at the chronic phase of EAE-induced ON (Figures 2L–M and 3). The clearance of abnormal proteins and protein debris such as myelin debris could be mediated by microglial cathepsin D [43]. In fact, a previous report has also revealed one important function of microglia/macrophages following demyelination to remove myelin debris in the lesion [32]. Microglia/macrophages with phagocytotic properties may be M2-polarized and contribute to myelin debris clearance [44,45]. In addition to this evidence, gal-3 activated phagocytosis of myelin to maintain myelin-debris clearance in autoimmune demyelinating diseases [20,46,47]. The expression of gal-3 is only present in microglia that phagocytose degenerated myelin rather than in microglia that do not phagocytose degenerated myelin [20,46]. In this point of view, unlike at peak disease, gal-3+Iba-1+cathepsin D+ microglia/macrophages at the chronic phase might be M2-polarized to promote remyelination. Recent investigations indicate categorization of microglial states is far too simplistic, and the different microglial states are better represented as a spectrum of combinations [48,49,50]. Therefore, we did not identify these microglia/macrophages to either M1 or M2 polarity in this study. Taken together, gal-3 on microglia/macrophages might function as the multipotent player having totally different roles depending on the microenvironment. Further study will be needed to explore to clarify a detailed their functions.
The present study also revealed that increased gal-3 expression on astrocytes was obtained at the peak disease and the chronic EAE. As shown in Figure 3, the number of GFAP-positive astrocytes was maximum at the peak disease and then decreased over the chronic phase, suggesting induction of astrocytic gliosis. Similar to the result in the microglial/macrophage’s expression, few expressions of gal-3 on astrocytes were observed in the naïve ON (Figure 3). Sirko et al. have reported that gal-3 is expressed on reactive astrocytes with proliferating astrocytes in the injured gray matter of adult mouse cerebral cortex [51]. By contrast, our previous study demonstrated that astroglial gal-3 expression was not observed in the EAE spinal cord [16]. It might be a different pathological role of astrocytes between the optic nerve and the spinal cord. Reactive astrocytes have both potentially beneficial and detrimental roles during remyelination; indeed, these functions may relate to a particular phenotype that the astrocytes adopt [52,53]. Astrocytes may promote/inhibit remyelination directly, but could also signal through microglia to promote remyelination [54,55,56,57]. Although a detailed mechanism of astrocytes during remyelination has not been well understood and further study will be required for understanding the association of astroglial gal-3 expression with remyelination in ON, our results indicate a possibility that astrocytic gal-3 play a crucial role on remyelination in the chronic ON.

5. Conclusions

In conclusion, our data indicates that gal-3 is a crucial role in microglia/macrophages and astrocytes in response to neuroinflammation in ON. Activation of microglia/macrophages as well as astrocytes is regarded as a double-edged sword, and the protective or harmful effects mediated by gal-3 depend on the disease progression, stages, and severity in the microenvironment. Our study also proposes that gal-3 is a potent therapeutic target for microglia/astrocytes-mediated pathogenesis of ON.

Highlights

MOG-EAE induced optic neuritis can be applied for a deep understanding of the mechanism of ON.
Galectin-3 is upregulated on microglia/macrophages and astrocytes, resulting in neuroinflammatory-mediated demyelination in ON.
Expression of galectin-3 is associated with the NLRP-3 signaling and galectin-3 expressing microglia/macrophages plays a crucial role in phagocytosis in ON.

Supplementary Materials

The following supporting information can be downloaded at the website of this paper posted on Preprints.org.

Author Contributions

Y.B.: Conceptualization, methodology, validation, writing – original draft preparation, review and editing, supervision, funding acquisition, M.F.: Investigation, validation, and writing-original draft preparation, J.NK. and R.S.: Discussion and comments. All authors have read and agreed to the published version of the manuscript.

Funding

This work was supported by the Japan Society for the Promotion of Science (JSPS) KAKENHI Grant Number JP20K07220 (Y.B) /JP23K06313 (Y.B) and Grant from Akita University Graduate School of Medicine (Y.B), Takahashi Industrial and Economic Research Foundation (Y.B).

Conflicts of Interest Statement

Authors have no conflicts of interest with the material presented in this manuscript, and specifically no financial interests.

Abbreviations

BBB blood-brain barrier;
CNS central nervous system;
DAPI 4',6-diamidino-2-phenylindole;
EAE experimental autoimmune encephalomyelitis;
gal-3 galectin-3;
GFAP glial fibrillary acid protein;
Iba-1 ionized calcium-binding adapter molecule 1;
MBP myelin basic protein;
MOG myelin oligodendrocyte glycoprotein;
MS multiple sclerosis;
NLRP3 NLR family pyrin domain containing 3;
NMO neuromyelitis optica, NMO;
ON optic neuritis;
OLs oligodendrocytes;
OPC oligodendrocyte precursor cell;
PBS phosphate buffered saline;
PFA paraformaldehyde

References

  1. Noseworthy, J.H.; Lucchinetti, C.; Rodriguez, M.; Weinshenker, B.G. Multiple sclerosis. N. Engl. J. Med 2000, 343, 938–952. [Google Scholar] [CrossRef]
  2. Reich, D.S.; Lucchinetti, C.F.; Calabresi, P.A. Multiple sclerosis. N. Engl. J. Med 2018, 378, 169–180. [Google Scholar] [CrossRef] [PubMed]
  3. Beck, R.W.; Cleary, P.A.; Anderson, M.M.; Keltner, J.L.; Shults, W.T.; Kaufman, D.I.; Buckley, E.G.; Corbett, J.J.; Kupersmith, M.J.; Miller, N.R.; Savino, P.J.; Guy, J.R.; Trobe, J.D.; McCrary, J.A.; Smith, C.H.; Chrousos, G.A.; Thompson, H.S.; Katz, B.J.; Brodsky, M.C.; Goodwin, J.A.; Atwell, C.W.; the Optic Neuritis Study Group. A randomized, controlled trial of corticosteroids in the treatment of acute optic neuritis. N Engl J Med 1992, 326, 581–588. [Google Scholar] [CrossRef] [PubMed]
  4. Kale, N. Optic neuritis as an early sign of multiple sclerosis. Eye Brain 2016, 8, 195–202. [Google Scholar] [CrossRef]
  5. Bennett, J. Optic Neuritis. Continuum (Minneap Minn) 2019, 25, 1236–1264. [Google Scholar] [CrossRef]
  6. Bando, Y.; Geisler, J.G. Disease modifying mitochondrial uncouplers, MP101, and a slow release ProDrug, MP201, in models of Multiple Sclerosis. Neurochemistry International 2019, 131, 104561. [Google Scholar] [CrossRef] [PubMed]
  7. Ben-Nun, A.; Kaushansky, N.; Kawakami, N.; Krishnamoorthy, G.; Berer, K.; Liblau, R.; Hohlfeld, R.; Wekerle, H. From classic to spontaneous and humanized models of multiple sclerosis: impact on understanding pathogenesis and drug development. J Autoimmun. 2014, 54, 33–50. [Google Scholar] [CrossRef]
  8. Constantinescu, C.S.; Farooqi, N.; O'Brien, K.; Gran, B. Experimental autoimmune encephalomyelitis (EAE) as a model for multiple sclerosis (MS). Br J Pharmacol 2011, 164, 1079–1106. [Google Scholar] [CrossRef]
  9. Cordano, C.; Ramos, C.; Arnow, S.; Cruz-Herranz, A.; Guglielmetti, C.; Iester, M.; Bandini, F. Inflammation in the anterior visual pathway in multiple sclerosis: what do the animal models teach us? Neuroimmunol Neuroinflammation 2021, 8, 185–202. [Google Scholar] [CrossRef]
  10. Redler, Y.; Levy, M. Rodent Models of Optic Neuritis. Front. Neurol 2020, 11, 580951. [Google Scholar] [CrossRef]
  11. Khan, R.S.; Dine, K.; Geisler, J.G.; Shindler, K.S. Mitochondrial Uncoupler Prodrug of 2,4-Dinitrophenol, MP201, Prevents Neuronal Damage and Preserves Vision in Experimental Optic Neuritis. Oxid Med Cell Longev. 2017, 2017, 7180632. [Google Scholar] [CrossRef] [PubMed]
  12. Quinn, T.A.; Dutt, M.; Shindler, K.S. Optic neuritis and retinal ganglion cell loss in a chronic murine model of multiple sclerosis. Front Neurol. 2011, 2, 50. [Google Scholar] [CrossRef]
  13. Shao, H.; Huang, Z.; Sun, S.L.; Kaplan, H.J.; Sun, D. Myelin/oligodendrocyte glycoprotein-specific T-cells induce severe optic neuritis in the C57BL/6 mouse. Invest. Ophthalmol. Vis. Sci. 2004, 45, 4060–4065. [Google Scholar] [CrossRef]
  14. Nio-Kobayashi, J.; Itabashi, T. Galectins and Their Ligand Glycoconjugates in the Central Nervous System Under Physiological and Pathological Conditions. Front Neuroanat. 2021, 15, 767330. [Google Scholar] [CrossRef]
  15. Nishihara, H.; Shimizu, F.; Kitagawa, T.; Yamanaka, N.; Akada, J.; Kuramitsu, Y.; Sano, Y.; Takeshita, Y.; Maeda, T.; Abe, M.; Koga, M.; Nakamura, K.; Kanda, T. Identification of galectin-3 as a possible antibody target for secondary progressive multiple sclerosis. Mult Scler 2017, 23, 382–394. [Google Scholar] [CrossRef] [PubMed]
  16. Itabashi, T.; Arima, Y.; Kamimura, D.; Higuchi, K.; Bando, Y.; Takahashi-Iwanaga, H.; Murakami, M.; Watanabe, M.; Iwanaga, T.; Nio-Kobayashi, J. Cell- and stage-specific localization of galectin-3, a β-galactoside-binding lectin, in a mouse model of experimental autoimmune encephalomyelitis. Neurochem Int 2018, 118, 176–184. [Google Scholar] [CrossRef]
  17. Jiang, H.R.; Al Rasebi, Z.; Mensah-Brown, E.; Shahin, A.; Xu, D.; Goodyear, C.S.; Fukada, S.Y.; Liu, F.T.; Liew, F.Y.; Lukic, M.L. Galectin-3 deficiency reduces the severity of experimental autoimmune encephalomyelitis. J Immunol 2009, 182, 2–1167. [Google Scholar] [CrossRef]
  18. Mendonça, H.R.; Carvalho, J.N.A.; Abreu, C.A.; Mariano de Souza Aguiar Dos Santos, D.; Carvalho, J.R.; Marques, S.A.; da Costa Calaza, K.; Martinez, A.M.B. Lack of Galectin-3 attenuates neuroinflammation and protects the retina and optic nerve of diabetic mice. Brain Research 2018, 1700, 126–137. [Google Scholar] [CrossRef] [PubMed]
  19. Reichert, F.; Rotshenker, S. Galectin-3/MAC-2 in experimental allergic encephalomyelitis. Exp Neurol 1999, 160, 508–514. [Google Scholar] [CrossRef]
  20. Rotshenker, S.; Reichert, F.; Gitik, M.; Haklai, R.; Elad-Sfadia, G.; Kloog, Y. Galectin-3/MAC-2, Ras and PI3K activate complement receptor-3 and scavenger receptor-AI/II mediated myelin phagocytosis in microglia. Glia 2008, 56, 1607–13. [Google Scholar] [CrossRef]
  21. Bando, Y.; Hagiwara, Y.; Suzuki, Y.; Yoshida, K.; Aburakawa, Y.; Kimura, T.; Murakami, C.; Ono, M.; Tanaka, T.; Jiang, Y.P.; Mitrovi, B.; Bochimoto, H.; Yahara, O.; Yoshida, S. Kallikrein 6 secreted by oligodendrocytes regulates the progression of experimental autoimmune encephalomyelitis. Glia 2018, 66, 359–378. [Google Scholar] [CrossRef] [PubMed]
  22. Bando, Y.; Nomura, T.; Bochimoto, H.; Murakami, K.; Tanaka, T.; Watanabe, T.; Yoshida, S. Abnormal morphology of myelin and axon pathology in murine models of multiple sclerosis. Neurochem Int 2015, 81, 16–27. [Google Scholar] [CrossRef]
  23. Bettelli, E.; Pagany, M.; Weiner, H.L.; Linington, C.; Sobel, R.A.; Kuchroo, V.K. Myelin oligodendrocyte glycoprotein-specific T cell receptor transgenic mice develop spontaneous autoimmune optic neuritis. J Exp Med 2003, 197, 1073–1081. [Google Scholar] [CrossRef] [PubMed]
  24. Fonseca-Kelly, Z.; Nassrallah, M.; Uribe, J.; Khan, R.S.; Dine, K.; Dutt, M.; Shindler, K.S. Resveratrol neuroprotection in a chronic mouse model of multiple sclerosis. Front Neurol 2012, 3, 84. [Google Scholar] [CrossRef]
  25. Sun, S.W.; Liang, H.F.; Schmidt, R.E.; Cross, A.H.; Song, S.K. Selective vulnerability of cerebral white matter in a murine model of multiple sclerosis detected using diffusion tensor imaging. Neurobiol Dis. 2007, 28, 30–38. [Google Scholar] [CrossRef]
  26. Cacciaguerra, L.; and Flanagan, E.P. Updates in NMOSD and MOGAD Diagnosis and Treatment: A Tale of Two Central Nervous System Autoimmune Inflammatory Disorders. Neurologic Clinics. 2023. [Google Scholar] [CrossRef]
  27. Hafler, D.A. Multiple sclerosis. J. Clin. Invest 2004, 113, 788–794. [Google Scholar] [CrossRef]
  28. Lassmann, H. Pathogenic mechanisms associated with different clinical courses of multiple sclerosis. Front. Immunol. 2018, 9, 3116. [Google Scholar] [CrossRef]
  29. Rawlinson, C.; Jenkins, S.; Thei, L.; Dallas, M.L.; Chen, R. Post-Ischaemic Immunological Response in the Brain: Targeting Microglia in Ischaemic Stroke Therapy. Brain Sciences. 2020, 10, 159. [Google Scholar] [CrossRef]
  30. Volarevic, V.; Milovanovic, M.; Ljujic, B.; Pejnovic, N.; Arsenijevic, N.; Nilsson, U.; Leffler, H.; Lukic, M.L. Galectin-3 deficiency prevents concanavalin A-induced hepatitis in mice. Hepatology 2012, 55, 1954–1964. [Google Scholar] [CrossRef]
  31. Baaklini, C.S.; Rawji, K.S.; Duncan, G.J.; Ho, M.F.S.; Plemel, J.R. Central Nervous System Remyelination: Roles of Glia and Innate Immune Cells. Front. Mol. Neurosci. 2019, 12, 225. [Google Scholar] [CrossRef] [PubMed]
  32. Lowry, J.R.; Klegeris, A. Emerging roles of microglial cathepsins in neurodegenerative disease. Brain Research Bulletin 2018, 139, 144–156. [Google Scholar] [CrossRef] [PubMed]
  33. Kim, S.; Ock, J.; Kim, A.K.; Lee, H.W.; Cho, J.Y.; Kim, D.R.; Park, J.Y.; Suk, K. Neurotoxicity of microglial cathepsin D revealed by secretome analysis. J. Neurochem. 2007, 103, 2640–2650. [Google Scholar] [CrossRef] [PubMed]
  34. Al Mamun, A.; Wu, Y.; Monalisa, I.; Jia, C.; Zhou, K.; Munir, F.; Xiao, J. Role of pyroptosis in spinal cord injury and its therapeutic implications. J Adv. Res. 2021, 28, 97–109. [Google Scholar]
  35. Orihuela, R.; McPherson, C.A.; Harry, G.J. Microglial M1/M2 polarization and metabolic states. Br J Pharmacol 2016, 173, 649–665. [Google Scholar] [CrossRef] [PubMed]
  36. Bordt, E.A.; Polster, B.M. NADPH oxidase- and mitochondria-derived reactive oxygen species in proinflammatory microglial activation: a bipartisan affair? Free Radical Biol Med 2014, 76, 34–46. [Google Scholar] [CrossRef]
  37. de Rivero Vaccari, J.P.; Dietrich, W.D.; Keane, R.W. Activation and regulation of cellular inflammasomes: gaps in our knowledge for central nervous system injury. J Cerebral Blood Flow Metab 2014, 34, 369–375. [Google Scholar] [CrossRef] [PubMed]
  38. Li, H.; Xiao, L.; He, H.; Zeng, H.; Liu, J.; Jiang, C.; Mei, G.; Yu, J.; Chen, H.; Yao, P.; Tang, Y. Quercetin Attenuates Atherosclerotic Inflammation by Inhibiting Galectin-3-NLRP3 Signaling Pathway. Mol Nutr Food Res 2021, 65, e2000746. [Google Scholar] [CrossRef] [PubMed]
  39. Zahid, A.; Li, B.; Kombe, A.J.K.; Jin, T.; Tao, J. Pharmacological Inhibitors of the NLRP3 Inflammasome. Front. Immunol. 2019, 10, 2538. [Google Scholar] [CrossRef]
  40. Shao, B.Z.; Wei, W.; Ke, P.; Xu, Z.Q.; Zhou, J.X.; Liu, C. Activating cannabinoid receptor 2 alleviates pathogenesis of experimental autoimmune encephalomyelitis via activation of autophagy and inhibiting NLRP 3 inflammasome. CNS Neurosci Ther. 2014, 20, 1021–1028. [Google Scholar] [CrossRef]
  41. Inoue, M.; Williams, K.L.; Gunn, M.D.; Shinohara, M.L. NLRP3 inflammasome induces chemotactic immune cell migration to the CNS in experimental autoimmune encephalomyelitis. Proc Natl Acad Sci USA. 2012, 109, 10480–10485. [Google Scholar] [CrossRef] [PubMed]
  42. Vidoni, C.; Follo, C.; Savino, M.; Melone, M.A.; Isidoro, C. The Role of Cathepsin D in the Pathogenesis of Human Neurodegenerative Disorders. Med Res Rev. 2016, 36, 845–70. [Google Scholar] [CrossRef] [PubMed]
  43. Sosa, R.A.; Murphey, C.; Ji, N.; Cardona, A.E.; Forsthuber, T.G. The kinetics of myelin antigen uptake by myeloid cells in the central nervous system during experimental autoimmune encephalomyelitis. J. Immunol. 2013, 191, 5848–5857. [Google Scholar] [CrossRef]
  44. Rawji, K.S.; Kappen, J.; Tang, W.; Teo, W.; Plemel, J.R.; Stys, P.K.; Yong, V.W. Deficient surveillance and phagocytic activity of myeloid cells within demyelinated lesions in aging mice visualized by ex vivo live multiphoton imaging. J. Neurosci. 2018, 38, 1973–1988. [Google Scholar] [CrossRef] [PubMed]
  45. Tan, Y.; Zheng, Y.; Xu, D.; Sun, Z.; Yang, H.; Yin, Q. Galectin-3: a key player in microglia-mediated neuroinflammation and Alzheimer's disease. Cell Biosci. 2021, 11, 78. [Google Scholar] [CrossRef] [PubMed]
  46. Thomas, L.; Pasquini, L.A. Galectin-3-Mediated Glial Crosstalk Drives Oligodendrocyte Differentiation and (Re)myelination. Front. Cell. Neurosci 2018, 12, 297. [Google Scholar] [CrossRef] [PubMed]
  47. Campagno, K.E.; Mitchell, C.H. The P2X7 Receptor in Microglial Cells Modulates the Endolysosomal Axis, Autophagy and Phagocytosis. Front. Cell. Neurosci. 2021, 15, 645244. [Google Scholar] [CrossRef] [PubMed]
  48. Lively, S.; Schlichter, L.C. Microglia responses to pro-inflammatory stimuli (LPS, IFNγ+TNFα) and reprogramming by resolving cytokines (IL-4, IL-10). Front. Cell. Neurosci. 2018, 12, 215. [Google Scholar] [CrossRef] [PubMed]
  49. Morganti, J.M.; Riparip, L.K.; Rosi, S. Call off the dog(ma): M1/M2 polarization is concurrent following traumatic brain injury. PLoS One 2016, 11, e0148001. [Google Scholar] [CrossRef]
  50. Sirko, S.; Irmler, M.; Gascón, S.; Bek, S.; Schneider, S.; Dimou, L.; Obermann, J.; De Souza Paiva, D.; Poirier, F.; Beckers, J.; Hauck, S.M.; Barde, Y.A.; Götz, M. Astrocyte reactivity after brain injury-: The role of galectins 1 and 3. Glia 2015, 63, 2340–2361. [Google Scholar] [CrossRef]
  51. Liddelow, S.A.; Guttenplan, K.A.; Clarke, L.E.; Bennett, F.C.; Bohlen, C.J.; Schirmer, L.; Bennett, M.L.; Münch, A.E.; Chung, W.S.; Peterson, T.C.; Wilton, D.K.; Frouin, A.; Napier, B.A.; Panicker, N.; Kumar, M.; Buckwalter, M.S.; Rowitch, D.H.; Dawson, V.L.; Dawson, T.M.; Stevens, B.; Barres, B.A. Neurotoxic reactive astrocytes are induced by activated microglia. Nature 2017, 541, 481–487. [Google Scholar] [CrossRef] [PubMed]
  52. Liddelow, S.A.; Barres, B.A. Reactive astrocytes: production, function and therapeutic potential. Immunity 2017, 46, 957–967. [Google Scholar] [CrossRef] [PubMed]
  53. Skripuletz, T.; Hackstette, D.; Bauer, K.; Gudi, V.; Pul, R.; Voss, E.; Berger, K.; Kipp, M.; Baumgärtner, W.; Stangel, M. Astrocytes regulate myelin clearance through recruitment of microglia during cuprizone-induced demyelination. Brain 2013, 136 Pt 1, 147–167. [Google Scholar] [CrossRef] [PubMed]
  54. Syed, Y.A.; Baer, A.S.; Lubec, G.; Hoeger, H.; Widhalm, G.; Kotter, M.R. Inhibition of oligodendrocyte precursor cell differentiation by myelin-associated proteins. Neurosurg. Focus 2008, 24, E5. [Google Scholar] [CrossRef] [PubMed]
  55. Plemel, J.R.; Manesh, S.B.; Sparling, J.S.; Tetzlaff, W. Myelin inhibits oligodendroglial maturation and regulates oligodendrocytic transcription factor expression. Glia 2013, 61, 1471–1487. [Google Scholar] [CrossRef] [PubMed]
  56. Kotter, M.R.; Li, W.W.; Zhao, C.; Franklin, R.J. Myelin impairs CNS remyelination by inhibiting oligodendrocyte precursor cell differentiation. J. Neurosci. 2006, 26, 328–332. [Google Scholar] [CrossRef]
  57. Takano, C.; Takano, T.; Masumura, M.; Nakamura, R.; Koda, S.; Bochimoto, H.; Yoshida, S.; Bando, Y. Involvement of Degenerating 21.5 kDa Isoform of Myelin Basic Protein in the Pathogenesis of the Relapse in Murine Relapsing-Remitting Experimental Autoimmune Encephalomyelitis and MS Autopsied Brain. Int J Mol Sci. 2023, 24, 8160. [Google Scholar] [CrossRef]
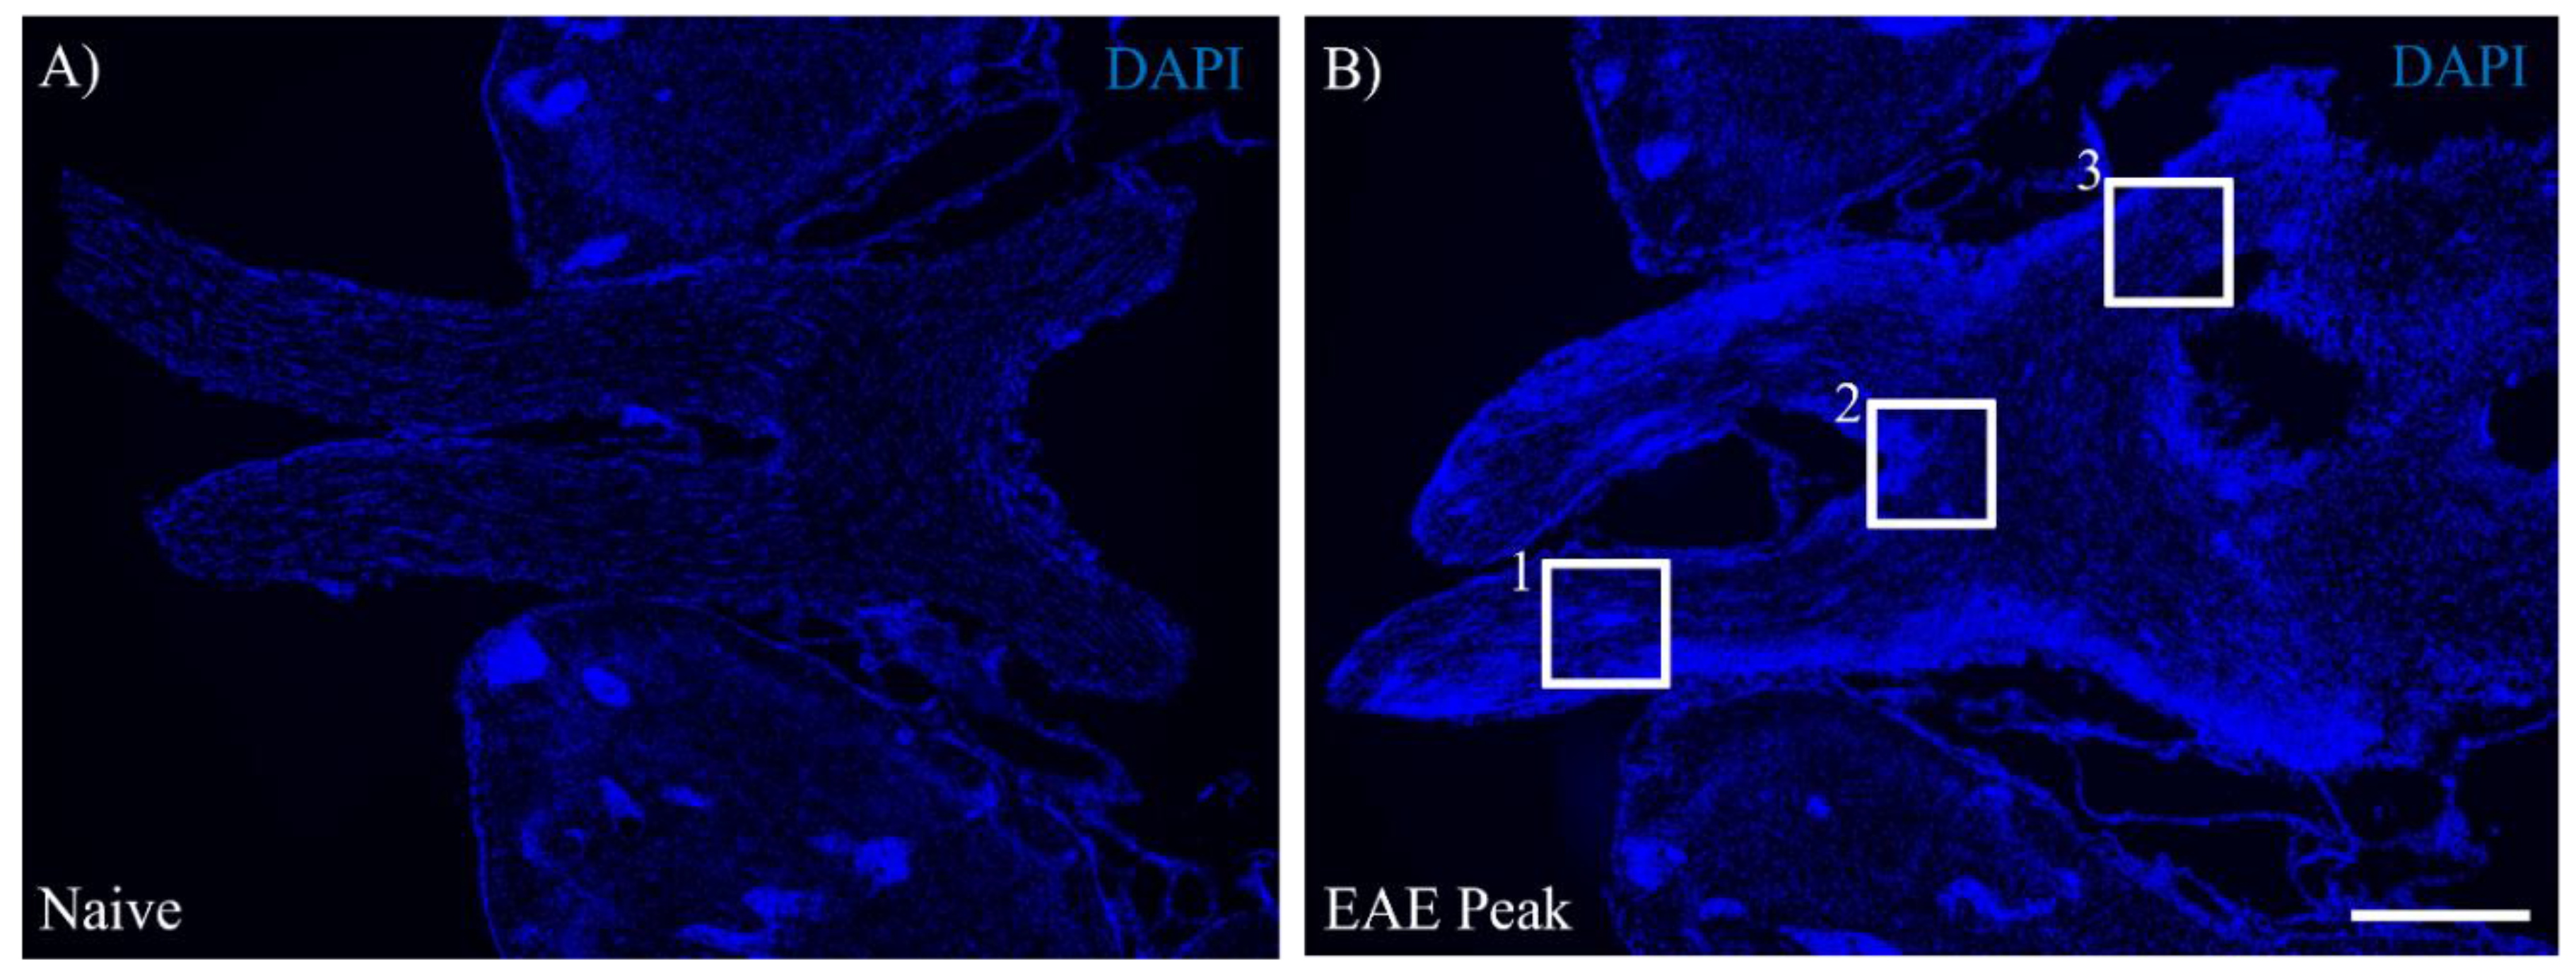
Figure 1. MOG-EAE induced ON. The representative section of the visual pathway including the optic nerve, optic chiasm, and optic tract in naïve (A) and EAE mice at the peak disease (B) was shown. Each section was stained with DAPI (a marker for nuclei, blue). Each inset represents the optic nerve (1), optic chiasm (2), and optic tract (3), respectively. Note that EAE mainly developed meningeal inflammation of the pia matter during the peak disease in the visual pathway compared to naïve mice. Scale bar = 500 μm.
Preprints 89366 g001
Figure 2. Microglial expression of gal-3 during MOG-EAE induced ON. Naïve (A-D) and EAE mice were perfused at either the peak disease (E-I) or the chronic phase (J-M) after MOG immunization and optic nerve to optic tract with brain was taken out. Frozen sections were stained with anti-Iba-1 antibody (a marker for microglia, A, E, J, green) and anti-gal-3 antibody (B, F, K, red). DAPI staining (blue) was also performed. Merged images are also shown (C, D, G, H, I, L, M). Images with high-power magnification of each panel (C, G, L, inset) are shown, respectively (D, H, M). A High-power magnification of panel H (inset) is also shown in panel I. (N-T) Quantitative analysis were shown. The numbers of DAPI+ cells (N), Iba-1+ cells (O), gal-3+ cells (P), gal-3+Iba-1+ cells (Q), and gal-3+Iba-1+ cells/gal-3+ cells (R) in optic nerve of naïve and EAE mice were shown. Six mice per group were examined. (S) Immunoblot analysis showing expression of gal-3 in optic nerve obtained from Naïve and EAE mice. GAPDH was used as a loading control. Representative data is shown. (T) Quantitative analysis of panel S. Ratio of Galectin-3/GAPDH is shown (N = 4). Scale bars: C, G, L: 100 μm, D, H, M: 50 μm, I: 25 μm. *p<0.05, **p<0.01 are shown.
Preprints 89366 g002
Figure 3. Astroglial expression of gal-3 during MOG-EAE induced ON. The frozen cross sections were stained with anti-gal-3 antibody (A, E, I, red) as well as anti-GFAP antibody (a marker for astrocyte, B, F, J, green). Merged images with DAPI staining (blue) are shown in panels (C, G, K), respectively. Images with high-power magnification in inset of each panels C, G, K are also shown (D, H, L), respectively. Representative data are shown. Quantitative analysis of GFAP+ area (M) and gal-3+GFAP+ area (N) are shown (6-9 mice). Scale bars: C, G, K: 100 μm, D, H, L: 50 µm. *p<0.05, **p<0.01.
Preprints 89366 g003
Figure 4. Involvement of gal-3+cells with demyelination in the EAE optic nerve. The frozen cross sections were stained with anti-gal-3 antibody (A, E, I, green) as well as Fluoromyelin (a marker for myelin, B, F, J, red). Merged images with DAPI (blue) are shown (C, D, G, H, K, L). Images with high-power magnification (inset in panels C, G, K) are also shown (D, H, L), respectively. (M) Quantitative analysis of % demyelination is shown (N=3). Scale bars: C, G, K: 100 µm, D, H, L: 50 μm. *p<0.05, **p<0.01.
Preprints 89366 g004
Figure 5. Association of gal-3+Iba-1+cells with demyelination in the EAE optic nerve. The frozen cross sections were triple stained with anti-Iba-1 antibody (A, E, blue), anti-gal-3 antibody (B, F, green). Merged images with Fluoromyelin (red). are shown (C, D, G, H). Images with high-power magnification of panels C and G (inset) are also shown (D and H), respectively. Three mice per group were examined. Representative data is shown. Scale bars: A-C, E-G:100 µm, D, H: 50 μm.
Preprints 89366 g005
Figure 6. Co-expression of Cathepsin-D and gal-3 in the EAE optic nerve. The frozen cross sections were stained with anti-gal-3 antibody (A, D, red) as well as anti-Cathepsin-D antibody (a marker for phagocytotic microglia/macrophages, B, E, green). Merged images with DAPI staining (blue) are shown (C, F, G). Images with high-power magnification of panel F (inset) is also shown (G). Arrowheads represent gal-3+ cells expressing cathepsin-D. Representative data are shown. (H) Quantitative analysis of Cathepsin-D+gal-3+/gal-3+ cells (N=6). Note that about 80% of gal-3+ cells expressed cathepsin-D in EAE optic nerve at peak disease. Scale bars: A-C: 100 μm, D-F: 50 µm, G: 25 µm.
Preprints 89366 g006
Figure 7. Expression of NLRP3 in gal-3+Iba-1+cells in optic nerve of EAE. The frozen cross sections from naïve (A-D), EAE at peak disease (E-H) and EAE at chronic phase (I-L) were triple-stained with anti-Iba-1 antibody (A, E, I , blue), anti-gal-3 antibody (B, F, J , green) and NLRP3 (marker for inflammasome, C, G, K, red). Merged images are shown (D, H, L, M). Images of high-power magnification (panel H, inset) are also shown (I-L). (M) An image of high-power magnification of panel L (inset) is shown. Arrowheads show gal-3+Iba-1+NLRP3+cells in optic nerve of EAE mice. Representative data are shown. Quantitative analysis of the number of gal-3+Iba-1+NLRP3+cells in optic nerve (N) and the ratio of gal-3+Iba-1+NLRP3+/ gal-3+Iba-1+cells in optic nerve (O). Three mice per group were examined. Scale bars: A-D: 100 μm, E-H: 50 µm, I-L: 25 µm. *p<0.05, **p<0.01.
Preprints 89366 g007aPreprints 89366 g007b
Figure 8. Expression of gal-3 in Cathepsin-D+NLRP3+cells in optic nerve of EAE. (A, C) The frozen cross sections in optic nerve of EAE mice at peak disease were stained with anti-Cathepsin-D antibody (green), anti-NLRP3 antibody (red) and DAPI (blue). An image with high-power magnification in panel A (inset) is shown in panel C. (B, D) The frozen cross sections in optic nerve of EAE mice at peak disease were also stained with anti-Cathepsin-D antibody (green), anti-NLRP3 antibody (red), anti-gal-3 antibody (cyan) and DAPI (blue). An image with high-power magnification in panel B (inset) is shown in panel D. Scale bars: A-B: 50 μm, C-D: 25 μm.
Preprints 89366 g008
Disclaimer/Publisher’s Note: The statements, opinions and data contained in all publications are solely those of the individual author(s) and contributor(s) and not of MDPI and/or the editor(s). MDPI and/or the editor(s) disclaim responsibility for any injury to people or property resulting from any ideas, methods, instructions or products referred to in the content.
Copyright: This open access article is published under a Creative Commons CC BY 4.0 license, which permit the free download, distribution, and reuse, provided that the author and preprint are cited in any reuse.
Prerpints.org logo

Preprints.org is a free preprint server supported by MDPI in Basel, Switzerland.

Subscribe

© 2024 MDPI (Basel, Switzerland) unless otherwise stated