Submitted:
01 November 2023
Posted:
02 November 2023
You are already at the latest version
Abstract
Keywords:
1. Introduction
| AHA/BHA | Chemical Structure | Acidity | Source Reference |
|---|---|---|---|
| Glycolic Acid | HOCH2COOH | pKa 3.8 | Sugar Cane, Fruit acids |
| Lactic Acid | CH3CH(OH)COOH | pKa 3.8 | Milk, Yogurt, Sauerkraut |
| Citric Acid | C6H8O7 | pKa 3.1, 4.7, 6.4 | Citrus Fruits |
| Malic Acid | C4H6O5 | pKa 3.4, 5.1 | Apples, Pears |
| Tartaric Acid | C4H6O6 | pKa 2.2, 3.0 | Grapes, Berries |
| Salicylic Acid | C7H6O3 | pKa 2.98 | Willow Bark, Wintergreen Oil |
2. Mechanism of biological actions of Has
3. Material and Methods
3.1. Materials
3.1.1. Preparation of Pullulan Solution
3.1.2. PVA solution
3.1.3. Solution Preparation
3.2. Material Characterization
3.2.1. Scanning Electron Microscopy (SEM)
3.2.2. Fourier Transform Infrared Spectroscopy (FTIR)
3.2.3. Contact Angle
3.3. Biocompatibility Assay
3.3.1. MTT Assay
4. Results
4.1. Characterization of Pullulan Collagen encapsulated AHA BHA nanofibers
4.2. Contact angle
4.3. Biocompatibility Assessments
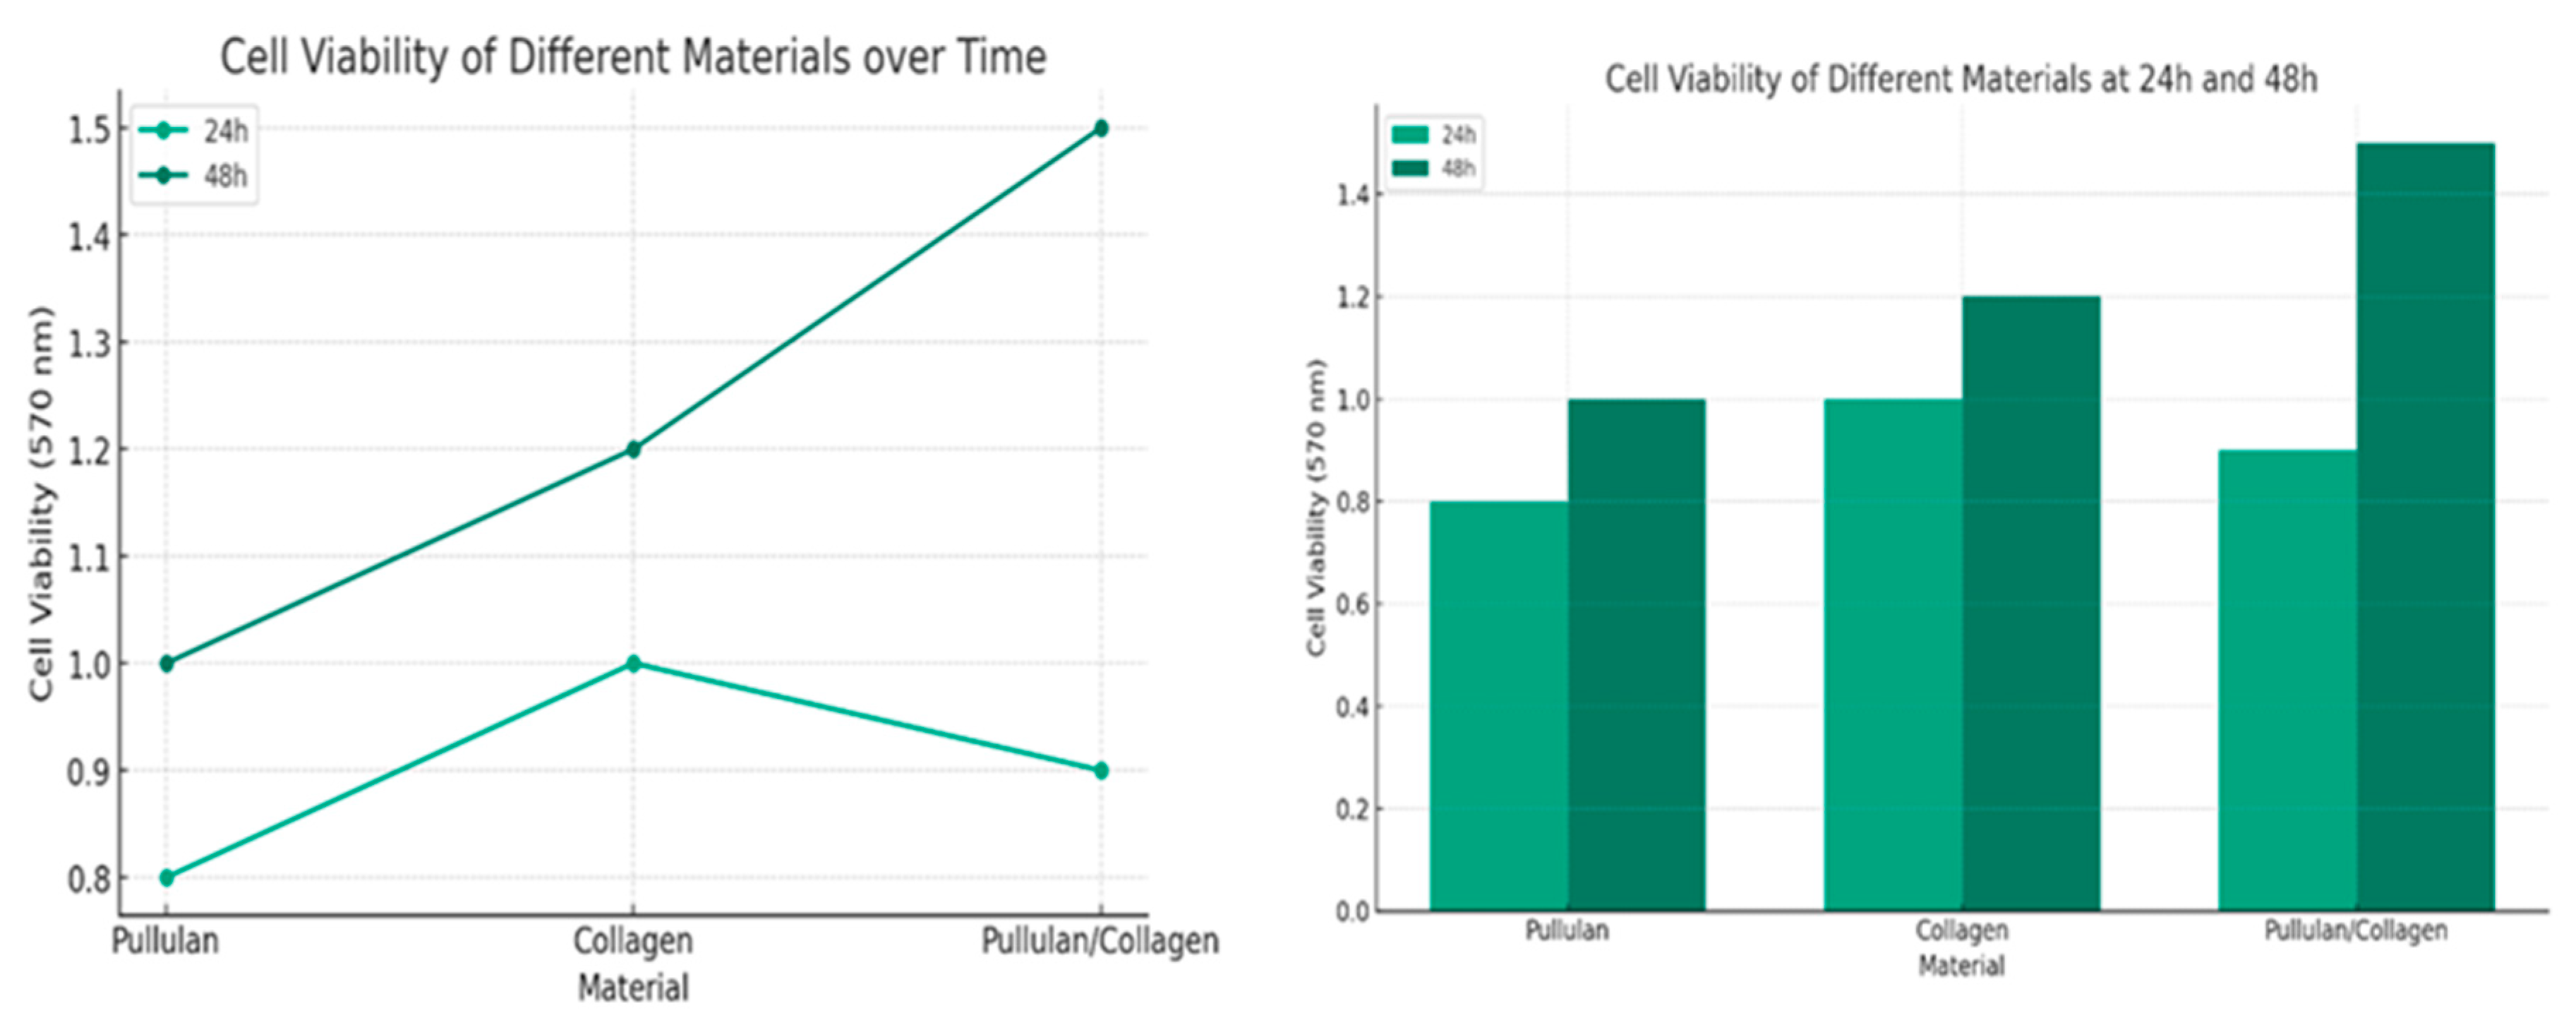
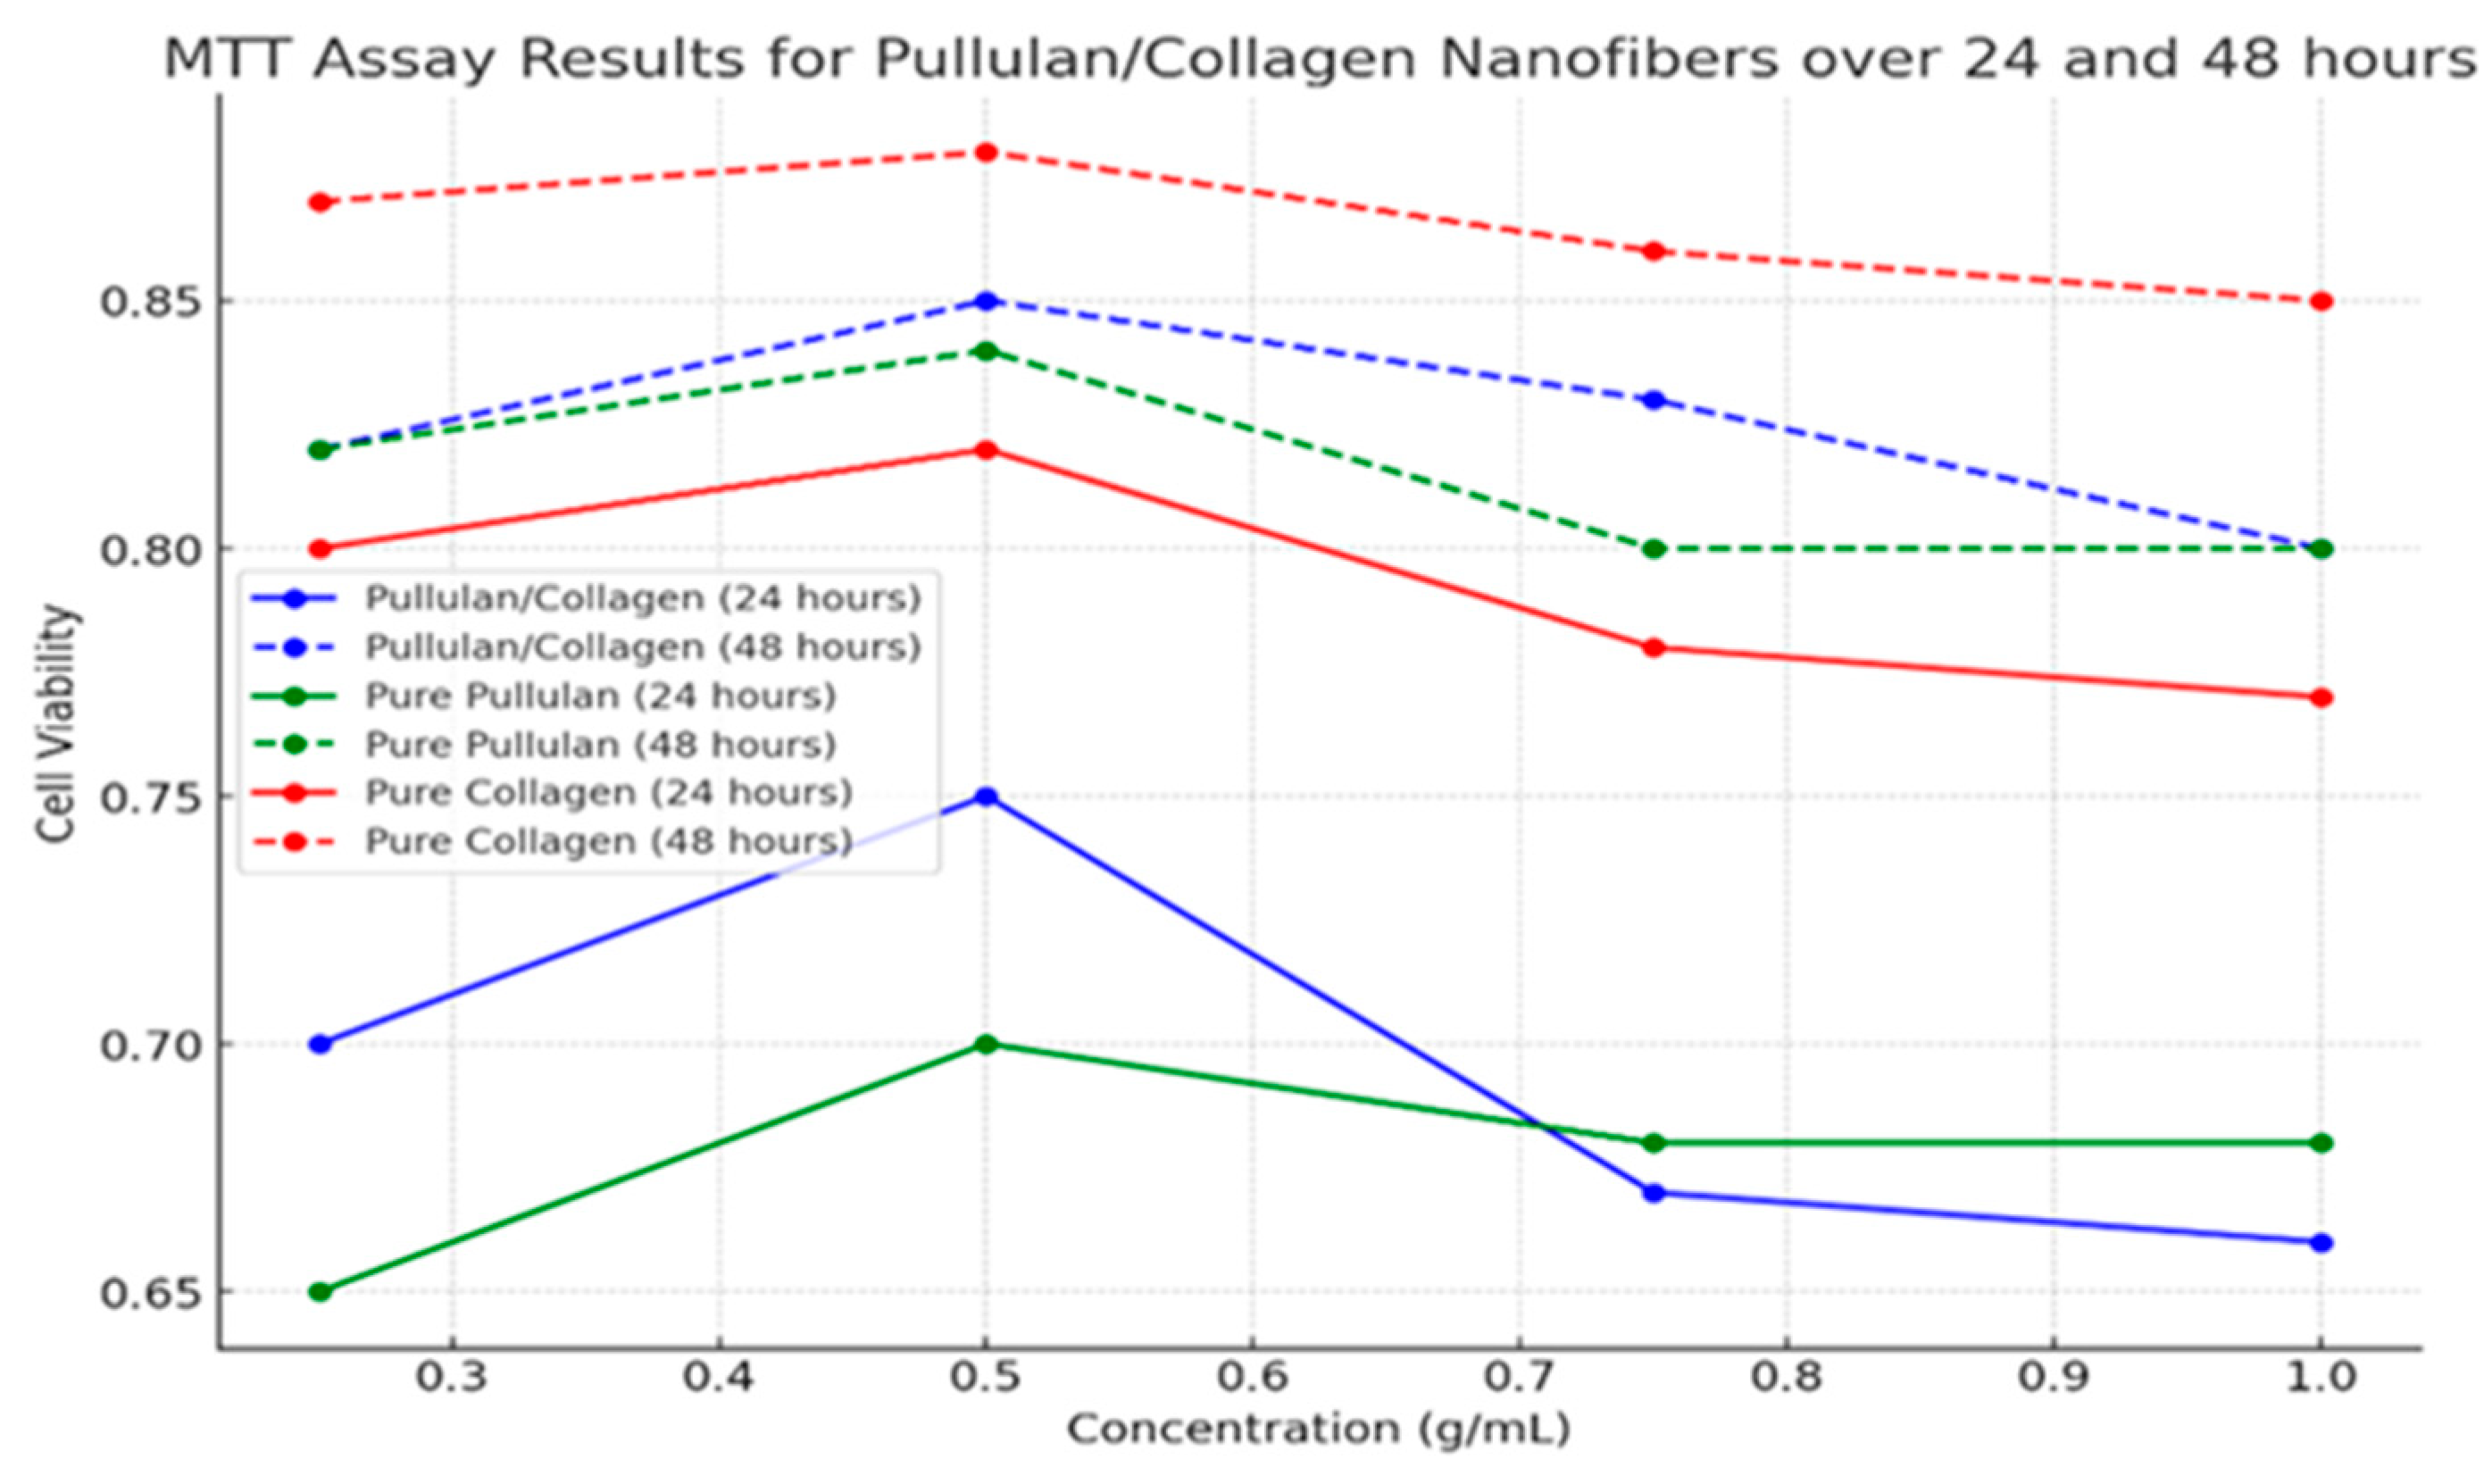
| Concentration (g/mL) | Cell Viability at 24 hours | Cell Viability at 48 hours |
|---|---|---|
| Pullulan/Collagen | ||
| 0.25 | 0.70 | 0.82 |
| 0.50 | 0.75 | 0.85 |
| 0.75 | 0.67 | 0.83 |
| 1.00 | 0.66 | 0.80 |
| Pure Pullulan | ||
| 0.25 | 0.65 | 0.82 |
| 0.50 | 0.70 | 0.84 |
| 0.75 | 0.68 | 0.80 |
| 1.00 | 0.68 | 0.80 |
| Pure Collagen | ||
| 0.25 | 0.80 | 0.87 |
| 0.50 | 0.82 | 0.88 |
| 0.75 | 0.78 | 0.86 |
| 1.00 | 0.77 | 0.85 |
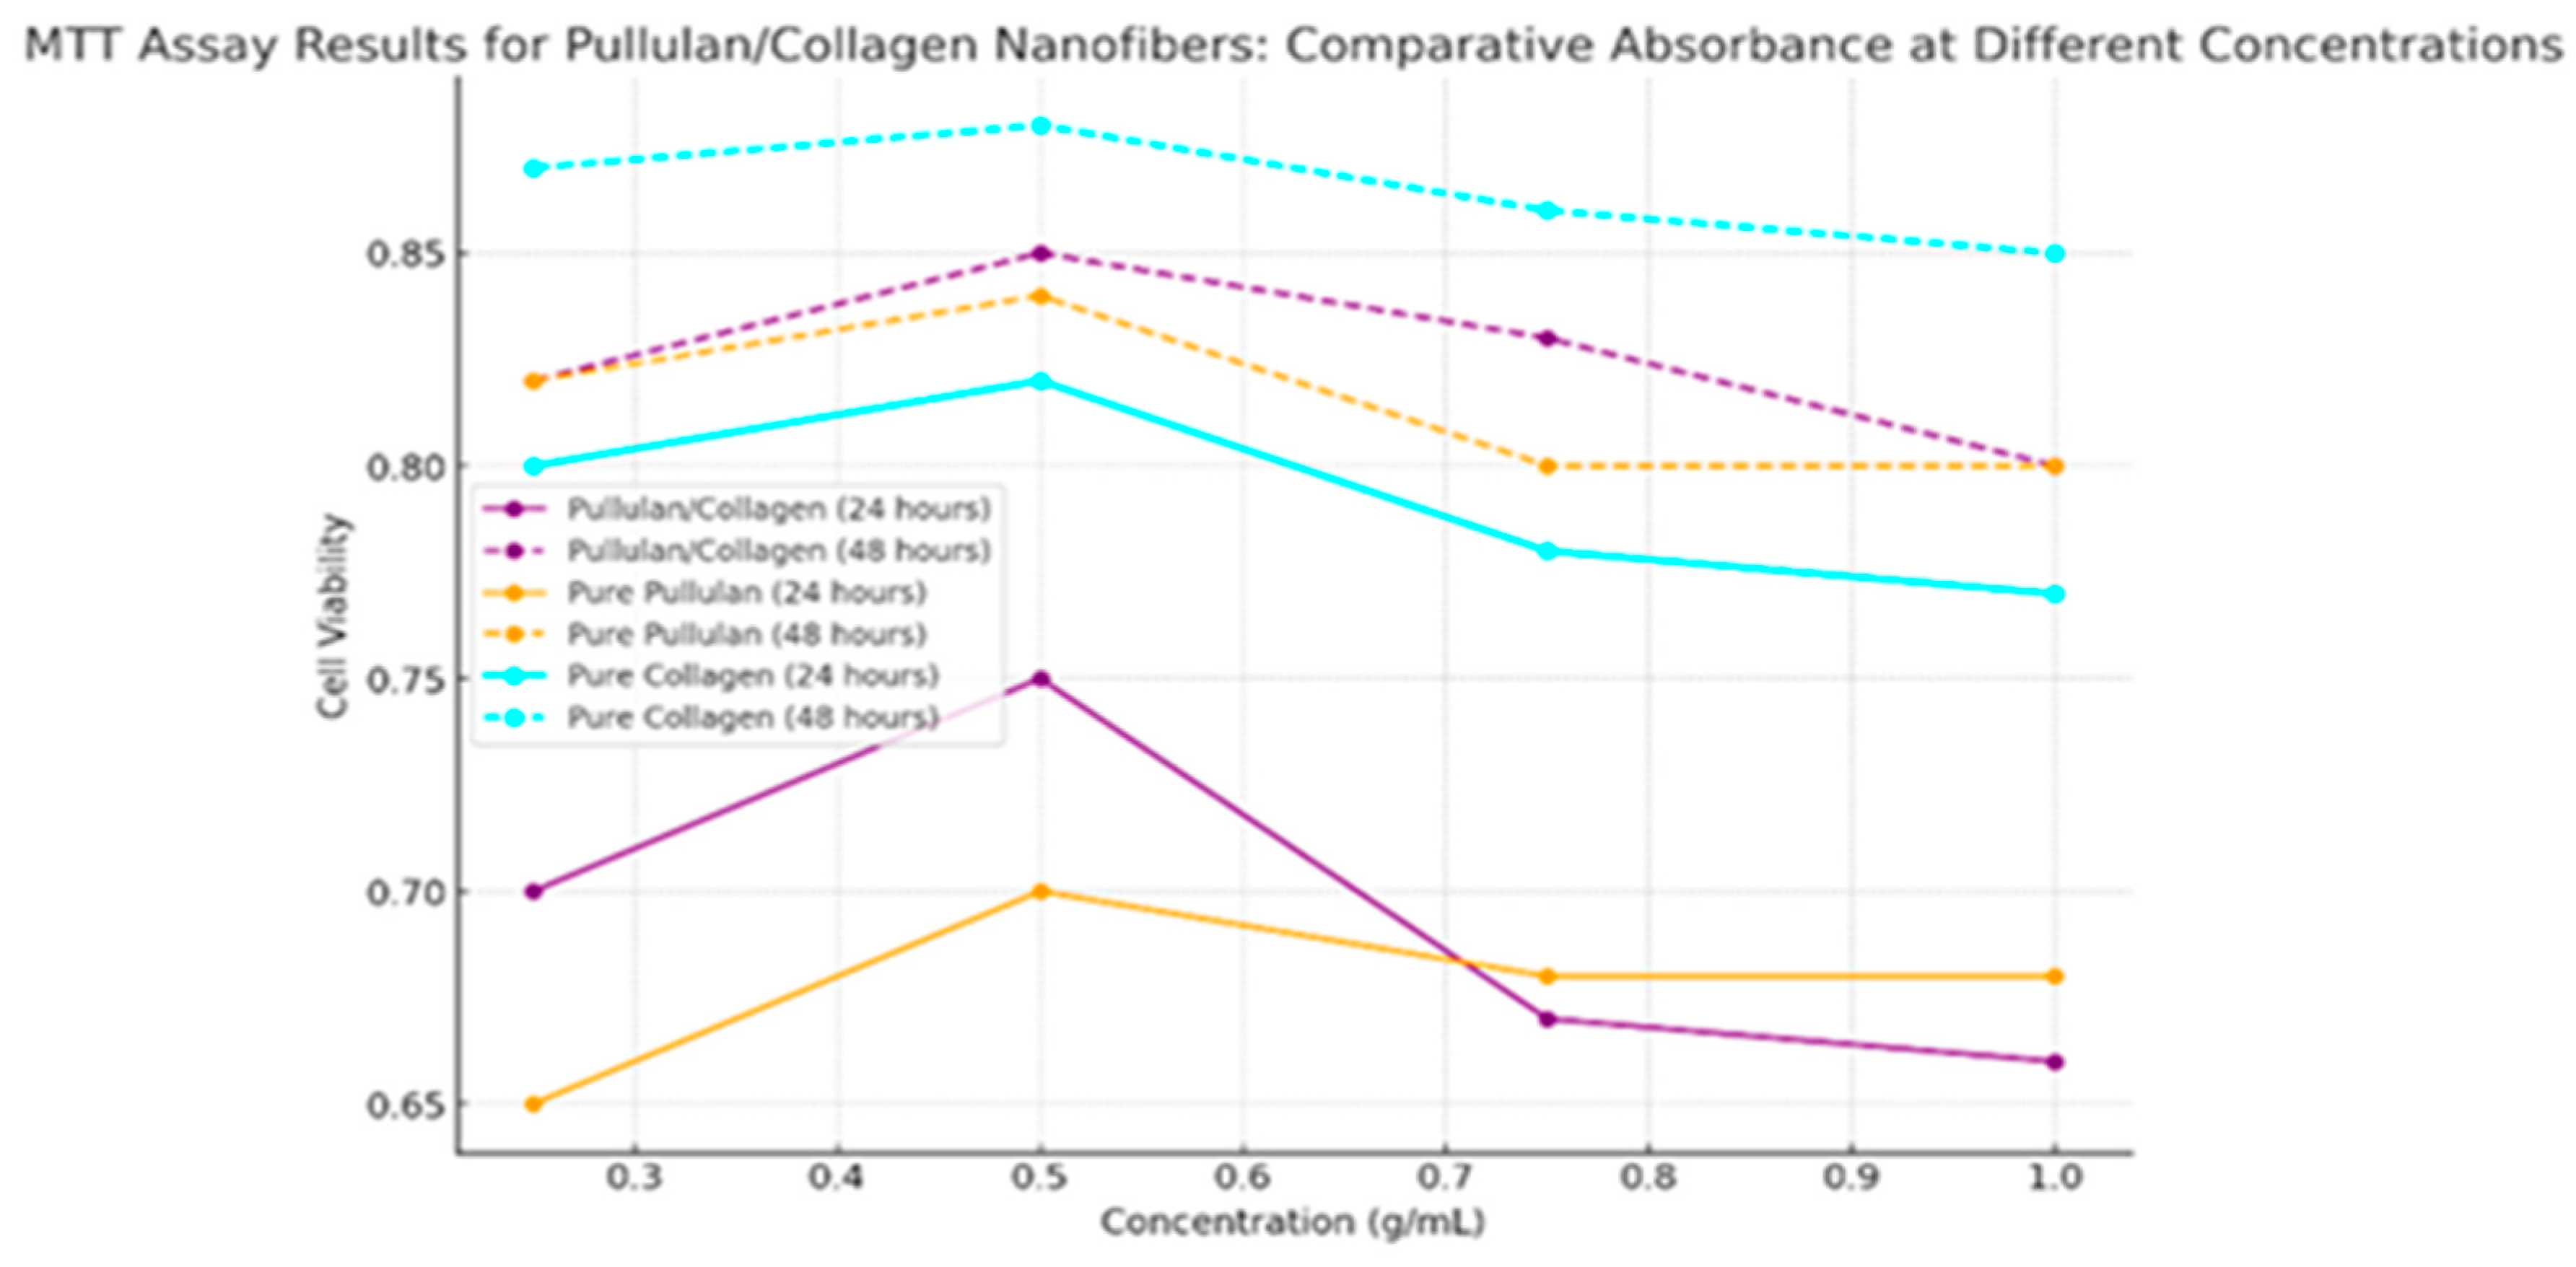
| Concentration (g/mL) | Pullulan/Collagen Cell Viability at 24 hours | Pullulan/Collagen Cell Viability at 48 hours | Pure Pull at 24 hours | Pure Pull at 48 hours | Pure Collagen at 24 hours | Pure Collagen at 48 hours |
|---|---|---|---|---|---|---|
| 0.25 | 0.70 | 0.82 | 0.65 | 0.82 | 0.80 | 0.87 |
| 0.50 | 0.75 | 0.85 | 0.70 | 0.84 | 0.82 | 0.88 |
| 0.75 | 0.67 | 0.83 | 0.68 | 0.80 | 0.78 | 0.86 |
| 1.00 | 0.66 | 0.80 | 0.68 | 0.80 | 0.77 | 0.85 |
5. Conclusions
References
- Arda O, Göksügür N, Tüzün Y. Basic histological structure and functions of facial skin. Clin Dermatol 2014;32:3–13. [CrossRef]
- Jensen JM, Proksch E. The skin's barrier. G Ital Dermatol Venereol 2009;144:689–700.
- Kaziga R, Muchunguzi C, Achen D, Kools S. Beauty Is Skin Deep; The Self-Perception of Adolescents and Young Women in Construction of Body Image within the Ankole Society. Int J Environ Res Public Health 2021;18:7840. [CrossRef]
- Choi JH, Jin SW, Lee GH, Cho SM, Jeong HG. Orostachys japonicus ethanol extract inhibits 2,4-dinitrochlorobenzene-induced atopic dermatitis-like skin lesions in NC/Nga mice and TNF-α/IFN-γ-induced TARC expression in HaCaT cells. Toxicol Res 2019;36:99–108. [CrossRef]
- Reduan FH, Shaari RM, Sayuti NSA, Mustapha NM, Abu Bakar MZ, Sithambaram S, et al. Acute and subacute dermal toxicity of ethanolic extract of Melastoma malabathricum leaves in Sprague-Dawley rats. Toxicol Res 2020;36:203–10. [CrossRef]
- Avci P, Sadasivam M, Gupta A, De Melo WC, Huang Y-Y, Yin R, et al. Animal models of skin disease for drug discovery. Expert Opin Drug Discov 2013;8:331–55. [CrossRef]
- Balls M. Postponement of the EU ban on animal tests for cosmetic ingredients. Altern Lab Anim 1997;25:401–3.
- Kuehn BM. The EU bans cosmetics testing on animals. J Am Vet Med Assoc 2003;222:559.
- Dellambra E, Odorisio T, D'Arcangelo D, Failla CM, Facchiano A. Non-animal models in dermatological research. ALTEX 2019;36:177–202. [CrossRef]
- Agonia AS, Palmeira-de-Oliveira A, Cardoso C, Augusto C, Pellevoisin C, Videau C, et al. Reconstructed Human Epidermis: An Alternative Approach for In Vitro Bioequivalence Testing of Topical Products. Pharmaceutics 2022;14:1554. [CrossRef]
- Plaza C, Meyrignac C, Botto J-M, Capallere C. Characterization of a New Full-Thickness In Vitro Skin Model. Tissue Eng Part C Methods 2021;27:411–20. [CrossRef]
- Zeltinger J, Holbrook KA. A model system for long-term serum-free suspension organ culture of human fetal tissues: experiments on digits and skin from multiple body regions. Cell Tissue Res 1997;290:51–60. [CrossRef]
- Mavon A, Bacqueville D, Wever B. Reconstructed human skin and skin organ culture models used in cosmetic efficacy testing. Handbook of Cosmetic Science and Technology, Third Edition, 2009, p. 345–56.
- Filaire E, Nachat-Kappes R, Laporte C, Harmand M-F, Simon M, Poinsot C. Alternative in vitro models used in the main safety tests of cosmetic products and new challenges. Int J Cosmet Sci 2022;44:604–13. [CrossRef]
- eBooks.com. Cosmeceuticals and Cosmetic Ingredients. EBooksCom n.d. https://www.ebooks.com/en-cz/book/1189015/cosmeceuticals-and-cosmetic-ingredients/leslie-s-baumann/ (accessed March 2, 2023).
- Kabene S, Baadel S. Bioethics: a look at animal testing in medicine and cosmetics in the UK. J Med Ethics Hist Med 2019;12:15. [CrossRef]
- 17. Józsa L, Nemes D, Pető Á, Kósa D, Révész R, Bácskay I, et al. Recent Options and Techniques to Assess Improved Bioavailability: In Vitro and Ex Vivo Methods. Pharmaceutics 2023;15:1146. [CrossRef]
- Goddard ED, Gruber JV, editors. Principles of polymer science and technology in cosmetics and personal care. New York: Marcel Dekker; 1999.
- Baumann L. Cosmetic Dermatology: Principles and Practice, Second Edition. Mcgraw-hill; 2009.
- Debeer S, Le Luduec J-B, Kaiserlian D, Laurent P, Nicolas J-F, Dubois B, et al. Comparative histology and immunohistochemistry of porcine versus human skin. Eur J Dermatol 2013;23:456–66. [CrossRef]
- Ba G, Rj Y, Ej VS. Clinical and cosmeceutical uses of hydroxyacids. Clinics in Dermatology 2009;27. [CrossRef]
- Yu RJ, Van Scott EJ. Hydroxycarboxylic acids, N-acetylamino sugars, and N-acetylamino acids. Skinmed 2002;1:117–22; quiz 125–6. [CrossRef]
- Kornhauser A, Coelho SG, Hearing VJ. Effects of Cosmetic Formulations Containing Hydroxyacids on Sun-Exposed Skin: Current Applications and Future Developments. Dermatol Res Pract 2012;2012:710893. [CrossRef]
- Rostkowska E, Poleszak E, Wojciechowska K, Dos Santos Szewczyk K. Dermatological Management of Aged Skin. Cosmetics 2023;10:55. [CrossRef]
- Mawazi SM, Ann J, Othman N, Khan J, Alolayan SO, Al thagfan SS, et al. A Review of Moisturizers; History, Preparation, Characterization and Applications. Cosmetics 2022;9:61. [CrossRef]
- Milosheska D, Roškar R. Use of Retinoids in Topical Antiaging Treatments: A Focused Review of Clinical Evidence for Conventional and Nanoformulations. Adv Ther 2022;39:5351–75. [CrossRef]
- Zhou H, Luo D, Chen D, Tan X, Bai X, Liu Z, et al. Current Advances of Nanocarrier Technology-Based Active Cosmetic Ingredients for Beauty Applications. Clin Cosmet Investig Dermatol 2021;14:867–87. [CrossRef]
- Alpha Hydroxy Acid (AHA) / Beta Hydroxy Acid (BHA), 2010.
- Tran D, Townley JP, Barnes TM, Greive KA. An antiaging skin care system containing alpha hydroxy acids and vitamins improves the biomechanical parameters of facial skin. Clin Cosmet Investig Dermatol 2014;8:9–17. [CrossRef]
- Dayal S, Kaur R, Sahu P. Efficacy of Microneedling With 35% Glycolic Acid Peels Versus Microneedling With 15% Trichloroacetic Acid Peels in Treatment of Atrophic Acne Scars: A Randomized Controlled Trial. Dermatol Surg 2022;48:1203–9. [CrossRef]
- Thawabteh AM, Jibreen A, Karaman D, Thawabteh A, Karaman R. Skin Pigmentation Types, Causes and Treatment—A Review. Molecules 2023;28:4839. [CrossRef]
- Lee H-S, Kim I-H. Salicylic acid peels for the treatment of acne vulgaris in Asian patients. Dermatol Surg 2003;29:1196–9; discussion 1199. [CrossRef]
- Endly DC, Miller RA. Oily Skin: A review of Treatment Options. J Clin Aesthet Dermatol 2017;10:49–55.
- Makrantonaki E, Ganceviciene R, Zouboulis C. An update on the role of the sebaceous gland in the pathogenesis of acne. Dermatoendocrinol 2011;3:41–9. [CrossRef]
- Zheng Y, Liang H, Zhou M, Song L, He C. Skin bacterial structure of young females in China: The relationship between skin bacterial structure and facial skin types. Exp Dermatol 2021;30:1366–74. [CrossRef]
- Goodman G. Cleansing and moisturizing in acne patients. Am J Clin Dermatol 2009;10 Suppl 1:1–6. [CrossRef]
- Tang S-C, Yang J-H. Dual Effects of Alpha-Hydroxy Acids on the Skin. Molecules 2018;23:863. [CrossRef]
- Oge’ LK, Broussard A, Marshall MD. Acne Vulgaris: Diagnosis and Treatment. Am Fam Physician 2019;100:475–84.
- Hwang J, Jeong H, Lee N, Hur S, Lee N, Han JJ, et al. Ex Vivo Live Full-Thickness Porcine Skin Model as a Versatile In Vitro Testing Method for Skin Barrier Research. International Journal of Molecular Sciences 2021;22:657. [CrossRef]
- 40. Sabzevari N, Qiblawi S, Norton S, Fivenson D. Sunscreens: UV filters to protect us: Part 1: Changing regulations and choices for optimal sun protection. International Journal of Women's Dermatology 2021;7:28–44. [CrossRef]
- Tahir R, Albargi HB, Ahmad A, Qadir MB, Khaliq Z, Nazir A, et al. Development of Sustainable Hydrophilic Azadirachta indica Loaded PVA Nanomembranes for Cosmetic Facemask Applications. Membranes (Basel) 2023;13:156. [CrossRef]
- Dayan N. 4 - Delivery System Design in Topically Applied Formulations: An Overview. In: Rosen MR, editor. Delivery System Handbook for Personal Care and Cosmetic Products, Norwich, NY: William Andrew Publishing; 2005, p. 101–18. [CrossRef]
- Cimini A, Imperi E, Picano A, Rossi M. Electrospun nanofibers for medical face mask with protection capabilities against viruses: State of the art and perspective for industrial scale-up. Appl Mater Today 2023;32:101833. [CrossRef]
- Aguilar-Toalá JE, Quintanar-Guerrero D, Liceaga AM, Zambrano-Zaragoza ML. Encapsulation of bioactive peptides: a strategy to improve the stability, protect the nutraceutical bioactivity and support their food applications. RSC Adv n.d.;12:6449–58. [CrossRef]
- Pacheco G, Mello C, Chiari-Andréo B, Isaac V, Ribeiro S, Pecoraro E, et al. Bacterial cellulose skin masks—Properties and sensory tests. Journal of Cosmetic Dermatology 2017;17. [CrossRef]
- Quattrone A, Czajka A, Sibilla S. Thermosensitive Hydrogel Mask Significantly Improves Skin Moisture and Skin Tone; Bilateral Clinical Trial. Cosmetics 2017;4:17. [CrossRef]
- Huang C, Xu X, Fu J, Yu D-G, Liu Y. Recent Progress in Electrospun Polyacrylonitrile Nanofiber-Based Wound Dressing. Polymers (Basel) 2022;14:3266. [CrossRef]
- Shen R, Guo Y, Wang S, Tuerxun A, He J, Bian Y. Biodegradable Electrospun Nanofiber Membranes as Promising Candidates for the Development of Face Masks. International Journal of Environmental Research and Public Health 2023;20:1306. [CrossRef]
- Rahman MZ, Hoque ME, Alam MR, Rouf MA, Khan SI, Xu H, et al. Face Masks to Combat Coronavirus (COVID-19)—Processing, Roles, Requirements, Efficacy, Risk and Sustainability. Polymers (Basel) 2022;14:1296. [CrossRef]
- Essa WK, Yasin SA, Saeed IA, Ali GAM. Nanofiber-Based Face Masks and Respirators as COVID-19 Protection: A Review. Membranes 2021;11. [CrossRef]
- Zare M, Dziemidowicz K, Williams GR, Ramakrishna S. Encapsulation of Pharmaceutical and Nutraceutical Active Ingredients Using Electrospinning Processes. Nanomaterials (Basel) 2021;11:1968. [CrossRef]
- Naragund VS, Panda PK. Electrospun nanofiber-based respiratory face masks—a review. Emergent Mater 2022;5:261–78. [CrossRef]
- Rodan K, Fields K, Majewski G, Falla T. Skincare Bootcamp: The Evolving Role of Skincare. Plast Reconstr Surg Glob Open 2016;4:e1152. [CrossRef]
- Wang X. A theory for the mechanism of action of the alpha-hydroxy acids applied to the skin. Med Hypotheses 1999;53:380–2. [CrossRef]
- Wang X. A theory for the mechanism of homocysteine-induced vascular pathogenesis. Medical Hypotheses 1999;53:386–94. [CrossRef]
- 56. Okano Y, Abe Y, Masaki H, Santhanam U, Ichihashi M, Funasaka Y. Biological effects of glycolic acid on dermal matrix metabolism mediated by dermal fibroblasts and epidermal keratinocytes. Exp Dermatol 2003;12 Suppl 2:57–63. [CrossRef]
- Bernstein EF, Lee J, Brown DB, Yu R, Van Scott E. Glycolic acid treatment increases type I collagen mRNA and hyaluronic acid content of human skin. Dermatol Surg 2001;27:429–33. [CrossRef]
- Rendl M, Mayer C, Weninger W, Tschachler E. Topically applied lactic acid increases spontaneous secretion of vascular endothelial growth factor by human reconstructed epidermis. Br J Dermatol 2001;145:3–9. [CrossRef]
| Ingredient | Chemical Name | Function | Amount | Benefits on the Skin |
|---|---|---|---|---|
| AHA | Glycolic acid | Exfoliation | 5-10% concentration | Removes dead skin cells, promotes cell turnover, and smoother skin |
| AHA | Lactic acid | Exfoliation | 2-5% concentration | Improves texture, reduces fine lines and wrinkles |
| AHA | Mandelic acid | Exfoliation | 5-10% concentration | Brightens skin evens out skin tone |
| BHA | Salicylic acid | Acne treatment | 0.5-2% concentration | Unclogs pores reduce sebum production, prevents breakouts |
| BHA | Betaine salicylate | Acne treatment | 0.5-2% concentration | Gentle exfoliation reduces inflammation |
| ACI (g) | Spin parameter | Collagen Concentration | Pullulan Concentration | Result |
|---|---|---|---|---|
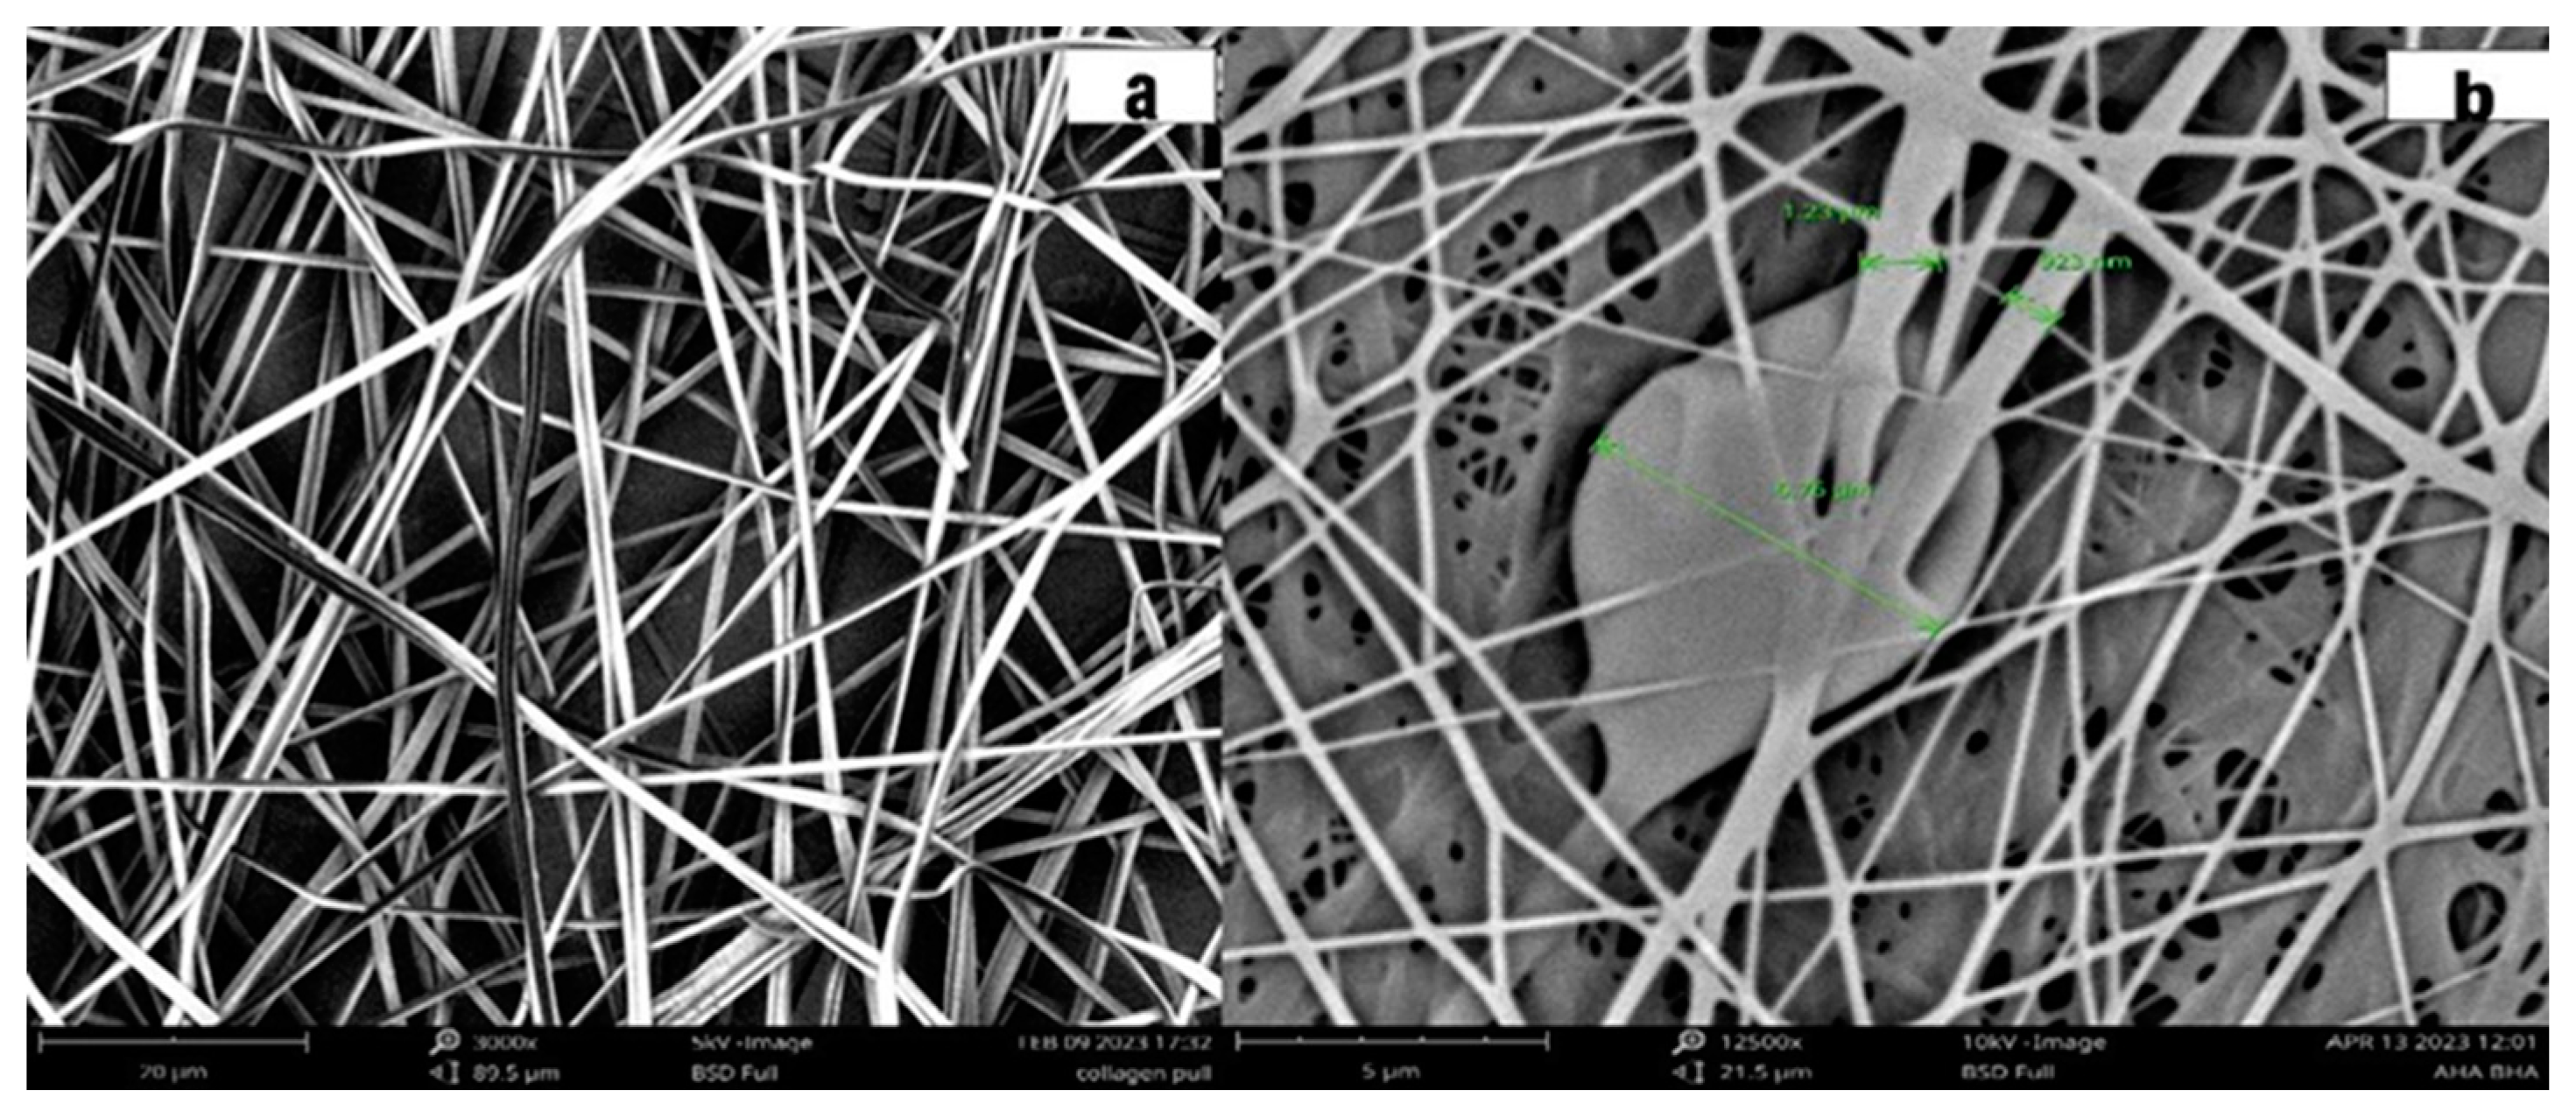
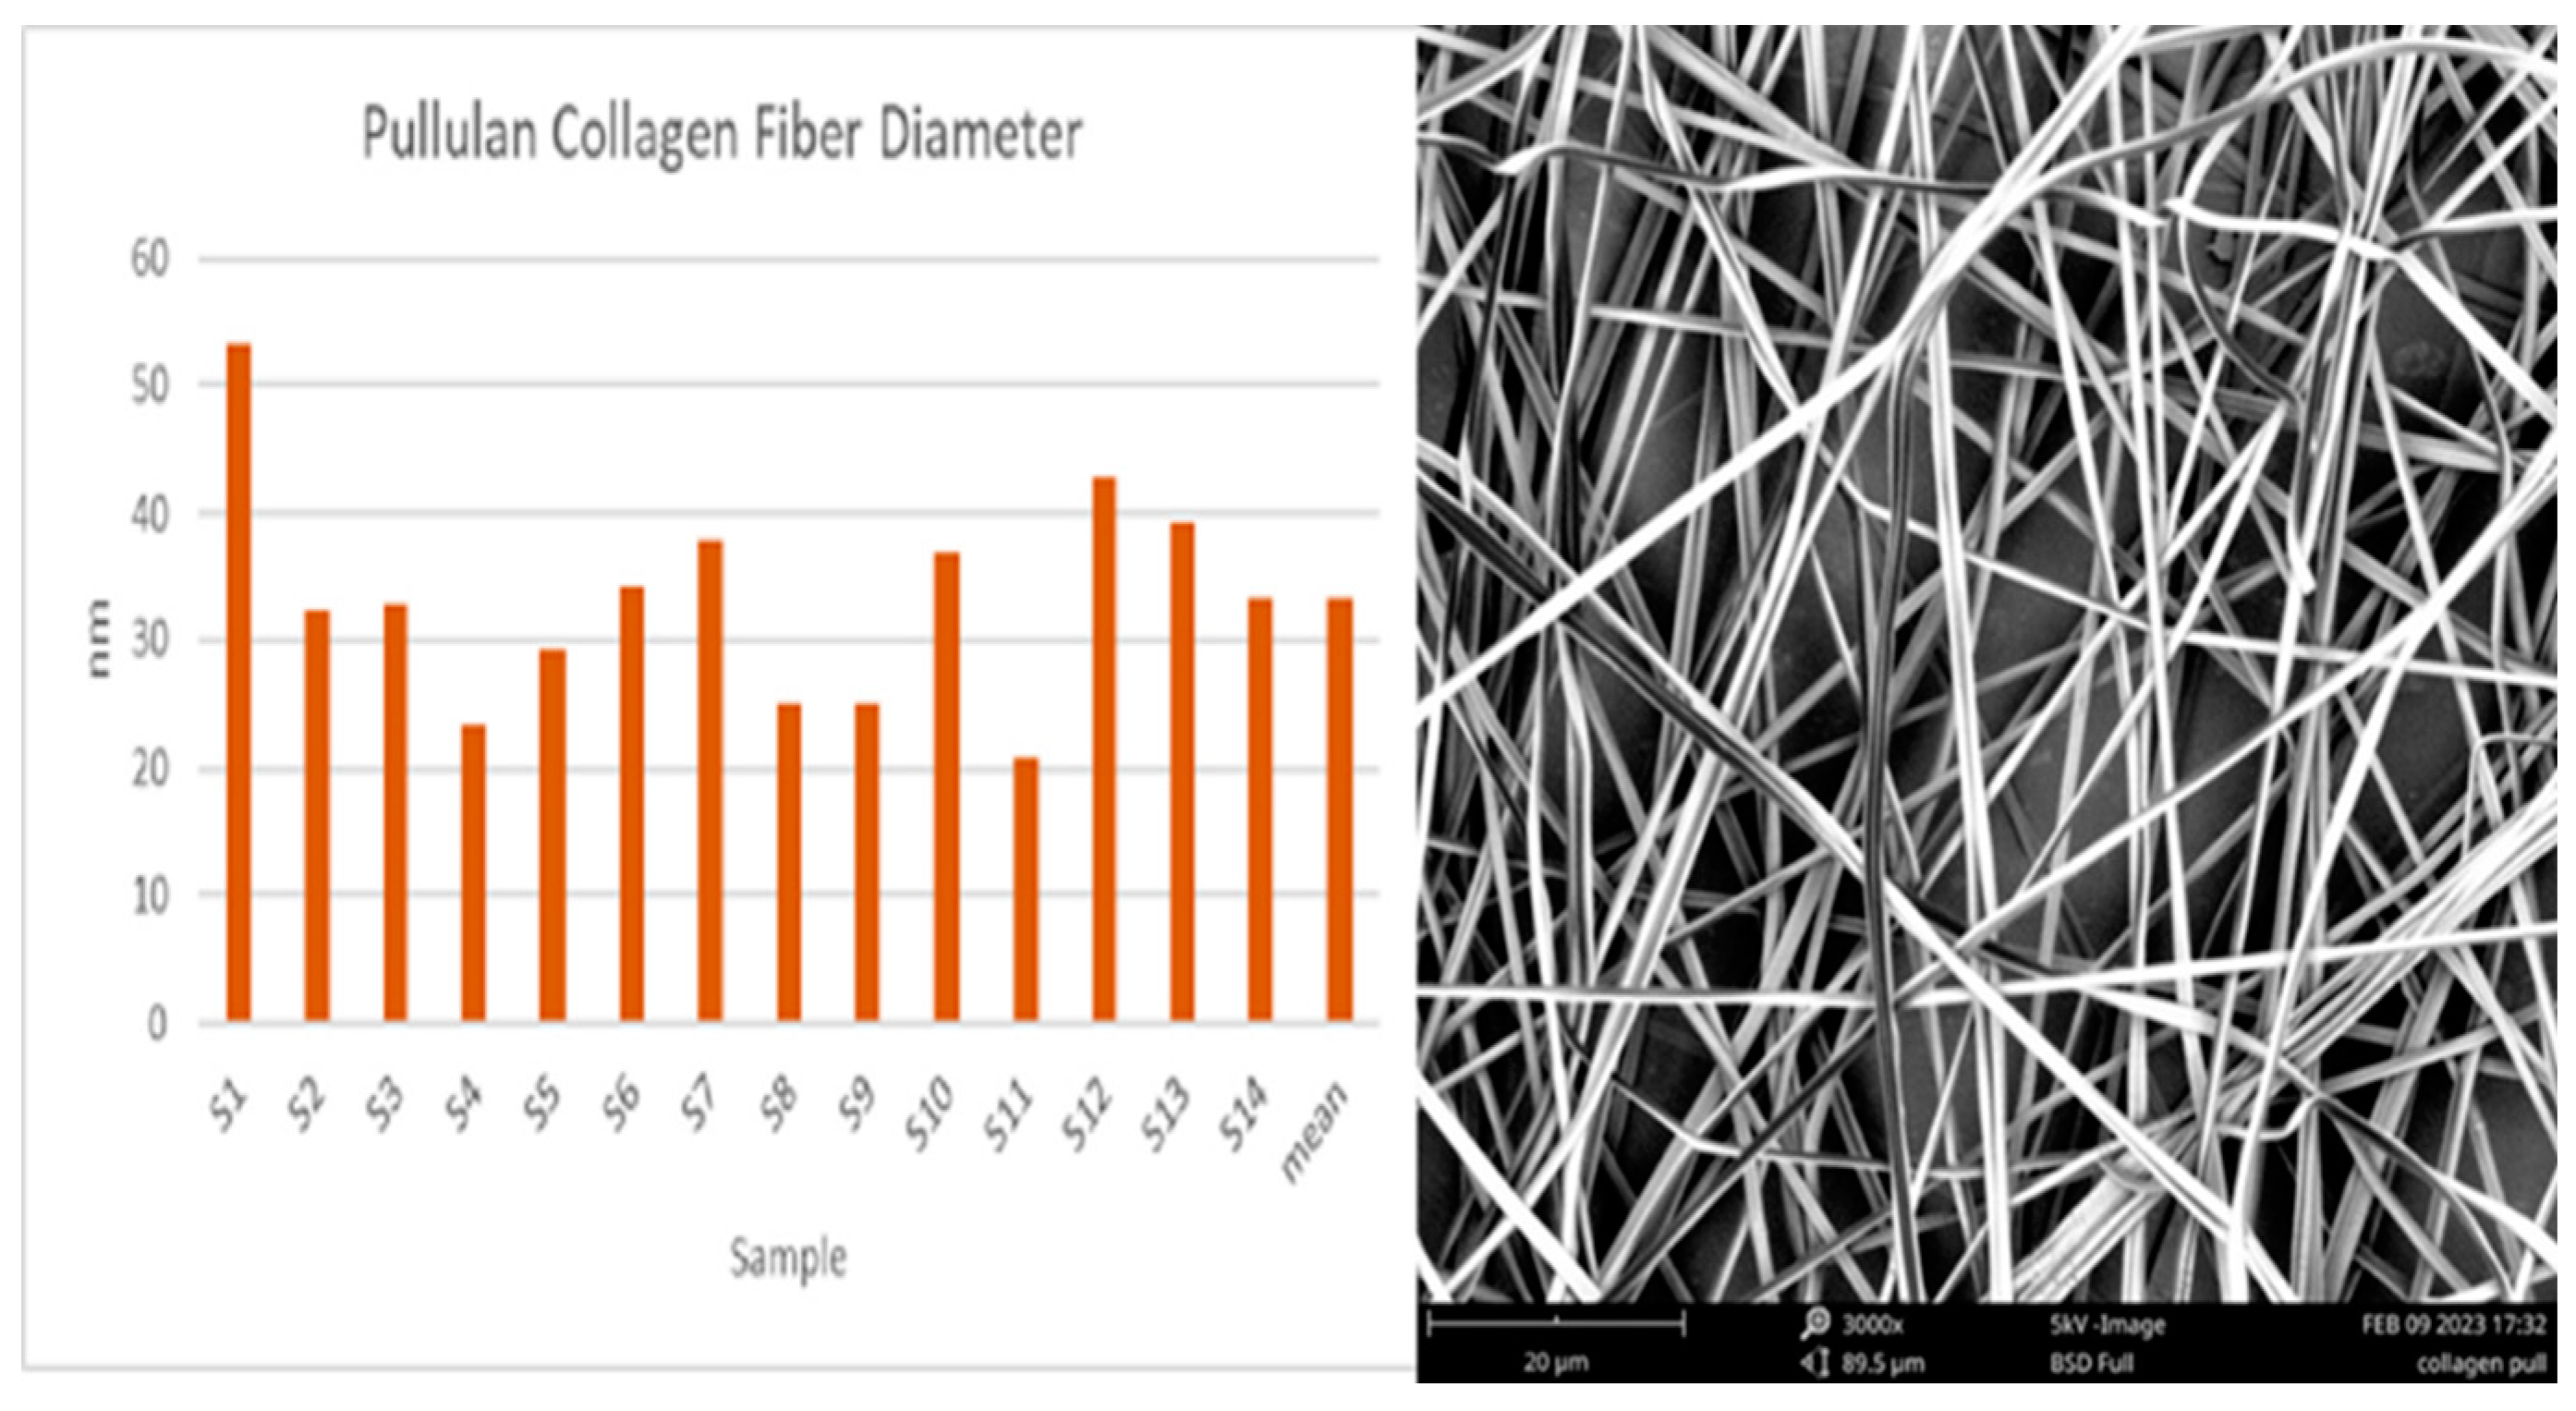
| 1,668 | 70/25 kV | 7.5 | 15 | Highly spun uniform structure. |
|
4,835 |
70/25 kV |
7.5 |
15 |
Spin started rapidly, but the fibre gathered on the electrode surface after a few minutes. |
|
2,490 |
70/25 kV |
7.5 |
15 |
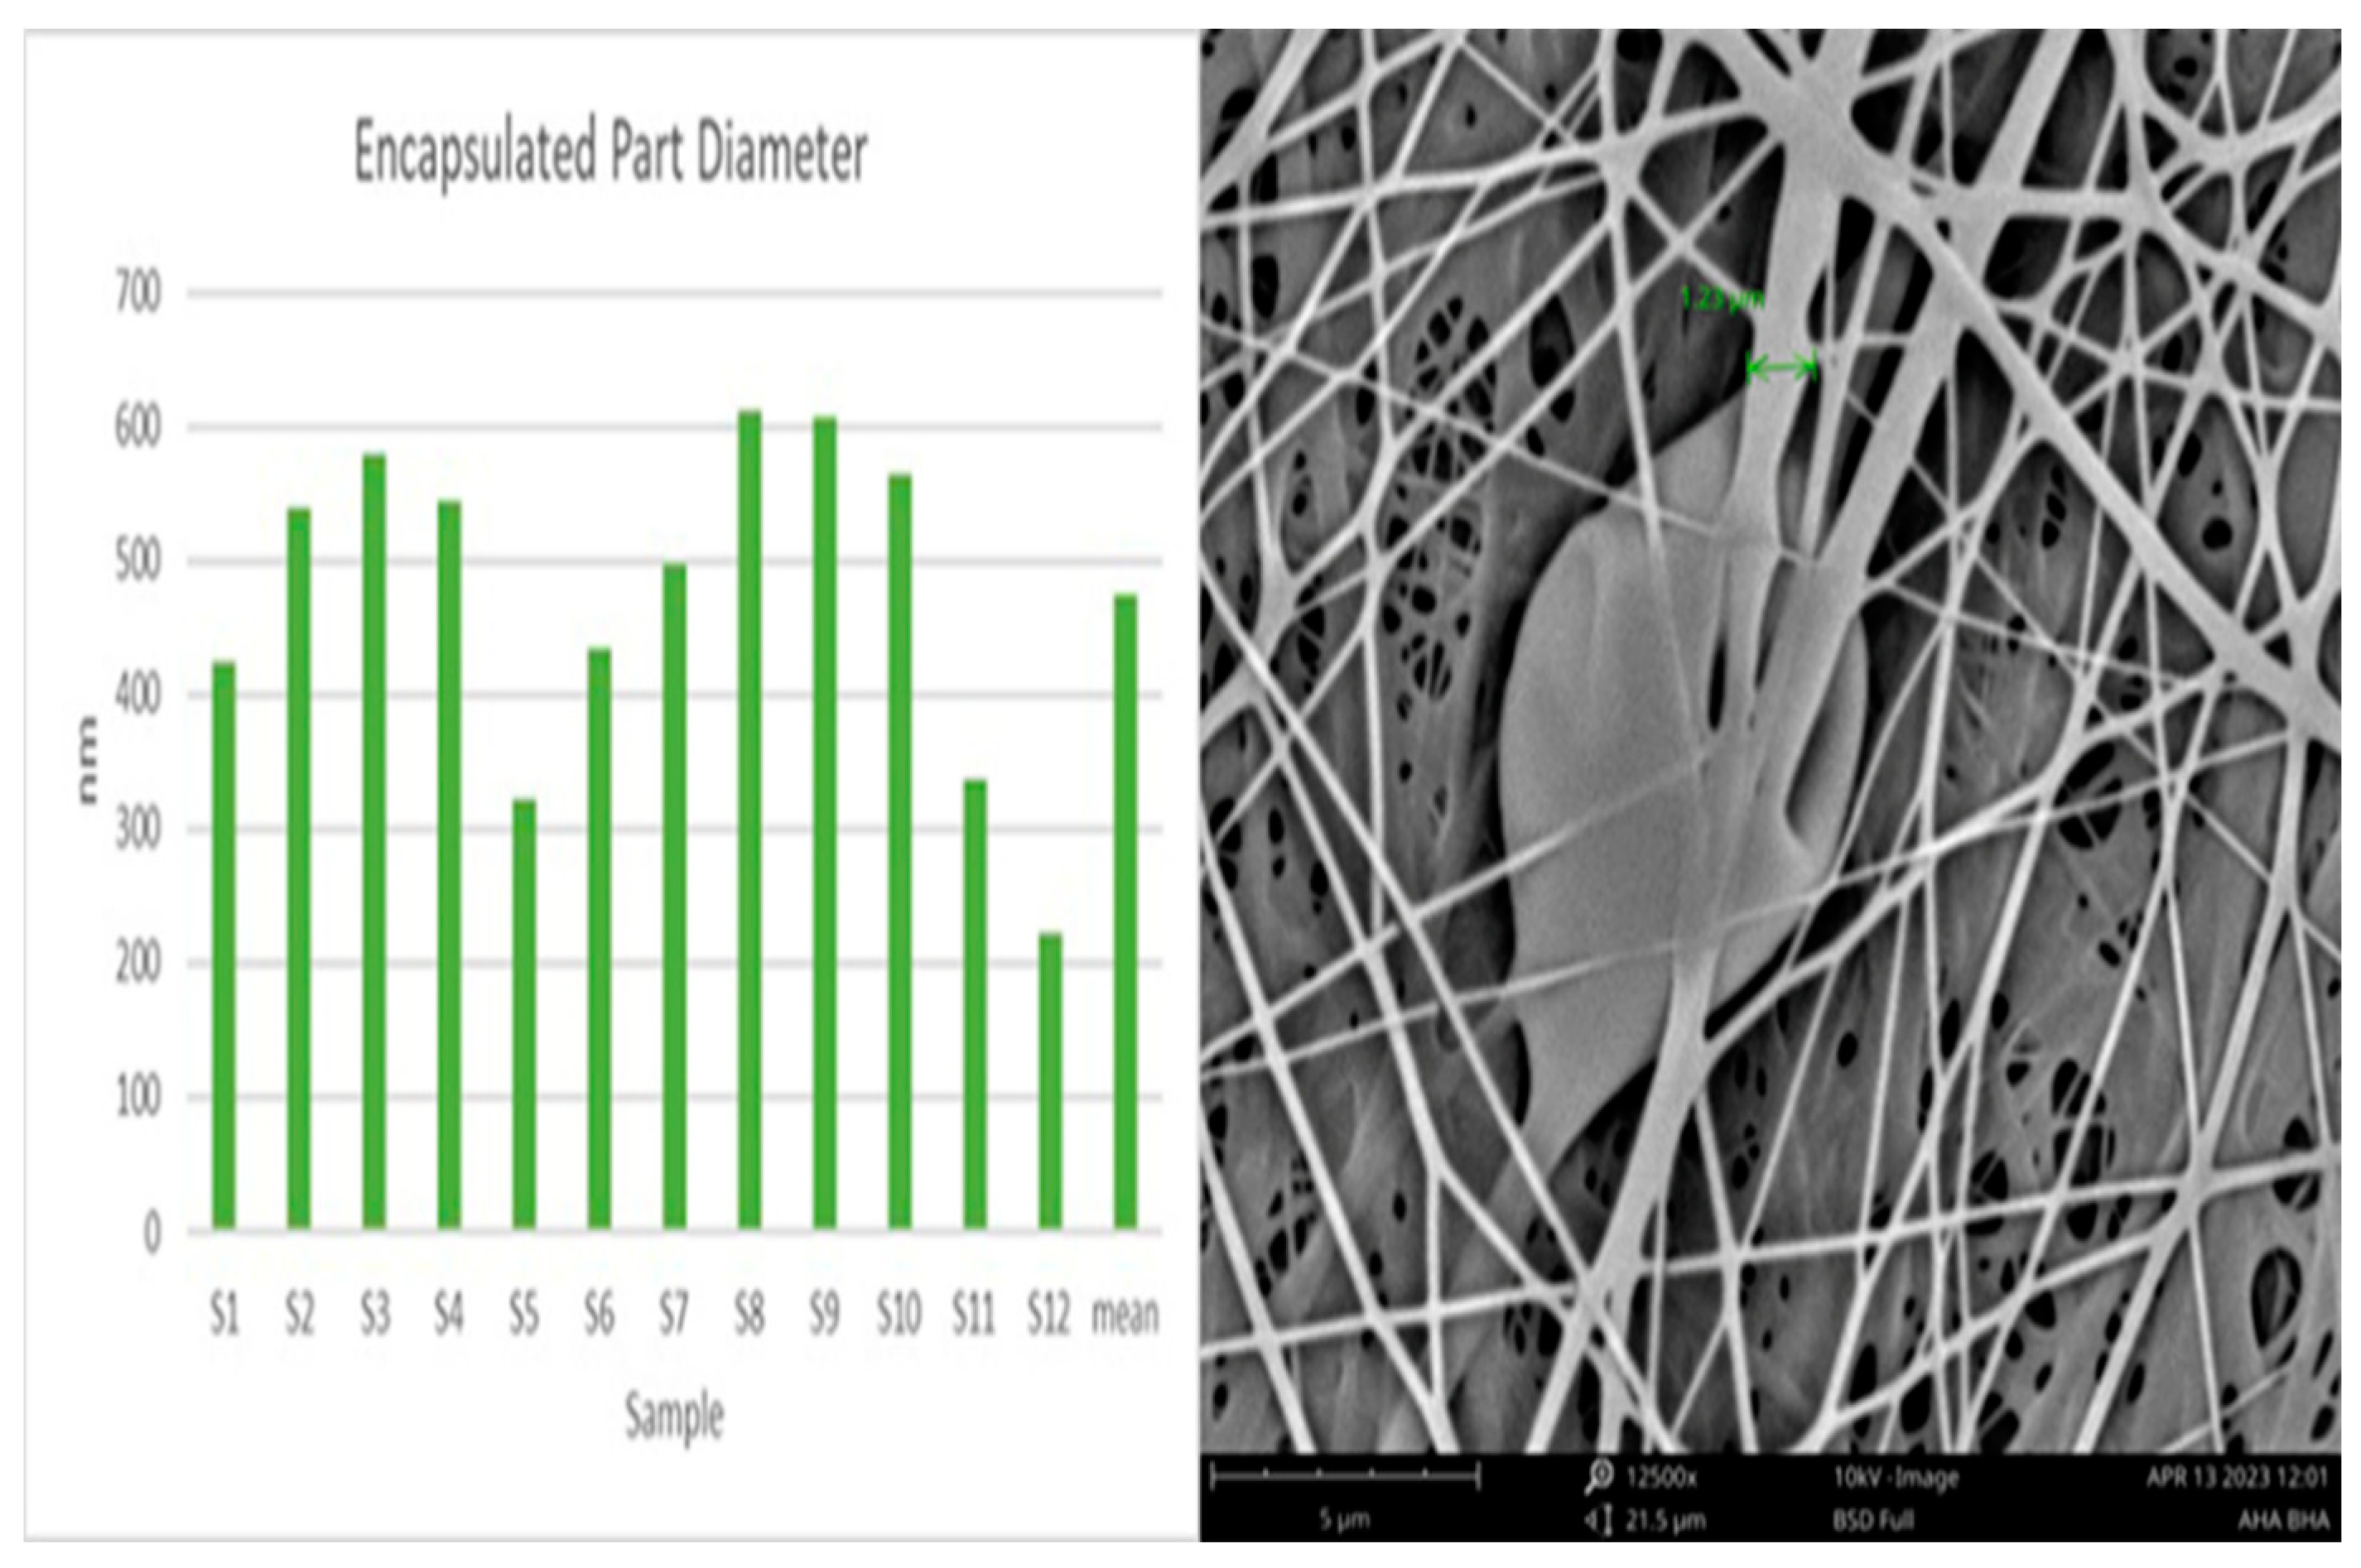
Highly spinner. Uniform and porous structure. |
|
3,297 |
70/25 kV |
7.5 |
15 |
Spin started rapidly, but the fibre gathered on the electrode surface after a few minutes. |
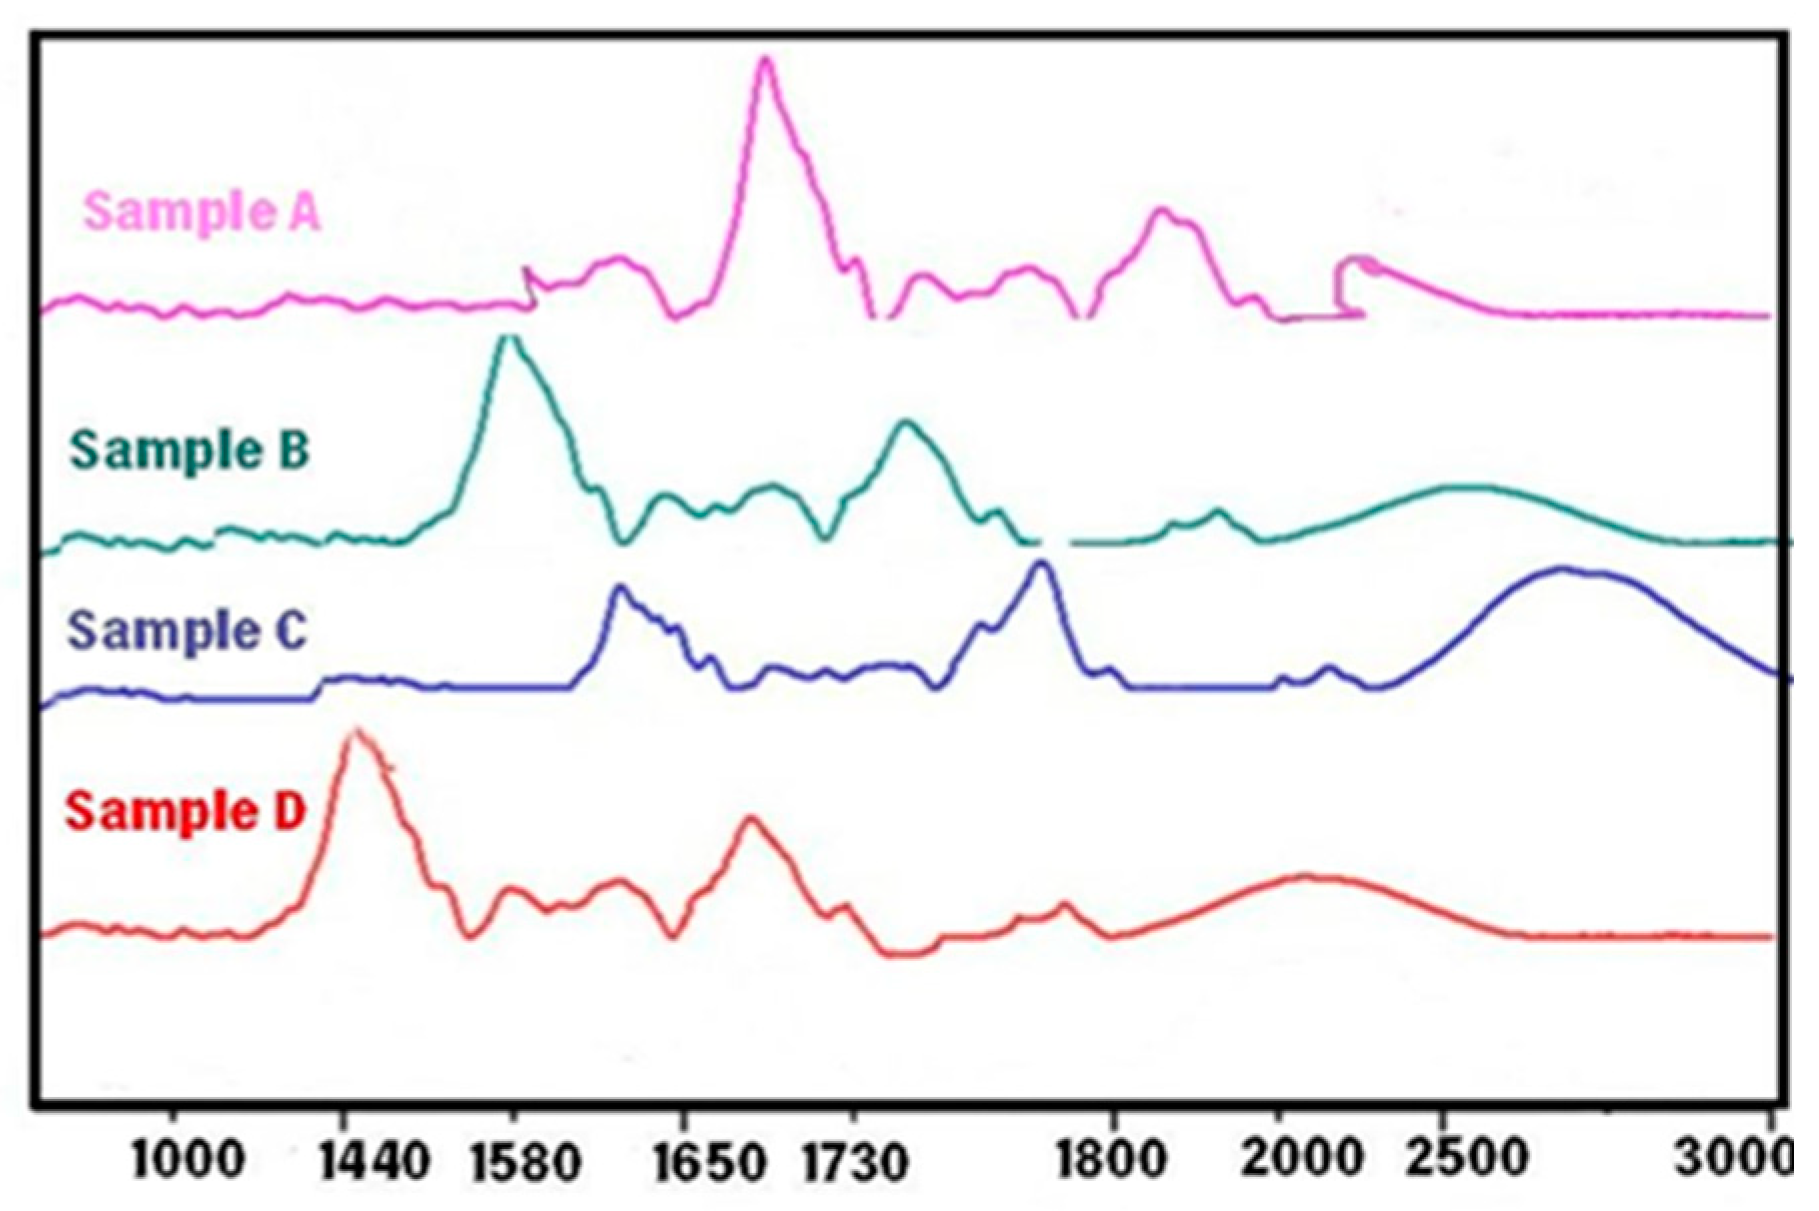
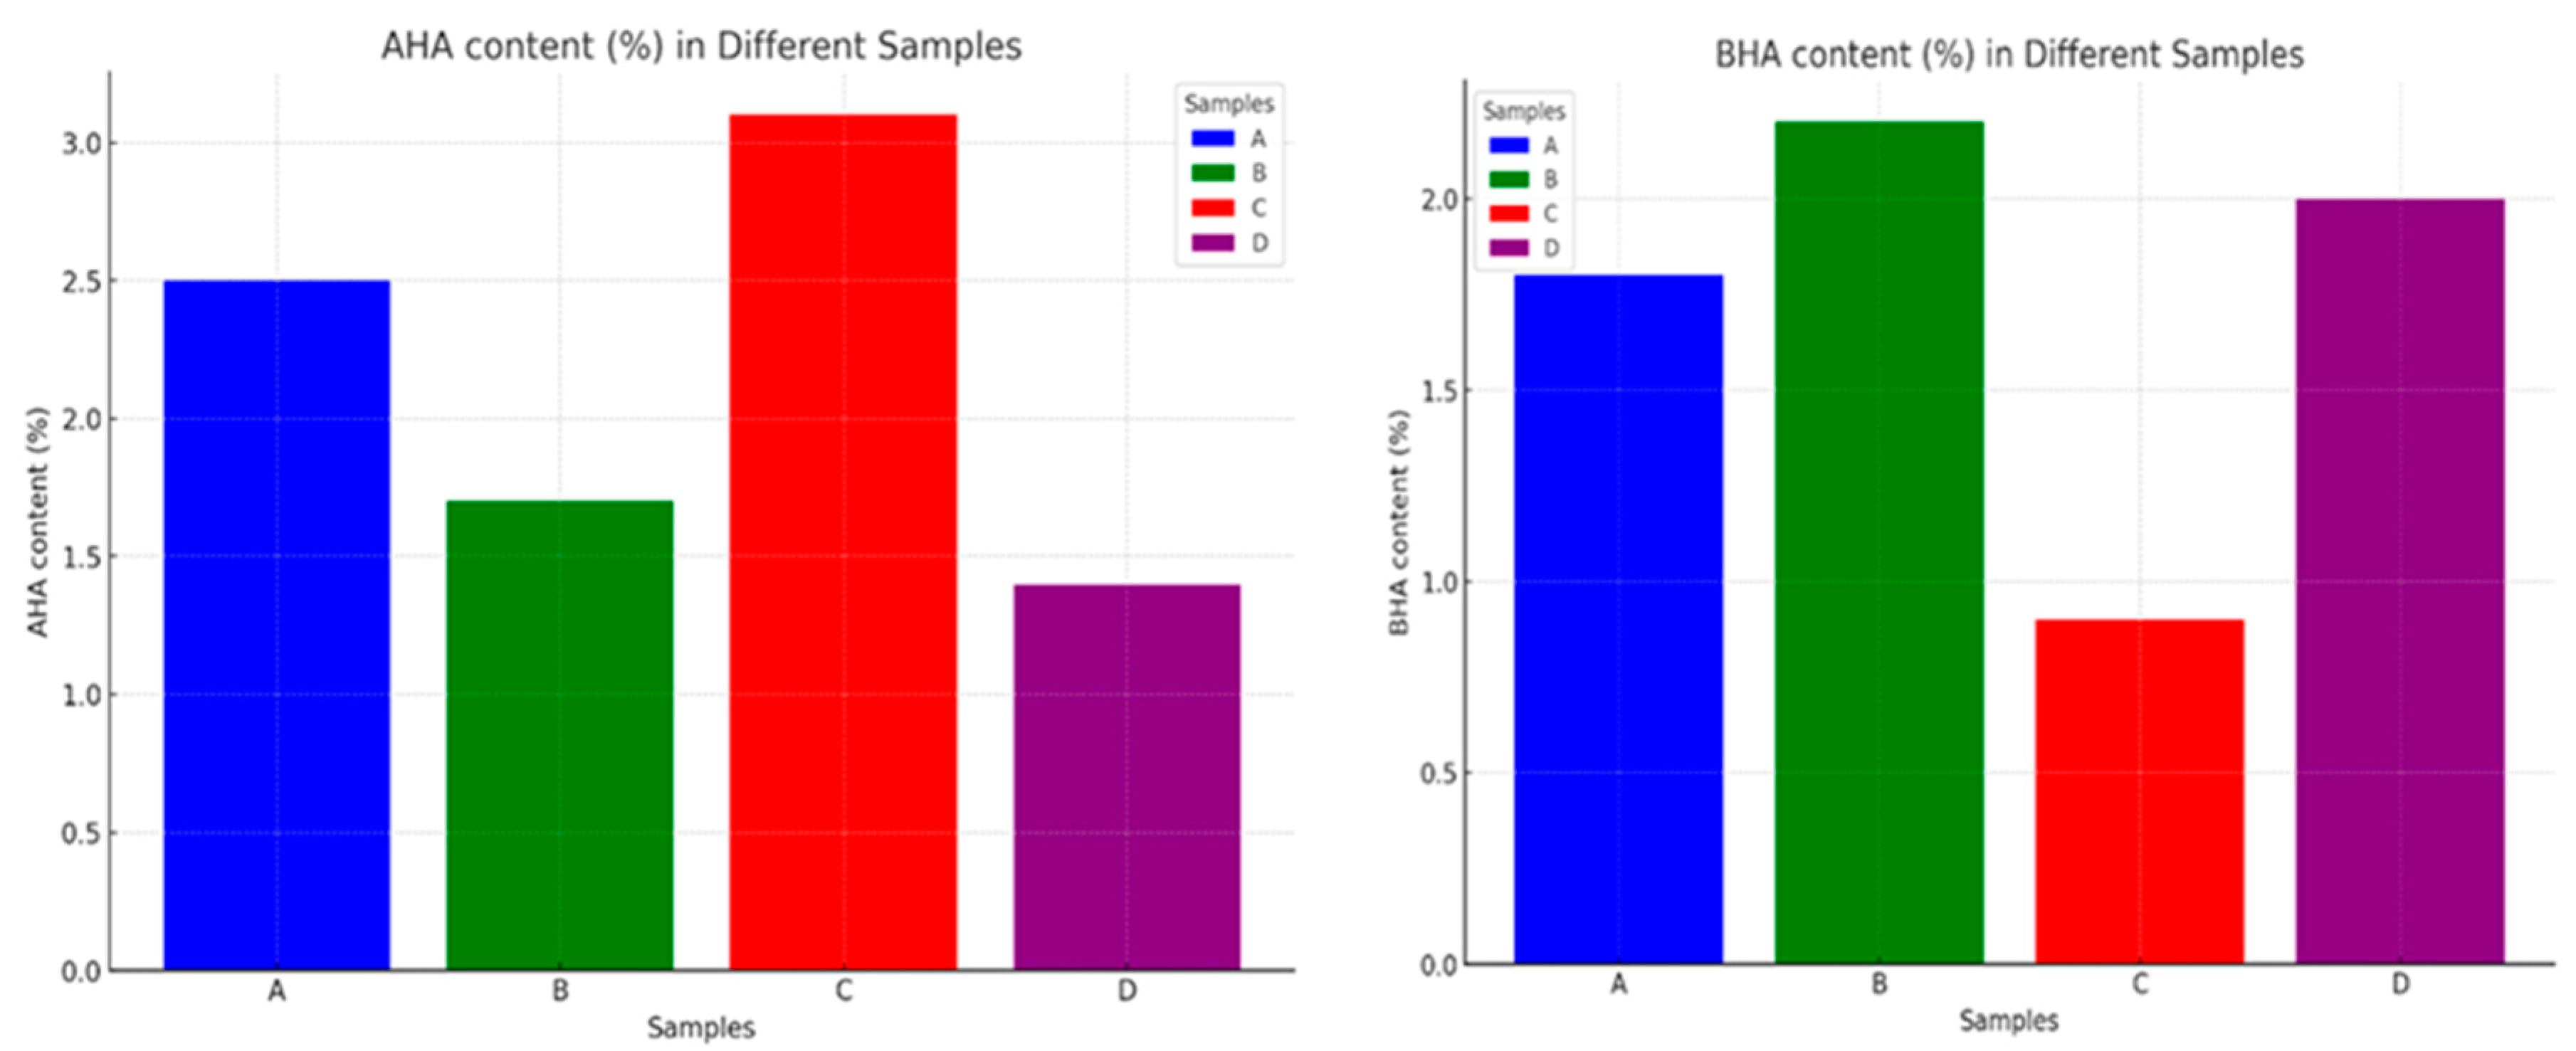
| Sample | AHA content (%) | BHA content (%) | FITR result |
|---|---|---|---|
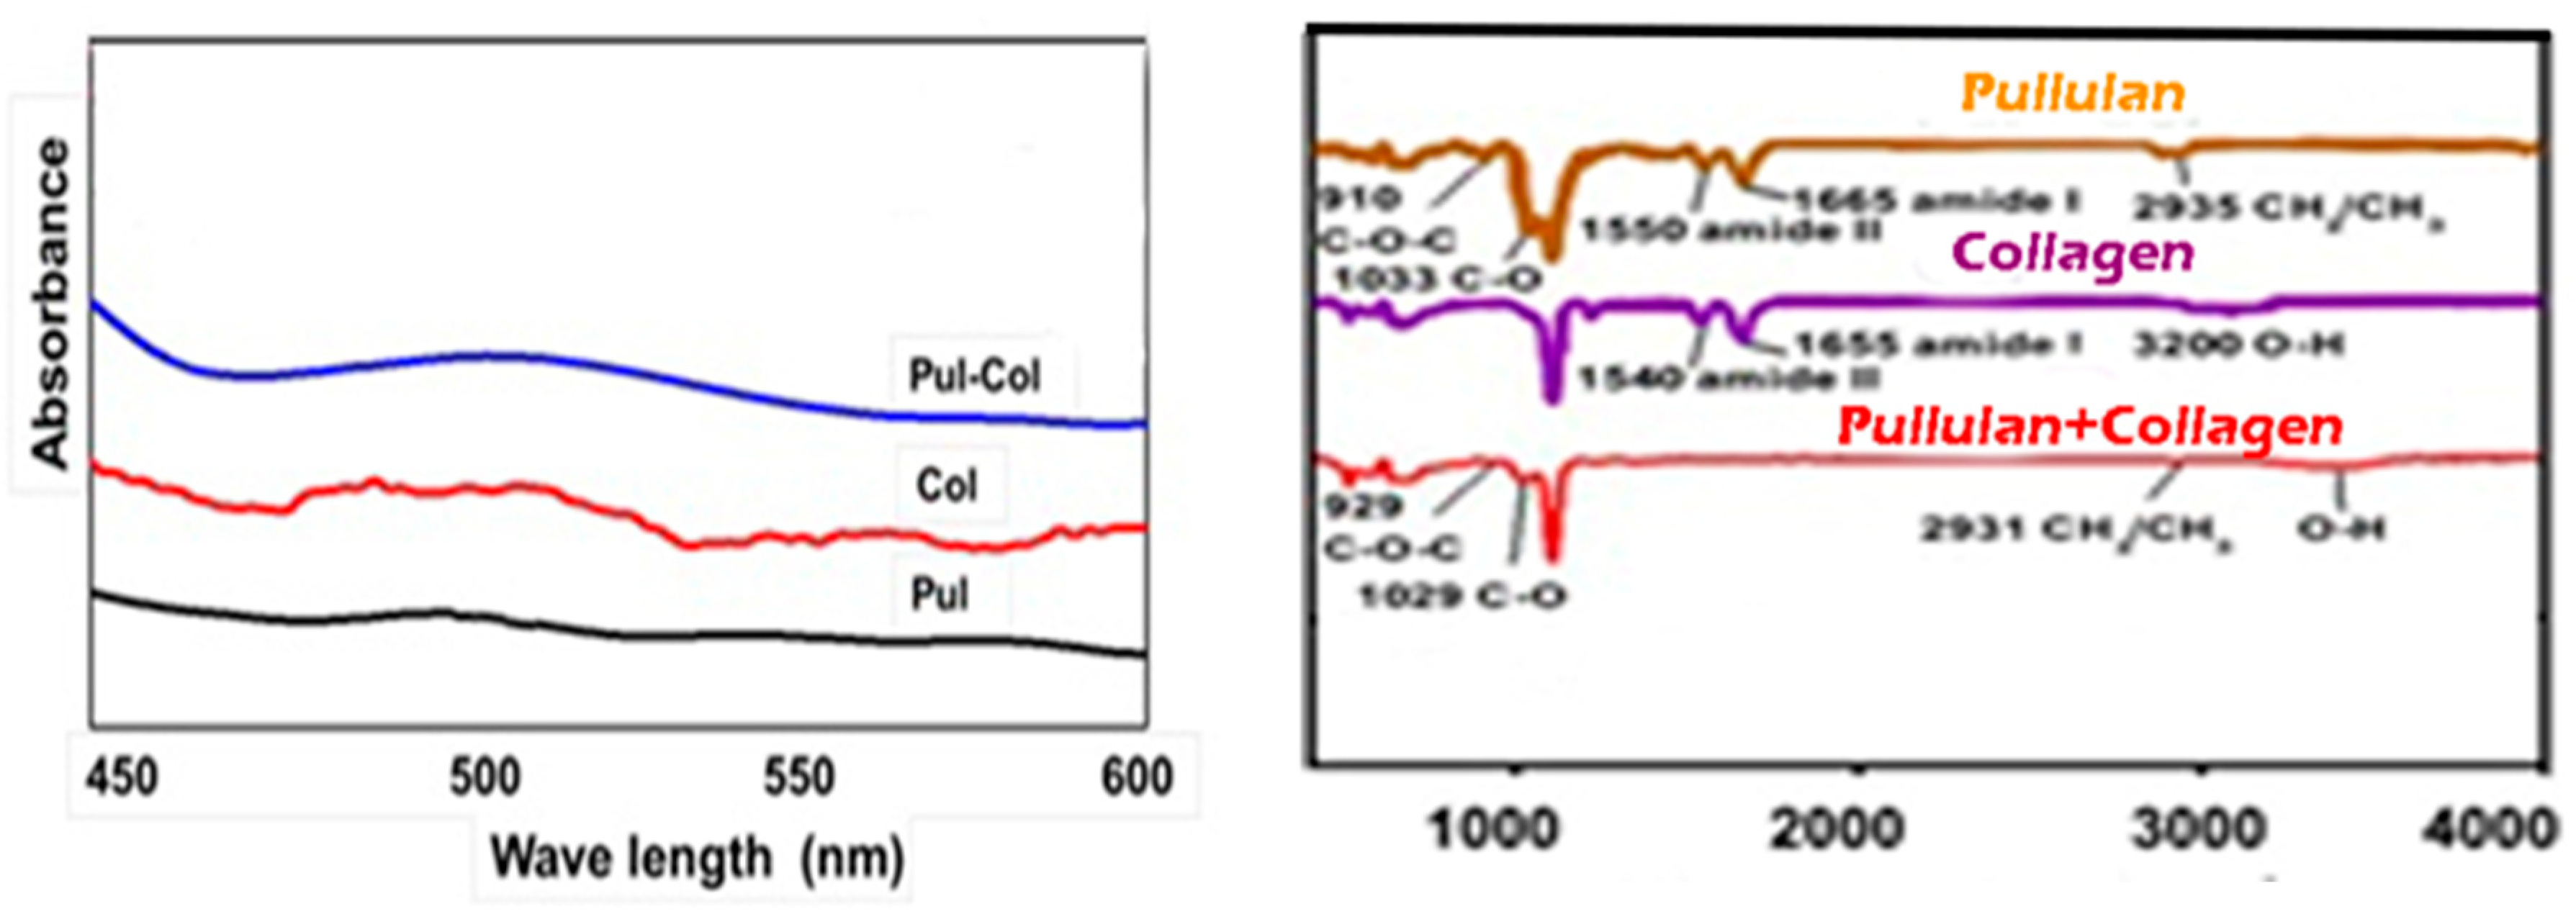
| A | 2.5 | 1.8 | The absorption peak at 1730 cm-1 indicates the presence of ester groups. |
| B | 1.7 | 2.2 | The absorption peak at 1730 cm-1 indicates the presence of ester groups, while the absorption peak at 1580 cm-1 indicates the presence of carboxylic acid groups. |
| C | 3.1 | 0.9 | The absorption peak at 1650 cm-1 indicates the presence of hydroxyl groups. |
| D | 1.4 | 2.0 | The absorption peak at 1440 cm-1 indicates the presence of phenolic groups. |
Disclaimer/Publisher’s Note: The statements, opinions and data contained in all publications are solely those of the individual author(s) and contributor(s) and not of MDPI and/or the editor(s). MDPI and/or the editor(s) disclaim responsibility for any injury to people or property resulting from any ideas, methods, instructions or products referred to in the content. |
© 2023 by the authors. Licensee MDPI, Basel, Switzerland. This article is an open access article distributed under the terms and conditions of the Creative Commons Attribution (CC BY) license (http://creativecommons.org/licenses/by/4.0/).


