1. Introduction
Serology tests are commonly used to screen for celiac disease (CeD), an autoimmune disorder triggered by the ingestion of gluten in genetically susceptible individuals. These tests measure certain antibodies in the blood that are associated with the disease. tTG-IgA assays are the most used in the diagnosis and treatment of CeD [
1]. The test is generally performed using an enzyme-linked immunosorbent assay (ELISA). It has been reported that the tTG-IgA test has a sensitivity of 78% to 100% and a specificity of 90% to 100% for diagnosing CeD in individuals with gluten-containing diet [
2]. However, these results can be dependent on the degree of intestinal damage and the gluten intake of the suspected individual. The DGP tests are not considered as sensitive as tTG-IgA [
3] but are useful in circumstances such as in young children who may not be as sensitive to tTG-IgA [
1]. Serology is also a useful way to select CeD patients for clinical trials where effectiveness of new treatments may be dependent on gluten exposure of the patient [
4,
5].
The connection between serologic titer readings and gluten intake, whether unintentionally or in a gluten-challenge clinical trial, is not immediate but can significantly lag a change in gluten intake. A particular issue is when suspected CeD individuals have already self-administered a GFD and therefore may register negative in serologic tests. Often the individual is put back on a gluten diet to restore their serologic levels. The aim of this work is to present evidence showing that serologic change to gluten may be slower and lower than commonly assumed and relying on restoring a gluten diet in suspected CeD patients to reestablish a positive serologic titer may be fallacious.
Another topic presented in this manuscript is a comparison of two different versions of tTG-IgA assays to determine the strength of the correlation particularly in the upper limit of normal (ULN) diagnostic threshold region in treated patients suspected of exposure to gluten.
2. Materials and Methods
The test results reported here are from two recent celiac disease trials, IMGX003-NCCIH-1721 (NCT03585478) [
6] and IMGX003-NIAID-1821 (NCT04243551) [
7]. In both trials serum was collected and analyzed by enzyme-linked immunosorbent assay (ELISA) for antibodies tTG-IgA (QUANTA Lite
® R h-tTG IgA (recombinant) and QUANTA Lite
® h-tTG IgA (non-recombinant)) and DGP-IgA, DGP-IgG (QUANTA Lite™ Gliadin IgA II, QUANTA Lite™ Gliadin IgG II), all assays by INOVA Diagnostics, Inc., San Diego, CA. The IMGX003-NCCIH-1721 study samples were collected and analyzed at Mayo Clinic. The IMGX003-NIAID-1821 study samples were collected at each of seven clinical trial sites and serum samples were sent for analyses to ACM Global Laboratories (QUANTA Lite, h-tTG IgA (non-recombinant), Gliadin IgA II, and Gliadin IgG II) and Quest Diagnostics (QUANTA Lite
® R h-tTG IgA (recombinant)).
Serologic change from baseline following a 6-week, 2 g per day gluten challenge study (IMGX003-NCCIH-1721) was evaluated for N = 22 patients receiving gluten plus placebo for the assays identified above. In this study adult patients (18–80 years) were required to have physician-diagnosed, biopsy-confirmed CeD; to be following a GFD for a minimum of 12 months; and to have histologically well-controlled disease, as evidenced by a measured ratio of villus height to crypt depth Vh:Cd of ≥2.0.
The correlation of tTG-IgA (recombinant) and tTG-IgA (non-recombinant) was evaluated based on an on-going non-gluten challenge study (IMGX003-NIAID-1821) for a total of 347 paired titer readings (694 total readings). In this study, similar to the above study, adult patients (18–80 years) were required to have physician-diagnosed, biopsy-confirmed CeD; to be following a GFD for a minimum of 12 months, however, histology as represented by Vh:Cd was not measured or controlled. In this on-going trial this currently represents 304 individual patients at initial screening for seroactivity (positive readings for any of tTG-IgA AB, DGP-IgA, or DGP-IgG). Of these screened patients, 83 were seroactive and of these patients 35 passed subsequent screening requirements and were randomized for treatment providing a second set of individual serologic readings. A final set of serology readings were conducted at completion of the treatment period and at the time of locking the data for the analyses for this manuscript that included 23 completed patients in this on-going trial.
Statistical analyses were performed using GraphPad Prism 9.1.1 or XLSTAT 2021.1.1. In all cases the lower and upper readable thresholds of <1 and >100 were converted to 0 and 125 titer units to limit the full range of excessive values. For the tTG-IgA comparison a Pearson’s correlation test was performed to determine the correlation between the two immunoassay variants. Descriptive statistics were determined.
3. Results
3.1. Serologic Change Dynamics
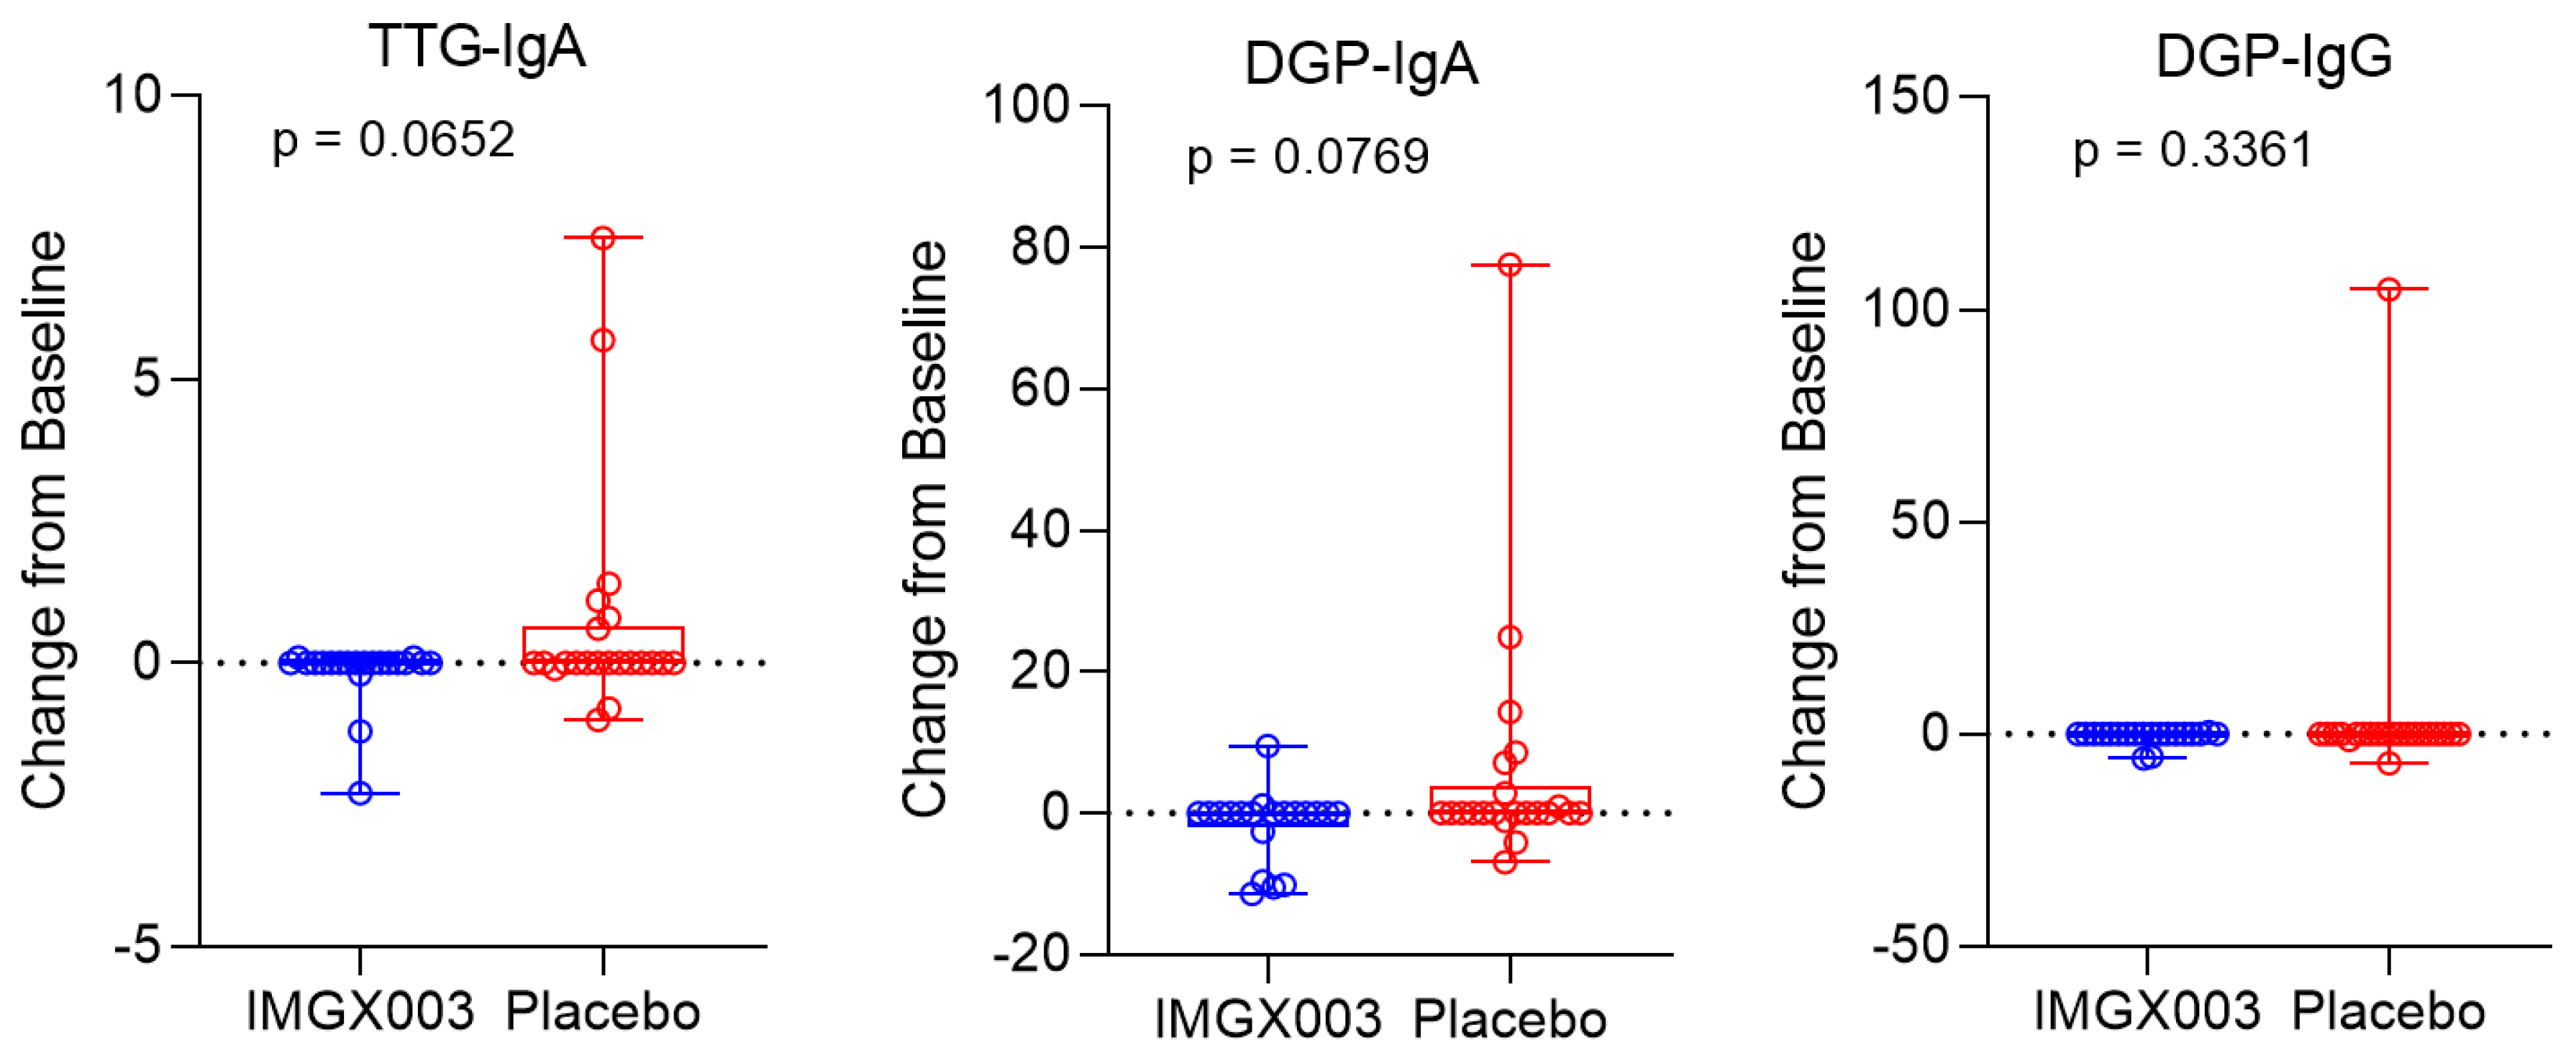
Figure 1 shows the serologic changes from baseline for N = 22 enrolled patients in the IMGX003-NCCIH-1721 gluten-challenge study. After consuming 2 g of gluten daily for 6 weeks, a total of 84 g of gluten, no more than 6 out of 22 patients (≤23%) registered a positive change for any of the three measured titers (6 of 22 for tTG-IgA, 6 of 22 for DGP-IgA and 1 of 22 for DGP-IgG) and only two patients went from seronegative to seropositive (for tTG-IgA). This strongly suggests that a regimen of taking gluten to reestablish seropositivity to diagnose individuals for celiac disease may require much greater quantities than previously believed.
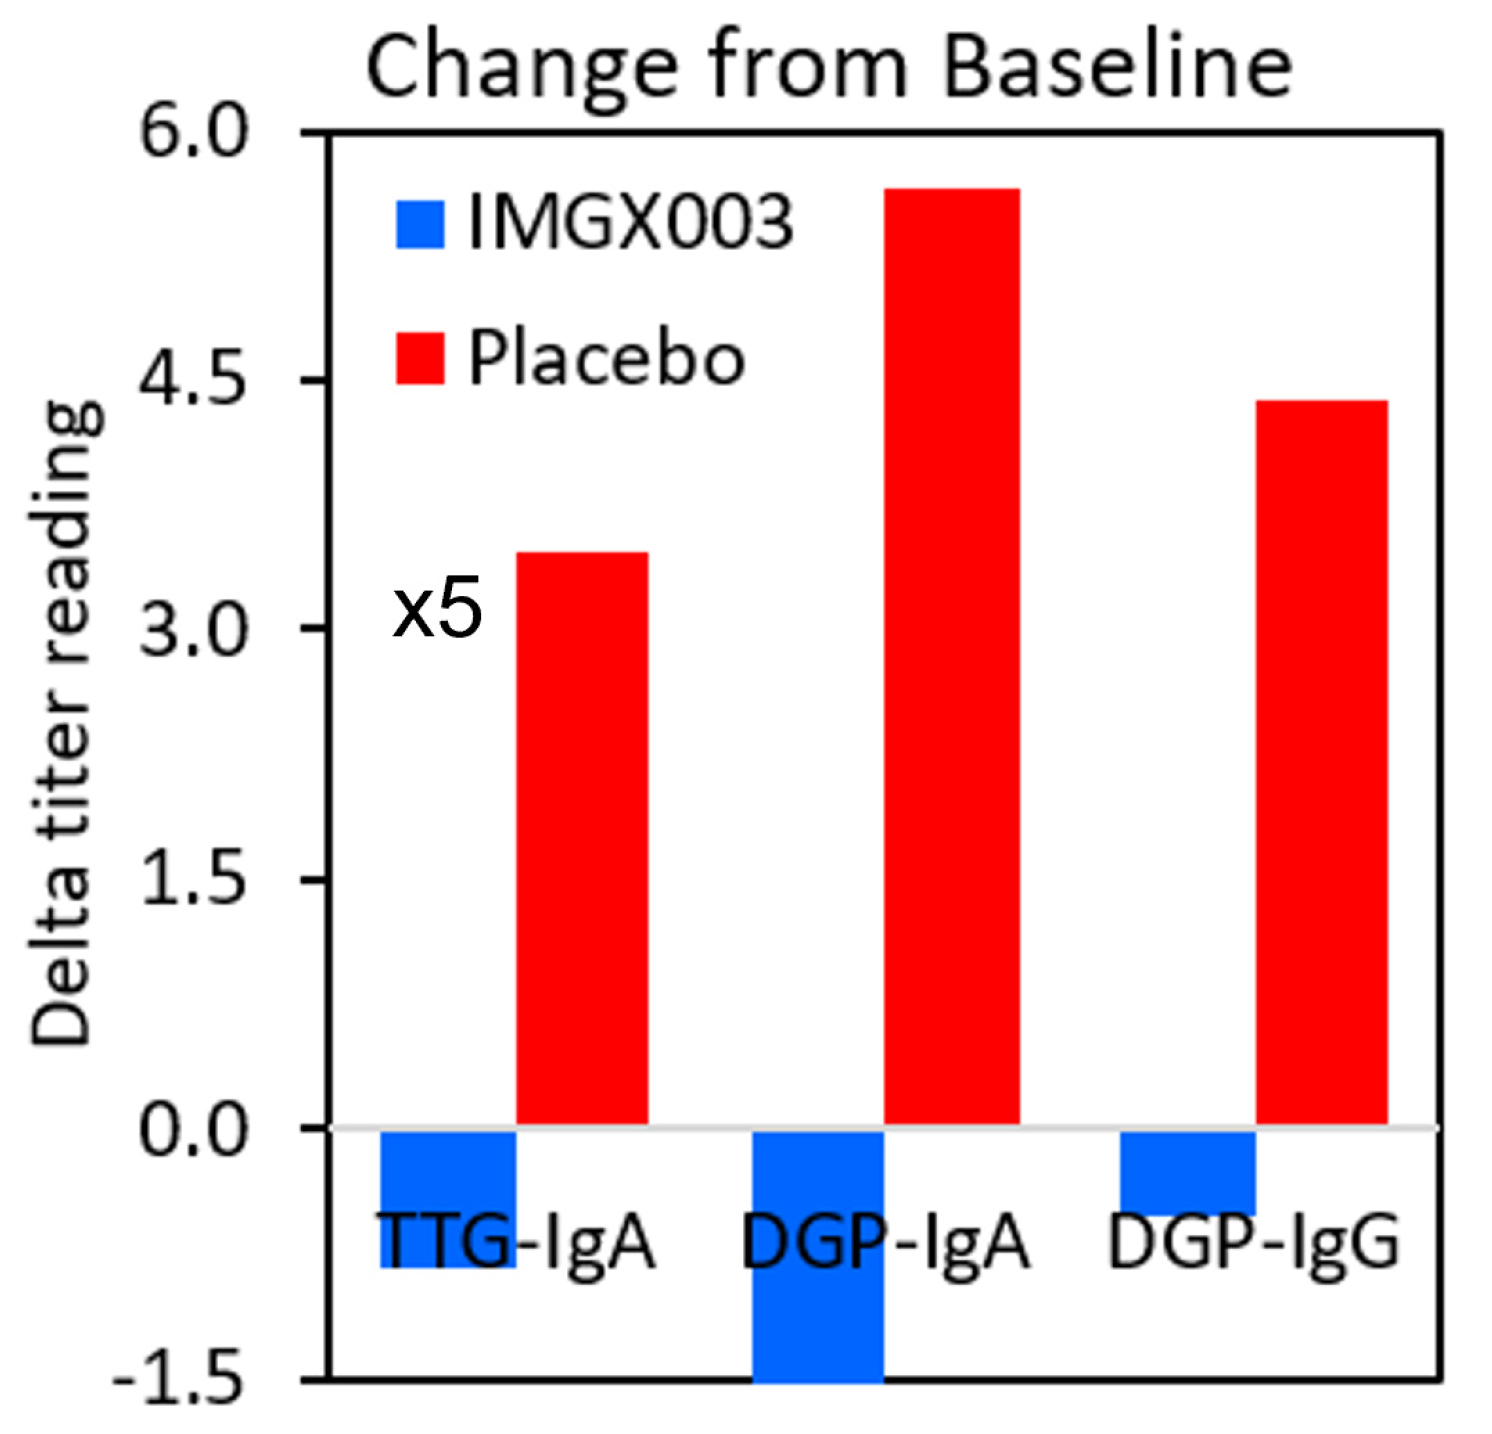
Figure 2 shows the mean change for the placebo group in the IMGX003-NCCIH-1721 study. These mean changes are well below the ULN values for tTG-IgA (ULN = 4 Units/mL) and for DGP IgA and IgG (ULN = 20 Units). As an interesting aside, the IMGX003 (Active) group on average improved their serologic scores despite the gluten challenge [
6].
3.2. Correlation of tTG IgA vs. tTG IgA AB Assays
Recently a new tTG-IgA chemiluminescence assay (QUANTA Lite
® h-tTG IgA (non-recombinant)) was introduced with a ULN of 20 units matching that of currently used DGP-IgA and DGP-IgG assays. We compare this assay in paired readings of the same patient serum samples against the older tTG-IgA AB (recombinant) assay to assess the correlation and accuracy in the ULN threshold regions.
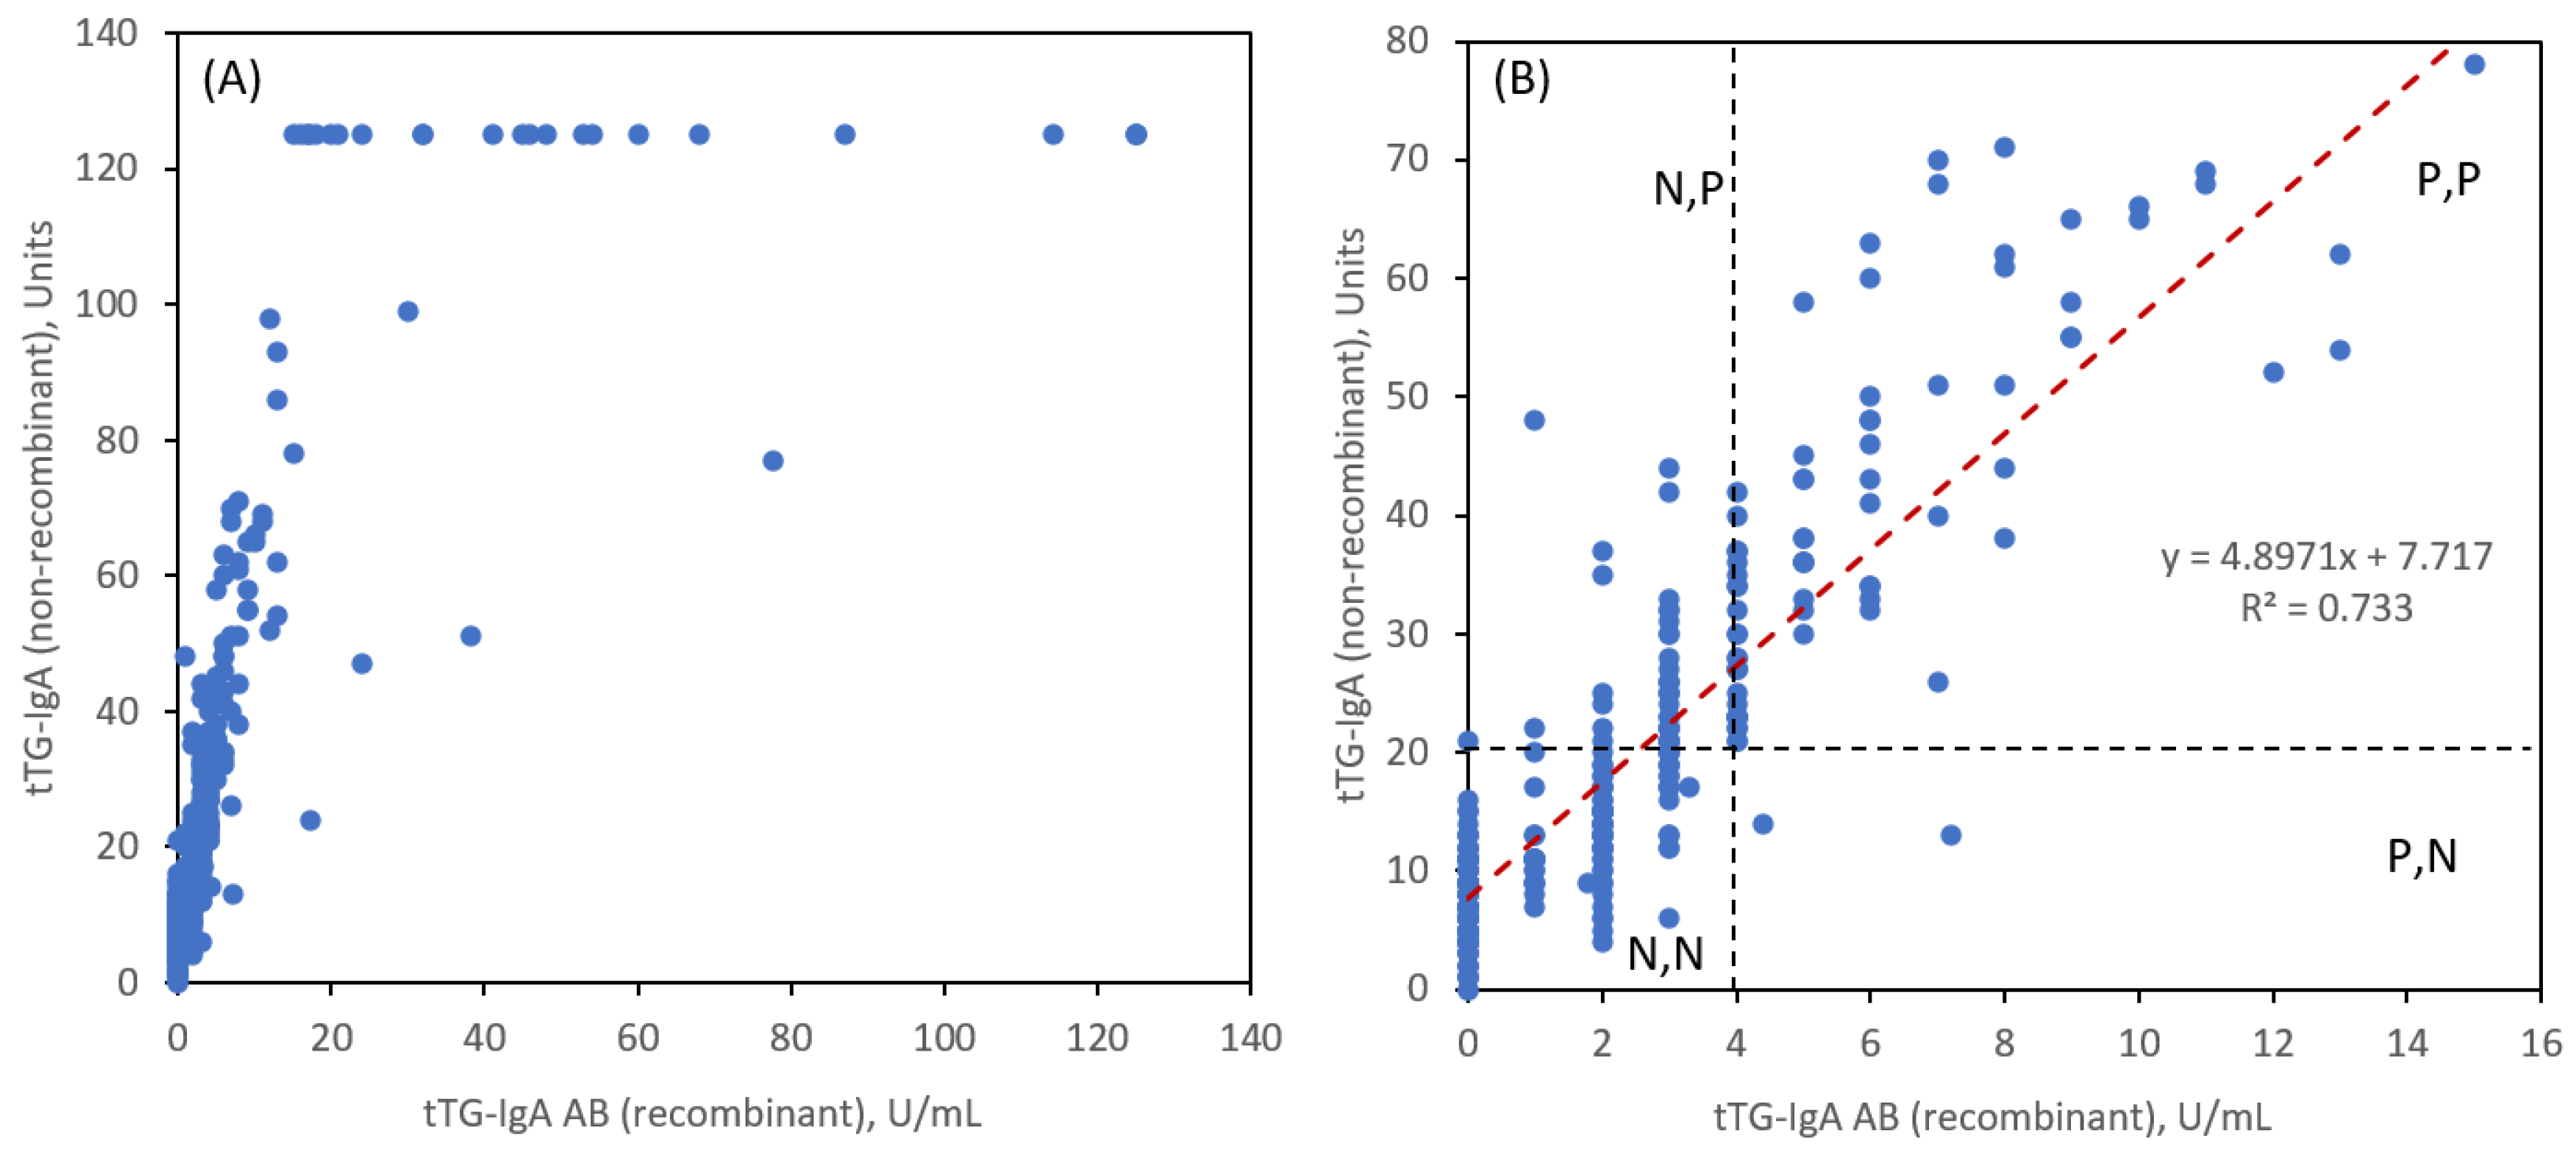
Figure 3 shows the 347 paired readings. General linearity (
Figure 3A) is observed for the two tTG-IgA assays. An expanded view (
Figure 3B) shows the linear correlation near the ULN region along with the ULN thresholds for each assay. There is a strong correlation by both measurements as evidenced by a Pearson coefficient R = 0.8584.
The notation N and P is for negative and positive readings based on <ULN and ≥ULN, respectively for tTG-IgA (AB = recombinant) and tTG-IgA (non-recombinant), respectively. It is evident that for a tTG-IgA AB ULN value of 4 units/mL, that there are a significant number of readings that are in the N,P category (48 instances) and very few in the P,N category (2 instances).
Table 1 tabulates the number of such readings in addition to the more desirable agreements for N,N and P,P. To achieve better correlation at the ULN thresholds, we reduced the tTG-IgA AB ULN value to 3 units/mL and observed a much more balanced agreement for N,P (14 instances) and P,N (16 instances). If we define a combination sensitivity (sens) as the sum of N,N and P,P results as a percentage of total patient reads and 1-specificity (1-spec) by the sum of N,P and P,N we obtained the values in
Table 1. These are not true sensitivity and specificity values since we have not compared the pairing of these two tTG-IgA assays to a controlled group of non-CeD patients, but they are instructive for evaluating the correlation and for suggesting refinements in the threshold ULN to be used for making diagnoses.
4. Discussion
In this study we address two issues regarding serologic immunoassay measurements for CeD: (i) the reestablishment of seropositivity for CeD patients who resume a gluten-containing diet and (ii) the correlation between two different tTG-IgA assays near the ULN designated thresholds.
Regarding the first topic, it is assumed that individuals who are suspected of having CeD and have already self-treated with a GFD can regain positive serology with a reasonable gluten regimen. There is very little literature indicating the appropriateness of this practice, yet it is commonly practiced. There is also impetus to develop diagnostic methodologies, in particular serologic assays, that can avert the need for biopsies, particularly in children.
Guidelines published by the the European Society for Paediatric Gastroenterology Hepatology and Nutrition (ESPGHAN) recommend preliminary screening of adolescences by tTG-IgA [
8]. If symptomatic patients register titer readings >10 ULN of tTG-IgA, the guidelines recommend further blood sampling to measure endomysial antibodies as an alternative to duodenal biopsies. Positive outcomes for these measures are sufficient to provide a CeD diagnosis in children provided their symptoms improve on a GFD. A key consideration, which is a primary topic of this study, is if the patient has already started a GFD resulting in a negative tTG-IgA, then a recommendation is to revert to a diet to include three slices of wheat bread daily for 1–3 months. Assuming a slice of bread contains about 4 g of gluten, this regimen accounts for about 100-300 g over a 1-3 month recommended period, although shorter periods of time can be justified [
9].
We show that 84 g of gluten consumed over a 6-week period is inadequate for regaining seropositivity for tTG-IgA or DGP-IgA and DGP-IgG. Only 2 of 22 patients under this gluten challenge regimen reverted to a seropositive tTG-IgA response at 1x ULN in contrast to the 10x ULN response necessary to affirm a CeD diagnosis absent a biopsy determination.
A recently reported new assay, based on measuring interleukin-2 (IL-2) levels following a single gluten dose, holds promise to obtain an immunological biomarker response for diagnosing for CeD [
10,
11,
12]. In this case an individual is given a short duration gluten challenge and whole blood is collected and incubated for a few hours and analyzed. Elevated levels of IL-2 are indicative of individuals with CeD and differentiate them from non-celiac gluten sensitivity [
12]. This assay when validated could obviate the need to rely on an extended gluten challenge and diagnosis by tTG-IgA assays. Another alternative way is to use a novel approach, which is utilizing the neoepitopes derived from tTG-DGP complexes. Indeed, a recent study using these neoepitopes showed the promising accuracy to differentiate the mucosal healing in treated patients with CeD [
13].
We now focus on the second topic of this study regarding the relative agreement of the two different tTG-IgA assays reported above. There are few such comparisons [
14,
15,
16,
17]. Other than reasonable agreement in the diagnostic threshold region near the ULN, an important insight revealed that perhaps the older tTG-IgA AB (recombinant) version should lower the ULN from a value of 4 to 3. The threshold for positivity for patients with a normal gluten-containing diet may not provide reliable results compared to the context of a gluten challenge where the degree of and direction of change in CeD serology may be more sensitive. A persistently negative serological test after a period of gluten challenge may provide a false sense of security in ruling out CeD with potentially long-term implications for the patient. Although this revision may not have major impact on 1x ULN diagnostic information, it could be very impactful for singular diagnostic decisions based on the use of 10x ULN to circumvent for example biopsy confirmation in children, particularly in terms of negative predictive value of a higher value [
18].
Author Contributions
Conceptualization, J.S.; methodology, J.S.; software, J.S., V.L.; validation, J.S., A.R., V.L., J.M.; formal analysis, J.S., M.D.; investigation, J.S., A.R., V.L., A.N., M.D., J.S.-V., J.M.; resources, A.R., V.L., A.N., M.D., J.M.; data curation, J.S., A.R., V.L., J.S.-V.; writing—original draft preparation, J.S.; writing—review and editing, J.S., M.D., A.B., R.S.C., J.M.; visualization, J.S.; supervision, J.S.; project administration, J.S., A.R., V.L., A.N., M.D., J.M.; funding acquisition, J.S. All authors have read and agreed to the published version of the manuscript.
Funding
This research was funded by ImmunogenX, Inc. This work used data from two National Institutes of Health (NIH) grants to ImmunogenX; the National Center for Complementary and Integrative Health (grant no. R33AT009637) and the National Institute for Allergy and Infectious Diseases (grant no. U44AI134590).
Data Availability Statement
Data may be made available upon request to the corresponding author.
Acknowledgments
We would like to thank Dr. Gail Comer of ImmunogenX for insightful comments. We also thank the participants in the clinical trials and the site study staff including Carol Van Dyke and Irina Horwath of Mayo Clinic.
Conflicts of Interest
All authors associated with ImmunogenX are employees and either are stockholders or grantees of stock options. J.M. currently receives study grants from National Institutes of Health, ImmunogenX, Johnson & Johnson, Kanyos/Anakion, Takeda Pharmaceutical, Allakos, Oberkotter, and Cour; consultancy fees from UKKO, Dren Bio, Dr. Schar USA, Chugai Pharma; GSK, and holds patents licensed to Evelo Biosciences. A.B. receives grants (to the insitution) from Chugai Pharma and Kanyos Bio (a wholly owned subsidiary of Anoxion). In addition, J.M. and R.S.C. are supported by an NIH RC2 Celiac Grant (RC2 DK133947-1). R.S.C. received a grant from the Beyond Celiac Foundation (Beyond Celiac Grant No. 1056867).
References
- Rubio-Tapia A, Hill ID, Kelly CP, Calderwood AH, Murray JA; American College of Gastroenterology. ACG clinical guidelines: diagnosis and management of celiac disease. American Journal of Gastroenterology. 2013;108(5):656–677. [CrossRef]
- Hujoel IA, Reilly NR, Rubio-Tapia A. Celiac disease: clinical features and diagnosis. Gastroenterology Clinics of North America. 2019;48(1):19–37. [CrossRef]
- Husby S, Murray JA, Katzka DA. AGA clinical practice update on diagnosis and monitoring of celiac disease—changing utility of serology and histologic measures: expert review. Gastroenterology. 2019;156(4):885–889. [CrossRef]
- Syage JA, Murray JA, Green PHR, Khosla C. Latiglutenase improves symptoms in seropositive celiac disease patients while on a gluten-free diet. Dig Dis Sci. 2017;62:2428–2432. [CrossRef]
- Syage JA, Green PHR, Khosla C, et al. Latiglutenase treatment for celiac disease: symptom and quality of life improvement for seropositive patients on a gluten-free diet. GastroHep. 2019;1:293–301. [CrossRef]
- Murray JA, Syage JA, Dickason, MA, et al. Latiglutenase Protects the Mucosa and Attenuates Symptom Severity in Patients with Celiac Disease Exposed to a Gluten Challenge, Gastroenterol. 2022;163:1510-1521. [CrossRef]
- Unpublished results.
- Husby S, Koletzko S, Korponay-Szabo IR, et al. European Society for Pediatric Gastroenterology, Hepatology, and Nutrition guidelines for the diagnosis of coeliac disease. J Pediatr Gastroenterol Nutr 2012;54:136–60. [CrossRef]
- Husby S, Murray JA, Katzka. AGA Clinical Practice Update on Diagnosis and Monitoring of Celiac Disease: Changing Utility of Serology and Histologic Measures: Expert Review. Gastroenterol. 2019:156:885-889. [CrossRef]
- Anderson RP, Goel G, Hardy MY, et al. Whole blood interleukin-2 release test to detect and characterize rare circulating gluten-specific T cell responses in coeliac disease. Clin & Exp Immunology. 2019;204:321-334. [CrossRef]
- Tye-Din JA, Daveson AJM, Goldstein KE, et al. Patient factors influencing acute gluten reactions and cytokine release in treated coeliac disease. BMC Medicine 2020;18:1-10. [CrossRef]
- Choung RS, Rostamkolaei SK, Ju JM, et al. Synthetic Neoepitopes of the Transglutaminase-Deamidated Gliadin Complex as Biomarkers for Diagnosing and Monitoring Celiac Disease. Gastroenterol. 2019;156:582-591. [CrossRef]
- Cartee AK, Choung RS, King KS, Wang S, Dzuris JL, Anderson RP, Van Dyke CT, Hinson CA, Marietta E, Katzka DA, Nehra V, Grover M, Murray JA. Plasma IL-2 and Symptoms Response after Acute Gluten Exposure in Subjects With Celiac Disease or Nonceliac Gluten Sensitivity. Am J Gastroenterol. 2022;117:319-326. [CrossRef]
- Naiyer AJ, Hernandez L, Ciaccio EJ, et al. Comparison of Commercially Available Serologic Kits for the Detection of Celiac Disease. J Clin Gastroenterol 2009;43:225-232. [CrossRef]
- Rashtak S, Ettore MW, Homburger HA, Murray JA. Combination testing for antibodies in the diagnosis of coeliac disease: comparison of multiplex immunoassay and ELISA methods. Aliment Pharmacol Ther. 2008;28:805-813. [CrossRef]
- Catelijn DAR, Mulder AHL, van der Pol P, et. al. Multicenter study to compare the diagnostic performance of CLIA vs. FEIA transglutaminase IgA assays for the diagnosis of celiac disease. Clin Chem Lab Med 2023;61:1446–1454. [CrossRef]
- Afzal AJ, Hernandez L, Ciaccio EJ, et al. Comparison of Commercially Available Serologic Kits for the Detection of Celiac Disease. J Clin Gastroenterol 2009;43:225-232. [CrossRef]
- Silvester JA, Kurada S, Szwajcer A, et al. Tests for Serum Transglutaminase and Endomysial Antibodies Do Not Detect Most Patients With Celiac Disease and Persistent Villous Atrophy on Gluten-free Diets: a Meta-analysis. Gastroenterology 2017;153:689–701. [CrossRef]
|
Disclaimer/Publisher’s Note: The statements, opinions and data contained in all publications are solely those of the individual author(s) and contributor(s) and not of MDPI and/or the editor(s). MDPI and/or the editor(s) disclaim responsibility for any injury to people or property resulting from any ideas, methods, instructions or products referred to in the content. |
© 2023 by the authors. Licensee MDPI, Basel, Switzerland. This article is an open access article distributed under the terms and conditions of the Creative Commons Attribution (CC BY) license (http://creativecommons.org/licenses/by/4.0/).


