Preprint
Article

Automatic System for the Study the Interaction Between Porous Media and Atmosphere, Clime Change and Environmental Conditions

Altmetrics

Downloads

83

Views

17

Comments

0

This version is not peer-reviewed

Submitted:

02 November 2023

Posted:

03 November 2023

You are already at the latest version

Alerts
Abstract
The paper presents the main experimental capabilities of the automatic system for the study of the interaction between porous media and atmosphere. This system is one of the possible variants of patent 2-241-477. The paper shows the result of a drying and wetting study of a tailings sample. The sample is 32 cm in height and 29 cm in diameter. The saturation and drying process was carried out at 26 degrees Celsius at the sample surface, an air velocity of 2 m/s and a relative humidity of 60%. The recharge applied to the column surface was 0.3 cm3/cm2/minute. The results show the effectiveness of the system in controlling the spatial-temporal variation of different physical properties of the porous medium in the vertical and surface profile. The controlled variables include volumetric water content, suction, relative humidity, sample weight variation due to recharge or drying, shrinkage, temperature, etc. The experiment shows how the tailings saturate very quickly but dry very slowly. Tailings consolidation occurs in the drying and wetting processes, being higher in the first one.
Keywords: 
Subject: Environmental and Earth Sciences  -   Sustainable Science and Technology

1. Introduction

The study of the interaction processes between the atmosphere and the porous medium (soils, mine and metallurgical wastes, technosols, etc.) is one of the main lines of research in earth sciences [1,2,3,4,5,6,7,8,9,10,11,12]. Different authors have investigated the process of soil crack formation by desiccation due to interaction with the atmosphere [1,2,3,4,8]. There are works that have combined experimental study of drying crack formation under controlled environmental conditions and numerical simulation [8,9]. Different investigations have studied the preferential flow caused by the existence of shrinkage cracks in the porous medium [3,6,10]. The use of sensors for the experimental study of drying pores and the control of the spatio-temporal evolution of certain variables in the porous medium has been developed mainly in the last three decades [3,4,6,11,12,14].
The objective of this work is to present an automatic system for the study of the interaction between porous media and atmosfere. The results we analyze have been obtained with one of the variants in terms of shape and type of materials that can be studied with patent 2-241-477 [14].

2. Materials and Methods

2.1. Description the Main Component of Automatic System

The automated system for the study the interaction between porous media and environmental conditions has three main components (Table 1 and Figure 1,Figure 2,Figure 3,Figure 4,Figure 5).
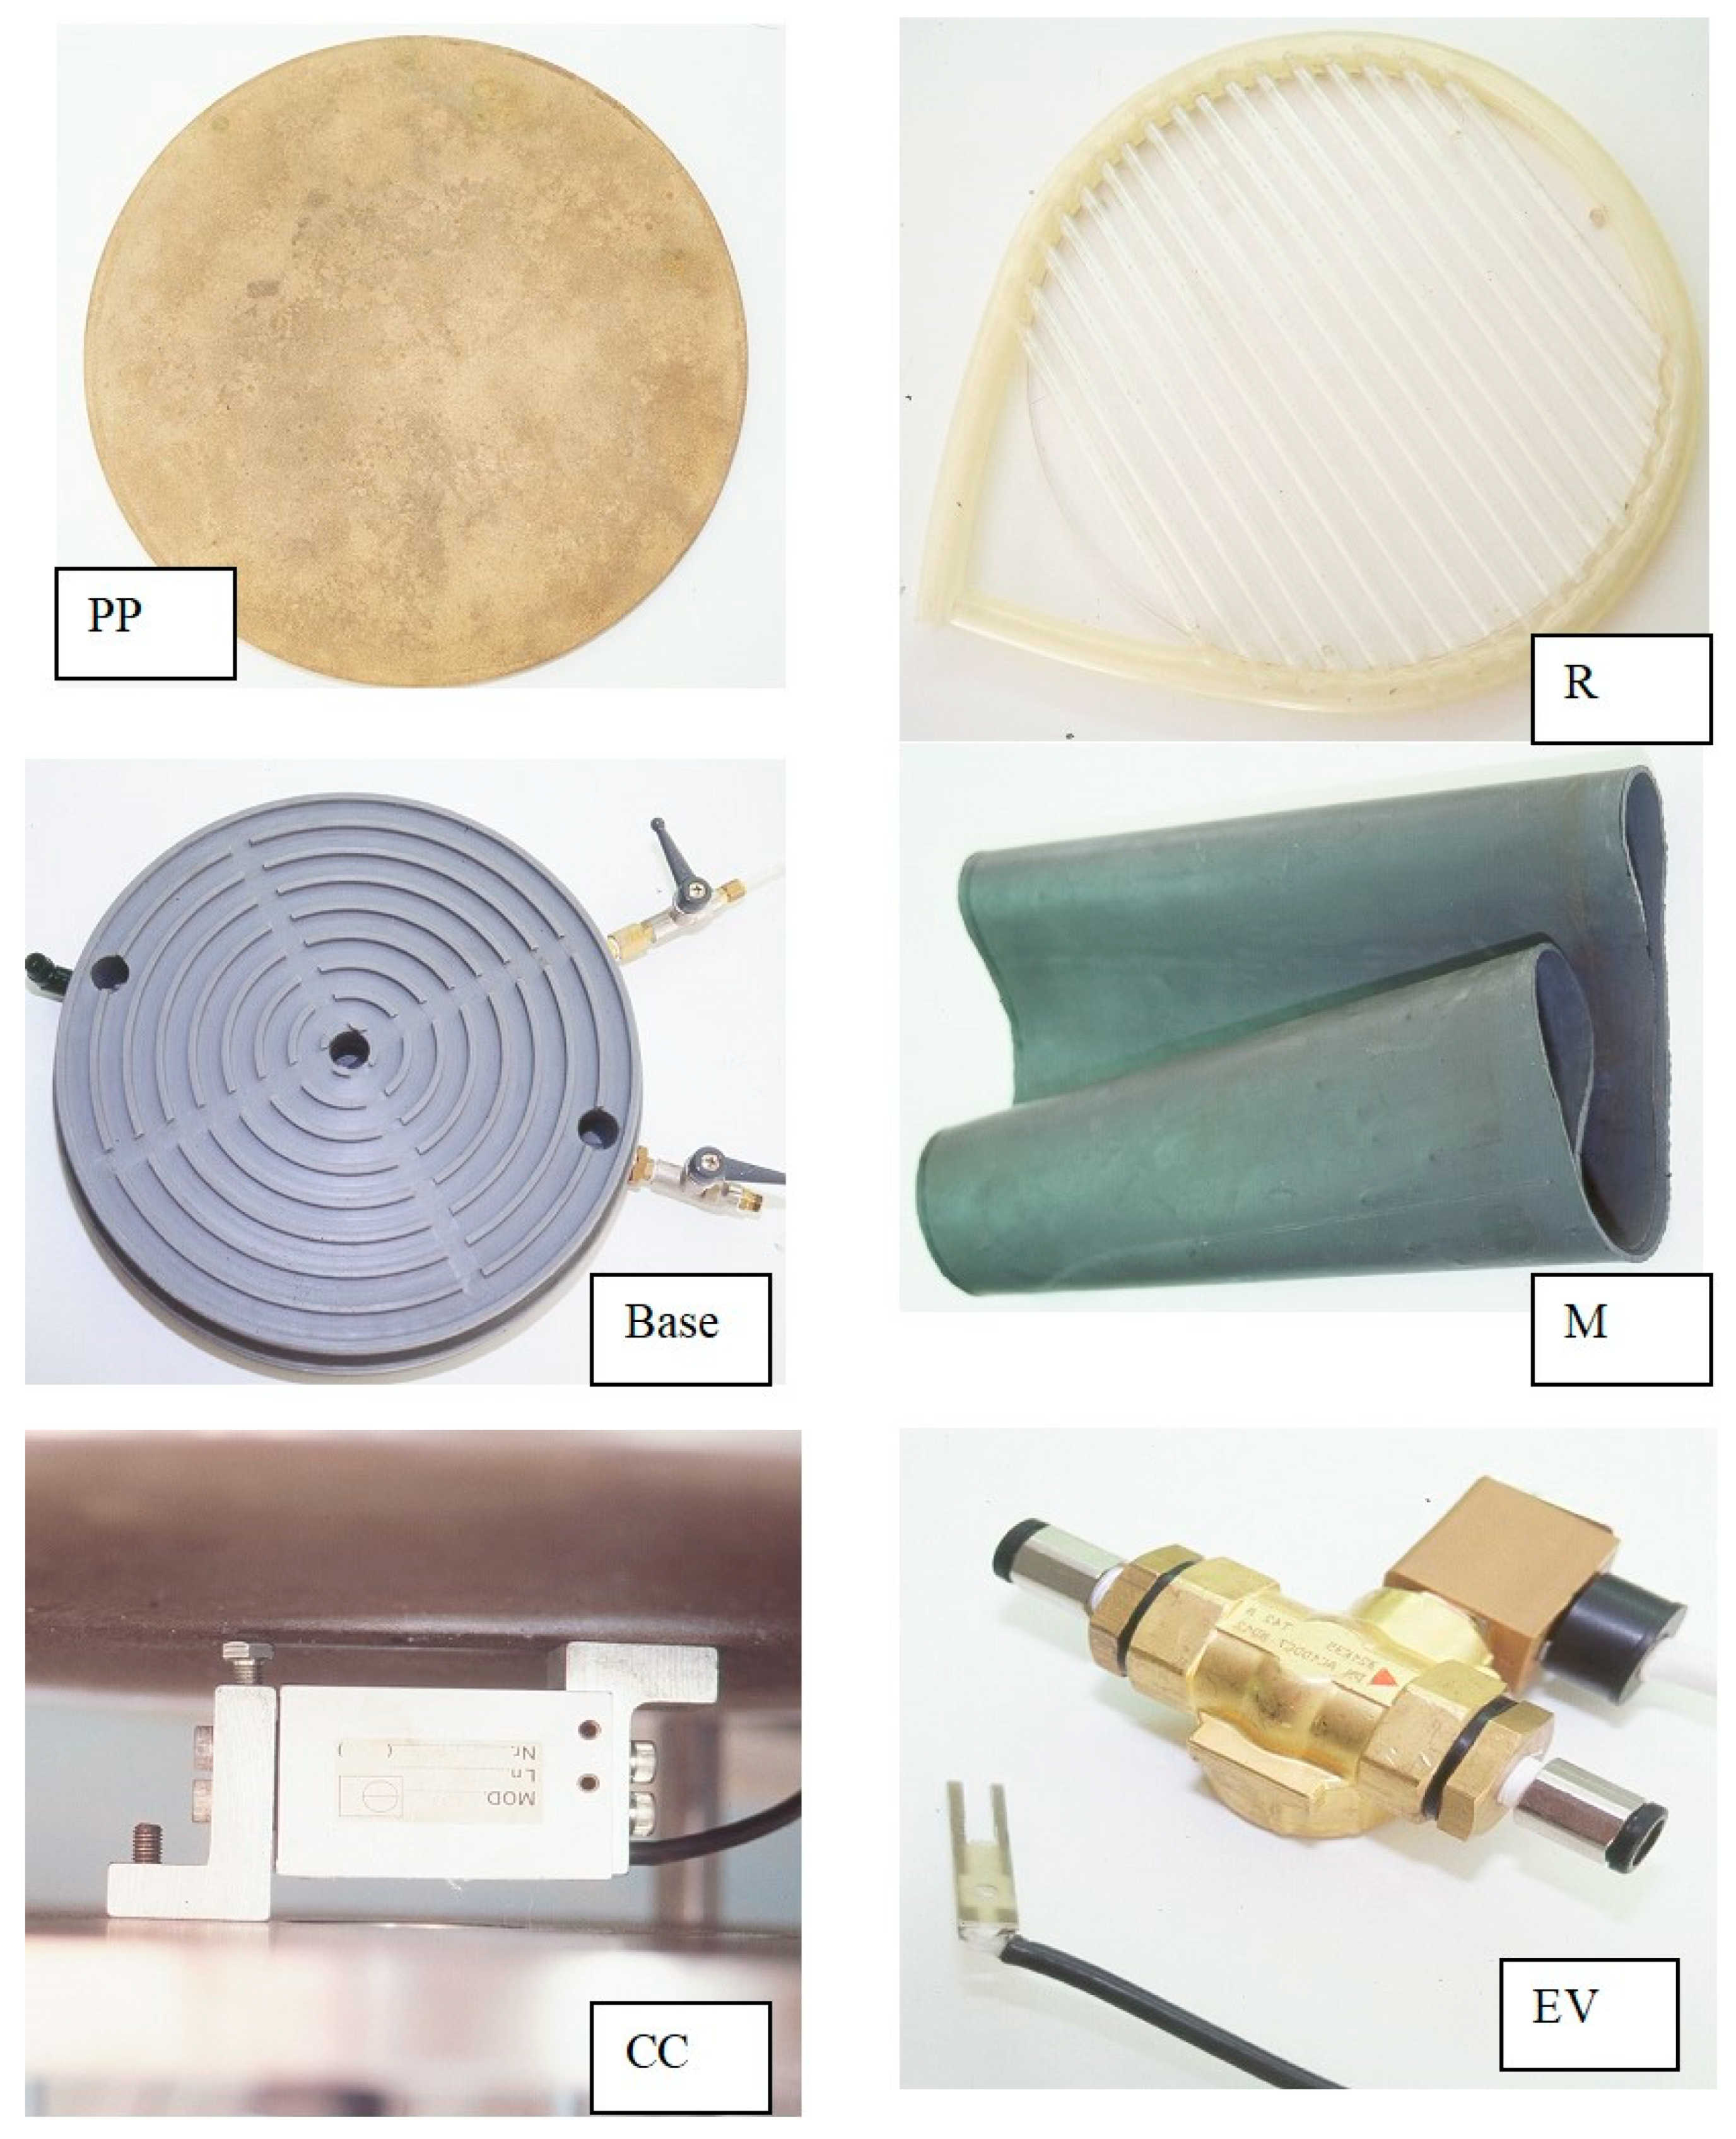
I) Physical part, consisting of a column with a load cell (CC, Figure 1 and Figure 2), solenoid valve, fan, bulb, porous stone, filter and various sensors to measure relative humidity, temperature, suction, volumetric water content, etc.
II) An electronic interface (data acquisition card) which acts as a link between the physical part and the computer.
III) An automatic control and recording system for the different sensors programmed with a code developed in Visual Basic.

2.2. Materials

The material used in the experiment is silt-clay tailings. This is the result of the exploitation of a lateritic nickel deposit. More information in [3,13].
Table 2. Min physical caracteristic a layers of tailings (see localization in Figure 1).
Layers H (cm) A (cm2) V (cm3) Ws (g) ρd (g/cm3) η Ww (g) w
N=3
1 2.55 637.94 1626.75 2300 1.41 0.64 1047.40 0.46
2 2.58 637.94 1645.89 2300 1.40 0.65 1066.54 0.46
3 2.59 637.94 1652.27 2300 1.39 0.65 1072.92 0.47
4 2.62 637.94 1671.41 2300 1.38 0.65 1092.06 0.47
5 2.63 637.94 1677.79 2300 1.37 0.65 1098.44 0.48
6 2.64 637.94 1684.16 2300 1.37 0.66 1104.82 0.48
7 2.65 637.94 1690.54 2300 1.36 0.66 1111.20 0.48
8 2.66 637.94 1696.92 2300 1.36 0.66 1117.58 0.49
9 2.67 637.94 1703.30 2300 1.35 0.66 1123.96 0.49
10 2.69 637.94 1716.06 2300 1.35 0.66 1136.72 0.49
11 2.68 637.94 1709.68 2300 1.34 0.66 1130.34 0.49
12 2.70 637.94 1722.44 2300 1.34 0.66 1143.10 0.50
*H: thickness of layers, A: area, V: volume, Ws: weight of solids, ρd: dry density, η: porosity, Ww: weight of water and w: gravimetric water content in saturated conditions.

2.3. Methods

The paper investigates the drying and wetting process of a sample of tailings. The dry and weting tests are performed under boundary conditions of relative humidity and temperature imposed on the surface of the tailings sample. The sample is 32 cm in height and 29 cm in diameter. The saturation and drying process was carried out at 26 degrees Celsius at the sample surface, an air velocity of 2 m/s and a relative humidity of 60%. Saturation was performed with a recharge applied to the column surface was 0.3 cm3/cm2/minute (Q=190 cm3/minute).
In addition, in this case the test laboratory also controlled the temperature, an aspect that had not been done before in any of the previous tests [3,4,11]. The sample was prepared according to the methodology described by [3,4]. Information and method of calibration of the different sensors can be found in the following research works [3,6,8].

3. Results

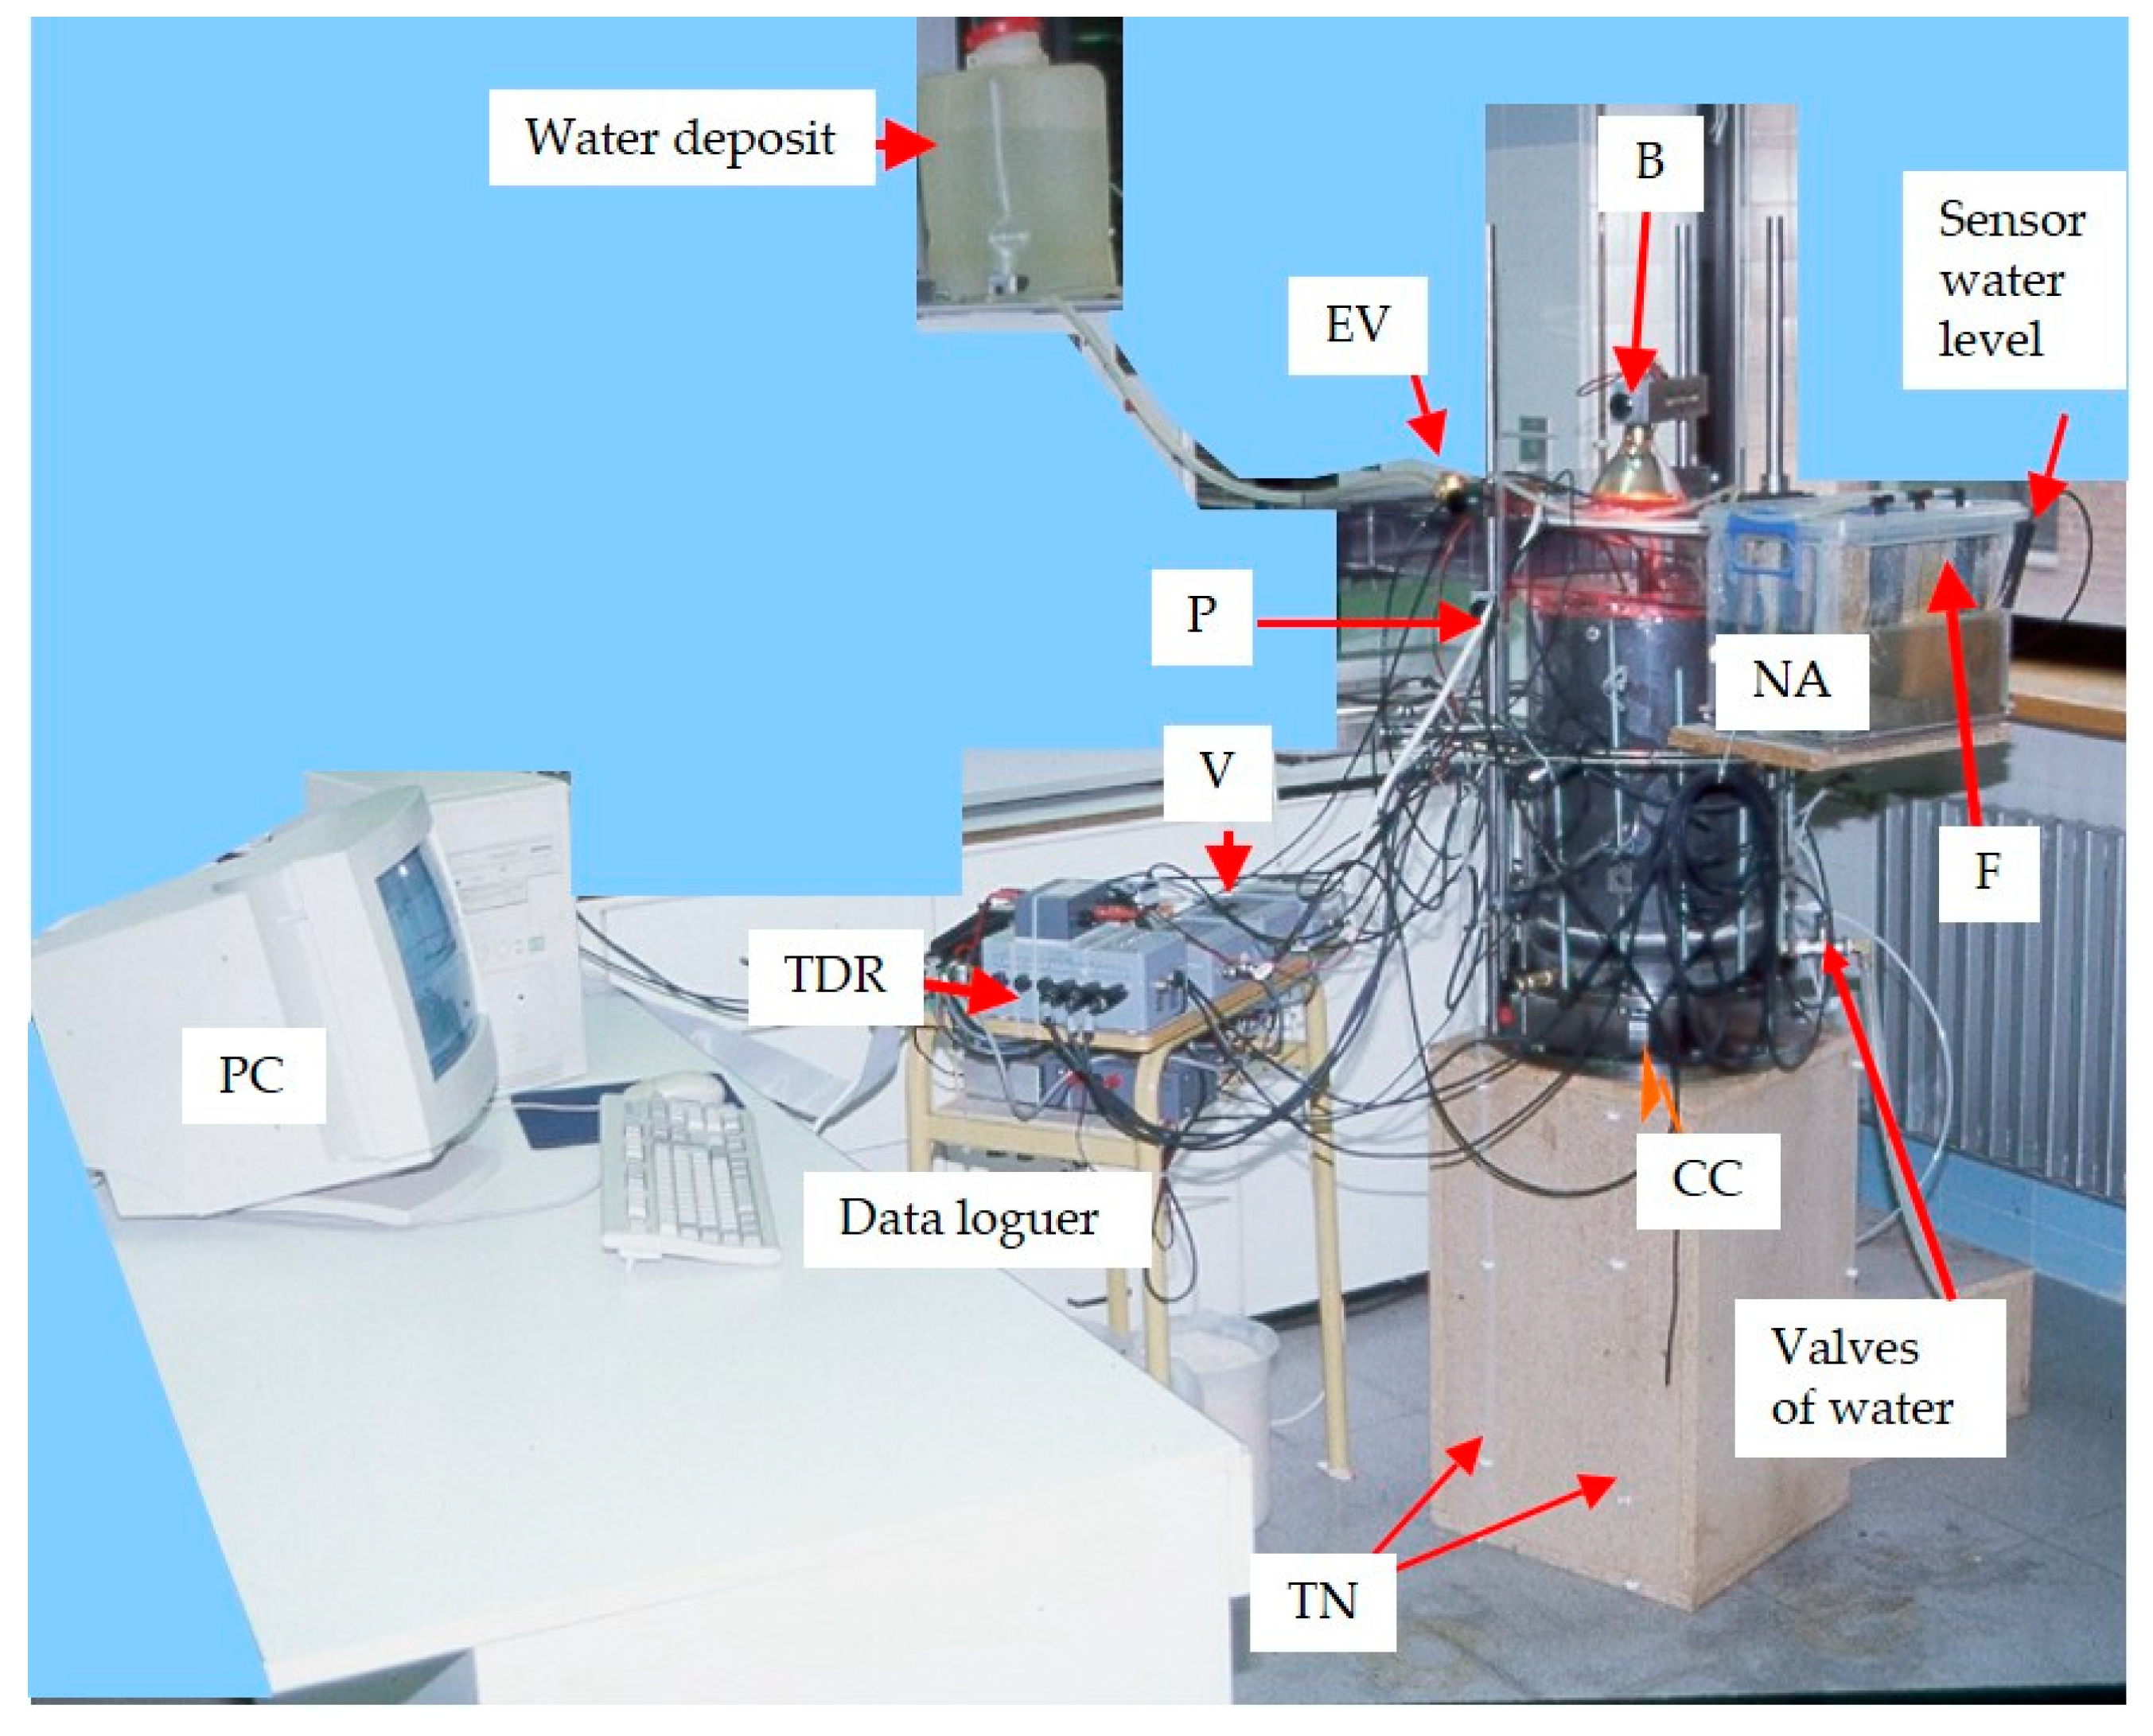
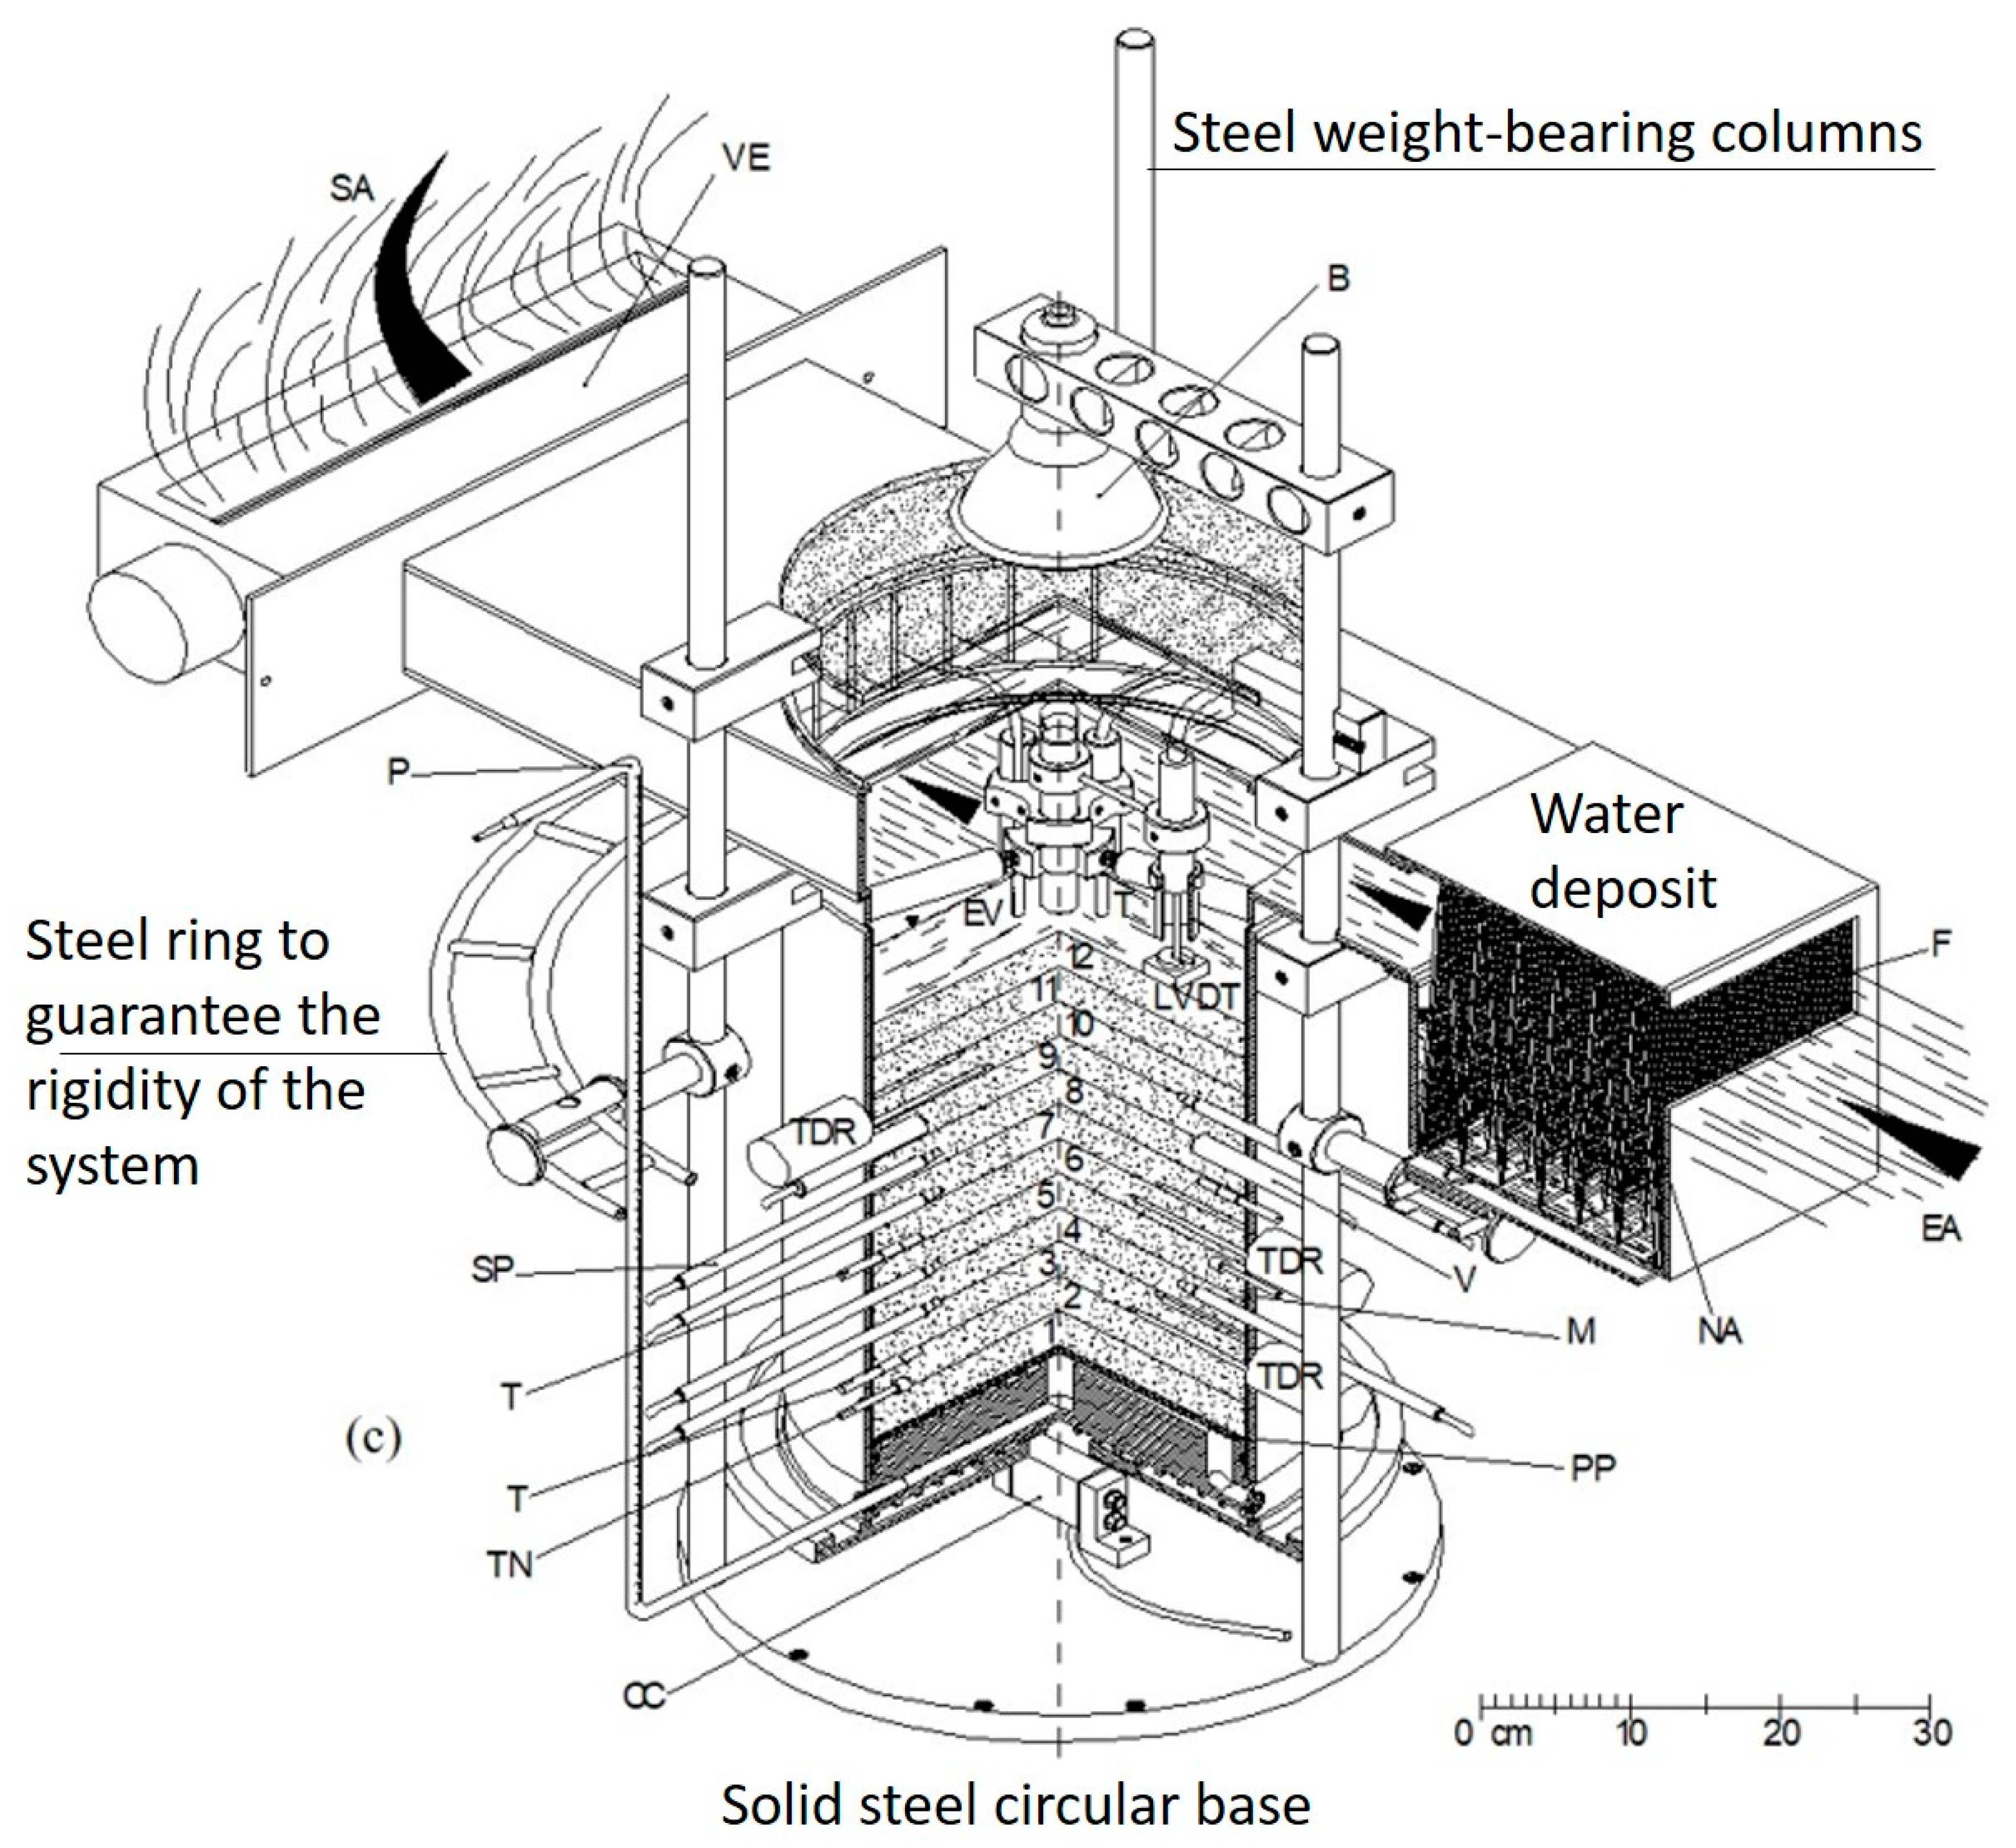
We will now analyze some of the results of the experiment. Figure 5 shows an image of the experimental set-up in the laboratory. Figure 6 shows a 3-D example of the application of the drying and wetting experiment developed on a tailings column. The objective is to evaluate the spatio-temporal variation of some physical, hydraulic and environmental parameters and properties.

3.1. Espaciotemporal Evolution a Relative Humidity and Temperature

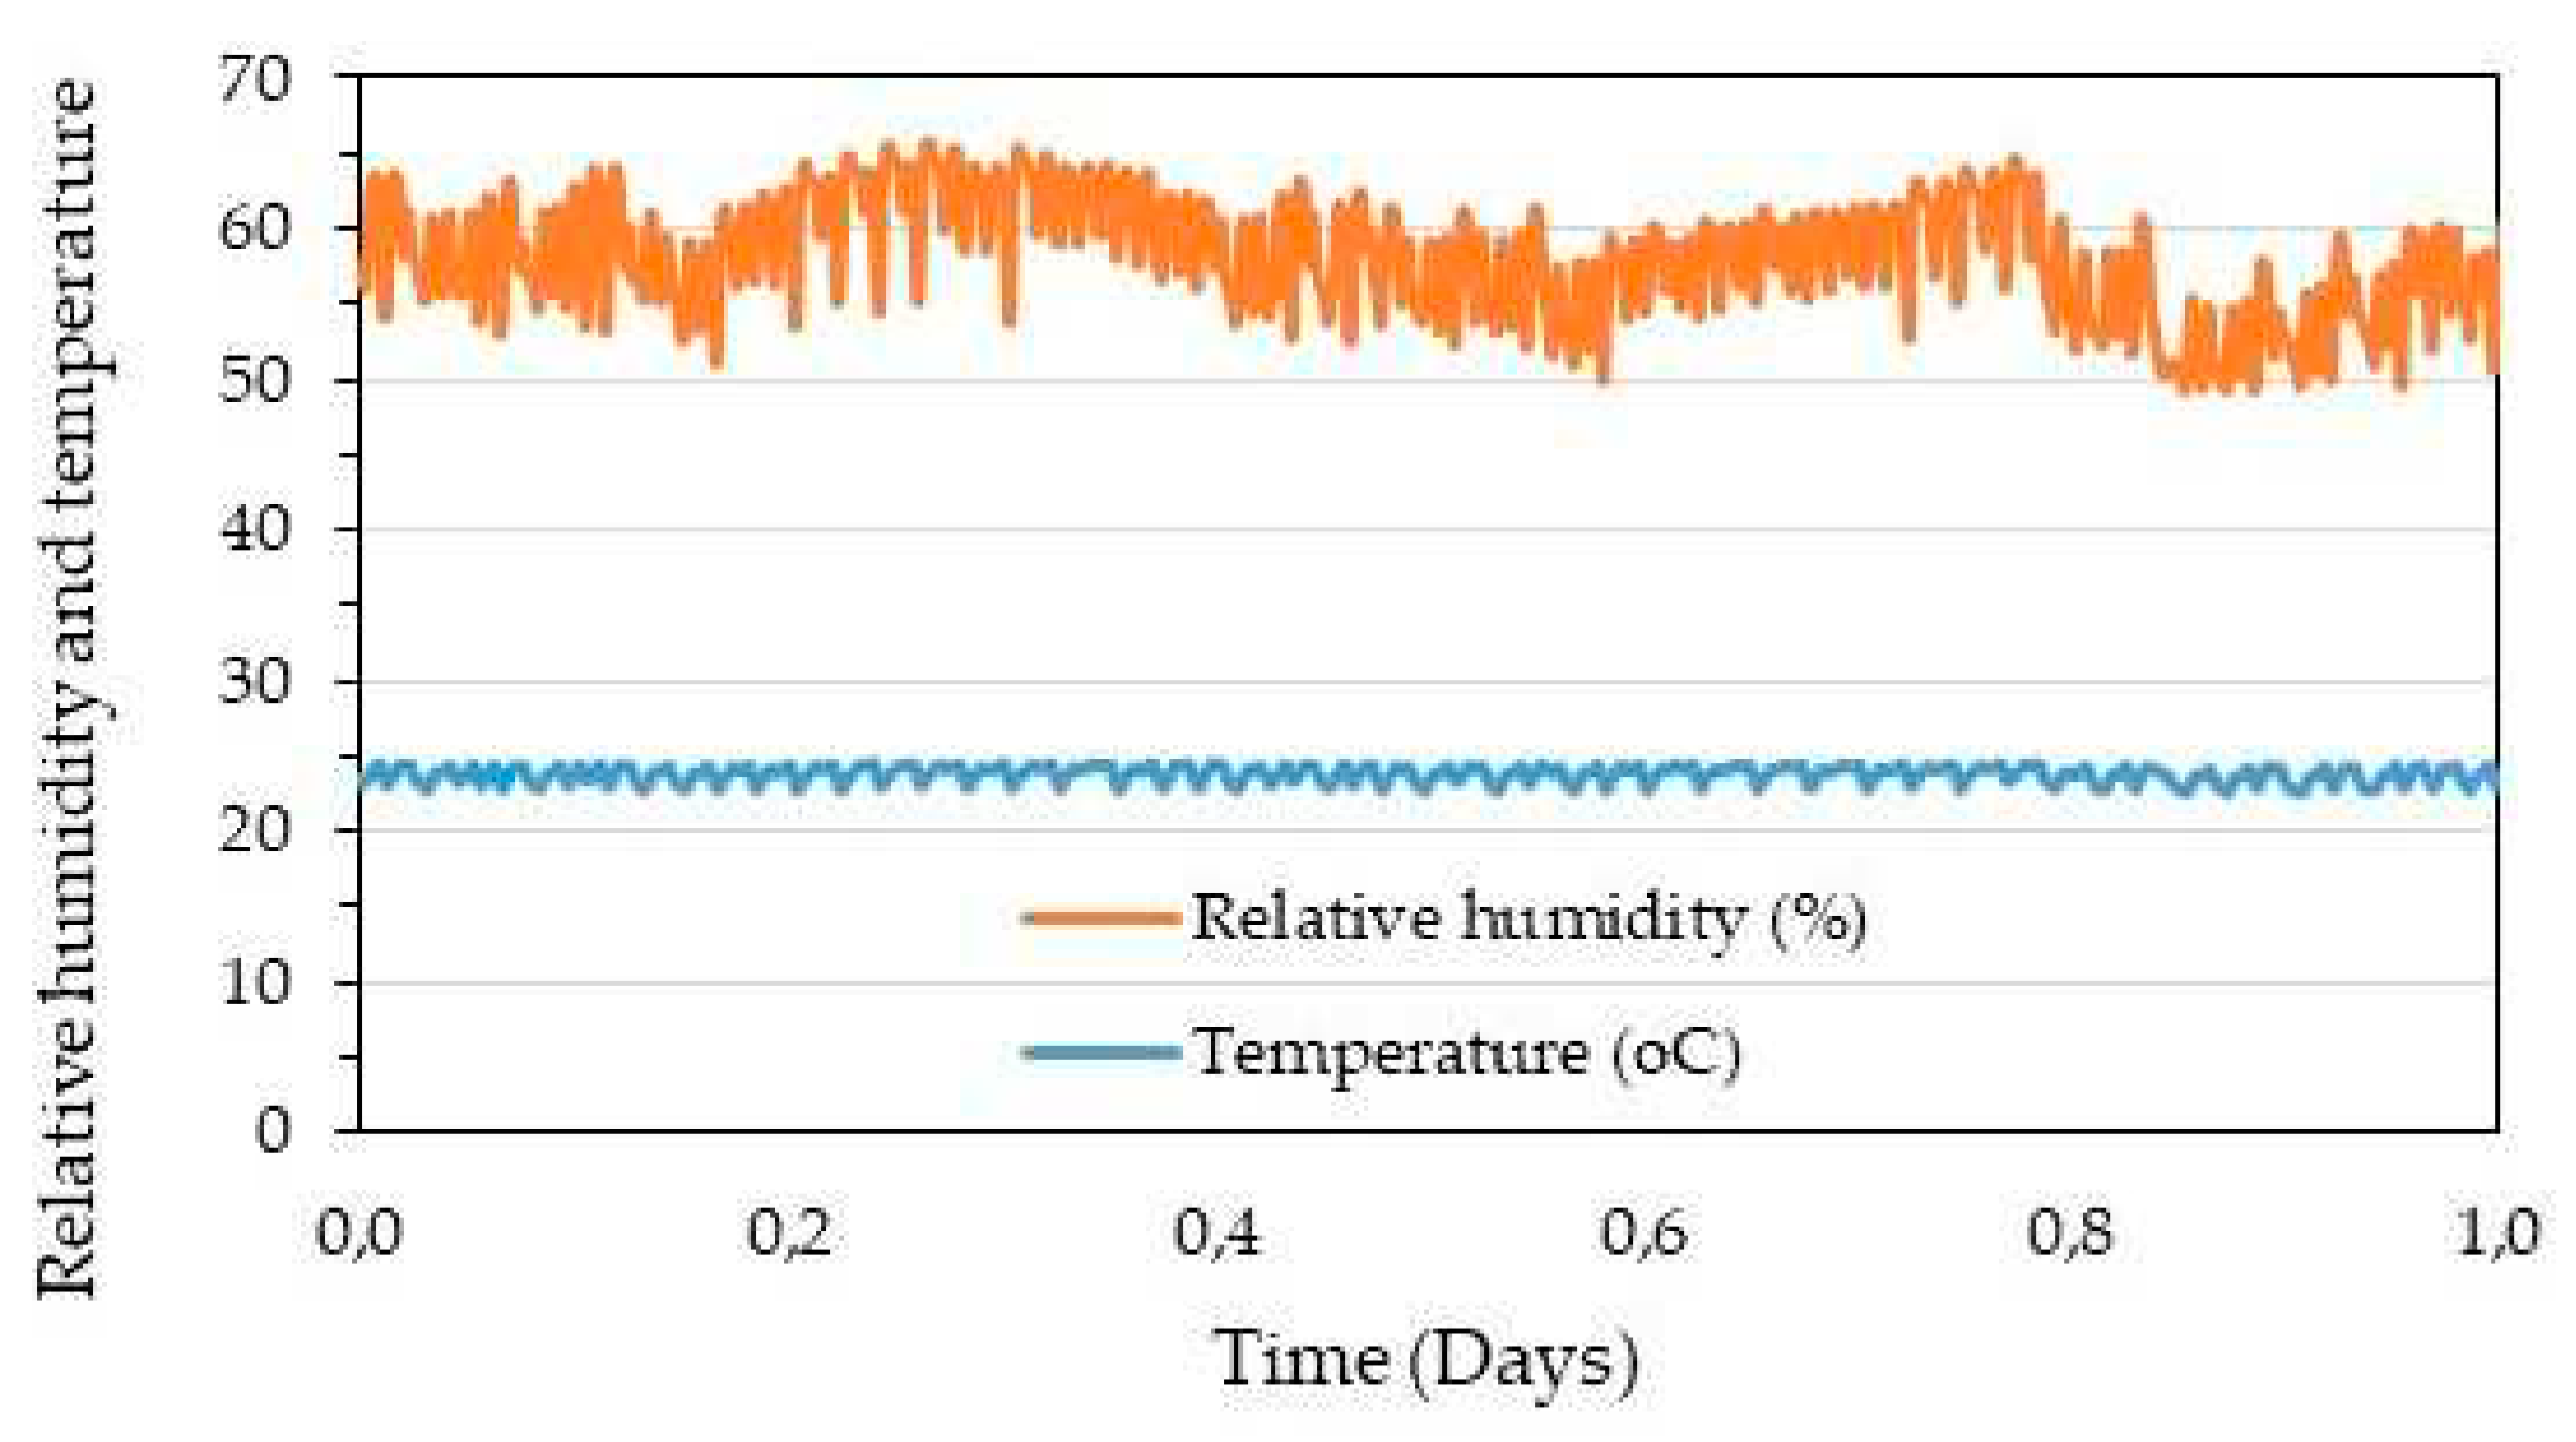
Figure 7 shows the results of the temperature evolution on the surface of the sample. The temperature shows very little variation range. However, the relative humidity of the air shows more variation than the temperature. It should be noted that the air velocity is always kept constant at 2 m/s and the temperature at the sample surface and in the laboratory. When the laboratory temperature is not controlled, it shows significant changes influenced by the temperature at the surface on the sample and in the laboratory [3].

3.2. Espaciotemporal Evolution a Saturation, Dry and Consolidation a Tailings Sample

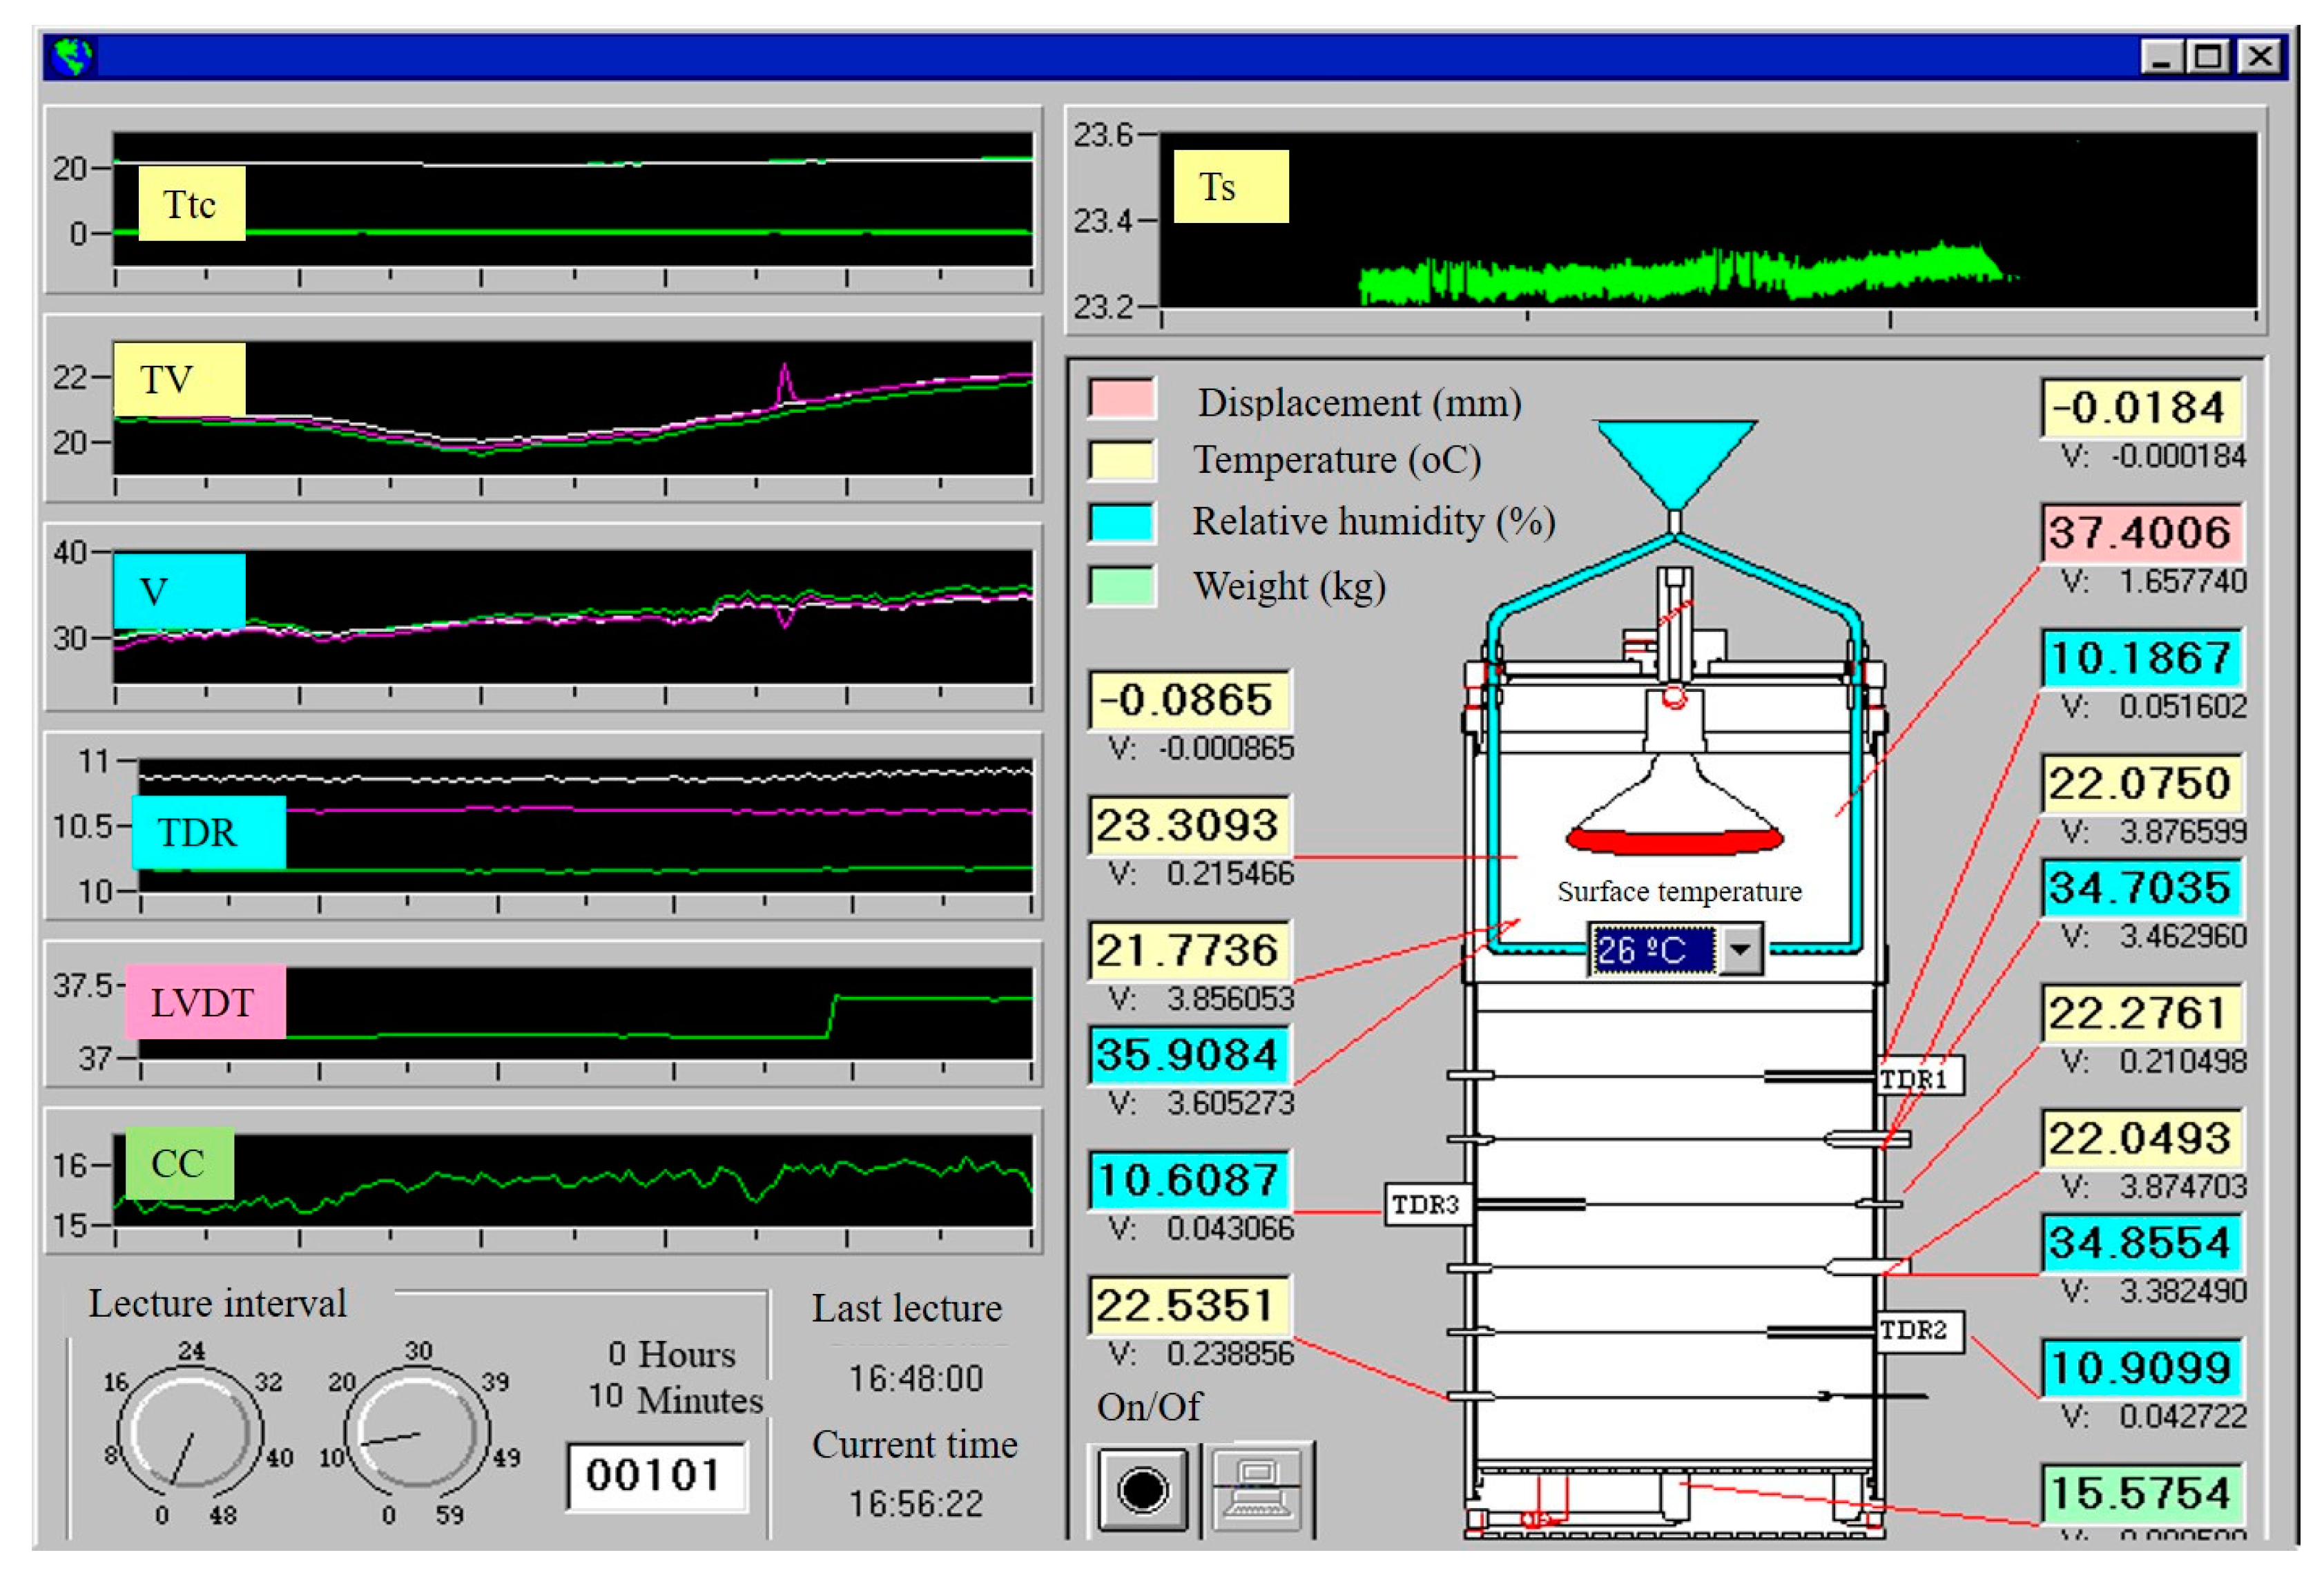
The initial recharge applied to the surface of the column was 0.3 cm3/cm2/minute (Q=190 cm3/minute). This flow rate allowed a 2 mm high layer of water to form on the column 10 minutes after the saturation process had started. Subsequently, this height was kept constant with the water supply from the solenoid valve controlled by a water level sensor until 1000 minutes had elapsed. At this point, the position of the solenoid valve sensor was raised and the water level on the surface of the column was increased to 80 mm. As can be seen in Figure 4, the system developed sensor readings every 10 minutes during both the saturation and dry processes.
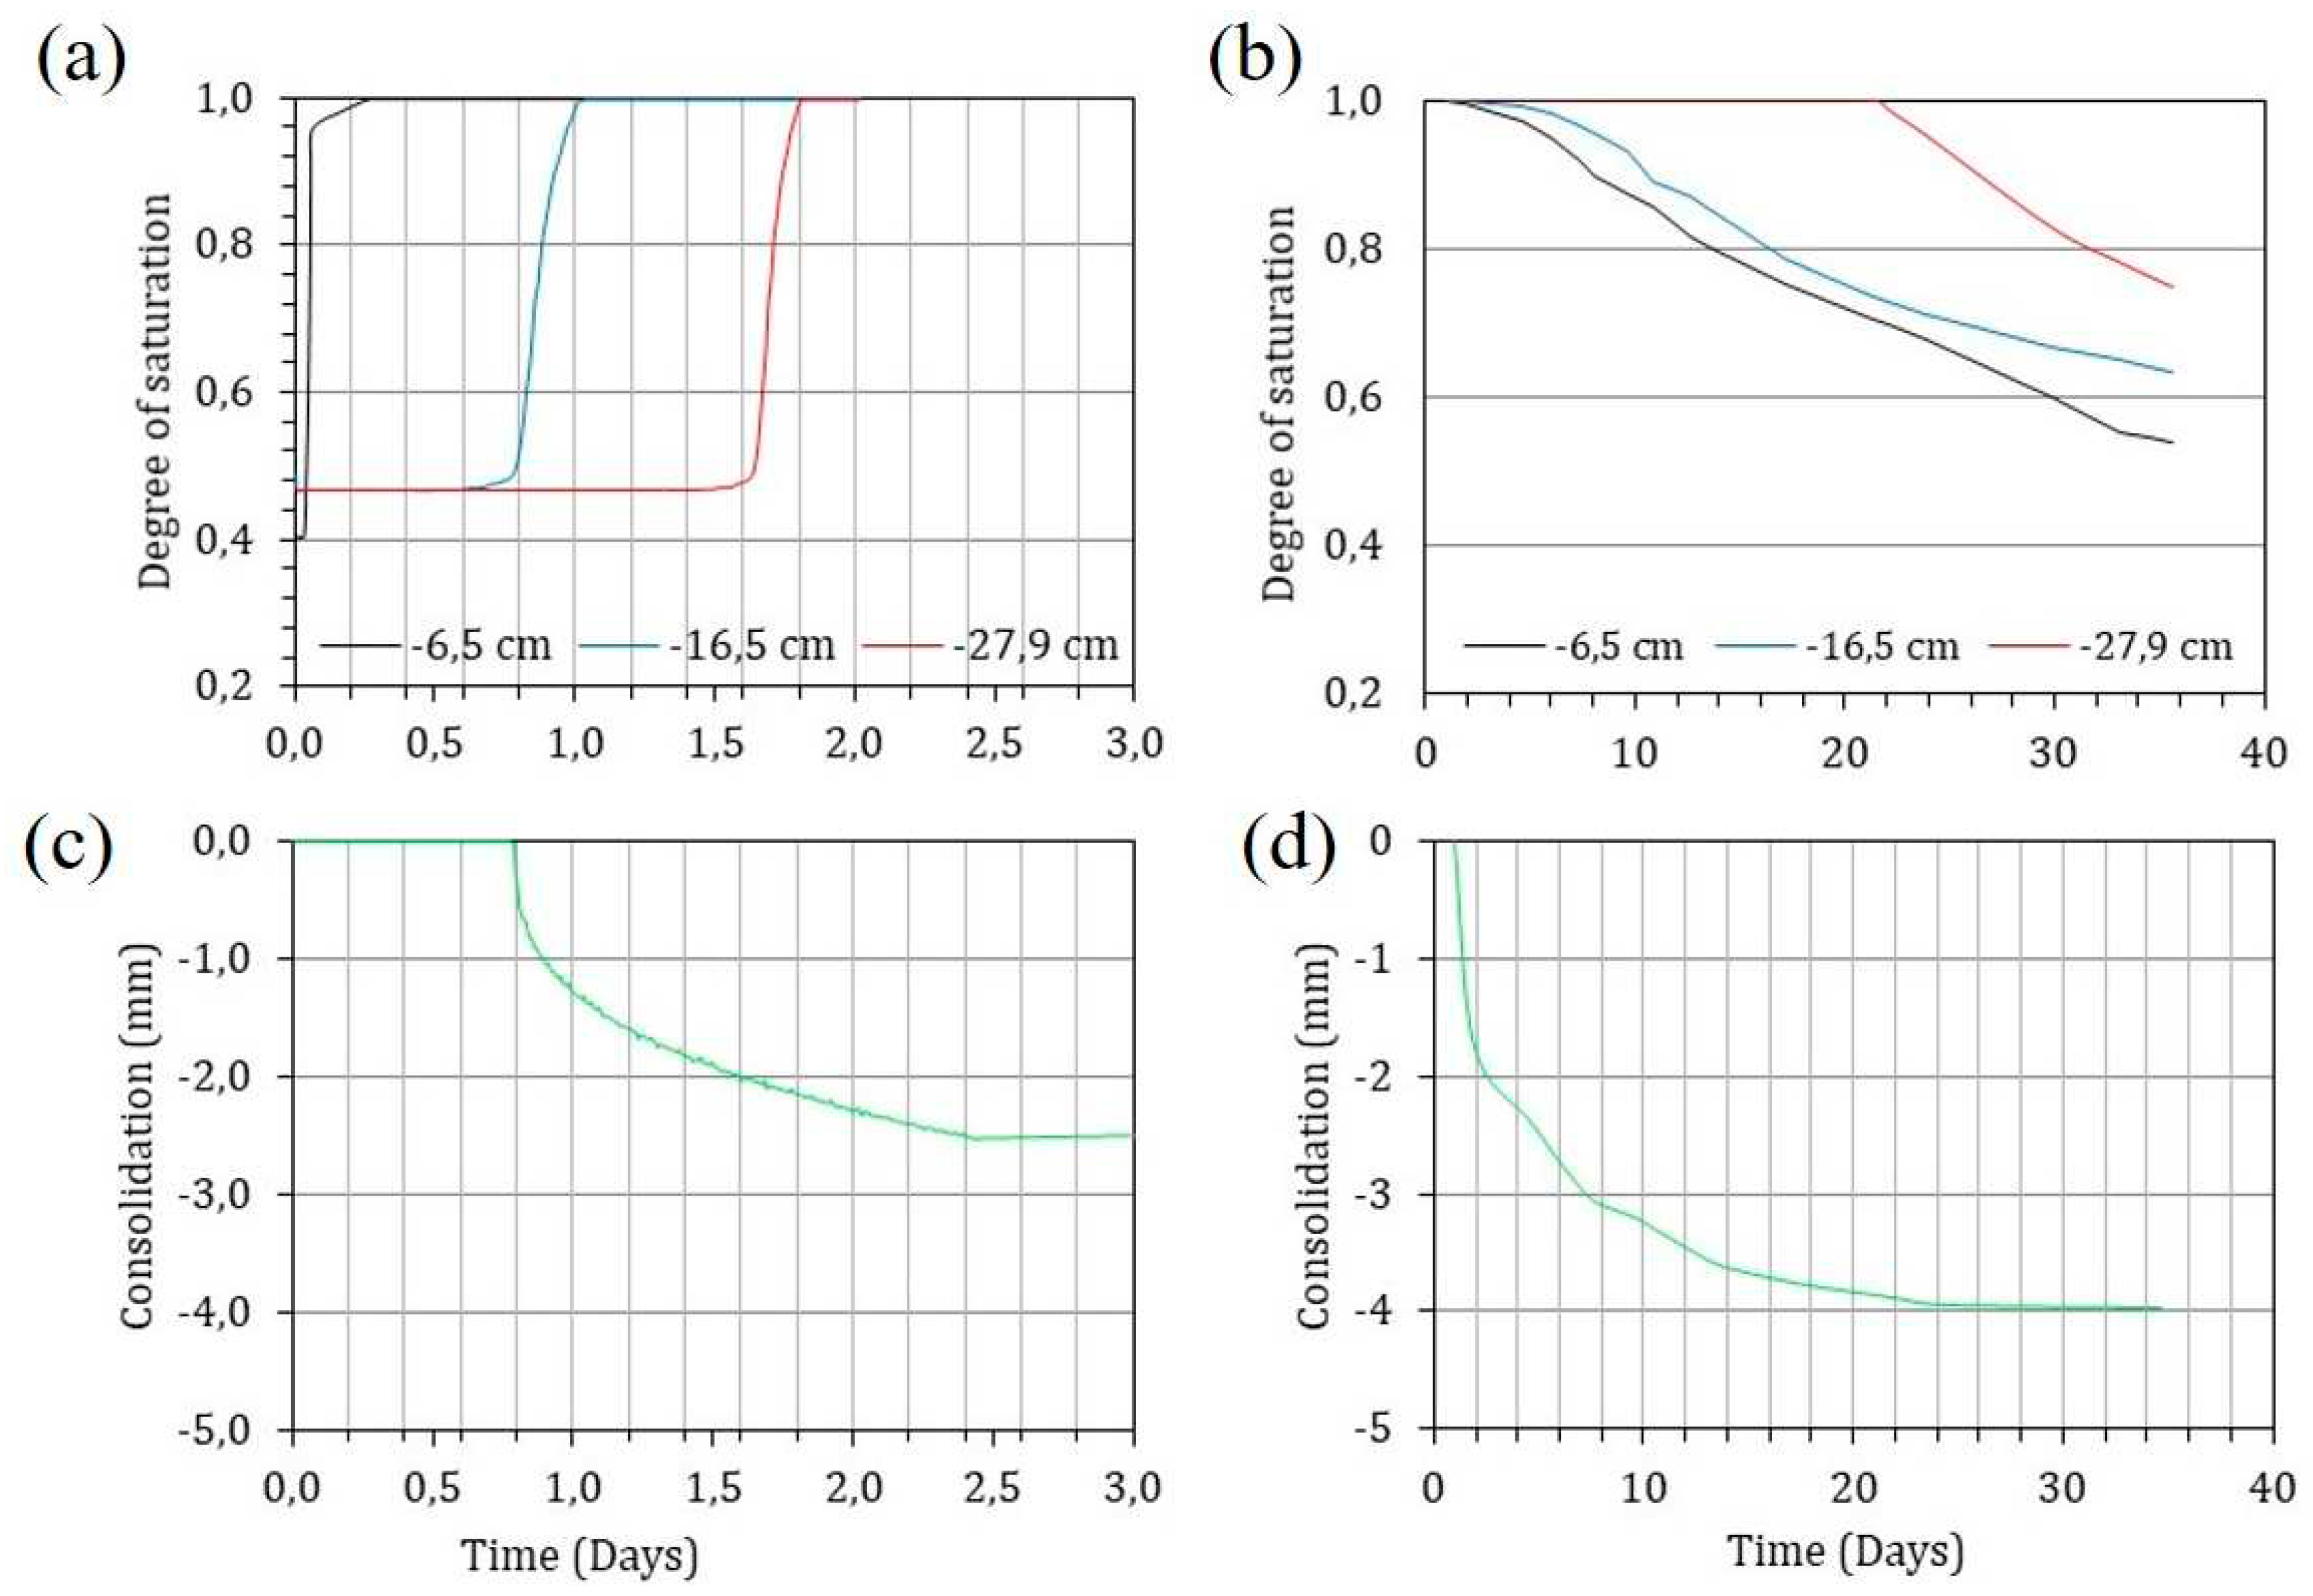
Figure 8a shows the spatial and temporal evolution of the increase in the degree of saturation during saturation and Figure 8b during drying. It can be seen that the tailings saturate quickly but the drying process is very slow. Consolidation during saturation begins when TDR2 starts to saturate at a depth of 15.6 cm. It starts to consolidate 0.8 days after the start of the recharge and ends after 2.4 days, after which time it stabilises. This behaviour is due to the presence of stratification and drying cracks in the sample. Studies by [3] show the existence of an increase in permeability of up to two orders of magnitude due to the effect of cracks and stratification.
The results show that the interaction processes of the porous medium with the atmosphere are complex. In the saturation process the response of the first sensors is very fast. After only two days the porous medium is saturated.
In the drying process the behaviour is different. A direct influence is observed in the first 20 cm of the soil in the first week. However, at greater depths the evaporation processes take more than 20 days to develop.

4. Discussion

In the following, we discuss on the basis of real results the main applications and uses that can be made with the automatic system (patent 2-241-477) [14].
a)- It allows the filling of the chosen or designed tank with solid material of any characteristic (natural or anthropogenic soils, waste, etc.). The filling of the column can be done all at once, in stages, in layers, by compacting the material or by pouring it wet and leaving it to dry and consolidate inside according to the objectives of the work [3,6,17].
- Flow and solute transport tests can be performed under saturated or unsaturated conditions. The porous medium can be homogeneous or heterogeneous. The hydraulic gradient of the column can be modified according to the objectives of the work. The saturated hydraulic conductivity is determined under steady state conditions and constant or variable hydraulic gradient. A solenoid valve controls the water level at the surface of the sample and waters deposit [3,6,17].
- It allows soil shrinkage (crack formation) tests with temperature control or imposition, with control of water mass loss by evaporation, relative humidity and surface wind speed. Soil shrinkage can only be measured continuously in the vertical direction. A computer continuously stores the data [3,6,17].
- It allows the measurement in depth of humidity, suction and temperature and their evolution in the vertical profile and over time [3,6,17].
- It measures the loss in weight as a function of time, which makes it possible to determine the evaporation of the sample tested [3,6,17].
- It allows the temperature of the desired test to be set [3,6,17].
- The desired wind speed can be set if a power regulator for the fan, motor is available [3,6,17].
- Relative humidity can be set with a variation of ±5percentage under ambient temperature conditions, this variation can be reduced by 1-2% if tests are carried out in a temperature-controlled laboratory [3,6,17].
- It allows a recharge (irrigation) to be applied or carried out on the soil sample under test provided that the total weight of solid and water does not exceed 100 kg, this can be solved by using a load cell with a higher capacity [3,6,17].
- The process of evolution of the volumetric water content can be controlled by the TDR and the suction by psychrometers and tensiometers [3,6,7].
- The saturation of the solid material can be carried out in two directions from bottom to top or from top to bottom [3,6,17].
- From this design, the height and capacity of the column, as well as the number of sensors can be varied according to the objectives of each research work [3,6,14,17].
The sensors used and calibrated for this study have been applied in other research in site [15,16] and doctoral thesis development [3,12].
More information and details in [3,14,16].

5. Conclusions

The results show the versatility of the utomatic system for the control of environmental variables and boundary conditions in one of the many test variants that can be performed.
With the data from the humidity, suction, relative humidity sensors and the physical properties of the porous medium, the water retention curve (WRC) is obtained. The WRC is obtained for the drying and wetting processes.
With the drying and wetting process, the spatio-temporal evolution of the consolidation experienced by the tailings is observed.

6. Patents

Patent: 2 241 477. Authors Rodríguez-Pacheco, R.L.; Lloret A.; Candela, L.; Pérez, T.; Cortés, F. Dispositivo para la caracterización de medios porosos sujetos a diferentes condiciones ambientales y de contorno, 2006. Patent: 2 241 477. DOI: 10.13140/RG.2.1.2012.4882

Author Contributions

Conceptualization, methodology, software, validation, formal analysis, investigation, resources, data curation, writing—original draft preparation, writing—review and editing, visualization; supervision; project administration; funding acquisition.

Funding

This research received no external funding.

Data Availability Statement

Not applicable.

Acknowledgments

This research was supported by the Spanish Ministry of Ecological Transition and Demographic Challenge. Authors thanks the anonymous reviewers for their work.

Conflicts of Interest

The author declare no conflict of interest.

Appendix A

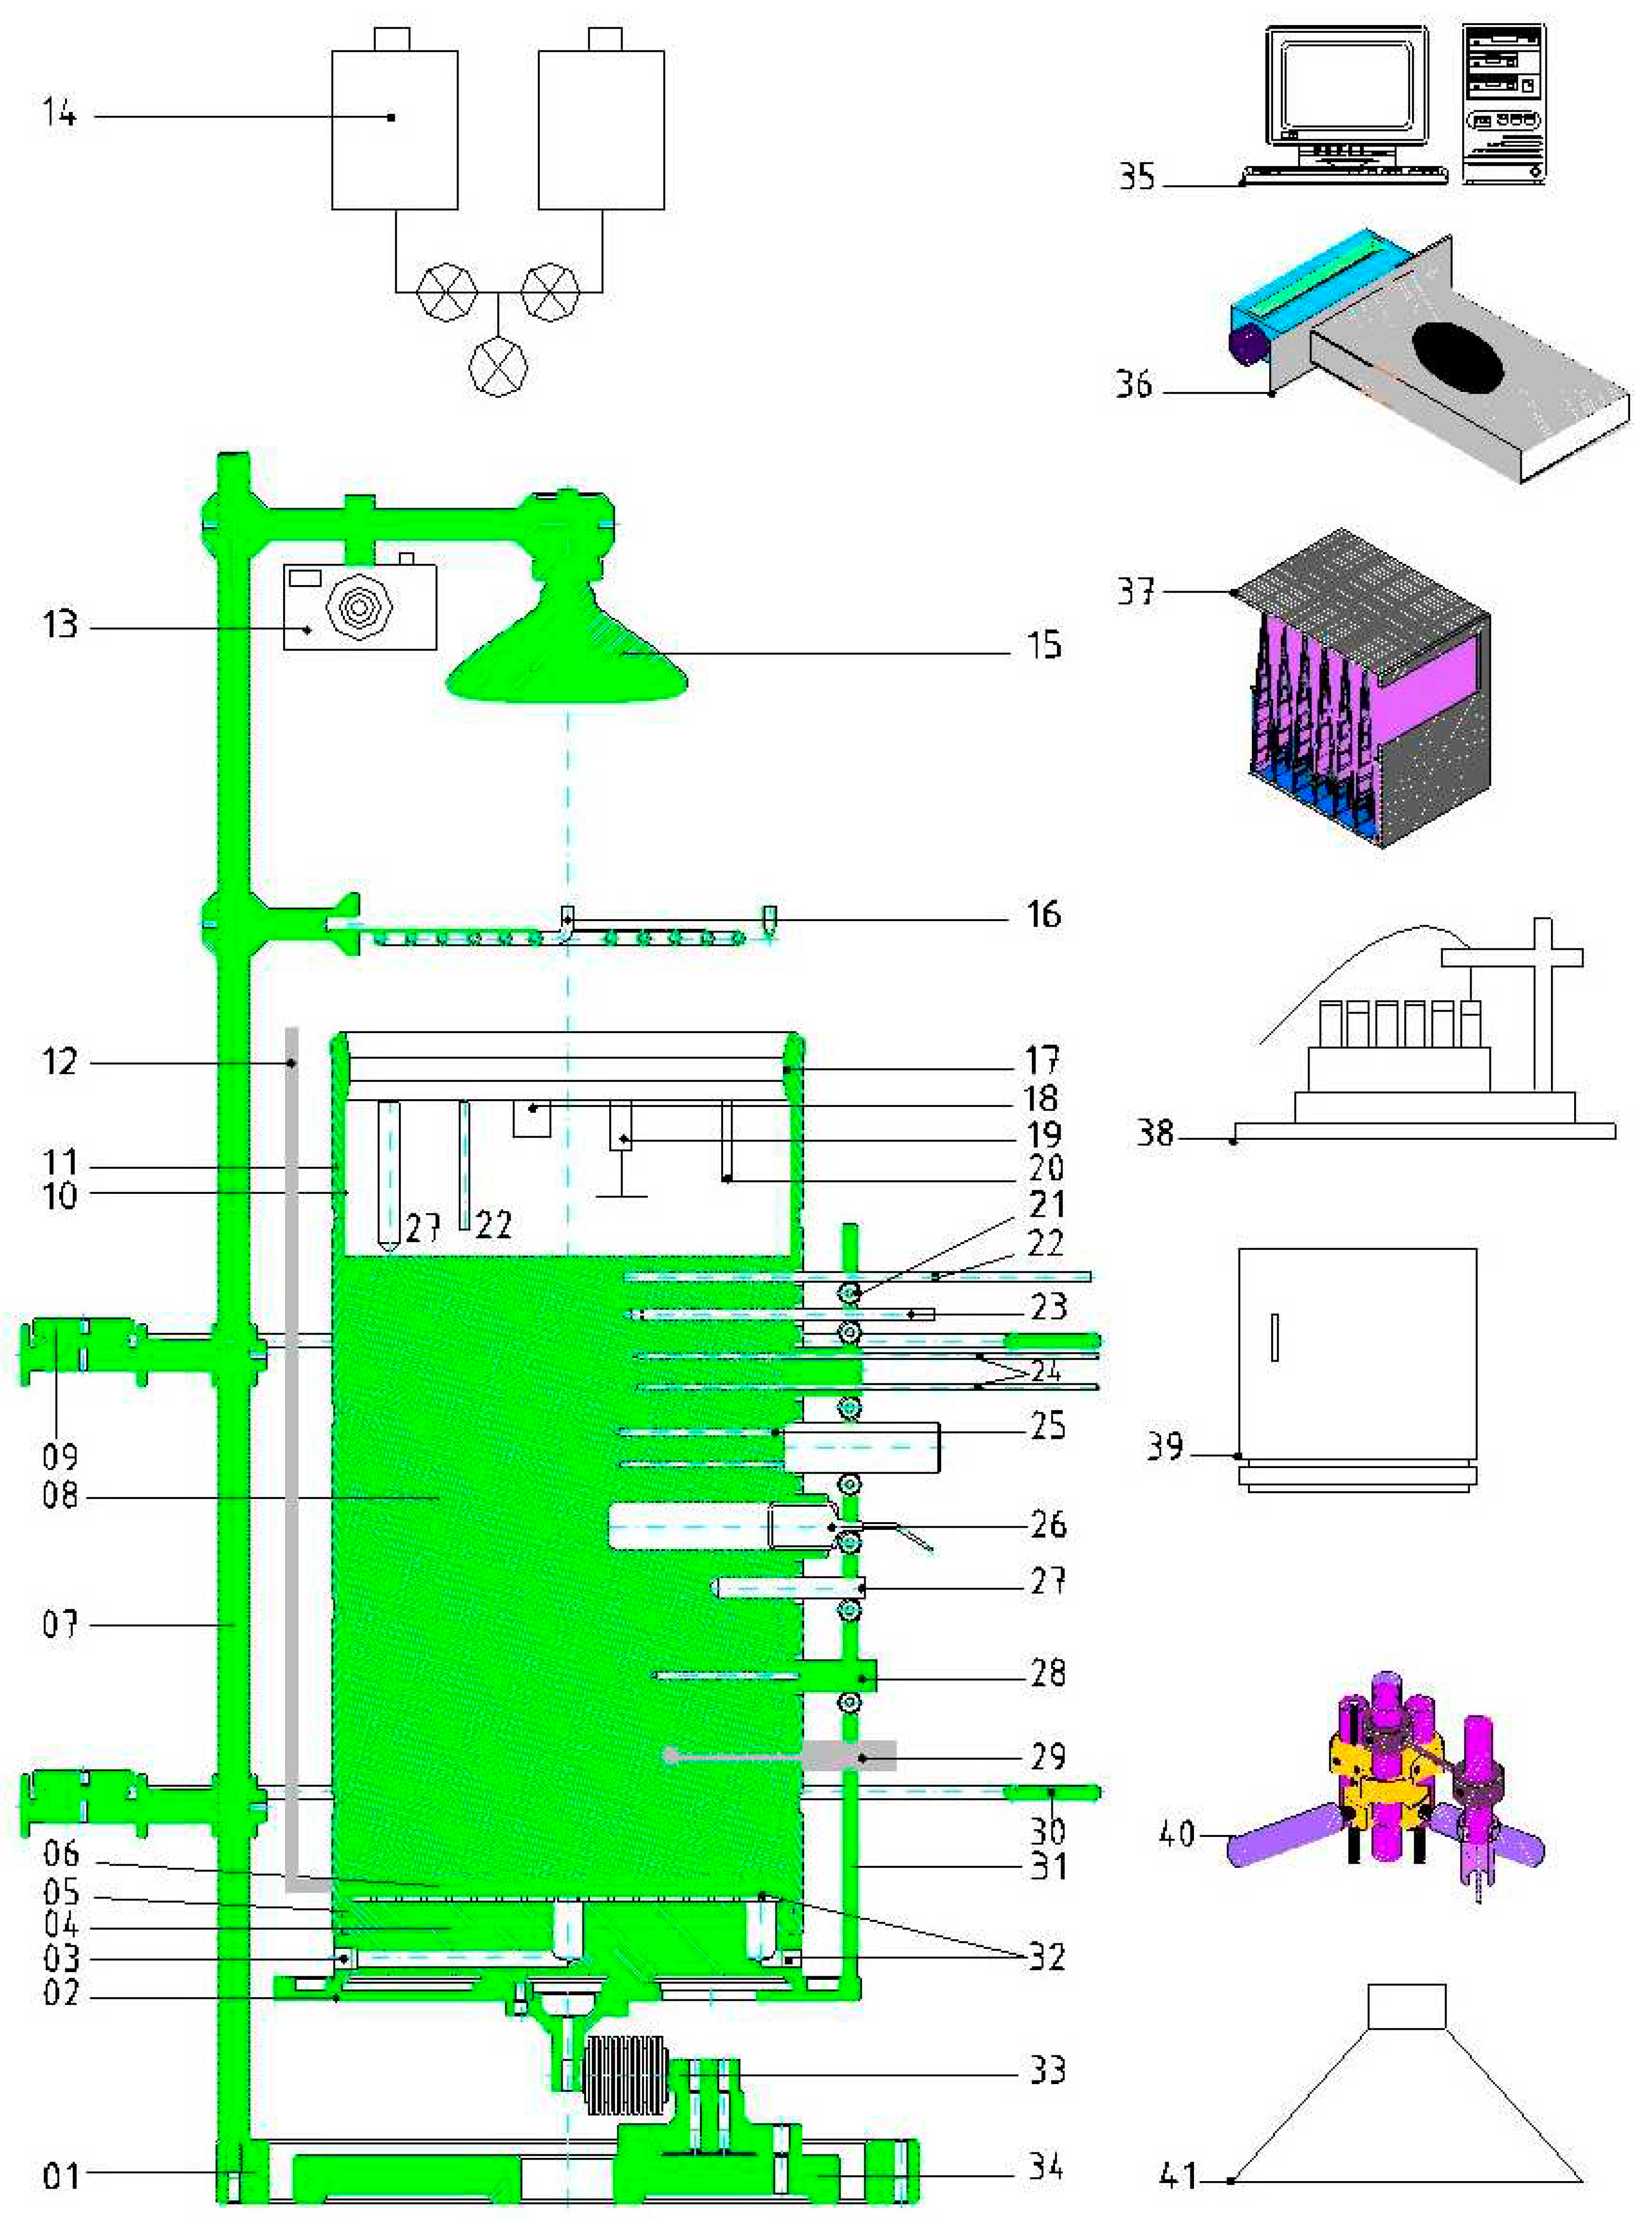
The main parts, components and different sensors that can be placed in the "Device for the characterization of porous media subject to different environmental and boundary conditions" and their main functions are described below (see Figure A1).
01. Outer ring and base on which rests the protective rings of the system and the support of other sensors.
02. Base of the main tank on which rests the filter (06) and the sample (08) with the sensors, is directly connected to the load cell (33).
03. Drainage system for the effluent coming out of the sample of porous material.
04. Disc on which the porous disc rests and through which the drainage of the device is evacuated.
05. Adjusting O-ring between the base and the outer wall of the device, in this case the column in which the porous material surrounded by the membrane is stored.
06. Position of the filter, porous stone or suction plate. The placement of one or the other depends on the test to be performed.
07. Support bar or mast on which rest all the connectors that transmit the signal from the different sensors to the data acquisition system.
08. Sample of porous material, which varies its geometric shape (Figure 2) depending on the test to be performed.
09. Outer ring and its fastening device on which rests the load of the cables that transmit the signals from the sensors to the data acquisition system.
10. Membrane used to isolate the sample from the outer column and prevent preferential flow through the walls as it confines the sample of porous material.
11. Outer wall of the device, this can have different geometric shapes, as well as being made up of horizontal, vertical or continuous sections.
12. Piezometer to measure the piezometric level of water inside the sample of porous material.
13. Digital camera for continuous observation, it is connected to the computer where it stores the information acquired during the performance of a test and according to the time interval that has been programmed.
14. Tanks from which water is supplied to the system.
15. Bulb for the imposition of the temperature, this one has a device in which the intensity of the same one can be regulated.
16. Irrigation system that simulates a rainfall of a certain intensity.
17. Closure that guarantees the rigidity of the sample container (08) when made in sections and to which certain sensors are attached to measure certain variables at different heights or on the surface of the sample.
18. Laser sensor.
19. Sensor for measuring the change in height of the sample.
20. Electrovalve for the control of water on the surface of the sample of porous material according to the test.
21. Mechanism for holding and moving the sensors to the desired position.
22. Thermometers for measuring temperature variation in porous material. The measuring range is between 0 -100 degrees Celsius.
23. Psychrometer to measure suction and temperature in the porous material sample.
24. Sensor to measure the thermal properties of the porous material.
25. Meter for measuring the volumetric water content in the porous material sample. Its sensitivity depends on the type of sensor.
26. Micro-tensiometer to measure suction in the soil.
27. Relative humidity and temperature meter in the air or inside the sample. It measures between 0 and 100 percent relative humidity and between 0 and 100 degrees Celsius.
28. Micro-tensiometer for measuring the suction in the sample of porous material.
29. System for taking a water sample from the porous material.
30. Outer ring for protection of the central part of the device, as many as necessary can be placed.
31. Support for the various sensors attached to the base on which the sample rests, which in turn is connected to the load cell.
32. Orifice through which a stream of water, steam or air can be applied through the base of the sample.
33. Load cell that allows the measurement of weight variations in the device, due to the application of water recharge in the system or evaporation of this.
34. Base of the device to which the load cell is connected, this base is rigid and of great weight. Its function is to give stability to the system.
35. Computer which includes the electronic interface with the different sensors, the computer program that performs the acquisition and storage of data and displays on screen the results of the measurements of the different sensors in real time.
36. Fan that can be coupled to the system at the top of the sample to apply a certain wind speed according to the desired climatic conditions.
37. Water reservoir for cotton filters
38. Automatic sampler
39. Refrigerator for sample conservation
40. System to move the sensors to the desired position or point in the sample reservoir. It ensures that once the sensor is in place it remains rigidly at that point.
41. Extraction hood for vapor, gases, volatile elements, etc.
Figure A1. The main parts, components and different sensors that can be placed in the "Device for the characterization of porous media subject to different environmental and boundary conditions".
Preprints 89516 g0a1

References

  1. Miller, E.D. Physics of swelling and cracking soils. J. Colloid, Interface Sci. 1975, 52, 344–443.
  2. Blight, G.E. Interactions between the atmosphere and the Earth. Geotechnique 1997, 47, 715–767.
  3. Rodríguez, R., Estudio Experimental de Flujo y Transporte de Cromo, Níquel y Manganeso en Residuos de la Zona Minera de Moa, Cuba: Influencia del Comportamiento Hidromecánico,” Ph.D. Thesis, University Polytechnic of Catalonia UPC, Barcelona, Spain, 2002.
  4. Rodríguez, R. Hydrogeotechnical characterization of a metallurgical waste. Can Geotecl J 2006, 43, 1042–1060. [CrossRef]
  5. Morris, P.H., Graham, J., Williams, D.J. Cracking in drying soils. Can. Geotech. J. 1992, 29, 263–277. [CrossRef]
  6. Rodríguez, R.; Candela L.; Lloret A. Experimental system for studying the hydromechanicalbehaviour of porous media. Vadose Zone J 4, 345–353.
  7. Lloret, A., Ledesma, A.; Rodríguez, R.L.; Sánchez, M.J. ; Olivella, S.; and Suriol, J. Crack initiation in drying soils. Proc. Int. Conf. on Unsaturated Soil, 2nd edition, 27–30 Aug. International Academic Publishers, China, Beijing, China. 1998. Vol. I. p. 497–502.
  8. Rodríguez R, Sánchez M, Ledesma A.; Lloret ,A. Experimental and numerical analysis of desiccation of a mining waste. Can Geotech J. 2007. 44, 644–658. [CrossRef]
  9. Swarbrick, G.E.; and Fell, R. Modelling desiccating behaviour of mine tailings. J. Geotech. Eng. ASCE. 1992,118, 540–557.
  10. Corwin, D.L. Evaluation of a simple lysimeter-design modification to minimize sidewall flow. J. Contam. Hydrol. 2000. 42, 35–49. [CrossRef]
  11. Garino Libardi LM, Oldecop LA, Romero Morales EE and Rodriguez-Pacheco, R.L. Tailings desiccation process studied in environmental chamber experiment. Proceedings of the Institution of Civil Engineers – Geotechnical Engineering, 2021, 1-11. [CrossRef]
  12. Lakshmikantha, M.R. Experimental and Theoretical Analysis of Cracking in Drying Soils. PhD thesis, Universitat Politècnica de Catalunya, Barcelona, Spain. 2009.
  13. Rodríguez, R., Lloret, A., Ledesma, A., and Candela, L. Characterization of Mine Tailings in the Cuban Nickel Industry,” Proc. 3rd Intern. Cong. on Environmental Geotechnics, P. S. Seco e Pinto Ed., V-1 Balkema, Rotterdam, 1998, pp. 353–358.
  14. Rodríguez Pacheco, R.L., Lloret A., Candela L. Pérez, T., Cortés, F. Dispositivo para la caracterización de medios porosos sujetos a diferentes condiciones ambientales y de contorno, 2006. Patent: 2 241 477. [CrossRef]
  15. Garino L, Rodari G and Oldecop L. Characterization of mine waste materials after 50 years of climate interaction. In PanAm Unsaturated Soils. Applications (Hoyos LR, McCartney JS, Houston SL and Likos WJ (eds)). American Society of Civil Engineers, Reston, VA, USA, GSP 302, 2017. [CrossRef]
  16. Garino Libardi L and Oldecop L. Evolución de la humedad en presas de relaves mineros ubicadas en climas áridos. Caso de estudio: mina Castaño Viejo, San Juan, República Argentina. Boletín Geológico y Minero de España, Monográfico 2021, 3(132), in press (in Spanish).
  17. Rodríguez R, Candela L, Lloret A, Apparatus for evaluation of haydomechanicalbehaviour of porous media subjected to environmental changes. Geotech Test J 2006, 29:9–20.
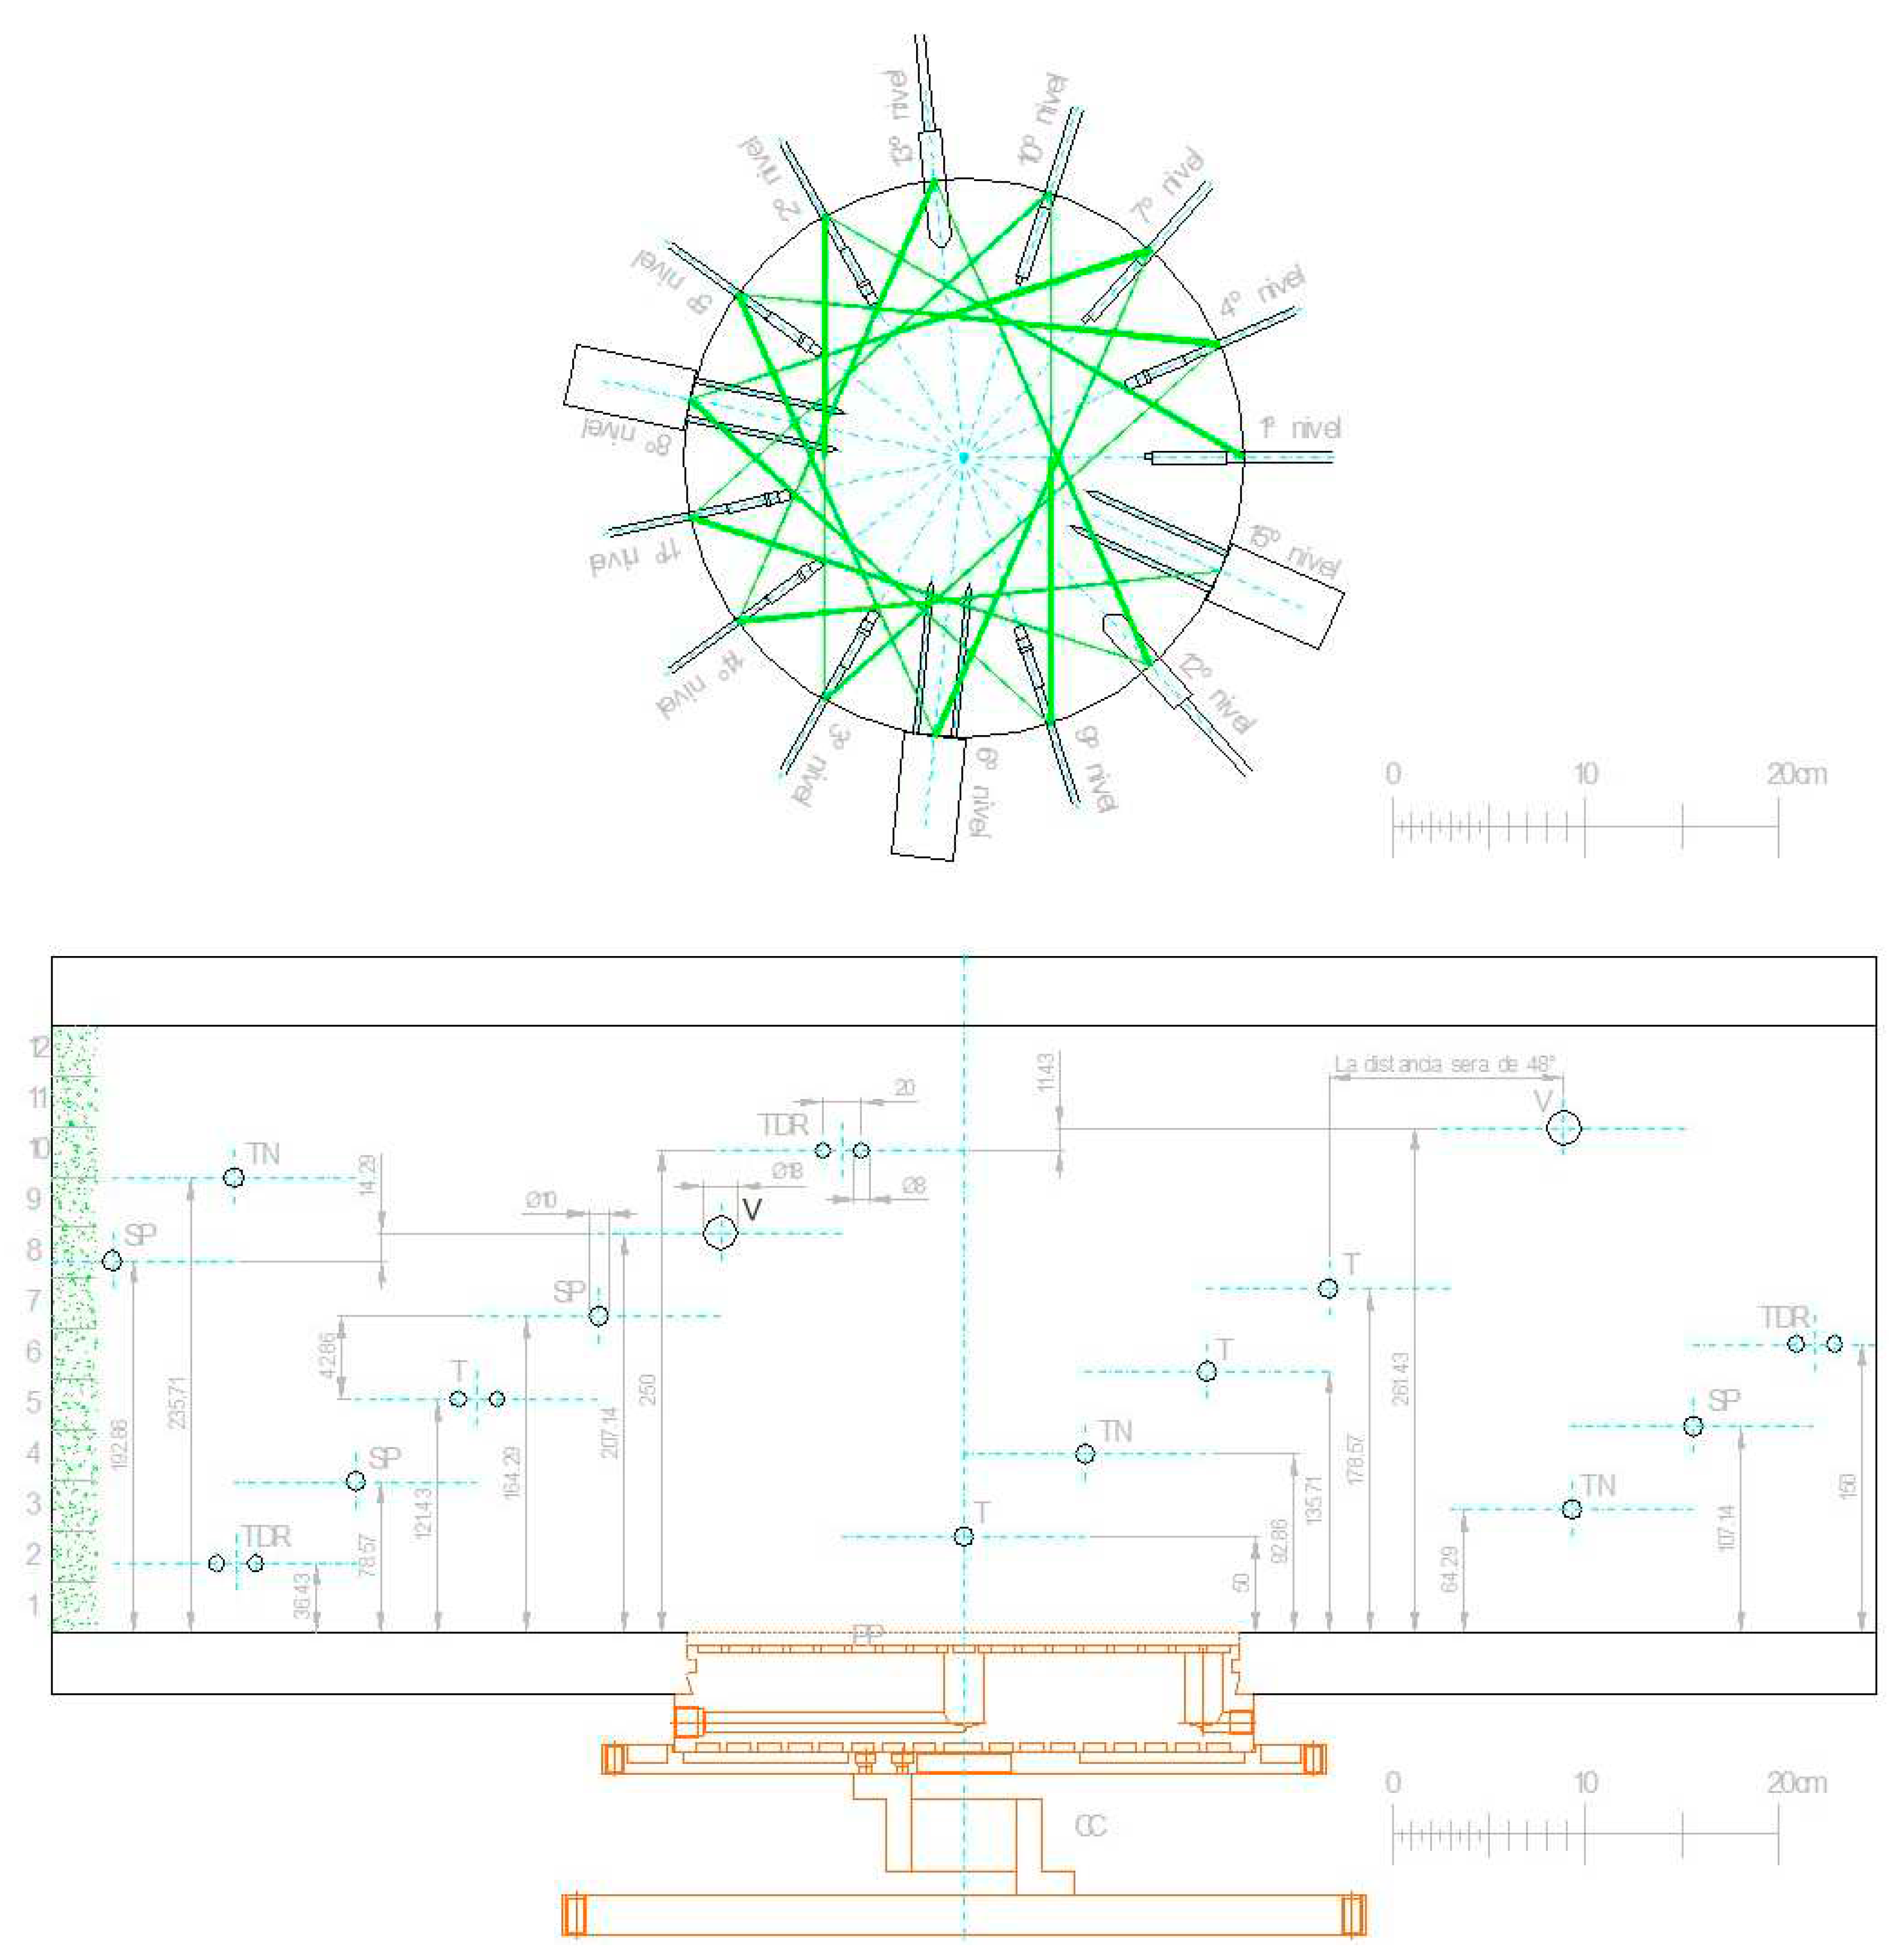
Figure 1. Schematic of the automatic system. At the top a view from above of the cylinder and the distribution of the sensors inside the sample. At the bottom, the open cylinder in the plane with the vertical position of the sensors used in this test. The sensors placed in the spiral to avoid preferential flow in the vertical profile. The numbers on the left indicate the position of the tailings layers. CC: load cell; TN: tensiometer; PP: porous plate; M: membrane; TDR: volumetric water content meter; T: thermometer; SP: psychrometer; V: hygrometer; EA: air inlet; SA: air outlet; NA: water level; F: cotton filter; VE: fan; B: infrared bulb; LVDT: displacement transducer; EV: electro valve; P: piezometer; Nivel: level. See main features and details of its functions in Table 1 and [3].
Preprints 89516 g001
Figure 2. Main components of the column for the study of the hydromechanical properties of the residue. PP: porous plate; R: device for applying the uniformly distributed water recharge; Base: support of the solid and methacrylate column wit sensors, on which the porous plate rests and allows water evacuation; M: latex membrane; CC: load cell; EV: solenoid valve. See main features and details of its functions in Table 1 and [3].
Preprints 89516 g002
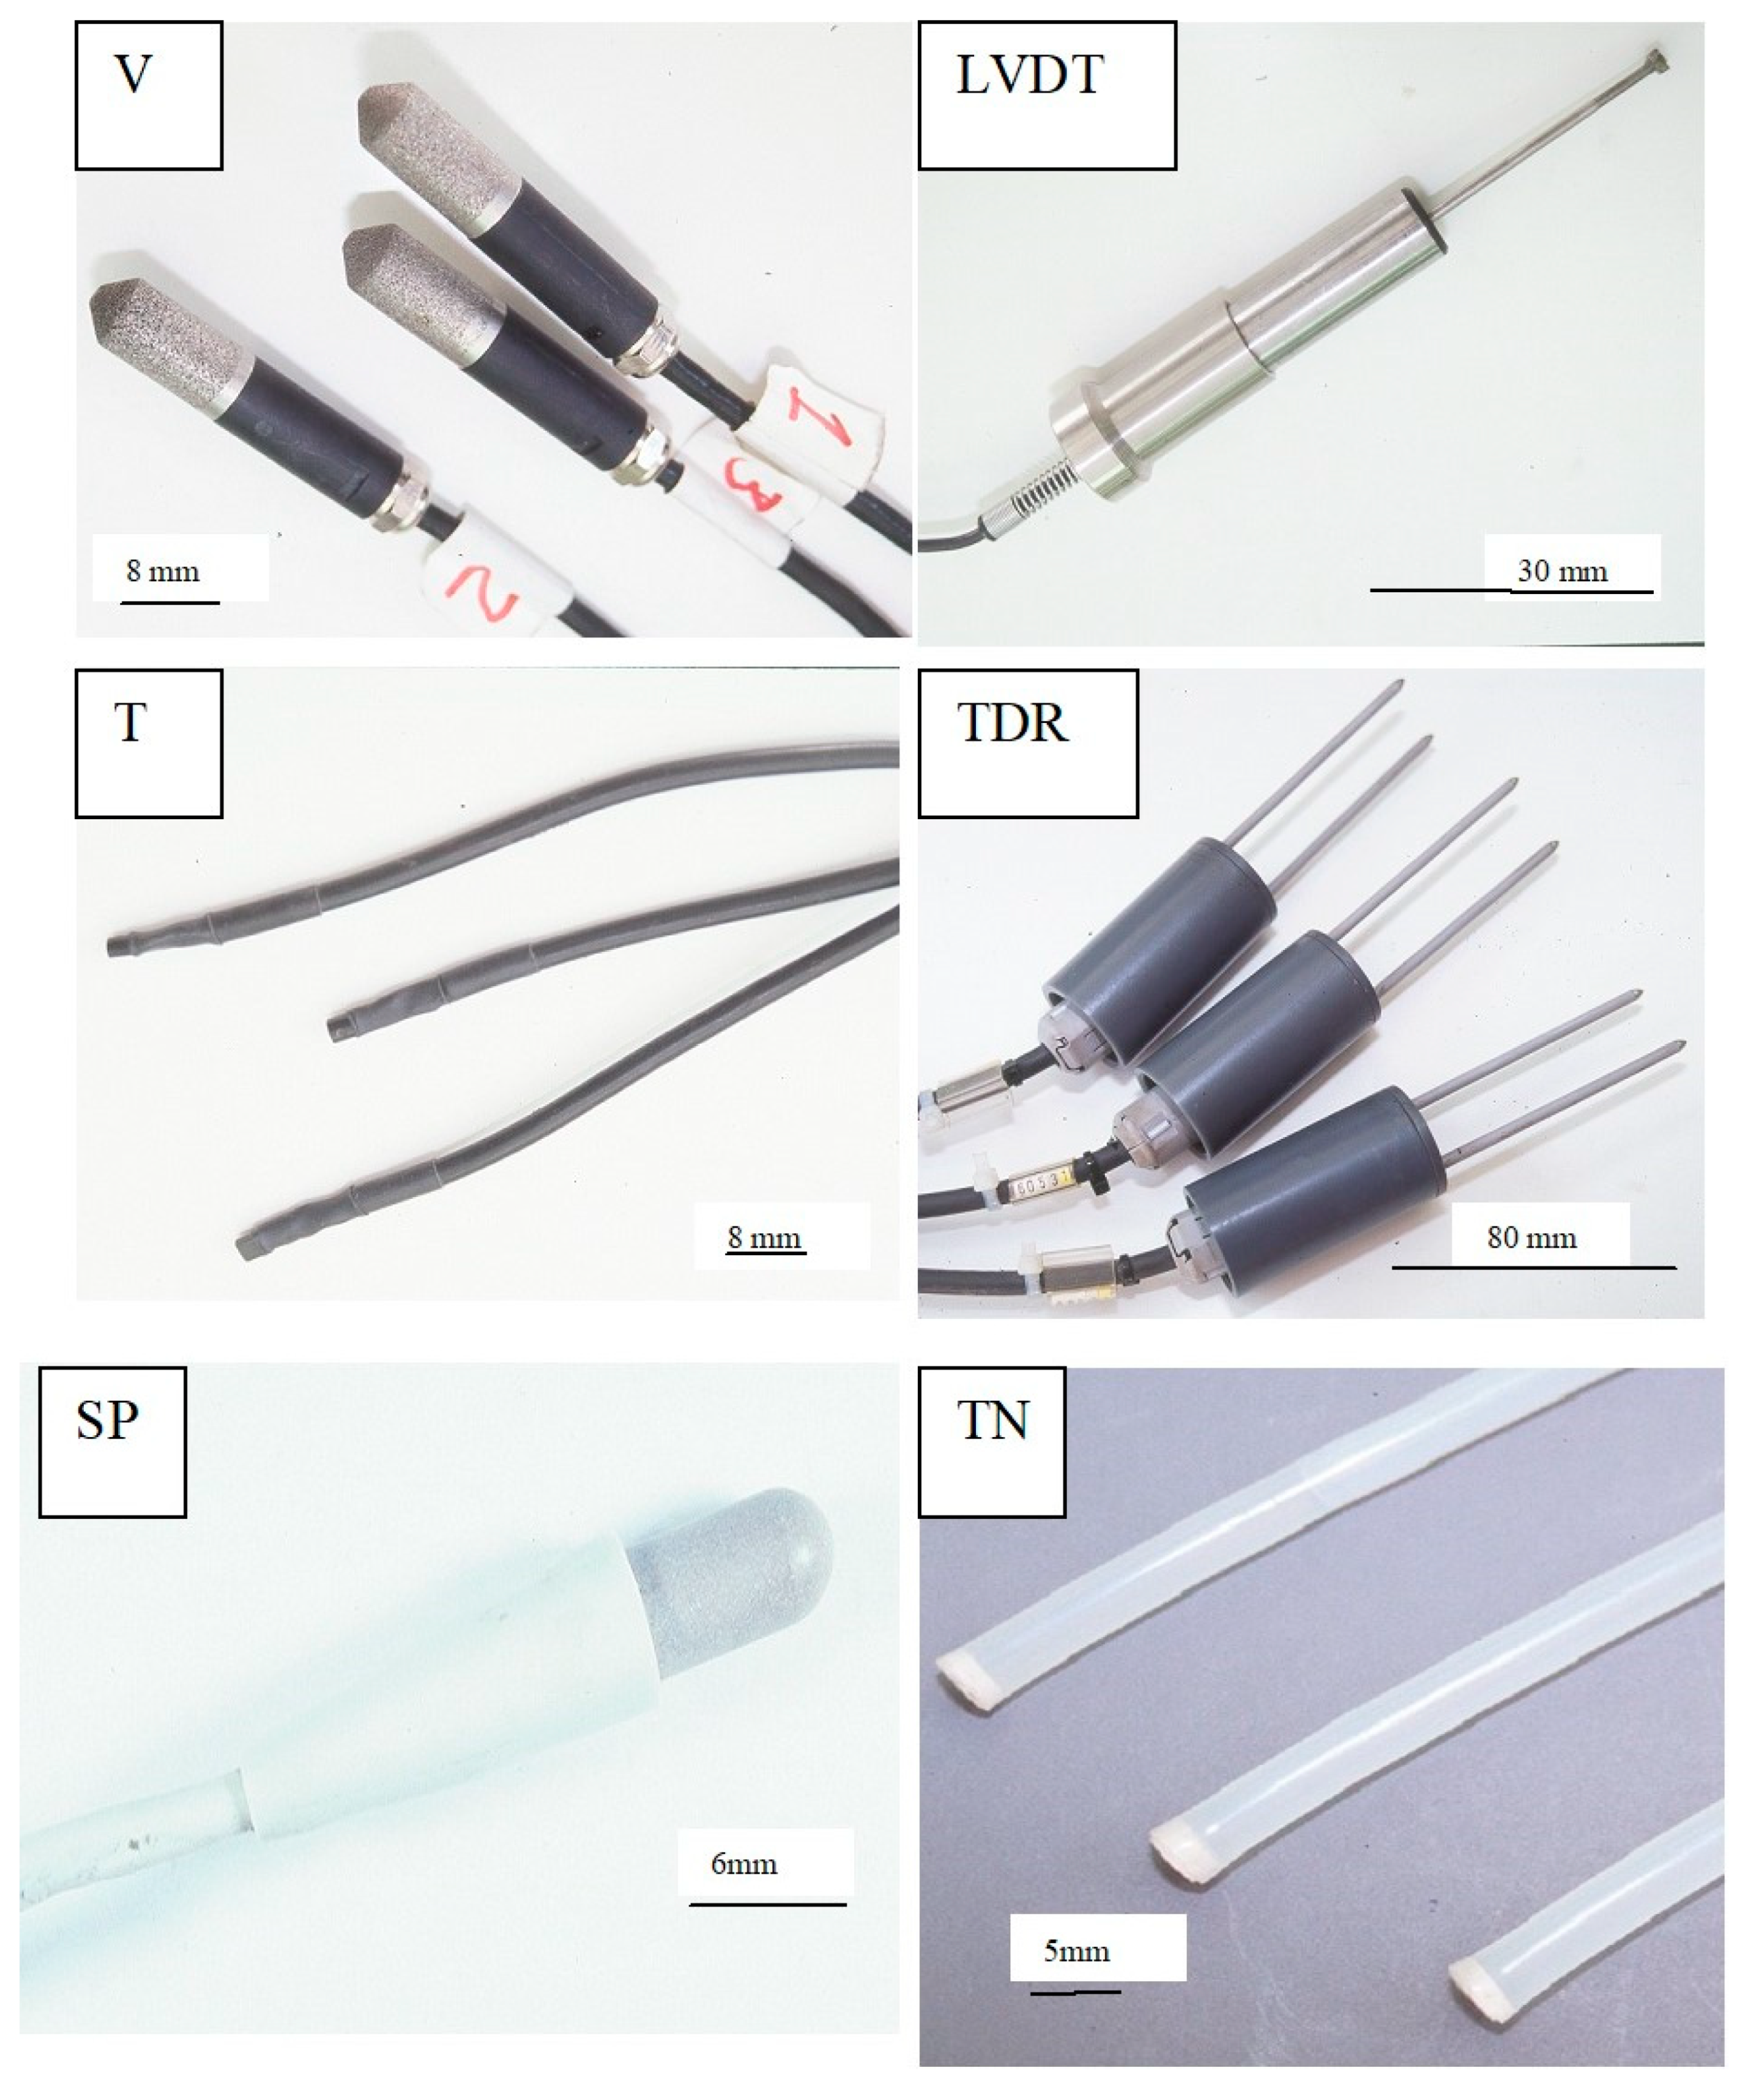
Figure 3. Main sensors. V: hygrometer; LVDT: displacement transducer; T: thermometer; TDR: time domain reflectometer; SP: psychrometer; TN: tensiometer. See main features and details of its functions in Table 1 and [3].
Preprints 89516 g003
Figure 4. Display view of the one example of graphical and digital output of the measure with different sensors. The color indicates the parameter being measured. V: hygrometer; LVDT: displacement transducer; T: thermometer; TDR: time domain reflectometer; SP: psychrometer; TN: tensiometer. See main features and details of its functions in Table 1 and [3].
Preprints 89516 g004
Figure 5. An image of the experimental set-up in the laboratory. CC: load cell; TN: tensiometer; TDR: volumetric water content; V: hygrometer; NA: water level; F: cotton filter; B: infrared bulb; P: piezometer. Detailis in Table 1 and [3,14] Appendix A.
Preprints 89516 g005
Figure 6. Schematic of the automatic system, the distribution of the sensors inside the sample, modified from [3]. At the bottom the position of the sensors in the vertical. The sensors placed in the spiral to avoid preferential flow in the vertical profile. Numbers indicate tailings layers in the vertical profile of porous media. CC: load cell; TN: tensiometer; PP: porous plate; M: membrane; TDR: volumetric water content; T: thermometer; SP: psychrometer; V: hygrometer; EA: air inlet; SA: air outlet; NA: water level; F: cotton filter; VE: fan; B: infrared bulb; LVDT: displacement transducer; EV: electro valve; P: piezometer. Detailis in Table 1 and [3,14].
Preprints 89516 g006
Figure 7. One example a results of the temperature and relative hymidity in laboratory.
Preprints 89516 g007
Figure 8. Results of the saturation and drying test, a) saturation test and evolution a degree of saturation vs time, b) drying test and evolución of degree of saturation vs time, c) consolidation during saturation test vs time and d) consolidation during drying test vs time.
Preprints 89516 g008
Table 1. Min physical components, sensors, parameter and range og mesure with accuracy.
Physical components Diameter and height (m) Function, parameters and range of measure Accuracy
Outside Inside Height
Outer column 0.30 0.29 0.50 Avoid deformation of the sample and the shape of the porous medium and the position of the sensors
Latex membrane 0.29 0.285 0.50 Avoid preferential flow through the walls due to separation of the porous medium from the walls
Porous plate 0.29 - 0.05 Avoid percolation solid particles
Base a porous media 0.29 - 0.10 Sample and sensor support. It facilitates the entry and exit of water through three different points. Allows the piezometric control in the sample.
Automatic system base 0.80 - 0.10 Weight of sample, physical component and sensor support
Fan generating air at 2 m/s speed - - 0.10 Maintain air inlet and outlet at a constant velocity
Wet cotton filter Humidify inlet air to maintain constant relative humidity
Water deposit for cotton filter Maintain cotton filters to ensure constant relative humidity of incoming air
Infrared bulb to impose the temperature in degrees centigrade (oC) Maintain constant surface temperature of the porous medium 0-100
Solenoid valve Water flow that maintains the level inside the column and the reservoir where the filters that humidify the inlet air are placed
Piezometer 0.005 0.003 0.65 Measuring the water table in the porous medium
Glass Diffuse light to avoid shadow effect
Device for the application of a recharge or irrigation 0.28 - 0.05 Apply a rainfall of a determined duration and intensity
Sensors, their characteristics and measurement parameters
Hygrometers (Vaisala) 0.012 0.50 Relative humidity 0-99%
Temperature 0-100 oC
1.0
0.05
Psychrometers (Wescor) 0.06 0.50 Suction 0-10 MPa%
Temperature 0-100 oC
0.001
0.2
TDR - Time Domain Reflectometry (IMKO) 0.025 - 0.08
Thermometer (self-made) 0.005 0.005 Measurement of temperature at the surface and inside the vertical profile (0-100 oC) 0.02
LVDT (Displacement Transducer) 0.0025 0.066 Measurement of height variation in the sample 0.02
Load cell Measurement of weight change in kilograms (0-100 kg)
Tensiometer 0.005 Measuring suction in meter of water column (m.w.c.a.) 0.01-1.2 0.02
Disclaimer/Publisher’s Note: The statements, opinions and data contained in all publications are solely those of the individual author(s) and contributor(s) and not of MDPI and/or the editor(s). MDPI and/or the editor(s) disclaim responsibility for any injury to people or property resulting from any ideas, methods, instructions or products referred to in the content.
Copyright: This open access article is published under a Creative Commons CC BY 4.0 license, which permit the free download, distribution, and reuse, provided that the author and preprint are cited in any reuse.
Prerpints.org logo

Preprints.org is a free preprint server supported by MDPI in Basel, Switzerland.

Subscribe

© 2024 MDPI (Basel, Switzerland) unless otherwise stated