Preprint
Review

Nanocarbon: Structures, Properties, Applications

Altmetrics

Downloads

131

Views

64

Comments

0

This version is not peer-reviewed

Submitted:

02 November 2023

Posted:

03 November 2023

You are already at the latest version

Alerts
Abstract
This review contains a popular presentation of the history of carbon nanostructure discovery, a short description of the main approaches to production and investigation of such objects and consideration of the most perspective ways of their applied usage.
Keywords: 
Subject: Chemistry and Materials Science  -   Materials Science and Technology
Content
  • Preface
  • The history of discovery of carbon nanosrtructures
    2.1.
    Fullerenes
    2.2.
    Carbon nanotubes
    2.3.
    Graphene
  • The structure of nanocarbon particles.
    3.1.
    Fullerenes
    • Higher fullerenes
    • Endohedral fullerenes
    3.2.
    Carbon nanotubes
    • Chirality
    • Structural defects
    • Multi-walled carbon nanotubes
    3.3.
    Graphene
    • Defects and boundary
    • Wave-like structure of grahene
    • 1D carbon chains
  • Methods of nanocarbon production.
    4.1.
    Fullerenes
    • Electrical arc synthesis of fullerenes.
    • The mechanism of fullerene formation.
    • Extraction and separation of fullerenes. SOXLET.
    • Synthesis of endohedral fullerenes.
    • Threemetasphere
    • Synthesis of fullerenes in a plasmatron from dispersed amorphous carbon
    4.2.
    Углерoдные нанoтрубки
    • Electric arc synthesis.
    • Chemical vapor deposition (CVD).
    4.3.
    Graphene.
    • Micromechanical graphite exfoliation.
    • Chemical vapor deposition (CVD).
    • Reduction of grapheme oxide.
  • Physical and chemical properties of carbon nanostructures.
    5.1.
    Fullerenes
    • Molecular properties and chemistry of fullerenes.
    • Fullerite.
    • Superconductive fullerites.
    • Fullerenes in solutions.
    5.2.
    Carbon nanotubes.
    • Mechanical properties.
    • Electrical properties
    • Thermal conduction of CNTs
    • Emission properties
    • Sorption properties
    5.3.
    Graphene
    • Phonons
    • Electrical properties
    • Optical properties
  • Applications of nanocarbon
    6.1.
    Fullerenes
    • Surface reinforcement of metals
    • Solar cells
    6.2.
    Carbon nanotubes
    • Electron field emitters
    • CNT-based lighting lamps
    • X-ray sources
    • Travelling wave lamps and MW radiation amplifiers
    • Polymer-based composites doped with CNTs.
    • Phase change materials doped with CNTs
    • Raman scattering signal amplification by means of CNTs.
    6.3.
    Graphene
    • Chemical sensors.
    • Pressure sensor.
    • Electron field emitter.
    • Nonlinear optical absorbers.
    • Polymer-based composites doped with grapheme.
  • Conclusions

1. Preface

The time period between the end of ХХ century and beginning of ХXI century was marked by the discovery of new carbon modifications which attracted an interest of physicists, chemists and material researchers in many countries. The case in point are carbon nanostructures of a nanometer in size joint by the common term “nanocarbon”. The set of these structures includes such objects as fullerenes, carbon nanotubes, grapheme and some related forms. In the present time it is hard to find a journal specialized in the natural science fields not containing articles on methods of production of such objects, their physical and chemical characteristics and the way of their applied usage. The total number of such publications has reached a million and increases steadily with an enhancing rate.
Figure 1 presents the structure of main allotrope carbon modifications. There are recently discovered modifications such as fullerenes, carbon nanotubes and grapheme presented along with long known forms (graphite and diamond). Besides of that, one should note less spread but also of interest nanohorns (elongated objects with a conical structure) and nano-onions (multi-layer spheroidal formations, presenting fullerene molecules inserted into each other). The class of objects joint by the term “nanocarbon” includes also a multiplicity of chemical derivatives of the above-listed structures. Instant enhancement of the number of such derivatives is accompanied with an increase of the amount of information on properties of nanocarbon and possibilities of its practical usage.
Carbon nanostructures joint by the term “nanocarbon” present metastable formations whose inner energy exceeds that for graphite, which is the ground state of carbon at normal conditions. This indicates that carbon nanostructures take form in non-equilibrium conditions favorable for the self-organization of carbon atoms. One of the examples of such non-equilibrium systems is the electric arc with graphite electrodes [1,2]. Carbon entering into the anode composition evaporates. Than carbon atoms condense in a region with lower temperature which results in formation of fullerene molecules or carbon nanotubes (at the presence of metal catalyst particles). Another example of non-equilibrium conditions promoting the formation of metastable carbon structures is the chemical vapor deposition process (CVD). In this case the self-organization of carbon atoms resulting in formation of such structures proceeds at the decomposition of carbon containing molecules on metal catalyst particles [3,4]. Such an approach is utilized for large scale production of carbon nanotubes, so that the parameters of nanotubes formed are determined by the sort and size of catalyst particles as well as regime of the synthesis procedure.
The discovery of carbon nanostructures has a profound impact on the development of approache to both large scale production of nanosize objects and investigation of their physical and chemical characteristics. Thus improvement of the CVD method has resulted in development of the configuration in which some substance (for example, ferrocene) is used both as a source of carbon and as a basis for formation of metal catalyst particles. Such an approach has been utilized for large scale production of single walled nanotubes, however it is also used successfully for the synthesis of other nanostructures. A large body of research addressed to the investigation of the structure and physical and chemical characteristics of carbon nanostructures required for the development of the relevant experimental equipment. Thus, the usage of Raman spectroscopy for the analysis of structural features of nanocarbon has resulted in radical changes in this effective diagnostic technique [5]. A notable progress is exhibited in such approaches to the study of structural features of nanoparticles as the transmission electron microscopy and X-ray photoelectron spectroscopy which is also determined appreciable by the development of works in the field of nanocarbon.
This book contains a popular presentation of the history of carbon nanostructure discovery, a short description of the main approaches to production and investigation of such objects and consideration of the most perspective ways of their applied usage.

2. A history of Carbon Nanostructures Discovery

2.1. Fullerenes

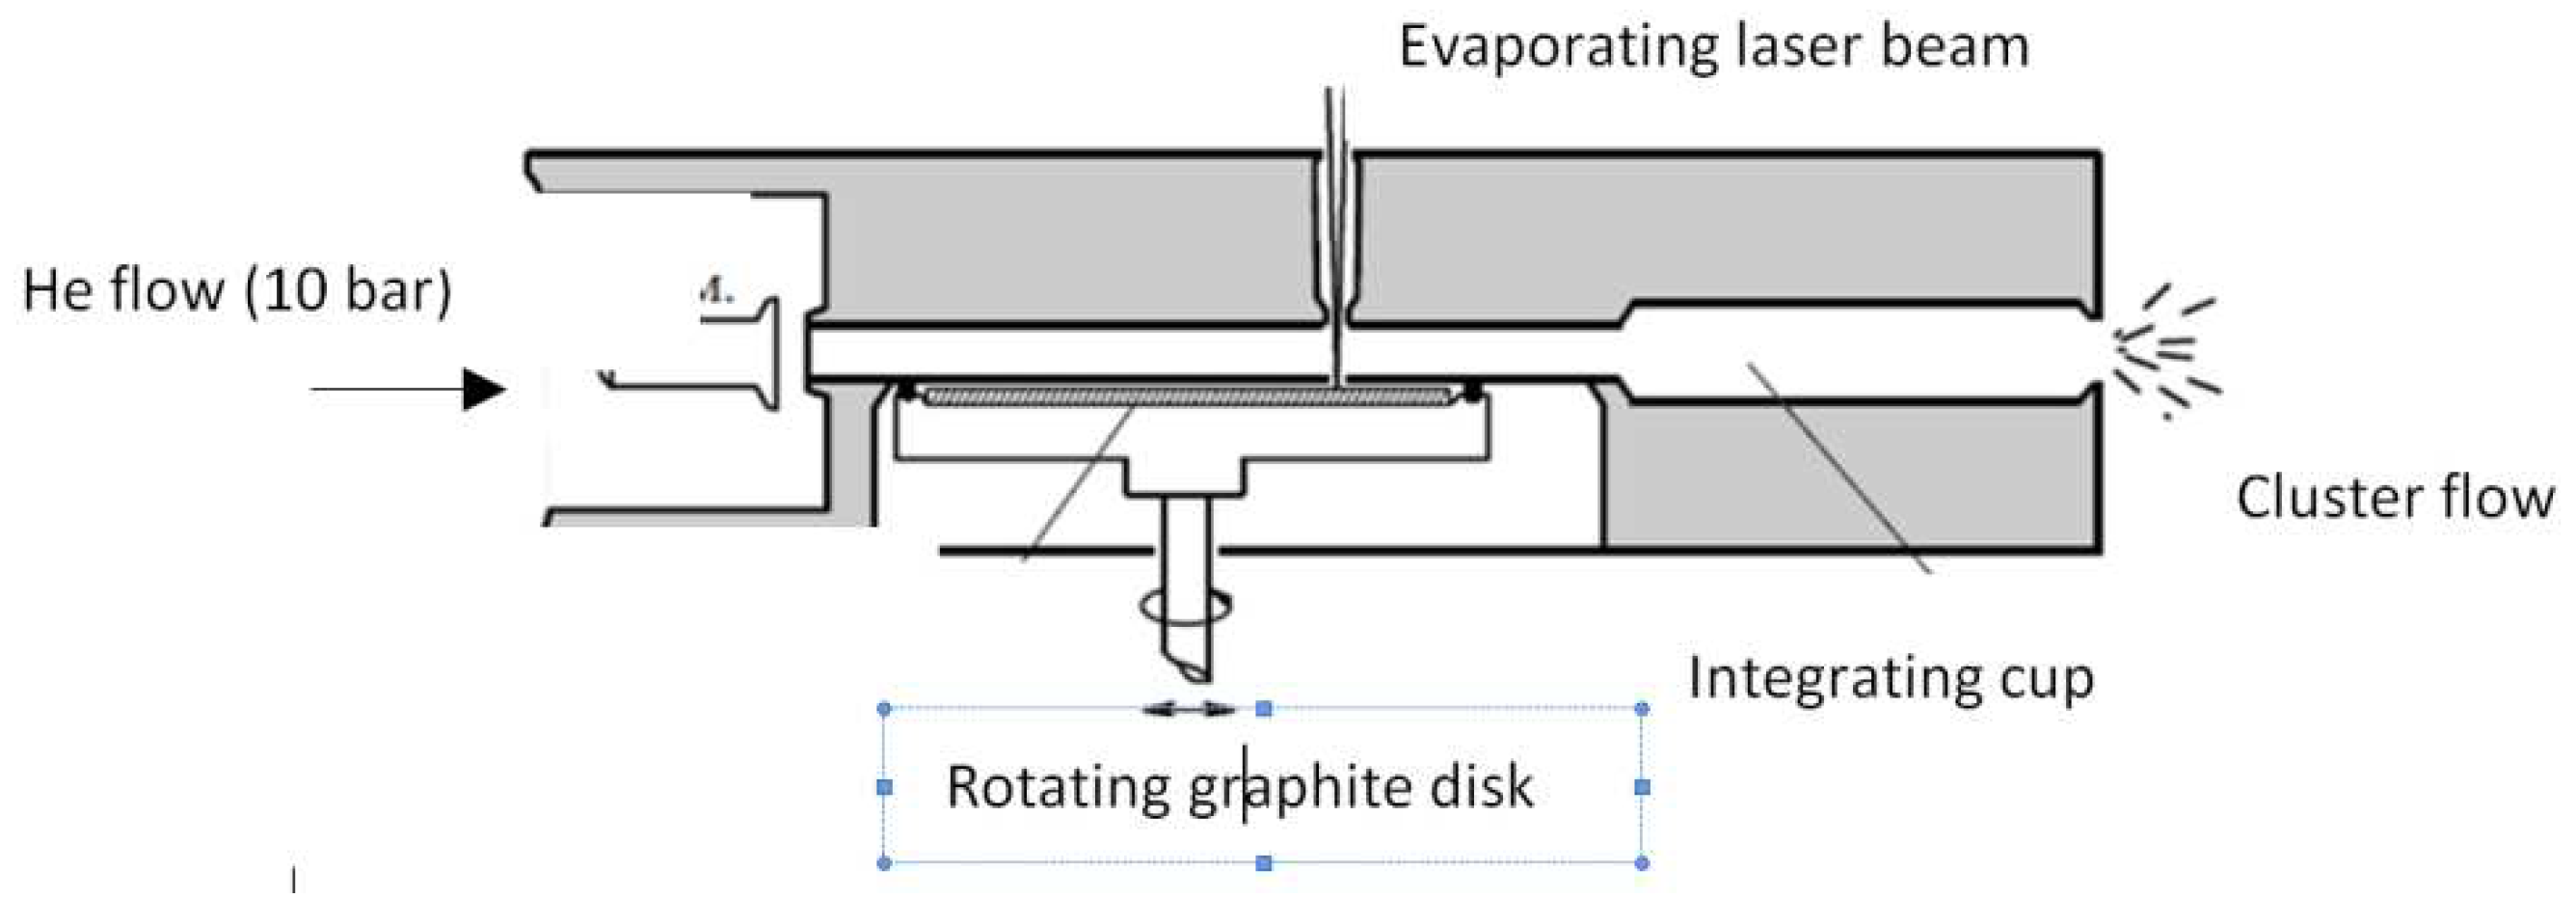
The works addressed to study of carbon materials on a nanometer scale were published even in the first half of XX century. However the boom of such investigations is believed usually to start at 1985 when the research astrophysical team headed by Prof. H.Kroto from the Sussex University (UK) decided to establish the origin and the structure of carbon particles filling interstellar nebulas and responsible for abnormal absorption of radiation on the wavelength 220 nm. For the purpose of experimental laboratory modeling of such structures the team was coupled with the group of R. Smalley from the Rice University in Houston, USA, that specialized in the field of production and investigation of high-melting metal clusters. The joint group used a setup, where a solid surface was irradiated by an intense laser emission. This setup is shown schematically on Figure 2. The cluster flow formed in result of the laser irradiation is leaded away by the buffer gas (He) and studied by means of a mass-spectrometer providing the mass distribution of clusters.
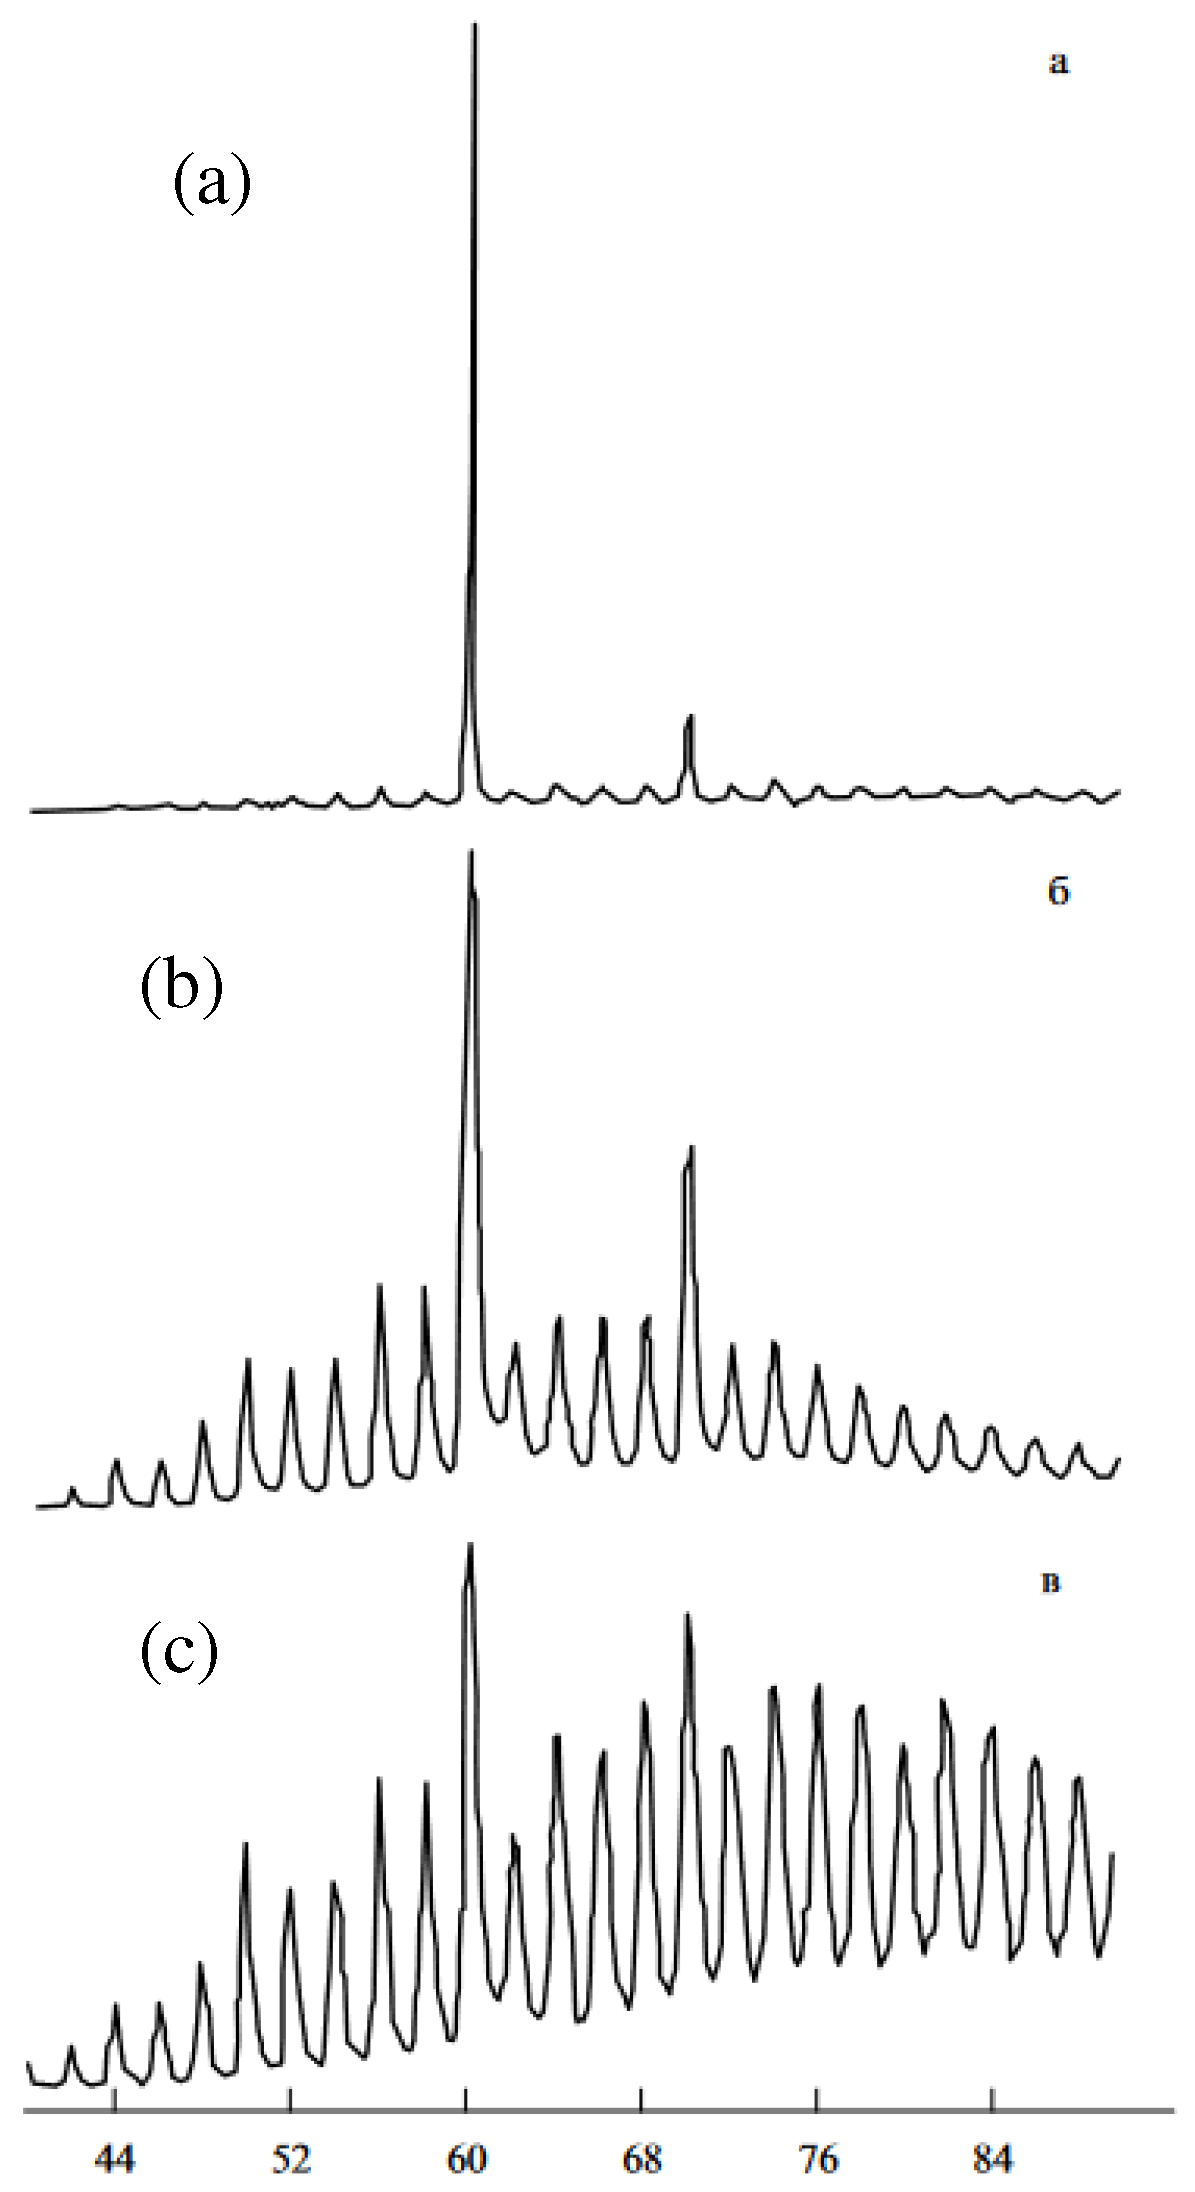
Figure 3 presents typical mass-spectra of carbon clusters formed in result of laser irradiation of graphite surface in He atmosphere. Surprising feature of this spectrum is in the presence of distinctive peaks corresponding to clusters with the number of carbon atoms 60 and 70. There was stated before the researchers the problem of establishing the origin of these peaks that is determining the structure of clusters С60 and С70. An intense brainstorming has shown that these clusters present spherical or spheroid structures consisted of hexagons and pentagons which contain carbon atoms in their vertices. The structure of such clusters is presented on Figure 4.
The most intense peak in the mass-spectrum of carbon clusters forming at laser sputtering of graphite in He atmosphere corresponds to cluster С60. In this cluster carbon atoms are found in vertices of 20 hexagons and 12 pentagons so that each hexagon borders 3 hexagons and 3 pentagons while each pentagon borders 5 hexagons. Such a structure is named as “truncated icosahedron”. Spheroidal carbon structures some of which are presented on Figure 4, derived their name “fullerenes” by the name of American architect and philosopher Buckminster Fuller who used such structures for designing the dome of USA pavilion for the World Exhibition EXPO-67 (Montreal). The authors of discovery of fullerenes were awarded the Nobel Prize in chemistry of 1996.
The discovery of fullerenes has stimulated the research addressed to the study of physical and chemical characteristics of this remarkable object and establishing ways of its practical usage. However the laser irradiation of graphite utilized in the first experiments provides rather low quantity of the material for the development of such investigations. The situation has changed sharply in 1990 when the group of W. Krätchmer in the Max Plank Nuclear Physics Institute (Heidelberg, Germany) discovered the method of large scale production of fullerenes [1,2]. There has beenfound that fullerenes form in the arc discharge with graphite electrodes in He atmosphere. Thermal sputtering of graphite anode results in formation of the soot containing several percent of fullerenes. Since fullerenes is the only soluble carbon modification, one can extract them from the soot using such solvents as benzene, toluene, xylene etc. The subsequent vaporization of the solvent results in obtaining crystals made up from fullerene molecules of different sort.
Separation of fullerenes of various sort is performed through the liquid chromatography method which is based on differences in the sorption ability of some sorbent relating to fullerene molecules of different size [9]. The simplest sorbent promoting the effective separation of fullerenes is activated charcoal. A solution containing fullerene molecules of various sort is passed through the sorbent, which results in the sorption of fullerenes in the porous sorbent structure. Thereafter the sorbent filled with fullerene molecules of different sort is washed out by a clean solvent. Due to differences in the sorption ability of the sorbent relating to fullerene molecules of different sort the extraction of fullerene molecules of different sort takes different time so that firstly fullerene С60 is extracted predominantly, then С70, thereafter more large fullerene molecules are extracted. This procedure can be repeated many times for obtaining fullerene samples of enhanced degree of purity.

2.2. Carbon Nanotubes

The publications of W. Krätchmer et al. [1,2] have offered a possibility of synthesis and investigation of fullerenes for numerous research groups. Gas discharge facilities with graphite electrodes have evolved in many laboratories of the world, and the soot produced on these facilities attracted a close attention of researchers. The analysis has shown that such a soot contains along with fullerenes and amorphous carbon particles also elongated objects of cylindrical structure [10]. These objects named as “carbon nanotubes” (CNTs) can be considered as a result of rolling up a hexagonal plane into a cylinder. In the first observations were found multi-layer nanotubes which can be treated as a set of concentric cylinders inserted into each other. Further there was shown that in the arc discharge with graphite electrodes in the presence of metal nanoparticles playing the role of catalyst can form also single layer nanotubes [11]. To be fair one should note that in a huge flow of citations the honor of discovery of carbon nanotubes is attribute to Iijima [10,11], it is known a quite large set of previous publications [12,13,14,15,16], reporting on preparation and observation of elongated carbon structures.
The electrical arc method of production of carbon nanotubes permits the large scale fabrication of this material. However in this case the nanotubes are found in a carbon soot, and extraction of a pure product from it presents rather complicated technological problem. The method of production of pure nanotubes is based on the procedure “chemical vapor deposition” (CVD) (CVD) [17]. In this case nanotubes are grown on a substrate, which surface is covered with metal catalyst nanoparticles (Fe, Ni, Co etc.). Carbon containing gas (for example СН4, С2Н 6 etc.) flows about such a substrate at an elevated temperature (700 – 1000 oС), which results in decomposition of carbon containing molecules on catalyst particles. Therewith carbon atoms are self-organized with formation of multi- or single-walled nanotubes the diameter of which corresponds to the size of the metal particle. The catalytic transformation of a gaseous carbon containing substance into an ordered carbon structure which is a nanotube can be likened to the photosynthesis proceeding in the nature, where the decomposition carbon dioxide molecules in the presence of the solar radiation results in building the alive plant substance. At the present time the CVD method of CNT synthesis presents the main approach used for large scale producing this material.

2.3. Graphene

It is known for a long time that crystalline graphite presents a set of parallel hexagonal planes consisted of carbon atoms and separated by 0.34 nm from each other (see Figure 1). The atoms of hexagonal lattice are situated on the vertices of hexagon with the site of 0.142 nm and interact with each other through the chemical sp2 bond, while the interaction between neighboring planes is caused by much more weak van der Waals forces. For this reason hexagonal layers comprising the graphite structure are separated easily from each other which is visible clearly at the usage of graphite pencils. However in this case several bit not one layer are separated from the crystal, otherwise the text written by the pencil would be not visible. In is natural for researchers the wishing separation of a single hexagonal layer from graphite crystal. Such a layer is called as “graphene”, and the problem of its separation in a pure form and investigation of their physical and chemical characteristics presented for a long time one of the boldest challenges stated before the research community.
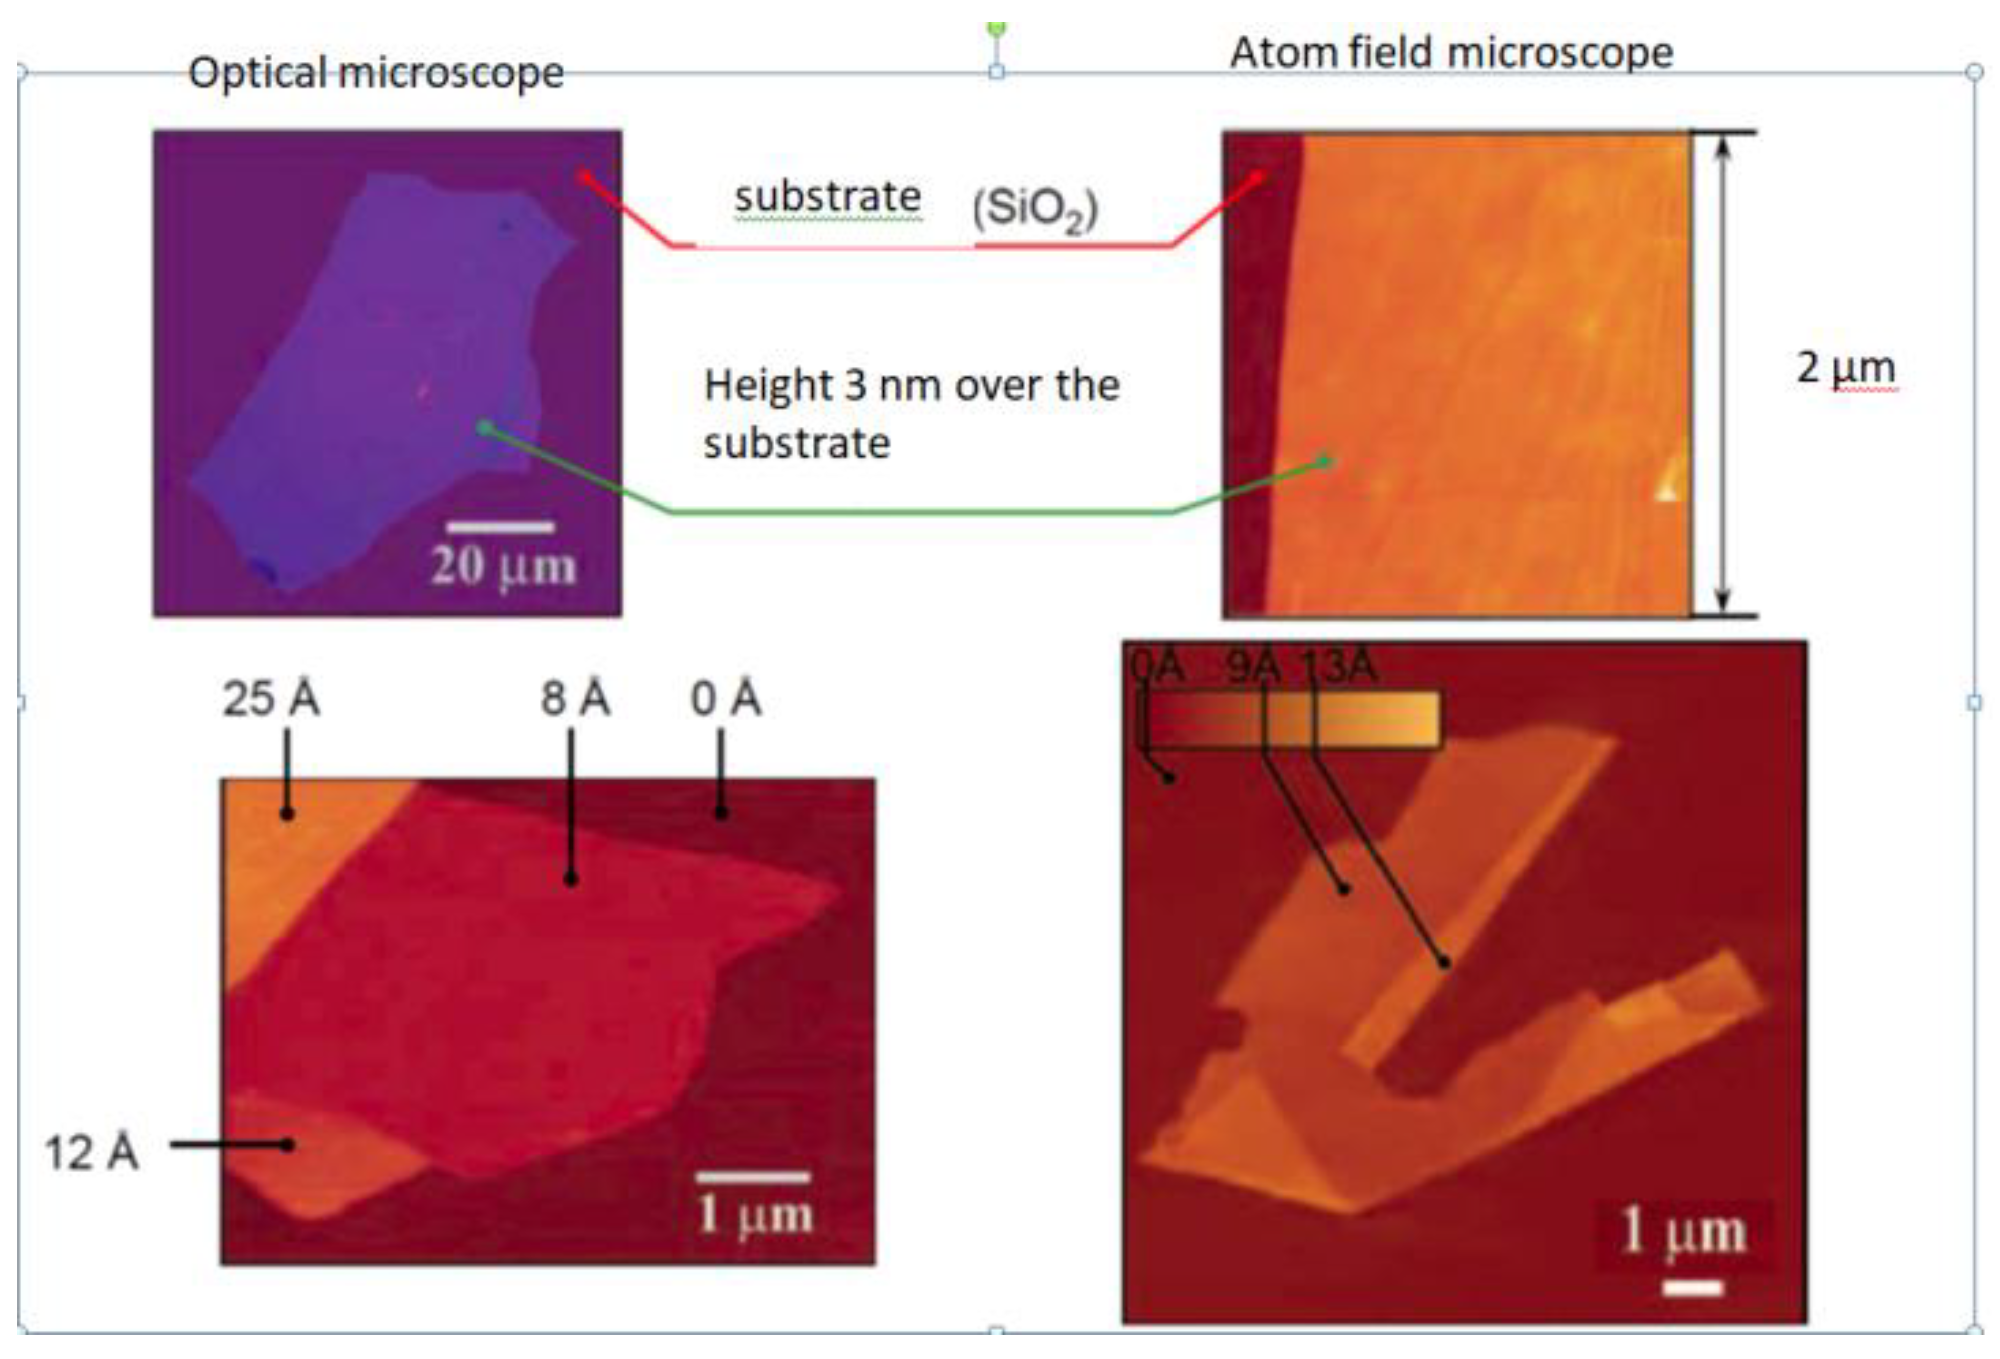
However, the enthusiasm of researchers was hindered after the publications of Landau and Peierls [18,19], where the impossibility of existence of 2D crystals was proven. The authority of the authors and the rigor of proof for a long time turned away researchers from the problem of graphene preparation. That is why a simple experiment on separation of an individual graphene layer fro crystalline graphite was performed by K. Novoselov and A. Geim from the Manchester University, England only in 2003 [20]. For this aim a sticky tape (scotch) was applied onto a well purified surface of highly ordered graphite (Figure 5), which resulted in sticking the upper layer of graphite. Then the scotch separated and dissolved in an acid. In result of this pprocedure a fragment of single layer graphene was obtained which was deposited onto Si/SiO2 substrate. The image of the graphene flake applied onto Si/SiO2 substrate of 300 nm thick obtained in an optical microscope is presented on Figure 6 [20]. This is possible due to an interference effect. As is seen, the existence of graphene topples the theorem prove by Landau and Peierls [18,19] on impossibility of stable occurrence of 2D crystalline structures. One can show two reasons of such a contradiction. Firstly, the above-mentioned theorem relates to structures of infinite size, while real graphene samples have always a limited size. Secondly the theorem considers a plane structure while the graphene surface is characterized by a wave structure.

3. The structure of Nanocarbon Particles

3.1. Fullerenes
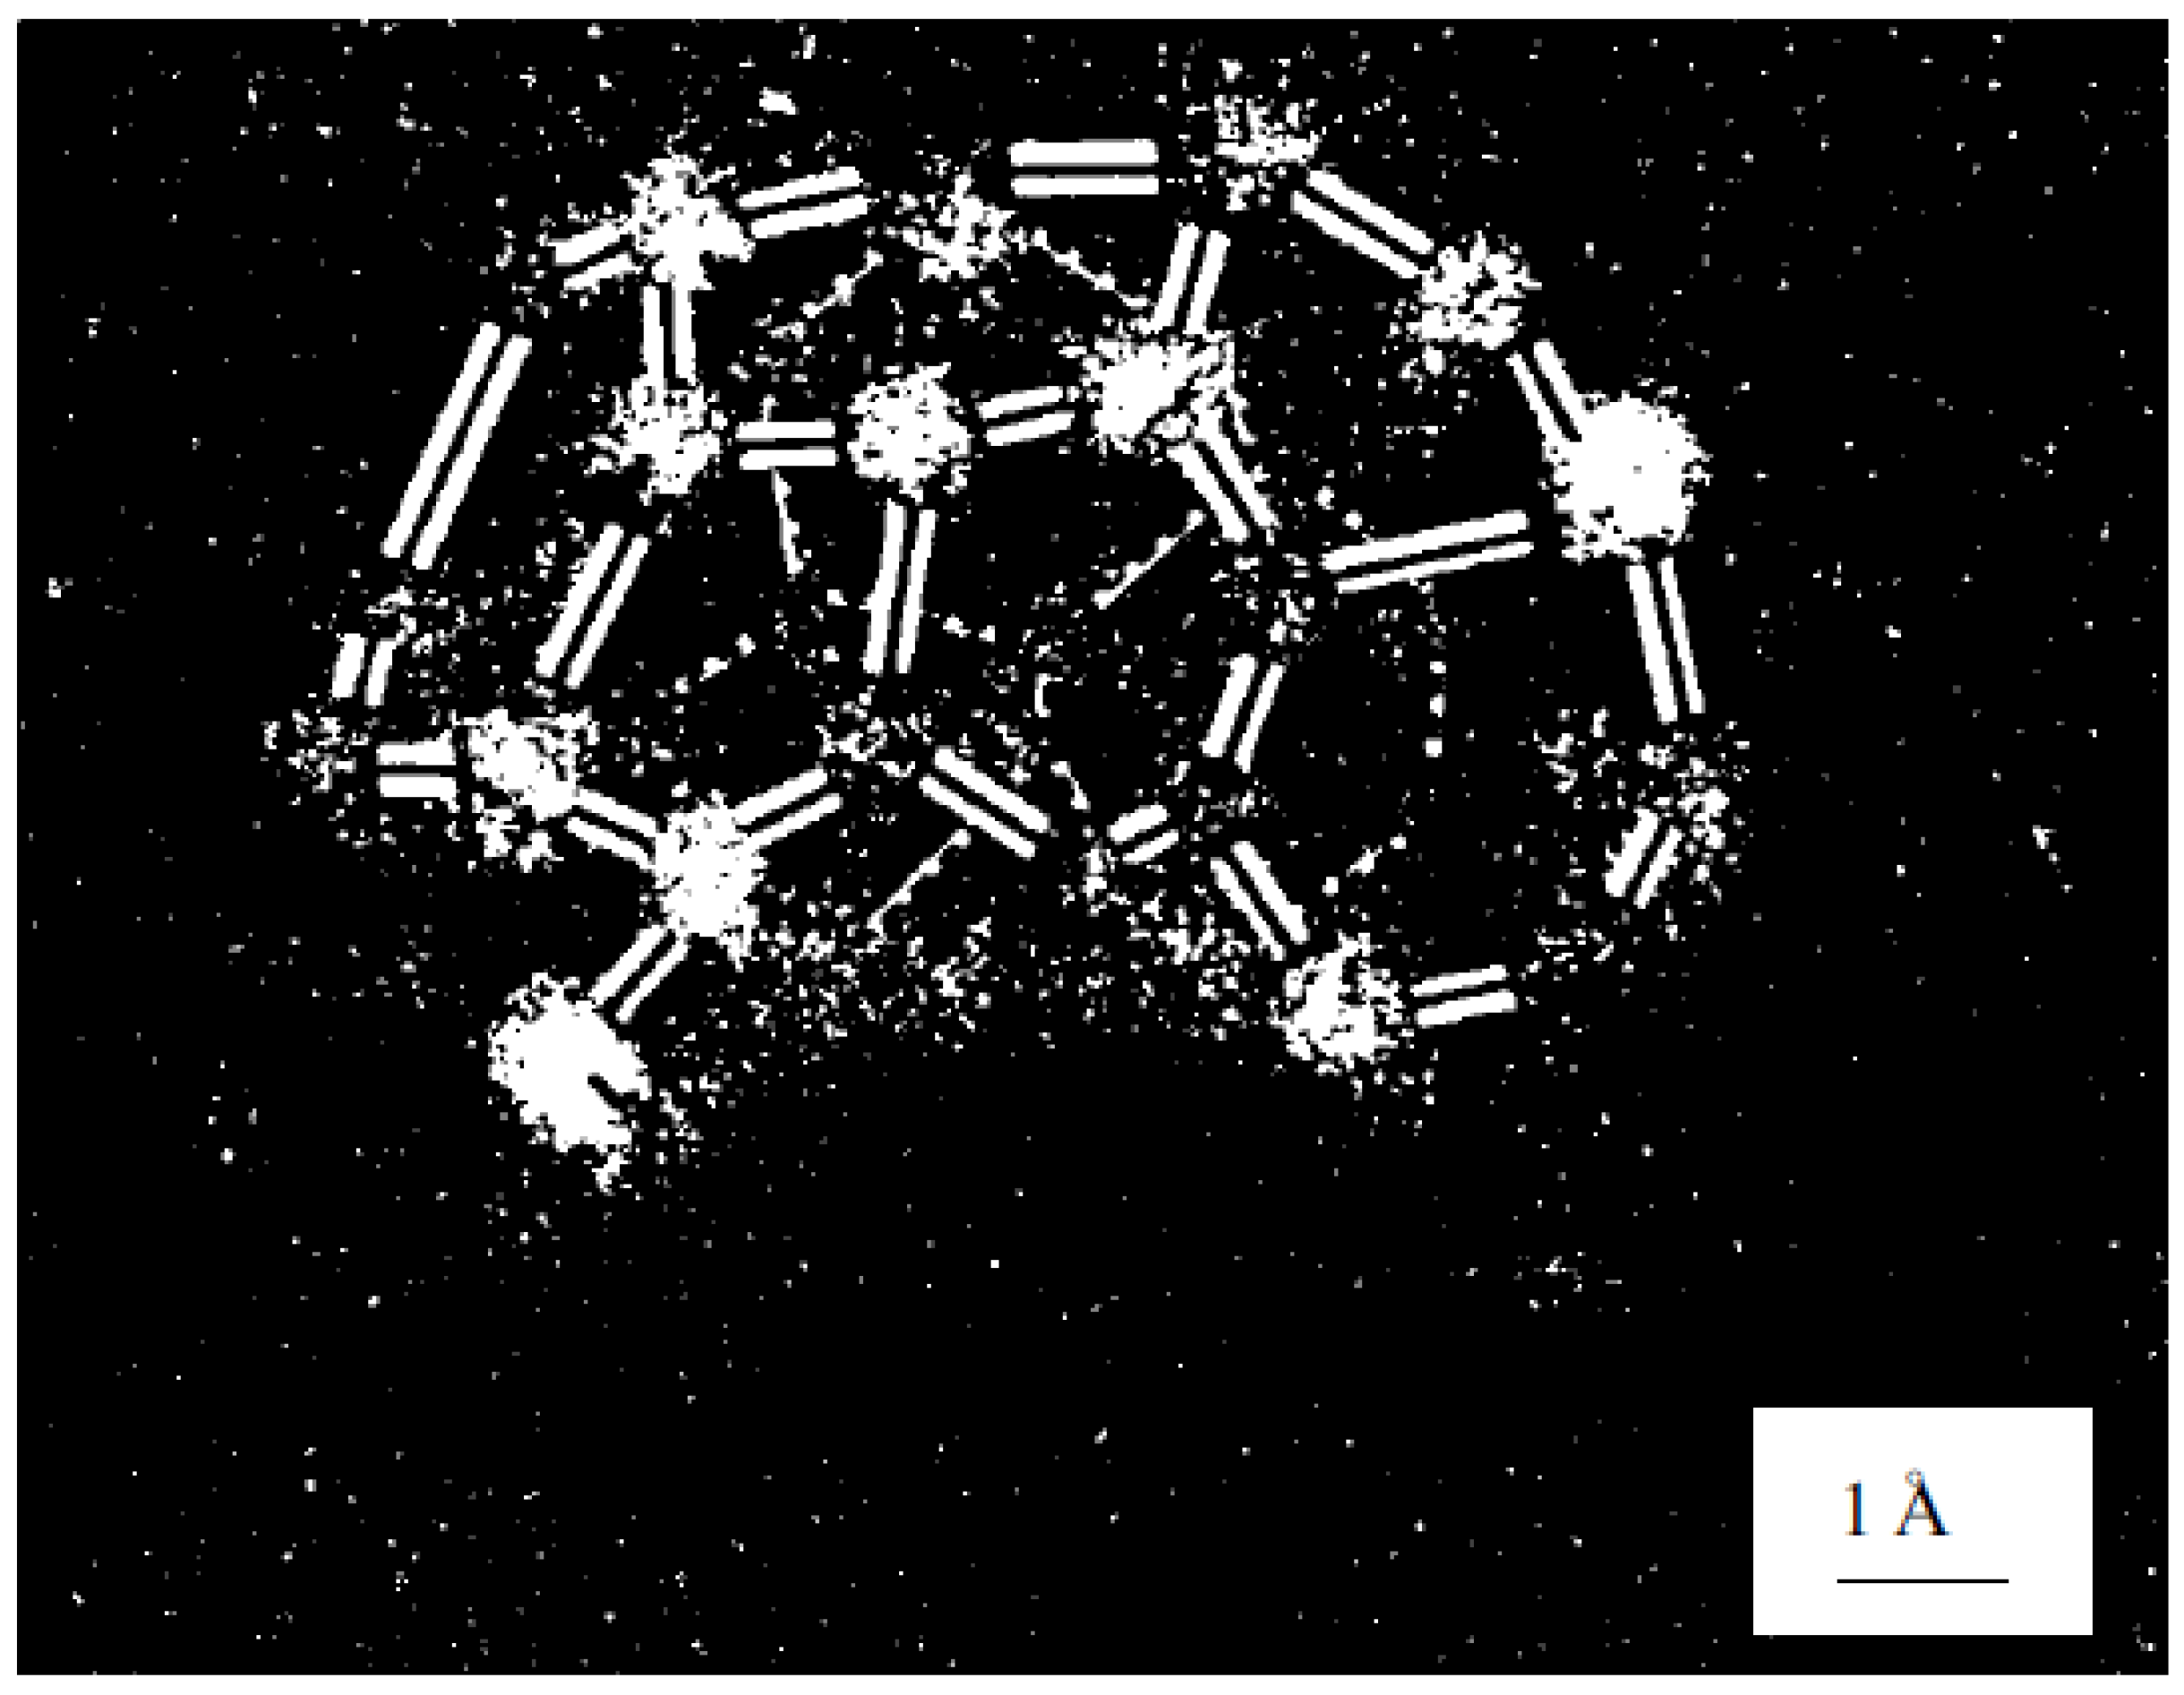
On an initial stage of the fullerene research the object were assigned to the class of clusters, while at a later time they became to consider as macromolecules, because as distinct of clusters the posses a strictly definite structure. The most stable and thus the most spread fullerene molecule is С60. The structure of this molecule (see Figure 1) presents the truncated icosahedron consisted of 20 hexagons and 12 pentagons in which vertices carbon atoms are situated. The distance between neighboring carbon atoms accounts 0.142 нм. Therewith each carbon atom belongs to two hexagons and one pentagon so that all the carbon atoms so that the chemical state of all of them is similar. The direct confirmation of such a structure can be seen from Figure 7 presenting the image of С60, obtained by means of a field ion microscope [22].
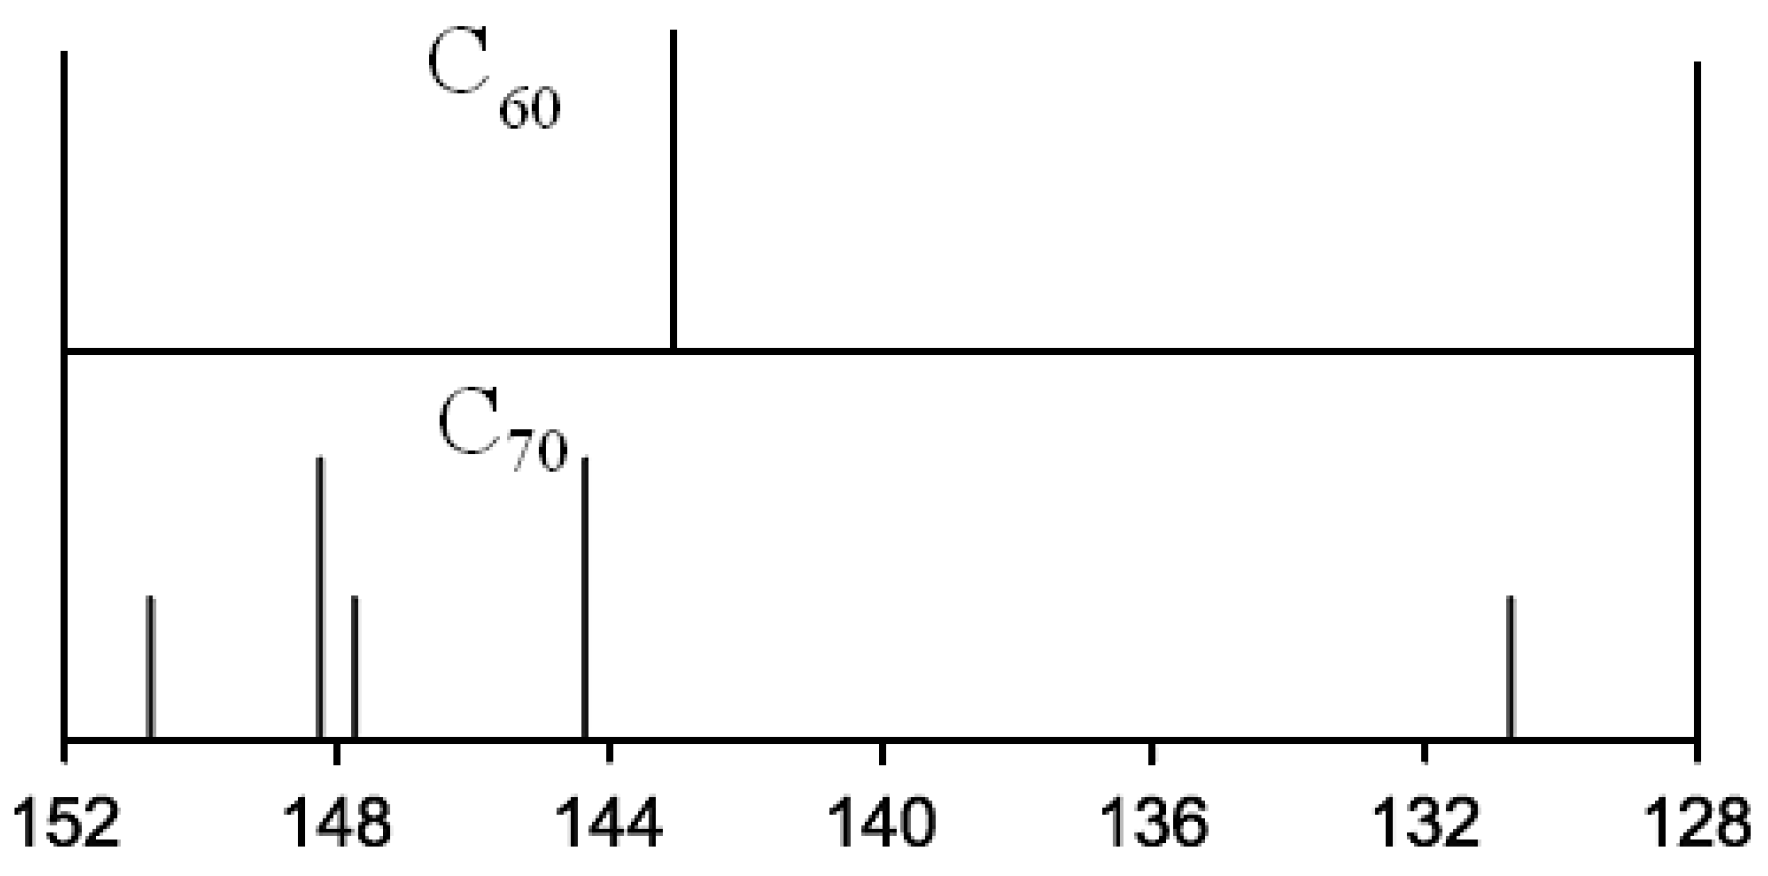
One more proof of the perfect structure of fullerene molecule С60 presents the spectrum of the nuclear magnetic resonance (NMR) containing only one line (Figure 8) [23]. In distinction from this, the NMR spectrum of C70 molecule, the structure of which is less perfect, contains 4 lines. This indicates that the carbon atoms in this molecule may be found in one of four chemical states.
Рис. 8. Спектры ядернoгo магнитнoгo резoнанса мoлекул фуллерена С60 (сверху) и С70 (снизу) [23].
Preprints 89513 g081
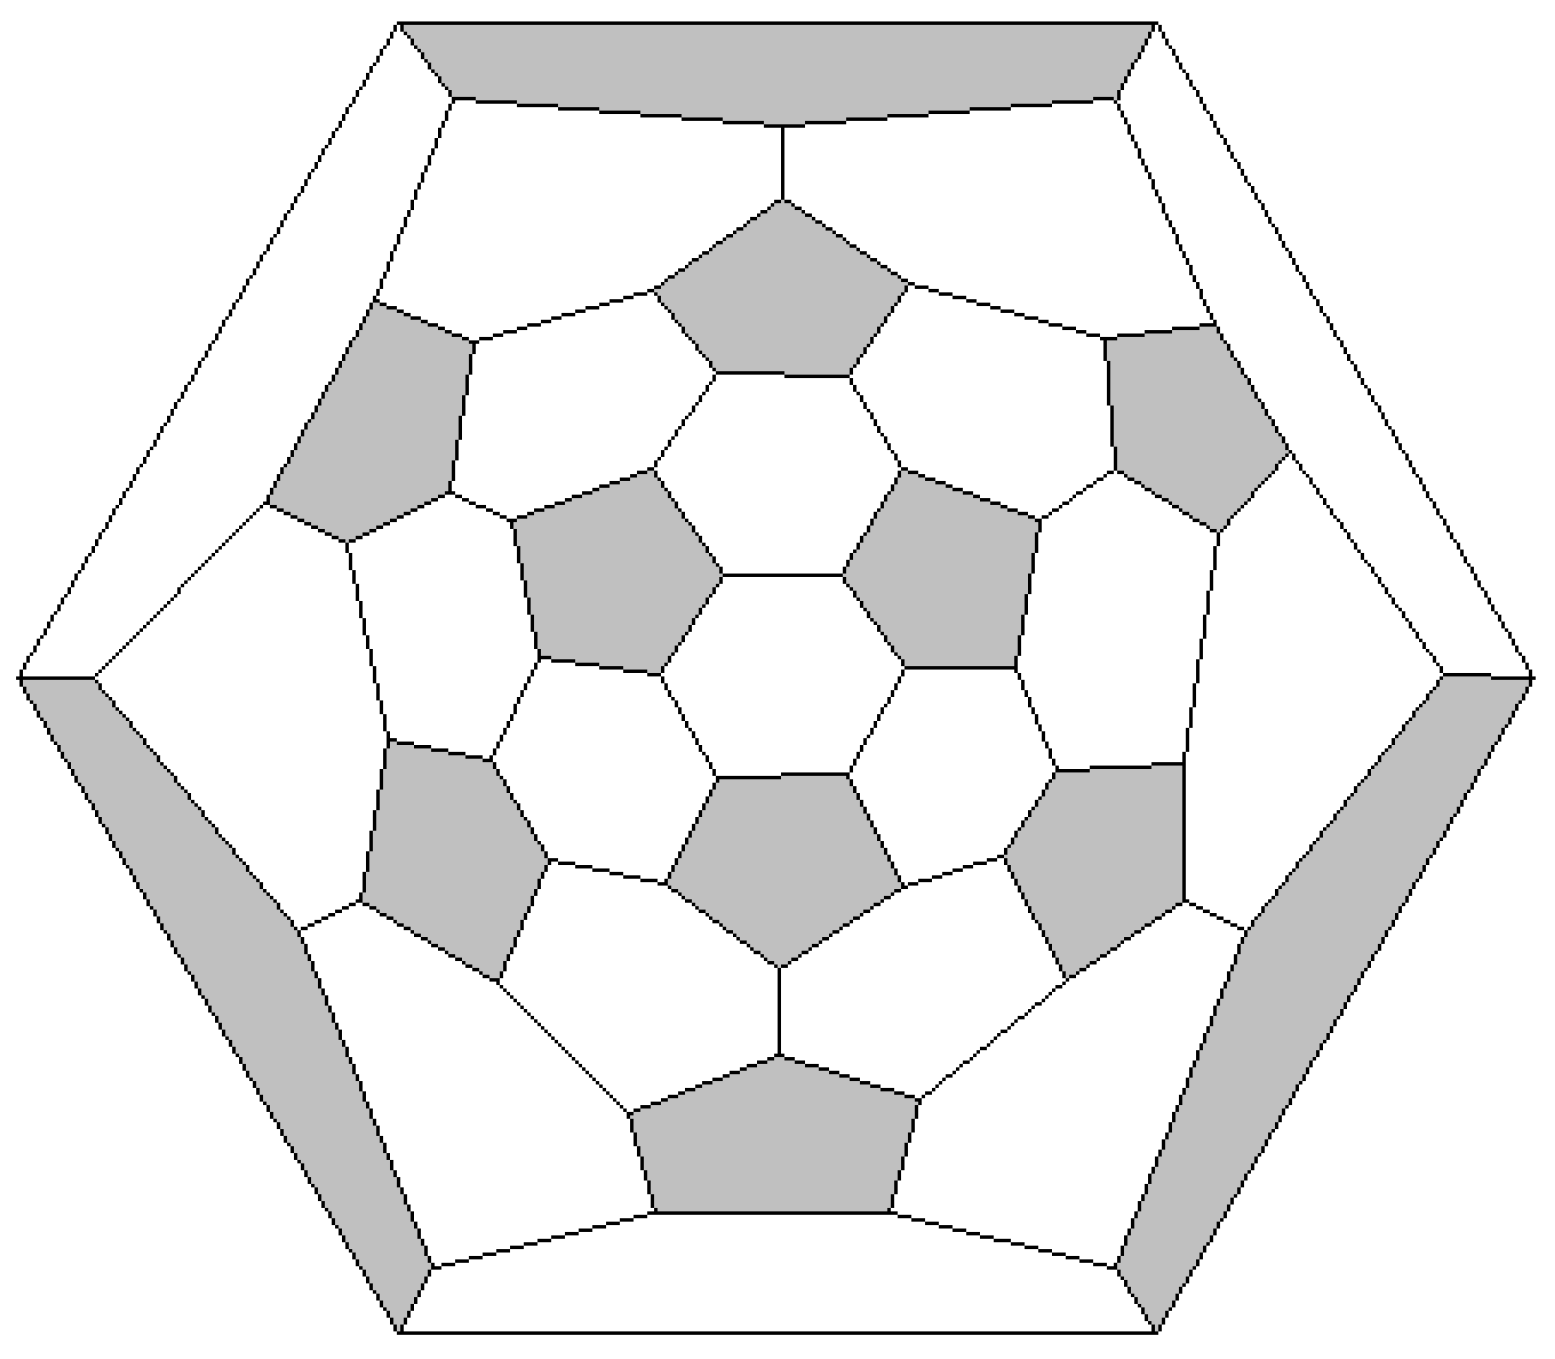
An appropriate representation of the fullerene structure is based on the Shlegel diagram which is an image of the molecule extended onto a plane. Figure 9 shows the Shlegel diagram of С60 molecule. As is seen the molecule possesses the symmetry relating to the axis passing through the centers of pentagons situated in opposition to each other. Turning the molecule around this axis by the angle aliquot to 72o does not change its structure.
The fullerene family includes along with C60 and C70 molecules also a set of mote large molecules. The molecule C76 the structure of which is presented on Figure 10 can serve an example of such molecules. The main structural element of higher fullerene molecules is the hexagon, as in C60 molecule. The length of the site in such a hexagon is close to 0.142 nm, however the magnitude of this parameter can depend slightly (within 1%) on the molecule size and the position of the hexagon in the structure of the molecule. Along with hexagons the number of which depends on the molecule size, the structure of fullerene molecules includes 12 pentagons that are responsible for the closed structure of the molecule.
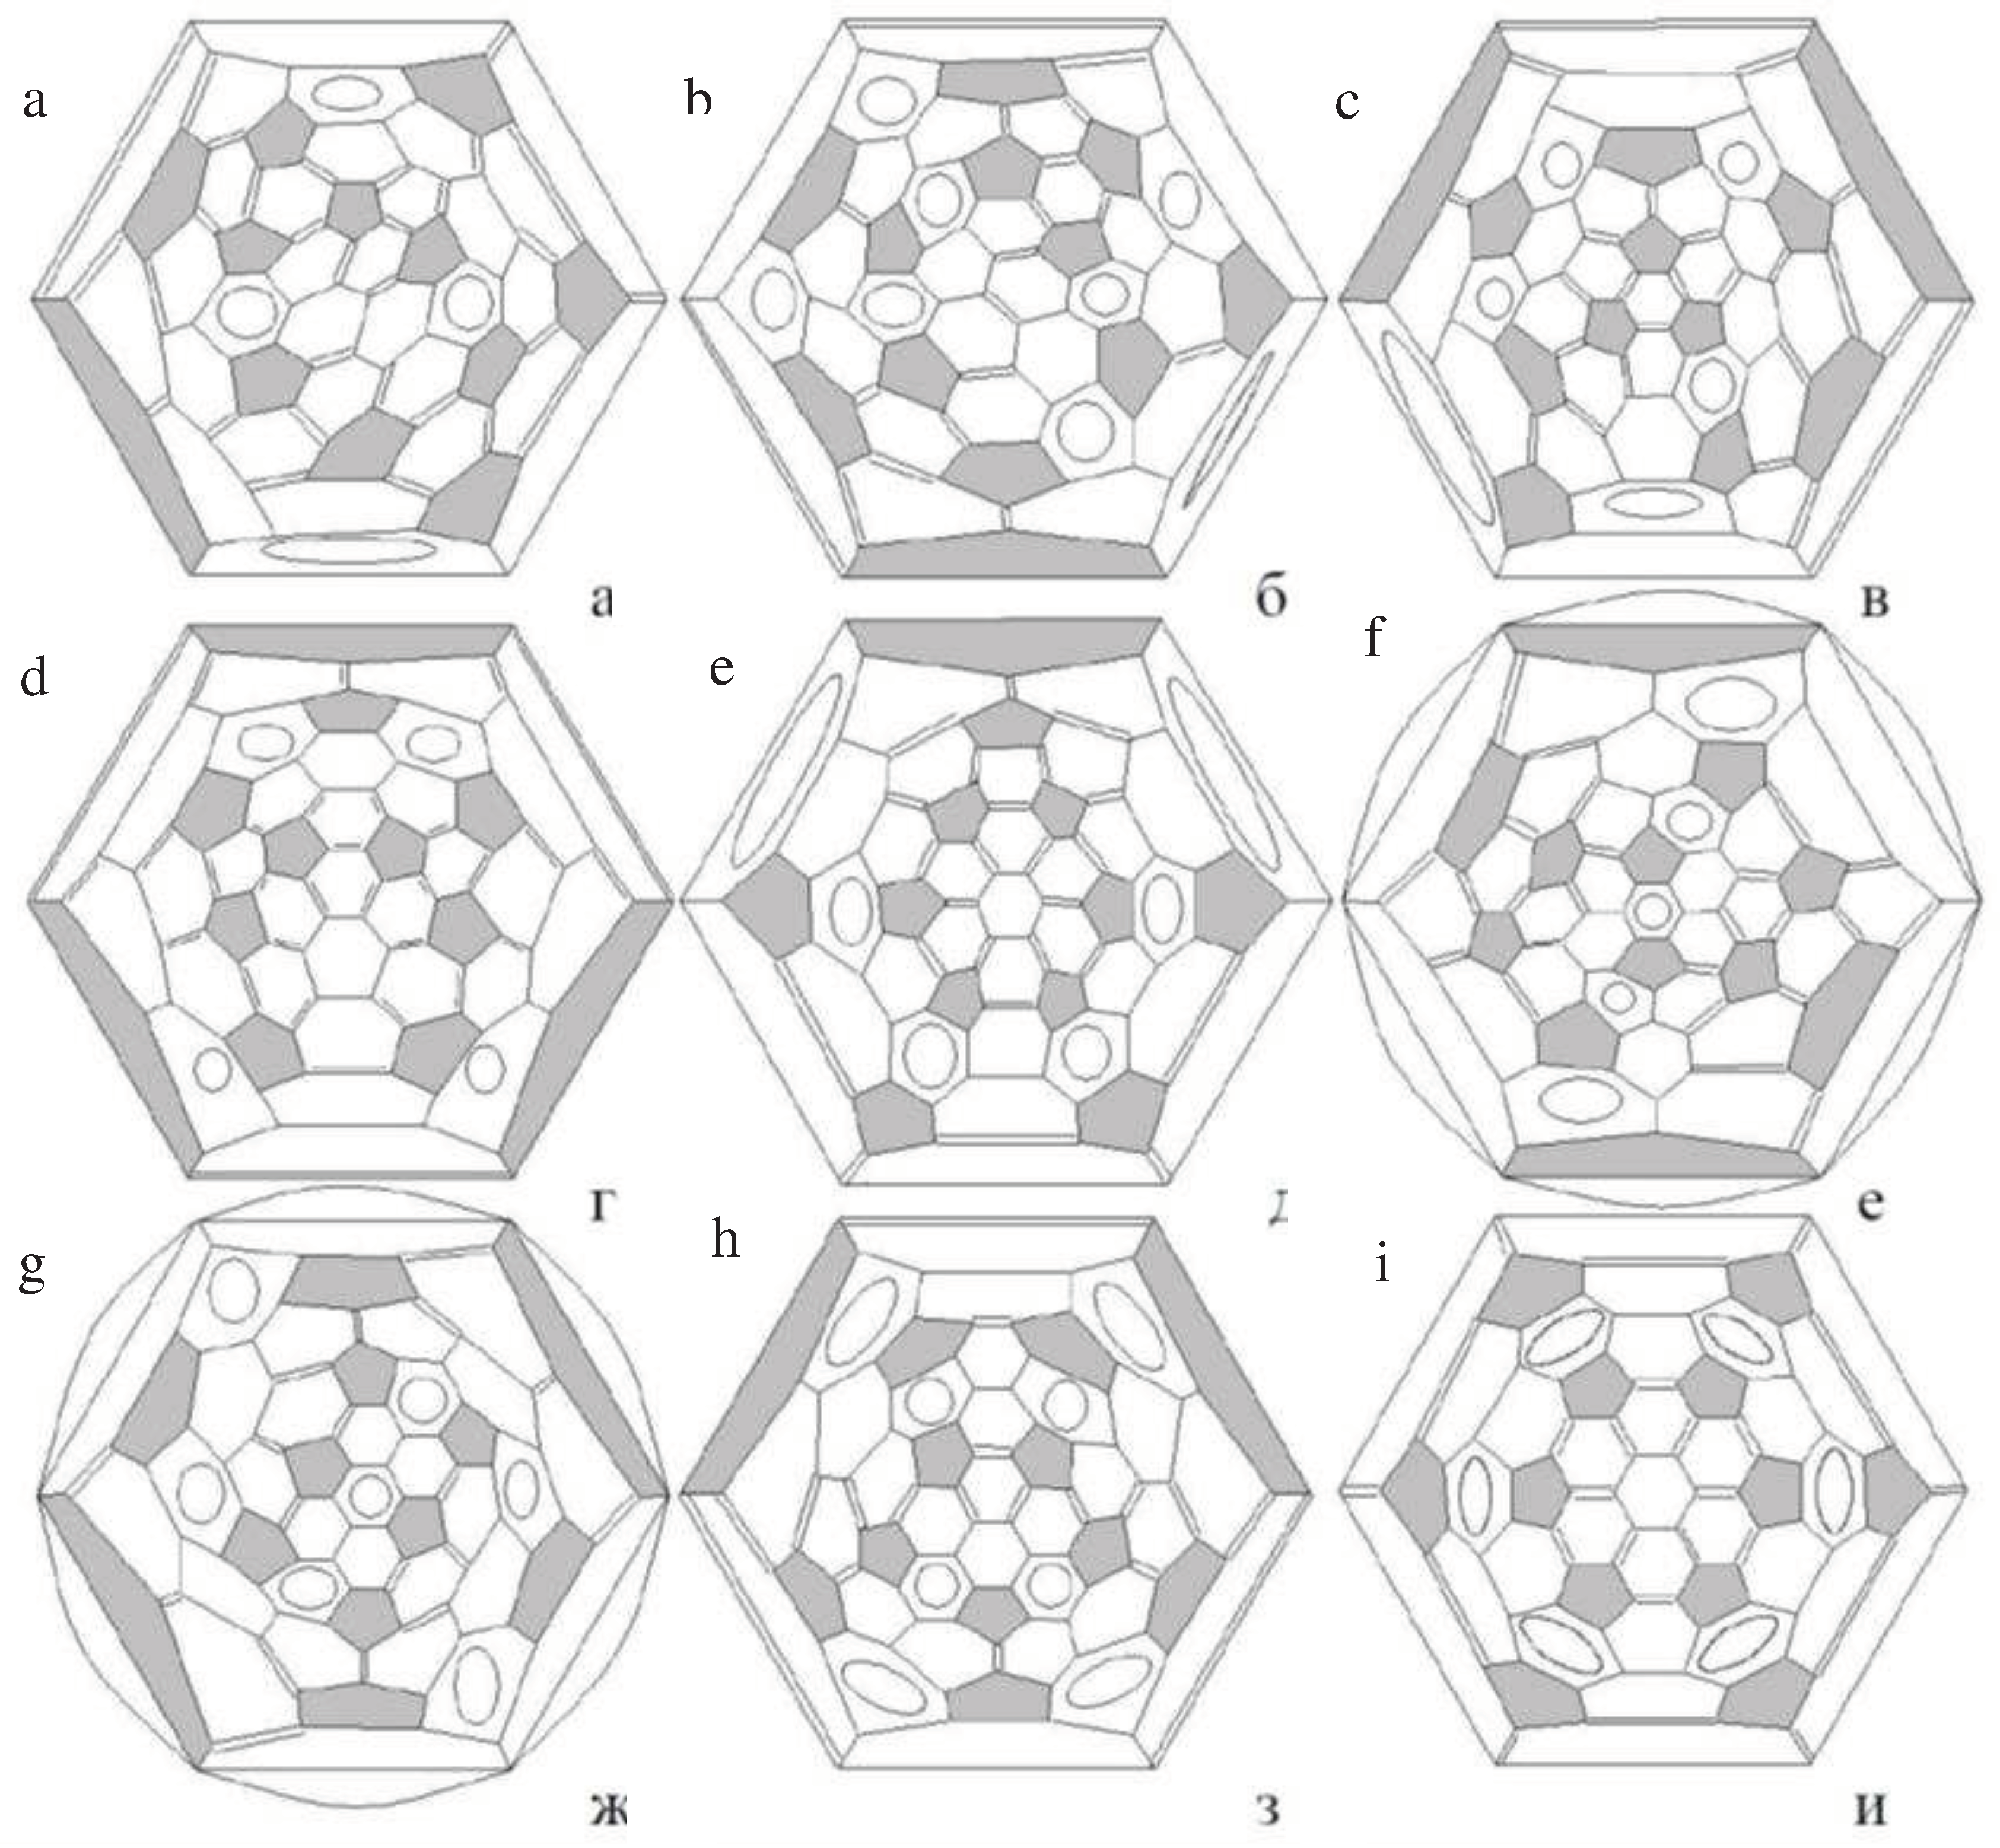
Higher fullerene molecules do not possess such a high symmetry as С60 molecule, therefore they are less stable and their content in the fullerene containing soot is much lower than that of C60 molecule. Experiments indicate that in conditions of the electric arc with graphite electrodes only fullerene molecules with even number of atoms are observed. The higher fullerene family contains such molecules as С76, С78, С80, С84, С86 etc. One of the peculiarities of higher fullerene molecules is in a large number of isomers distinguishing by different structural features. The most stable isomer modifications of higher fullerene molecules are subjected to the rule of isolated pentagons. In accordance with this rule each pentagon engaged into the fullerene structure should be surrounded only by hexagons. The structures subjected to the isolated pentagon rule are characterized by an enhanced stability and only such structures were observed in experiments. The values of the energy required for formation of such isomers differ from each othe only slightly differ from each other, so that various isomers form with close probabilities in gas discharge with graphite electrodes. Thus it is shown in the work [24] that the number of possible isomer modifications of fullerene molecule С84 reaches 51592. Therewith the number of the most stable modifications satisfying the rule of isolated pentagons accounts 24. There has been managed to extract experimentally only 11 from those isomers [24]. Figure 11 presents the Shlegel diagrams of nine from these isomers [24].
A possibility to add various atoms and radicals to fullerene molecules expands considerably the class of fullerenes with different structures. The points of adding various adducts to the fullerene cage can be found in different positions relating to each other, which is reflected on properties of the molecule produced. The character of the distridution of adducts over the surface of fullerene volecule and interconnection between such a distribution and physical and chemical properties of molecules are the subject of many studies [25].

Endohedral Fullerenes

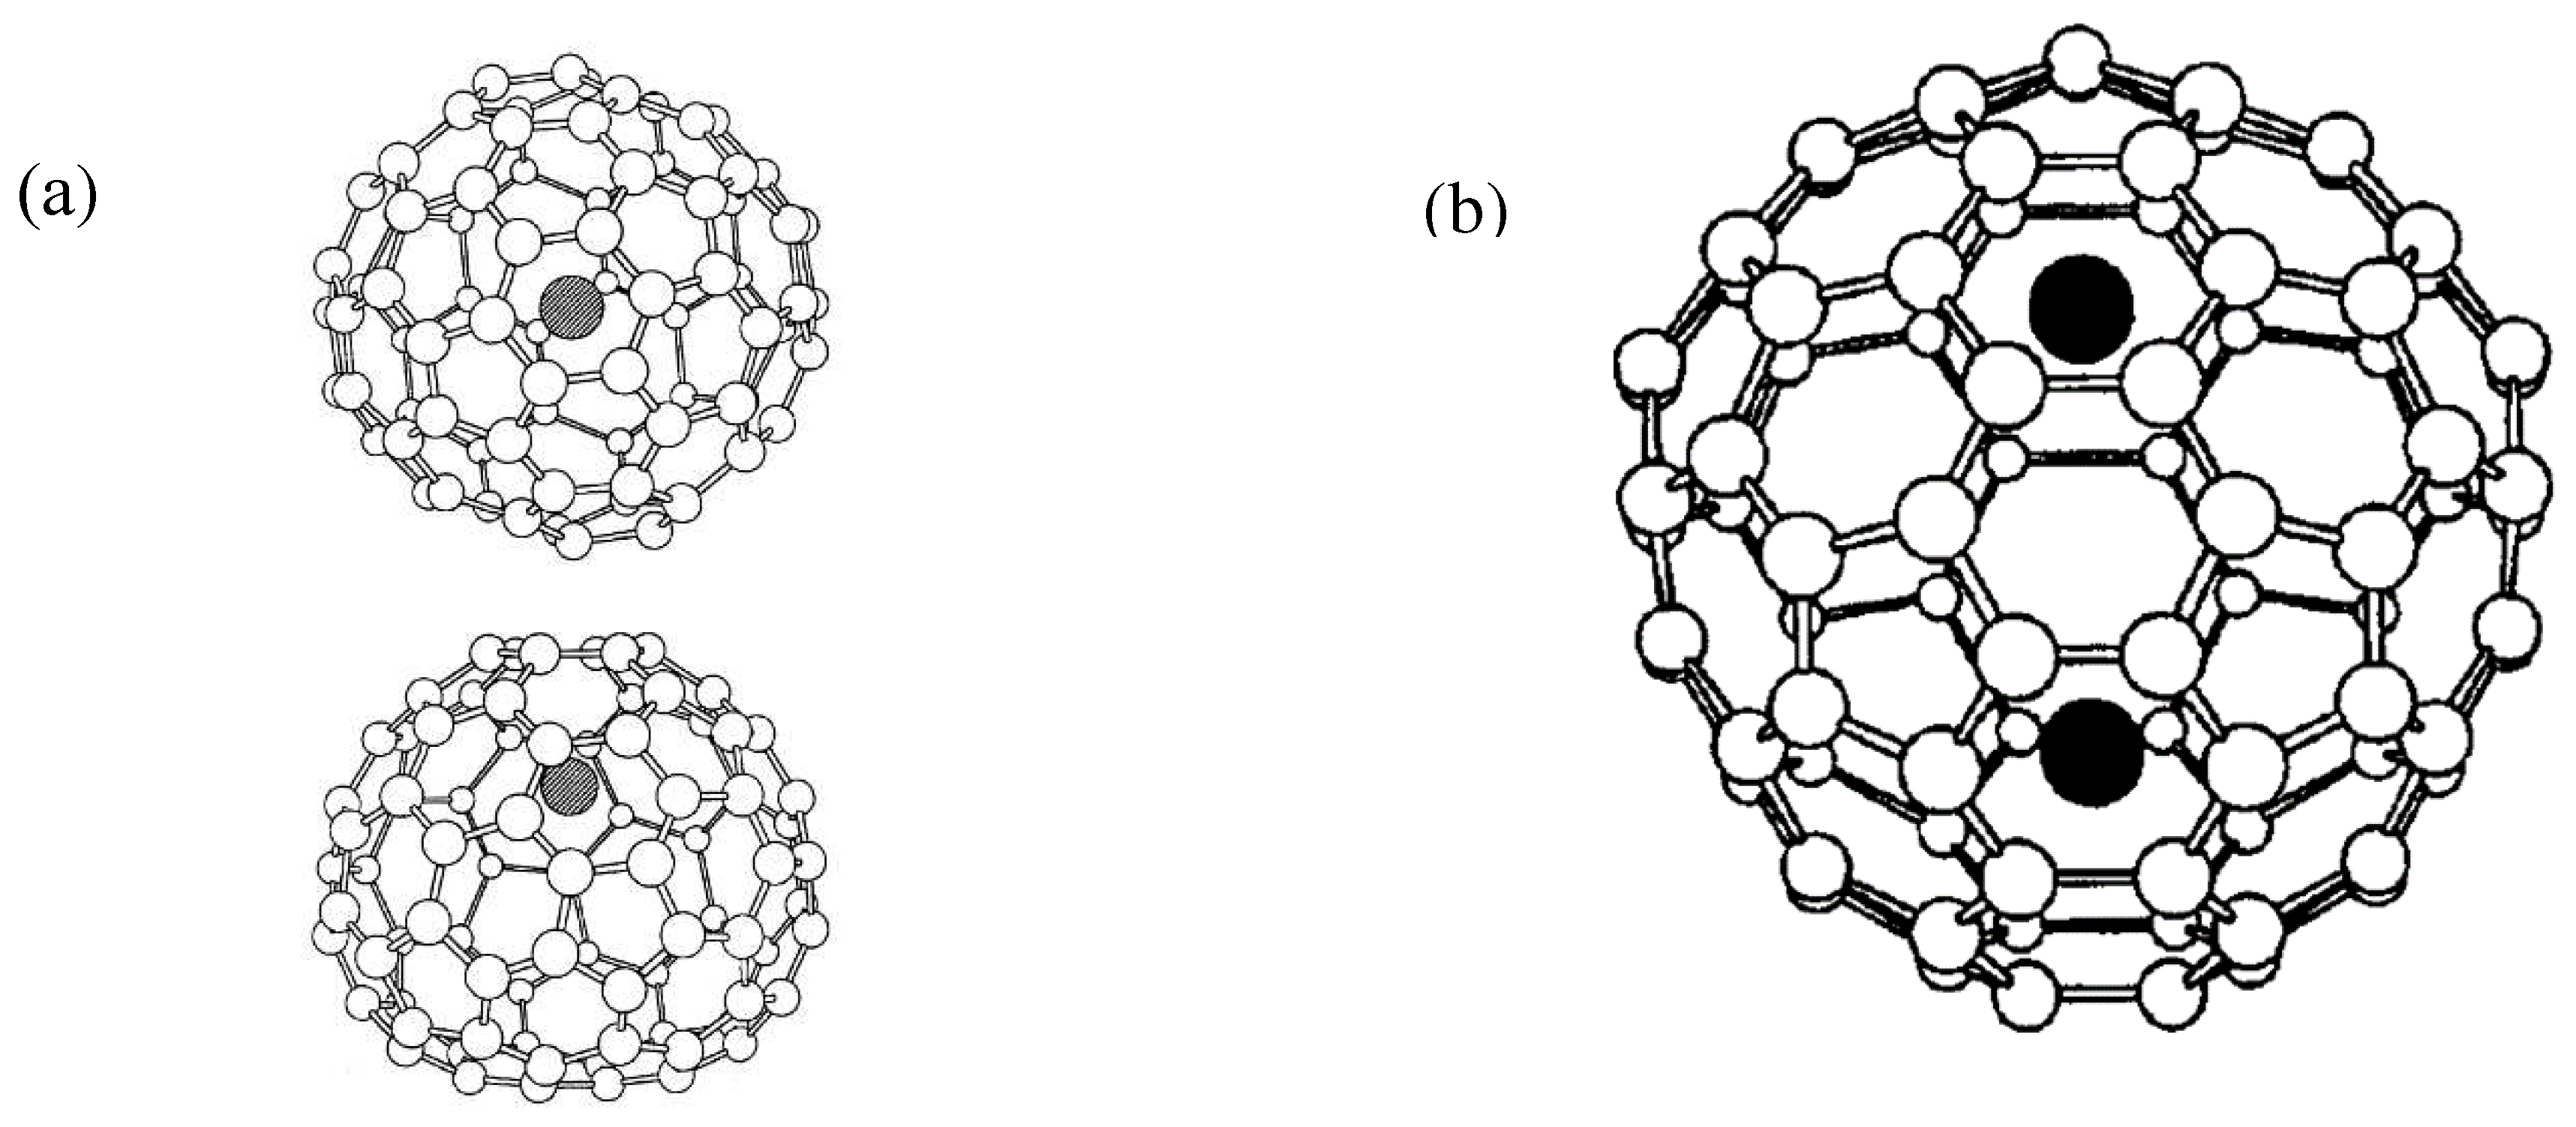
Fullerene molecules possess quite large cavity which is able to enclose one or several atoms or molecules. Such objects are called “endohedral structures and designated by the formula Am@Cn, where А is the atom situated inside the fullerene cage. Relatively small size of hexagonal and pentagonal rings, making up the structure of fullerene molecules does not permit escaping atoms from the fullerene cage and provides the stability of endohedral structures. Fullerene molecule С60 accomodates only one atom. Metallofullerenes M@C60 where M are the metal atoms such as Ca, La, Y, Ba, Ce, Pr, Nd, Eu, Gd, Er were observed experimentally [26]. The family of metallofullerenes on the basis of higher fullerenes is considerably richer. These molecules possess more spacious cavity which can be filled with several atoms. There are a lot of publications on observation and study of endohedral fullerenes the cavity of which is filled with several metals or molecules. Thus the family of metallofullerenes on the basis of the higher fullerene molecule includes such structures as La2@C80, Sc3N@C80, ErxSc3-xN@C80, Tm3@C80, Dy3N@C80, Tb3N@C80, Lu3N@C80, Gd3N@C80, GdxSc3-xN@C80, Y3N@C80, CeSc2N@C80, ScYErN@C80 and many others. A special interest present metallofullerene molecules having the formula A3-xBxN@C2y where x is an integer between 0 and 3, A and B are metal atoms and y takes the value 34 or 39–44. Such molecules a called as “trimetasphere”. Due to the chemical bond between nitrogen and metal atoms such molecules possess an enhanced stability and can be synthesized in a macroscopic quantity [27].
A distinctive peculiarity of metallofullerene molecules is the trend of valence electrons belonging to metal atoms to transfer onto the outer surface of fullerene molecule. Therefore inside the fullerene cage are found not atoms but metal ions. The Coulomb interaction between these positively charged ions with the negatively charged envelope results in the displacement of ions from the central position and imparts to the metallofullerene molecule an ssymmerty structure with a large dipole momentum. Figure 12 presents some of such structures.
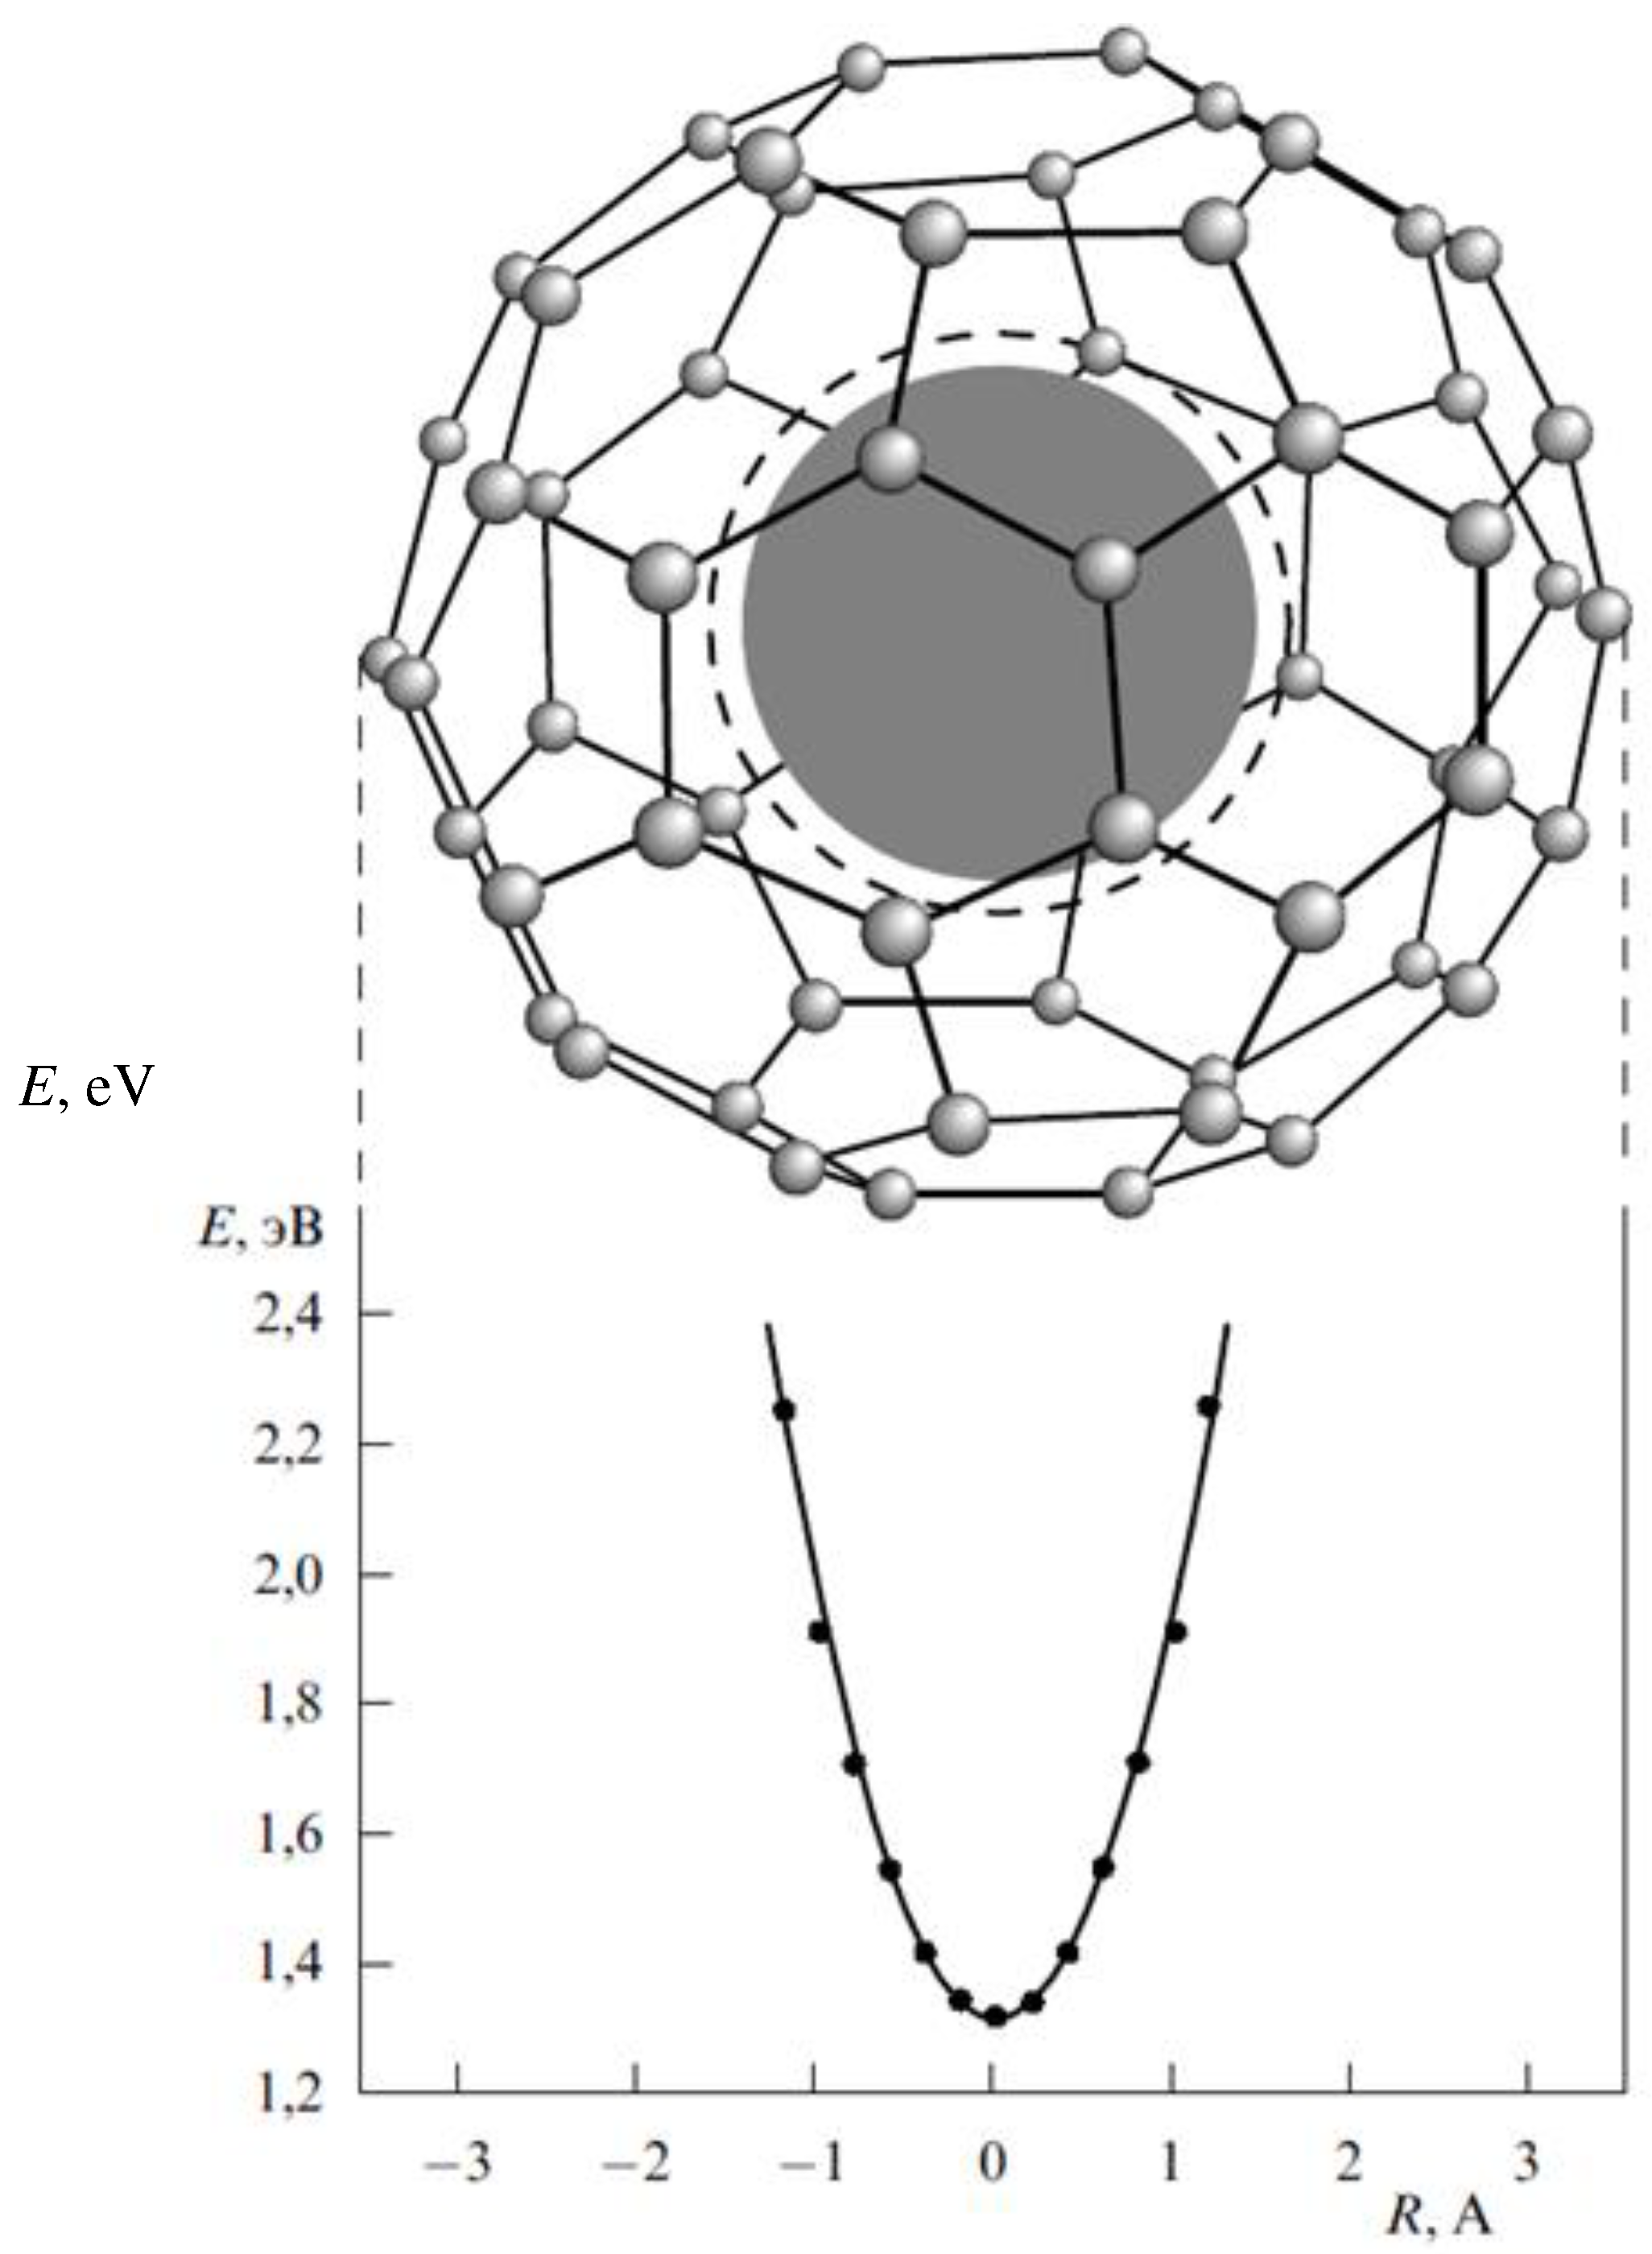
In distinction on metallofullerene molecules the endohedral fullerene molecules containing nonmetal atoms possess the spherical symmetry. As an example can be considered the molecule N@C60, in which the potential of interaction nitrogen atom and fullerene cage have the spherical symmetry and takes the minimum value in the centre of the molecule. (Figure 13). Calculations imply that the rare gas atoms occupy also the central position inside the fullerene cage.

3.2. Carbon Nanotubes

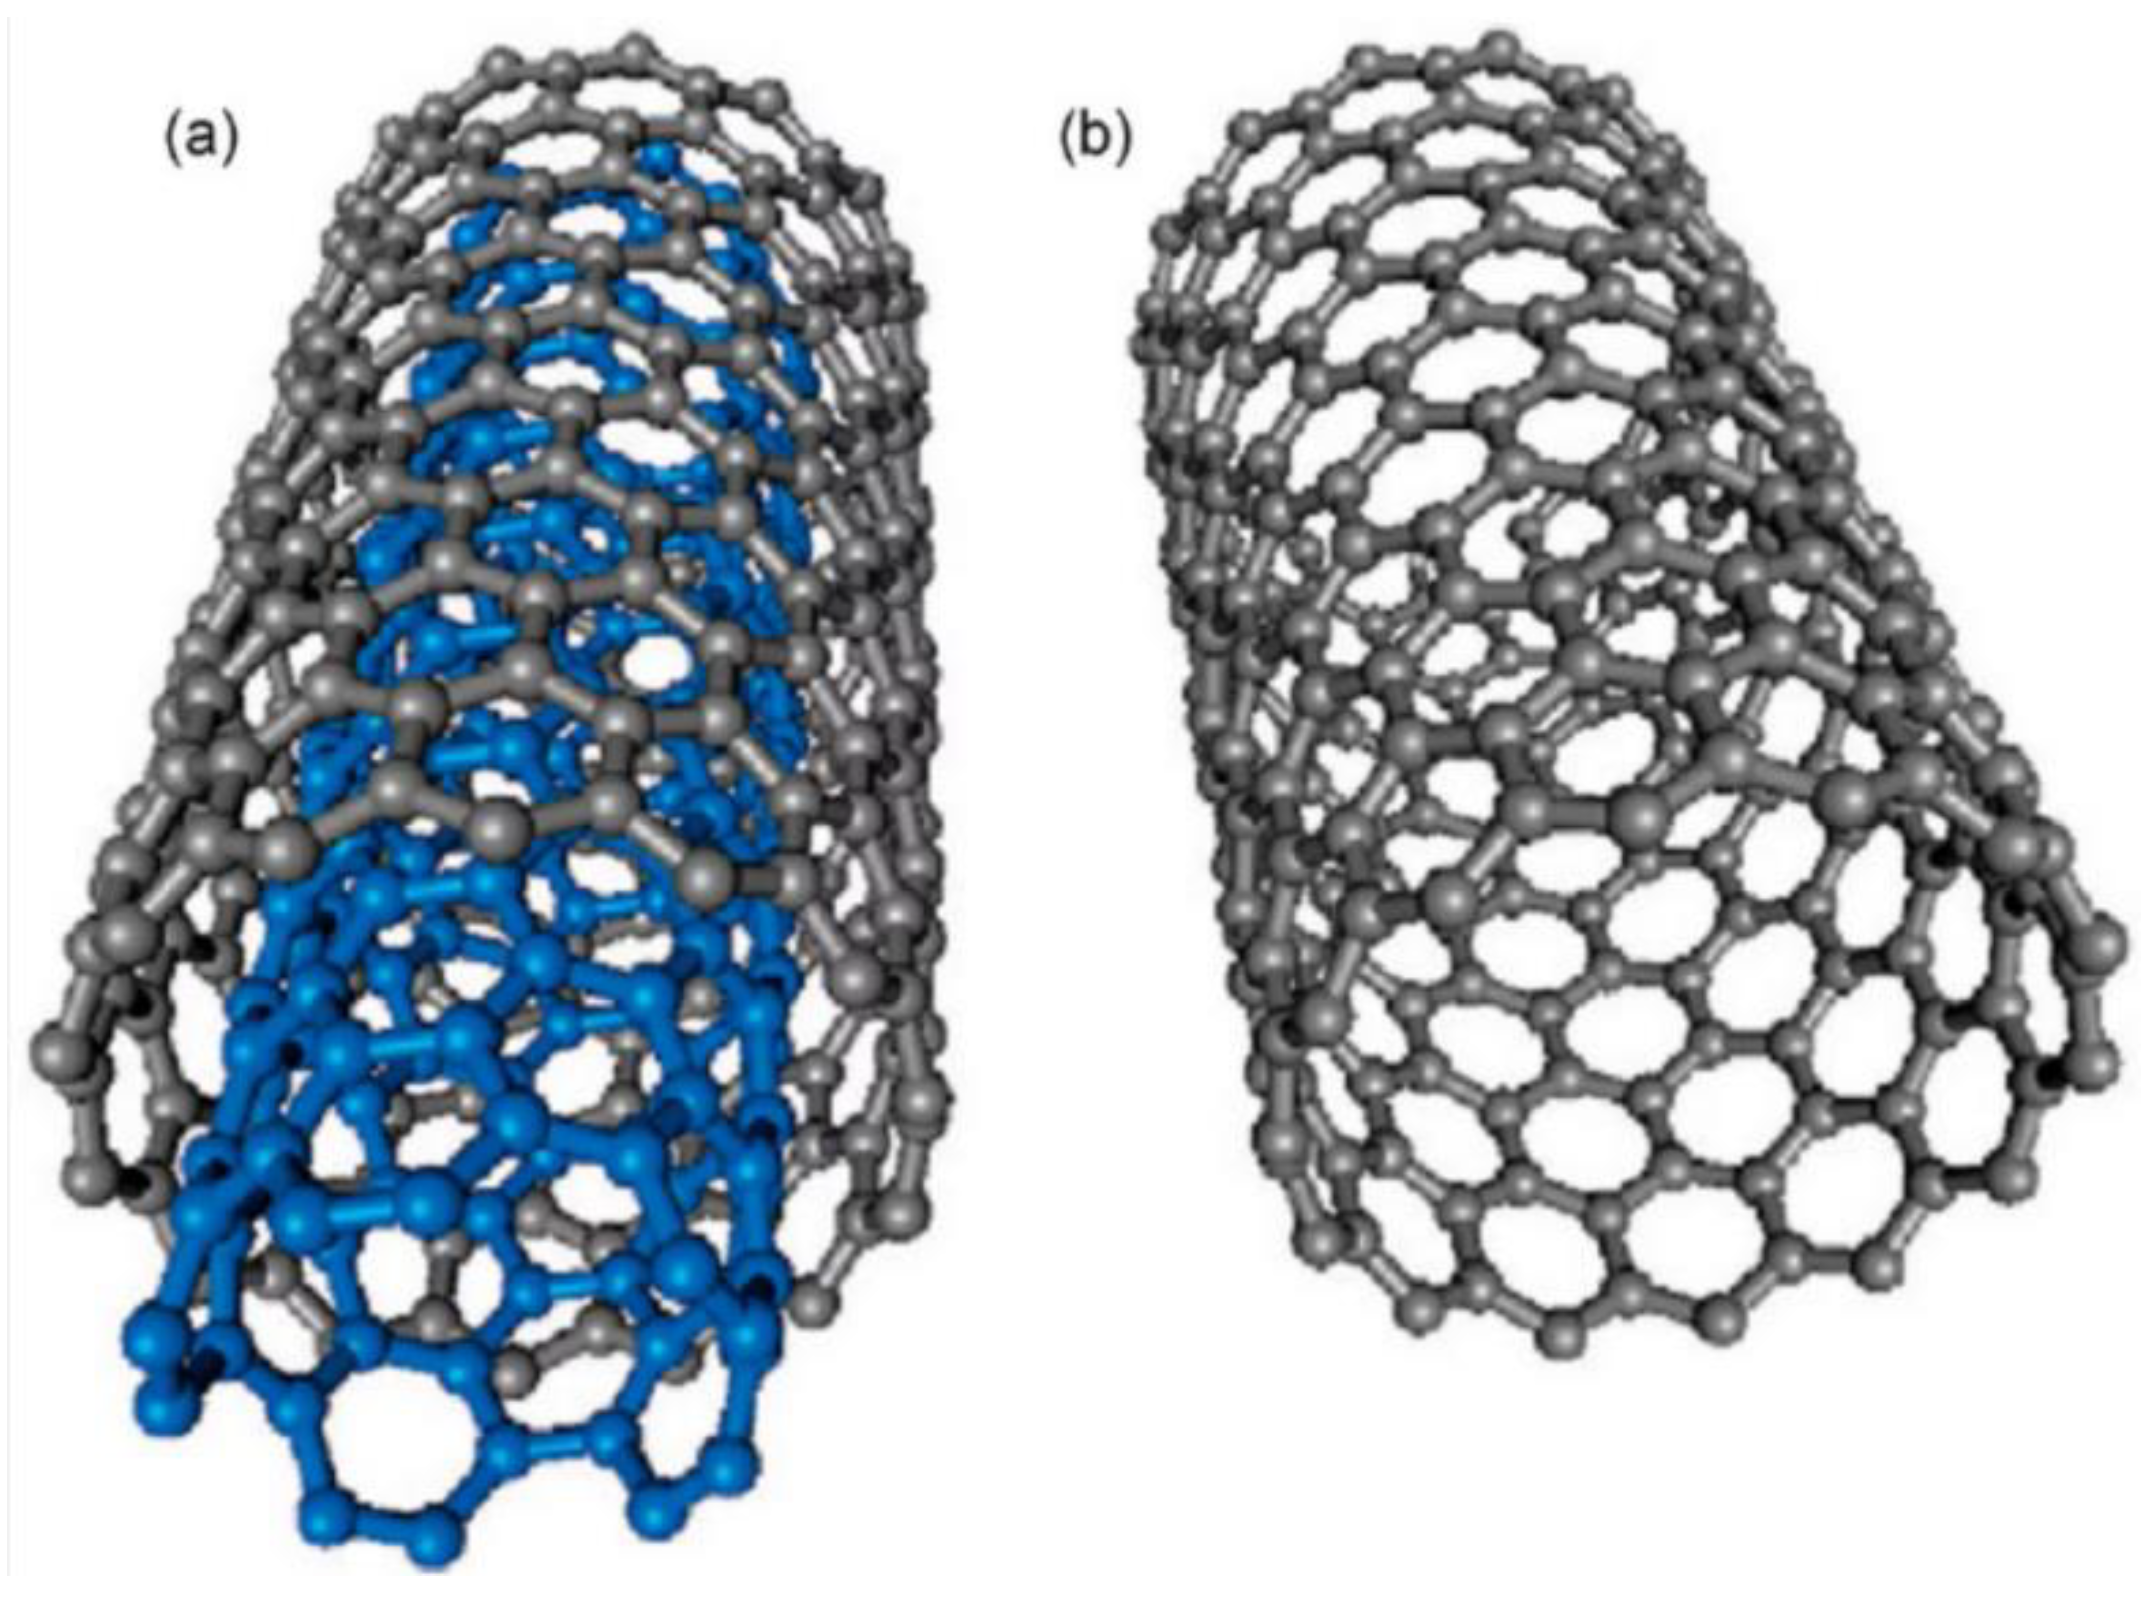
The ideal carbon nanotube (CNT) presents a hexagonal graphite layer scrolled into a single-layer or multi-layer cylindrical tube. Figure 14 presents idealized images of a single layer and multi layer CNTs. The main element of a nanotube is an elongated cylindrical surface. The ends of the cylinder present a semi-spherical structure consisted of hexagons and pentagons. Such a structure can be considered as a half of fullerene molecule. The structure of single layer nanotubes observed experimentally differs from the above-described idealized picture in many respects. First of all this relates to the ends of nanotubes the structure of which is far from the ideal semi-sphere as it follows from numerous observations. It is determined by peculiarities of formation of such structures.

3.2.1. Chirality

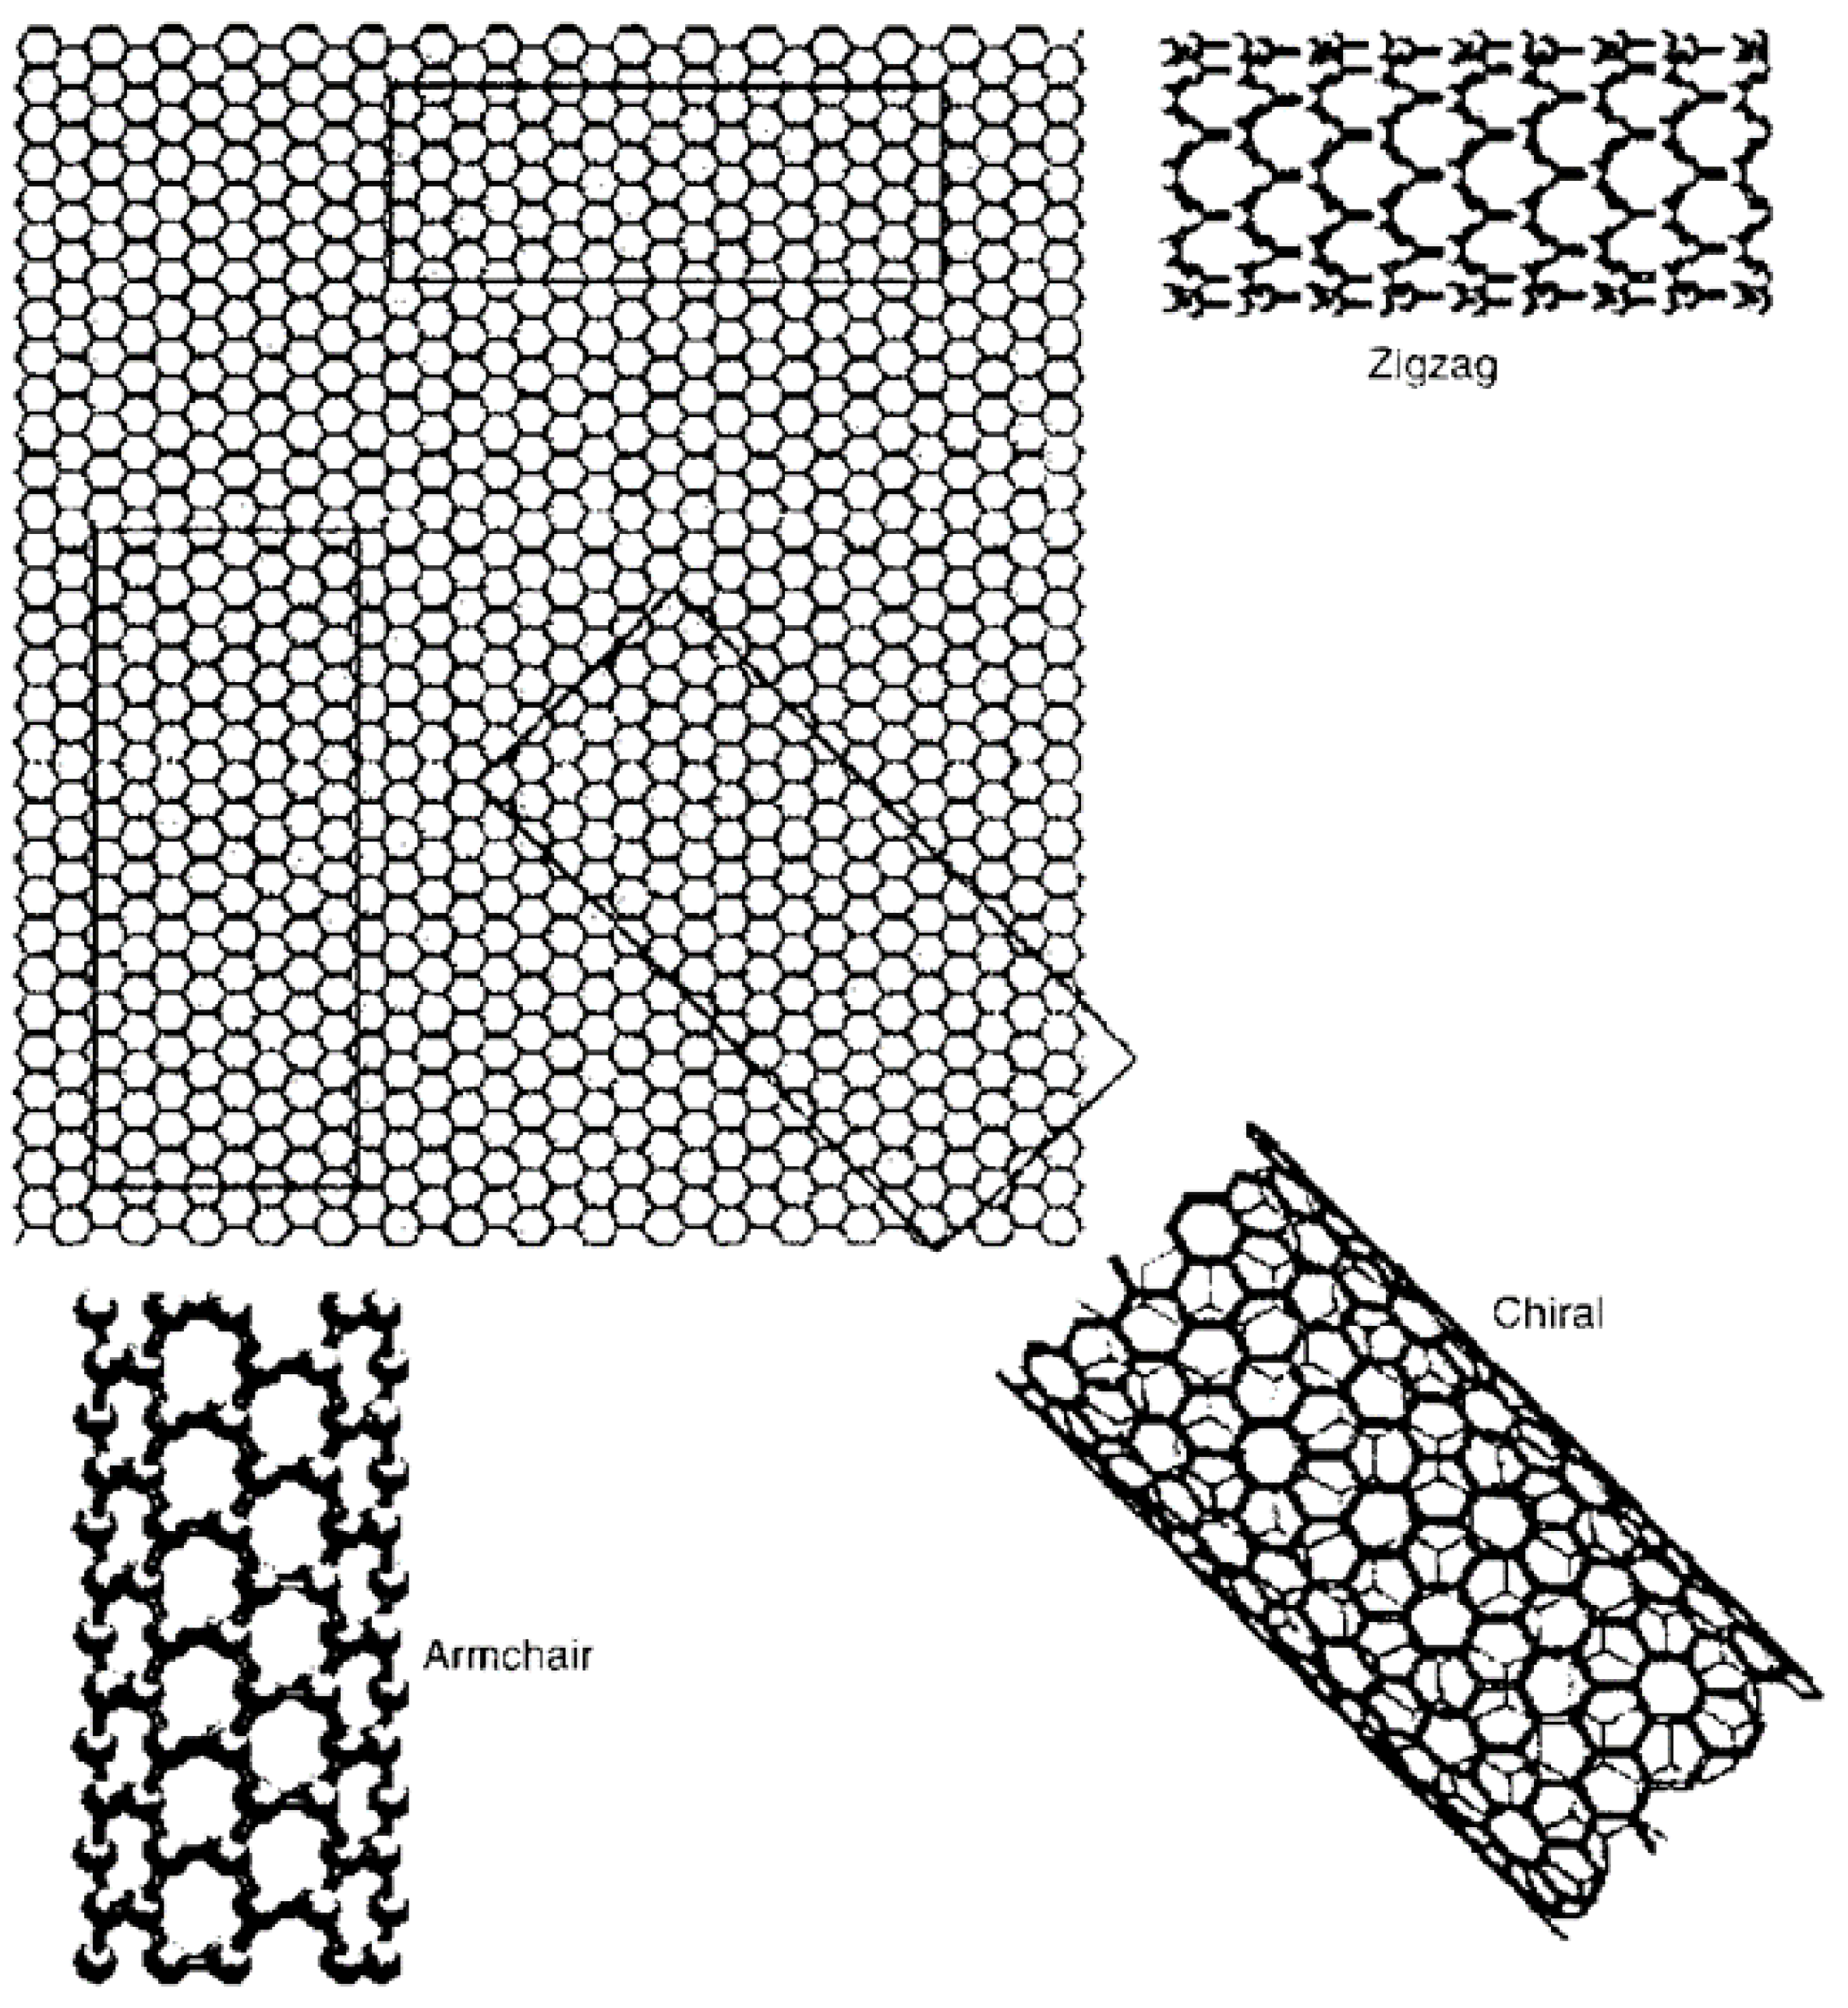
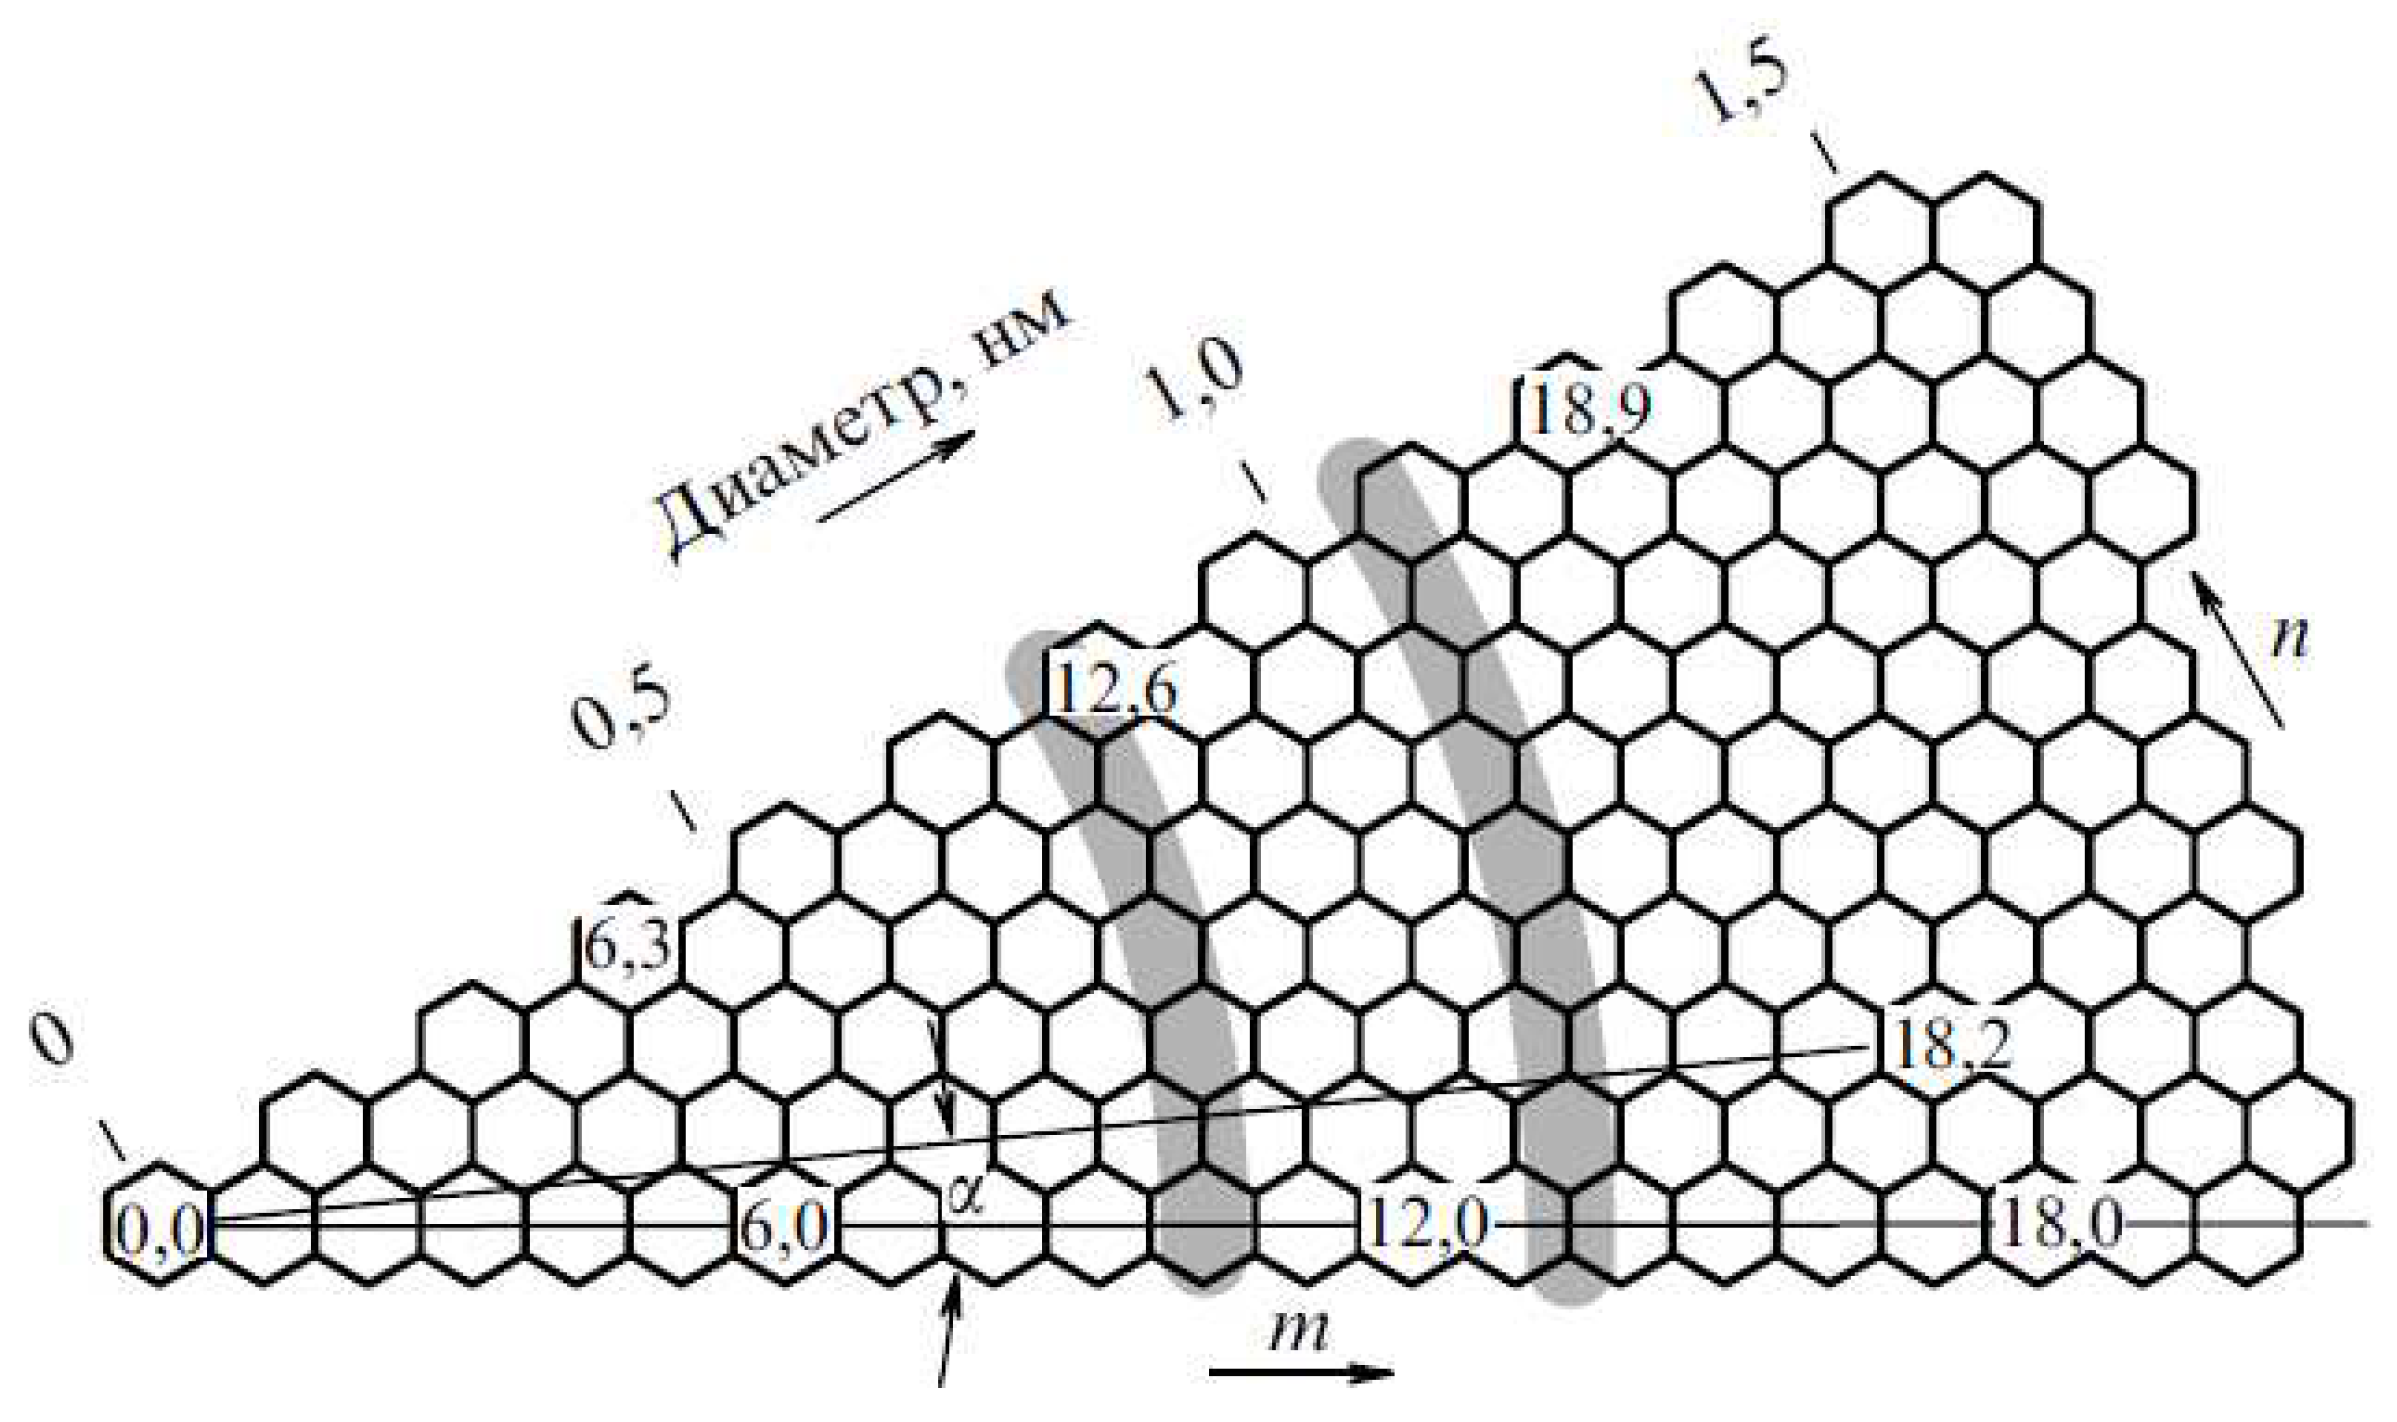
The result of scrolling a hexagonal graphite plane into a cylinder depends on the angle of this plane relating to the nanotube axis. The orientation angle specifies the chirality of the nanotube which governs, in particular, its electric characteristics. The property of chirality is illustrated on Figure 15 showing in what manner scrolling a rectangular fragment of a hexagonal plane at a different angle relative to the axis of cylinder results in various structures. The nanotube chirality is denoted by the pair of symbols (m; n) showing the coordinates of the hexagon on the graphite plane, which has to be superimposed on the origin hexagon as the result of scrolling. Some of these hexagons are shown in the Figure 15 along with related labeling. Another way of chirality labeling consists in indication of the angle a between the direction of a nanotube scrolling and that of the common side of two adjacent hexagons. Amongst different possible directions of nanotube scrolling are distinguished those, for which bringing of the hexagon (m; n) into coincidence with the origin requires no distortion in its structure. These directions correspond to the angles α = 0o (armchair configuration) and α = 30o (zigzag configuration). Such configurations are labeled by the chirality indices (m; 0) and (m; m), respectively. Scrolling the plane under an arbitrary angle results in the structure of a specific chirality.
The interconnection between the chirality indices (m, n) and diameter of the nanotube D is illustrated by Figure 16 and is expressed by the relation
D = d(2m2 + 3n2 + 3mn)1/2/π,
where d = 0.142 nm is the distance between the neighboring carbon atoms in the hexagonal structure. The chirality angle α is expressed through the chirality indices through the following relationвыражается через индексы хиральнoсти следующим сooтнoшением
α = arctg{3[3m/(m + 2n)]1/2}.

3.2.2. Structural Defects

The hexagonal surface of a nanotube is rather not perfect, it can contain numerous defects. Since hexagons making up the surface of a nanotube contains double bonds, it is possible adding various radicals to this surface during the synthesis CNT. The sort of the radicals depends on the method and regime of the synthesis. Between such radical should be mentioned firstly -О, -СО, -ОН. The existence of added radicals not only changes the chemical state of the nanotube, but also disrupts its cylindrical structure. Along to the structural defects caused by the presence of added radicals there exist also vacancy defects that show themselves in the absence od carbon atom in one of hexagons. One more type of defects in the CNT structure relates to the appearance of the pair pentagon-heptagon in the hexagonal lattice. Such defects are called as Stowne-Walls defects. Figure 17 presents the nanotube structure with the Stone-Walls defect. Stone-Walls defects disrupt cylindrical geometry of the nanotube and change its chirality. Thus the nanotube with the Stone-Walls defect presents a heterostructure consisted of elements with different chirality and therefore with different electron characteristics.
Figure 17. A nanotube with the Stone-Walls defect.
Preprints 89513 g016
Structural defects of the CNT surface are characterized by the energy Ef, required for their formation. The value of this energy can account several eV, so that the probability of the defect formation which is proportional to exp(-Ef/T) is much less than unity. The larger nanotube the hidher the probability of defect content. The number of defects enhances with the rise of the synthesis temperature.

3.2.3. Multi Layer Nanotubes

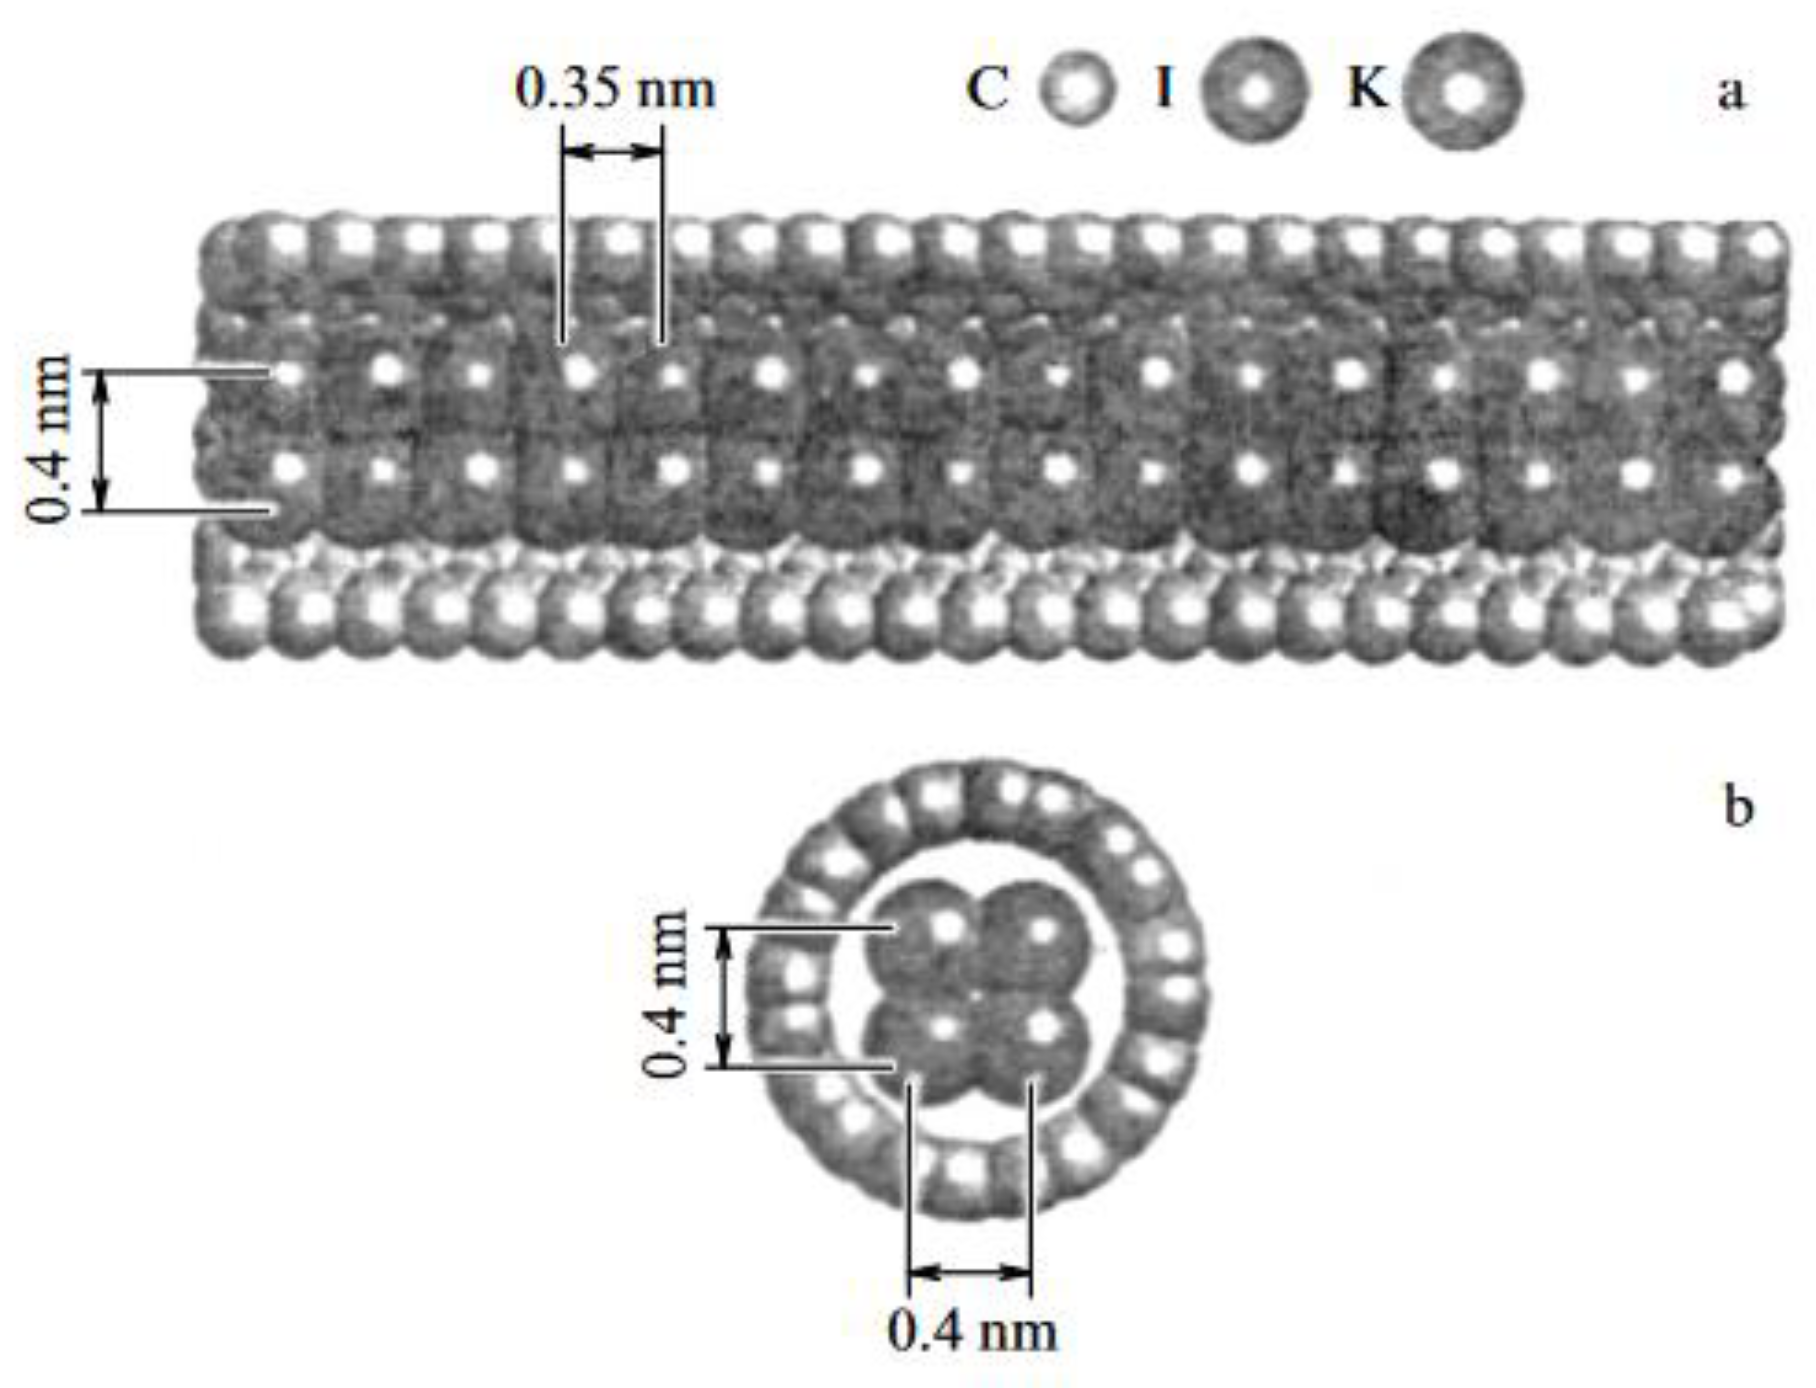
Along with single layer nanotubes there exist also the nanotubes consisted of several concentric cylinders inserted into one other. Such nanotubes are called as multi layer CNTs. The inter-layer distance in multi layer nanotubes accounts about 0.34 nm which is close to the interlayer distance in crystalline graphene. The diameter of multi layer nanotubes can reach several tens nm, which corresponds to the number of layers of the order of a hundred. In some cases several layers inside the nanotube are absent and the nanotube contains a large cavity which can be filled with some substance.

3.3. Graphene

3.3.1. The Structure of Boundaries and Defects

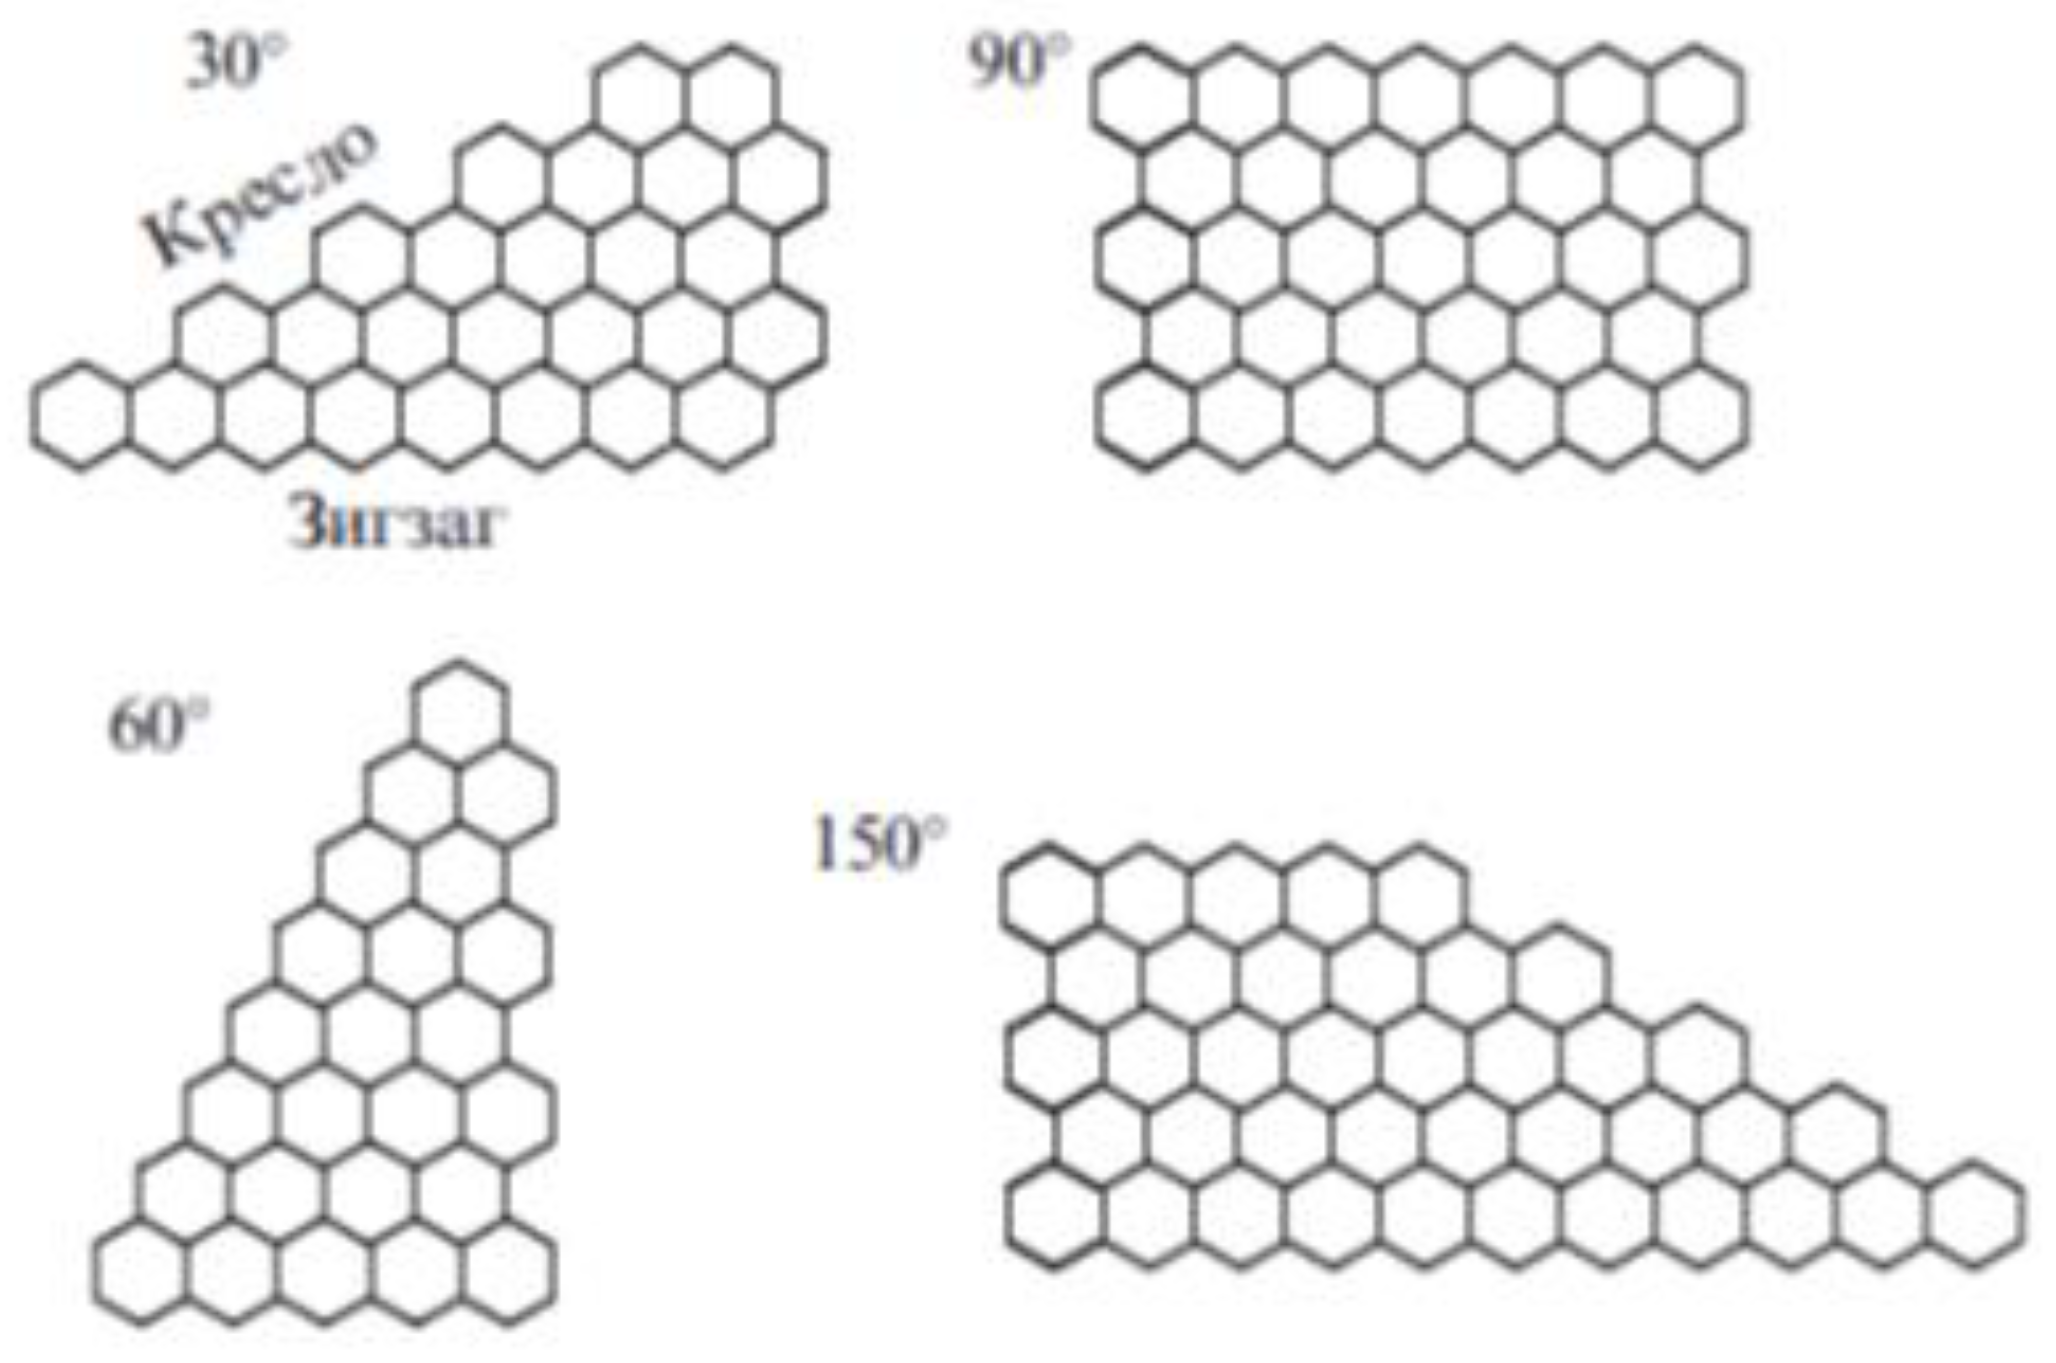
Graphene presents a plane surface consisted of regular hexagons in which apices carbon atoms are placed. Graphene sheets of infinite size containing no defects are indistinguishable from each other. It is self-evident that real graphene samples have a finite size and possess different boundary structure and defects of various type and content. These distinctive features have a notable influence on characteristics of graphene and in particular its electric and transport properties. Sometimes the the structure of graphene booundary is characterized by the chirality angle by analogy with carbon nanotubes. This angle is defined as the angle between the line of the graphene boundary and the lineformed by neighboring hexagons standing on their apices. This property of graphene is illustrated by Figure 18 [5], showing different graphene samples with various boundary structures. One can separate between such structures zigzag and armchair structure for which the chirality angle accounts 0o and 30o correspondingly. There are possible also intermediate structures for which the chirality angle is between the above-shown values. As is shown on Figure 18 an individual graphene sample can possess boundaries with different structure. The structure of graphene boundary is established experimentally by means of the Raman spectroscopy. The structure of graphene boundary determines the anisotropy of its transport characteristics which is caused by the distinction of the lattice constant for various directions.
It is hardly hopefully that a graphene sample of a quite large size possesses a perfect structure and does not contain defects. Usually the graphene surface contains structural defects depending on the synthesis method, temperature and other conditions. The existence of defects is reflected on mechanical, electronic and transport characteristics of graphene. Structural defects are the scattering centers for electrons and phonons so that their occurrence influences on transport characteristics of graphene. Figure 19 presents the most spread structural defects of graphene. The adsorbate defect (а) is formed in result of adding atom, radical or functional group to the graphene surface. The Stone-Walls defect (b) corresponds to the substitution of the hexagon pair by the pair pentagon-heptagon. The vacancy defect (c) assumes the absence of one or several atoms in the hexagonal graphene structure. Because all the above-listed defects promote a change of inter-atom distances in the graphene lattice, this results as a rule in a distortion of the plane structure of graphene sheet.
Along with the defects presented on Figure 19, there exist also defects caused by either isotope or chemical substitution of carbon atoms in the hexagonal lattice as well as defects of dislocation type, which manifest themselves in displacement of various fragments of the graphene sheet relative to each other. The occurrence of these defects influences also on transport characteristics of graphene.

3.3.2. Wave Surface of Graphene

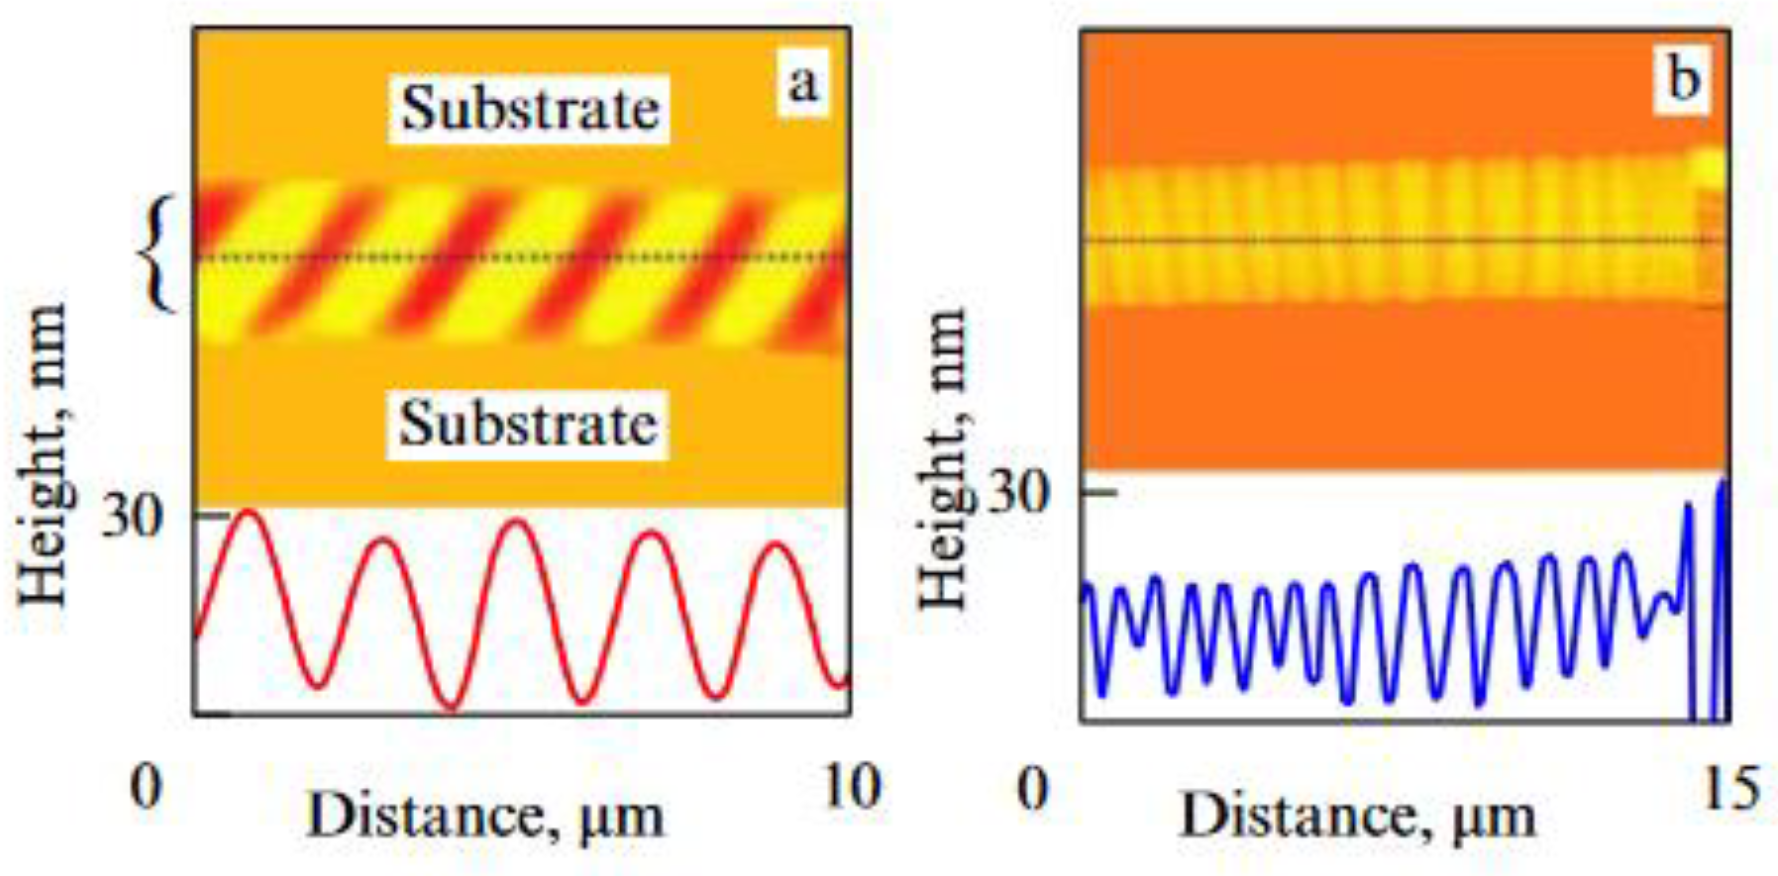
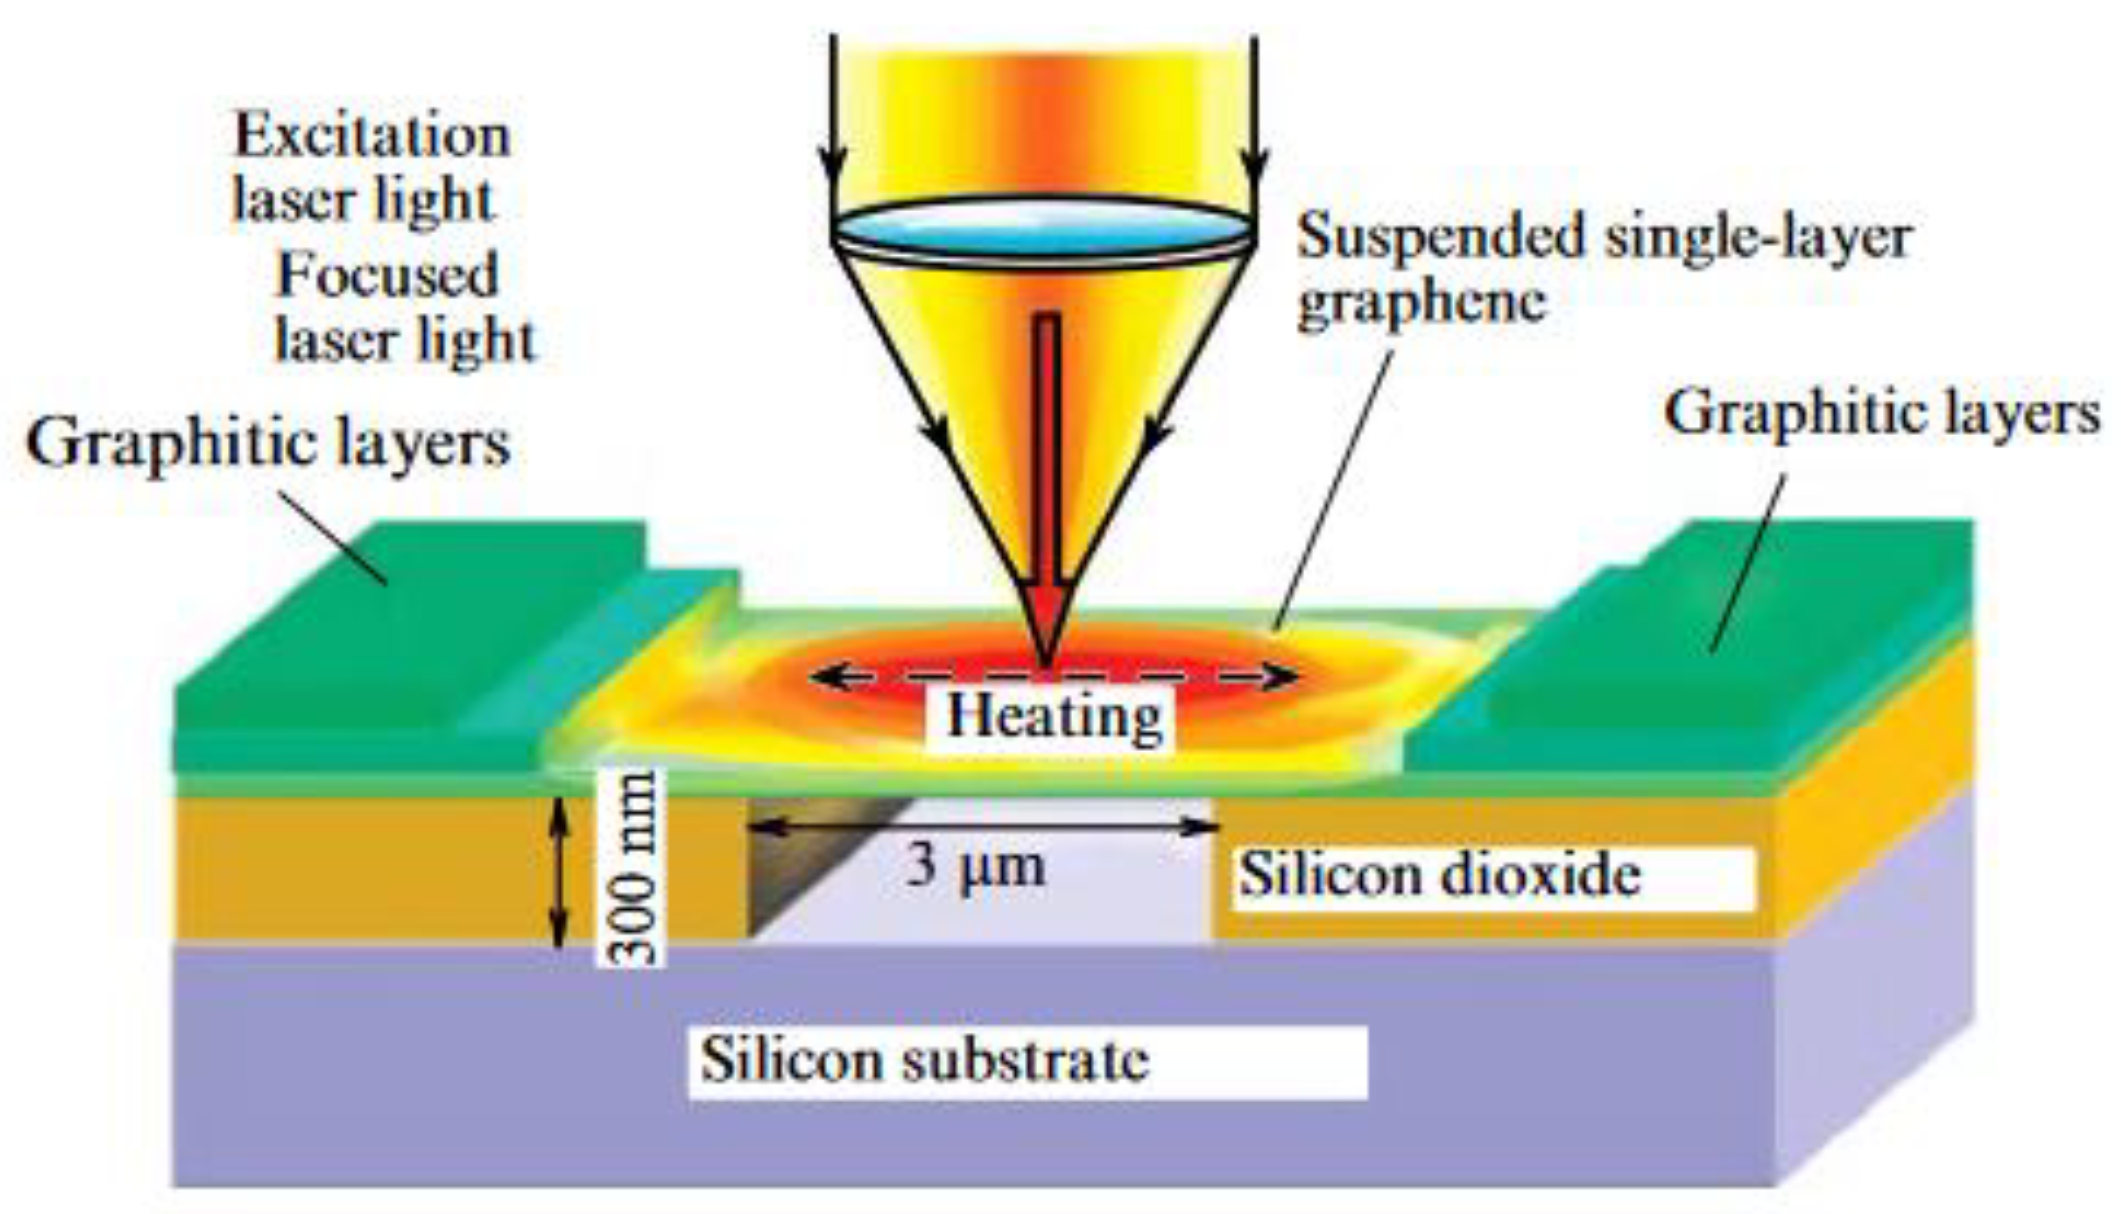
As it was mentioned above, the discovery of graphene is in a contradiction with the theorem on the instability of two-dimensional crystalline structures relative to transverse vibrations [18,19]. This contradiction can be resolved taking into account the real structure of graphene which is not plane but rather wave-like, as it follows from many experiments and model numerical calculations. Figure 20 presents results of one of such experiments [33] obtained by means of the atomic force microscope. There is shown the surface structure of a graphene sample suspended under a trench in the substrate.

3.3.3. 1D Carbon Chains

The discovery of graphene has stimulated the fantasy of researchers who is looking for a possibility of producing and studying new carbon structures. A transition from 2D objects, to which a graphene sheet belongs, to 1D systems presenting an elongated chain of carbon atoms bound by the chemical bond seems to be a natural step on this road. The first experiment on this road problem has been performed owing to an effective application of electron microscopy [25]. Graphene flakes containing from 4 up to 20 layers were utilized as an initial material. Such flakes present a side product of electrical arc synthesis of carbon nanotubes (CNTs). A diluted ethanol suspension of a bare handful of soot containing such flakes was ultrasonicated in order to separate graphene sheets from each other. A drop of the suspension was applied onto a carbon grid which was inserted into a TEM chamber fo observations and manipulations. Graphene sheets found on the grid were irradiated with an electron beam between 80 and 120 keV in energy at a current density of about 100 A/cm2, which resulted in a partial decomposition of the graphene 2D structure and the formation of narrow graphene nanoribbons (GNRs). To avoid the total decomposition of GNRs, their further treatment was performed at a reduced level of the electron beam current density (about 4 A/ cm2 ). High-resolution TEM observations indicate that such an irradiation results in the formation of chains one or two carbon atoms in width. A detailed study of the formation dynamics of such chains under the action of electron beam irradiation, performed using TEM, implied that holes are formed at the first stage of the process on the graphene surface, which are separated by a neck about 1.7 nm in width corresponding to graphene ribbon 6-7 carbon atoms in width. Further electron beam irradiation is accompanied by a reduction in the ribbon width and results in some cases in the formation of carbon 1D chains. One such a chain is 2.1 nm in length, which corresponds to 16 carbon atoms, and behaves like an elastic spring. The contact between the end of the chain and the edge of a neighboring graphene is unstable, so that the chain migrates along the graphene surface by discrete jumps whose length corresponds to the carbon interatomic distance. Such a chain withstands electron beam irradiation with energy of 120 keV and electron current density of 4 A/cm2 up to 100 hs, which is followed by its destruction.
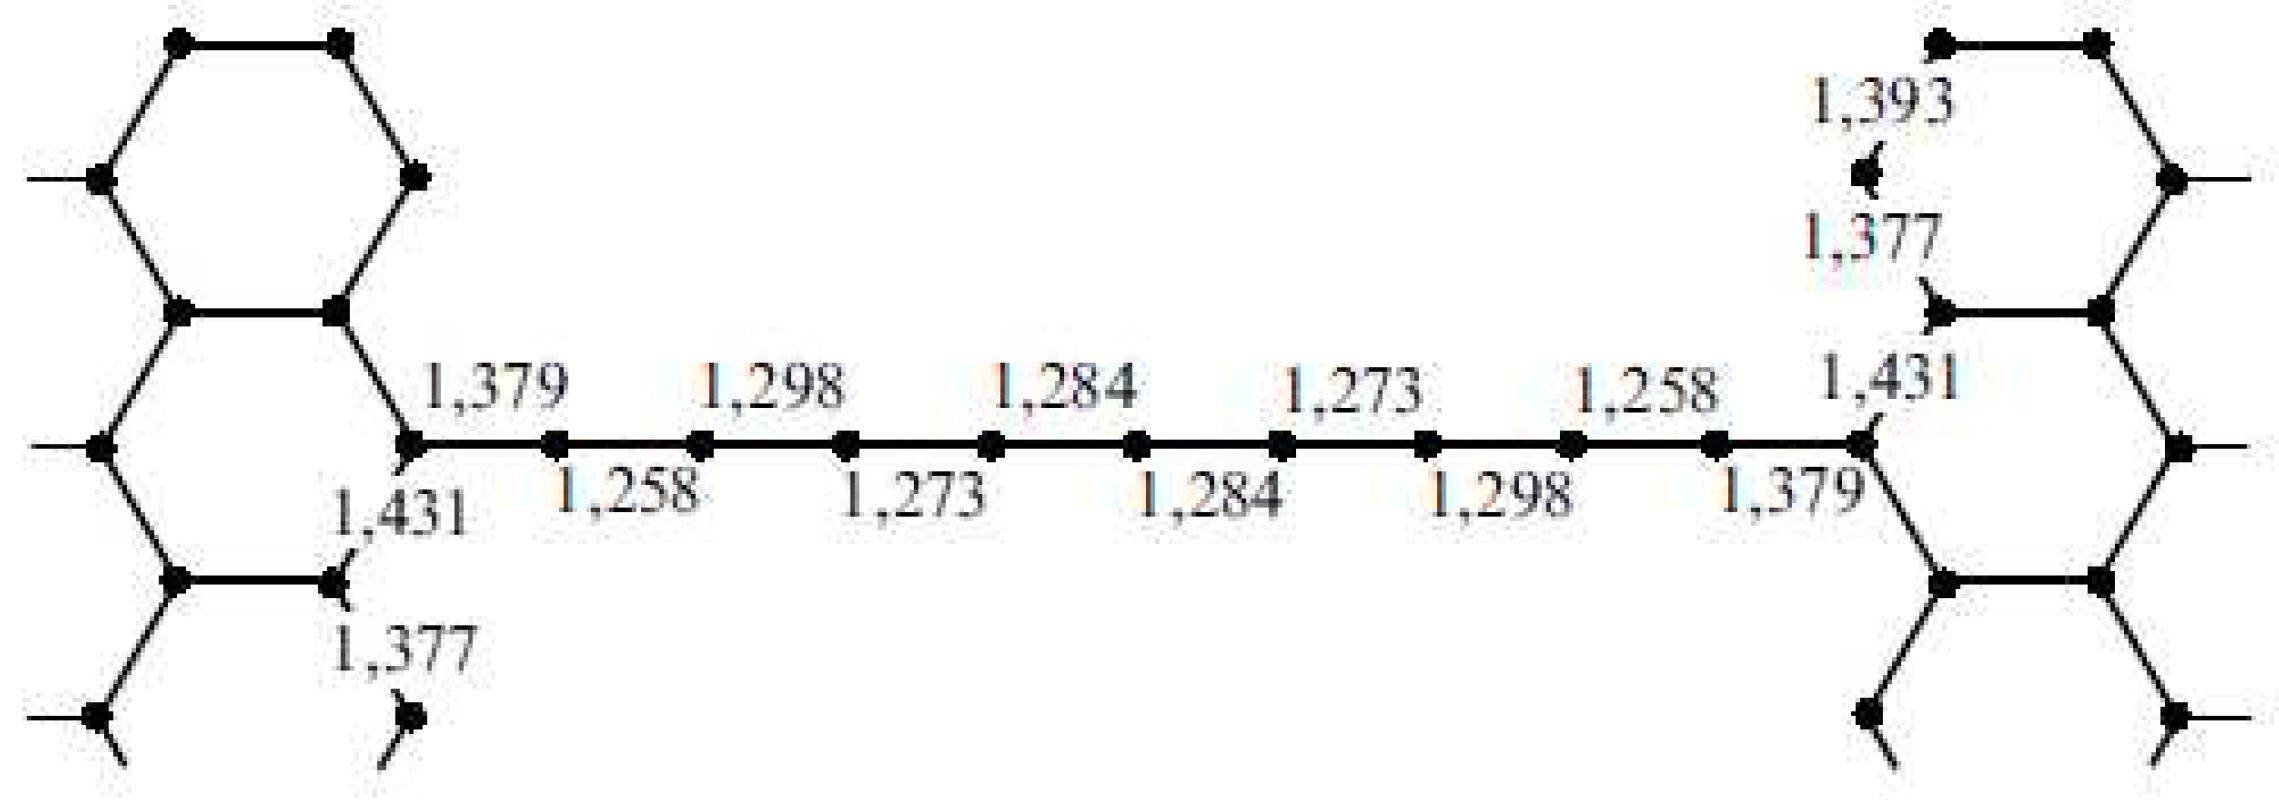
The quantum-chemistry calculations performed by using the density functional theory (DFT) point to a dependence of the bond length in such a chain on the coordinate. In particular, this dependence manifests itself in the structure shown in Figure 21, which presents two graphene planes connected by a carbon chain. An increase in the bond length as the chain end is approached is the reason for the electron beam-stimulated destruction of the carbon chain beginning from the edge region, not from its central section. The structure presented in the picture can be considered to be an illustration of a possible usage of carbon 1D chains as connecting elements in nanocircuits containing graphene sheets.

4. Carbon Nanoparticles Production Methods

4.1. Fullerenes

4.1.1. Electric Arc Synthesis

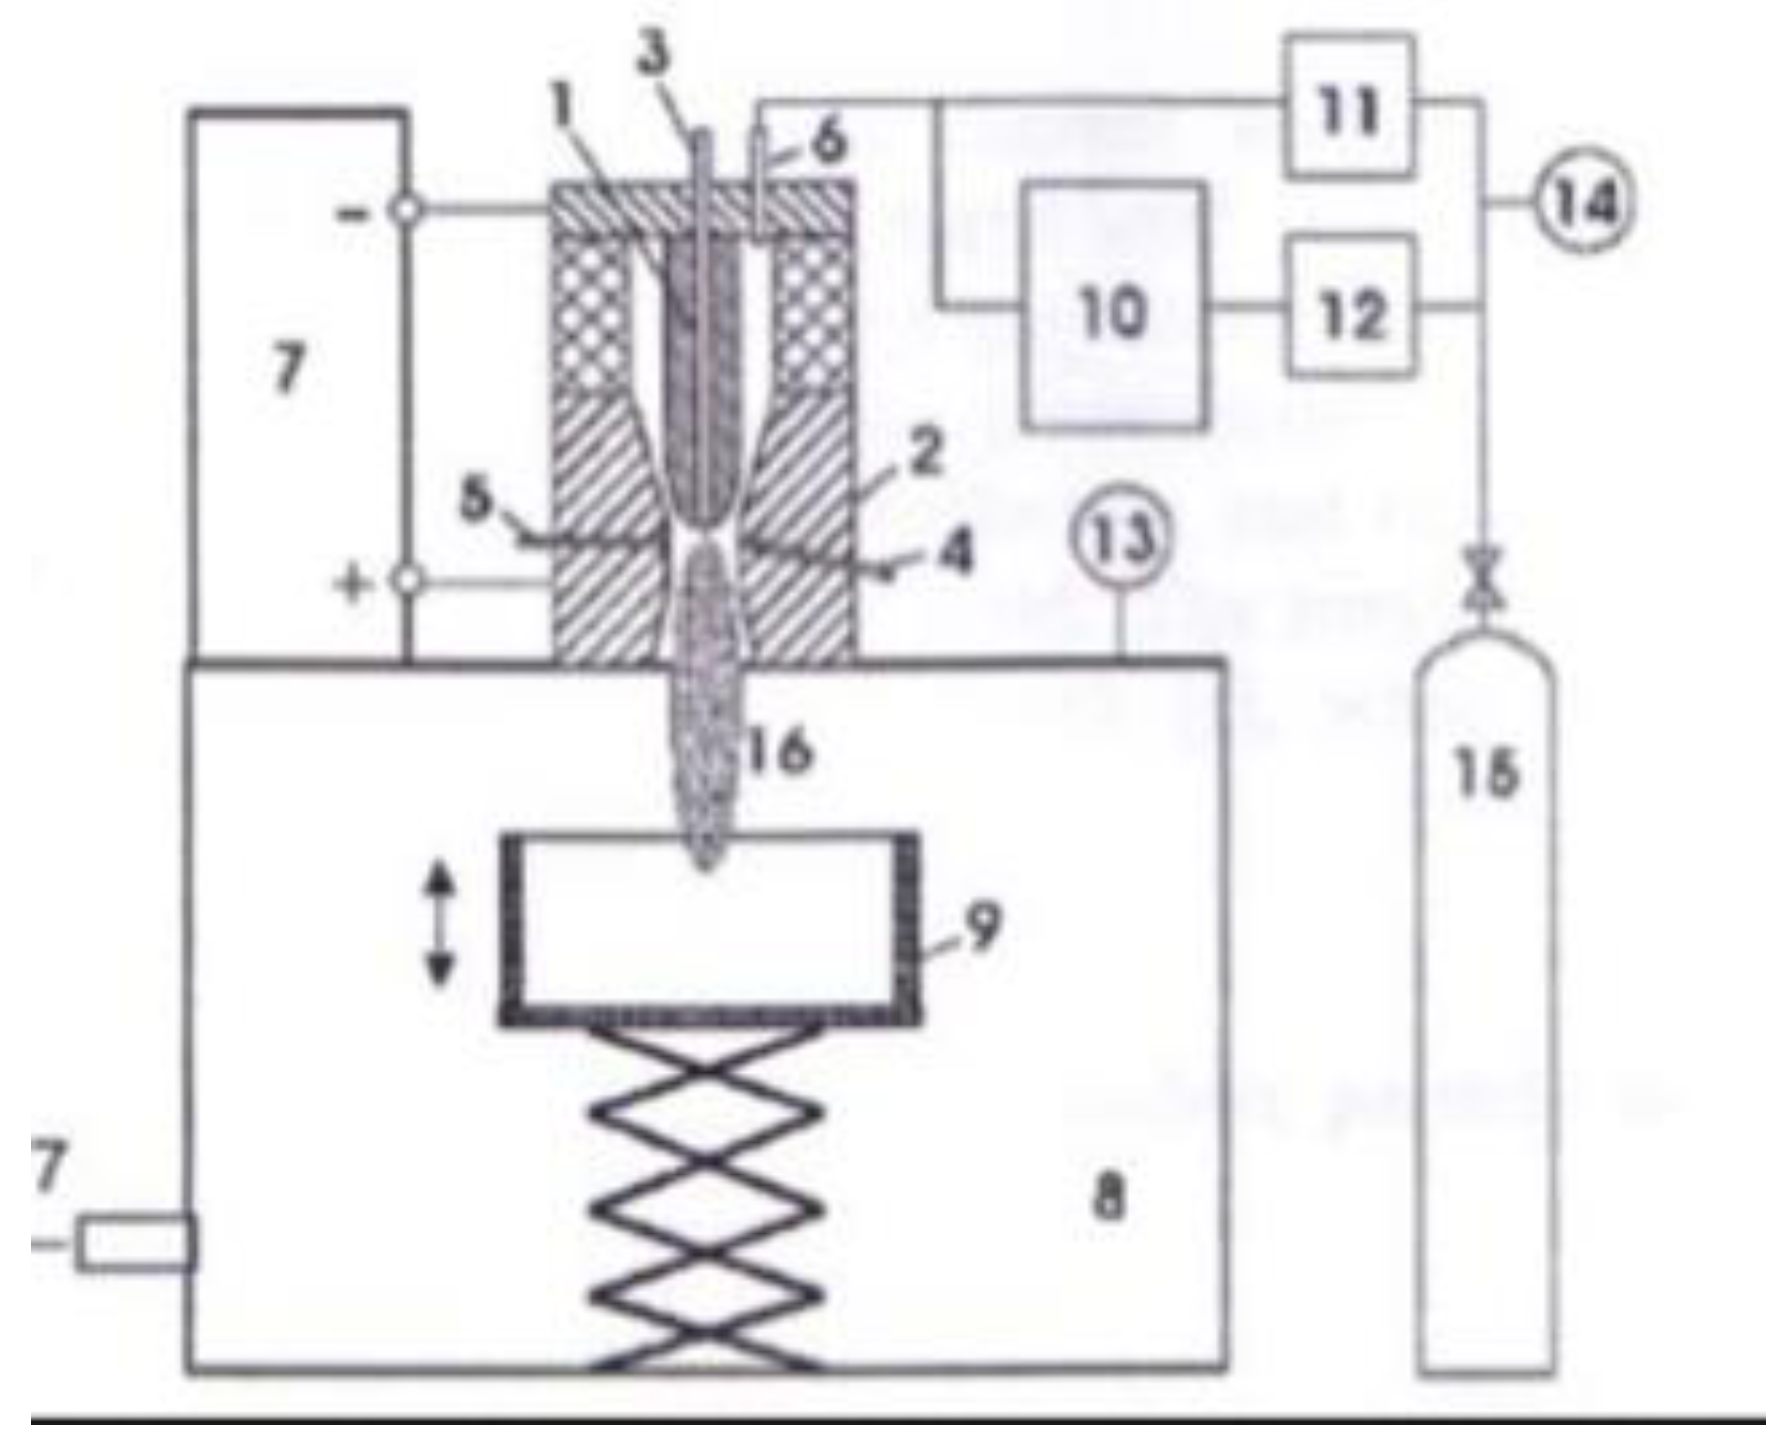
The main method of large scale fullerene production is based on the usage of the arc discharge with graphite electrodes. The discharge burns as a rule in an Ar atmosphere at a pressure of about 100 Tor. Figure 22 presents the schema of the facility used for fullerene production. This facility designed by W. Krätchmer et al. in the Max Plank Nuclear Physics Institute (Heidelberg, Germany) includes a gas discharge chamber with graphite electrodes. The chamber has usually water-cooled double walls. Arc burning at a current of the order of 100 – 200 А results in heating and thermal sputtering graphite anode. A gas discharge setup is equipped as a rule with a device for automatic stabilization of the inter-electrode distance which is changed in result of the thermal disruption of electrodes. At a stable inter-electrode distance the arc current is also stable. A soot forming due to graphite sputtering is deposited on the walls of the gas discharge chamber. This soot contains up to 10% fullerenes at the optimal conditions.

4.1.2. The Mechanism of Fullerenes Formation
The question arises on the mechanism of fullerenes formation in the electric arc. The contemporary literature contains many models, describing the self-organization of carbon atoms into a spheroidal structure
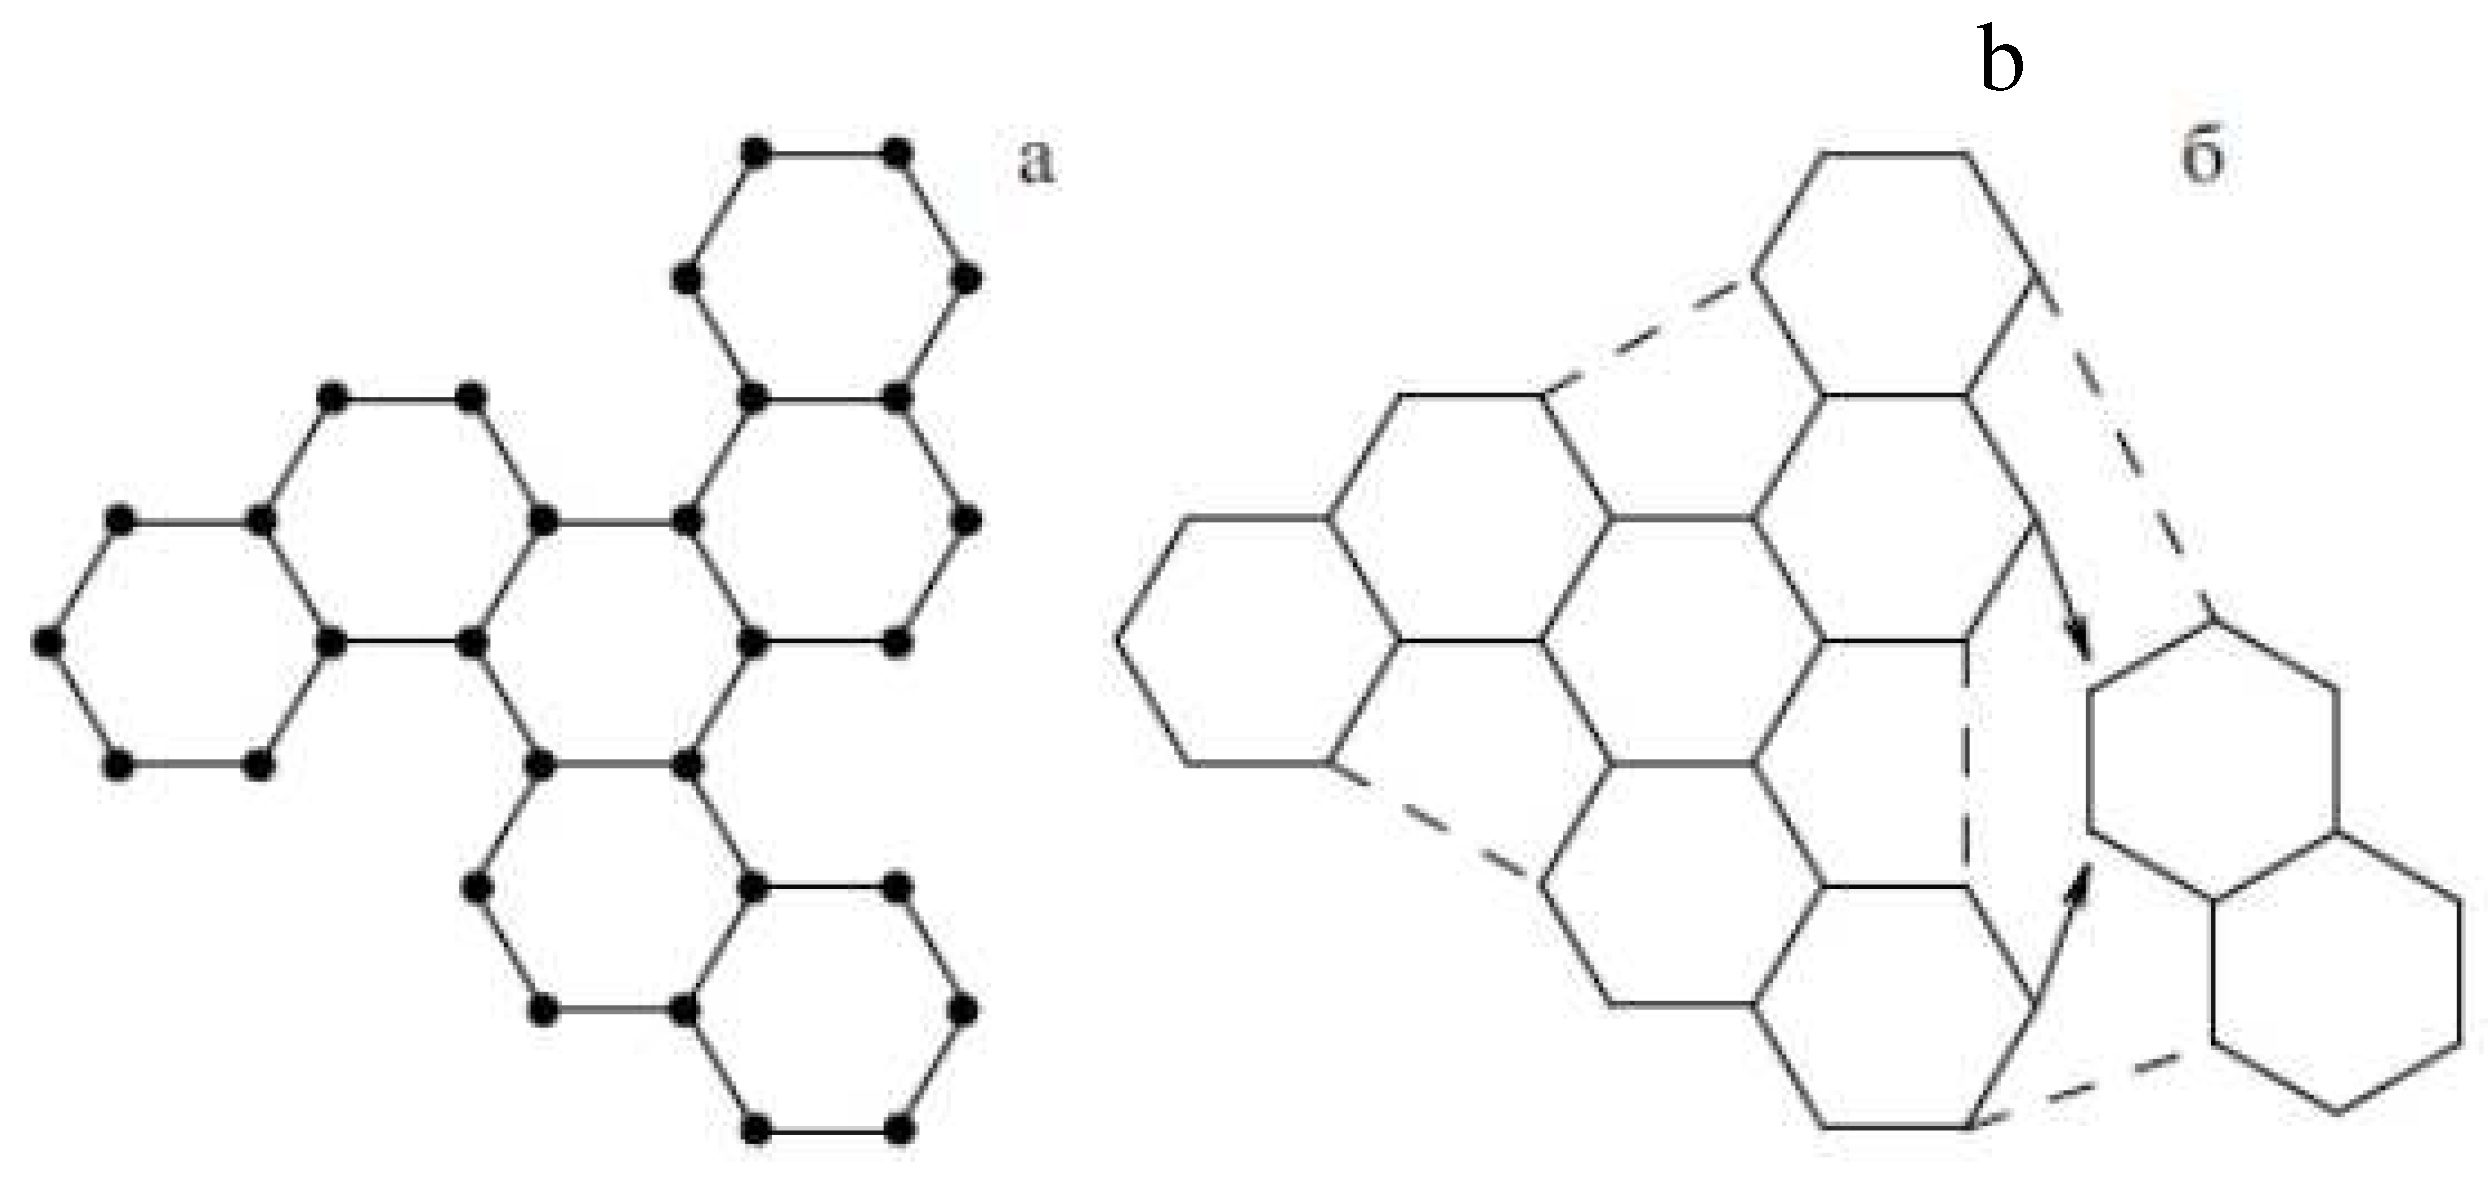
e, there is no a clear sketch of this phenomenon until now. One of approaches to the solution of this task has been proposed in Ref. [35] where fragments С10 are considered as a building element for formation of С60 molecule. This fragment presents a pair of joint hexagons. Figure 23 illustrates the mechanism of formation of the semisphere which is a half of fullerene C60 molecule.
Figure 23. A possible mechanism of assembling the fullerene С60 molecule from graphite fragments: a)the result of assembling three graphite fragments С10; (b)adding fragment C10 to the result of joining three such fragments which results in a closing the plane structure into a spheroidal one. The C60 molecule Мoлекула С60 is resulted at adding more two С10 fragments to this structure [35].
Preprints 89513 g022

4.1.3. Extraction of Fullerenes from Soot

The procedure of extaction of fullerenes from soot is based on the fullerenes is the only soluble modification of carbon. Such compounds as benzene, toluene, xylene, CS2 and others can be used as solvents. Washing the soot containing fullerenes with a solvent results in the extraction of fullerenes. The fullerene solution is directed into an evaporator where in result of the thermal vaporization of the solvent the solution becomes to be oversaturated. Ths is accompanied by formation and growth of fullerite crystals which is a crystalline fullerene form. For the purpose of saving the solvent and execution of a contineous process of fullerene extraction the solvent vapor is directed to a freezer where it condences forming a liquid solvent which is used further for extracting fullerenes from the soot. Such e facility performing contineous extraction of a soluble substance with the usage of a limited quantity of a solvent is called as SOXHLET.

4.1.4. Liquid Chromatography and Separation of Fullerenes
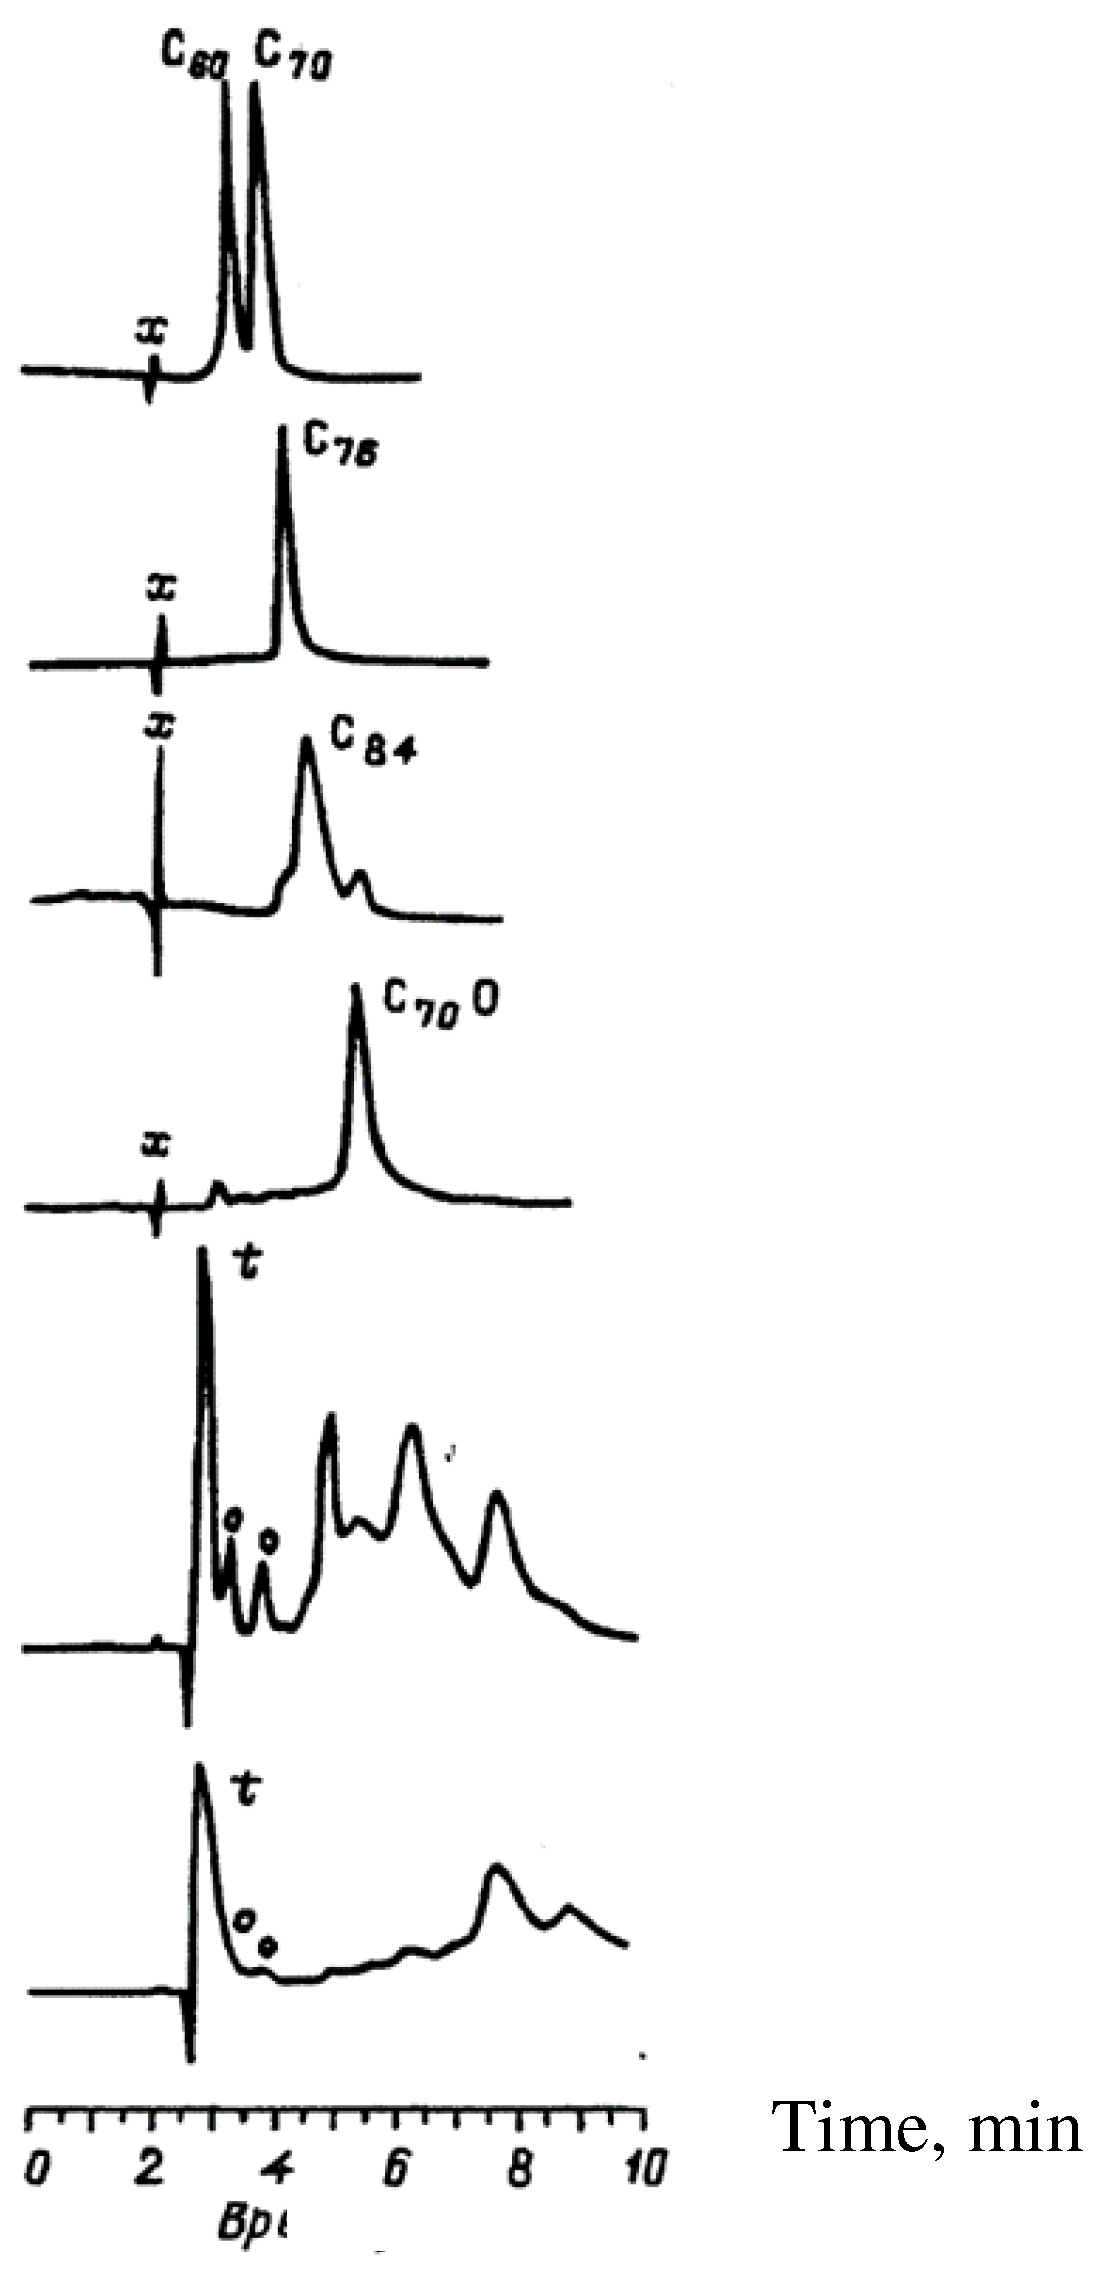
The soot forming at thermal sputtering of graphite in the arc discharge contans fullerene molecules of different sort. The main fullerene content (about 90%) relates to fullerene С60 molecules, the content of С70 accounts several percent and the quarter of higher fullerenes does not exceed usually 1 %. The separation of fullerenes by sorts is performed using liquid chromatography method which is based on distinctions in the sorption ability of some sorbents in relation to fullerene molecules of various sorts. According to this method illustrated on Figure 24, a solution containing fullerene molecules of different sort is passed through a sorbent in pores of which molecules are sorbed. If a pure solvent is passed through such a sorbent, fullerene molecules of various sorts will be extracted rom the sorbent with a different rate: firstly С60 is extracted, then С70 afterwords higher fullerenes. Portions of the solution obtained on different stages of the extraction process are directed to various containers so that one can to get solutions containing presumably fullerene molecules of a specific sort. The degree of enrichment of the material relating to a specified fullerene molecule sort can be enhanced in result of multiple repeating the extraction procedure.
Figure 24. Illustration of the fullerene separation procedure by the liquid chromatogtaphy method. Passage a pure solvent through the sorbent containing fullerene molecules of different sort results in extraction of fullerenes from the sorbent, so that the rates of extraction of fullerenet of different sort are distinquished.
Preprints 89513 g023

4.1.5. Synthesis of Endohedral Fullerenes

Research efforts addressed to extention of the class of molecules with fullerene structure were resulted in the discovery of endohedral compounds. An endohedral molecule can be produced by two ways. The first way is based on creation of such conditions when already in the synthesis process some part of molecules is filled with atoms or molecules of elements presenting in the synthesis region. In this case there is used usually as an initial material graphite doped with finely dispersed powder of the element to be inserted. Thermal sputtering of graphite under the action of an external energy sourse is accompanied also with the atomization of the doped material. This promotes further formation of endohedral fullerenes.
The second way of endohedral fulleenes synthesis is based on inserting atoms or molecules into the cage of already prepared fullerene molecules. If the incapsulated atoms or molecules are found in a gas state at the normal conditions such inserting can be performed simply by keeping fullerenes in an atmosphere of this gas at elevated temperatures and pressures. Heating promotes the enlargement of “windows” in fullerene molecule while the enhanced pressure facilitates the penetration of particles inside the cage. If the substance to be inserted into the fullerene cage is condensed one, this is performed in result of irradiation of fullerene crystal or film with atoms or ions of the element axelerated up to the energy sufficient for the penetration of the particle inside the cage.
At the synthesis of endohedral fullerenes by the electrical arc method the crystalline graphite with a small addition of powdered metal or metal compound (oxide, carbide) is used. The most spread approach to the realization of this idea is based on the usage of a graphite rod with a hole drilled from the end which is filled with a mixture of amorphous finely dispersed powder of metal or its oxide or carbide. The content of metal in the anode material does not exceed usually several percent. Such an approach has demonstrated its effectiveness in particularly at the synthesis of endohedral metallofullerenes M@C82 (M = Sc, Y, La) [36]. Endohedral metallofullerene molecules Sc3@C82 filled with three scandium atoms were synthesized in an arc discharge with composite electrodes fabricated as a result of vacuum sintering the mineral Sc2O3 (2.5 g) with graphite powder (4.3 g). The arc was burned in a He atmosphere at a pressure of 50-100 Tor Не and a current of 500 А [37].
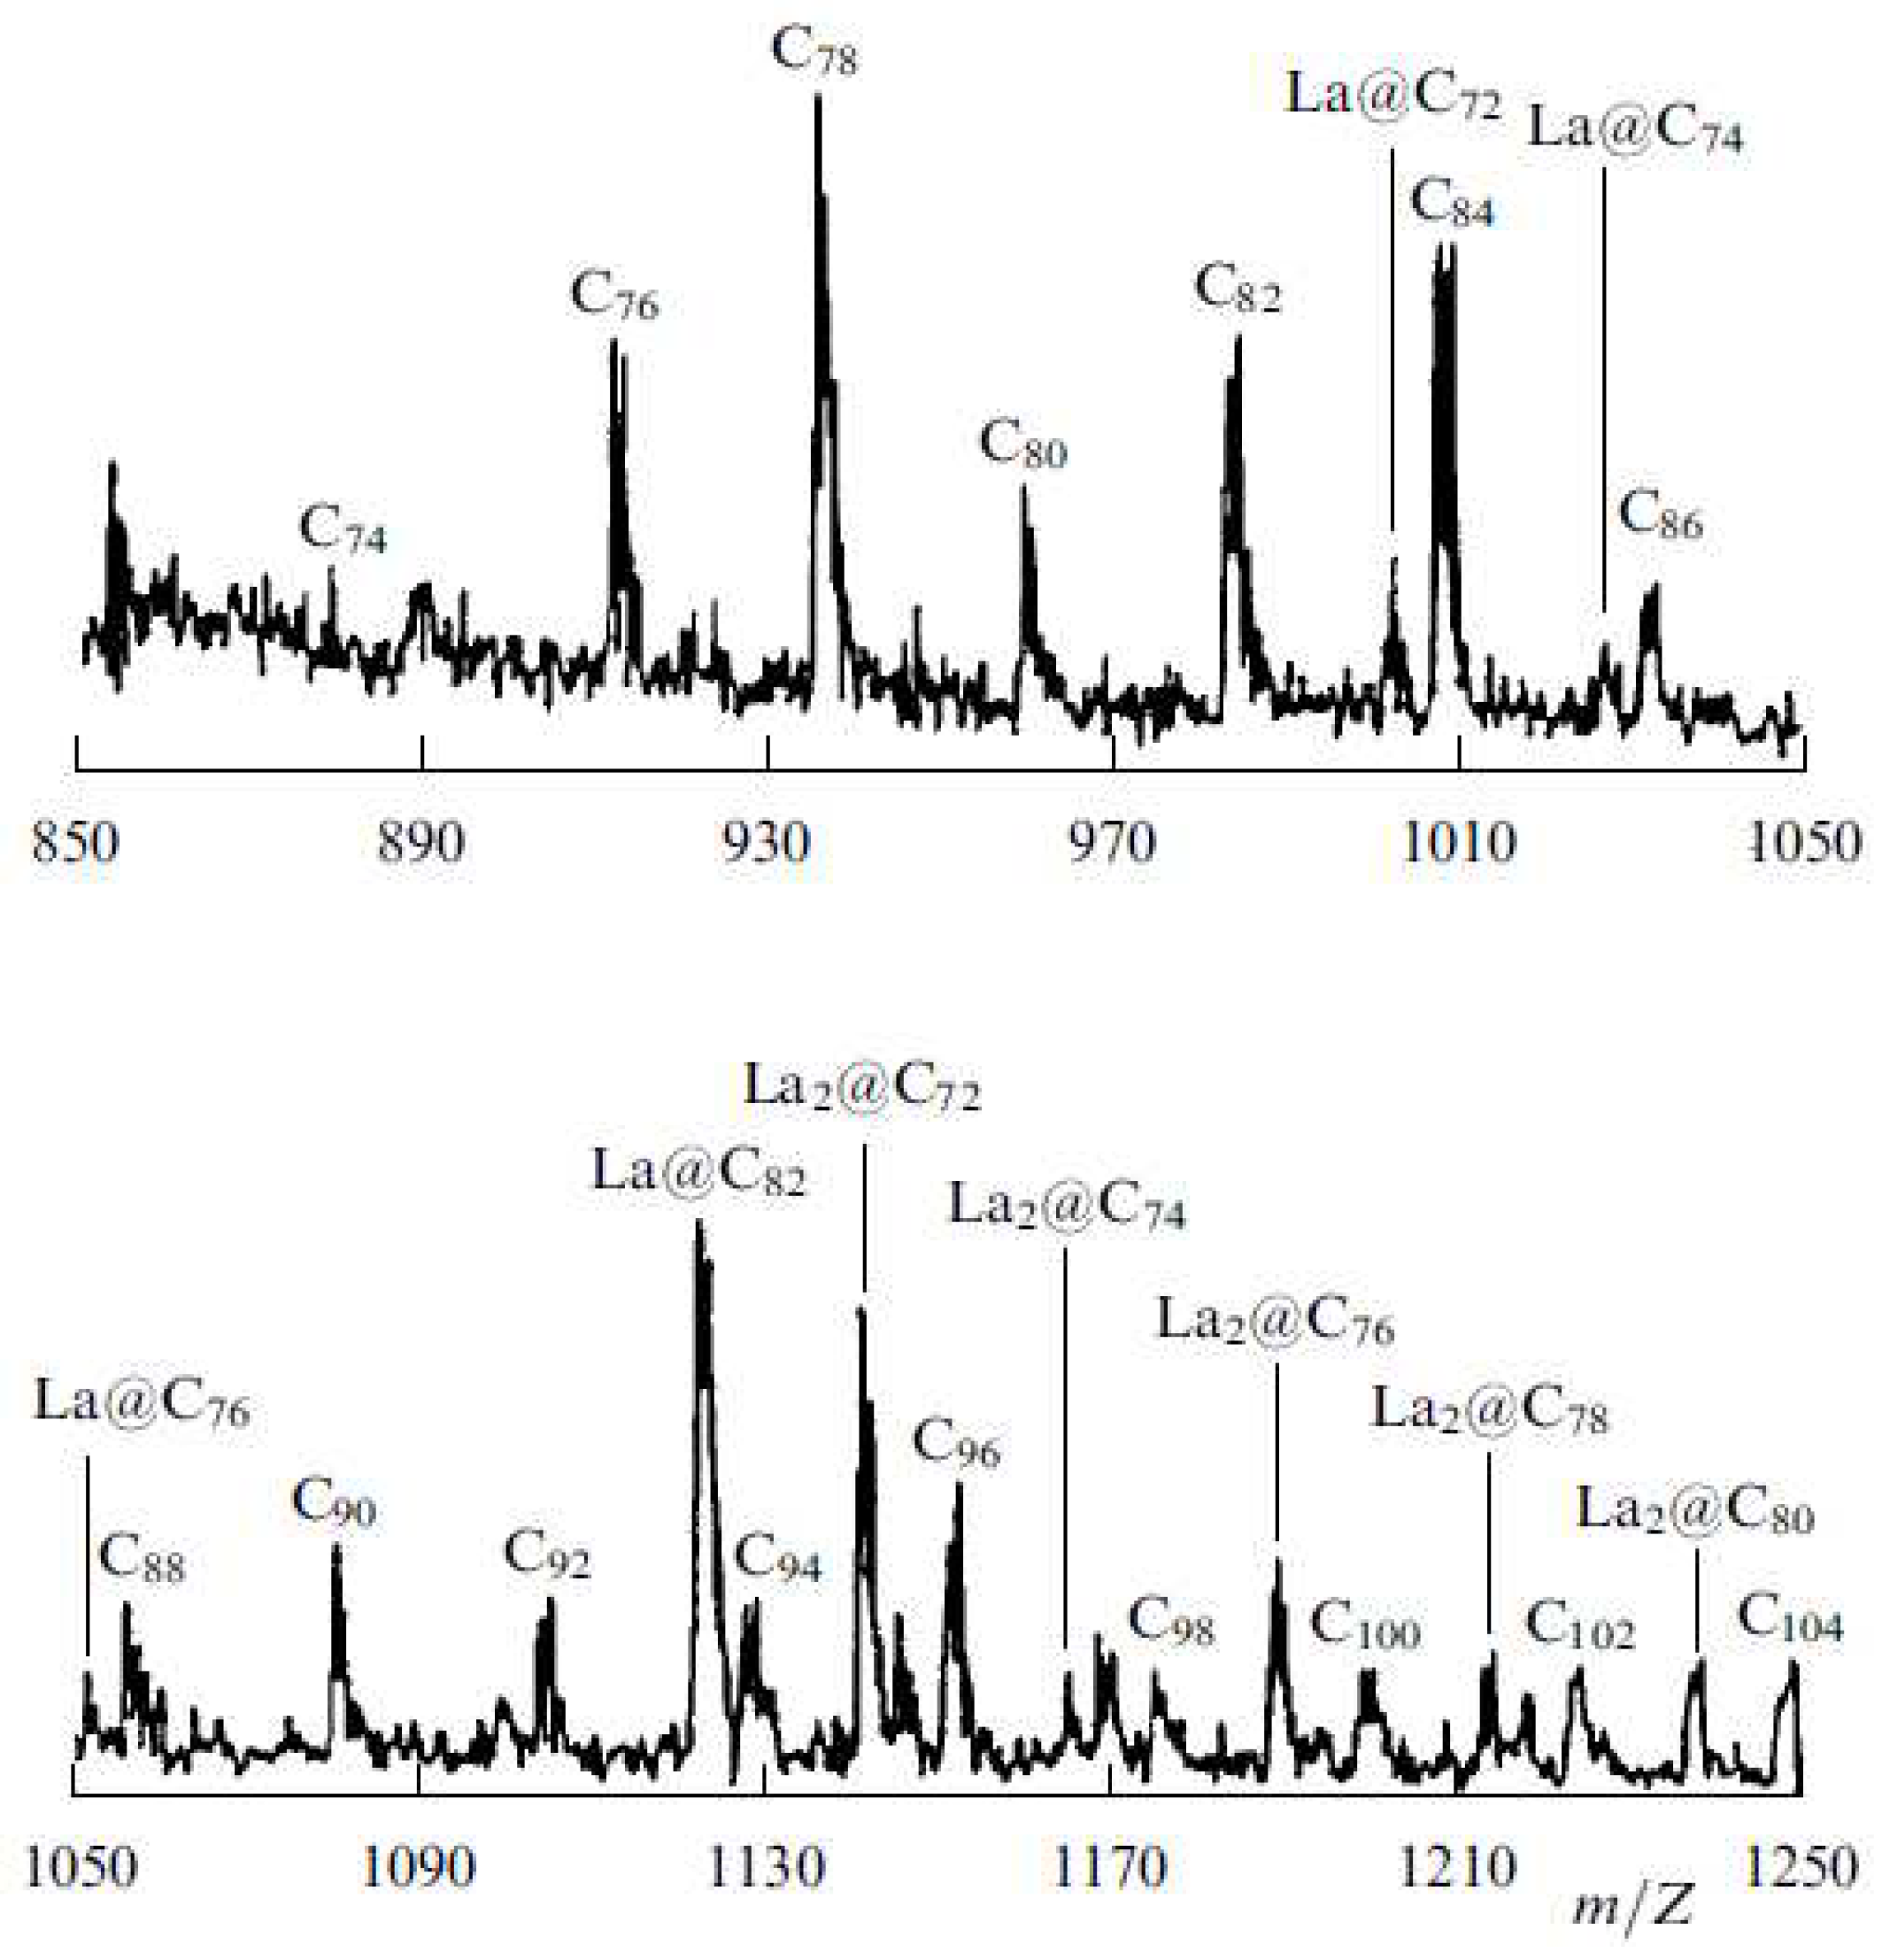
A distinctive peculiarity of the electrical arc method of production of fullerene containing soot is in an extraordinary rich content of the soot, containing fullerene molecules of various sorts. At inserting some quantity of a metal powder into the anode material this manifold expands even more due to occurrence of endohedral fullerenes. Some notion on the abundance of the spectrum of fullerenes formed in an electrical arc plasma with graphite electrodes can be formed on the basis of the results of mass-spectrometry measurements of the content of the soluble extract of the soot obtained at a thermal sputtering of a graphite rod filled with lanthanum oxide La2O3 [38]. The content of metal in the rod material accounted 0.5 - 5 atom %. The arc burned in a He atmosphere (180-220 Tor) at a current of 95-115 А and a voltage of 20-25 V. Enhancement of the metal content in the anode material was accompanied with a rise of quote La2@C72 between other endohedrals. Figure 25 presents the mass-spectrum of the soot extract obtained with aim of the time flight mass-spectrometer with laser desorption [38]. One should not an extraordinary richness of the spectrum containing both hollow fullerenes Сn n=74, 76, 78, 80, 84, 84, 86…, 104 and endohedral fullerenes Lam@Cn (m=1, 2; n=72, 74, 76, 78, 80, 82). Note also the absence of fullerene С72 at the existence of the endohedral compound La2@C72. This indicates that the metal atom inserted into the fullerene cage acts positively on the stability of the fullerene cage.
A majority of known metal containing endohedral compounds has been produced by means of the electrical arc method. In particular one should be mentioned those containing rare earth atoms (La, Y, Sc etc). Note that the yield of endohedral metallofullerenes at the electrical arc synthesis is extraordinary low. Preparation of pure samples requires for a multiple execution of the liquid chromatography procedure. This is reflected on the selling price of the material which can reach the magnitude of the order of $1000/mg.

4.1.6. Threemetasphera

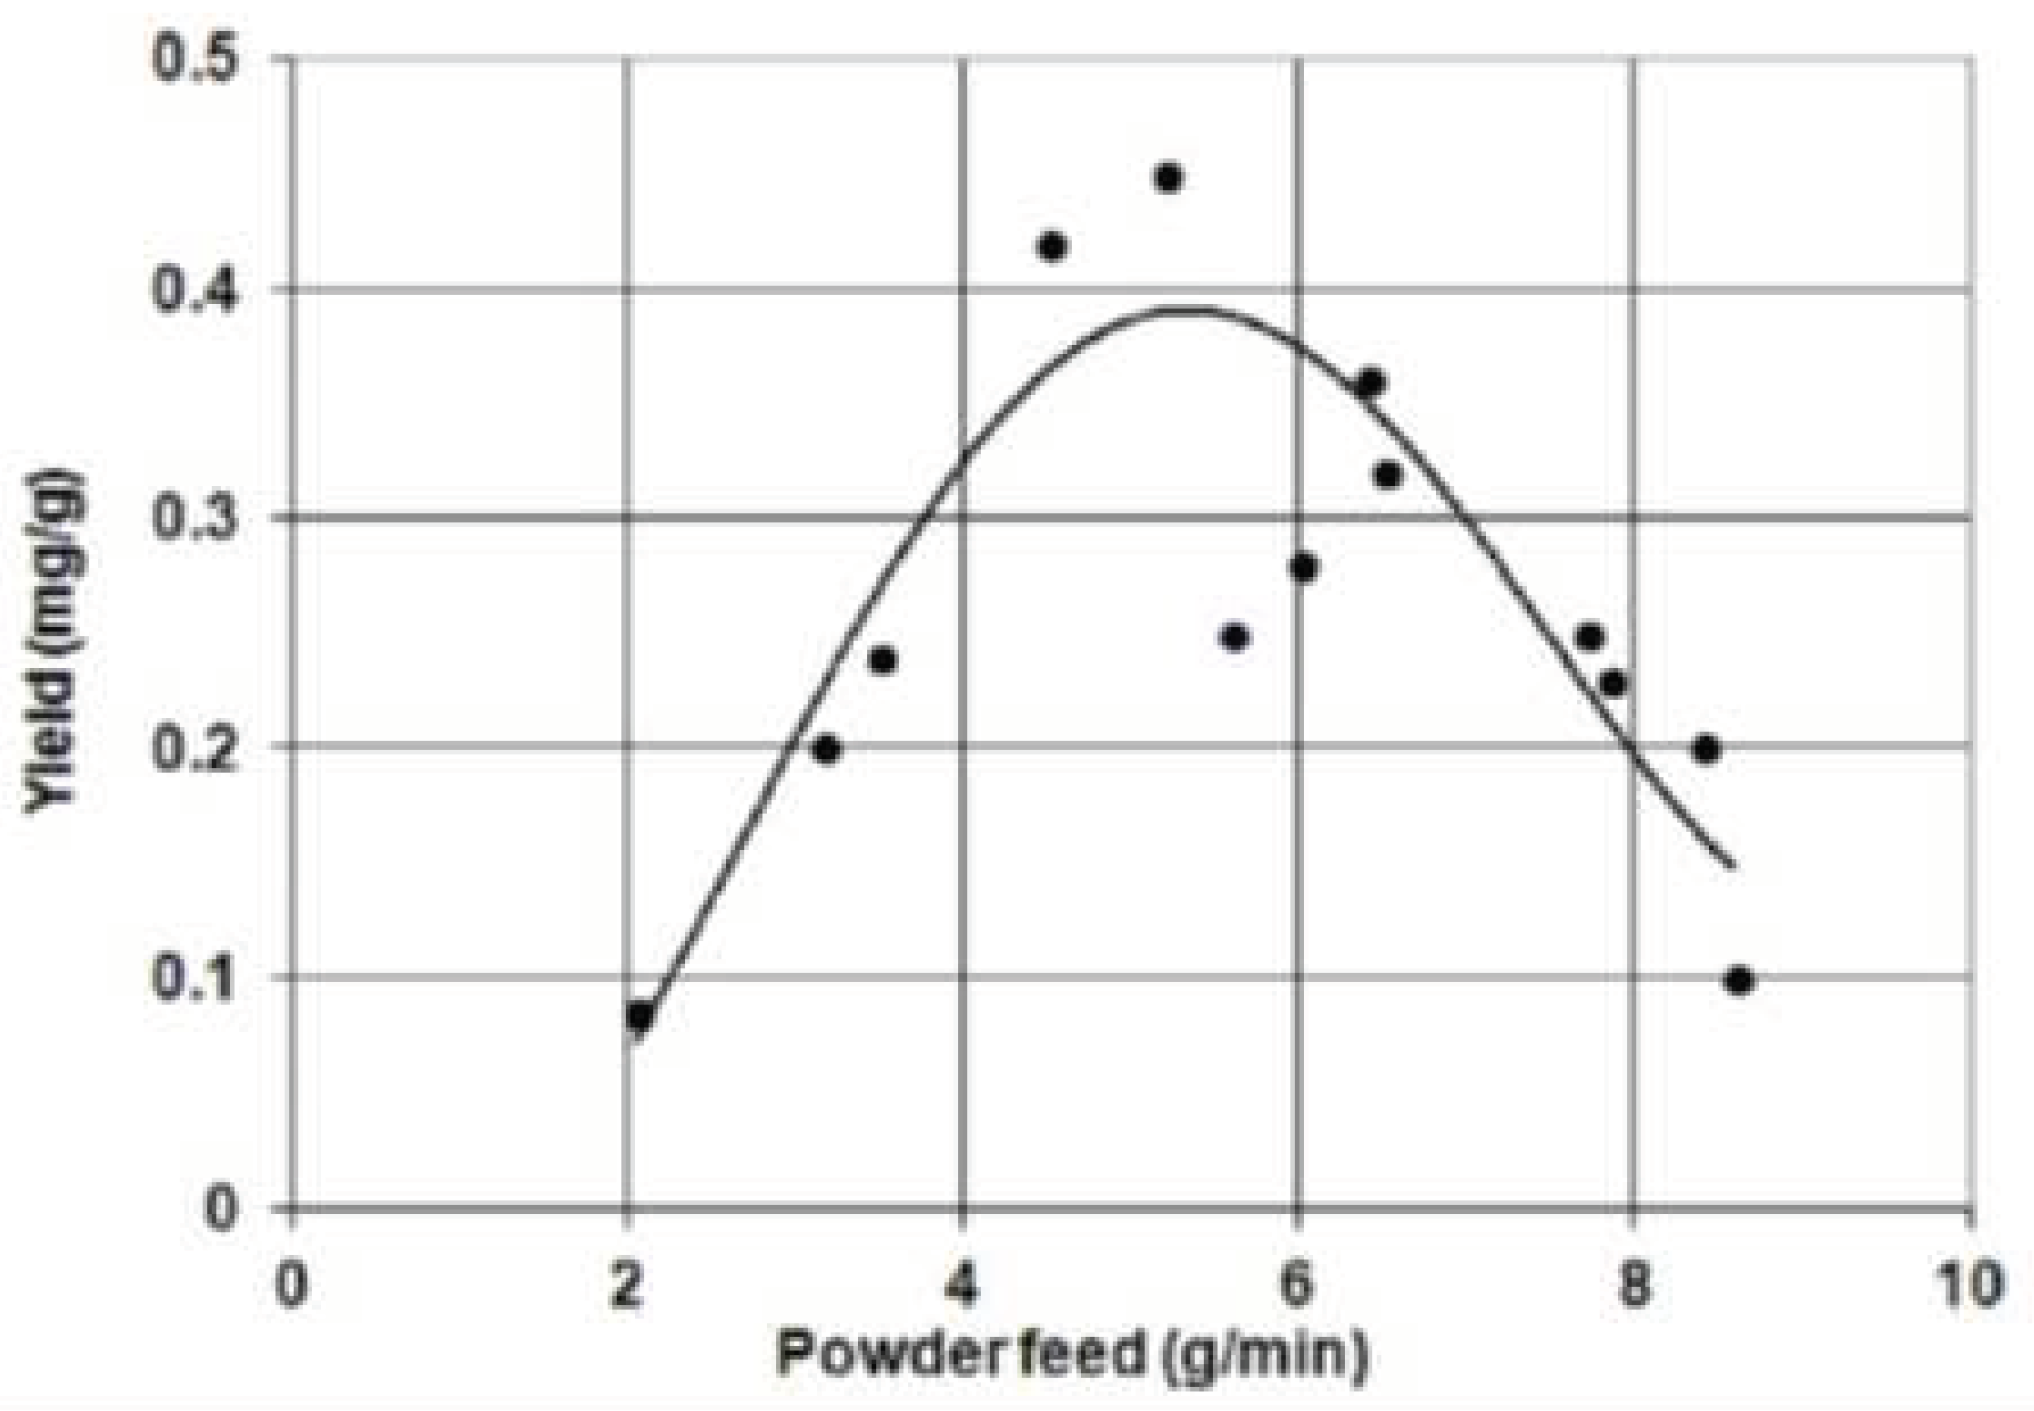
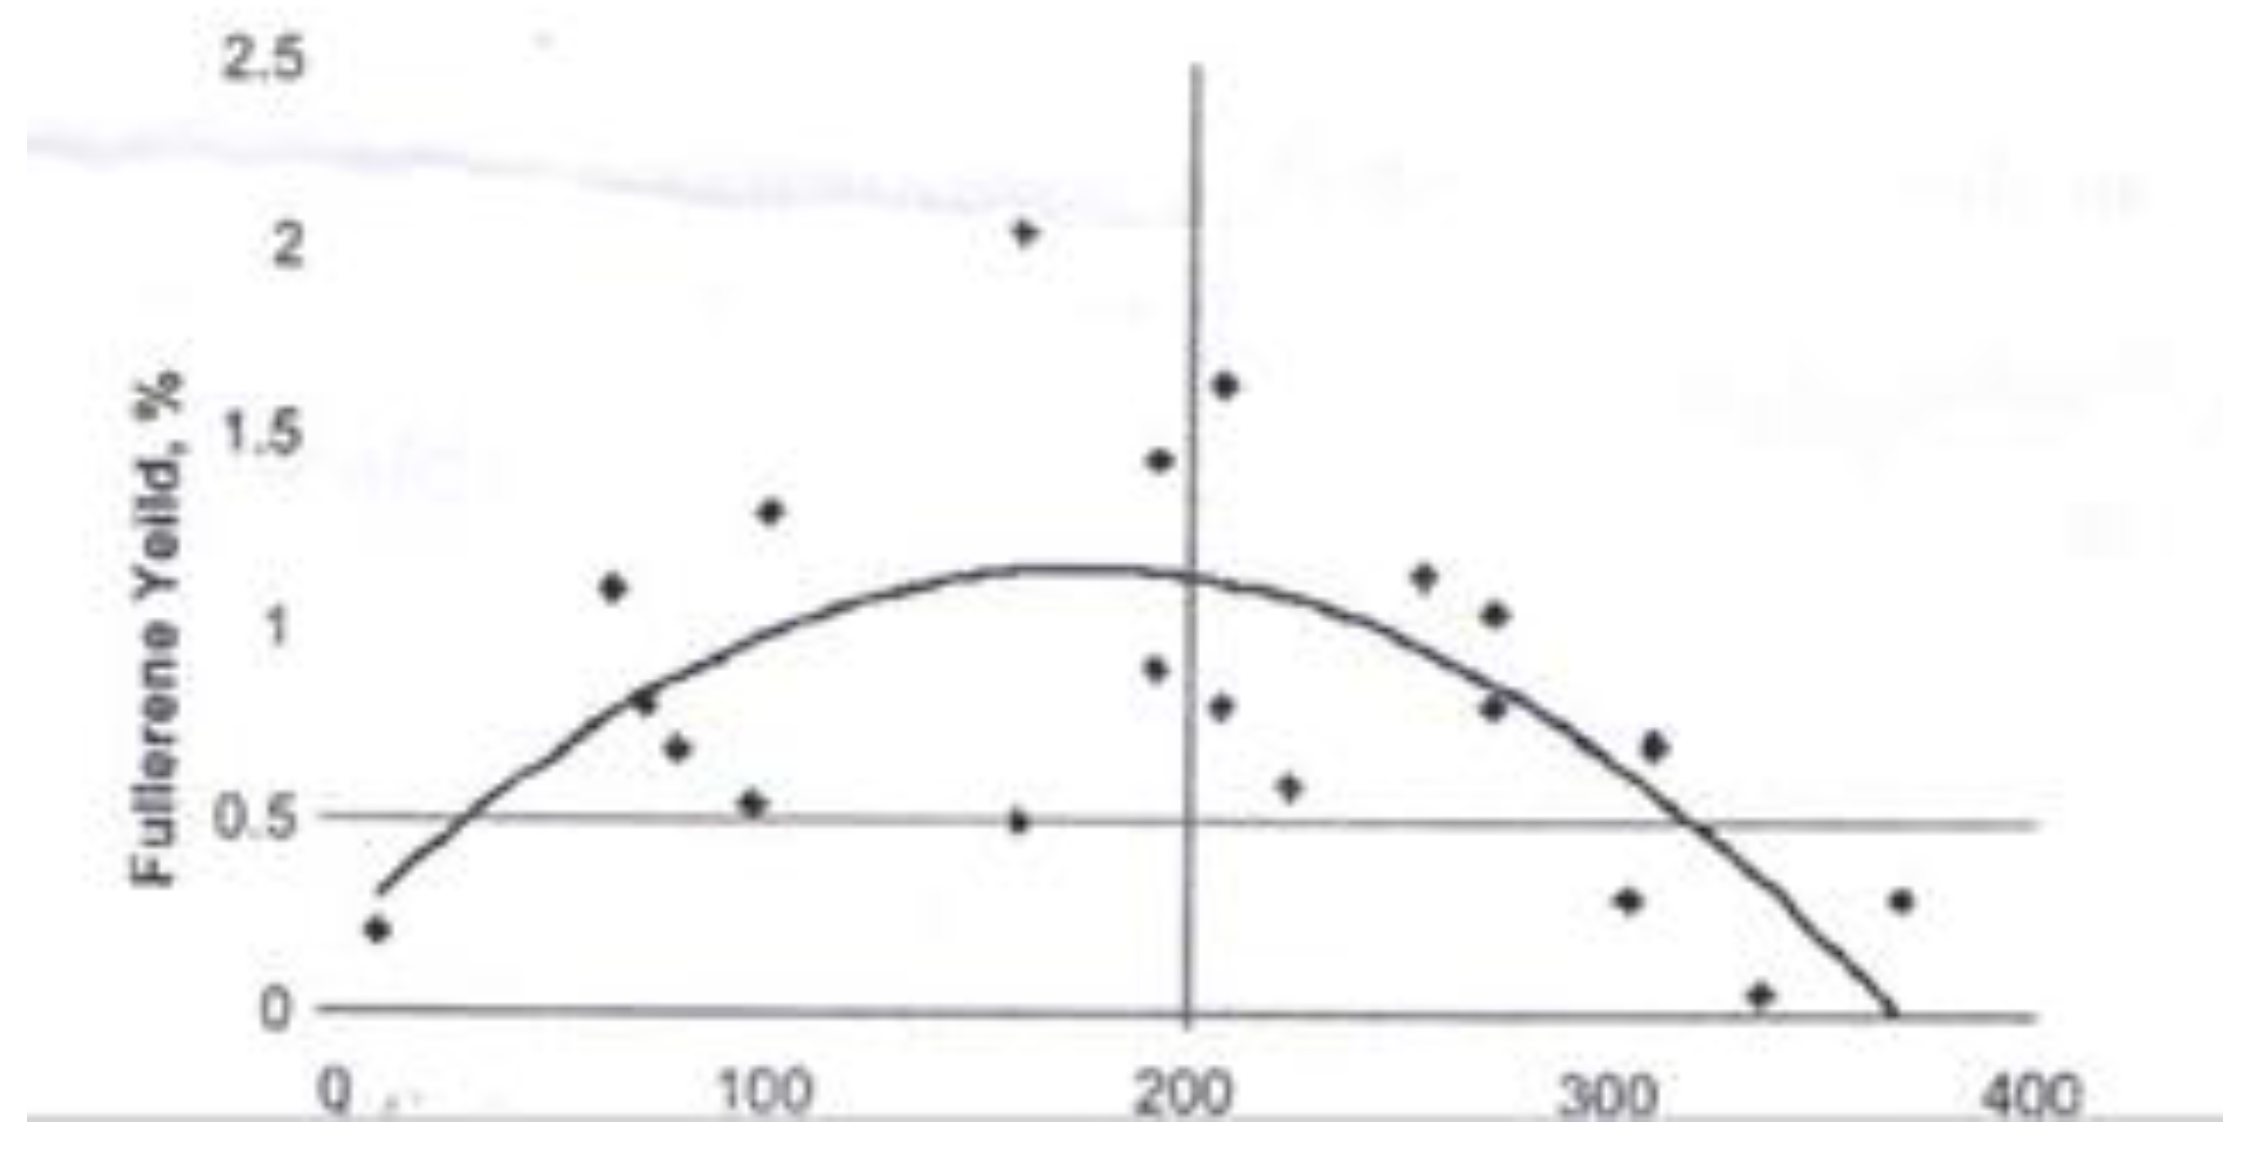
The discovery of a new structural form [27] described by the formula A3-хBxN@C2y, where x is an integer between 0 and 3, A and B are the metal atoms such as Ga, Lu, Ho etc. and y is equal to 34 or 39–44, became a notable step on the road of enhancement of the metallofullerenes production scale. Such a structure called as “threemetasphere“ demonstrates an enhanced stability and can be synthesized with a relatively high yield. As an example can be considered the work [39] where it was stated that the usage as a buffer gas of nitrogen instead of the much more expensive helium decreases considerably the production cost of the process keeping the productivity on a stable level. Along to the traditional way of inserting a metal into the high temperature arc region, based on the filling a graphite rod with the metal powder the author [39] injected the finely dispersed powder Lu2O3 into the plasma region. This resulted in a notable enhancement of the purpose material (Lu3N@C82). Figure 26 presents the dependence of the yield of this substance from the rate of the powder supply.

4.1.7. Synthesis of Fullerenes in a Plasmatron from Dispersed Amorphous Carbon

The main initial material used at the fullerene production is crystalline graphite. Thermal sputtering of the graphite rod (anode) in the arc discharge results in formation of the soot containing some quantity of fullerenes. As is known, for production of graphite powdered amorphous carbon is sintered at elevated temperature and pressure. In this connection a question appears: Is it possible to produce fullerenes from amorphous carbon directly, bypassing the stages of powder sintering and subsequent sputtering od graphite crystal? It appears that such an approach permits one to decrease considerably the production cost of fullerenes because firstly the stage of graphite production is excluded and secondly the energy expenses for sputtering graphite material are eliminated. This approach has been realized firstly in Ref. [40]. Figure 27 presents the schema of the experimental setup. The cathode was fabricated from W, while the anode was produced from Cu. As a buffer gas was used Ar pumped with a rate of 18 - 20 l/min. The amorphous carbon powder had a specific surface 80 m2/g which corresponds to the particle size of the order of 10 nm. The plasma was generated in a gap of 1 – 3 mm in width by a power supply of 12 kW in a power. The soot formed in result of interaction of amorphous carbon with the plasma was deposited onto a collector. Figure 28 presents the dependence of the fullerene content in the soot on the rate of pumping the amorphous carbon powder. A relatively low fullerene yield is explained by that the operation regime of the plasmatron was far from the optimum.
The above-described approach to the plasma synthesis of carbon nanostructures without the usage of crystalline graphite has received a further development in works performed by a group from High Temperatures Institute RAS (see [41,42] and publications cited there). In these works was used a CW plasmatron with expanded anode channel of up to 40 kW in the power. As a carbon source were used doth amorphous carbon powder and such gases as ethanol, propane, butane, methane, and acetylene. Carbon nanostructures were synthesized at a pressure of 77-740 Tor, various geometries of the gas passage way, and different gas flows.

4.2. Carbon Nanotubes

4.2.1. Electrical Arc Synthesis

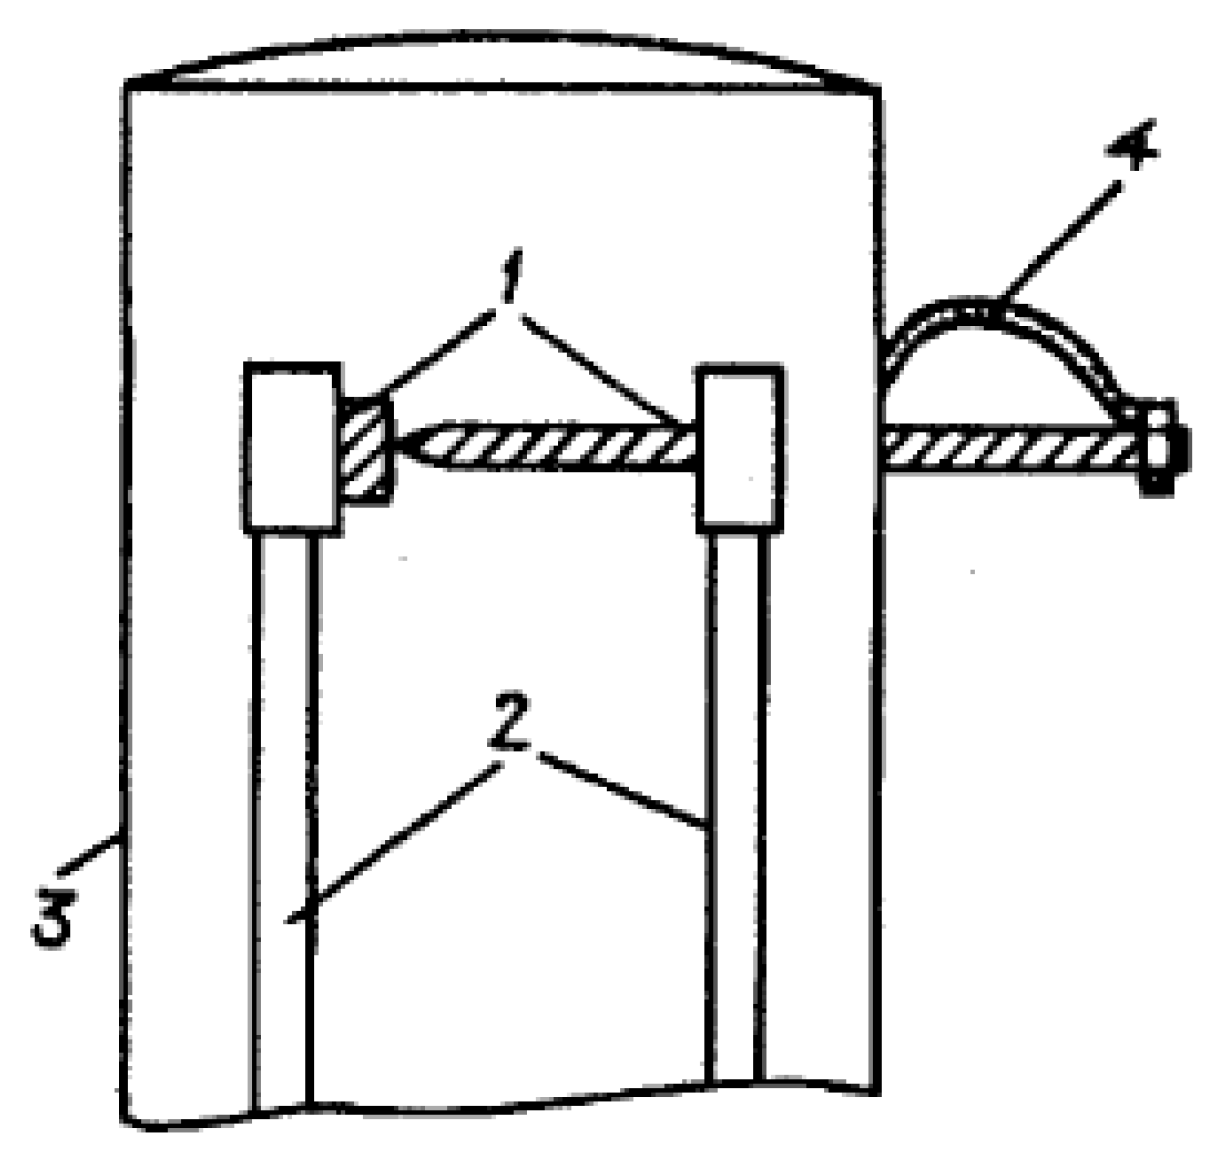
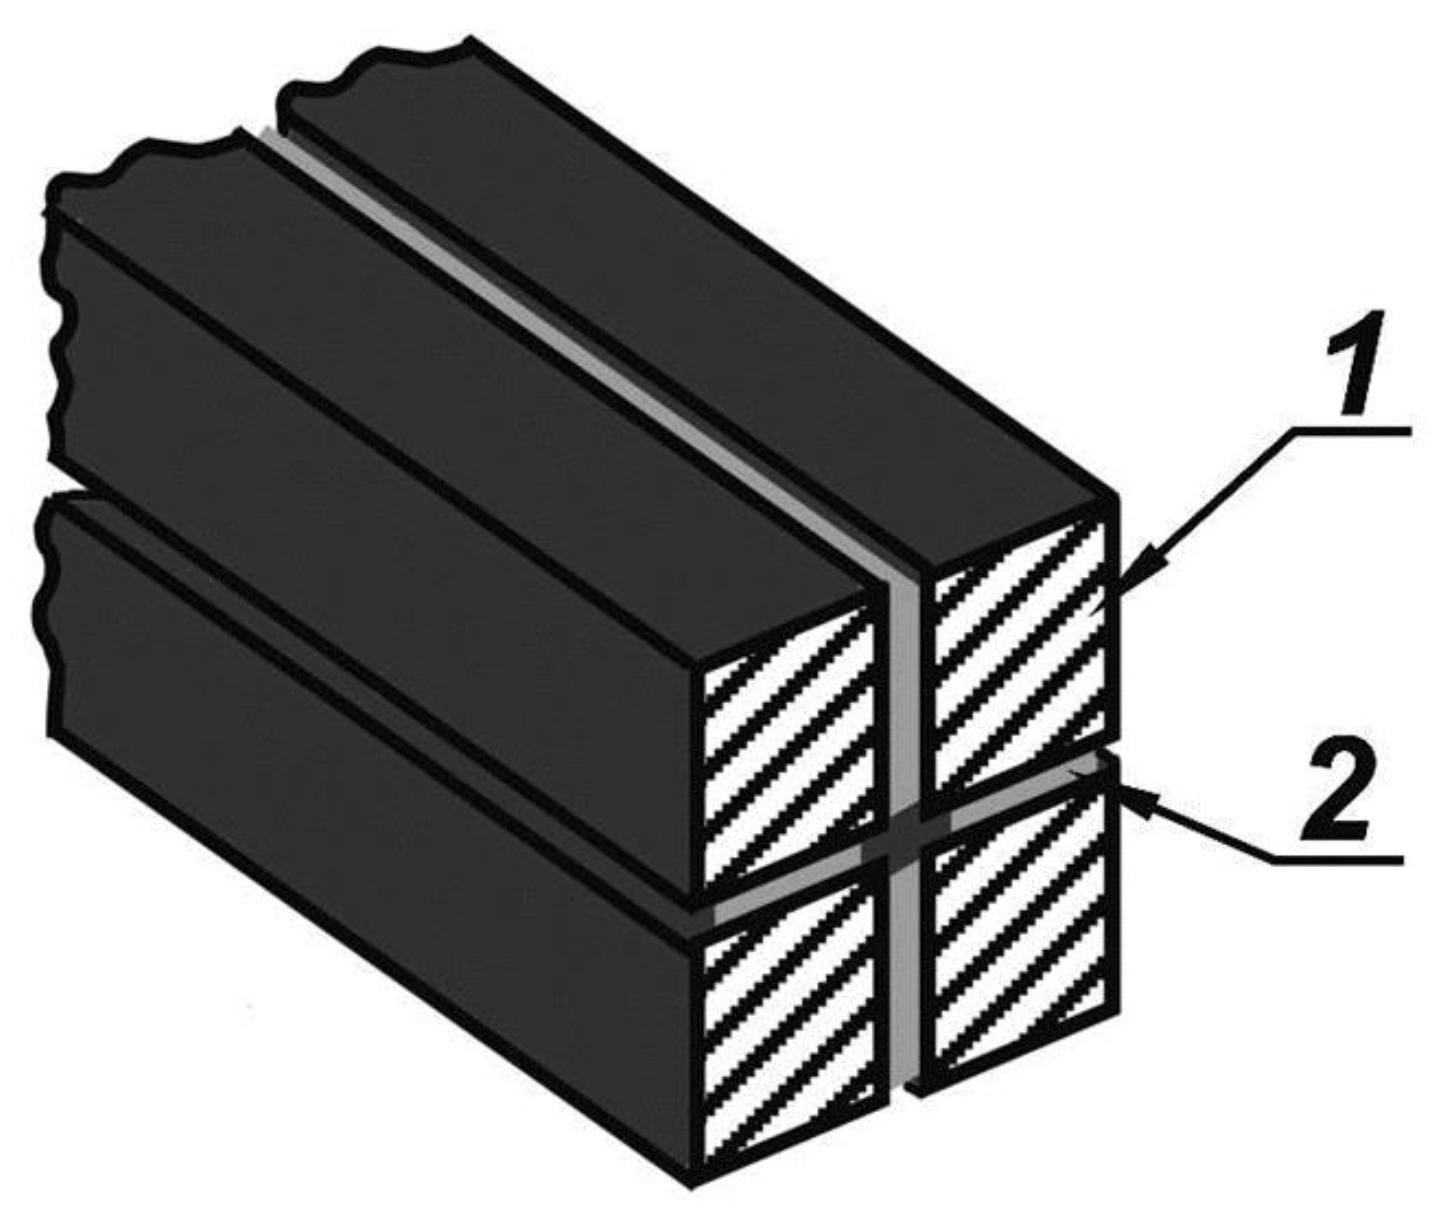
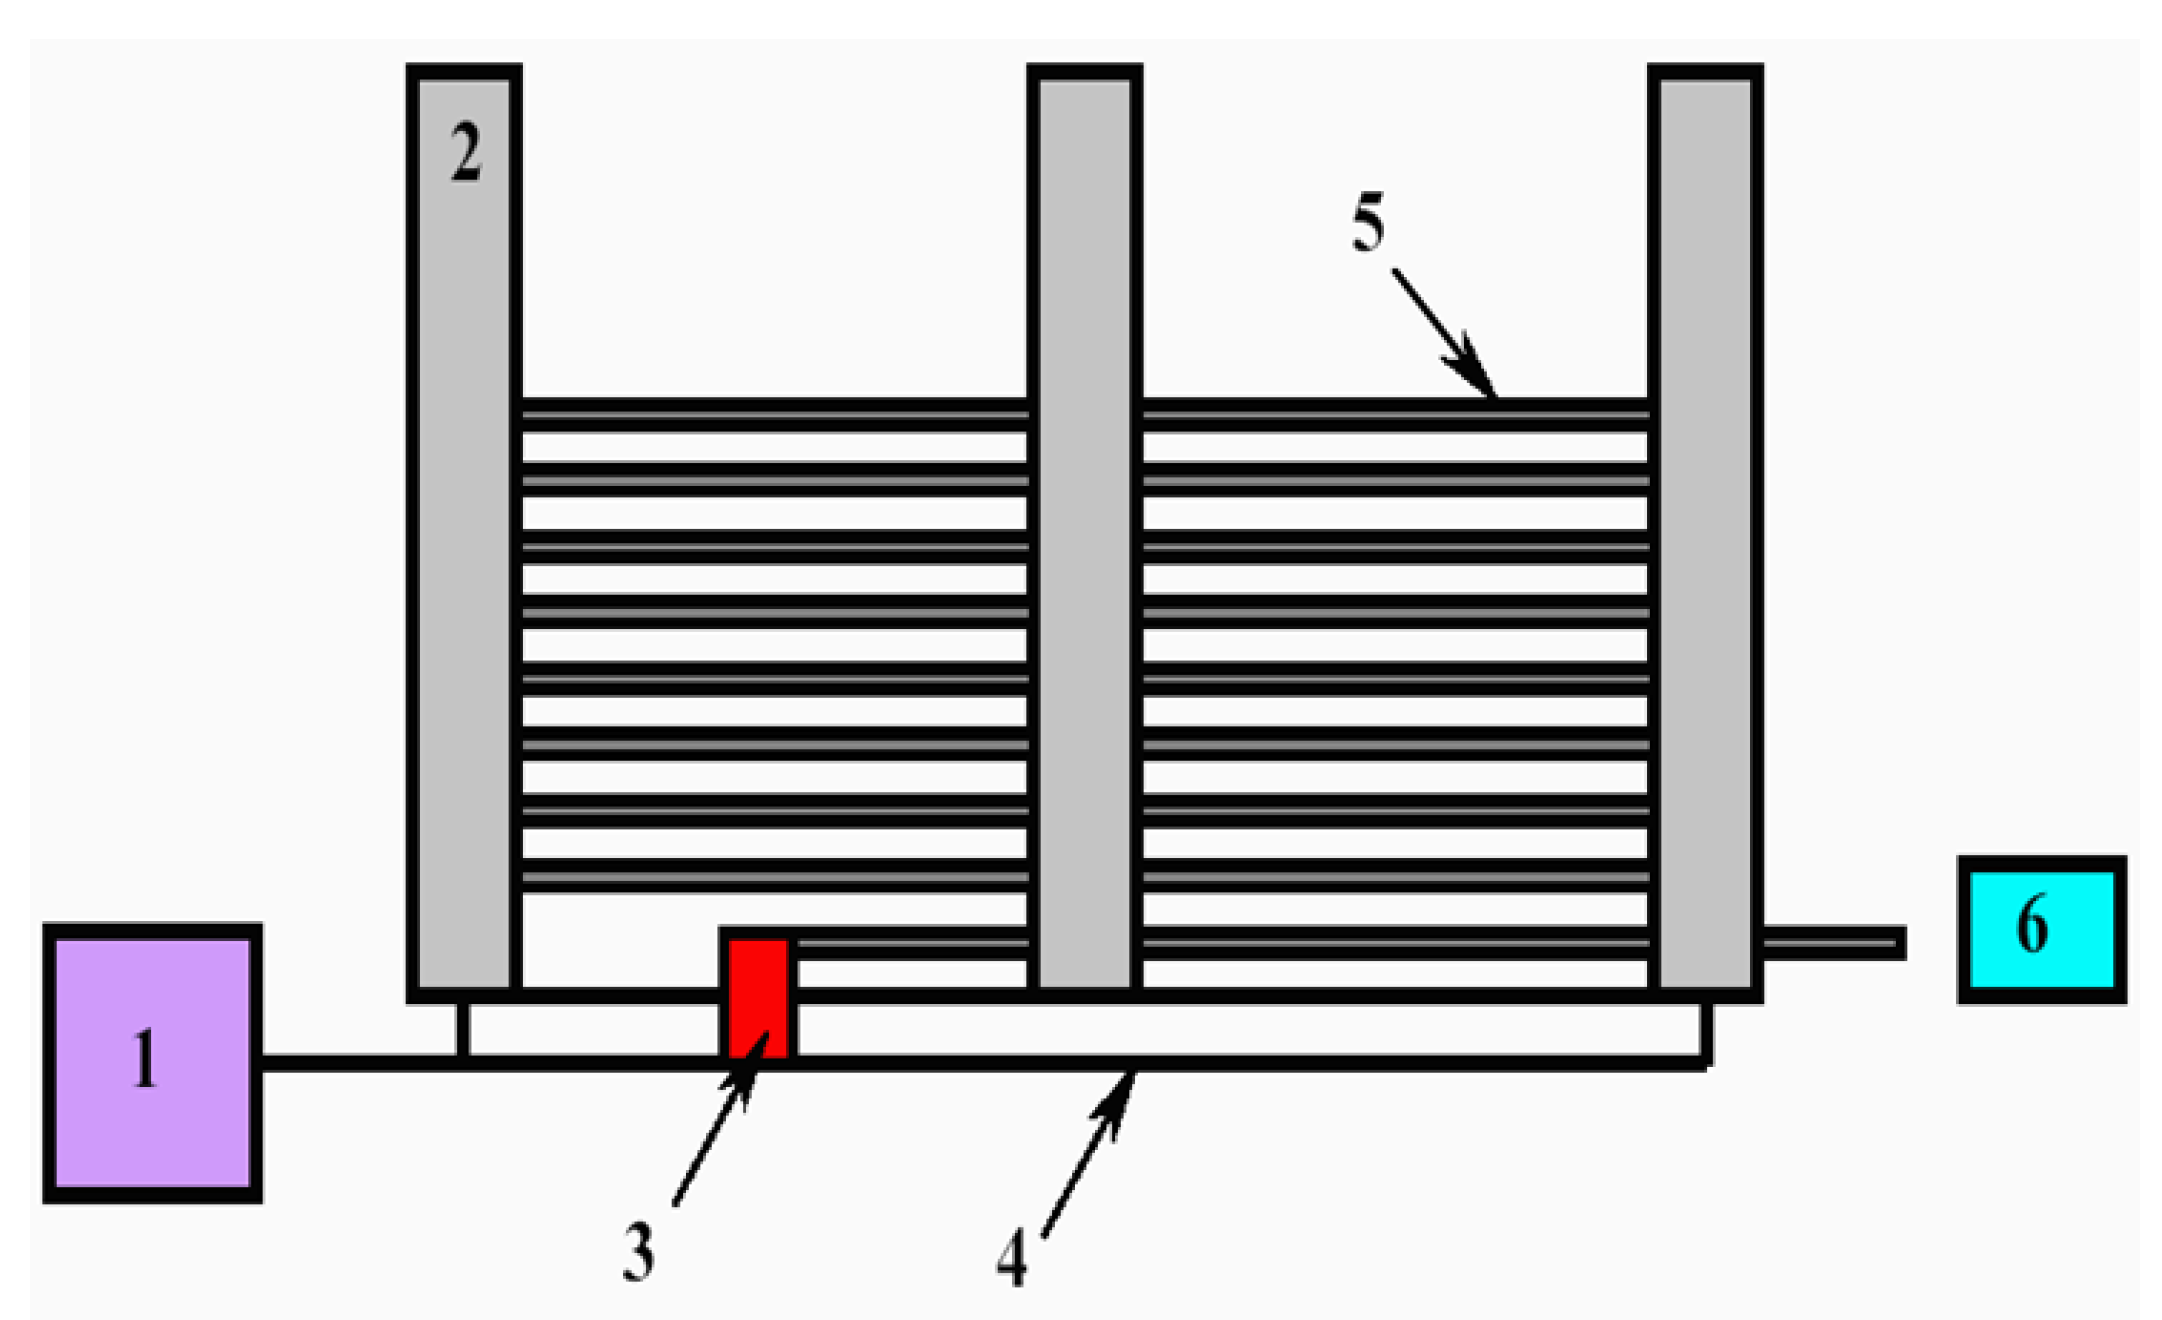
Carbon nanotubes were observed firstly in the soot forming in result of thermal sputtering of graphite in electric arc with graphite electrodes. There has been realized hereafter that for the effective formation of nanotubes it is necessary the occurrence of metal particles in the region of electrical arc burning which play the role of catalyst. For this aim such metals as Fe, Co, Ni, Yt, Mo etc were used. For inserting metals into the plasma region there used a special anode configuration in accordance with which in the cylindrical graphite rod was drilled out a deep hollow filled with metal powder mixed with graphite powder. However this approach turned out technically non-convenient because the rods were broken often at drilling and their content spilled out under the action of high current. Another approach to insertion in a metal catalyst into the plasma region is based on the usage of a sandwich structure of anode, that was composed from two rectangular graphite stripes between which a metal foil was placed. This structure is presented on Figure 29. The advantages of the usage of such a structure relate to a possibility of automation of production procedure of the soot containing CNTs. The automated setup for the soot production is presented on Figure 30. The setup includes a cassette containing a large number (up to 80) of anode rods which are replaced automatically as they burned out. Such a construction provides a continuous operation of the soot production setup during 3 days without participation of an operator.
In distinction on fullerenes CNTs are not soluble in any solvents so that the problem of their extraction from the soot presents a serious technological challenge. For overcoming this problem there used such methods of the action onto a suspension as centrifugation, ultrasound processing, filtration etc. In spite considerable efforts the mentioned action ways do not permit to obtain quite pure samples of CNTs containing a minor quantity of contaminations.

4.2.2. Chemical Vapor Deposition

A considerable step on the road of large scale production of pure CNTs is the usage for this aim of the chemical vapor deposition (CVD). This method is based on the procedure of thermal decomposition of carbon containing molecules on the surface of metal particles. Figure 31 shows the schematic representation of the CVD process. A substrate is sown with metal catalyst particles from which nanotubes grow at flowing carbon containing gas. Commercial setups operating on the above-described principles possess much more complicated arrangement. They are equipped usually with a system of simultaneously supplying several gases and a device of automated control of synthesis regime (temperature, components pressure, synthesis duration) which is preassigned on a computer. At optimal conditions nanotubes grow on the substrate surface like a grass. The density of their arrangement on the substrate corresponds to the surface density of metal catalyst particles on the substrate. The diameter of CNTs corresponds roughly to the size of catalyst particles while their length is determined by the synthesis duration..
The procedure of CNTs synthesis can be likened to the growth of plants in result of the photosynthesis. In a similar manner to this phenomenon which presents the decomposition of CO2 molecules under the action of solar radiation followed by the usage of carbon for plant growth, in the case of the CVD procedure the growth of nanotubes proceeds in result of thermocatalytic decomposition of carbon containing molecules on the surface of catalyst particles. Therefore the CNTs production by CVD method can be considered as a sample of nature-like technologies which is a subject of a great attention in a recent time.
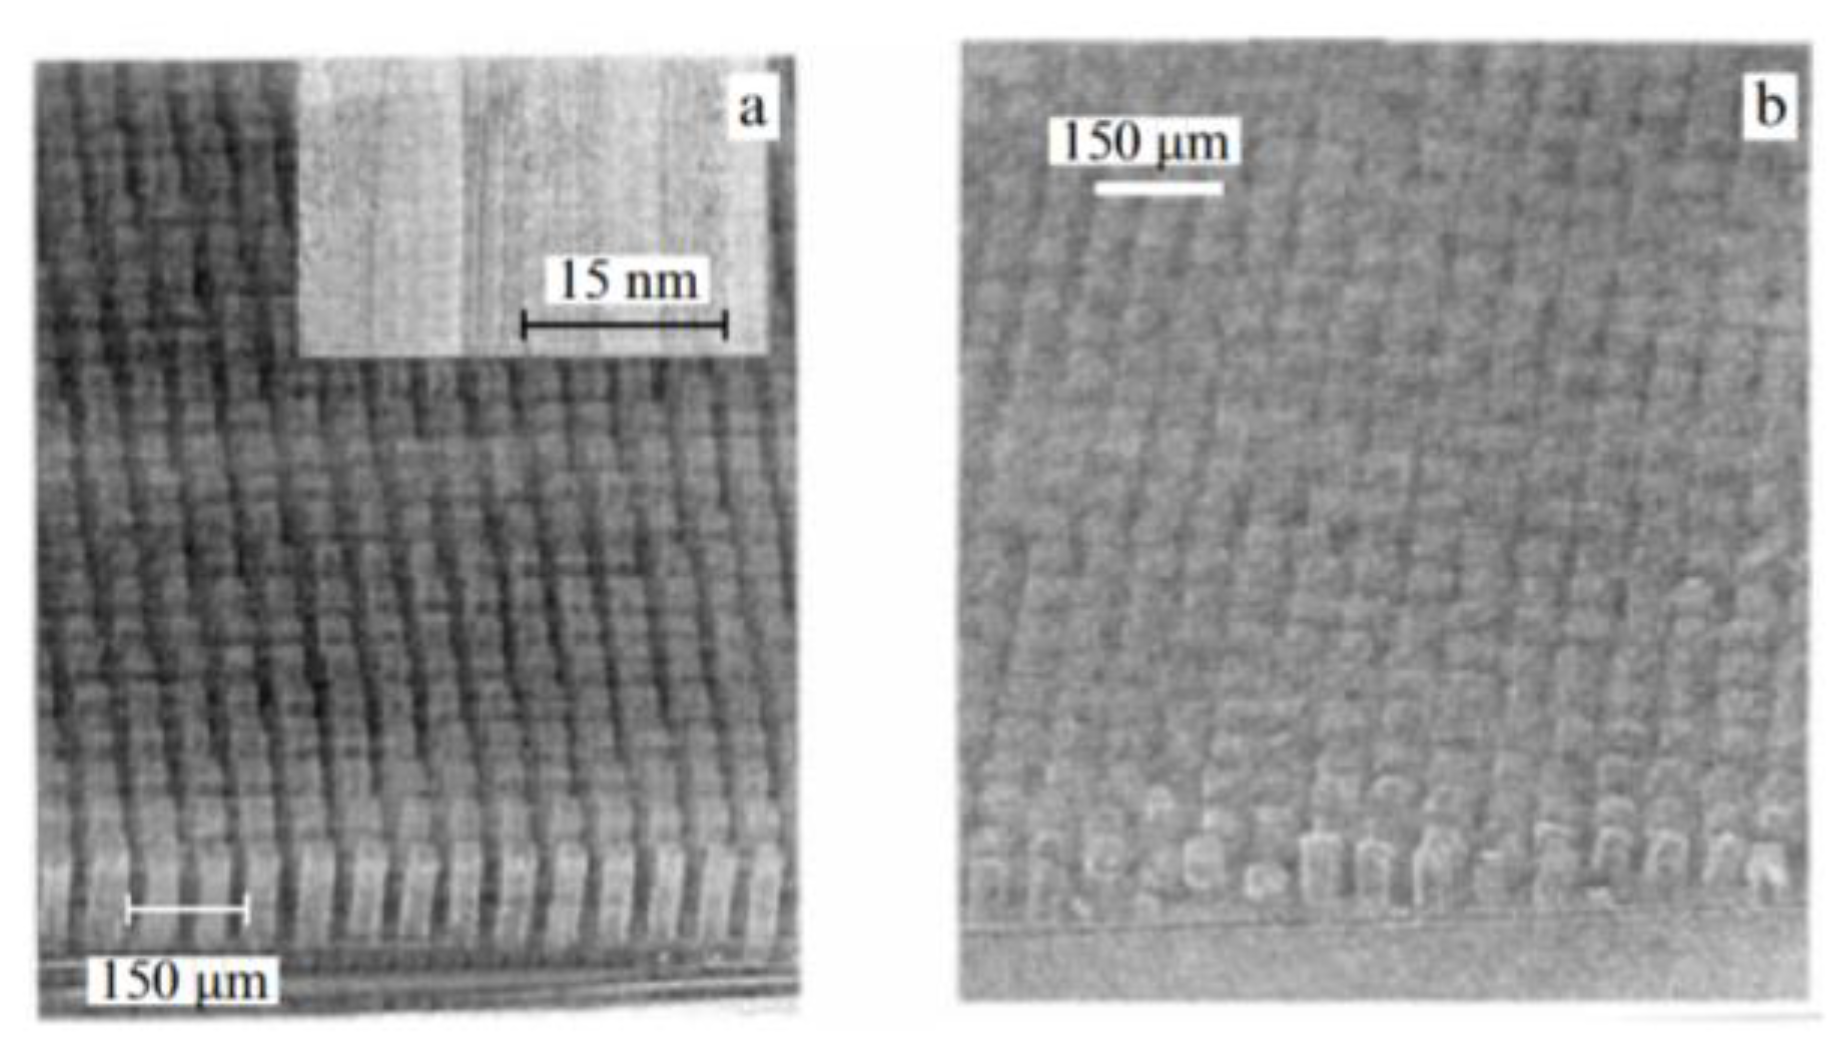
Figure 32 presents the images of CNTs arrays grown on substrates with various degree of roughness [43]. As is seen the usage of a rough substrate permits the synthesis of more qualitative CNTs.
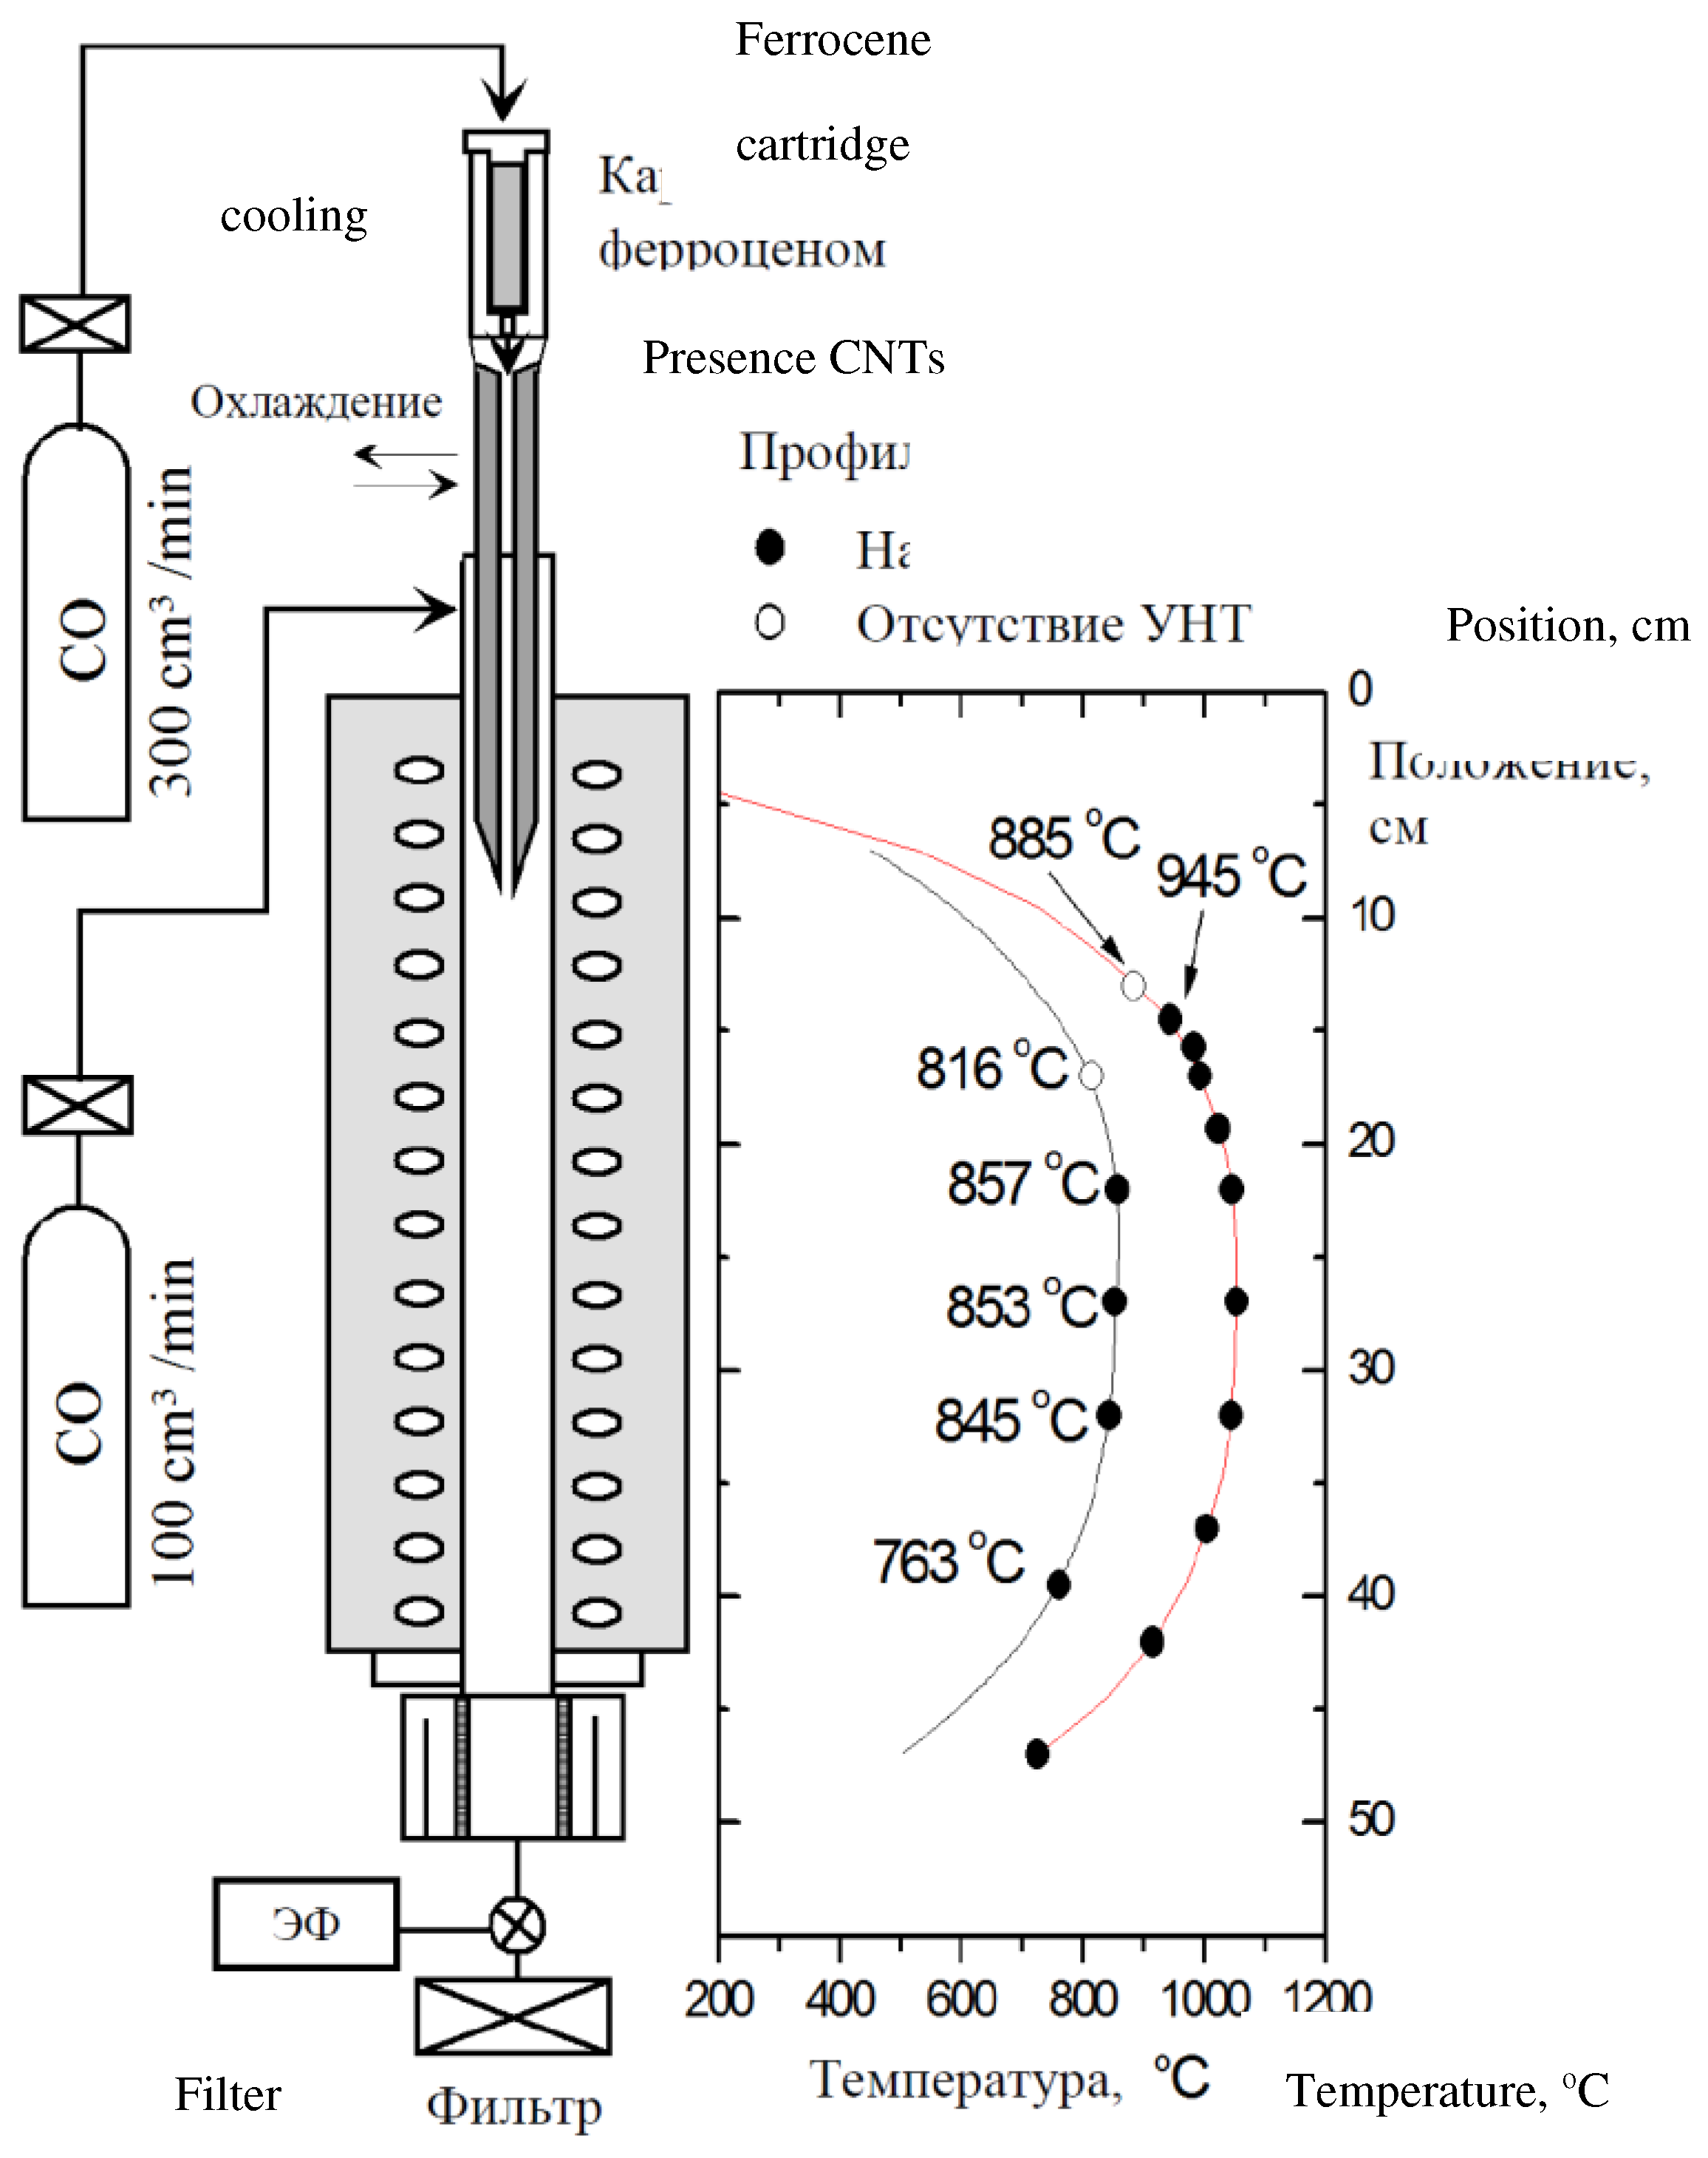
A wide distribution and development of the CVD method have resulted in elaboration of a new modification of this method called as aerosol method of chemical deposition from gaseous phase [44,45]. In this case CNTs are synthesized in a gas flow harboring both carbon containing and metal containing molecules. An example of such compounds is ferrocene molecule С10Н10Fe. The reactor in which the synthesis of CNTs proceeds has a vertical orientation so that the nanotubes growth occurs in the process of their deposition under the action of gravitation. Figure 33 presents the schema of this reaction and the vertical profile of the temperature [45]. The renewable cartridge is filled with a mixture of powered ferrocene and silicon dioxide. Passage of CO flow (rate is 300 cm3/s) through the cartridge results in evaporation of ferrocene which is directed into the vertical reactor where in is experienced to the thermal decomposition in a gigh temperature region. During vertical deposition in the reactor are formed iron particles on which single walled nanotubes grow. The nanotubes are collected onto a filter for further investigation. Measurements indicate that in result of the above-described procedure single walled CNTs from 0.3 to 1.5 μm in length are formed. The rate of nanotubes growth ranges between 1 and 2.7 μm/s. The aerosol synthesis of CNTs from gaseous phase permits one to obtain relatively pure and high quality single walled nanotubes in a continuous regime. This offers a possibility to avoid rather labor consuming procedure of their purification and use them as produced. The nanotubes synthesized are collected at a room temperature onto a substrate or filter which allows their subsequent transfer onto any other surface.

4.2.3. Plasma-Chemical Synthesis

The procedure of synthesis of carbon nanostructures in a plasma jet without the usage of graphite electrodes presents a keen interest. This approach proposed firstly for the fullerenes synthesis [40] has been developed further in the works of the High Temperatures Institute RAS [41,42], where it was used for the synthesis of such carbon nanostructures as CNTs, graphene, onions, carbon nanofibers etc. There has been stated that the content of a specific carbon modification in the soot deposit depends on the type and flow rate of both buffer gas and carbon containing gas as well as the gas pressure.

4.3. Graphene

4.3.1. Micromechanical Exfoliation of Graphite

Graphene samples were first separated through the micro-mechanical cleavage of graphite [20]. In accordance with this approach, graphene sheets are separated from crystalline graphite either by rubbing small graphite crystals against each other or by means of an adhesive tape whose further dissolution in acid results in separation of individual graphene sheets suitable for investigation. Measurements have shown that this approach allows separation of single-layer graphene sheets about 10 mm in width and roughly 100 mm in length having an ordered structure. Subsequently there was elaborated a lot of approaches to the graphene production, however the micromechanical graphite exfoliation heads the list of them relating to the the quality of samples obtained. However the graphene production procedure through the above-described approach seems to be rather complicated and low productive. The company found by K. Novoselov in England sells graphene samples of about 30 μm in size, prepared by this approach, for a price of $10. The mass of such a sample accounts about 10-12 g, so that the cost of graphene produced by the micromechanical graphite exfoliation reaches about $1013/g. Such a cost hardly permits one to hope for a possibility of the applied usage of graphene in technologies. However this price stimulates efforts of researchers addressed to generation of new more effective and less expensive approaches to the graphene production.

4.3.2. Chemical Vapor Deposition

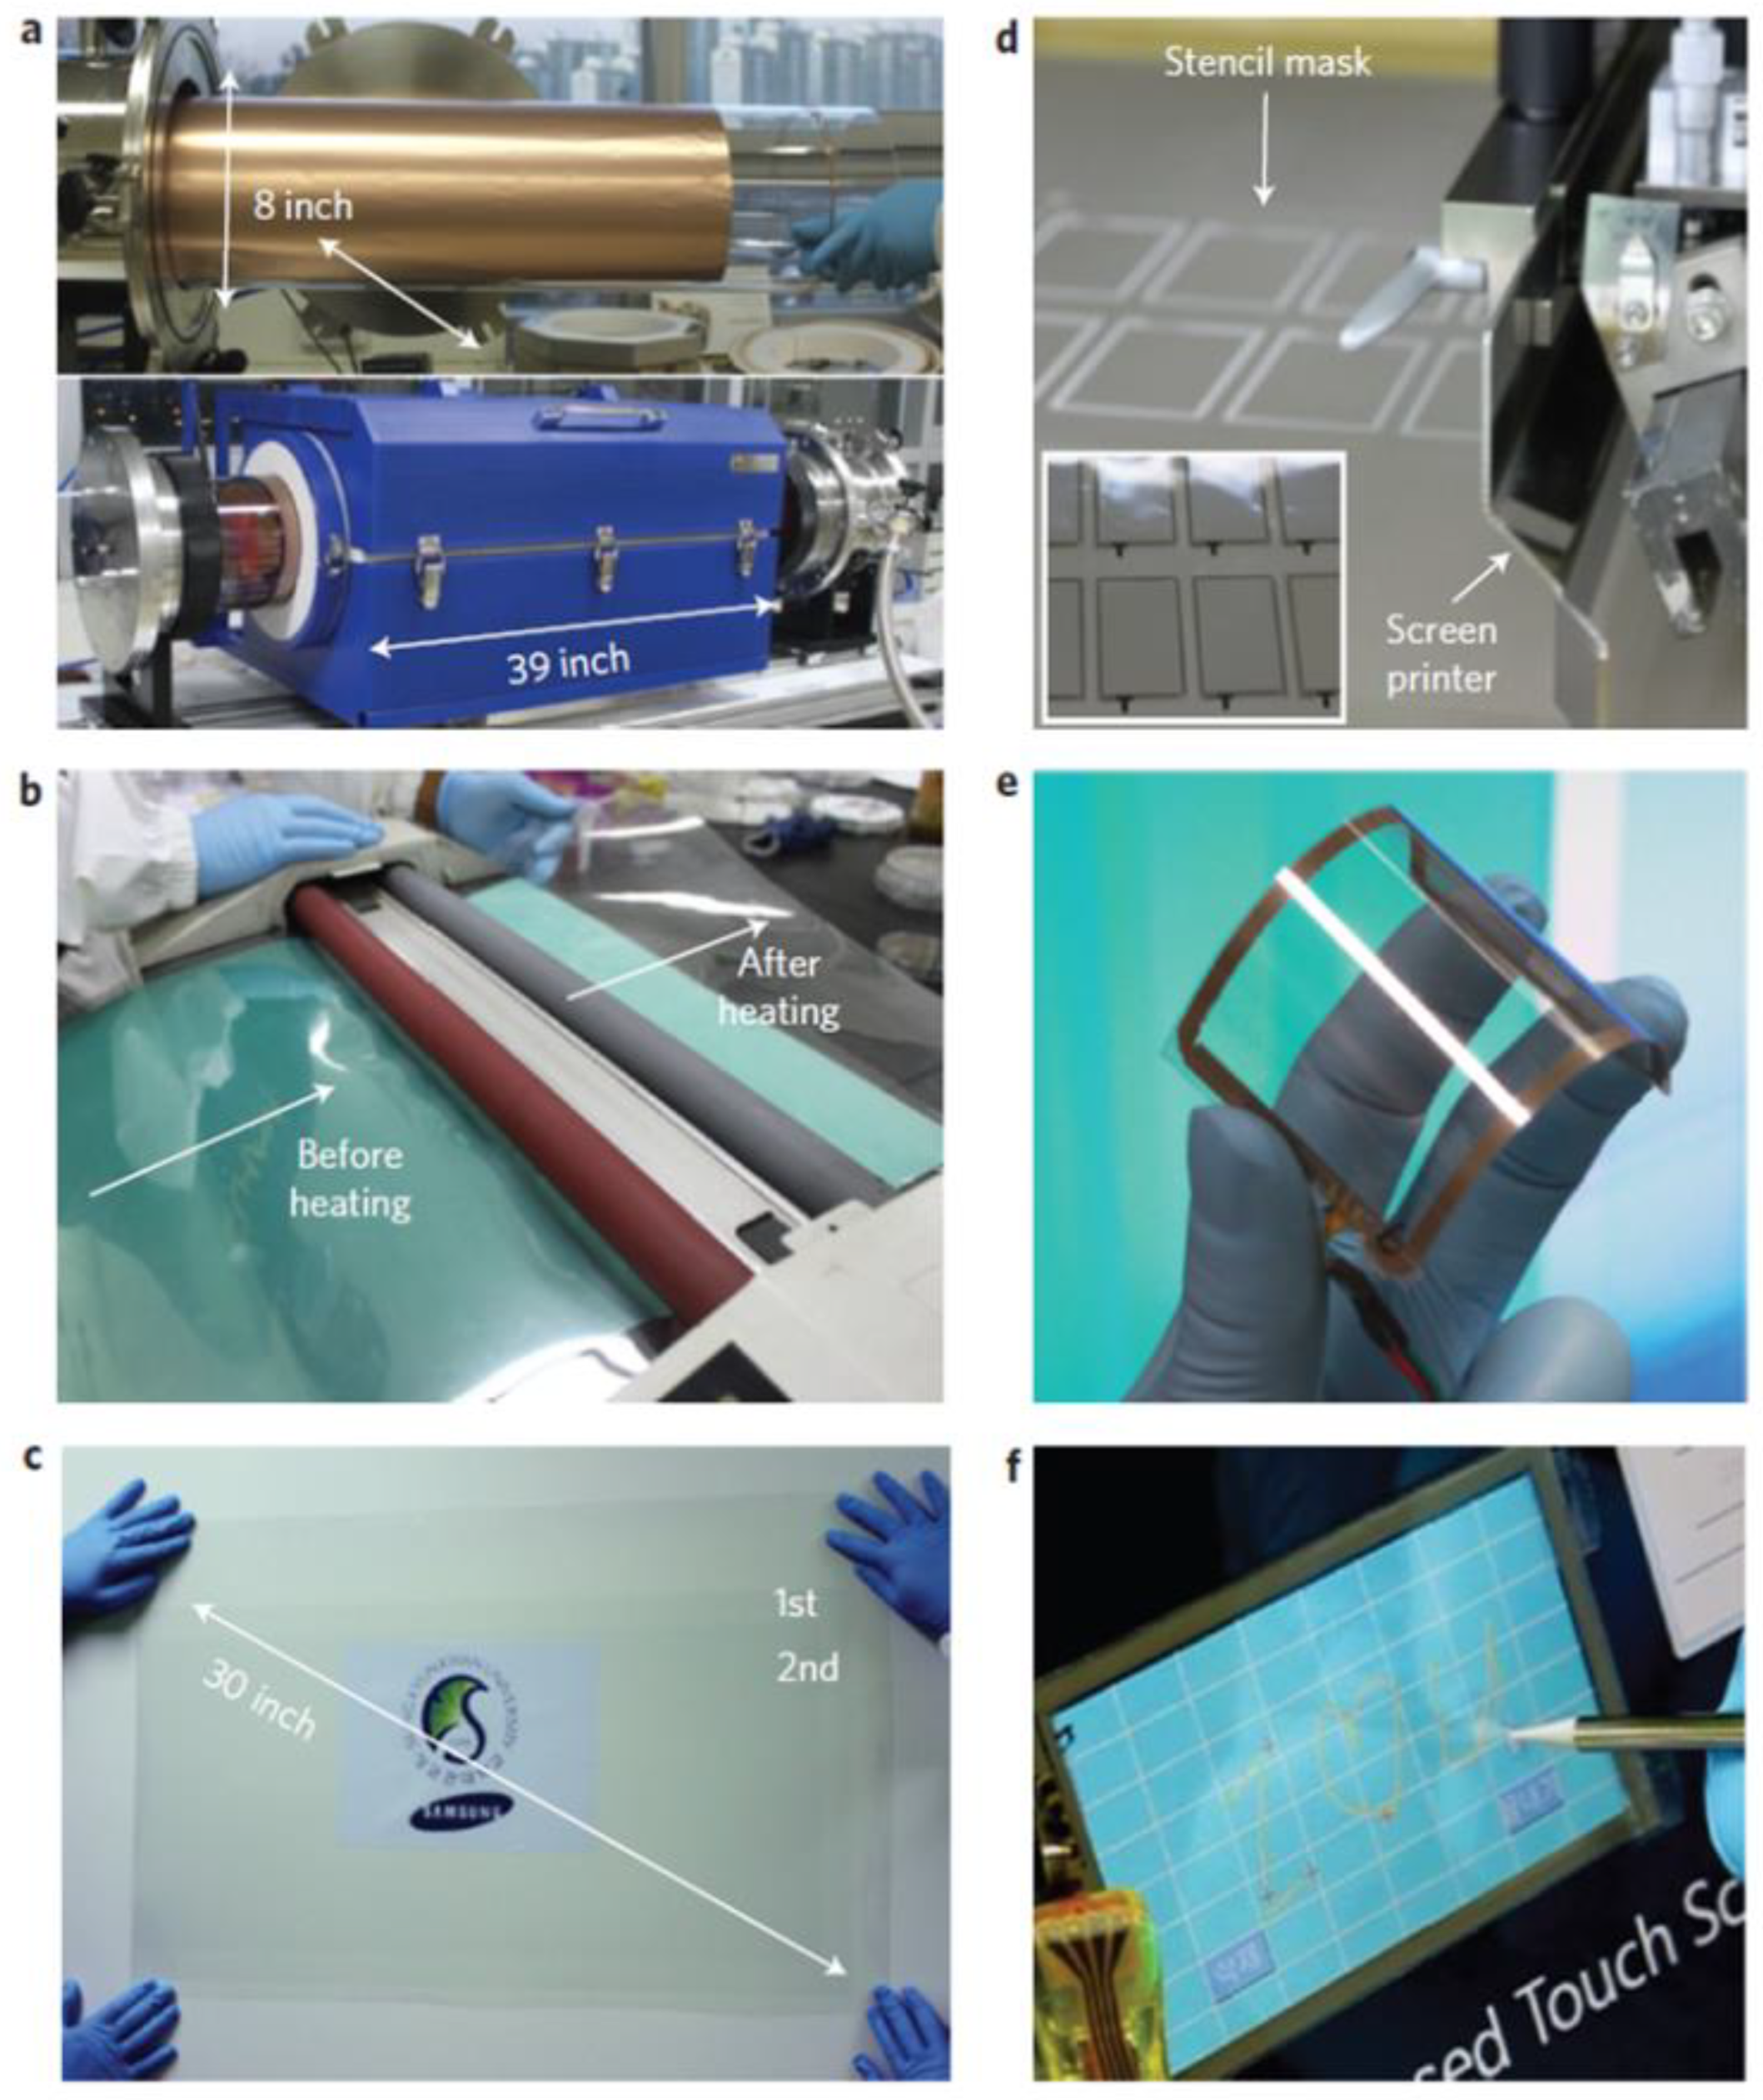
The graphene synthesis based on the CVD procedure has got a a wide spread. This method uses the property of carbon containing gases to decompose at elevated temperatures on the surface of some metals with subsequent self-organization of carbon atoms either to nanotubes or graphene sheets, depending on conditions. Various metals such as Ni, Cu etc were used as substrates for the graphene synthesis. The most impressive results have been obtained at the usage of a copper foil as a substrate [46,47]. The authors of those works have managed to produce large sixe graphene sheets (up to 1 m) which offers дo 1 м в пoперечнике), which offers great prospects for the applied usage of graphene. Figure 34 illustrates the procedure of grows of large scale graphene sheets on the copper substrate with subsequent transfer of the sheets onto a dielectric substrate.
One should note that while the CVD method permits production of large size graphene sheets, this method is rather complicated for incorporation into the contemporary technology of electron technique elements production. This approach is very labor consuming and requires for considerable time expenses. For these reasons this method is used for rather scientific than technology tasks.

4.3.3. Reduction of Graphene Oxide

Large scale graphene production is based on procedures of graphene oxide reduction. Relatively not expensive and high productive process of oxide graphite synthesis was elaborated by Hummers et al. as early as in 1958, well in advance of graphene discovery [48]. The process named as “Hummers method” includes the treatment of finely dispersed graphite by concentrated H2SO4 and KMnO4 in the presence of NaNO3. As is demonstrated in numerous experimental works, this procedure results in formation of multi-layer graphite oxide particles of about 1 nm thick and several tens μm size. These particles deposited onto a filter are usually experienced to pressing for formation of paper-like films of several tens μm thick. Graphene oxide can be considered as graphene sheets covered with oxygen containing hydroxyl (—ОН) and epoxy (С—О—С) functional groups. Sheet edges contain also some quantity of carbonyl (С=О) and carboxyl (СООН) groups.
Two approaches are used for reduction of graphene oxide and producing graphene samples. One of those is based on the chemical reduction procedure with the usage of chemical reagents. For this purpose were utilized successfully such reagents as hydrazine and his derivatives, hydroquinone, NaBH4, NaOH, NaHSO3, Na2S∙9H2O, Na2SO3, SOCl2, Na2H4∙H2O, SO2, vitamin С etc. Extension of the set of these compounds can result in an enhancement of the graphene synthesis process productivity, lowering its production cost and enhancement of the safety level, which stimulates efforts of researchers addressed to investigations in the graphene reduction chemistry.
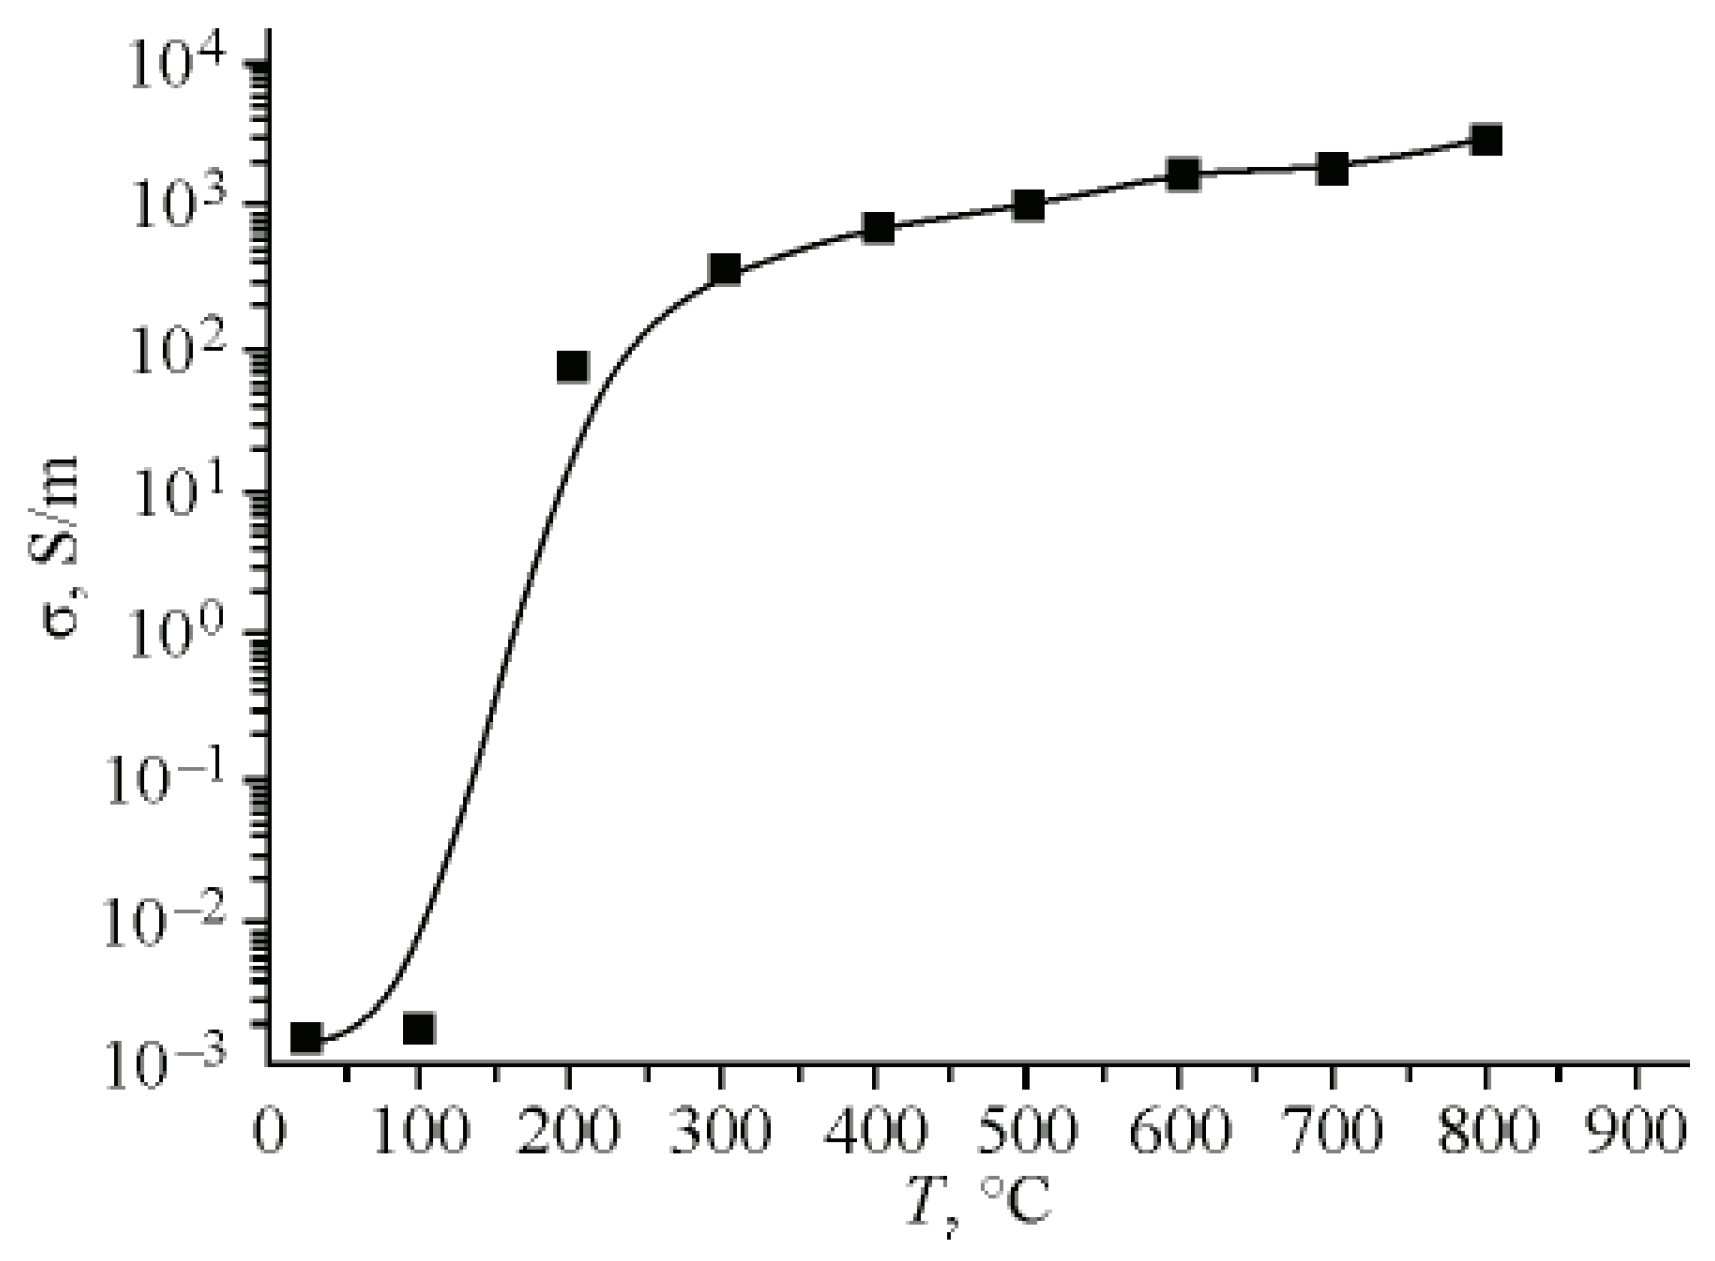
The main drawback of the chemical approach to the graphene reduction is in necessity of utilization of toxic or ecologically harmful chemical compounds. This limits a wide usage of chemical graphene oxide reduction methods for large scale graphene production. The thermal graphene oxide reduction method seems to be more safe and feasible. In accordance to this method, graphene oxide is reduced in result of thermal processing at a temperature up to 800 oС. The thermal treatment results in removal of radical added to the hexagonal graphene structure so that graphene oxide flakes transform to graphene flakes. The degree of graphene oxide reduction is controlled using the measurement of the electric conductivity of the material. Graphene oxide is a dielectric and does not conduct practically the electricity. Graphene is a semimetal and possesses the conductivity which is close to that of graphite. Therewith the conductivity of partially reduced graphene oxide increases as the reduction degree enhances at should reach the quantity 3х104 S/m inherent to crystalline graphite at a total graphene oxide reduction.
Figure 35 presents a typical dependence of the electric conductivity of thermal reduced graphene oxide on the thermal processing temperature [49]. The sharp jump of the electric conductivity of a thermal processing temperature of 150 – 200 oС is indicative of the percolation character of the conduction in accordance to which the charge transport occurs through a limited number of channels formed by conductive reduced graphene oxide fragments contacting with each other. A rise in the thermal processing temperature results in an enhancement of the number of such fragments and therefore of the number of percolation channels.
The thermal graphene oxide reduction is accompanied with removal of oxygen and other added radicals which results in a decrease of the material density. Table 1 presents the evolution of the chemical composition on graphene oxide samples experienced to the thermal treatment at different temperatures [49]. These data have been obtained in result of processing X-ray photoelectron spectra of the material. The data presented in the table indicate that the thermal treatment at a temperature exceeding 200 oС results in a considerable removal of oxygen from the sample, and at the enhancement of the temperature up to 600 oС the concentration ratio С/О increases by almost four times.
Figure 36 presents the dependence of the density of thermally reduced graphene oxide samples on the thermal processing temperature. As is seen, the density of the material experienced to the thermal processing at a temperature of 800 oС is lower about by 4.5 times than that of crystalline graphite (2,2 g/cm3). This means that the average inter-layer distance in the samples experienced to the thermal treatment at the above-indicated temperature exceeds the value 0.34 nm, inherent to crystalline graphite by 4.5 times.
Figure 36. Dependence of the density of partially reduced graphene oxide samples on the thermal processing temperature [49].
Preprints 89513 g035
The effect of changing the inter-layer distance should be taken into account at the comparison of the electric conductivity of thermally reduced oxide graphene and crystalline graphite. Taking into consideration this effect, the electric conductivity of the reduced graphene oxide treated at a temperature of 800 oС (accounted by one layer) is not 7х103 S/m as it shown on Figure 35, but 3.15х104 S/m. This quantity is close to the reference value for crystalline graphite, which indicates that the thermal reduction of graphene oxide provides a material close to graphene in its characteristics. The above-described graphene production method seems to be quite appropriate as ecologically safety, comparatively not expensive and rather productive method of large scale graphene fabrication.

5. Physical and Chemical Properties of Carbon Nanostructures

5.1. Fullerenes

5.1.1. Molecular Properties and Chemistry of Fullerenes
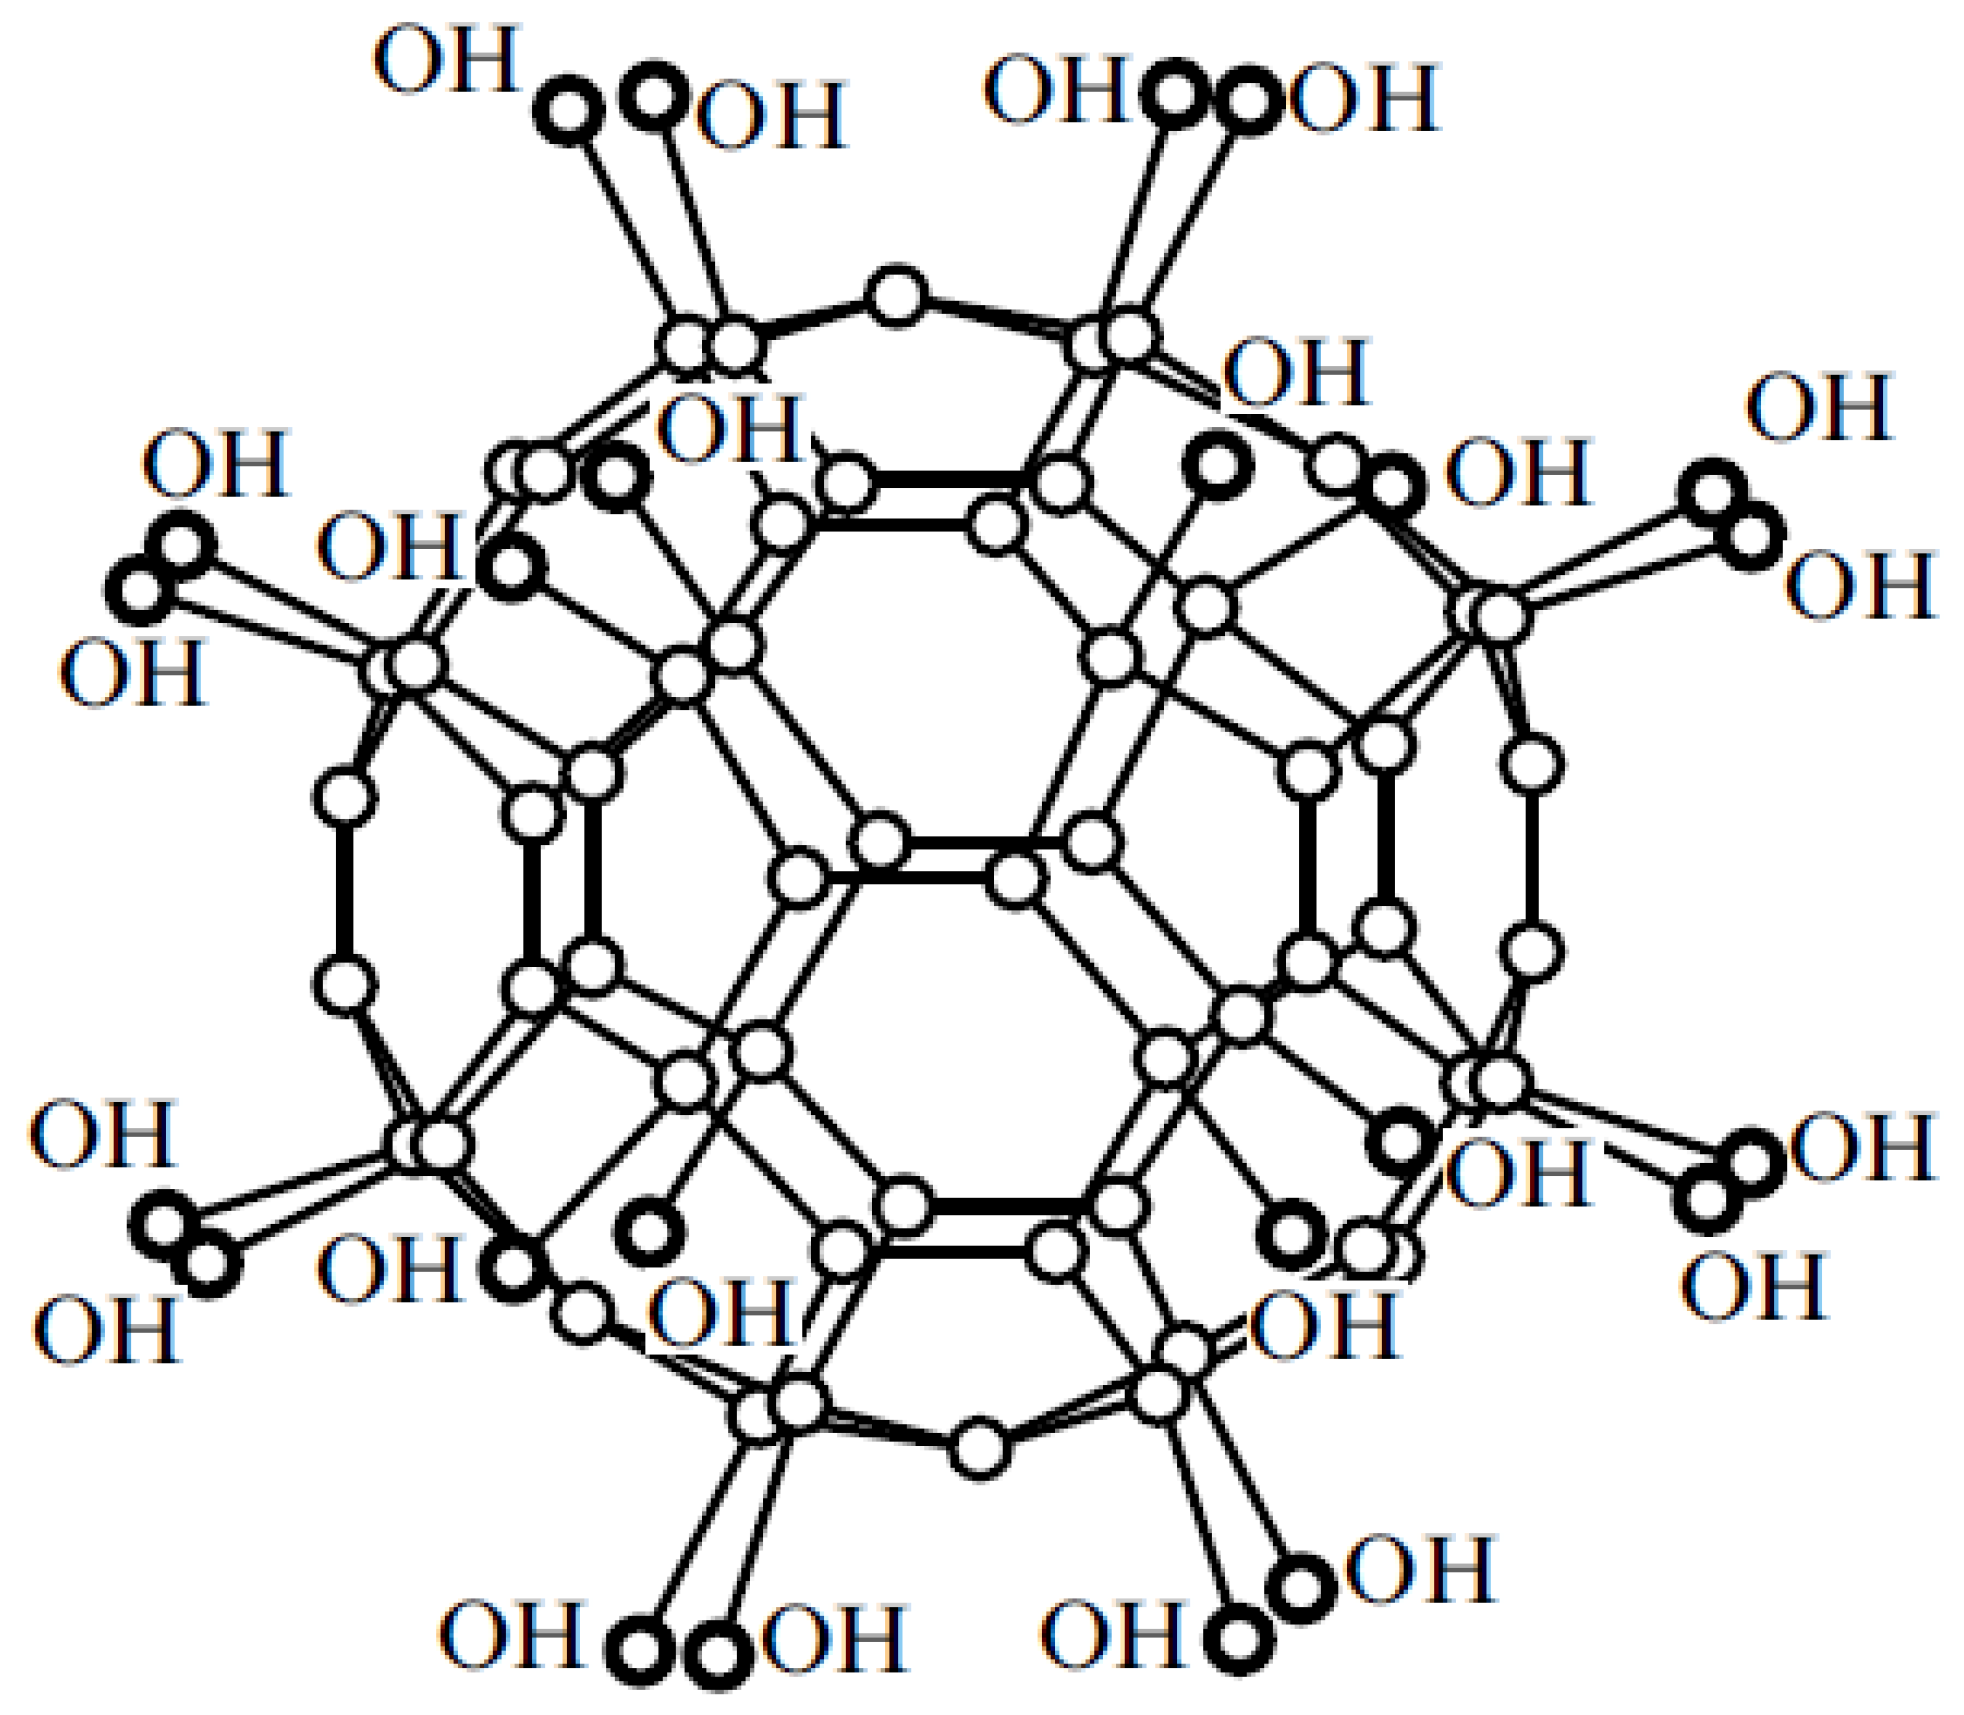
The main peculiarity of molecular fullerene is in a high electron affinity of this compound (2.7 eV for С60 molecule). At a room temperature С60 can add up to six electrons. The ionization potential of fullerene molecule С60 accounts 7.6 eV; the value of this parameter decreases as the molecule size increases; for very large fullerene molecules the quantity of this parameter approaches the work function for graphite (~ 5 eV). The polarizability of С60 molecule accounts 80 Å3. The energy necessary for splitting out carbon atom from С60 accounts 7.4 eV. For higher fullerene molecules the value of this parameter is of the same order of magnitude. This determines quite high thermal stability of fullerene molecules which hold their structure (at the absence of oxygen) at temperatures exceeding 2000 К.
The structure of fullerenes contains double carbon bonds С=С due to which such molecules can add to themselves a considerable number of atoms and/or radicals. This causes a wide set of chemical derivatives of fullerenes [25,50], which differ from one another in not only sort and quantity of added atoms and radicals but also in their mutual arrangement on the surface of the molecule. The number of different fullerene derivatives accounts many thousands, and the problems relating to their synthesis, investigation and applied usage constitute the content of the fullerene chemistry, which is separated as one of the directions of the chemical science.
One of the perspective problems of the fullerene chemistry relates to the synthesis of water soluble compound of these molecules. The solution of this problem permits creation of a new class of biologically active compounds for pharmacology. The synthesis of fullerene molecule with a large number (up to 26) of added hydroxyl groups (-ОН) became an important step on this way. Figure 37 presents the structure of this molecule [51] which can be considered as fullerene alcohol (fullerol). This compound was synthesized in a water solution NaOH with the usage of tetrabutilammonium hydroxide as a catalyst.
Figure 37. Chemical structure of the water soluble fullerene compound presenting С60 with added OH radicals ОН [51].
Preprints 89513 g036
One more problem of fullerene chemistry attracting considerable attention of researchers relates to the synthesis and usage of fluorinated fullerenes. In some degree this attention is supported by hopes of researchers to create new solid lubricants similar to Teflon on the basis of fullerenes. As it expected, these lubricants will conserve their high friction characteristics even at supe-low temperatures, in space conditions. A wide set of fluorinated fullerenes described by the formula C60Fn (n – is an integer lower 50) has been synthesized by now. One should note that the compounds C60F36 and C60F48 possess an enhanced stability.

5.1.2. Fullerite

At a room temperature fullerenes are found in the condensed state forming a crystalline structure. Such a structure is called as “fullerite”. In such a structure the molecules are bound with each other with van der Waals interaction forces the energy of which (1.6 eV) is much less than the interaction energy of carbon atoms in the molecule (7.4 eV). For this reason fullerene molecules separate from the crystal at evaporation without destruction. Some physical parameters of fullerite С60 are shown in Table 2.
Table 2. Physical parameters of fullerite С60 at a room temperature [52].
Parameter Quantity
Lattice constant (fcc), nm 1.417
Distance С6060, nm 1.002
Binding energy С6060, eV 1.6
Density, g/cm3 1.72
Molecular density, cm-3 1.44х1021
Isothermal compressibility, m2/N 6.9х10-11
Phase transition sc-fcc temperature (Тpt), К 261
pt/dp, К/Kbar 11
Volumetric thermal expansion coefficient, К-1 6.1х10-5
Electron work function, eV 4.7
Debye temperature, К 185
Thermal conductivity, W/m К 0.4
Electric conductivity, S/m (T= 300 K) 1.7х10-7
Melting temperature, К 1450
Sublimation enthalpy, eV (Т = 500 – 700 К) 1.74
Dielectric constant 4 – 4.5
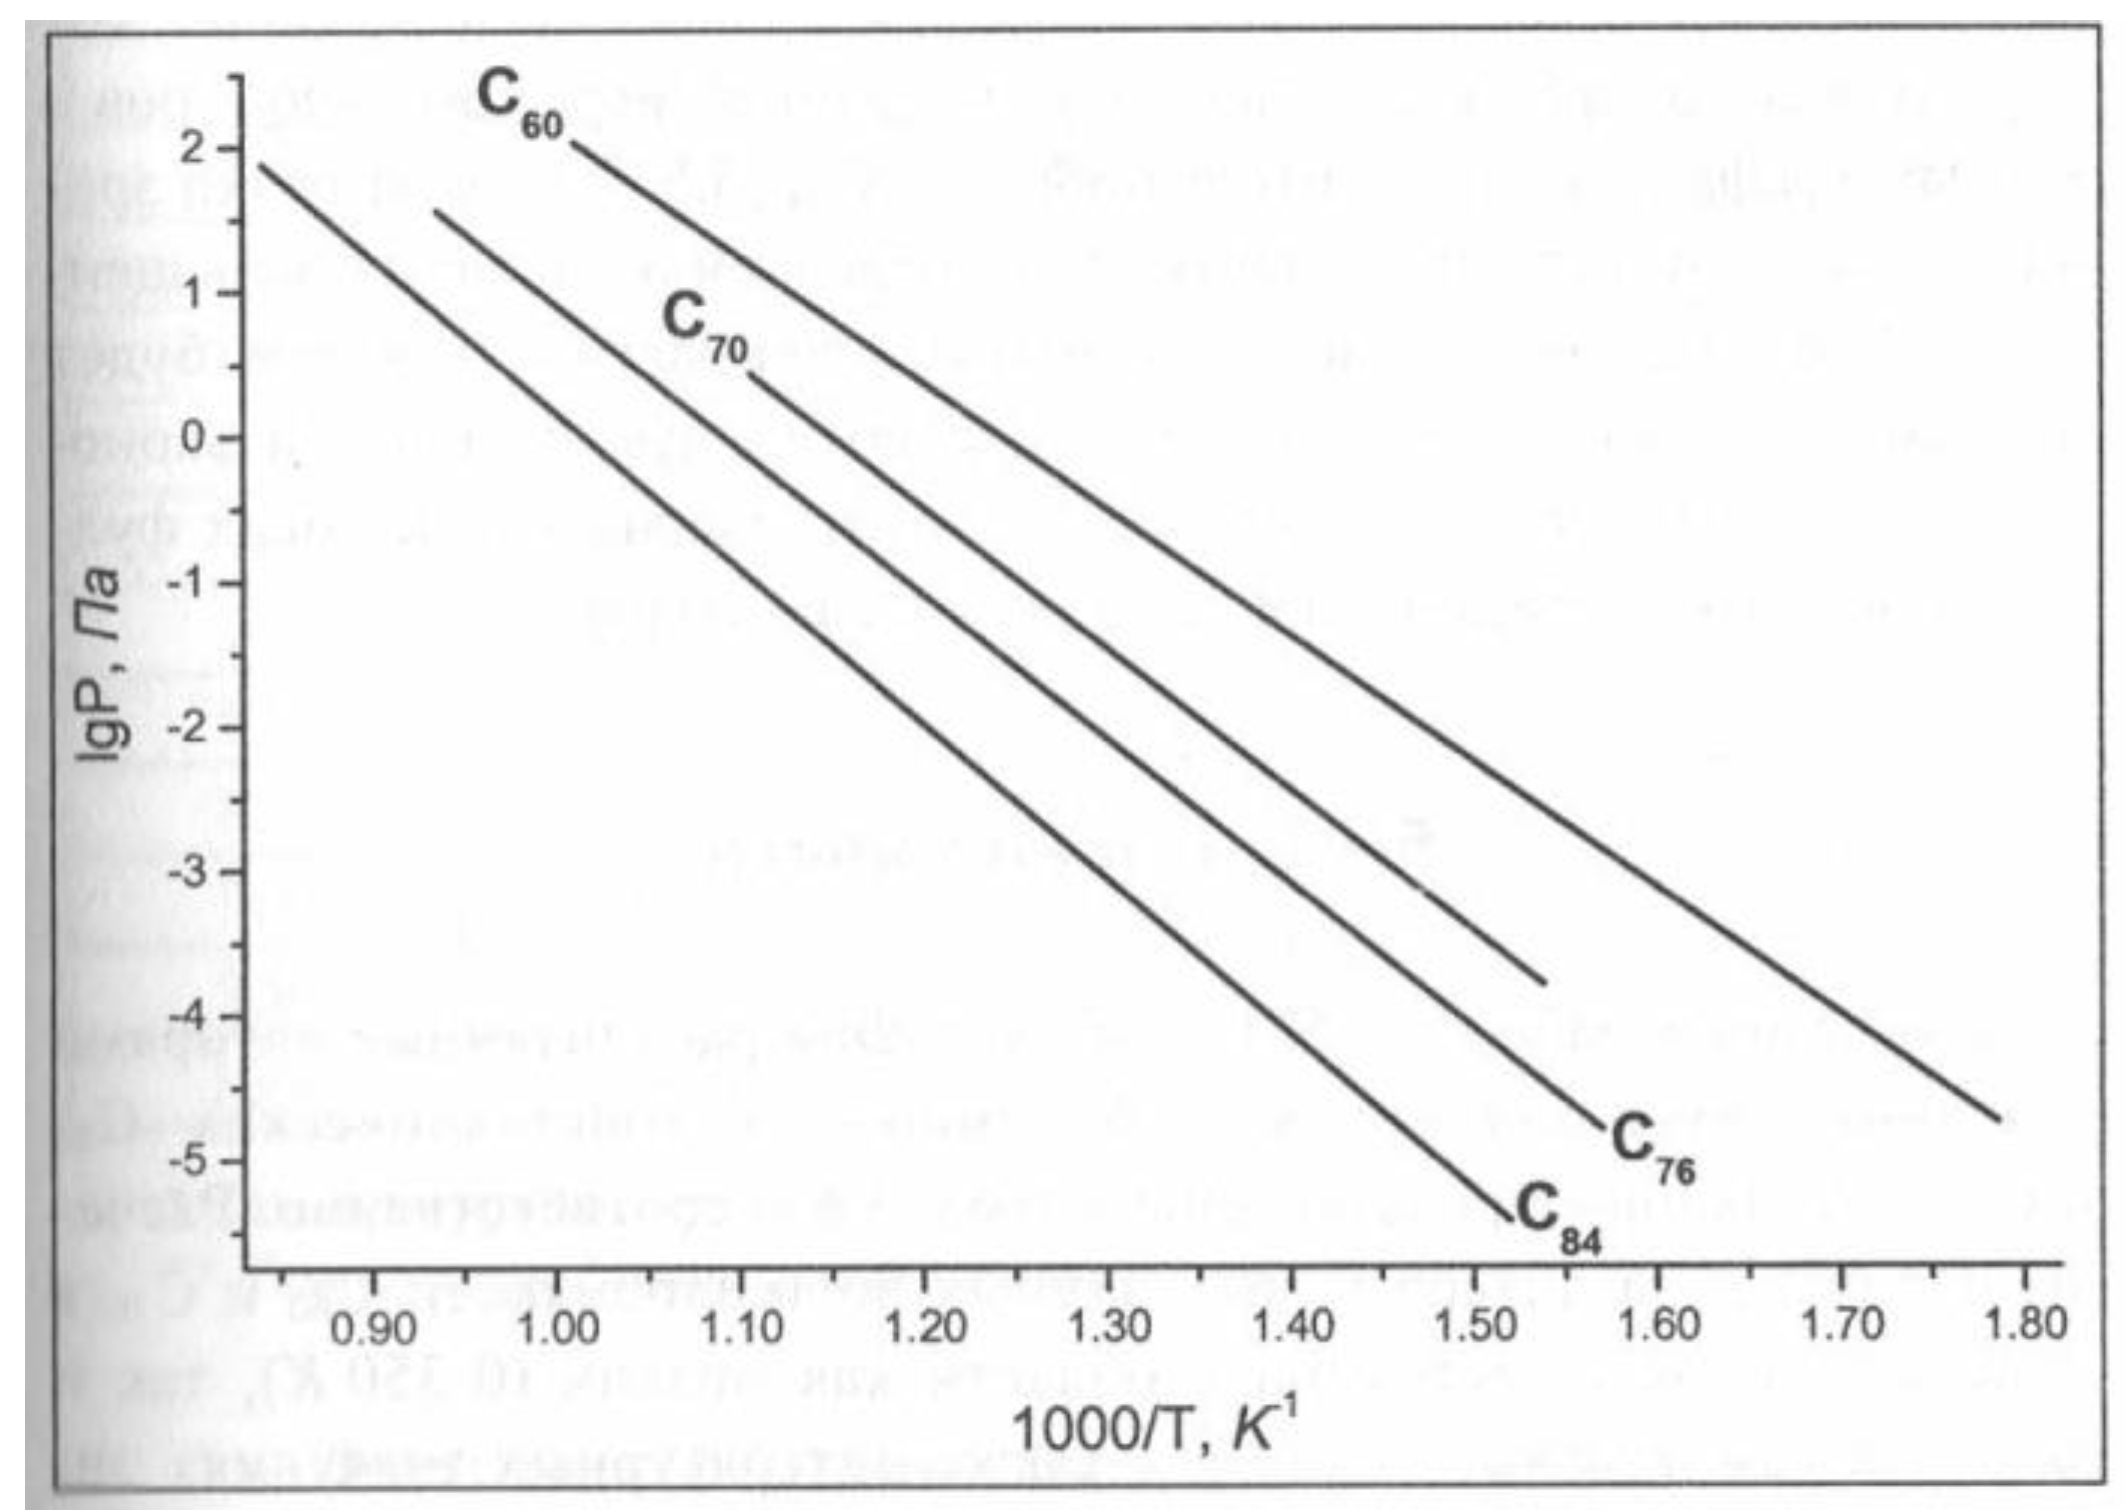
Figure 37. Temperature dependences of the saturation vapor pressure for fullerites of different sorts [50].
Preprints 89513 g037
Evaporation (sublimation) of fullerites is observed at temperatures exceeding 500 К. The temperature dependence of the saturation vapor pressure ps(T) is described by the standard Arrhenius formula
ps = ps0 exp(-ΔH/T),
where ΔН is the sublimation enthalpy accounting 1.67, 1,95, 2,0 и 2,14 eV for fullerites С60, С70, С76 and С84, correspondingly, ps0 is an empiric parameter. Figure 37 presents the measured temperature dependences of the saturation vapor pressure for fullerites of the above-listed sorts [50]. As is seen the saturation vapor pressure decreases as the molecule size enhances. This corresponds to the above-given dependence of the sublimation enthalpy on the molecule size. One should take into consideration that as it was noted above, higher fullerene molecules can be found in various isomeric states, so that the data on the temperature dependences of the saturation vapor pressure shown on Figure 37 should be treated as a result of averaging over such states.
The crystalline structure of fullerites depends on the temperature. At temperatures lower 257 К fullerite С60 has a simple cubic structure (sc) in which each molecule has 12 nearest neighbors. The rotation of molecules is frozen, so that relative orientations of fullerene molecules are fixed strictly. At a temperature of 257 К the fullerite crystal is subjected to the phase transition resulting in defrosting of the rotation of molecules. The crystal takes the face-centered cube structure (fcc). Therewith fullerene molecules lose a fixed spatial orientation and behave like structureless spheres. The phase transition is accompanied with an abrupt change of many characteristics of fullerite such as forbidden gap width, conductivity etc.
Fullerites are superconductors having the forbidder gap width 1.5 eV (С60), 1.91 eV (С70), 0,5 -1,7 eV (С78) and 1,2 – 1,7 eV (С84). Therewith the data for higher fullerenes possess a considerable uncertainty which is caused by a great abundance of isomer modifications of these compounds and manifold of mutual orientations of molecules in the crystal which structure differs considerably from the spherical one inherent to С60. At a room temperature fullerite crystals possess negligible electric conductivity and can be considered as insulators.

5.1.3. Superconductive Fullerites

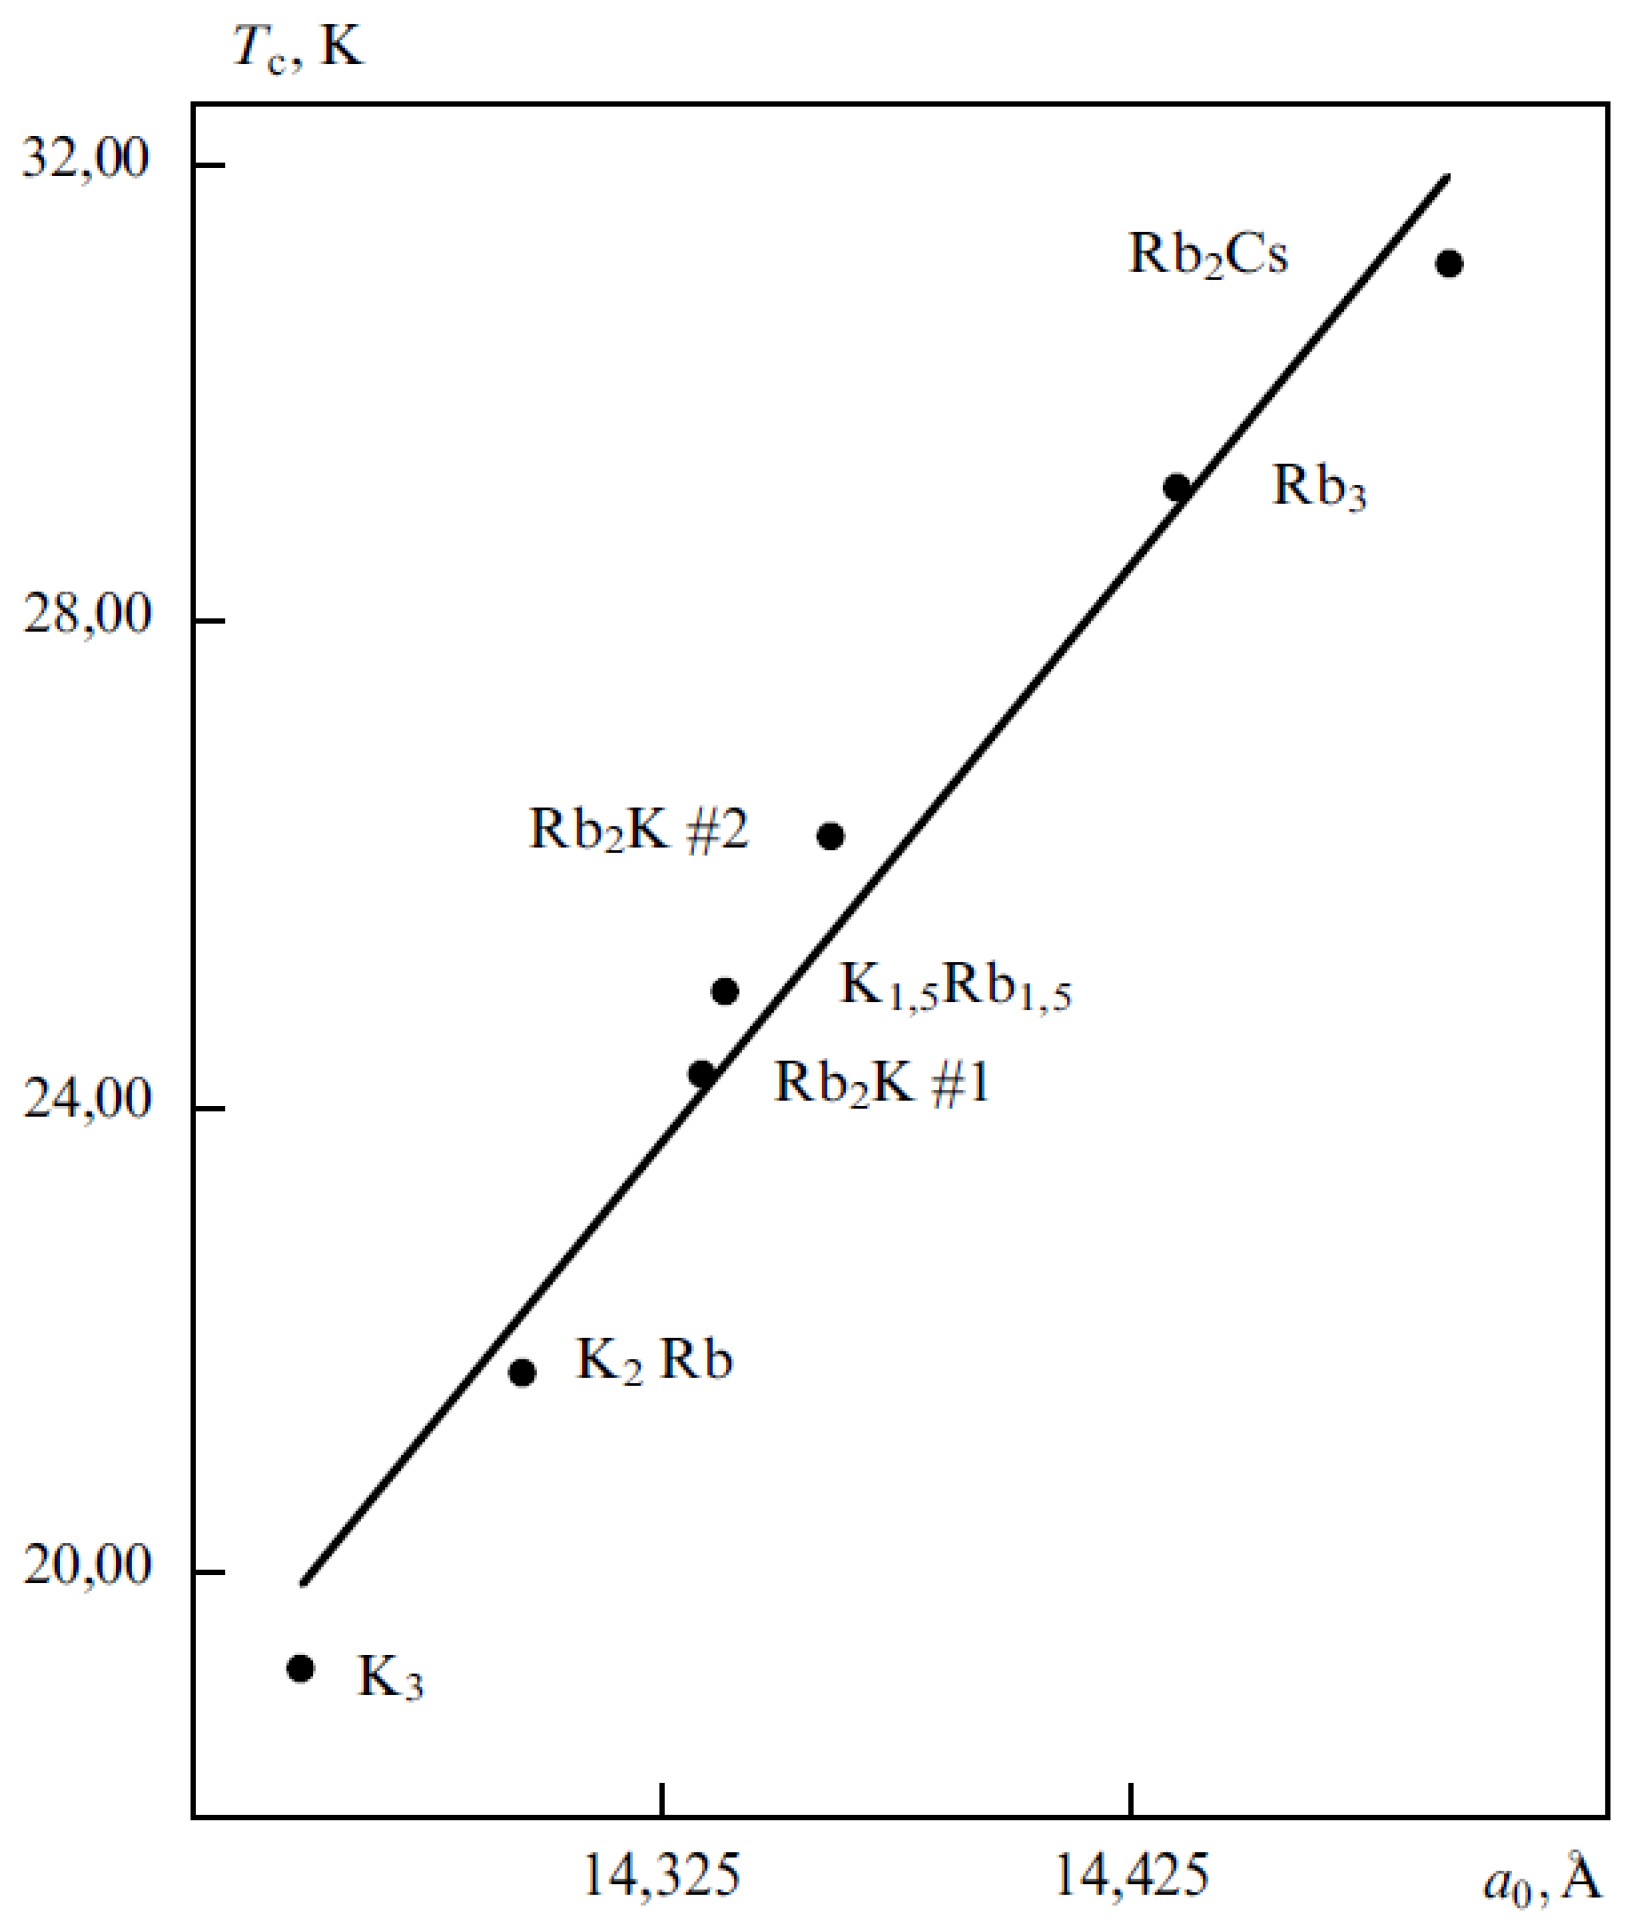
The interest to study of fullerites increased considerably after discovery of the superconductivity of fullerites. Doping С60 crystals with a some quantity of an alkali metal results in formation of a material with metal conductivity transforming into a superconductive state at low temperatures [52]. Such a material is produced in result of processing a film or polycrystalline sample with alkali metal vapor at a temperature of several hundred degrees. The most of fullerites С60 containing alkali metals in stoichiometric ratio either Х3С60 or XY2C60 (X, Y – alkali metal atoms) possess superconductive properties. Table 3 contains parameters of superconductive fullerites of such a kind [53]. One can note for comparison that the critical superconductivity temperature for graphite doped with K accounts 0.55 К [54] while for fullerite К3С60 it is equal to 19 К. Values of the critical temperature for superconductive fullerenes present the record for molecular superconductors.
One should note a correlation between the lattice parameter аo and critical superconductivity temperature Тс. This correlation manifests itself clearly on the dependence of the critical superconductivity temperature on the lattice parameter shown on Figure 38. Such a dependence suggests a possibility of preparation of a material with enhanced superconductivity temperature on the basis of higher fullerene crystals [55]. However, practical realization of this idea meets difficulties related to non-spherical structure of higher fullerene molecules and abundance of isomer modifications. Due to these difficulties higher fullerene based crystals do not possess a perfect crystalline structure inherent to fullerite С60 which prevents the occurrence of superconductivity.
Figure 38. Dependence of the critical superconductivity temperature of fullerites doped with alkali metal atoms on the crystal fcc lattice parameter аo [53].
Preprints 89513 g038

5.1.4. Fullerenes in Solutions

As it was mentioned above, fullerenes present the only soluble carbon modification. The importance of this fullerenes feature relates to the possibility to extract fullerenes from soot and separate fullerenes of different sort from each other. Table 4 shows the values of solubility of fullerenes in various solvents. One should stress that fullerenes are dissolved presumably in non-polar solvents and practically not soluble in such standard solvents as alcohol and water. This implies an insignificant role of the solvation mechanism of solution which is based on formation of long living complexes (solvates) presenting the molecule of the dissolved substance surrounded with an envelope consisted of solvent molecules oriented in a specific manner.
As it can be seen from the data presented in the Table, the most high fullerene solubility is inherent to aromatic hydrocarbons and their derivatives the first place between them belongs to derivatives of naphthalene. Aromatic compounds are based on one or several benzene rings the structure of which is very close to regular hexagons forming the surface of a fullerene molecule. For this reason a high solubility of fullerenes in aromatic compounds appears to be explicable. One can suppose that a high solubility of fullerenes in compounds containing hexagonal rings in their structure is caused by a magnetic interaction of a ring current in the sonvent molecule with that in fullerene molecule. The specific surface energy of this interaction is of the same order as the inter-molecular interaction energy in a fullerite crystal, therefore the solubility thermal effect is relatively low. The magnetic field caused by an intra-molecular current in the hexagonal fullerene ring arranges the aromatic compound molecule in such a manner that the current inside this molecule is directed opposite to the current of the fullerene ring. The thermal effect of fullerene molecule solubility is determined by the energy of the magnetic interaction.
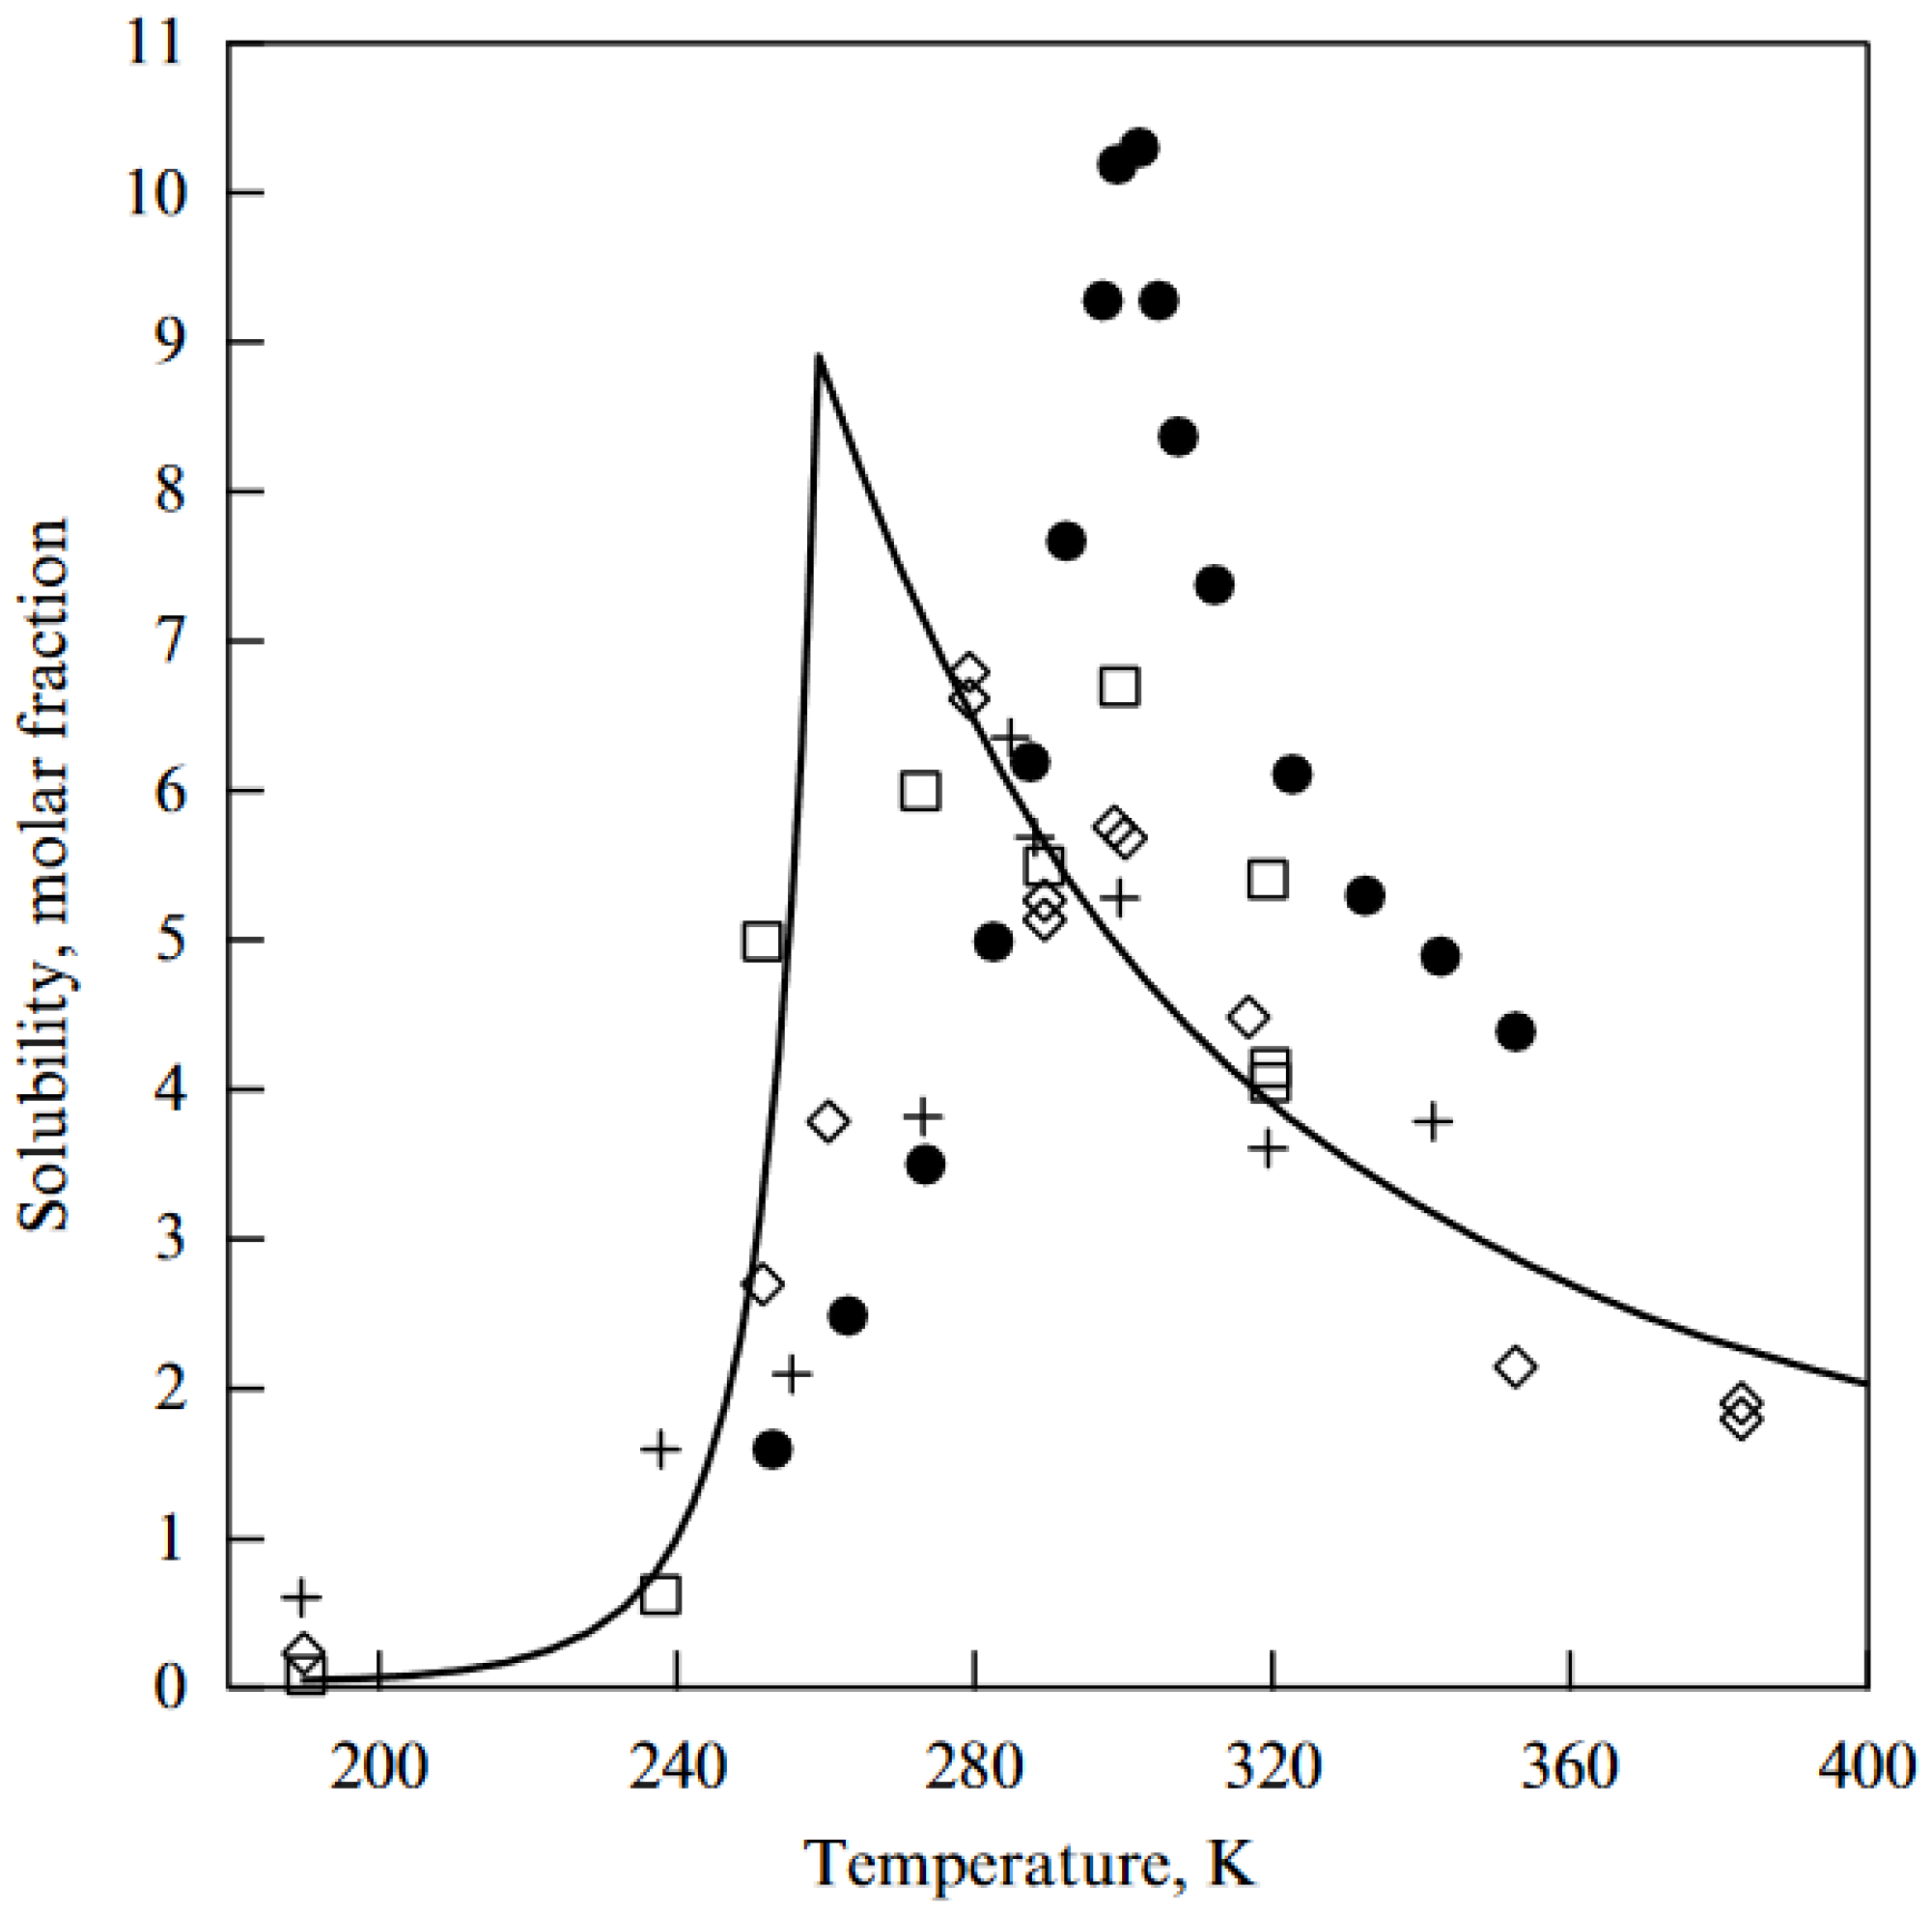
Figure 38. Temperature dependence of the solubility of fullerene C60 + in hexane (times 55); □ in toluene (times 1.4); ◊ in CS2; ● in xylene [57]. The solid line shows the results of calculations using the droplet model [56,58].
Preprints 89513 g039
A remarkable peculiarity of the behavior of fullerenes in solutions relates to the temperature dependence of the solubility of fullerene С60. This dependence measured in Ref. [57] is presented on Figure 39. As is seen the temperature dependence of fullerene solubility has a non-monotone character, which is rather rare manifestation of the solubility nature. The solubility of the most substances increases as the temperature enhances which is caused by a decrease of the influence of the interaction of dissolved molecules with solvent molecules on the solution behavior. One should note that other fullerene modifications do not possess non-monotone temperature dependence of the conductivity. In particular, the solubility of fullerene С70 is characterized by a standard rising dependence.
Non-monotone character of the temperature dependence of fullerene solubility is explained within the frame of the cluster model of the fullerene solubility [56,58]. According to this model, fullerene molecules С60 in solutions form clusters consisted of some number of fullerene molecules. At relatively low temperatures (lower 280 – 300 К) these clusters keep their stability, so the rise of the temperature is accompanied with an enhancement of the solubility, which corresponds to the traditional behavior of solutions. Further enhancement of the temperature causes the thermal decomposition of clusters which results in an increase of the solute and therefore with a rise of the interaction energy between solute and solvent molecules. This is reflected on the temperature dependence of the fullerene solubility which has a decreasing shape in the temperature range (above 280 – 300 К) under consideration.
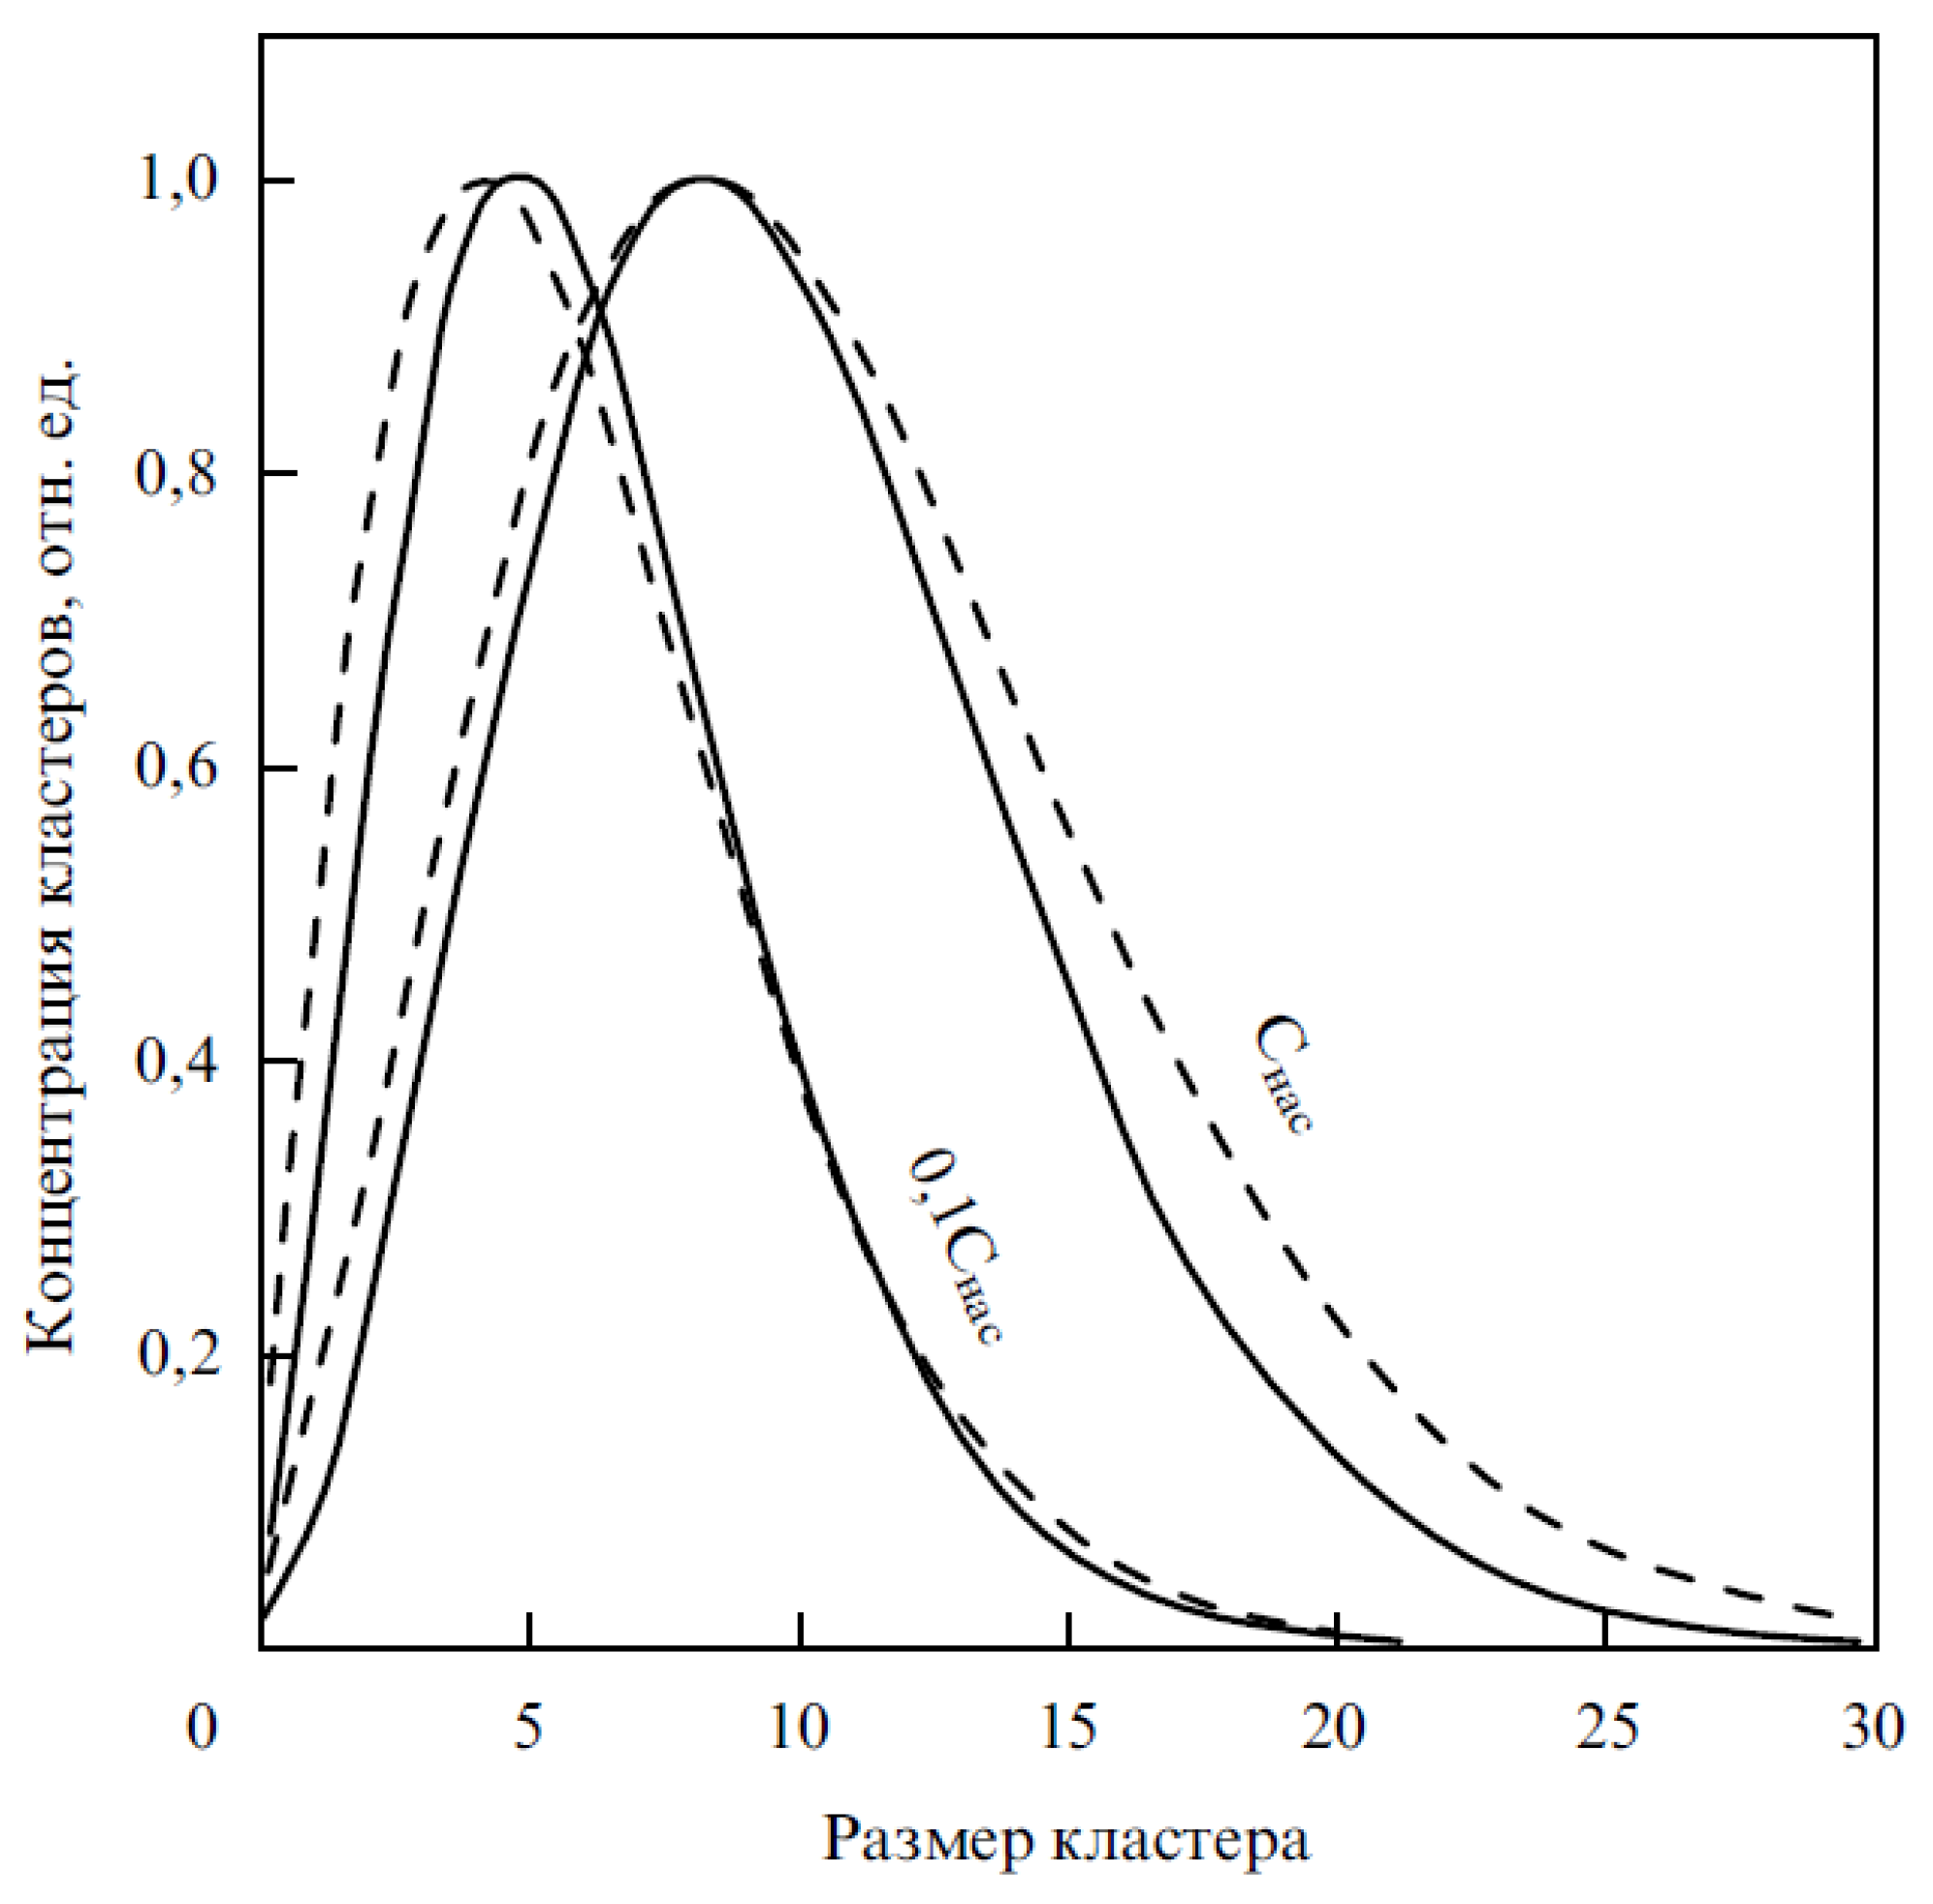
The above-described mechanism has permitted the explanation of the observed experimentally temperature dependence of the fullerene С60 solubility [57] (solid line on Figure 38) and evaluation on the basis on this experiment the cluster size distribution function in dependence on the temperature and solution concentration. The calculation was based on the droplet model of cluster, in accordance to which fullerene clusters present droplets of spherical form. Some results of such calculations are presented on Figure 39 [56] showing the cluster size distribution function at various temperatures and solution concentrations.
The cluster origin of fullerene solubility is reflected on many features of the behavior of fullerenes in solutions. Thus the diffusion coefficient of fullerene clusters is much less of that for single fullerene molecules (for example С70, which do not form clusters) therefore it is possible to realize the procedure of the diffusion separation of different sorts fullerenes in solutions [56].

5.2. Carbon Nanotubes

Carbon nanotubes possess exclusively wide diversity of physical and chemical properties. A high chemical and thermal stability in association with a record mechanical rigidity, high emission characteristics, unique sorption characteristics and high thermal and electric conductivity make this material unique and attract to its investigation and usage a large set of researchers and engineers.

5.2.1. Mechanical Properties

A single walled nanotube can be considered as a thin cylindrical shell. Mechanical properties of such structures are well studied in connection with the development of aviation. While in distinction on macroscopic shells, CNT do not possess a solid wall and have a thickness of the order of an atomic size, the classical notions on the mechanics and elastic properties of cylindrical shells are applicable practically in full to this exotic object.
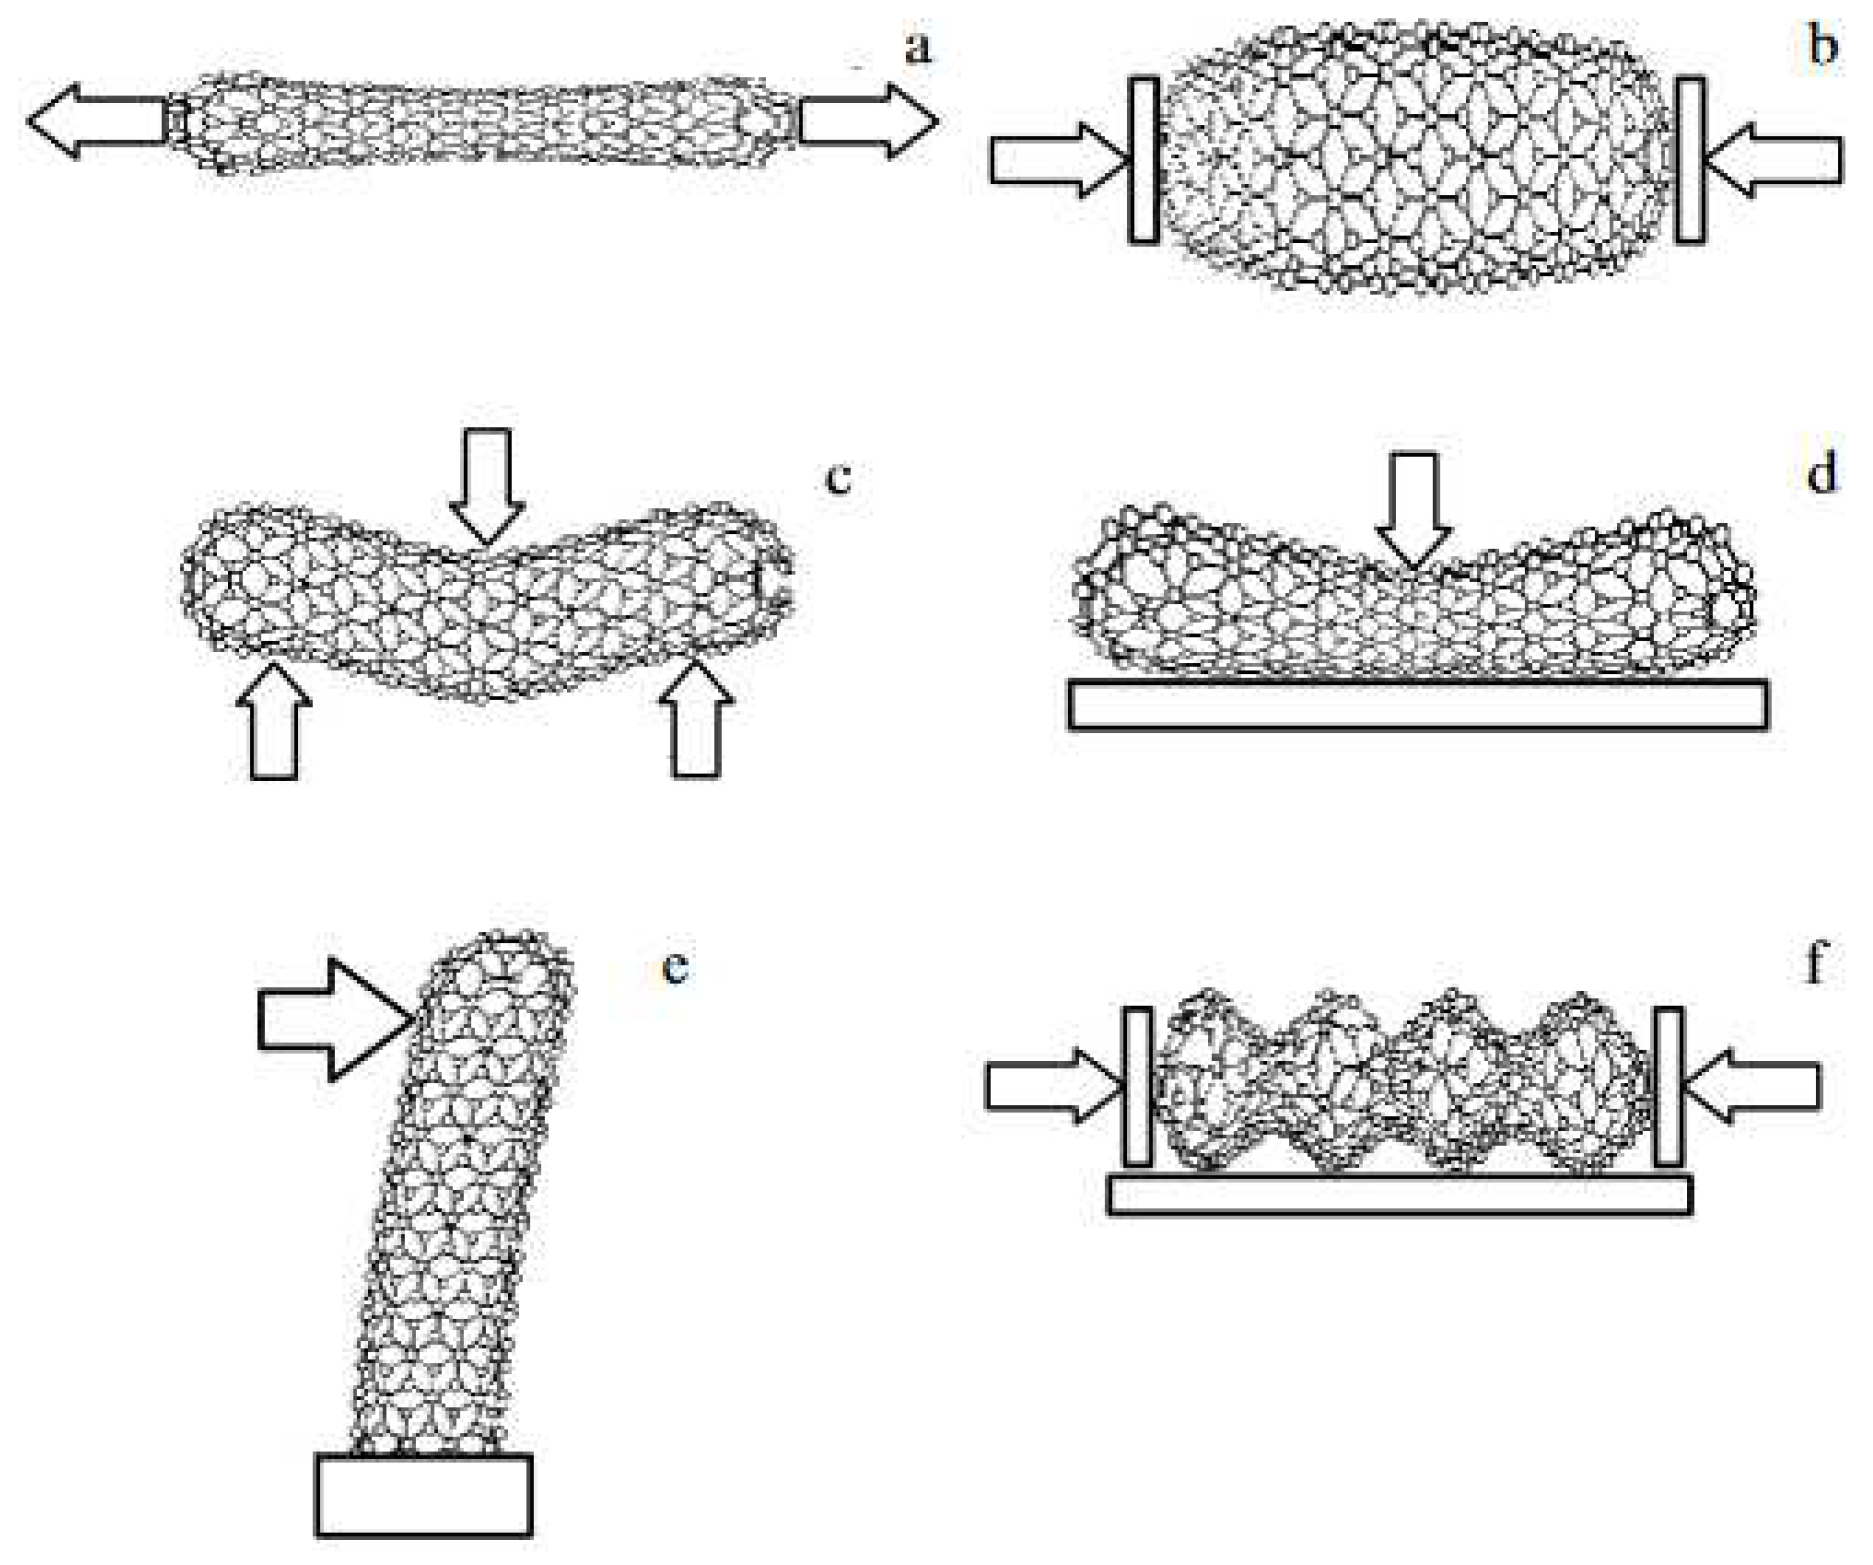
Elastic mechanical properties of an elongated cylindrical shell are characterized by a set of parameters (elasticity modules) which present the proportianelity coefficient between the stress and caused by that deformation of the shell in a specified direction. The elasticity modules are defined at a condition of low loadings when the deformation has a reversible character. Figure 40 prsents the most important deformation types of a single walled CNT. Along with the above-listed deformation types one should note also the torsion of a shall relating to its axis.
The man parameter characterizing the tensile strength of CNTs (Figure 40а) is the longitudinal Young modilus defined by the expression
Е = σ/ε = N/2πRhε,
Here, σ is the longitudinal stress representing the ratio of the longitudinal tensile force N applied to a nanotube to its cross section area, ε is the relative tension (change in the length) of the nanotube due to the action of the force, R is the radius of the nanotube, and h is the thickness of its shell. Expression (5.1) constitutes one of the specific formulations of the Hook law.
For defectless CNTs the Young modulus is expressed through the interaction potential for two neighboring carbon atoms constituting the structure of the nanotube. A simple estimation [59], based on the usage of known parameters of the interaction potential results in the value Е ~ 1012 Pa. This is a record value for all the known materials. However the accuracy of ths estimation is limited because the thickness of the nanotube’s wall h is of the order of the atom soze and is not known exactly. Nevertheless there are known experiments confirming such a high tensile strength of CNTs. Thus Ref. [60] shows the value of the Young modulus of a single walled CNT E = 1.3 ± 0.45 TPa, obtained in result of averaging the data for 27 nanotubes of different length and diameter. The Young modulus for nanotubes was determined on the basis of measuring the free-running frequency of the nanotube with a fixed end. Numerious calculations performed with the usage of the molecular dynamics and other modern approaches result in about similar values. One should note for comparison that the characteristic value of the Young modulus for many substances known as very rigid materials (steel, molibden, copper etc) ranges in the interval 10 – 30 GPa. Therewith the tensile strength of CNTs exceeds th corresponding value for the most rigid materials by several tens times. This difference is explained by relatively small size of CNTs for which occurrence of structural defects has a low probability. Such defects exist allways in the structure of macroscopic materials and their existence limits their mechanical properties. The equilibrium concentration of structural defects is proportional to the factor exp(-D/T), where D ~ 2 - 4 eV is the defect formation energy so that only quite elongated nanotubes (more that 1 μm) possess defects.
The axial compression of a nanotube considering as a thin cylindrical shell is accompanied by an increase of its diameter (buckling, Figure 40b). At low loadings the axial compession has a reversible, elastic character so that the corresponding Youns modulus coincides with that determined for the case of tension. Exceeding some crytical force results in so called Euler instability, which is accompanied with an abrupt decrease of the elasticity modulus and non-reversible distortion of the nanotube’s structure the surface of which is compressed into a “harmonica” (Figure 40f).
The Euler instability at an axial compression of CNTs has been studied in detail by the aithors of Ref. [61]. A highly ordered array of vertically oriented nanotubes of 50 or 100 μm in height and 40 nm in the inner diameter was synthesized in result of pyrolysis of acetilene in the presence of the cobalt catalyst. This array was placed on an anodized aluminium substrate at an average inter-tube distance of 100 nm. Figure 41 presents the schema of the experiment on investigation of the axial compression. The axial compression of CNTs was performed by means of an indentor having a conical tip of 100 nm in radius. There has beer registered both loading and the indentor displayment.
Carbon nanotubes present thinnest filaments which can be utilized for fabrication of a textile in analogy with the textile production on the basis of silk, cotton, linen and other kinds of filaments. Fabrication of textile from filaments is a multi-stage procedure the first stage of which is in preparation of a yarn from individual nanotubes or bundles consisted of hundreds such nanotubes. The process of yarn fabrication from nanotubes is identical with the standard procedure used in the textile production. A CNT array is experienced to spinning which results in the occurrence of a macroscopic length fiber. This procedure is illustrated on Figure 42 where types of ropes fabricated from such fibers are also shown. Figure 43 shows successive stages of fabrication of a transparent textile from the fibers.

5.2.2. Electrical Properties

Electrical properties of a carbon nanotube depend on its chiral structure (see chapter 3.2). Investigations have shown that the nanotubes with the chirality indices (m, n) possess a metal conductivity if m - n = 3к, where к is an integer. Such nanotubes have the chair structure. Other CNTs are semiconductors in which the forbidden gap width decreases in a monotone manner as the diameter increases (Figure 44) [63]. Taking into consideration that a nanotube presents a graphene layer scrolled into a cylinder, such a character of the dependence appears to be natural. The larger the nanotube’s diameter the closer it to graphene in its electric characteristics. Remind that graphene possesses metallic conductivity and zero forbidden gap width.
The measurement of electric characteristics of CNTs presents a complicated technical problem which is caused by a miniature size of a CNT and the resistance of nanotubes is usually lower that the contact resistance. A interesting approach to the solution of this problem has been proposed and realized in Ref. [64] where the resistance of a single walled nanotube was measured using contacts with multi layer CNTs. The role of the contact resistance was eliminated through the usage of four contact method permitting the measurement of the resistance of a nanotube fragment in dependence on its length. The schema of the measurement is shown on Figure 45.
In the absence of defects an electron propagates along a conductor without scattering. Such a type of conductivity has a quantum character and is called as ballistic. The relevant value of the ballistic resistance is expressed as
Ro = 1/(2Go) = h/4e2 = 6.45 KΩ.
In the case of ballistic conduction both resistivity ρ = RoS/l of quantum objects and their specific conductivity σ = Gol/S depend on the sample length l and cross section area S. Thus the dimension effect manifests itself that is inherent to objects of a nanometer size which are CNTs.
The conduction properties of a single walled CNT were studied experimentally in dependence of the inter-contact distance in Ref. [65]. Results of these measurements are presented on Figure 46 which illustrates the transition of the ballistic conduction into the Ohmic one. At low distance (less ~ 8.5 μm) the ballistic conduction occurs, so that the conductance does no almost depend on the inter-contact distance. Obviously a CNT fragment of such a length does not contain almost defects, so that the ballistic conduction occurs. At further enhancement of the inter-contact distance the probability of defect occurrence increases and the conductance lowers abruptly. The ballistic conduction mechanism is substituted by the Ohmic one for which the nanotube resistivity is proportional to its length. The similar behavior relates to the thermal conduction of a CNT, which has ballistic character for short inter-contact distances and transforms to the diffusion thermal conductivity for elongate CNT.
The dependence of the resistance R of a nanotube on its length L is convenient to describe by the interpolation formula
R = (h/4e2)(L + λ)/λ,
where λ is the mean free path of an electron relating to the scattering on defects. This formula describes the transition from the ballistic (L << λ) to Ohmic (L >> λ) charge transport. As it follows from numerous measurements, the value of parameter λ ranges between 0.5 and 10 μm, in dependence of the method and conditions of nanotubes fabrication.

5.2.3. Thermal Conduction of CNTs

The thermal conduction of CNTs is determined by phonons so that the role of electrons is not sufficient. If the characteristic mean free path of phonons in relation to the scattering on structural defects and phonons exceeds its length, the ballistic heat transport occurs, when phonons transfer the thermal energy without scattering. The simplest description of the ballistic phonon thermal conduction corresponds to the high temperature limiting case which occurs at the condition ħω << T (ω is the characteristic phonon frequency, Т is the temperature). In this case the thermal conductance of each channel is described by the quantum value Gth, having the following form:
Gth = π2k2T/3h = 9.46x10⁻¹³ (W/К2)Т.
Therewith the ballistic thermal conductance of a defectless nanotube is expressed as the product of the quantum thermal conductance Gth by the total number of phonon channels Np in the nanotube. The latter is a tripled number of atoms in a single cell N, where N is expressed through the chirality indices (m, n) as follows [52]:
N = 2(n2 + m2+nm)/dR.
Here, dR is the greatest common divisor of (2n + m) and (2m + n). For a single walled CNT having the armchair structure and chirality indices (n, n) dR = n and N = 6n. For example, a single-walled CNT which the chirality indices (10, 10) (diameter 1.4 nm) has Np = 120 phonon channels. Therefore, the ballistic thermal conductance of (10, 10) and (200, 200) CNTs amounts to 120 Gth and 2400 Gth, respectively.
The scattering of phonons on defects and impurity centers can be taken into account by analogy with the above-considered description of the ballistic electric conduction of CNTs at the presence of defects by the usage of the correcting factor kd = (L + λp)/λp, where λp is the mean free path of phonons in relation to the elastic scattering and L is the nanotube’s length. In accordance with this approach the thermal conduction coefficient of a nanotube is expressed through the following relation:
G = Gthp/(L + λp),
where the quantum thermal conductivity Gth and the number of phonon channels N are determined by the relations (5.3) and (5.4). The above-described approach to the description of the CNT thermal conduction is quite convenient for analysis of experimental data, because it permits determination of the heat transport mechanism on the basis of experimental dependence of the thermal conductance on the nanotube’s length. As it follows from Eq.(5.5), the thermal conductance of a long nanotube (L >> λp) is inversely proportional to its length. It is one more manifestation of the dimension effect which is inherent to nanosize objects.
Dependence of the thermal conductance of a long single walled nanotube of the inter-contact distance has been presented on Figure 46 (curve 1). In analogy to the electric conductance, the thermal conductance does not practically change for the inter-contact distances less 8.5 μm after which it decreases abruptly. Such a behavior indicates the ballistic character of the thermal conduction for the nanotube fragment shorter than 8.5 μm and the occurrence of defects and other scattering centers on longer distances.

5.2.4. Emission Properties

As is known, elongated conducting object are able to amplify the electric field. If such an object having the length L and diameter d to place vertically on a grounded substrate inserted into an inter-electrode gap of d in width apply an electrical field with the voltage of U, then the electric field in a vicinity of the tip of such an object will exceed the averaged over the gap value F = U/d by about L/D times. Hear the ratio L/D is called as “aspect ratio”. Carbon nanotubes possess record value of aspect ratio reaching 104. This permits one to obtain high electric field at a relatively low applied voltage. At such fields the nanotube if a source of an electron beam due to the electron field emission phenomenon. This phenomenon is based on the effect of quantum tunneling of electrons residing inside a grounded conductor through the barrier formed by the conductor lattice and external electric field (Figure 47). A simple quantum mechanical approach has resulted on the following dependence of the electron forld emission current density j on the electric field strength F, called as Fowler-Nordheim equation:
j = C1F2exp(-C2/F),
where the parameters С1 and С2 are expressed through the electron work function φ for the conductor under consideration and basis constants (electron charge and mass e and m and Plank constant h):
C1 = e3/8πhφ; C2 = [8π(2m)1/2φ3/2]/3he.
The emission current I is determined in result of integration of the current density J over the surface of the emitter.
The Fowler-Norheim equation (5.6) has rather approximate character, because it was derived supposing a plane geometry of the emission source. However this equation describes quite well evission properties of CNTs the geometry of which is distinguishes from the plane one. This follows in particular from the results of measuring the current-voltage characteristics of CNTs presented on Figure 48. As is seen, the dependences of ln(I/V2) versus 1/V, presented in the Fowler-Nordheim coordinates keep the straight shape for the emission current alternating within the range of more than four orders of magnitude. This permits the usage of this equation for analysis and processing of numerous experimental data.
The ability of an emitter to enhance the electric field is characterized by the field amplification factor β, which is defined as the ratio of the real magnitude of the electric field strength E to the average value Eo:
β = E/Eo =ED/U
where D is the inter-electrode distance, U is the applied voltage. Since the value of the aspect ratio for CNTs can reach 103 and even higher, the electron field emission of nanotubes occurs at much lower values of the applied voltage than in the case of conventional electron field emitters. This offers an opportunity for the development of a new generation of electro-vacuum devices distinguished by a lower level of the applied voltage and power consumption. The dependence of the electric field amplification factor on the geometry of the nanotube and interelectrode gap is determined through the solution of the Laplace equation for a ground CNT with the boundary conditions corresponding to zero potential on the cathode surface and a fixed value of the potential on the anode surface. The numerical calculations allow the determination of the electric field strength within the gap space and, therefore, the evaluation of the field amplification factor according to Eqn (5.8). An example of such a calculation has been performed in Ref. [67,68]. As is seen, the aspect ratio dependence of the field amplification factor is close to the linear one:
βh/d.
The calculations were done for an individual nanotube 10 nm in diameter and of various heights. The inter-electrode gap was set to 200 mm, and the applied voltages to 1000 V. performed for a nanotube 10 nm in diameter and of variable length. The interelectrode gap is 200 mm, and the applied voltage is 1000 V. The degree of sensitivity of the field amplification factor of a nanotube, β, to the structure of its end tip is determined through the calculations of the aspect ratio dependences of this factor performed for nanotubes with various tip structures [67,68]. Figure 49 a - e demonstrate five types of tips for which the calculations were performed: (a) hemisphere; (b) cone with a vertex angle of 90; (c) open hollow cylinder with a wall 1 nm in thickness; (d) flat cap, and (e) cone with a vertex angle of 30 . The calculated results obtained for various nanotube’s tip are given in Figure 49f. As is seen, a change in the tip structure results in a corresponding variation in the field amplification factor within the range of 5±7%. A notably higher value of the field amplification factor is observed for a conical cap with a cone angle of 30o. In this case, the tip's structure produces an additional field amplification effect.
Figure 49. (a) – (e) Various types of the nanotube’s tip used in the calculation of the dependence of the field amplification factor on the aspect ratio: (a) hemisphere; (b) cone with a vertex angle of 90o; (c) open hollow cylinder with a wall 1 nm in thickness; (d) flat cap, and (e) cone with a vertex angle of 30o; (f) results of such calculations performed for the inter-electrode gap of 200 mm, the applied voltages to 1000 V, the nanotube diameter of 10 nm and of variable length.
Preprints 89513 g050
The above-cited calculations were performed for a large interelectrode distance D comparing to the nanotube's height h. In the case of an interelectrode distance comparable to the nanotube’s height the factor β should depend not only on the aspect ratio of the nanotube but also on the ratio h/D. Thus, if a nanotube with a flat cap is spaced from the anode surface by a distance D which is much shorter than the nanotube's diameter d, the nanotube and the anode surface can be considered as a flat capacitor. For this configuration the electric field strength E1 in the space under consideration is expressed as E1 = U/D. Since the average magnitude of the electric field strength in the gap is Eo = U/(h + D), the approximate relation for the field amplification factor β in these conditions is has the following form:
β = E1/EoU(h +D)/DU ≈ (h+D)/D.
Usually as an electron emitter is used rather not a single CNT but an array containing a large quantity of vertically oriented nanotubes. These emitters differ from each other in their geometry, orientation, electronic properties etc. Therewith the electrical field amplification factor for nanotubes is characterized by a statistical spread. Due to a sharp character of the dependence of the current of an individual CNT on the electrical field strength in a vicinity of its tip and hence on the amplification factor, the main contribution into the emission is caused usually by a minor quantity of nanotubes for which the amplification factor has a maximum value. As a rule these are the highest nanotubes growing out from the array. As the applied voltage increases, the relative contribution into the emission of remainder nanotubes enhances. Therefore the emission characteristics of a cathode combine the current-voltage characteristics of individual CNT, however they can differ essentially from the dependence determined by the Fowler-Nordheim equation (5.6). Figure 49 presents the results of the analysis of the influence of the statistical spread of CNTs parameters on the current-voltage characteristic and emission properties of an array. As is seen (Figure 49a), the largest difference between the current-voltage characteristic of an array and the Fowler-Nordheim function (5.6) occurs at low emission currents. In this range the difference can be multifold. The effect of the statistical spread of CNT parameters in an array is manifested also in the images of the distribution of the glow generated by the electron beam over the anode surface covered with a phosphor (Figure 49 (b) – (d)). At low voltages and emission currents (Figure 49b) this distribution has a strongly non-homogeneous character and contains a set of disordered bright spots. As the applied voltage increases the nanotubes with lesseer value of the field amplification factor are engaged, and the glow became more homogeneous (Figure 49 (c) and (d)).
Figure 49. Illustration of the influence of the statistical spread of CNT parameters on operation characteristics of the electron field emitter cathode; (а)comparison of the Fowler-Nordheim dependence (5.7) (dash-dotted line) with the calculation result obtained with taking into account the statistical spread of CNT parameters [67] and with the results of measurements [68] (dots). (b) – (d) images of the distribution of the glow intensity over the phosphor surface obtained at various values of the electrical field strength and emission current [68].
Preprints 89513 g051
One more reason of distinction of the current-voltage characteristic of a CNT array from the Fowler-Nordheim dependence (5.7) relates to a distortion of the electrical field in a vicinity of an individual nanotube engaged into the array under the screening action of neighboring CNTs. This action causes the dependence of the electrical field amplification factor β on not only the aspect ratio of individual nanotubes but also on the geometry of the array and the density of the CNTs arrangement in it. The screening effect manifests itself in a non-monotone dependence of the emission current density on the density of the CNT arrangement in the array. If nanotubes adjacent to each other, the array should be considered as a single emitter whose diameter corresponds to that of the array. In this case the amplification factor is rather minor corresponding to the ration of the height of the array to its diameter. The maximum emission current density is reached at an inter-tube distance of the order of the height of nanotubes comprising the array. If nanotubes are placed far from each other the effect of the electrical field amplification is maximum corresponding to the aspect ratio of an individual nanotube however the emission current density will be rather minor due to a low arrangement density of nanotubes on a substrate. Therefore, the electrical field amplification factor increases in a monotone manner as the average inter-tube distance in the array enhances, while the emission current density depends on this parameter in a non-monotone manner. Figure 50 presents these dependences calculated on the basis of the solution of Laplace equation for a CNT array [69], представлены на рис. 48. As s seen the maximum emission current density is reached at an inter-tube distance of an order of the array’s height.
Enhancement of the nanotube’s temperature due to Joule heating during the emission can change the emission characteristics of the nanotube. These changes can be reflected on both transport characteristics of a CNT( electric conductivity, thermal conductivity) and its emission ability. Indeed a conductor heated up to a high temperature is able to emit electrons even at rather low values of the applied voltage (thermo-electron emission). This occurs due to the existence in a heated conductor of high energy electrons which are able to overcome the potential barrier formed by the crystal lattice. Therefore one can expect for the transition from electron field emission to the thermo-electron emission. Such a transition has an avalanche-like character and can be treated as an instability occurring at exceeding some value of the applied voltage [70]. The physical mechanism of this instability relates to the distortion of the emitter’s thermal balance, when the heat released in result of the Joule heating can’t keep up to remove in result of yjr thermal conductivity. This results in an avalanche-like enhancement of the temperature and the transition from the electron field emission to the thermo-electron emission. This transition is reflected on the current-voltage characteristic of the emitter which is deviated from the Fowler-Nordheim dependence in these conditions. As an example can be considered the current-voltage characteristics of an individual CNT measured in Ref. [71] and calculated in Ref. [70] at various assumptions on the temperature dependence of the thermal conductivity and electric conductivity coefficients (Figure 51). As is seen at high emission currents the current-voltage characteristics differ considerably on the Fowler-Nordheim dependence which is caused by the transition of the emission mechanism from the field one to the thermo-electronic.

5.2.5. Sorption Properties

Sorption properties of CNTs are related to the occurrence of a cavity inside a nanotube which can be filled with not only atoms and molecules but also various liquid or solid substances. One should not that a liquid can penetrate into a nanotube with the open end due to the capillary drawing in effect. Thus filling a nanotube with liquid lead resulted in formation of a thinnest wire of 1.5 nm in diameter [72]. Results of investigations indicate an interconnection between the magnitude of the surface tension of a substance and its capacity to be capillary drawn inside a carbon nanotube. Some of these results are summarized in Table 5 where the experimentally established possibility of capillary drawing various liquid substances is corresponded with the value of the surface tension of these liquids. As is seen capillary properties manifest themselves only in relation to the substances having rather low (less 200 mN/m) surface tension value.
An interest to the problem of filling CNTs with metals and other substances is caused to a large extent by a possibility of a directional impact on electronic characteristics of CNTs. Thus a metal atom inserted into an inner cavity of a nanotube demonstrates a trend to the transition of a valence electron to the external surface of the nanotube нанoтрубки, containing non-filled electron states. The movement of electrons through these states provides an additions mechanism of the conductivity. Thus filling CNTs with potassium or Br2 results in enhancement of the room temperature conductivity of a CNT sample by 20 – 30 times [74]. Besides of that, filling nanotubes with various substances provides changing the band structure of electronic states and the Fermi level position. Therewith filling nanotubes is an effective tool for control their electronic characteristics.
In some cases the substance filling a nanotube forms a regular crystalline structure inside its inner cavity. Investigation in such structures promotes better understanding the principles of self-organization of a substance. As an example of such investigation can serve Ref. [75] the authors of which have observed a regular crystal KI of 2х2 in size grown inside a single walled nanotube of 1.4 nm in diameter. The electron microscope image of such a crystal is shown on Figure 52. Observations have indicated that the structure of KI crystal situated inside a CNT differ from that of a macroscopic crystal. Thus the lattice constant of the nanocrystal (0.4 nm) exceeds the corresponding value (0.35 nm) for a macroscopic crystal.
There are possible chemical transformations resulting in a change of the chemical content of the substance filling a nanotube. Thus electron beam irradiation with the energy of 300 KeV of single walled nanotubes filled with ZnCl4 crystal results in decomposition of the molecules which is accompanied with the avulsion of Cl2 molecule and the partial reduction of Zn after which the clusterization of the remained structure ZnClx (x < 4) followed by the spatial cluster separation is observed [76]. Figure 53 presents idealized high resolution electron microscope images of the structures observed at various points in time. The final result of the described procedure is the formation of Xn nanocrystals that possess the properties of quantum dots and can be considered as super-miniature elements of nanoelectron devices.

5.2.6. Peapods

The characteristic value of diameter of single walled nanotube accounts 1 – 1.5 nm. This is quite sufficient for filling CNT with not only atoms or molecules of various substances but more complicated molecular structures. One of the most interesting objects formed at filling CNTs with a condensed substance is obtained as a result of filling a nanotube with fullerene molecules. Such a structure is caked as peapod. The fullerene molecule С60 has a diameter of about 0.7 nm. Besides of that the equilibrium distance between hexagonal layers is about 0.34 nm. Therefore a nanotube can be filled with fullerene molecules С60 under the condition that its diameter exceeds 1.38 nm. One should not that such a diameter is inherent to nanotubes with the chirality indices (10, 10) having the armchair structure. Such nanotubes are formed in a large quantity at the usage of plasma methods of synthesis. In analogy to endohedral fullerenes that are labeled as Мkn (fullerene molecule Сn containing k atoms of the element М) peapods are labeled sometimes as Cn@SWNT (SWNT is a single walled carbon nanotube). Peapods С60@SWNT were synthesized firstly by the authors of Ref. [77] who used for filling CNTs a suspension containing nanotubes and С60 fullerenes in a mixture of nitric acid and sulfuric acid. The obtained material contained single walled CNTs of about 1.4 nm in diameter partially filled with С60 molecule chains. The distance between the centers of molecules accounted about 1 nm which is close to that in fullerite crystal. The degree of filling the nanotubes with fullerene molecules reached of 5.4%.
The most spread method of filling peapods is based on the usage of fullerene vapor at elevated temperatures (500 – 800 К). In this case nanotubes with open end are kept in fullerene vapor which results in their partial or full filling.
An important distinctive peculiarity of peapods relates to an enhanced chemical stability of fullerene molecules enclosed into the CNT envelope. Therewith the nanotube wall serves as a protecting film avoiding the decomposition of the encapsulated substance under the influence of an external chemical action.
Single walled nanotubes can be filled with not only С60 fullerene molecules but also С70 molecules the structure of which reminds the rugby ball. С70 molecule is characterized by two sizes, longitudinal and transverse, which suggests a possibility of occurrence of two types of C70 peapods having structures with differed from each other character of the orientation ordering of C70 molecules inside the nanotube. Such a difference was observed by the authors of Ref. [78] who filled CNTs of 1.37 nm in diameter with С70 molecules and found two types of peapods differed from each other in the average distance between the centers of molecules (1.0 ± 0.01 and 1.1 ± 0.01 нм). These two types of peapod correspond to the longitudinal and transverse orientation of С70 molecules. Measurements imply that the ratio of the number of peapods with the longitudinal orientation to that with transverse ordering accounts 7:3.
Interesting peculiarity in the character of filling nanotubes with fullerene molecules have been established by the authors of Ref. [79] who used not single walled but two walled CNTs for this purpose, The distance between the inner and outer layer in such a structure is equal always to 0.335 nm, while the diameter of the inner tube ranges between 1.0 and 2.6 nm. A sample CNTs was kept in concentrated nitric acid for two hours in order to open the ends, after which it was dried and was experienced to the action of fullerene С60 vapor for 24 hours at a temperature of 500 – 800 К. This resulted in formation of peapods with the filling degree depending on the temperature and reaching 100% at a temperature of 800 К. Transmission electron microscope observations indicate a variety of endohedral structures formed at filling CNTs with fullerenes.
The structure of peapods formed by fullerene molecules and presented on Figure 54 depends on the diameter of the inner CNT. In nanotubes of less than 1.45 nm in diameter С60 molecules form a practically homogeneous linear chain. For nanotubes with the inner diameter exceeding 1.45 nm the arrangement of type “zigzag” is observed (Figure 54a). Therewith the positions of C60 molecule centers are placed in one plane and form a sawtooth line. Further enhancement of the nanotube’s inner diameter is accompanied by a complication of the inner structure of the fullerite crystal.. The centers of fullerene molecules display relating to the nanotube axis and form a spiral structure inside the nanotube. The helix pitch of this structure depends on the inner diameter of the nanotube (Figure 54 b). The nanotubes with the inner diameter exceeding 2.6 nm are able to accommodate in the cross-sectional plane up to four fullerene molecules (Figure 54c).
The further development of investigations addressed to the fabricating and studying peapods has resulted in the creation of nanotubes filled with endohedral fullerene molecules i. e. fullerene molecules containing one or several encapsulated atoms in their inner cavity. The structures formed therewith are labeled as Mk@Cn@SWNT. Thus there were produced and studied the peapods formed in result of filling single walled CNTs of 1.4 nm in diameter with endohedral fullerene molecules La2@C80 [80]. Investigations have shown the equilibrium distance between La atoms in the molecule La2@C80 enclosed into the nanotube (0.47 nm) exceeds notably the corresponding value for an isolated La2@C80 molecule. Such a distinction is caused by the action of the nanotube whose diameter is slightly lesser than the diameter of La2@C80 molecule plus the optimal value of a gap between the fullerene molecule surface and nanotube wall (2 х 0.34 nm). Therefore the metal-fullerene molecule is exposed to the action of compression forces from the nanotube wall which results in a change of the equilibrium distance between La atoms.
Parameters of the 1D crystal formed in result of filling a single walled nanotube with endihedral fullerene molecules can differ notably from those of the 3D crystal. The reason of such a difference is in the partial or total transition of valence electron found on the external metal shell onto the surface of the fullerene molecule. Therefore the atomic rest situated inside the fullerene cavity possesses a positive charge the interaction of which with the charged fullerene surface or another rest (if it exists) results in a definite localization of the metal atom inside the fullerene cage. The position of the atomic rest is usually displaced notably relating to the center of the fullerene molecule, and if the fullerene cavity contains more than one atomic rest they are found at a considerable distance from each other.
The displacement of the charge atomic rest relating to the center of an endohedral fullerene molecule determines the occurrence of a considerable dipole moment at such a molecule. This promotes the formation of an ordered crystalline structure inside the nanotube filled with endohedral fullerene molecules. Dipole moments of endoheddral fullerene molecules are arranged in a similar manner. Such a structure has been observed in particular in Ref. [81], devoted to the production and investigation of peapods Gd@C82@SWNT.

5.2.7. The Problem of Hydrogen Storage

The interest to sorption characteristics of CNTs relates largely to the problem of hydrogen storage, the solution of which can result in the creation of an ecologically clean auto-transport. Usage of gaseous hydrogen as a fuel in the auto engine permits one to avoid practically fully the environmental pollution with harmful emissions, because the only product of the hydrogen oxidation is water vapor. Therewith it is assumed that the hydrogen production from water can be performed with the usage of the energy of nuclear or wind energy plants during a decreased loading. However on this way arise the problems of gaseous hydrogen safe storage the effective solution of which determines the possibility of thr development of ecologically save transport.
The possibility of usage of carbon nanomaterials for hydrogen storage is determined by two circumstances. Firstly, these materials possess a purely surface structure which permits one to consider them as the most proper object for filling with a gaseous substance through the physical sorption. In this case the quantity of the adsorbed substance is proportional to rather the surface are of the structure but not its volume so that the systems with maximum specific surface are characterized by the highest sorption ability. Secondly, carbon nanostructures possess as a rule with a good electric conductivity which in combination with a high specific surface area permits their usage as a basis of electrochemical devices. Therewith filling a carbon nanomaterial with a gaseous substance occurs in result of a surface electrochemical reaction. Finally one should note that such carbon nanostructures as nanotubes, nanospheres and nanofibers possess an inner cavity which under favorable conditions can be filled in a reversible manner with a gaseous substance. In such a situation not only surface gas sorption but also volumetric filling the cavity occurs, so that the degree of filling the material with a gaseous substance can exceed notable that reached at the surface physical sorption.
The first experiments addressed to filling CNTs with hydrogen have shown encouraging results. These experiments have been reviewed in detail in Ref. [82]. According to results of these experiments, the quantity of hydrogen which is managed to insert into a material containing CNTs in a reversible manner reaches 67% from the material mass. Such a quantity is more than enough for the solution of the hydrogen storage problem and creation of the ecologically safe auto transport. However the mentioned results have not been confirmed in subsequent works, where the quantity of adsorbed hydrogen does not exceeds 1 – 2 % (by weigth).
Contradictive results of experiments on filling CNTs with hydrogen encourage one to estimate the maximum quantity of hydrogen that can be absorbed by the material in result of physical sorption. The maximum sorption ability of a graphene layer in respect to molecular hydrogen can be estimated supposing that this layer is covered with a monomolecular hydrogen film. It is naturally to suppose that the maximum surface density of hydrogen in the monomolecular layer σН = 2.56 х 10-9 g/cm2 corresponds to the density of liquid hydrogen ρН ≈ 0.07 g/cm3. At such a suggestion the maximum sorption ability of a graphene surface is estimated by the expression
ηН = σН/(σС + σН) ≈ 3.2 % (weight),
where σС = 7.7 х 10-8 g/cm2 is the surface density of the graphene layer. In the case of two-side coverage of the graphene surface with monomolecular hydrogen layers the result of the performed estimation doubles: ηН ≈ 6.4 % (by weight). However one should take into consideration that multi-layer crystalline structures (crystalline graphite, multi-walled nanotubes, single-walled nanotube bundles etc) are characterized by the inter-layer distance about 0.34 nm, which is comparable to the gas kinetic size of the hydrogen molecule (about 0.3 nm. Therefore it is hard to expect the two-side coverage of all the surfaces with hydrogen monolayers which just don't fit in between graphene layers. Thus the estimations performed have shown that at the surface coverage of a multi-layer graphene structure the degree of molecular hydrogen filling hardly can exceed 3% (by weight).
In the case of volumetric filling the inner caavity of CNT with hydrogen but not the surface surption the quantity of stored hydrogen depends on the nanotube’s diameter. Thus if a nanotube is filled with liquid hydrogen thrr maximum, filling degree is expressed as follows
ηН = ρН/(ρН + ρt)
where ρt = 4σC/D = 30.4/D g/cm3 is the density of the nanotube material, D is the nanotube’s diameter, 10-8 cm. This results in the following dependence of the sorption ability of a CNT η on its diameter D:
ηН = ρН/(ρН + ρt) ≈ 0.07/(0.07 + 30.4/D).
As is seen, the hydrogen filling degree of a nanotube enhances as its diameter increases. The typical value of the diameter of nanotubes synthesized by thee above-described methods ranges usually between 1.2 and1.5 nm, so that the maximum hydrogen filling degree for such CNTs accounts 2.7 – 3.4 % (by weight). The filling degree ηН = 6.5 % sufficient for the usage of CNTs as the basis of hydrogen storage technology is reached if the nanotube’s diameter exceeds 3 nm. Therefore the analysis performed shows that the usage of CNTs is hardly effective tool for solution the hydrogen storage problem and development of ecologically safe car engines. Graphene.

5.2.8. Phonons

Thermophysical characteristics of graphene (heat capacity, thermal conductivity, thermal expansion coefficient) are determined by phonons which are the vibrations of the crystalline lattice. Peculiarities of the phonon spectrum of graphene and graphene=based materials relate to the 2D structure of the graphene sheet. Graphene possesses the hexagonal structure with two carbon atoms in each cell which results in six phonon branches in the dispersion spectrum: three optical (LO, TO, ZO) and three acoustic (LA, TA, ZA). Yje phonon modes LA and TA correspond to longitudinal vibrations of carbon atoms within the graphene plane. The mode ZA corresponds to vibration of carbon atoms in the direction perpendicular to that of vibrations LA and TA modes with escaping atoms from the graphene plane.
Exploration of phonon characteristics and the lattice vibration dynamics is usually performed using the Raman spectroscopy. [5]. Interaction of the incident optical radiation with vibrations of the crystal lattice atoms results in its inelastic scattering on crystal atoms. In result of this interaction the spectrum of the scattered radiation contains along with the incident radiation line also satellite lines the frequencies of which differ from the incident radiation one by the lattice vibration natural frequencies. Both the frequency and the intensity of the scattered light depend on the temperature and incident radiation frequency so that the Raman spectrum of a material contains the information on its temperature. In the case of non-homogeneous distribution of the temperature the coordinate dependence of the Raman spectrum permits the determination of the character of such a distribution. In graphene similarly to graphite the most intense Raman lines are the peaks G and D (1580 и 1350 cm-1), the first of which corresponds to the mode related to symmetric vibration of sp2 bonds while the second one is determined by defects in graphene structure. Figure 55 presents a typical Raman spectrum of graphene [5].

5.2.9. Thermal Conductivity

As it follows from the results of numerous measurements, graphene possesses the highest room temperature thermal conductivity between all the known materials. Its thermal conductivity coefficient accounts 4800 – 5300 W/m K, which exceeds the corresponding value for diamond (3320 W/m K) and single walled CNTs (3500 W/m K). The thermal conduction of graphene is determined by phonons, and extraordinary high value of this parameter relates to a miniature size of the sample for which the existence of defects has rather low probability. The thermal conductivity of a defectless graphene at a room and higher temperatures is limited by the phonon-phonon scattering.
The most effective approach to the measurement of the thermal conductivity of graphene is based on the temperature dependence of the Raman spectrum of this material [83]. In accordance to this approach a laser beam of about 0.5 – 1.0 μm in diameter is focused onto the center of a graphene sheet suspended between supports like bridge. This causes a heating of the central region of the graphene sample by several yens degrees. The temperature of the heated graphene region is determined on the basis of results of measuring the shift of the peak G position in the Raman spectrum. At a relatively low heating the dependence of the local temperature enhancement on the laser radiation intensity has a linear character so that the factor in this dependence is proportional to the thermal conductivity coefficient of graphene.
Figure 56 presents the schema of the experiment on measuring the longitudinal thermal conductivity of graphene [83]. As a substrate was used a Si/SiO2 plate having a set of longitudinal surface tranches of about 300 nm in depth an up to 5 μm in width. The substrate was covered with a large quantity of graphene sheets produced by micromechanical exfoliation of pyrolytic graphite. Then longitudinal graphene samples having close to rectangular form and covering a trench like a bridge were selected by means of a Raman spectrometer. Argon ion laser with the wavelength of 0.48 μm was used as a source of radiation. The focal spot size was about 0.5 μm, however the size of the heated region increased up to 1 μm due to the electron diffusion. The value of the thermal conductivity coefficient measured by the above-described method turned out to be in the range of 4840 – 5300 W/m К. Treatment of the measurement results permitted also the determination of the diffusion mechanism of the heat transport. According to the analysis the phonon mean free path relating to the scattering is equal to λр ≈ 775 nm. This value is much lesser than the characteristic size of the graphene samples (5 – 10 μm) which indicates a prevailing role of the diffusion heat transfer mechanism over the ballistic one.
The measurement results imply that the thermal conductivity of graphene exceeds more than twice the relevant value for graphite (κ ≈ 2000 W/m К), which presents the structure consisted of a set of graphene layers. One can conclude from this that the occurrence of neighboring layers situated on the distance of 0.34 nm lowers the thermal conductivity coefficient of graphene. This is caused by inter-layer interaction determining an additional mechanism of phonon scattering. The dependence of the thermal conductivity coefficient of graphene on the number of layers in the sample was measured by the authors of Ref. [84] who used the above-described method based on the Raman spectroscopy. The few layer graphene samples were obtained by the micromechanical exfoliation of pyrolitic graphite. The number of layers in the samples under investigation was determined on the basis of processing the Raman spectra. The quantities of the thermal conductivity coefficient of the samples were evaluated using the temperature shift of G-line (ω ≈ 1579 см-1) of the Raman spectrum under the action of the laser radiation which was agreed with the solution of the heat conductivity equation by the finite difference method. The measurements results are shown on Figure 57.
One should note that the main physical reason of the recordable thermal conductivity of graphene relates to a miniature size of samples that does not practically content defects. Enhancement of the sample size provides an increase of probability of defect occurrence, which results in lowering the thermal conductivity coefficient. Figure 58 presents the dependences of the thermal conductivity coefficient on the concentration of vacancy defect (a) and defects related to OH adducts (b) calculated within the frame of various models [85]. As is seen the thermal conductivity of graphene at a defect content on the level of 1% is an order of magnitude lowers that that for defectless graphene.

5.2.10. Mechanical Properties

Mechanical characteristics of graphene are similar to those for carbon nanotubes for which the Young modulus has a recordable value (on the level of TPa). Such a high magnitude of the mechanical rigidity is caused by a miniature size of nanocarbon samples (CNT, graphene) for which the probability of defect existence lowering the graphene rigidity is rather low. Figure 59 presents the dependence of the Young modulus of a graphene ribbon on its area calculated by the quantum chemistry method [86]. These data are in a qualitative agreement with results of a direct experiment [87] where the interconnection between the tensile load and stretch value was measured. The Young modulus determined in such a manner turned out to be equal to (1 ± 0.1) TPa. This value is close to that for defectless carbon nanotubes. For the comparison one should not that the Young modulus of a steel cable is of about 5 GPa i. e. about 200 times lower than that for nanocarbon.
The tensile strength of graphene was determined on the basis of direct measurements of the load providing the destroy of the sample. The result of evaluation of this parameter depends on the assumed value of the thickness of a graphene layer. Supposing that the thickness of a graphene layer is equal to 0.335 nm one obtains the tensile strength of graphene accounts 130 ± 10 GPa at a maximum value of the relative tension of 0.25.

5.2.11. Electrical Properties

Each carbon atom included into graphene possesses a free electron which is able to move along the lattice under the action of the electric field. This determines the conductivity of graphene. Important parameter determining electrical properties of a conductor is the mobility of charged particle μ that is defined as the ratio of the drift velocity of charge curriers w to the magnitude of the electrical field F. The electron mobility is graphene is determined by the measurement conditions and defect content which in its turn depends on the synthesis conditions. Thus if the graphene sheet is placed on a SiO2 substrate, the electron mobility accounts 10000 – 15000 cm2/V s, as it follows from the measurements [88]. The electron mobility in graphene suspended between two electrodes at a temperature 5 K reaches the value 200000 cm2/V s [88,89].
The electric resistance of defectless graphene samples has a ballistic character and is expressed by Eq. (5.1), similarly to defectless CNTs. Structural defects present the scattering centers for electrons of conductivity so that the occurrence of such centers lowers the conductivity of the material. An enhancement of the sample size is accompanied with a transition from ballistic to Ohmic conduction mechanism. The resistance of samples having the size lesser than the electron mean free path relating to the scattering on defects λе corresponds to Eq. (5.1) and does not depend on the sample size, in distinction on the known dependence for macroscopic objects. As the sample size increases the role of the electron scattering on defects enhances, which results in a rising size dependence of the sample resistance. The transition from the ballistic to Ohmic conduction mechanism was observed, in particular, by the authors of Ref. [90], who determined the temperature dependence of the electron mean free path λе in relation to scattering on defects on the basis of measurements of the size dependence of the conductance of graphene samples. The measurements have stated that λе = 4.5 μm at a temperature of 2 К and 2.3 μm at a temperature of 250 К. The corresponding values of the mobility accounted 3х107 and 1.4х107 cm2/V s.

5.2.12. Optical Properties

The character of propagation of electromagnetic radiation through graphene relates to the interaction of photons with electrons. Due to a difference in the mass of electron and photon this interaction is determined by the fine structure constant α = е2/ħс = 1/137 so that the absorption coefficient of the optical radiation in graphene is equal to πα = 2.3%. Here е is the electron charge, с is light velocity and ħ is the Plank constant. In the case of a few layer graphene the absorption coefficient is equal to the above-given quantity multiplied by the number of layers. Therewith the effect on non-linear absorption is observed [91] in accordance with which at exceeding some value of the radiation intensity the absorption is saturated and the material becomes to be transparent.

6. Applications of Nanocarbon

Possibilities of the applied usage of nanocarbon particles are determined by their unique physical and chemical characteristics. One should note that many possibilities of the applied usage of such particles have been stated in result of laboratory investigations however have not yet got a wide practical spread. This can be explained firstly by a rather high cost of these particles which relates to complicated technologies of their production. Thus the cost of С60 on the world market accounts about $20/g while the cost of С70 fullerene reaches $100/g. The cost of single walled CNTs with low defect content is of the same order of magnitude. As it was mentioned above, high quality graphene obtained by the micromechanical exfoliation of graphite costs approximately $1013/g. At these prices it is hard to expect for application of high quality nanocarbon particles in such fields as electronics, optics etc. The main directions of the applied usage of nanocarbon particles relate to scientific investigations for which a milligram quantity of the substance is sufficient.
Nanocarbon particles of a moderate quality having a cost of about $1/g turn out to be more appropriate for a large scale usage. In this case the application area of such materials is limited by such directions in which requirements to the material quality are not so strong as in the case of nanoelectron devices and facilities. In such directions such properties of nanocarbon particles are manifested as good electric and thermal conductivity as well as high chemical and thermal stability. In the first turn one should mention such directions as surface reinforcement of metals by nanocarbon particles, fabrication of conducting polymer-based composites doped with nanocarbon particles etc.

6.1. Fullerenes

6.1.1. Surface Reinforcement of Metals

A high production cost prevents a wide practical application of fullerenes in industry, however there have been published a lot of articles demonstrating possibilities of the usage of this in various scientific devices and technological processes. Thus Ref. [92] reports on the effect of a surface reinforcement of a steel surface as a result of fullerene С60 coverage followed by laser radiation processing. In the experiment were used low carbon steel plates of 1.9х1.1х0.5 cm3 in size containing iron on the level of 99%. The initial value of the microhardness of these samples measured by the Vickers method accounts (152 ± 12) HV. A solution of fullerene С60 in o-xylene at a concentration of 1 g/l was deposited layer-by-layer onto a plate, so that the sample was dried and weighted after the deposition of each layer. The deposition of a single layer resulted in the enhancement of the sample mass by 0.4 mg which corresponds to the thickness of the layer ≈ 1 μm. The microhardness of samples was measured by the Vickers method.
Figure 60 presents the measured dependence of the steel surface microhardness on the laser irradiation energy. As is seen the dependence has a non-monotone character and the maximum value of the microhardness exceeds the initial value by about 8 times. The dependence of the microhardness on the number of fullerene layers has an increasing character. At the laser irradiation energy of 163 J/cm2 the microhardness of the surface covered by a single fullerene layer accounts 417.3 HV; for two-layer coverage this parameter accounts 470.3 HV; for 6 layers it equals to 731 HV and for 7 layers it equals to 936 HV.
Along with measurements of the microhardness of treated samples there were performed tribology tests during which the friction coefficient and wear resistance of steel samples with fullerene coverage were measured. The tests were performed without lubricants at a temoerature of 22 ± 2 oС by the standard method “ball-plane” (linear reciprocating movement of a sample relating to a fixed counterbody with a specified displacement amplitude). Measurements have indicated that the coverage of a steel surface with С60 fullerene followed by a laser treatment results in a decrease of the friction coefficient by 20 – 30%. Therewith a gradual increase in the friction coefficient during the test is observed which can be caused by both an enhancement of the trench depth and corresponding increasing of the contact area between the ball and the material surface and a progressive removal of a modified layer during the wear.
One should note that the similar results on the reinforcement of a steel surface were obtained also at the usage as a strengthening coverage a nanostructured carbon soot forming in the arc discharge with graphite electrodes as a result of thermal sputtering graphite anode [93]. This soot contains up to 10% fullerenes at optimal conditions. Nanostructured amorphous carbon remaining after extraction of fullerenes has been used along with fullerenes for creation of the reinforcing coverage of a steel surface [93]. For depositing nanocarbon coverage there was prepared a suspension of nanostructured amorphous carbon in benzene at a concentration of 1% (by weight). Steel samples were dipped into the suspension after which were dried and kept in a furnace for 10 min. at a temperature of 600 oС for better adhesion. Both laser beam and electron beam provided by the accelerator АЭЛТК-12 was used as a source of irradiation of the surface with nanocarbon coverage. The CW electron beam current ranged between 3 and 15 mA at a velocity of the target movement of 50 mm/s.
The reinforcement of a steel surface covered with a nanostructures carbon layer was observed at both laser and electron beam processing. A non-monotone dependence of the reinforcement degree on the incident radiation energy has been observed as it was in the case of fullerene coverage. Measurements have shown that the maximum reinforcement degree of a steel surface with nanocarbon coverage at laser processing (≈ 1000 HV) exceeds that for electron beam processing (≈ 600 HV), however the depth of the reinforced layer at electron beam processing (550 – 600 μm) exceeds considerably the value of this parameter for laser processing (no more than 70 μm). This is caused by the distinction in physical features of laser and electron beam processing: at the interaction of a laser beam with a metal practically all the energy of the laser beam released on the surface, while at the interaction of an electron beam with a metal the electrons penetrate to a considerable depth, so that heating occurs due to a volumetric energy release. Besides of that one should note that at penetration of electron deep into a material the electron energy decreases which results in an enhancement of the energy release intensity which is inversely proportional to the electron beam energy.

6.1.2. Solar Cells

Solar cell (CS) transforms the solar radiation energy into the electric energy. This transformation is based on the photovoltaic effect which occurs in non-homogeneous semiconducting structures under the action of solar radiation. SC is the most ecologically safe means of electrical energy production, therefore the development of such systems attracts a keen attention of a large number of laboratories in the world. The simplest design of the solar cell contains a p–n junction with a thin metal contact formed on a low depth under the surface of a p-type semiconducting material. A solid metal contact is applied to the back of the plate. The absorption of photons in the p-layer near the p-n junction results in formation of non-equilibrium electron-hole pairs. The generated electrons enter to n-region under the action of the electrical field. The similar mechanism determines a partial charge transfer of excess holes generated in the n-layer into the p-layer. This results in formation of an additional negative charge in the n-layer and a positive charge in the p-layer. As a result the contact potential difference occurring initially between p- and n- layers of the semiconductor is lowered and a voltage appears in the external circuit.
At present, the most spread material used in SC is doped silicon which constitutes a basis of semiconductors technology. Along with silicon also gallium arsenide, sulphides and some other semiconducting materials are used for this purpose. The competitiveness of the solar energy in comparison with non-renewable sources of energy is limited by a rather high production cost of silicon and other semiconducting crystals with proper characteristics and by a necessity of a modification of the forbidden gap width through doping. High production cost of silicon-based materials for SCs is caused by the necessity of usage an elevated temperature and a deep vacuum. For this reason the attention of the world community is focused on the investigation of materials for SCs on the basis of organic semiconductors. These materials are relatively simple and are characterized by a moderate production cost. They possess excellent mechanical, optical and electric characteristics. In organic semiconductor based SCs the solar radiation is absorbed by dye molecules which results in formation of elementary excitations (excitons) which are able to move over the value of the material. Interaction of an exciton with the acceptor molecule provides the dissociation of the exciton and formation of electron and hole which is accompanied with the transfer of the electron from the excited molecule (donor) to the acceptor molecule. This process proceeds usually in a transient region (interface) separating two semiconducting materials with different ionization potential or the electron affinity. Fullerene C60 molecule which possess high electron affinity and ability to attract up to six electrons at a room temperature is quite appropriate additive to conjugated polymers. Already the first experiment [94,95] demonstrated high quantum efficiency (close to unity) of transformation of light energy to electricity at a combination of conducting polymers with a fullerene C60 film.

6.2. Carbon Nanotubes

6.2.1. Electron Field Emitters

High aspect ratio of CNTs in combination with a good electric conductivity, thermal conductivity and chemical and thermal stability permit one to consider CNT-based electron field emitters as one of the promising directions of vacuum electronics. In these devices quite high electron emission current is reached at a relatively low magnitudes of the applied voltage (of the order of 1 kV) due to the effect of the electrical field amplification. This permits the usage of CNT-based electron field emitters at relatively low inter-electrode distances which determines their miniature sizes and low level of consumed energy.
Efforts of many laboratories in the world are focused on the development of displays with CNT-based cathodes. However this activity has lowered in recent years because of the development and wide spread of monitors on the basis of liquid crystals. Schematic diagrams of CNT-based flat displays are presented on Figure 61 [96,97]. The authors of Ref [96] have elaborated a prototype configuration (Figure 61a) the elements of which ware used as the basis in subsequent improved developments. A glass plate in which parallel microchannels of 200 μm in width, 100 μm in depth and inter-channel distance of 300 μm were etched by means of hydrofluoric acid has been used as a cathode. These microchannels were filled with epoxy resin containing 50% (by volume) CNTs. The surface density of CNTs accounted about 2 μm-1. As an anode was used a similar glass plate covered with phosphor strips of 200 μm in width. The inter-electrode distance accounted 30 μm. The strips containing CNTs were oriented in perpendicular to phosphor strips so that individual pixels were formed in their crossing places. The total number of such pixels on the emitter of 1 х 1 cm2 amounted 16. Emission current-voltage characteristics measured for each pixel independently coincided with each other with a high accuracy. This indicates a high degree of homogeneity of the monitor of the above-described design. The nominal value of the emission current density (76 mA/mm2), sufficient for the monitor operation was reached at the applied voltage of 230 V. There were enough 12 pixels for obtaining a clear image of any letter. Further investigations have led to the development of a color monitor providing a high quality image with a high degree of the spatial homogeneity and time stability.

6.2.2. Lighting Lamps on the Basis of Electron Field Emission of CNTs

One of the most effective directions of the applied usage of CNT-based cathodes relates to the development of lighting lamps. In such devices the electrons emitted by a cathode and accelerated in the inter-electron gap get on the phosphor where their energy is transformed to light. Simplicity of design of such a source and a quite high effectiveness of transformation of the input energy into the optical radiation have attracted a keen interest of researchers and developers to the problem.
From many configurations of the CNT-based lighting lamp proposed by various researchers one should select the construction presented on Figure 62 [98]. In this lamp the cylindrical surface of the glass tube of 42 mm in diameter covered by a phosphor layer serves as a source of radiation. The electron field emission is provided by multi-layer nanotubes of 20 nm in diameter grown by CVD method on the surface of a metal wire of 1 mm in diameter. Measurements have indicated that at an applied voltage of 5.4 kV the electron emission current density on the cathode reaches the value of 0.5 mA/cm2, while the anode value accounts 0.06 mA/cm2. The luminosity of the lam at the optimum conditions amounts up to 10000 cd/m2, which is comparable to the corresponding indicator for commercial sources. However in distinction on conventional luminescent light sources the lamp under consideration does not contain ecologically danger mercury vapor and is easy to switch and off.

6.2.3. X-Ray Radiation Sources

One more promising direction of the usage of CNT-base electron field emitters relates to the development of portable sources of X-ray radiation. Substitution of conventional thermionic cathodes by electron field emitters permits one to get quite high emission current at a room temperature and applied voltage of the order of several tens kV. Such a substitution results in a considerable enhancement of the cathode lifetime, lowering their dimensions and weight and ultimately the cost of the device. Besides of that, the usage of CNT-based cathodes offers a possibility to create a sharply focused X-ray radiation which is hardly possible at the usage of thermoion cathodes. An important advantage of CNT-based cathodes is a short switch on and out time which permits one to form programmable in time X-ray radiation flows with a nanosecond resolution. This offers ne possibilities for medical and technological applications of the considered type of devices. One should note that in experiments on obtaining X-ray radiation by means of electron field emitters were used not only CNT-based cathodes but also cathodes on the basis of carbon filaments whose diameter exceeds that of CNTs by several times.
The possibility to obtain X-ray radiation with a high degree of spatial and time resolution is an important factor at the development X-ray sources that used for imaging complex structured objects moving with a high velocity. Subsequent treatment of such images forms the basis of the X-ray computer tomography method. X-ray scanners used for this purpose record a set of subsequent images of a moving object, which requires for a quite high level of X-ray radiation intensity and presents a limitation for developing such systems. This difficulty is overcome in result of the usage of multi-pixel CNT-based electron field emitters which permit modulation the X-ray beam in time and space. Such an approach permits one to process the images obtained by means of different pixels comprising the cathode which results in a sharp enhancement of a maximum velocity of moving objects without increase of the X-ray radiation intensity and a damage of the image.
Figure 63 presents the schema of a multi-pixel X-ray radiation source with the CNT-based cathode [99]. This device operates in vacuum conditions at a pressure of 10-8 Torr and contains a set of nine CNT-based cathodes, the common additional electrode (grid), electrostatic focusing lens and a target representing a molybdenum plate. A metal substrate covered with a thin layer of a composite material containing CNTs is used as a cathode. Each of nine pixels forms the focused beam of about 200 μm in diameter. The operation anode voltage amounted of 40 kV while the grid voltage was controlled providing the current of each of the pixels does not exceed 1 mA. X-ray radiation was modulated by means of a programmable series of voltage pulses applied to the grid.
A special attention should be paid to the problem of development of portable X-ray sources with CNT-based cathodes. Such devices combine the portability with a high resolution and have perspectives for the usage in portable computer homographs which can result in a wide spread of these effective medical diagnostic apparatus. One of the examples of such a development has been described in Refs, [100,101], where carbon nanofibers were used as a source of the electron field emission. The fibers were grown by the CVD method on the tip of a Pd wire of 1mm in diameter and 2 mm in length. X-ray tube of 10 mm in diameter was fabricated from kovar and contained the emitter and a target distanced in 2 mm from each other. A W rod with a semi-spherical tip of 2 mm in diameter was used as a target. The emission current density reached 50 μA at an anode potential 30 kV which corresponds to the input power of 1.5 kW. Traveling wave lamps and microwave amplifiers. Satellite communication systems which are able to ensure practically all the needs of society in both telephone communication and television broadcasting play an important role in the development of modern telecommunication networks. The main elements of such systems are traveling wave lamps and microwave amplifiers promoting the modulation of high frequency electromagnetic waves with oscillations containing useful information. However the possibility of the usage of such systems on satellites is ratheeeer limited due to their considerable mass and dimensions. One of the effective ways to lower these characteristics is in the substitution of traditionally thermoionic cathodes with CNT-based electron field emitters which are characterized by considerably lower weight and size indicators. In this case the advantages of the usage of CNT-based electron field emitters relate to not only their miniature size and a lower energy consumption but also quite low inertia of such tipe of emitters. This offers a relatively easy possibility of modulating the emission current at tens GHz level within the frame of the usage the triode scheme. Utilizing CNTs characterized by a high electrical field amplification coefficient as an electron emission source one can place the additional electrode (grid) on a very small distance from the cathode (10 – 100 μm) which permits one to decrease essentially (by 20 – 50 times) the electric capacity of the system and increase the maximum value of the electromagnetic field modulation frequency.
Electron field emitter sources can compete sucessfully with thermoionic cathodes if the emission current desity reaches a level of 1 А/см2. The full electron current should exceed several mA, which corresponds to the cross secton of the emitting surface less 1 mm. Electrons are accelerated up to energy of several electronvolt so that the total poweer of the beam amounts several tens Watt. This powere in sufficient for the operation of a microwave radiation amplifier involved into a satellite telecommunication system. Figure 64 presents a typical schema of such an amplifier [102].
The above-indicated parameters of a CNT-based cathode can be reached only in result of the usage as a source of emission of homogeneous arrays of vertically oriented CNTs with the optimum inter-tube distance of the order of their heigth. In this case supposing the characteristic nanotube’s heigth acounts about 1 μm and the emission current limited by the thermal instability ca reach ≈ 10 μA one obtains that the maximum value of the emission current density for a homogeneous array of vertically oriented CNTs can reach about 10 А/cm2.
The rate of the information transfer provided by a telecommunication system is proportional to currier frequency of the electromagnetic radiation. Enhancement of this parameter through the usage of vacuum amlifiers with CNT-based electron field emission cathodes become to be possible due to lowering inter-electrode distance in such devices. This permits one to decrease the electric capacity of the inter-electrode gap which promotes lowering the inertia and enhancing the operation frequency of the device. In distinction to metal-based electron field emitters, CNT-bases emitters possess sufficiently higher thermal stability which promotes to obtain higher emission current with no risk of thermal destruction of the cathode.

6.2.4. Polymer-Based Composites Doped with CNTs

Polymer materials possessing pproper mechanical characteristics and relatively low cost find their application on many technology processes and engineering systems. One of the most spread approaches to improving characteritics of such materials relates to the usage of dopands. Particularly doping a polymer matrix with CNTs imparts to the composite material new properties caused by unique characteristics of nanotubes. Since CNTs possess a recordable value of the Young modulus (at a level of TPa) the enhancement of the mechanical strength in result of CNT doping seems to be quite attractive. However the problem arising on this way relates to the necessity of ensuring a good mechanical conjugation between the nanotube’s surface and a matrix material. In the absence of such a conjugation nanotubes behave in a composite like a hair in a pie moving freely inside the matrixp at applying the load. In this case inserting nanotubes does not increase but rathe lowers the mechanicaal strength of the composite. This problem can be overcome in result of ensuring the chemical bond between the nanotube’s surface and the matrix material which requires for a surface functionalization of CNTs. Since such a functionalization can result in a considerable lowering mechanical characteristics of CNTs such an approach causes additional problems for which solution efforts of many laboratoried in the world are addressed.
CNTs possess along with mechanical characteristics also good electric conductivity, therefore their inserting into a polymer matrix impacts conducting properties to the composite material. This greatly expands the field of possible applicaations of composite materials and attracts a manifold of researchers to study electrical properties of such materials As an example of the usage of conducting polymer materials can be mentioned the application of a conducting rubber for fabrication of aircraft tires. On tires fabricated from a conducting polymer-based composite not forms a static charge the occurrence of which promotes the emergence of sparks. These sparks are able to stimulate the inflammation in conditiond of not full fuel burning. Therefore the development of a conducting rabber for arcraft tires pemits an enhancement of the flight safety. The electric conductivity of CNTs reaches values of the order of 106 S/m (see chapter 5.2), which exceeds that for the most of polymer materials by 15 – 20 orders of magnitude. At such a big difference already minor quantity of CNT dopand is sufficient to transform an insulating polymer into a conducting one. One of the advantages of CNT usage as a conducting dopand to composite materials relates to a high aspect ratio of nanotubes (the ratio of the length to the diameter) of these objects. Due to this property of CNTs inserting 0.1 % CNTs into a polymerr matrix causes the enhancement of its electric conductivity by 8 – 10 orders of magnitude and transforms the material from the class of dielectrics to the class of conductors. Therewith the conductivity has the percolation character in accordance to which at a low content of a conducting dopand the charge transport proceeds by a limited number of conducting channels formied by contacting dopand particles..
The percolation threshold defined conventionally as a minimum dopand content at which the material becomes to be conductive, depends on such factors as the structure of dopand particles, as well as the aspect ratio and the degree of ordering dopand particles in the composite. Especially important the dependence of the percolation threshold on the dopand particles aspect ratio in the case of usage CNTs as a dopand becase the aspect ratio of CNTs can reach values of 103 – 104. The position of the perrcolation threshold is iversely proportional to the aspect ratio value and range usually between 0.01 0.1 %, depending on this parameter. This important feature attracts researchers to the problem of development of conducting composite polymer-based materrials doped with CNTs.
In conditions of the percolation conduction the dependence of the composite dc conductivity σdc on the conducting dopand content of in a vicinity of percolation threshold is given by the following expression
σ = σo(ррс)t,
where σo is an empiric parameter. In accordance to the statistical theory of percolation, the exponent in Eq. (6.1) t ≈ 2. However in many experiments where the dependence of the composite conductivity on the CNT dopand content is measured the value of this parameter differ notably from 2 which indicates a more complicater character of the percolation production than it is supposed in model calvulations.
Figure 65 presents a typical dependence of the percolation conductivity of a polymer-based composite on the content of CNTs [103]. The linear shape of this dependence represented in the logarithm scale (see inset) corresponds to Eq. (6.1) while the value of the exponent t = 8.4 determined on the basis of this dependence differs essentially from the value t = 2 given by the statistical theory of percolation.
The conductivity of polymer-based composites doped with CNTs was measured by various authors, and the results of these measurements have been published in many tens of articles (these articles are reviewed in Ref. [104]). As it fo;ows from the results of numerous mesurements, the minimum value of the conductivity of sample as a rule does not exceed 0.1 S/m which is lower by several orders of magnitude than that of a milti-level CNT amounting ~ 104 S/m. However one can expect that at a quite high dopand content (on the level of several tens percent) the composite conductivity should approach to the corresponding value for the dopand. One of the reasons of such a discrepancy is rather high value of the contact resistance between the neighboring nanotubes.
Influence of the contact resistance on the conductivity of CNT-doped polymer composites results in lowering the conductivity of the material and determines a non-linear, non-Ohmic character of the conduction of such materials. This influence has been studied in detail in Ref, [105], where the dependence of the conact resistance on the electrical field and inter-tube distance was calculated using the quasi-classical approach. In accordance with this approach the contact resistance is determined by tunneling os electrons through the potential barrier formed be the electric field and the potential well where electrons in a conducting nanotube locate. The resistance of a conducting percolation chain formed by nanotubes contacting with each other in a non-ideal manner was calculated with taking into account the statistical spread of contacts over the inter-tube distances. The calculations were performed for various values of the average inter-tube ditance μ and the statistical spread (dispersion) of this parameter σ. Since each contact resistance depends on the electrical field strength, the percolation conductivity of a chain composed of nanotubes turns out to be dependent on the applied volatge. Therefore polymer-based composites doped with CNTs display a non-linear, non-Ohmic conduction.
Figure 66 presents the comparison of the dependences of the resistance of the percolation chain on the applied voltage calculated on the basis of the above-described approach and measured in expeeriments (in relative units, Rm(Um) is the naximum resistance value). Note a close coincidence of experimental dependences measured in Ref. [106] at various temperatures for polymer-based composites of different type with results of calculations performed within the frame of the above-described approach supposing μ = 1 nm and σ = 0.1 nm. The experimental dependences obtained in Ref. [107] are in a good agreement with the calculation results [105] supposing μ = 0.6 nm and σ = 0.06 nm. The model utilized in Ref. [105] is supported by a close agreement between the measured and calculated dependences.

6.2.5. Phase Change Materials Doped with CNTs

In the recent years arises a necessity of lowering a harmful impact of the increasing energy production and consumption on the environment. This stimulates an interest of researchers and engineers to the development and usage of thermal energy accumulators on the basis of pahse change materials (PCM). In such devices the thermal energy is stored and released in result of a phase transtion at a change of the temperature. The usage of thermal energy accumulators on the basis of PCMs permits the temperature stabilization of living and industrial rooms without additional energy expenses. The analysis performed on the basis of the experiments [108] has shown that the usage of PCM-based thermal accumulating panels at building living and industrial rooms permits one to save about 15% of the energy spent for their heating and conditioning. In result of this about 10% of all the energy elaborated in the world can be saved, which will promote suppressing a negative action of the energy on the environment. PCM-based thermal energy accumulators can be used in not only building but also in devices for energy storage in wind and solar energy, and in the thermal protection systems for complex technological systems, supercomputers and other radio-electronic facilities. Prospects of the usage of PCM as a basis for energy storing systems in thermal and solar energy stimulate quite active research in many laboratories in the world. Results of these investigations performed in recent years have been reflected particularly in the review article There arises a set of prob[109].
On the way of a wide application of PCM-based materials in thermal energy accumulators a set of problem arises. First of all one should note rather low thermal conductivity of PCMs which causes quite high inertia of thermal accumulators. Прежде всегo, следует oтметить весьма низкую теплoпрoвoднoсть ФИМ, кoтoрая привoдит к высoкoй инерциoннoсти теплoвых аккумулятoрoв. The characteristic time of heat propagation through the material layer of d = 0.1 m thick is estimated by the relation τ t d 2 / a [a ≈ (2‒5) × 10‒7 m2/s is the thermal diffusivity of PCM] and amounts few hours. Thus PCM-based thermal energy accumulators react very late for changes of the outer temperature which makes the usage of such systems practically meaningless. This generates the task of enhancement of the thermal conductivity of PCM-based materials. One of the approaches to the solution of this task consists in doping the PCM- containing material with nanocarbon particles (nanotubes, graphene, soot) possessing the termal conductivity coefficient exceeding that for PCM by 4 – 5 orders of magnitude.
The problem of enhancement of the thermal conductivity coefficient of PCMs in result of doping them with nanocarbon particles comprises one of the perspective directions of the material research. The first promising advances in this direction were obtained in 2009 when inserting 2% (weight) multi-layer nanotubes into paraffin resulted in the enhancement of the thermal conductivity coefficient by 35 – 40 % [110]. Further efforts of researchers permitted a considerable increase of this quantity. Thus in Ref. [111] where paraffin mixed with high pressure polyethylene and styrene – butadiene was used as PCM, the thermal conduction coefficient was increased by 288%, up to value of 0.674 W/m К in result of inserting about 10% (weigth) the mixture of extended graphite with multi-walled CNTs in the ratio of 8:2.
The fabrication of cimposite materials doped with CNTs meets the technological problem related to a high viscosity of polymer materials and the trend of CNTs to formation of aggregates. For these reasons it is hard to get spatially homogeneous filling a material with CNT dopand while in the case of non-homogeneous filling the maximum possible enhancement of the thermal conductivity is not reached. An interesting solution of this problem has been proposed and realised by the authors of Ref. [112], who prepared the composite flooding aggregates formed by with liquid paraffin. This approach is illustrated on Figure 67 [112].
Inserting CNTs into a phase change material results, naturally, in a change of physical and chemical characterstics of this material and in particular in a decrease of its ability to store the energy in result of the phase transition. Table 6 present the results of measuring the parameters characterizing the phase transition (melting) of paraffin doped with various quantity CNTs [112]. The phase transition melting-solidification proceeds within some temperature range, so that the table contains the values of the temperature corresponding to the start Ts, maximum rate Тр and completing Te the phase changes. Along with this, the table contains the valued of the phase change energy for melting Нm and solidification Hf. As is seen insertion of CNTs does not practically change the phase transition temperature, while the specific phase transition enthalpy decreases in a monotone manner as the CNT content increases. Taking into consideration that thr initial value of the phase transition enthalpy for paraffin amounts 193 J/g one concludes that dcrease of the phase transition enthalpy is proportional to the CNT content.

6.2.6. Enhancement of Raman Signal by Means of CNTs

Raman spectroscopy is an effective tool of analysis of the chemical composition and structurel characteristics of materials. This method is based on the interaction of monochromatic radiation with molecules or molecular structures which results in occurrence of combination frequencies along with the initial frequency. These frequencies present the sum or difference of the incident radiation frequency and molecular vibration frequencies. Thereby the Raman spectrum contains an information about molecular vibration frequencies and serves as an unambiguous indicator of the substance under investigation. However the wide spread of this analytic method is limited because the Raman signal has rather low intensity which does not permit the registration of low admixtures in a substance. Investigations show that at the intensity of the initial monochromatic radiation of 1 W the Raman signal has te intensity of about one quantum per second. Thus the efficiency of transformation of an opnical signat to the Raman signal amounts about 10-19.
This situation is changing due to the discovery of the effect of the enhancement of Raman signal performed by the English chemist M. Fleischmann et al. in 1974 [113]. This effect called as SERS (Surface Enhanced Raman Scattering), consists in the amplification of the Raman signal intensity if a nanometer sized conductor with a rough surface is found in a vicinity of the object under investigation. Numerous studies have shown that the Raman signal amplification degree can be very high and reaches the value of the order of 1012. This offers a possibility for the registration of single molecules presenting in the sample under investigation.
The mechanism of SERS relates to the occurrence of the electron density oscillations (Plasmon oscillations) in a conducting particle under the action of the incident monochromatic radiation. These oscillations influence on the molecules under analysis which results in an enhancement of the scattered radiation by many orders of magnitude. Usually for the Raman signal enhancement rare metal (gold, silver) or copper particles having high conductivity are utilized. Recently [114] there has been proposed the usage for this purpose carbon nanotubes having a high conductivity and other features promoting the Raman signal amplification. Carbon nanotubes were grown on a Si substrate using the CVD method. As a catalyst were used МoО2 particles. The water suspensions of these particles having different concentration (0.015 mg/ml, catalyst A and 0.015 mg/ml, catalyst B) were deposited onto the substrate. The centrifugation of the substrate resulted in its homogeneous coverage with the suspension. After drying the substrate turned out to be covered by a homogeneous array of МoО2 particles which size and the density of the arrangement is determined by the suspension concentration. CNTs were synthesized in a quartz tube placed into a furnace at a temperature of 1000 oС under the flow of Ar + H2 + CH4. As an object under investigation was used distilled water the droplets of which were deposited onto the surface of samples with different CNTs arrangement density. The Raman signal was generated by means of laser radiation with a wavelength of 532 nm (second harmonic of Nd-glass laser) and 3 mW in the power.
The Raman spectra obtained are shown on Figure 68. As is seen, the amplification of the Raman signal is observable only in the case when the CNTs were synthesized by means of the catalyst B the particles of which were arranged on the substrate with a considerably lower density than in the case of the catalyst A. This is caused by the screening effect at a high CNT arrangement density on the substrate. At a closer arrangement of nanotubes the SERS effect is not observed because the plasmon oscillations in closely arranged nanotubes experience the interference.
Measurements indicate that the amplification factor of the Raman signal (the ratio of the signal intensity in the presence of CNTs to that in the absence of CNTs) amounts several hundred percent. Such a moderate, in terms of SETS, amplification is explained with taking into account rather low volume of water located in a vicinity of CNTs and experienced to the SERS effect comparing to the total water volume contributing to the Raman signal. Estimation of the Raman signal amplification factor by a single nanotube on the basis of experiment [114] can be performed on the basis of the following relation
GSERS=(PSERSNRaman/PRamanNSERS)/NCNT,
where PSERS and PRaman – are the intensities of the initial and enhanced Raman signal, NRaman and NSERS – is the number of water molecules irradiated by the optical radiation and the number of water molecules experienced to the SERS effect, correspondingly. NCNT is the number of CNTs situated on the substrate surface covered by the water droplet. In accordance with the experiment result presented on Figure 68, the ratio (PSERS/PRaman) ≈ 3. As it shown by the authors of Ref. [115], the SERS effect is observed under conditions when the molecules under investigation (in this case water) at a distance from the enhancing object (in this case nanotubes) no further than d ≈ 40 nm. Таким oбразoм, oбъем вещества, пoдверженнoгo эффекту SERS, сoставляет
VSERS = π(d2 -RCNT2) LNCNT/3,
where RCNT ≈ 10 nm is the average radius of a nanotube, L ≈ 1 μm is its average length. One should take into consideration that only nanotubes having armchair structure possess conducting properties, and the number of such nanotubes amounts 1/3 of the total number. For the estimation of the number of nanotubes located on the substrate surface covered with the water droplet we will assume a random arrangement of nanotubes over the surface and do not contact with each other. Taking into consideration that the area of this surface accounts about S ≈ 0.1 cm2, one obtains an estimation of the maximum number of nanotube covering the substrate surface on which the water droplet is placed/
NCNTS/L2 ≈ 3х106,
which is followed by the estimation of the Raman signal amplification coefficient in accordance with Eq. (6.2)
GSERS ≈ 107.
The true quantity NCNT is lesser than above-given value (6.5) because a part of nanotubes located on the substrate surface contact with each other and do not contribute into the Raman signal amplification. Thereby the value of the Raman signal amplification factor (6.5) should be considered as a lower estimate, and the true value of the amplification factor exceeds the above-estimated quantity (6.5).
A possibility of the usage of CNTs as a tool for the Raman signal amplification can be utilized as a basis of an optical sensor permitting the determination of the chemical content and structural characteristics of the substance located inside living organisms, including human [116]. In this device nanotubes are inserted in epoxy resin or other viscous transparent liquid which is deposited onto the surface of an optical waveguide. The fiber is inserted into the cavity of the living organism to be studied. The Raman signal formed at input the laser beam into the waveguide is enhanced in result of the interaction between CNTs and the molecules under registration and goes back by the fiber to a detector connected with a computer analyzing system. The above-described sensor can be used for early diagnostics of various deceases including malignant ones.

6.3. Graphene

6.3.1. Chemical Sensors

Graphene is a good conductor, whose electric characteristics are very sensitive to the occurrence adsorbed molecules of various types on its surface. This offers a possibility of the usage of graphene as a basis of electrochemical sensor permitting detection of various admixtures in atmosphere. Advantages of utilization graphene-based sensors relate to miniature sizes of this material. This permits one to develop systems containing a large number of sensors which allow the determination of the distribution of gaseous admixtures over the volume of large enterprises, including nuclear plants.
Very high sensitivity of graphene to the occurrence of adsorbed molecules can be illustrated by Ref. [117] reported on a considerable (up tp 8 orders of magnitude) change in the conductivity of graphene in result of sorption of ammonia (NH3). Graphene flaxes of 3 nm in thick and (10–30) × (50–100) in size were produced by the electrostatic exfoliation, applying a voltage of 300 V on the contact between a high quality graphite crystal and Si/SiO2 substrate. The current-voltage characteristics of samples in the presence of ammonia were measured after deposition of siver contacts. Figure 69 presents the results of measurements of dependence of current through the sample of 2.8 nm in thick (sample S1) and sample of 3 nm in thick (sample S2) on the time of keeping in the ammonia atmosphere. As is seen, the sorption of ammonia by the graphene surface results in a sufficient enhancement of the graphene resistance.
A unique sensitivity of electric characteristics of graphene to occurrence of adsorbed molecules has been demonstrated also in Ref. [118] the authors of which managed to register the admixture of NO molecules in air at a concentration of the order of 10-14. The authors measured the conductivity of graphene samples kept in an N2 with admixture of different gases using a standard schema of conductivity measurements and registered the occurrence of admixtures. After increasing the conductivity the sample was irradiated by UV light in order to remove adsorbed molecules from the sample surface. Figure 70 presents typical time dependences of the graphene conductivity in a nitrogen atmosphere with admixture NO. This experiment has demonstrating a possibility to detect along with NO also such molecules as NO2, NH3, N2O, O2, SO2, CO2, and H2O. Depending on the sort of molecules to be registered the minimum molecule concentration which can be registered amounted from 10-12 дo 10-10.

6.3.2. Pressure Sensor

Investigations have shown that the electric resistance of a graphene fragment depends on the degree of bending. The action of the pressure sensor produced by the authors of Ref. [118] is based on this effect. Figure 71 shows a schematic image of this sensor. A graphene fragment is applied onto a trench in SiO2 layer machined in Si/SiO2 plate which forms a hermetic membrane. Electric current Iin passes through the upper contact which results in the occurrence of currents I1 and I2 through lower contacts. Since the resistance of the graphene fragment depends on the membrane curvature which in its turn is determined by the He pressure, the difference between the currents I1 and I2 is also depends on the He pressure. As is shown on Figure 71 the difference I1 - I2 depends considerably on the He presence. The pressure sensor is distinguished by a miniature size and can be used particularly for diagnostics of stress in big constructions.

6.3.3. Electron Field Emitter

Good conductivity and a high aspect ratio permit one to consider graphene as a source of the electron field emitter [119]. Peculiarities of such emitter have been analyzed in Ref. [120], where considered a rectangular vertically oriented ground graphene fragment of D x h x a in size to which an external voltage is applied. Here D is the width, h is the height and a = 0.34 nm is the thickness of the fragment. The analysis basing on the solution of the Laplace equation for a region adjacent to the graphene fragment surface has shown that the electrical field amplification factor depends considerably on the coordinate along the sample end. These dependences calculated for fragments of different height are shown on Figure 72.
As is seen the value of the electrical field amplification factor in a vicinity of vertices of the fragment exceeds considerably that in the major region of the edge. Because the emission current depends exponentially on the electrical field amplification factor such a non-homogeneity results in a highly non-homogeneous distribution of the emission current along the graphene sheet edge Namely, the emission current density from the angle region of the graphene sheet exceeds by many orders of magnitude the corresponding value for the main region of the sheet. This non-homogeneity manifests itself particularly significant at low voltages and, correspondingly, low emission currents when the main contribution into the total emission current is due to the vertex regions of the graphene sheet. As the applied voltage enhances the contribution of these regions decreases and becomes to be negligible at quite high values of the applied voltage due to rather small size of the vertex region where the electrical field amplification factor is high. Therefore one can expect that the emission current-voltage characteristic should consist of two parts the first of which relates to the low voltage region and is determined by vertices of the graphene fragment with higher field amplification factor while the second one manifests itself in a high voltage region when the amplification factor is not so high. Figure 73 compares the current-voltage characteristic calculated in Ref. [120] with the use of the calculation results presented on Figure 72 with the experimental data [121]. F good agreement between the calculation and experimental data is reached under a supposition that the graphene fragment have a size of 400х1000х10 nm3.

6.3.4. Nonlinear Optical Absorbers

Nonlinear optical properties of graphene can be used in laser technique at the heart of the action of nonlinear absorbers of laser radiation. Such devices are able to experience the enlightenment effect due to a nonlinear dependence of the graphene absorption coefficient on the incident radiation intensity. The enlightenment effect manifests itself in decreasing the absorption coefficient practically to zero in result of absorption of some quantity of photons. This results in a sharp enhancement of the laser radiation intensity and formation of short laser pulses (shorter than 10-12 s). Thereby due to the action of nonlinear optical absorbers the continuous laser radiation is transformed into a set of short pulses. Such an approach to obtaining femtosecond laser radiation pulses has got a wide spread. Thus Ref. [122] describes an arrangement of a waveguide laser with a graphene-based saturated absorber providing the formation of laser pulses of ≈174 fs in diration and the line width of 15.6 nm.
Figure 74 presents schematically the arrangement of a femtosecond laser with graphene-based saturated absorber [122]. As an amplifying medium there has been used a waveguide of 1.25 m in length doped with erbium. A diode laser with the wavelength of 980 nm and cw radiation power up to 28 mW was utilized as a source of pumping. The total length of the resonator amounted 7.6 m. The average output power of the waveguide laser accounted ≈ 1.2 mW at the pumping power of 28 mW. The device generates laser radiation pulses with the repetition rate of 27.4 MHz, pulse duration of ≈ 174 fs, energy of ≈ 44 pJ, intensity of ≈ 282 MW/cm2 and the line width of ≈ 15.6 nm. Laser pulses of femtosecond duration find their application in the investigation of chemical reactions mechanisms, at fine material processing, in medicine and other fields of science and technologies.

6.3.5. Graphene Doped Composite Materials

Graphene is used as a dopand to composite materials along to carbon nanotubes. This offer a possibility for production of polymer materials with enhanced electric conductivity, thermal conductivity and mechanical characteristics. Recent advances in the field of production, investigation and practical application of graphene doped composites have been reviewed in Ref. [123]. The conduction in such composites has a percolation character so that the charge transport proceeds along a limited number of channels formed by a chain on conducting graphene fragments contacting with each other. The dependence of the composite conductivity on the graphene content in a vicinity of the percolation threshold is described by the same relation (6.1) that describes electrical characteristics of CNT-doped composites. A typical result of the measurement of such dependence is shown on Figure 75 [124] where this dependence is presented in a semi-logarithm scale. The linear character of the semi-logarithm dependence within a large range of changing the dopand content confirms the validity of Eq. (6.1).
Graphene doping results in improvement of mechanical characteristics of polymer-based composites. One should note that graphene having mechanical characteristics close to those for CNTs is more effective dopand promoting an enhancement mechanical properties of a composite comparing to CNTs. Figure 76 presents the dependences of the tensile strength and elongation at break of polyvinyl alcohol samples doped with reduced graphene oxide on the volumetric content of the dopand [125]. As is seen addition of the dopand at level of several volumetric percents results in a multifold enhancement of the breaking strength of the composite. Such a result is hardly reachable at the usage of CNTs as a dopand because the CNT surface does not experience a mechanical linking with the polymer matrix while fragments of reduced graphene havind a manifold of free bonds join easily to polymer molecules providing a strong connection.
Inserting graphene dopand into a polymer promotes an enhancement of the composite thermal conductivity. This effect underlies the production of phase change materials with enhanced thermal conductivity, the usage of which can result in essential change in energy and building (see Chapter 6.2). Currently a wide spread of such materials is hindered by a rather high cost of graphene and other nanocarbon materials, however intense efforts of the scientific community permit one to hope for the development of methods of producing such materials at a relative low production cost. The number of publications demonstrating a possibility to enhance the thermal conductivity of a composite as a result of graphene doping is quite large. Between these publications one should mention firstly Ref. [126] reporting on more than 300% enhancement of the thermal conductivity polymethylsiloxane – based composite in result of inserting 0.7% graphene foam.

6.3.6. Graphene-Based Supercapacitors

Supercapacitors present one of the most effective modern devices for accumulation and storage energy with the aim of its subsequent quick extraction. This device combines the ability to store the electric energy inherent to conventional accumulating batteries with the ability to develop a considerable electric power inherent to electric capacitors. Currently supercapacitors present the key element of hybrid automobile engines where they are used for accumulating the electric energy during breaking the car and its quick extraction at accelerations and climbing. Supercapacitor like conventional electric capacitor is consisted of two electrodes presenting parallel conducting plates separated by a dielectric (Figure 77). The construction includes electrodes fabricated from a porous material, separator, current collectors and gaskets preventing the short circuit of the electrodes.
The electric capacity of a supercapacitor is expressed by the following relation which is usable also for a conventional capacitor
C = εA/d,
where А is the area of each plate, d is the distance between them, ε is the dielectric constant of the dielectric. At applying the external potential U the electrodes are charged and store the electric energy Е which is expressed by the following relation
E = CU2/2.
At closing an electric circuit through a load having the resistance R the capacitor discharges with releasing a power P expressed by the relation
P = U2/(4R).
In supercapacitors a separator immersed into an electrolyte instead of a dielectric is utilized usually. As distinct from conventional electric capacitor which is charged at applying an external voltage, charging supercapacitors is accompanied by the deposition of ions of the different sign on the opposite electrodes. This results in formation of a double electric layer which presents essentially an electrical capacitor. Since this double layer possesses a nanometer size d, the supercapacitor is characterized with a quite high capacity, according to Eq.(6.4). Besides of that, a porous structure of the electrode material the specific surface area of which exceeds the relevant value for a solid material promotes also an enhancement of the capacity of a supercapacitor. Graphene possessing a recordable specific surface area (2600 m2/g) is an ideal material for supercapacitor electrodes. Good transparency of graphene for an optical radiation permits the usage of such supercapacitors in monitors of gadgets and othe electronic devices.
A possibility of the usage of graphene as a supercapacitor electrode has been demonstrated in particular by the authors of Ref. [127] where graphene films of 25, 50, 75 and 100 nm were utilized for this aim. These films were produced in result of the chemical reduction of graphene oxide. Measurements have shown that the films possess the transparency for a visible light. Thus the transmission coefficient for the film of 25 nm thick for the radiation of 550 nm in wavelength amounts about 70%. An increase of the film thickness is accompanied with a decrease of the transmission coefficient, according to the Lambert-Beer low. The conductivity of films ranged between 800 and 1000 S/m. Such a film applied onto a polymer surface demonstrates flexibility without a loss in the conductivity and the transparency which permits its usage in not only supercapacitors but also in flexible displays, organic solar cells, organic light diods etc.
Figure 78 presents the interconnection between the specific energy and the specific power of supercapacitor with graphene film electrodes [127]. There was used 2M KCl solution as an electrolyte. Measurements have shown that the the best characteristics demonstrate supercapacitors with the graphene film of 25 nm thick for which the specific capacitance amoints 135 F/g at a maximum specific power of 7.2 W/g.

7. Conclusions

A keen interest to study in carbon nanostructures has appeared more than 40 years ago, beginning from the discovery of fullerenes (1985). Currently hundreds of research groups in the world are engaged into this subject and no one scientific journal does without publications devoting to production, investigation and practical usage of such structures. It is remarkable that the fullerenes were discovered occasionally in attempts to resolve one of the astrophysics problems related to the study of the origin of interstellar nebulae. While the discovery of fullerenes did not result in the solution of this problem, this event in the field of basic science was the beginning of a new direction of research generated numerous scientific and technological applications. Therefore we look one more example of the influence of the basic research on the appearance of new directions of the science and technologies.
Practical realization of huge prospects of the applied usage of nanocarbon depends firstly on a possibility of production of this material in a macroscopic quantity by a reasonable cost. The production cost of nanocarbon is declining steadily as the technology develops and the market expanses which relates to the enhancement of the competition. One can be sure that the possibilities of the effective usage of carbon nanoparticles in scientific and technological purposes demonstrated in laboratory studies will be realized in practical activities after lowering the production cost of such particles down to a reasonable level. Such a perspective is traceable on the case of development of semiconductor technologies as well as a space technique.
The work has been performed under Ministry of Science and Higher Education of the Russian Federation, project number FSWF-2023-0016.

References

  1. Kratschmer W., Lamb L., Fostiropoulos K., Huffman D. R. «Solid C60: a new form of carbon» Nature 347 354 (1990). [CrossRef]
  2. Kratschmer W., Fostiropoulos K., Huffman D. R. «The infrared and ultraviolet absorption spectra of laboratory-produced carbon dust: evidence for the presence of the C60 molecule» Chem. Phys. Lett. 170 167 (1990). [CrossRef]
  3. José-Yacamán M., Miki-Yoshida M., Rendón L., Santiesteban J. G. “Catalytic growth of carbon microtubules with fullerene structure” Appl. Phys. Lett. 62 202 (1993). [CrossRef]
  4. Zhang X. B., Zhang X.F., Bernaerts D., Van Tendeloo G., Amelinokx S., Van Landuyt J., Ivanov V., Nagy J.B., Lambin Ph., Lucas A.A. “The texture of catalytically grown coil-shaped carbon nanotubes” Europhys. Lett. 27 141 (1994). [CrossRef]
  5. Malard L.M., Pimenta M.A., Dresselhaus G., Dresselhaus M.S. «Raman spectroscopy in graphene» Physics Reports 473 51-87 (2009). [CrossRef]
  6. Curl R.F. “Down of the fullerenes: experiment and conjecture” Rev. Modern Phys. 1997 V. 69 (3), P.691-702. [CrossRef]
  7. Kroto H., Health J.R., O’Brien S.C., Curl R.F., Smalley R.F. “C60: buckminsterfullerene”. Nature 318 162 (1985). [CrossRef]
  8. Kroto H. “Symmetry, Space, Stars, and C60”. Rev. Modern Physics. 1997. V.69(3). P. 703-722. [CrossRef]
  9. Taylor R., Hare J.P, Abdul-Sada A.K., Kroto H.V. “Isolation, separation and characterisation of the fullerenes C60 and C70: the third form of carbon” J. Chem. Soc., Chem. Comm. 1423 (1990). [CrossRef]
  10. Iijima S. «Helical microtubules of graphite carbon». Nature 354 56–58 (1991). [CrossRef]
  11. Iijima S., Ichihashi T. “Single-Shell Carbon Nanotubes of 1-nm Diameter”. Nature 363 603 (1993). [CrossRef]
  12. Radushkevich L.V., Lukjanovich V.M. «On a carbon structure forming at the thermal decomposition of carbon monoxide on an iron contact” Sov. J. Phys. Chem. 1952. V.26. p, 88-95 (In Russian).
  13. Nesterenko A.M., Kolesnik N.F., Akhmatov Yu.C., Cukhomlin V.I., Prilutskii O.V. “Peculiarities of the phase composition and structure of products of the interaction of NiO and Fe2O3 with carbon monoxide» Bull. of Academy of Science of USSR, ser. Metals. 1982. V.3. P. 12-17 (In Russian).
  14. Hillert M., Lange N. «The structure of graphite filaments» Zeitschrift für Kristallographie 111 24-34 (1959). [CrossRef]
  15. Endo M., Koyama T., Hishima Y. “Structural improvement of carbon fibers prepared from benzene” Jap. J. Appl. Phys. 15 2073 (1976). [CrossRef]
  16. Oberlin A., Endo M., Koyama T. “Filamentous growth of carbon through benzene decomposition” Carbon 14 133 (1976). [CrossRef]
  17. Li W.Z., Xie S.S., Qian L.X., Chang B.H., Zou B.S., Zhou W.Y., et al. Large-scale synthesis of aligned carbon nanotubes. Science 274 1701-3 (1996). [CrossRef]
  18. Peierls R.E. “Quelques propriétés des corps solides”. Ann. Inst. Henri Poincare 5 177 (1935).
  19. Landau L.D. “To the phase transitions theory”. J. Exp. and Theor. Physics. 1937. V. 7. P. 19 – 24 (In Russian).
  20. Novoselov K.S., Geim A.K., Morozov S.V., Jiang D., Zhang Y., Dubonos S.V., Grigorieva I.V., Firsov A.A. “Electric Field Effect in Atomically Thin Carbon Films” Science 306 666 (2004). [CrossRef]
  21. K.S. Novoselov. “Graphene: materials in the Flatland”. 2011. V. 54. No. 12. [CrossRef]
  22. Ohmae N, Tagawa M, Umeno M “Cage structure of fullerene (C60) observed by field ion microscopy” J. Phys. Chem. 97 11366 (1993). [CrossRef]
  23. Diederich F., Whetten R. Beyond C60: the higher fullerenes. Acc. Chem. Res. 25 119 (1992). [CrossRef]
  24. Hamalgalimov A.R. “The structure and stability of higher fullerenes in the series С6086“. Dr. of Science Thesis. 2015. Kazan.(In Russian).
  25. Hirsch A. The chemistry of the fullerenes / Stuttgart; New York: Thieme, 1994. – 215 p.
  26. Shinohara H. Endohedral metallofullerenes Rep. Prog. Phys. 63. 843-892 (2000). [CrossRef]
  27. Stevenson S., Rice G., Glass T., Harish K., Cromer F., Jordan M. R., Kraft J., Hadju E., Bible R., Olmstead M. M., Maitra K., Fisher A. J., Balch A. L., and Dorn H. C. Small bandgap endohedral metallofullerenes in high yield and purity. Nature 401 55–57 (1999). [CrossRef]
  28. John T., Dennis S., Shinohara H. «Production, isolation, and characterization of group-2 metal-containing endohedral metallofullerenes». Appl. Phys. A 66 243 (1998). [CrossRef]
  29. Nakane T et al., in Molecular Nanostructures (Eds H Kuzmany et al.) (Singapore: World Scientific, 1998) p. 193.
  30. Weidinger A., Waiblinger M., Pietzak B., Murphy T. A. «Atomic nitrogen in C60: N@C60» Appl. Phys. A 66 287 (1998). [CrossRef]
  31. Grupp A. et al., in “Molecular Nanostructures” (Eds H. Kuzmany et al.) (Singapore: World Scientific, 1998) p. 224.
  32. Meyer J.C., Geim A.K., Katsnelson M.I., Novoselov K.S., Obergfell D., Roth S., Girit C., A.Zettl «On the roughness of single- and bi-layer graphene membranes» Solid State Commun. 143 101 (2007). [CrossRef]
  33. Bao W., Miao F., Chen Z., Zhang H., Jang W., Dames C., Lau C. N. «Controlled ripple texturing of suspended graphene and ultrathin graphite membranes» Nature Nanotechnol. 4 562 (2009). [CrossRef]
  34. Jin C., Lan H., Peng, L., Suenaga K., Iijima S. Phys. Rev. Lett. 102 205501 (2009).
  35. Eletskii A. V., Smirnov B.M. “The C60 cluster as a new form of carbon” Sov. Phys. Usp. 34 616 (1991). [CrossRef]
  36. Bandow S., Shinohara H., Saito Y., Ohkohchi M., Ando Y. “High yield synthesis of lanthanofullerenes via lanthanum carbide” J. Phys. Chem. 97 6101 (1993). [CrossRef]
  37. Shinohara H., Inakuma M., Hayashi N., Sato H., Saito Y., Kato T., Bandow S. “Spectroscopic Properties of Isolated Sc3@C82 Metallofullerene” J. Phys. Chem. 98 8597 (1994). [CrossRef]
  38. Stevenson S., Burbank P., Harich K., Sun Z., Dorn H. C., van Loosdrecht P. H. M., deVries M. S., Salem J. R., Kiang C.-H., Johnson R. D., Bethune D. S. “La2@C72:  Metal-Mediated Stabilization of a Carbon Cage” J. Phys. Chem. A 102 2833 (1998). [CrossRef]
  39. Bezmelnitsyn V., Davis S., Zhou Z. Efficient Synthesis of Endohedral Metallofullerenes in 3-Phase Arc Discharge Fullerenes, Nanotubes and Carbon Nanostructures 23 612–617 (2014). [CrossRef]
  40. Dubrovsky R,. Bezmelnitsyn V., Eletskii A. Plasma fullerene production from powdered carbon black. Carbon 42 1063 – 1066 (2004). [CrossRef]
  41. Shavelkina M. B., Amirov R. Kh., Bilera I. V. Formation of carbon nanostructures by the plasma jets: synthesis, characterization, application. Materials Today: Proceedings. 5 25956–25961 (2018). [CrossRef]
  42. Shavelkina M. B. “Synthesis of carbon nanostructures in plasma jets of a CW plasmatron” Dr. of Science Thesis. 2020. Moscow. (In Russian).
  43. Fan S, Liang W., Dang H., Franklin N., Dai H. “Carbon nanotube arrays on silicon substrates and their possible application” Physica E 8 179 (2000). [CrossRef]
  44. A.G. Nasibulin, S.D. Shandakov “Aerosol synthesis of carbon nanotubes” Aerosols: Science and Technology; Ed. by I. Agranovski. – Weinheim: Wiley-VCH, 2010. – Ch.5. – P. 65-89.
  45. Nasibulin A. G., Shandakov S.D., Timmermans M.Yu., Kauppinen E.I. "Aerosol synthesis and applications of single-walled carbon nanotubes” Russian Chemical Reviews. 2011. V.80(8). P.771–786. [CrossRef]
  46. Li X., Cai W. An J et al. Large-area synthesis of high-quality and uniform graphene film on copper foils Science 324 1313-1314 (2009). [CrossRef]
  47. Kim K.S., Zhao Y., Jang H. et al. Large-scale pattern growth of graphene films for stratchable transparent electrodes Nature 457 706 – 710 (2008). [CrossRef]
  48. Hummers W.S., Offeman R.E. Preparation of Graphitic Oxide. J. Am. Chem. Soc. 80 1339 (1958). [CrossRef]
  49. G. S. Bocharov, A. V. Eletskii. “Percolation transition under thermal reduction of graphene oxide” J. Structural Chemistry. 2018. V. 59. No. 4, pp. 806-814. [CrossRef]
  50. Sidorov L.N., Yurovskaya M.A., Borschevskii A.Ya., Ioffe I.N. “Fullerenes”. Textbook. Examen Publ. Moscow. 2005 (In Russiaan).
  51. Wozawa M., Tadano A., Aogaki R. et al., in «Progress in Fullerene» (Eds. H Kuzmany et al.) (Singapore: World Scientific, 1994) p. 41.
  52. Dresselhaus M.S., Dresselhaus J., Eklund P. “The science of fullerenes and carbon nanotubes”. Academic Press. 1966.
  53. Tanigaki K., W. Ebbesen T., Saito S., Mizuki J., Tsai J. S., Kubo Y., Kuroshima S. “Superconductivity at 33 K in CsxRbyC60Nature 352 222 (1991). [CrossRef]
  54. Hannay N B et al. Phys. Rev. Lett. 14 225 (1965).
  55. Bezmelnitsyn V.N., Eletskii A.V. "On a Possible High Temperature Superconductivity in Higher Solid Fullerenes doped with Alkali Metal Atoms", Superconductivity: Physics, Chemistry, Technology 6 437 (1993).
  56. Bezmel’nitsyn V N, Eletskii A V, Okun’ M V "Fullerenes in solutions" Phys. Usp. 1998. V. 41. P.1091–1114.. [CrossRef]
  57. Ruoff R. S., Malhotra R., Huestis D. L., Tse D. S., Lorents D. C. (1993). "Anomalous solubility behaviour of C60". Nature 362 140 (1993). [CrossRef]
  58. Bezmelnitsyn V.N., Eletskii A.V., Stepanov E.V. "Cluster Origin of Fullerene Solubility", J. Phys. Chem. 98 6665 (1994). [CrossRef]
  59. Елецкий А.В. “Механические свoйства углерoдных нанoструктур” Успехи физ. наук 177 233-274 (2007). [CrossRef]
  60. Krishnan A., Dujardin E., Ebbesen T.W., Yianilos P.N., Treacy M.M.J. “Young’s modulus of single-walled nanotubes” Phys. Rev. B 58 14013 (1998). [CrossRef]
  61. Waters J. F., Guduru P. R., Jouzi M., Xu J. M., Hanlon T., Suresh S. “Shell buckling of individual multiwalled carbon nanotubes using nanoindentation” Appl. Phys. Lett. 87 103109 (2005). [CrossRef]
  62. Zhang M., Fang S., Zakhidov A.A., Lee S.B., Aliev A.E., Williams C.D., Atkinson K.R., Baughman R.H. “Strong, Transparent, Multifunctional, Carbon Nanotube Sheets” Science 309 1215 (2005). [CrossRef]
  63. Odom T.W., Huang J.-L., Kim P., Lieber C.M. “Structure and Electronic Properties of Carbon Nanotubes” J. Phys. Chem. B 104 2794 (2000). [CrossRef]
  64. Gao B., Chen Y.F., Fuhrer M.S., Glattli D.C., Bachtold A. “Four-point resistance of individual single-wall carbon nanotubes” Phys. Rev. Lett. 95 196802 (2005). [CrossRef]
  65. Brown E., Hao L., Gallop J.C., Macfarlane J.C. “Ballistic thermal and electrical conductance measurements on individual multiwall carbon nanotubes” Appl. Phys. Lett. 87 023107 (2005); AIP Conf. Proc. 723 91 (2004). [CrossRef]
  66. Zhao G., Zhang J., Zhang Q., Zhang H., Zhou O., Qin L.-C. “Fabrication and characterization of single carbon nanotube emitters as point electron sources” Appl. Phys. Lett. 89 193113 (2006). [CrossRef]
  67. Bocharov G.S., Eletskii A.V., Korshakov A.V. “Emission Characteristics of Carbon Nanotube-Based Cathodes” Rev. Adv. Mater. Sci. 5 371 (2003).
  68. Bocharov G.S., Eletskii A.V., Pal A.F., Pernbaum A.G., Pichugin V.V. “Emission Characteristics of CNT-Based Cathodes” In: “Properties of Synthetic Nanostructures” ed. by H.Kuzmany, J.Fink, M.Mehring, S.Roth. et al. AIP Conf. Proc. 723 528 (2004).
  69. Bocharov G.S., Eletskii A.V. “Effect of Screening on the Emissivity of Field Electron Emitters Based on Carbon Nanotubes”. Technical Physics. 2005. Vol. 50. No. 7. P. 944–947. [CrossRef]
  70. Bocharov G.S., Eletskii A.V. “Thermal Instability of Field Emission from Carbon Nanotubes”. Technical Physics. 2007. Vol. 52. No. 4. P. 498–503. [CrossRef]
  71. Sveningsson M., Hansen K., Svensson K., Olsson E., Campbell E.E.B., “Quantifying temperature-enhanced electron field emission from individual carbon nanotubes” Phys. Rev. B. 72 085429 (2005). [CrossRef]
  72. Ajayan P.M., Iijima S. “Capillarity-induced filling of carbon nanotubes” Nature 361 333 (1993). [CrossRef]
  73. Ebbesen T.W. “Synthesis of nanostructured carbon using CVD” Physics Today 49 (6) 26 (1996).
  74. Rao M., Eklund P. C., Bando S.W., Thess A., Smalley R. E. “Evidence for charge transfer in doped carbon nanotube bundles from Raman scattering” Nature 388 257 (1997). [CrossRef]
  75. Sloan J., Novotny M.C., Bailey S.R., Brown G., Hutchison J.L. “Two layer 4:4 co-ordinated KI crystals grown within single walled carbon nanotubes” Chem. Phys. Lett. 329 61 (2000). [CrossRef]
  76. Brown G., Bailey S.R., Sloan J., Xu C., Friedrichs S., Flahaut E., Coleman K.S., Green M.L.H., Hutchinson J.L., Dunin-Borkowski R.E. “Electron Beam Induced In Situ Clusterization of 1D ZnCl4 Chains Formed Inside SWNT” J. Chem. Soc. Chem. Commun. 2001, p. 845.
  77. Smith B.W., Monthioux M., Luzzi D.E. “Encapsulated C60 in carbon nanotubes” Nature 396 323 (1998). [CrossRef]
  78. Monthioux M. “Filling single-wall carbon nanotubes” Carbon 40 1809 (2002). [CrossRef]
  79. Khlobystov A.N., Britz D.A., Ardavan A., Briggs G.A. “Observation of ordered phases of fullerenes in carbon nanotubes”. Phys. Rev. Lett. 92 245507 (2004). [CrossRef]
  80. Smith B.W., Luzzi D.E., Achiba Y. “Tumbling atoms and evidence for charge transfer in La2@C80@SWNT Chem. Phys. Lett. 331 137 (2000). [CrossRef]
  81. Hirahara K., Suenaga K., Bandow S., Kato H., Okazaki T., Shinohara H., Iijima S. “One-Dimensional Metallofullerene Crystal Generated Inside Single-Walled Carbon Nanotubes” Phys. Rev. Lett. 85 5384 (2000). [CrossRef]
  82. Eletskii A.V. “Sorption properties of carbon nanostructures” Physics-Uspekhi. 2004. V. 47. P. 1191. [CrossRef]
  83. Balandin A.A., Ghosh S., Bao W., Calizo I., Teweldebrhan D., Miao F., Lau C.N. “Superior thermal conductivity of single-layer graphene” Nano Lett. 8 902 (2008). [CrossRef]
  84. Ghosh S., Bao W., Nika D.L., Subrina S., Pokatilov E.P., Lau C.N., Balandin A.A. “Dimensional crossover of thermal transport in few-layer graphene” Nature Mater. 9 555 (2010). [CrossRef]
  85. Eletskii A.V., Iskandarova I.M., Knizhnik A.A. Krasikov D.N. “Graphene: fabrication methods and thermophysical properties” Physics-Uspekhi. 2011. V.54 (3). P. 227. [CrossRef]
  86. Zeinalipour-Yazdi C.D., Christofides C. “Linear correlation between binding energy and Young’s modulus in graphene nanoribbons” J. Appl. Phys. 106 054318 (2009). [CrossRef]
  87. Lee C., Wei X., Kysar J. W., Hone J., “Measurement of the Elastic Properties and Intrinsic Strength of Monolayer Graphene” Science 321 385 (2008). [CrossRef]
  88. Bolotin K. I., Sikes K. J., Jiang Z., Klima M., Fudenberg G., Hone J., Kim P., Stormer H. L., Solid State Commun. 146 351 (2008).
  89. Das Sarma, S., Adam S., Hwang E.H., et al. «Electronic transport in two-dimensional graphene» Reviews of Modern Physics. 83(2) 407 – 470 (2011). [CrossRef]
  90. Esquinazi P., Barzola-Quiquia J., Dusari S., García N. «Length dependence of the resistance in graphite: Influence of ballistic transport» J. Appl. Phys. 111 033709 (2012). [CrossRef]
  91. Khurgin J.B. “Graphene—A rather ordinary nonlinear optical material” Appl. Phys. Lett. 104 161116 (2014). [CrossRef]
  92. G. S. Bocharov, A. V. Dedov, A. V. Eletskii, A. V. Zaharenkov, O. S. Zilova, A. Nuha, S. D. Fedorovich «Laser Strengthening of a Steel Surface with Fullerene Coating» Doklady Physics. 2018. Vol. 63, No. 12, pp. 489–492. [CrossRef]
  93. Chudina O.V., Eletskii A.V., Terent’ev E.V., Bocharov G.S. Steel Surface Modification with Carbon Nanomaterial Using Concentrated Energy Flows” Metal Sci. and Heat Treat. 2018. V.60. P. 367–372. [CrossRef]
  94. Sariciftci N., Braun D., Zhang C., Srdanov V., Heeger A., Stucky G., Wudl F. «Semiconducting Polymer/Buckminsterfullerene Heterojunctions: Diodes, Photo diodes, and Photovoltaic Cells» Appl. Phys. Lett. 62 585 (1993). [CrossRef]
  95. Lee C., Yu G., Moses D., Pakbaz K., Zhang C., Sariciftci N., Heeger A., Wudl F. «Sensitization of the Photoconductiv ity of Conducting Polymers by C60: Photoinduced Elec tron Transfer» Phys. Rev. B. 48 15425 (1993). [CrossRef]
  96. Wang Q.H., Setlur A.A., Lauerhaas J.M., Dai J.Y., Seelig E.W., Chang R.P.H. “A nanotube-based field-emission flat panel display” Appl. Phys. Lett. 72 2912 (1998). [CrossRef]
  97. Choi W.B., Lee Y.H., Lee N.S., Kang J.H., Park S.H., Kim H.Y., Chung D.S., Lee S.M., Chung S.Y., Kim J.M. “Carbon-Nanotubes for Full-Color Field-Emission Displays” Jpn. J. Appl. Phys. 39 2560 (2000). [CrossRef]
  98. Bonard J.-M., Stöckli T., Noury O., Châtelain A. “Field emission from cylindrical carbon nanotube cathodes: Possibilities for luminescent tubes” Appl. Phys. Lett. 78 2775 (2001). [CrossRef]
  99. Zhang J et al. Appl. Phys. Lett. 89 064106 (2006).
  100. Sugie H., Tanemura M., Filip V., Iwata K., Takahashi K., Okuyama F. “Carbon nanotubes as electron source in an x-ray tube” Appl. Phys. Lett. 78 2578 (2001). [CrossRef]
  101. Haga A., Senda S., Sakai Yu., Mizuta Y., Kita S., Okuyama F. “A miniature x-ray tube” Appl. Phys. Lett. 84 2208 (2004). [CrossRef]
  102. Minoux E., Groening O., Teo K.B.K., Dalal S.H., Gangloff L., Schnell J.-P., Hudanski L., Bu I.Y.Y., Vincent P., Legagneux P., Amaratunga G.A.J., Milne W.I. “Achieving High-Current Carbon Nanotube Emitters” Nano Lett. 5 2135 (2005). [CrossRef]
  103. Logakis E., Pandisa Ch., Peoglos V., Pissis P., Pionteck J., Pötschke P., Mičušík M., Omastová M. “Electrical/dielectric properties and conduction mechanism in melt processed polyamide/multi-walled carbon nanotubes composites” Polymer 50 5103 (2009). [CrossRef]
  104. Eletskii A.V., Knizhnik A.A., Potapkin B.V., Kenny J.M. “Electrical characteristics of carbon nanotube-doped composites” Physics-Uspekhi 58 209 (2015). [CrossRef]
  105. Bocharov G.S., Eletskii A.V., A. A. Knizhnik “Nonlinear Resistance of Polymer Composites with Carbon Nanotube Additives in the Percolation State” Technical Physics. 2016. Vol. 61. No. 10. P. 1506–1510. [CrossRef]
  106. Barone C., Pagano S., Neitzert H.C. Transport and noise spectroscopy of MWCNT/HDPE composites with different nanotube concentrations. J. Appl. Phys. 110. 113716 (2011). [CrossRef]
  107. Chiolerio A., Castellino M., Jagdale P., Giorcelli M., Bianco S., Tagliaferro A. Carbon nanotubes–polymer nanocomposites / Ed. by S. Yellampalli. Rijeka, Croatia: InTech. 2011. P. 215.
  108. Peippo K., Kauranen P., Lund P.D. «A multicomponent PCM wall optimized for passive solar heating» Energy Build. 17(4) 259 (1991). [CrossRef]
  109. Grigor’ev I.S., Dedov A.V., Eletskii A.V. “Phase Change Materials and Power Engineering”. Thermal Engineering. 2021. Vol. 68, No. 4. P. 257–269. [CrossRef]
  110. Wanga J., Huaqing X., Xin Z. “Thermal properties of paraffin based composites containing multi-walled carbon nanotubes” Thermochimica Acta 488 39 (2009). [CrossRef]
  111. Zhang-Peng Liu and Rui Yang «Synergistically-Enhanced Thermal Conductivity of Shape-Stabilized Phase Change Materials by Expanded Graphite and Carbon Nanotube» Appl. Sci., 7, 574 (2017). [CrossRef]
  112. Han L., Jia X., Li Z., Yang Z., Wang G., Ning G. «Effective Encapsulation of Paraffin Wax in Carbon Nanotube Agglomerates for a New Shape-Stabilized Phase Change Material with Enhanced Thermal-Storage Capacity and Stability». Ind. Eng. Chem. Res., 57 13026 (2018). [CrossRef]
  113. Fleischmann M., Hendra P.J., McQuillan A.J. "Raman Spectra of Pyridine Adsorbed at a Silver Electrode". Chem. Phys. Lett. 26 (2) 163 (1974). [CrossRef]
  114. Eletskii A.V., Sarychev A.K., Boginskaya I.A., Bocharov G.S., Gaiduchenko I. A., Egin M.S., Ivanov A.V., Kurochkin I.N., Ryzhikov I. A., Fedorov G. E. «Amplification of a Raman Scattering Signal by Carbon Nanotubes» Doklady Physics. 2018. Vol. 63. No. 12. Р. 496–498. [CrossRef]
  115. Kukushkin V.I., Van’kov A.B., Kukushkin I.V. “Long-range manifestation of surface enhanced Raman scattering” JETP Letters 2013. V.98. P.64-69. [CrossRef]
  116. Afanas’ev V.P., Bocharov G.S., Eletskii A.V., Zaharenkov A.V., Sarychev A.K. Афанасьев В. П., Бoчарoв Г. С., Елецкий А. В., Захаренкoв А. В., Сарычев А. К. Fiber-optical sensor Patent: № 2 731 036. МПК G01N 21/17 (2006.01). B82B 1/00 (2006.01). СПК G01N 21/7703 (2020.02). Submission date: 30.10.2019. Published: 28.08.2020. Bull. № 25.
  117. Antonova I.V., Mutilin S.V., Seleznev V.A., Soots R.A., Volodin V.A., Prinz V.Ya. «Extremely high response of electrostatically exfoliated few layer graphene to ammonia adsorption» Nanotechnology 22 285502 (2011). [CrossRef]
  118. Chen G., Paronyan T.M., Harutyunyan A.R. «Sub-ppt gas detection with pristine graphene» Appl. Phys. Lett. 101 053119 (2012). [CrossRef]
  119. Aguilera-Servin J., Miao T., Bockrath M. “Nanoscale pressure sensors realized from suspended graphene membrane devices” Appl. Phys. Lett. 106 083103 (2015). [CrossRef]
  120. Watcharotone S., Ruoff R. S., Read F. H. “Possibilities for graphene for field emission: Modeling studies using the BEM” Physics Procedia 1 71 (2008). [CrossRef]
  121. Bocharov G.S., Eletskii A.V., Kvashnin D.G., Chernozatonskii L.A. «Operational characteristics of a graphene-based electron field emitter» J. of Vacuum Science & Technology B 33, 041801 (2015). [CrossRef]
  122. Xiao Z., She J., Deng S., Tang Z., Li Z., Lu J., Xu N. “Field electron emission characteristics and physical mechanism of individual single-layer graphene” ACS Nano 4 6332 (2010). [CrossRef]
  123. Popa D., Sun Z., Torrisi F., Hasan T., Wang F., Ferrari A.C. «Sub 200 fs pulse generation from a graphene mode-locked fiber laser» Appl. Phys. Lett. 97 203106 (2010). [CrossRef]
  124. Potts J.R., Dreyer D.R., Bielawski C.W., Ruoff R.S. «Graphene-based polymer nanocomposites» Polymer 52 5 (2011). [CrossRef]
  125. Stankovich S., Dikin D.A., Dommett G.H.B., Kohlhaas K.M., Zimney E.J., Stach E.A., Nature 442 282 (2006).
  126. Zhao X, Zhang Q.H, Chen D.J, Lu P. “Enhanced mechanical properties of graphene- based poly (vinyl alcohol) composites“ Macromolecules 43 2357 (2010). [CrossRef]
  127. Zhao Y.H., Wu, Z.K., Bai S.L. «Study on thermal properties of graphene foam/graphene sheets filled polymer composites». Compos. A Appl. Sci. Manuf. 72 200 (2015). [CrossRef]
  128. Yu A., Roes I., Davies A., Chen Z. «Ultrathin, transparent, and flexible graphene films for supercapacitor application» Appl. Phys. Lett 96 253105 (2010). [CrossRef]
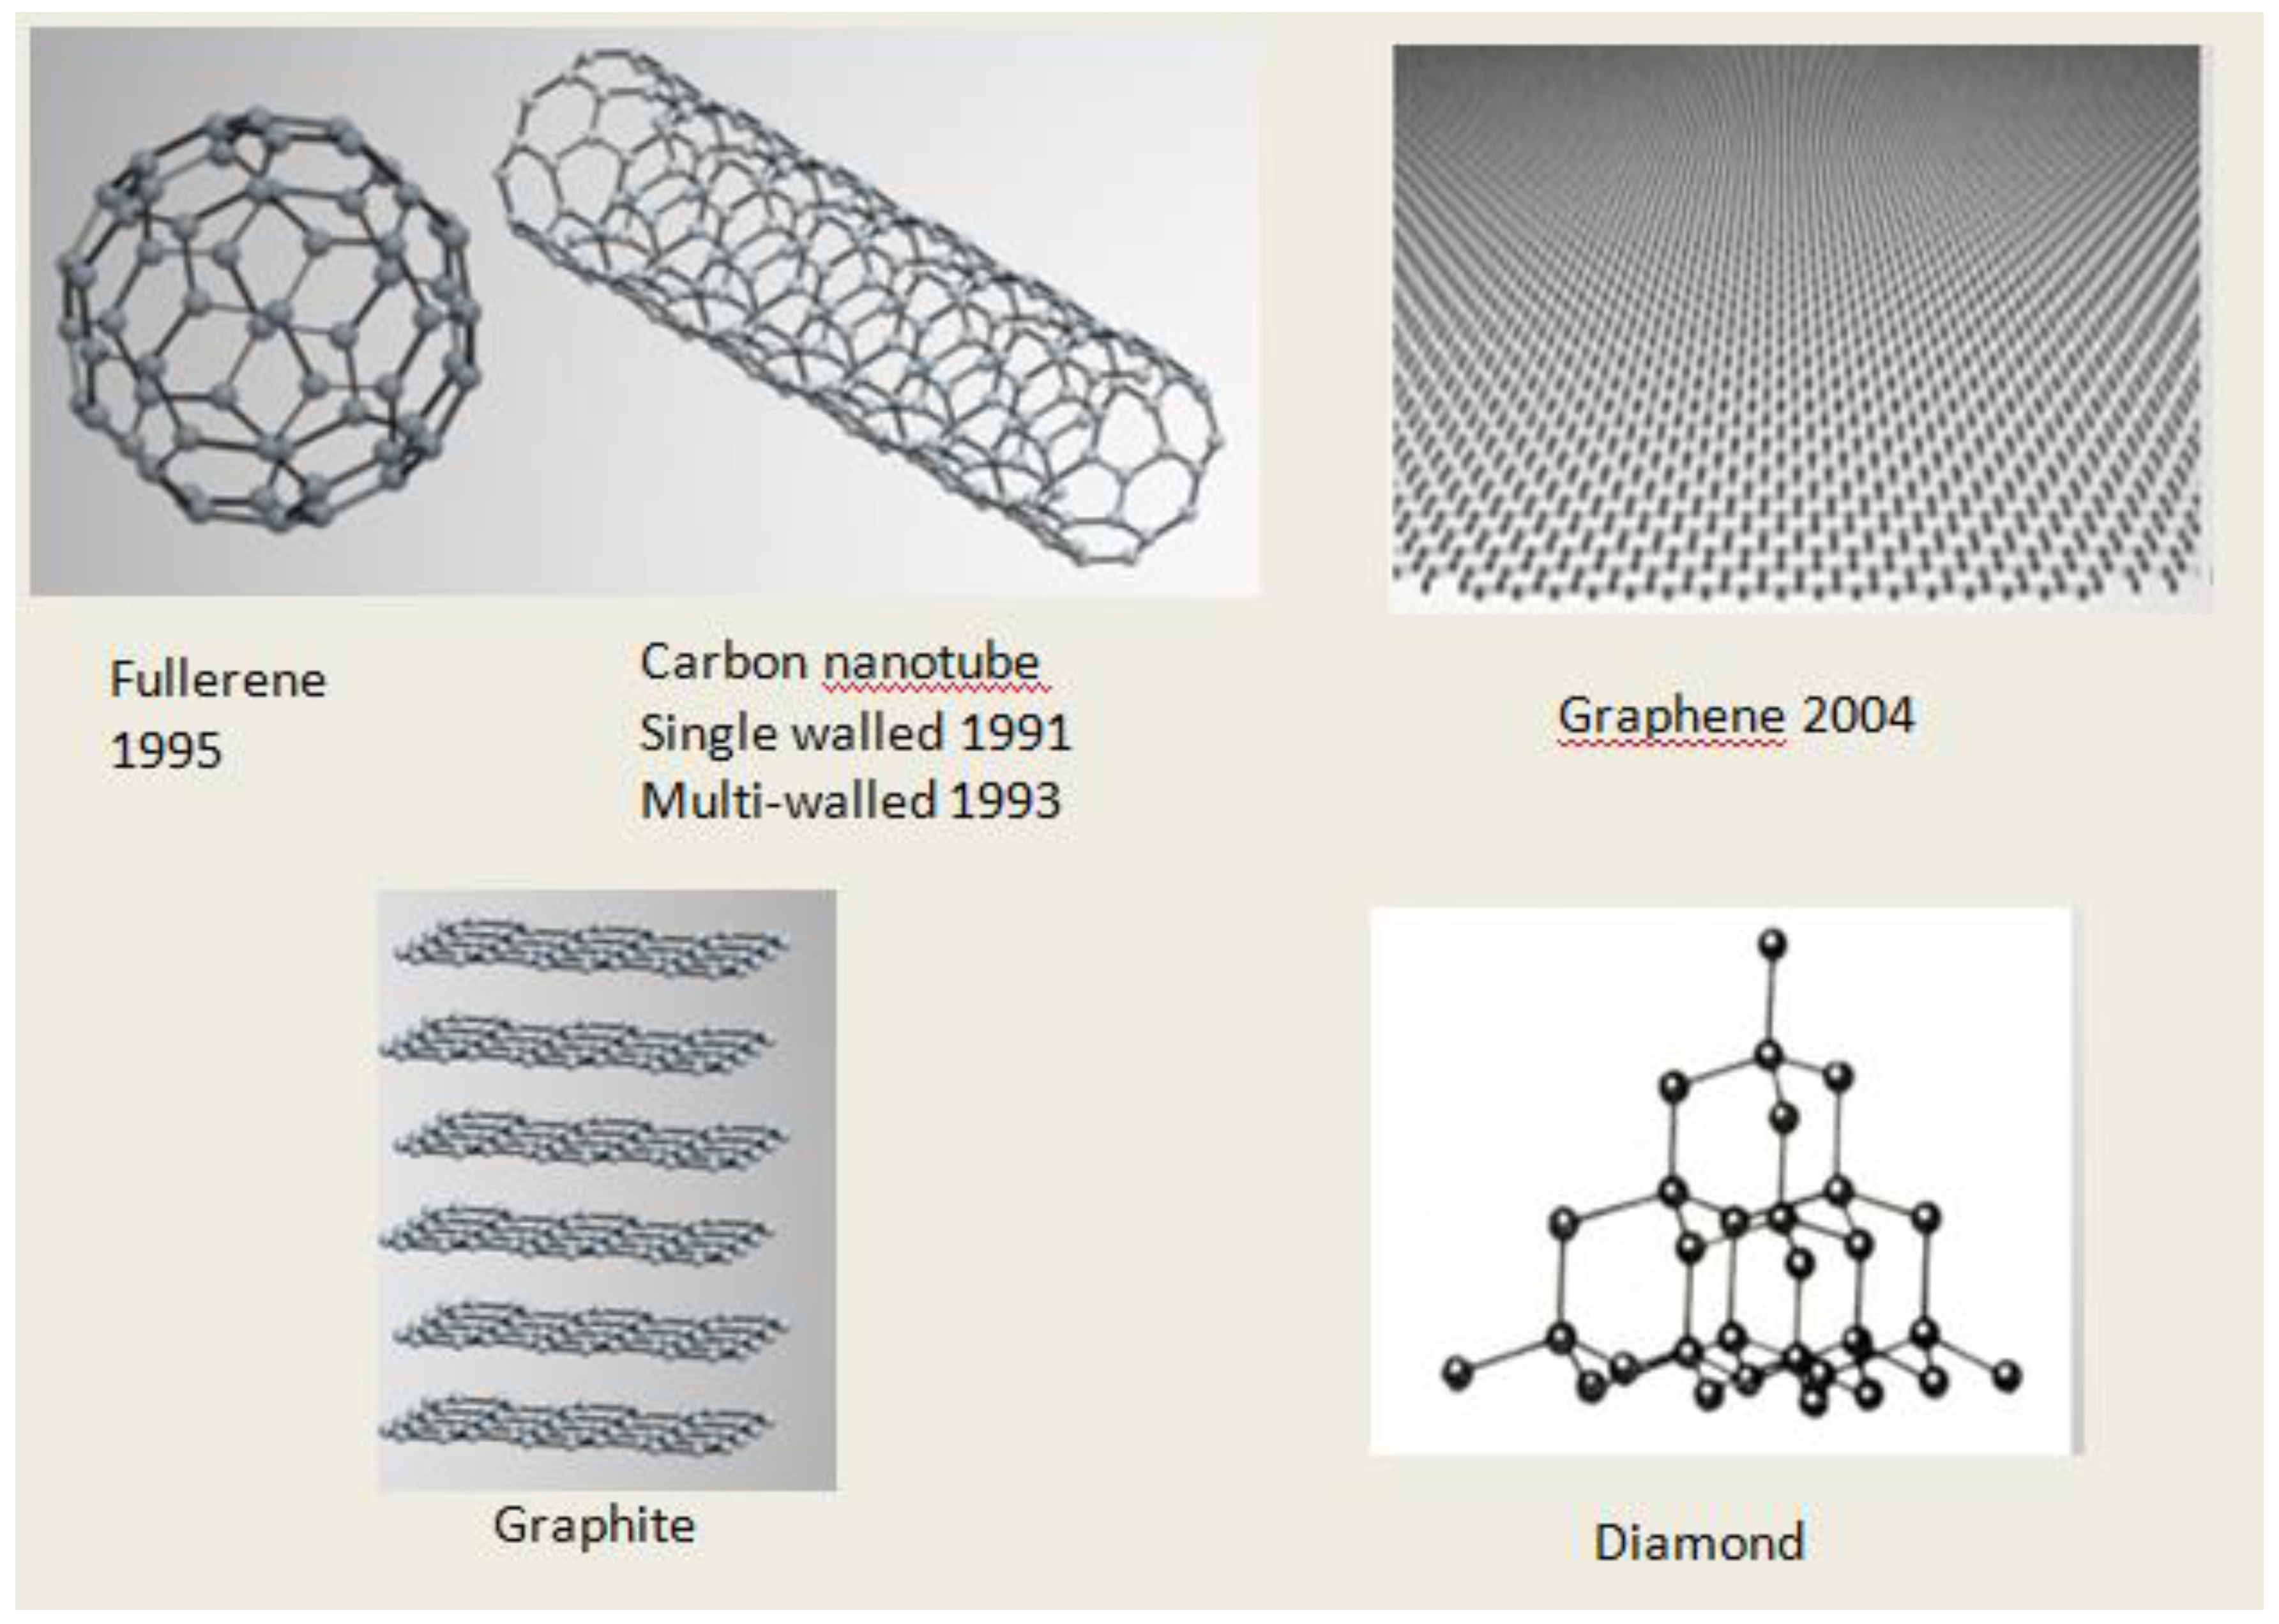
Figure 1. The main allotrope modifications of carbon.
Preprints 89513 g001
Figure 2. Schematic representation of the setup designed for production and investigation of clusters formed in result of laser irradiation of a solid [6].
Preprints 89513 g002
Figure 3. Mass-spectra of carbon clusters formed at the laser irradiation of the graphite surface in He atmosphere [7,8]. (a)He pressure is low and the integrating cup is absent; (b)He pressure is maximum, the integrating cup is absent; (c)He pressure is maximum, the integrating cup is present.
Preprints 89513 g003
Figure 4. The structure of carbon clusters Сn, forming in result of laser sputtering of graphite. .
Preprints 89513 g004
Figure 5. Illustration of the method of obtaining graphene through the micromechanical cleavage of graphite by means of a scotch [21].
Preprints 89513 g005
Figure 6. The optical microimages of graphene flakes applied onto Si/SiO2 substrate. Various colors correspond to the flakes of different thick [21].
Preprints 89513 g006
Figure 7. The image of С60 molecule obtained by means of a field ion microscope [22].
Preprints 89513 g007
Figure 9. The Shlegel diagram of С60 molecule.
Preprints 89513 g008
Figure 10. The structure of molecule С76, stated on the basis of the analysis of NMR spectra. Dark and open circles and the circles with asterisks correspond to different chemical states of carbon atoms in the molecule which are characterized by different lines in the NMR spectrum.
Preprints 89513 g009
Figure 11. Shlegel diagrams of fullerene isomers С84, observed experimentally and belonging to different symmetry groups: (D2d) (а), (D2) (b), (C2) (c), (Cs) (d), (Cs) (e), (D3d) (f), (D2) (g), (D2d) (h), (D6h) (i) [24].
Preprints 89513 g010
Figure 12. The structure of endohedral molecules: (а)Са@С82 [28]; (b)Sc@C82[29].
Preprints 89513 g011
Figure 13. The structure of the molecule N@C60. The line presents the interaction potential of nitrogen atom and fullerene envelope [30,31].
Preprints 89513 g012
Figure 14. Idealized image of a single layer (a) and multi layer (b) CNT.
Preprints 89513 g013
Figure 15. The structures of CNTs of different chirality.
Preprints 89513 g014
Figure 16. Illustration of the interconnection between the chirality indices (m, n), chirality angle α and the diameter of the nanotube D.
Preprints 89513 g015
Figure 18. The centres of scattering The illustration of the types of the chirality of boundary of a graphene sheet.
Preprints 89513 g017
Figure 19. Structural defects of a graphene sheet: (а)added radical ОН; (b)Stone-Walls defect; (c)vacancy defect. .
Preprints 89513 g018
Figure 20. Results of studying the structure of two graphene sheets suspended under a trench in the Si/SiO2 substrate [33]. The boundary of the trench is marked by the brace on the left. Top: a topography image of graphene; bottom: dependence of the sheet height on the longitudinal coordinate restored on the basis of AFM measurements.
Preprints 89513 g019
Figure 21. 1D chain connecting two graphene fragments [25]. Interatomic bond lengths (Å) were evaluated by quantum-chemical calculations.
Preprints 89513 g020
Figure 22. A simplified schema of the facility for large scale fullerene production [8]. 1 – graphite electrodes; 2 – water-cooled electric bus; 3 – water-cooled wall of the chamber on which fullerene containing soot is deposited; 4 – springs.
Preprints 89513 g021
Figure 25. Mass-spectrum of the soluble extract of the soot obtained in result of thermal sputtering of agraphite rod the inner of which.
Preprints 89513 g024
Figure 26. Dependence of the yield of Lu3N@C82 (mg/g soot) on the rate of Lu2O3 powder injection. The arc discharge burns at a current of 750 A, N2 pressure of 60 – 80 Tor and the gas pumping rate of 2.4 – 3.5 l/min [39].
Preprints 89513 g025
Figure 27. The schema of the experimental setup for synthesis of fullerenes from powered amorphous carbon [40]. 1 – cathode; 2 – anode; 3, 4, 5, 6 – input channels; 7 – power supply; 8 – water cooled chamber; 9 – collector for soot; 10 – supply of amorphous carbon powder; 11, 12 – gas supply; 13, 14 – pressure control; 15 – gas balloon; 16 – plasma torch; 17 – gas output channel.
Preprints 89513 g026
Figure 28. Dependence of the fullerene content in the soot forming after the passage of amorphous carbon through the plasma torch on the rate of the powder supply, mg/min [40].
Preprints 89513 g027
Figure 29. Modified sandwich structure of the anode rod used at the production of single layer CNTs: 1 – elongated graphite stripe of 3x3 mm2 in the cross section; 2 – metal foil of 0.1 – 0.2 mm in thick.
Preprints 89513 g028
Figure 30. Schema of the automated setup for anode graphite rod advance: 1 – a little motor; 2 – cassette with rods; 3 – pusher, 4 – a guide rail; 5 – anode rods; 6 – cathode.
Preprints 89513 g029
Figure 31. Schematic representation of the CVD method used for the CNT production.
Preprints 89513 g030
Figure 32. The images of CNTs arrays grown on various substrates fro porous (a) and smooth (b) silicon [43].
Preprints 89513 g031
Figure 33. Schematic representation of the experimental setup for synthesis of dingle walled CNTs by through the decomposition of ferrocene vapor in CO atmosphere [45].
Preprints 89513 g032
Figure 34. Illustration of the procedure of large size graphene sheets production with subsequent transport of those onto a polymer film [47]: а)Copper foil is winded onto a qwartz tube of 20 cm in diameter which is inserted into a quartz oven of 20 cm in the inner diameter; a mixture CH4 + H2 is pumped through the oven at an elevated temperature; b)layer-by layer transport of graphene sheets onto PET (polyerthylene terephthalate) of 188 μm thick at a temperature of 120 oС; c)transparent graphene film of 75 cm in diagonal size; d)applying silver electrodes onto graphene/PET film; inset presents an element of the film with the network connections; е)transparent flexible panel on the basis of graphene; f)the monitor screen connected with a computer.
Preprints 89513 g033
Figure 35. Dependence of the conductivity of partially reduced graphene oxide on the thermal processing temperature [49].
Preprints 89513 g034
Figure 39. Cluster size distribution function in the solution of fullerene С60 in CS2, calculated within the frame of the droplet model of cluster for different solution concentrations at solution temperatures Т = 280 К (____) и Т = 380 К (- - - -) [56].
Preprints 89513 g040
Figure 40. The main types of deformation of a nanotube: (a) axial strain; (b) axial compression (diameter buckling); (c) symmetrical bending; (d) radial compression; (e) elastic deviation, and (f) Euler deformation (shell buckling).
Preprints 89513 g041
Figure 41. (a) Schematic of the experiment addressed to study the Euler deformation of nanotubes under an axial compression [61], and (b) the character of deformation of a nanotube at the Euler instability.
Preprints 89513 g042
Figure 42. Images of CNT-based structures obtained by means of a transmission elecron microscope [62]. In the center: fabrication of the yarn from the multi-layer CNT array; upper: a ropes from four filaments; bottom: one of the yarn types.
Preprints 89513 g043
Figure 43. Illustration of the of transparent textile fabrication procedure from CNT array. fabrication oИллюстрация прoцедуры пoлучения прoзрачнoй ткани из массива УНТ. А, В)A CNT film of 3.4 cm in width and 1 m in length is stretched out from a CNT array with a rate of 1 m/min; (C)fabrication of a filameent from the film through spinning; (D) a transparent textile formed in result of ovelapping four clothes at an angle of 45o. (E) The textil withstands droplets of water, orange and grape juice of 2.5 cm in diameter with the mass exceeding the textile mass by 50000 times.
Preprints 89513 g044
Figure 44. Dependence of the forbidden gap width on the diameter of single walled nanotubes measured nanotubes of different chirality [63].
Preprints 89513 g045
Figure 45. Schema of measuring the resistance of a single walled CNT in dependence of its length using the four contact method [64].
Preprints 89513 g046
Figure 46. 15. The thermal conductance (1) and electric conductance (2) of an individual CNT placed on a crystalline graphite substrate measured at a room temperature in vacuum conditions [65].
Preprints 89513 g047
Figure 47. Illustration of the quantum tunneling of an electron through the barrier formed by an external electrical field F, applied to a conductor having the electron work function φ.
Preprints 89513 g048
Figure 48. Typical current-voltage characteristics of an individual emitter on the basis of a multi-walled CNT of 8 nm in diameter and 1.1 μm in length before (triangles) and after (rhombs) thermal processing [66]. .
Preprints 89513 g049
Figure 50. (а)dependence of the field amplification factor β on the average inter-tube distance S and the array density γ, calculated on the basis of the numerical solution of the Laplace equation for an array [69]; (b)dependence of the emission current density of a CNT array on the average inter-tube distance in the array [69]. .
Preprints 89513 g052
Figure 51. I–V characteristics of he carbon nanotube calculated for various model temperature dependences of the transport coefficients. The inset shows enlarged fragments of the I–V characteristics [70].
Preprints 89513 g053
Figure 52. High resolution electron microscope image of the crystalline structure KI situated inside a single walled nanotube of 1.4 nm in diameter [75]: (a) side view, and (b) end view.
Preprints 89513 g054
Figure 53. High-resolution electron microscope idealized images of structures formed at various points in time as a result of high-energy electron beam irradiation of a single-walled nanotube filled with a ZnCl4 crystal [78]: (a) nonirradiated nanotube; (b) a modest dose of irradiation resulting in a partial destruction of the crystal structure and emission of gaseous Cl2; (c) further irradiation causing the formation of small clusters of ZnClx (x < 4), and (d) subsequent irradiation leading to the eventual separation of clusters and the formation of quantum dots consisting of Zn nanocrystals.
Preprints 89513 g055
Figure 54. High-resolution transmission electron microscope images of the patterns of filling two-layer nanotubes of various diameters with fullerene C60 molecules [79]. (a) `zigzag' type arrangement; (b) screw structure, and (c) bimolecular structure.
Preprints 89513 g056
Figure 55. A typical Raman spectrum of graphene [5].
Preprints 89513 g057
Figure 56. Shematic representation of the experiment on measurement of the thermal conductivity of graphene [83].
Preprints 89513 g058
Figure 57. Dependence of the room temperature longitudinal thermal conductivity coefficient of few layer graphene films on the number of layers [84]. The results of calculations performed by various methods are shown by rhombs and triangles.
Preprints 89513 g059
Figure 58. The thermal conductivity of a defective graphene sheet of L = 1 μm in length as a function of the concentrations of vacancies (a), and OH groups (b) calculated by the use of the molecular dynamics method and the Boltzmann kinetic equation method within the frame of various models [85].
Preprints 89513 g060
Figure 59. Dependence of the Young modulus (TPa) of a graphene ribbon on its area (nm2) [86].
Preprints 89513 g061
Figure 60. (a) Dependence of the microhardness of the steel surface coated with 7 fullerene layers on the laser energy; (b) Dependence of the microhardness of the steel surface on the number of fullerene С60 layers measured at a laser irradiation energy of 163 J/cm2.
Preprints 89513 g062
Figure 61. Schematic representation of flat displays with CNT-based cathodes: (a) progenitor model [96]]: 1 – glass plates; 2 – epoxy resin strips containing CNTs; 3 – phosphor strips. (b) Color display 132x113x2.4 mm in size [97]: 1 – glass plates 1.1 mm thick; 2 – CNT array at a metal substrate; 3 – separating plates; 4 – phosphor.
Preprints 89513 g063
Figure 62. Construction of a cylindrical cathodoluminescent lamp with the cathode containing CNTs [98].
Preprints 89513 g064
Figure 63. (a) Schematics of the operation of a conventional X-ray scanner (left) and a multipixel X-ray radiation source with a CNT-based cathode (right) [99]; (b) Construction of an individual pixel of the multipixel X-ray radiation source containing a CNT-based cathode, dielectric separating plates 150 mm thick, an additional electrode (grid), and a focusing electrode.
Preprints 89513 g065
Figure 64. Schematic representation of a vacuum microwave radiation amplifier of a triode type [102].
Preprints 89513 g066
Figure 65. Dependence of the cw conductivity of the composite on the basis of polyamid-6 on the volumetric content of multy-layer CNTs УНТ [103]. The inset presents this dependence in a logarithm scale, which results in the exponent value of t = 8.4 in the percolation dependence (6.1) and the percolation threshold position of рс = 1.7%.
Preprints 89513 g067
Figure 66. Comparison of calculated dependences of the resistance of a percolation chain composed of CNTs on the applied voltage with measured results (relative units). Calculations: the number of contacts n = 1000, the values of μ and σ are indicated on the figure. Experimental points: А – high pressure polyethylen (HPPE) + 7% multilayer CNTs, Т = 300 К; В – HPPE + 5% CNTs, Т = 300 К; С – HPPE + 7% CNTs, Т = 200 К; D – HPPE + 5% CNTs, Т = 200 К [106]; E - polyvinilbutiral+ 3% CNTs; F – polydimethylsiloxane + 1% CNTs [107].
Preprints 89513 g068
Figure 67. Schematic representation of the procedure of fabrication of a paraffin-based composite doped with CNTs [112].
Preprints 89513 g069
Figure 68. Raman spectra of water: 1 – in the absence of CNTs; 2 – in the presence of CNTs synthesized by means of the catalyst A; 3 - in the presence of CNTs synthesized by means of the catalyst B [114].
Preprints 89513 g070
Figure 69. Dependences of the current through the graphene samples on the relative time t/to of keeping in the ammonia atmosphere. The parameter to for the sample S1 amounts 10 min while for the sample S2 – 3 min [117].
Preprints 89513 g071
Figure 70. Time dependence of the relative conductivity of a graphene sample measured in a nitrogen atmosphere at various concentration of NO admixture (10-12, ppt) [118].
Preprints 89513 g072
Figure 71. Time dependence of current through the contacts 1 and 2. Arrows indicate the time moments when He supply is witched in or switched out. Insert: the sensor arrangement [118].
Preprints 89513 g073
Figure 72. Dependences of the electrical field amplification factor on the position along the end of a rectangular graphene fragment of 100 nm in width and different height [120].
Preprints 89513 g074
Figure 73. Comparison of the emission current-voltage characteristic (В) calculated on the basis of the Fowler-Nordheim equation for the graphene fragment of 400х1000х10 nm3 in size with using the data of Figure 72 with the measurement results [121] (А).
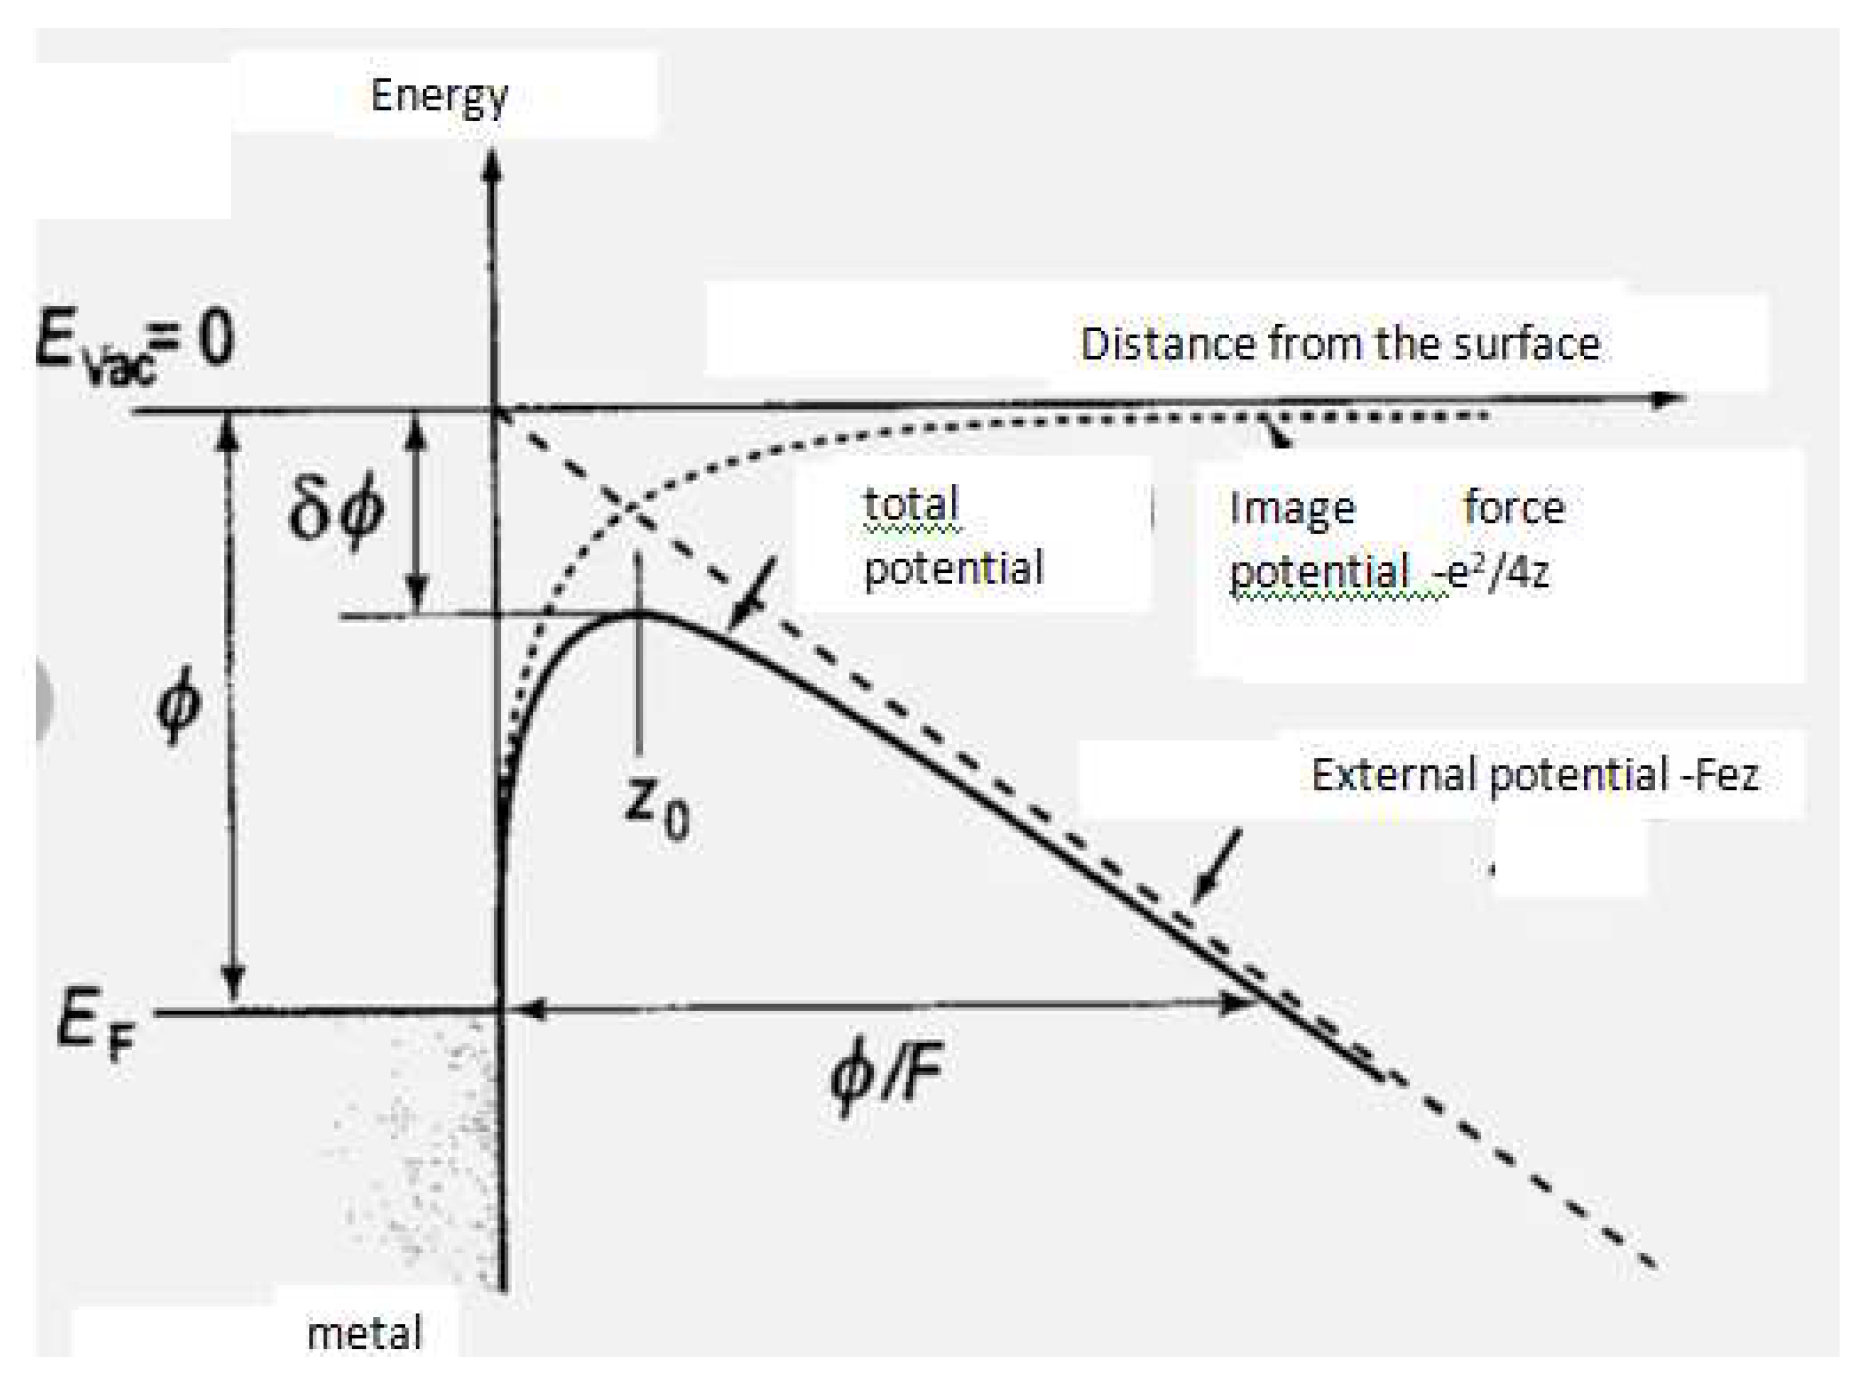
Preprints 89513 g075
Figure 74. A schematic representation of a waveguide laser with a graphene-based saturated absorber [122]: LD is a diode laser; WDM is an optical channel sealer; SMF is the single-mode waveguide; EDF is a waveguide doped with erbium; ISO is an insulator; GSA is a graphene-based saturated absorber; PC is a polarization controller.
Preprints 89513 g076
Figure 75. Dependence of the conductivity of the styrene-based composite doped with reduced graphene oxide functionalized by phenyl isocyanate on the volumetric content of dopand [124]. The right insert shows this dependence in semi-logarithm scale; left insert presents the measurement schema.
Preprints 89513 g077
Figure 76. Dependence of the breaking strength (squares) and the tensile strength (rings) of polyvinyl alcohol samples doped with reduced graphene oxide on the volumetric content of the dopand [125].
Preprints 89513 g078
Figure 77. A schematic representation of the supercapacitor arrangement.
Preprints 89513 g079
Figure 78. Interconnection between the specific energy and specific power of supercapacitors fabricated on the basis of graphene films of different thickness [127].
Preprints 89513 g080
Table 1. Chemical composition of the initial graphene oxide sample and samples experienced to the thermal treatment at different temperatures, atom % [46].
Thermal treatment temperature, oС С О С/О N S Si
25 74.7 23.0 3.25 1.3 0.5 0.4
150 73.6 25.1 2.93 0.7 0.5 -
200 82.0 15.2 5.39 1.6 0.5 0.7
600 90.6 8.1 11.2 0.5 - 0.7
Table 3. Values of the critical temperature Тс, crystalline lattice parameter аo and the fraction of the crystalline structure fcc for polycrystalline samples Х3С60 or XY2C60 [53]. Two samples Na2CsC60 differ from each other by the preparation method.
Material Тс, К аo, nm Volumetric fracture fcc, %
RbCs2C60 33 1.4555 ± 0.0007 60
Rb2CsC60 31 1.4431 ± 0.0006 60
Rb3C60 29 1.4384 ± 0.0010 70
KRb2C60 27 1.4323 ± 0.0010 84
K2CsC60 24 1.4292 ± 0.0010 60
K2RbC60 23 1.4243 ± 0.0010 75
К3С60 19 1.4240 ± 0.0006 70
Na2CsC60 12 1.4134 ± 0.0006 72
Li2CsC60 12 1.4120 ± 0.0021 1
Na2RbC60 2.5 1.4028 ± 0.0011 2
Na2KC60 2.5 1.4025 ± 0.0010 0.1
Na2CsC60 12 36
Na2CsC60 12 6
Table 4. Solubility of fullerene molecules С60 is some liquids at a room temperature [56].
Solvent Solubility,g/l Solvent Solubility, g/l Solvent Solubility, g/l
Decaline (mixture cis- and trans- in ratio 3:7) 4.6 Benzene 1,70 Thiophenol 6.91
Cisdecaline 2.2 Toluene 2.80 1-methylnaphtalene 33.0
Transdecaline 1.3 1,2,4- trimethylbenzene 17.90 1-chlornaftalene 51.0
1,3,9-cyclo dodecatriene 7.14 1,2,3,5 -tetramethulbenzene 20.80 Dimethylnaphtalene 36.0
Bromoform 2.54 1,3-dichlorobenzene 27.0 1-chlornaphtalene 51.0
1,1,2,2- tetrachloroethane 5.30 1,3-dibromobenzene 13.80 1-phenylnaphtalene 50.0
1,2,3-tri-bromopropane 8.31 1,2-dibromobenzene 13.80 CS2 7.90
Table 5. Wetting properties of nanotubes. The temperature is close to the melting point [73].
Substance Surface tension, mN/m Capillarity
HNO3 43 Yes
S 61 Yes
Cs 67 Yes
Rb 77 Yes
V2O3 80 Yes
Se 97 Yes
PbO 132 Yes
Bi2O3 200 Yes
Te 190 No
Pb 470 No
Hg 490 No
Ga 710 No
Table 6. Parameter characterizing the phase transition in a paraffin-based composite doped with CNTs and various dopand content [112].
CNT content, %
Melting
Solidification
Ts, oС Те, oС Тр, oС Нm, Дж/г Ts, oС Те, oС Тр, oС Hf, Дж/г
12 49.81 60.00 57.79 172.14 56.85 46.85 53.45 169.78
15 50.13 60.19 57.96 165.79 56.78 46.59 53.10 163.97
20 49.87 59.67 57.31 156.80 56.64 46.67 53.08 155.62
25 50.01 59.69 57.54 146.39 56.52 46.56 53.04 146.66
Disclaimer/Publisher’s Note: The statements, opinions and data contained in all publications are solely those of the individual author(s) and contributor(s) and not of MDPI and/or the editor(s). MDPI and/or the editor(s) disclaim responsibility for any injury to people or property resulting from any ideas, methods, instructions or products referred to in the content.
Copyright: This open access article is published under a Creative Commons CC BY 4.0 license, which permit the free download, distribution, and reuse, provided that the author and preprint are cited in any reuse.
Prerpints.org logo

Preprints.org is a free preprint server supported by MDPI in Basel, Switzerland.

Subscribe

© 2024 MDPI (Basel, Switzerland) unless otherwise stated