1. Introduction
“Landscape” encompasses a geographic “area” or “region” that is based on the union of physical nature and human culture [1]. In a broader context, “landscape” can be regarded as a comprehensive system with its structure, boundaries, and interconnections among its components. Contemporary landscape research initially focused on urban areas, addressing concerns such as urban environmental pollution and civic health, before gradually expanding its scope to rural areas [2]. The exploration of rural landscapes has gained prominence due to the urban-rural conflict stemming from rapid urbanization and globalization. In China, the past few decades of rapid urbanization have promoted the nation’s economy and introduced challenges to rural areas [3]. Chinese government data reveals an increasing urban population and a notable trend of urban-rural disconnection, further widening the gap between these regions [4]. Rural areas are marked by diminishing built-up zones and considerable landscape fragmentation, posing a significant challenge to the development of rural China.
In terms of rural revitalization, rural tourism is recognized as one of the important economic tools for rural development in China [5], and it’s also perceived as a catalyst for cultural preservation and the pro-motion of social harmony. Empirical evidence has demonstrated that rural tourism is effective, particularly in the case of traditional Chinese villages blessed with rich and unique landscape resources [6]. The natural landscape resources consist of local climate, hydrological land-forms, vegetation, etc., while the cultural landscape resources include characteristic architecture, religions, folklore, etc. [7]. To promote the sustainable development of rural landscapes, the recreational landscape, closely related to rural tourism, is worthy of further study.
The concept of “recreation” in this study refers to a part of rural tourism, where people can feel happy and release stress, excluding other behaviors such as overnight stays [8]. For a better experience, designers often connect amenities via linear paths. While walking along these paths, individuals are exposed to scenes on the left, right, and ahead. The experience is a physiological stimulation process, including visual, auditory, olfactory, and other multidimensional perceptions, of which vision serves as the primary medium for people to get information. Approximately 80% of external stimuli are visually acquired [9]. This results in a comprehensive aesthetic experience with intricate cultural characteristics, spatial types, and landscape elements [10].
Numerous studies have delved into the evaluation of landscape perception, developing diverse methods and technologies over the decades. Broadly, there are at least three categories of methods: specialist evaluation, public evaluation, and quantitative synthesis integrating subjective and objective analysis [11]. For example, Kun Sang et al. proposed a methodology using AHP and GIS to build a comprehensive evaluation system for the railway heritage landscape [12]; Calvin et al. used the semantic differential approach to evaluate by public through various landscape elements [13]; and M. Arriaza et al. assessed the visual quality of agricultural landscapes through subjective and objective methods [14]. Nevertheless, specialist evaluations may entail arbitrary component determinations and ratings, while public assessments are susceptible to mass-driven fluctuations. Considering these challenges, our research employed the third method, harmonizing subjective and objective techniques, to minimize errors in analyzing observers’ visual preferences and demonstrated the statistical relationship between the two methodologies [15]. Concerning linear path landscape evaluations, the existing research offers limited insights, while Ian D. Bishop et al. discussed path choices on a country walk using a virtual environment, their analysis based on a macro perspective and an entirely natural environment [16]. Therefore, the starting point of this research is to evaluate visual preference based on the linear recreational path landscape, including multidimensional elements such as nature, culture, spatial form, etc.
Eye movement is the dynamic movement through which the eyes gather external visual information. To a certain extent, it can reflect the individual’s internal cognitive process [17]; this activity primarily con-sists of three fundamental forms: gaze, eye hopping, and following [18], and includes the indicators of two dimensions: time (average fixation duration, total fixation duration, and eye hopping duration), and space (saccade distance, fixation count, and saccade count) [19]. Eye-tracking technology quantifies the visual attention and cognitive process of the human eye by objectively recording people’s observation of the land-scape environment so that the subjective feelings can be objectively reflected through the eye-movement indexes, which has the advantage of quantitative research and direct evaluation. It is an effective tool for researching the cognition of built environments [20]. Photographs and real scenes are commonly used stimuli for eye-tracking experiments.
Eye-tracking technology originated at the end of the 19th century and was mainly used in psychology research. Subsequently, its applications extended to geography, cartography, and landscape science. De Lucio studied human landscape preference through vision and found that people were more interested in the central part of the picture [20]; Lien et al. explored the effects of different attributes as well as land-scape features of the photographs on landscape perception [21]; and found that professionals would have more saccade activities than non-professionals [22]; Weidong Zhang used the SBE method combined with eye movement analysis to analyze eye movement differences in urban greening landscapes [23]; Suling Guo et al. combined eye movement with a subjective scale to construct a subjective evaluation system for the visual quality of tourism landscapes [24]; Min Wang et al. found that the hotspot areas of eye-tracking are related to people’s memory emotion of landscape symbols [25]. Eye-tracking methods have yet to be applied much in the landscape field, and their application in rural cultural landscapes and linear recreational experiences is even less.
Osgood proposed the semantic differential (SD) method, which stands as one of the classic methods offered by the psychophysical school. It is used to psychometrically measure human intuitive feelings from a subjective point of view using verbal scales to obtain quantitative data. Back in 1955, Osgood used the SD method to study the visual quality of landscapes [26]; Calvin and Craik et al. used it to evaluate the preference of different landscape elements [13]; in the 1990s, Cao Juan first investigated the landscape evaluation of Beijing nature reserves through SD method and factor analysis [27]. Combining the objective measurement of eye-tracking analysis and the subjective determination of the SD method can reduce the constraints of singular evaluation and effectively refine the evaluation process. This holds profound implications for assessing rural cultural landscape and path shaping through linear excursion experience.
In the case study of Baofeng Village, located in Yunlong County, the research studied three recreational paths with different characteristics, aiming to expand the methods of rural recreational path land-scape evaluation and explore the significance of the results to rural tourism development. Considering the above analysis, the eye-tracking experiment is chosen as the main research technique, as data from subjects were collected and combined with the result of subjective se-mantic evaluation. It attempts to answer the following questions:
Tourists’ visual preferences for different rural recreation paths and the attractiveness of specific elements to them;
The influence of subjects’ differences on this evaluation;
The correlation between objective and subjective evaluation results and the possibility of subjective-objective combined evaluation system;
The design and planning strategies of rural recreation paths.
2. Study Area
2.1. Site Overview
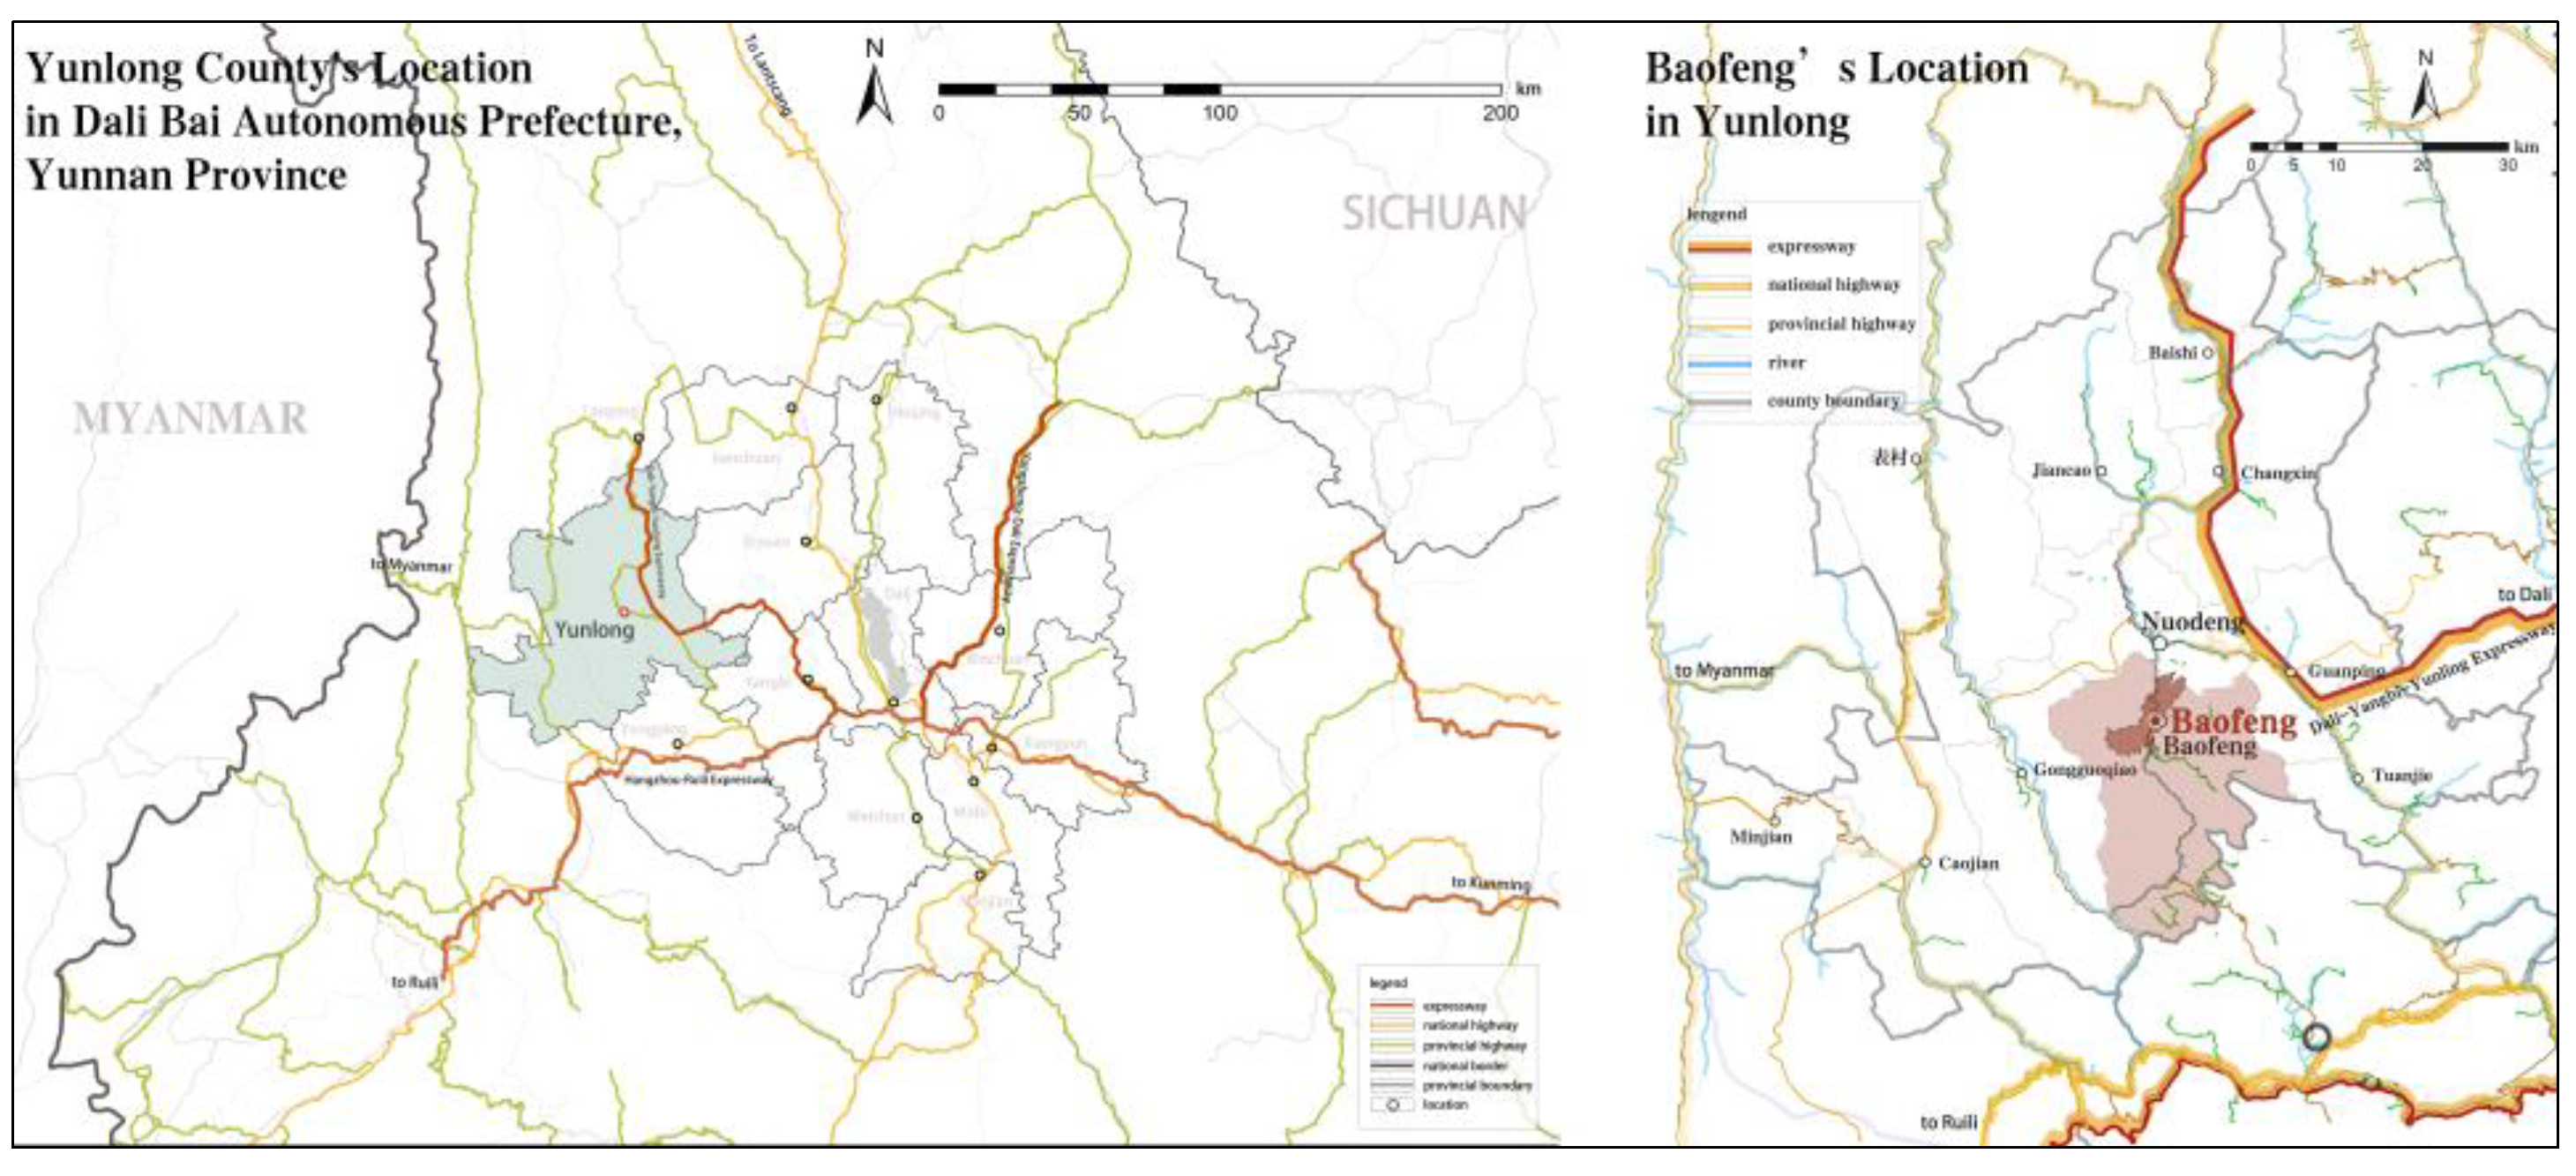
Located in Yunlong County, Yunnan Province, Baofeng is an important salt-producing village in Yunlong, where the Jinquan salt well, one of “the Eight Salt Wells in Yunlong,” is an important node on the Salt Horse Trail. It was also the capital of Yunlong Prefecture for 300 years. Its importance is intrinsically tied to salt, resulting in a rich and harmonious complex of cultural and natural landscape resources, melding mountains, water, and villages into a captivating spatial mosaic. However, the rapid urbanization process has inflicted damage upon the rural landscape, diluting sensory experiences.
Figure 1.
Baofeng Village’s Location.
Figure 1.
Baofeng Village’s Location.
2.2. Sample selection for analysis
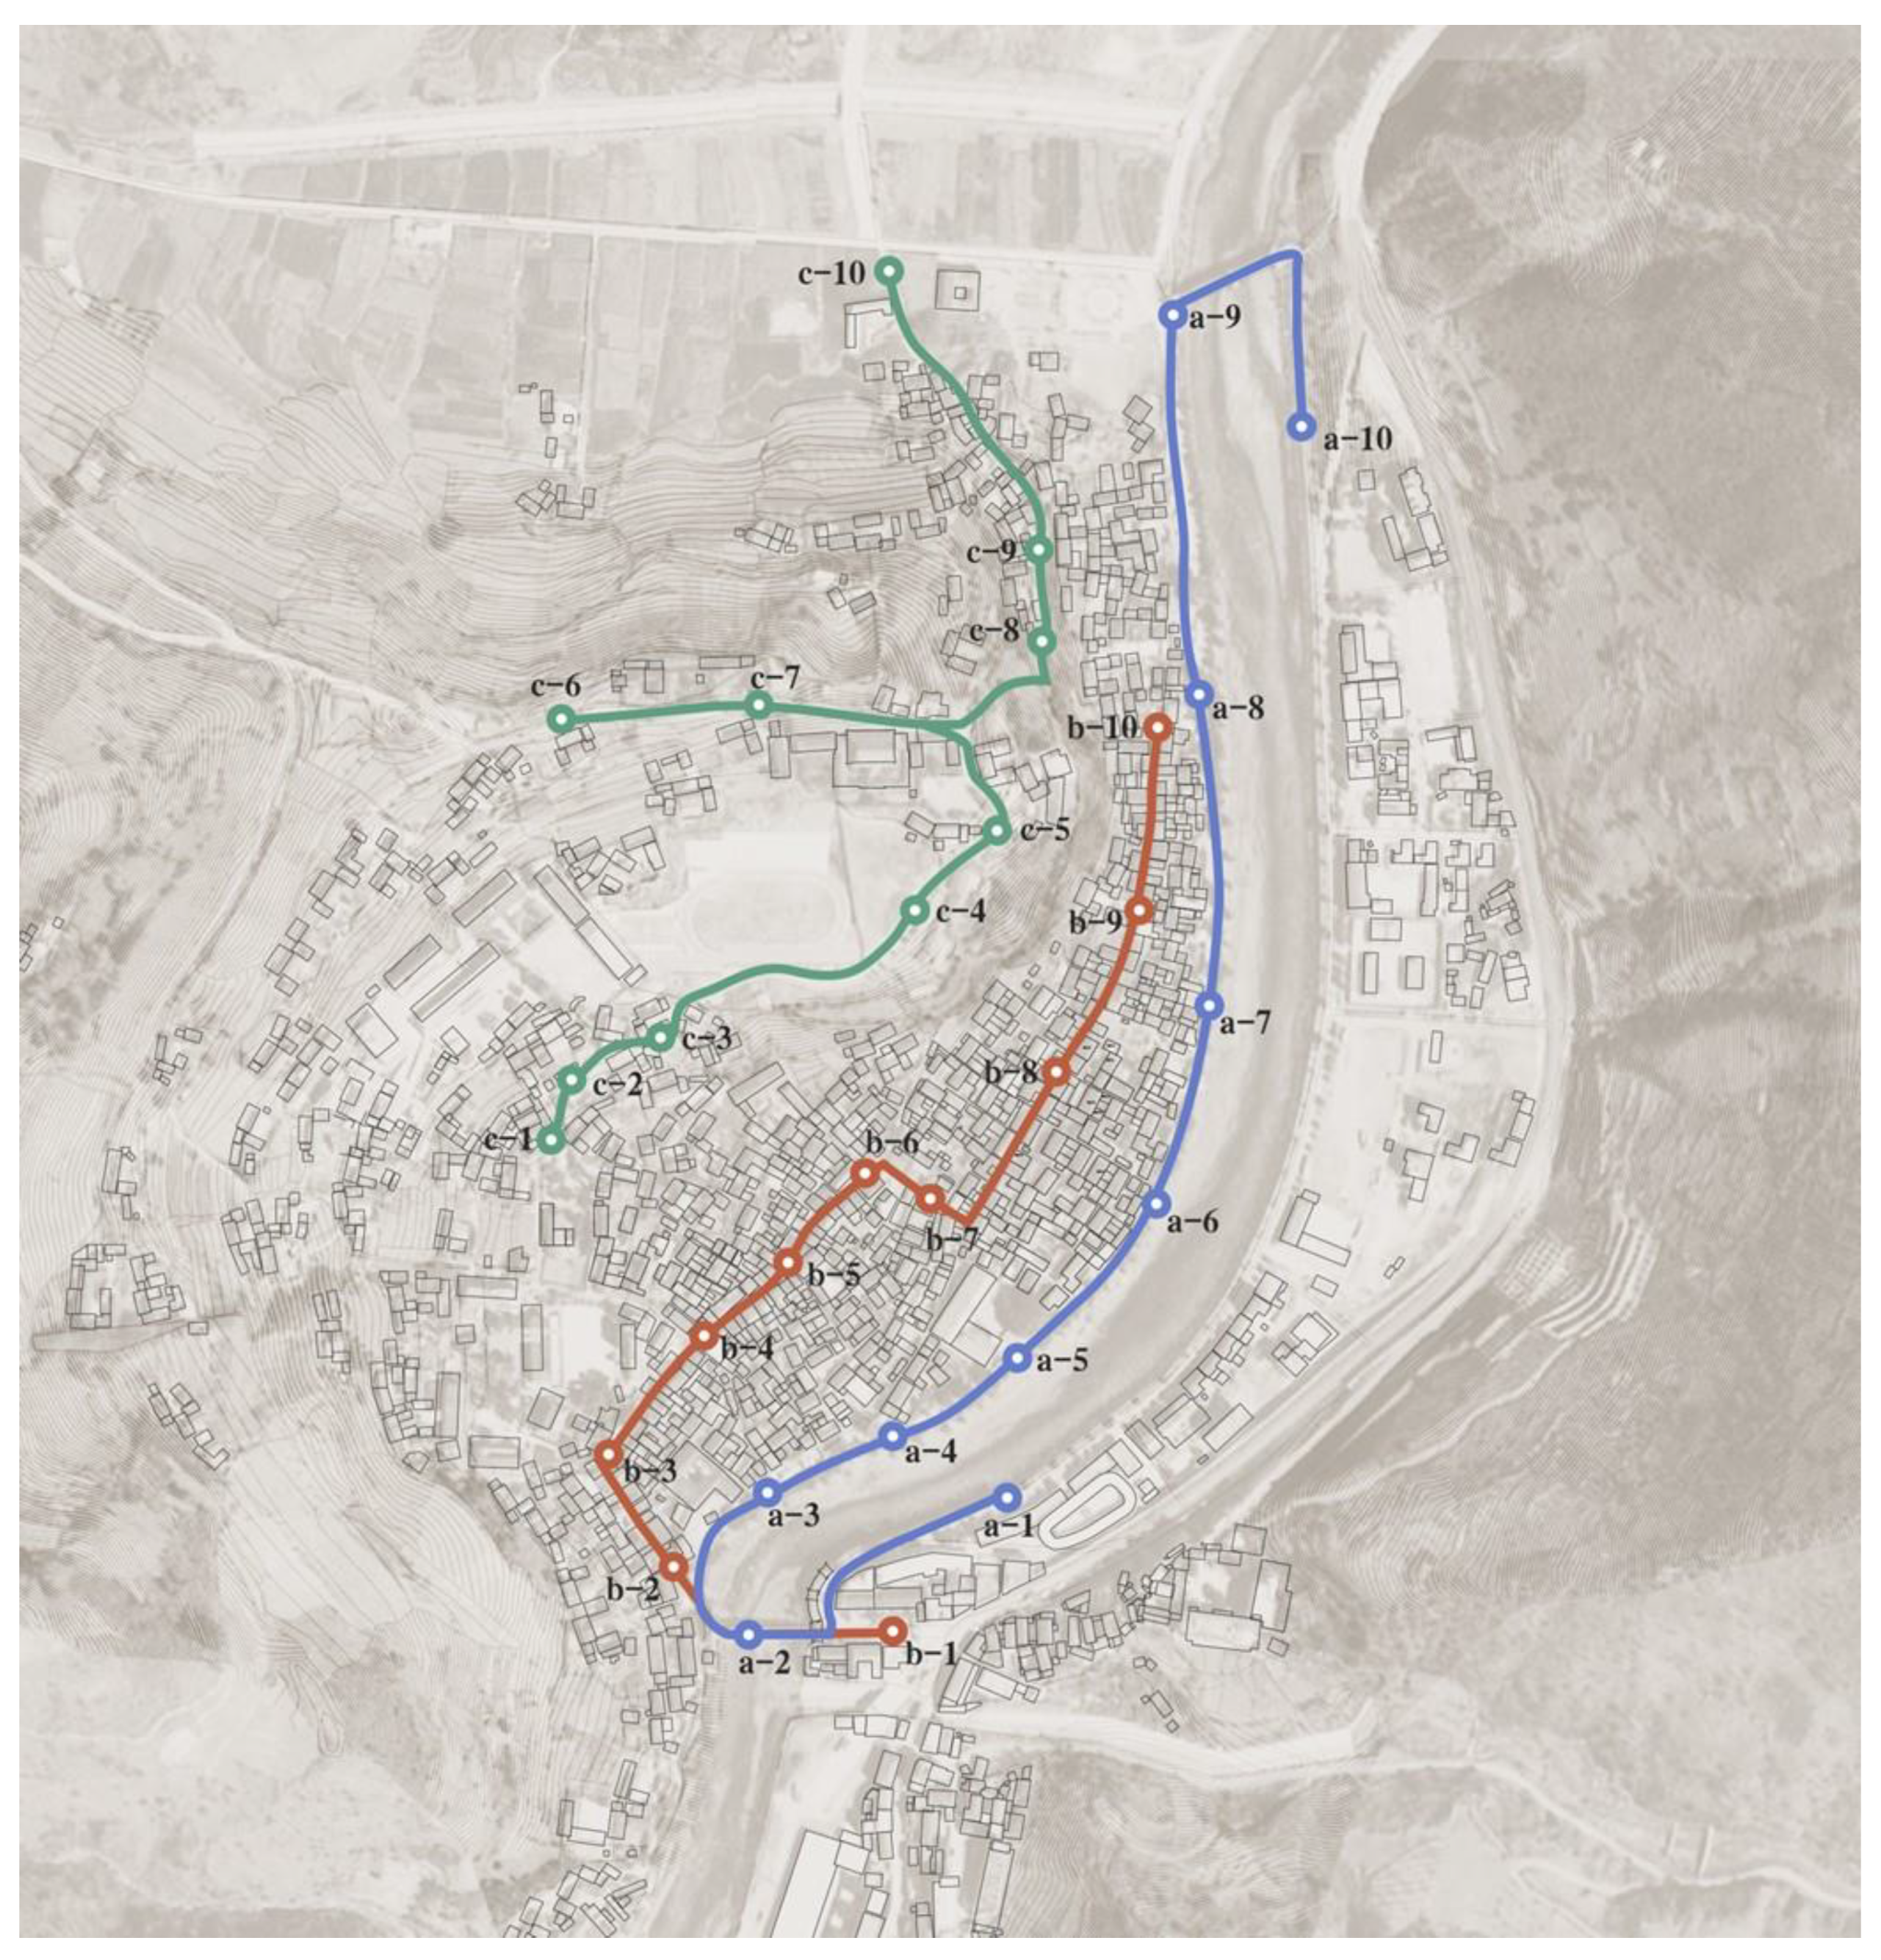
The village’s topography features mountains and waterfront views, with roads distributed along the contour line in belt shapes. Buildings predominantly face east to west, contributing to a three-dimensional stratified structure of “mountain-village-water,” seamlessly integrated with the local environment. To facilitate our analysis, we selected three main paths, each representing distinct spatial attributes: A (water), B (village), and C (mountain). Ten representative locations were pin-pointed within these paths, capturing street scenes ahead. In total, it had 30 photographs for use in subsequent experiments.
Figure 2.
Three tour routes in Baofeng Village.
Figure 2.
Three tour routes in Baofeng Village.
3. Methodology
The methodology of this study was divided into two main sections. The first featured an eye-tracking experiment, in which subjects observed a series of successive photographs of three selected paths in-stead of a field experiment. Physiological data generated during this process were recorded by the device, enabling the creation of heatmaps. By dividing the photos into AOI (Areas of Interest), the device could automatically analyze a table of AOI data. After the experiment, sub-jects would fill in a questionnaire, mainly using the SD (semantic differential) analysis to allow them to evaluate their visual experience of these paths. We draw some basic conclusions by analyzing the data of the two sections separately. Ultimately, the data of the two sections are compared to finish the correlation analysis, exploring the effectiveness of combining subjective and objective evaluation.
3.1. Subjects
For further convenience of data analysis, the subject group was divided into professional and non-professional groups. Age and gender were also taken into account to simulate the major group in the real environment. Forty subjects were selected for this study, with a male-to-female ratio of 1:1 and an age range of 18 to 40, all with normal physical (visual) conditions. Most were college students (including students of different majors at all stages of undergraduates and graduates) and a small portion of social individuals to increase diversity and meet the main characteristics of the tourists’ portrait.
3.2. Experiment Design
3.2.1. Apparatus
The equipment used in this experiment was an eye movement system containing a QY - I desktop eye-tracker and an EyeLab V2.0 data analysis software. QY-I is a precise eye-tracker with image frequency (F/S) >= 100FPS and a working distance of 60cm. It can accurately record in real-time and analyze fixation characteristics, counting data from specified areas of interest. The experiment was conducted with a desktop computer; subjective evaluation data were collected using questionnaires that were filled out after they completed the eye movement experiment.
3.2.2. Material
The research team stayed at Baofeng Village for two weeks before this study, completed the remote pre-test, and took photos of the street scenes. The remote pre-test was conducted with the help of an online webcam eye-tracking system called “Webgazer,” using a web camera as an eye-tracker to test a few subjects and generate heatmaps while they faced the computer screen to view these images [30]. Raw Image mate-rials were 30 street photos of recreational paths, which could fully summarize basic visual conditions along these paths and were evenly distributed in space.
3.2.3. Process
The eye-tracking experiment was processed in the UHC (Urban Heritage Conservation) studio at Tongji University in Shanghai. The experimental space was ventilated, and curtains were used to cover the windows to prevent natural light from affecting the viewing screen. We led 40 subjects (3-5 per time) to this space, explained the experimental steps and precautions, conducted pre-tests for eye positioning, and then started the formal experiment. Subsequently, subjects were instructed to fill out a questionnaire. This experiment was paid for 30 RMB per person.
3.3. Data Collection
3.3.1. Eye-Tracking Data Collection
The collection of eye-tracking data involves two parts. One is the heatmap, as shown in Figure 2. Heatmaps offer a direct and effective means of representing the areas and intensity of visual attention, whether derived from individual datasets or as overlays. Generally, red indicates focus areas of visual attention, yellow indicates areas with less visual attention, and green or blue indicates areas with the least attention [28]. Through heatmaps, one can quickly analyze elements of interest in these pictures. To explore specific aspects of interest in path view pictures, the other part of eye-tracking data is the division of AOI (Area of Interest). AOI analysis divides each person’s picture into several areas and extracts corresponding data for quantitative data analysis [29].
We pre-categorized elements of interest using specific tools of EyeLab software. After careful discussion, all elements were categorized into three major categories and 15 minor categories, as shown in
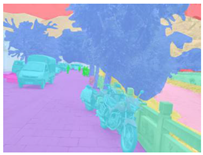
Table 1. The first major category is natural elements, including trees, shrubs, water, sky, fields, mountains, and natural embankments. The second major category is constructional elements, including buildings, structures, landmarks, paving, and barriers (railings and steps). The third one is configurational elements, including signs, utility poles, people, etc. In instances where similar elements appeared in diverse areas of a single image (e.g., Tree 1, Tree 2, etc.), these were combined into a singular element (e.g., Tree).
Eye movement data used in this study are mainly three parameters: fixation duration (FD), fixation count (FC), and time to first fixation (TTFF), each serving different roles. “FD” is the sum of the time of one element gazed per second: the larger the value, the greater interest people show in this element. “FC” is to count how many gaze points there are in AOI, which is a supplementary parameter of the “FD.” “TFD” is the first time spent observing one element from the beginning of the visual stimulus, indicating which elements will be prioritized for attention [
30].
3.3.2. Semantic Differential Data Collection
Suitable adjectives were selected for “rural recreation path landscape.” The evaluation table has five levels, giving the values of -2, -1, 0, 1, and 2, for convenience of quantitative analysis [
31]. A total of 13 factors of four categories were preset considering the specific circumstances of this experiment. These factors generally focused on human perception, reflecting people’s feelings during the visit, and attributes of the path landscape from multiple aspects, as shown in
Table 2. In the questionnaire design, the participants were asked to carefully compare and observe three paths of water, village, and mountain (numbered “A,” “B,” and “C”) with their corresponding pictures before filling in answers.
3.3.3. Correlation between eye movement analysis & semantic differential evaluation
Intercomparison began after data were collected. Pearson correlation coefficient was used as an objective reference to verify whether the two could be used to describe visitors’ visual preferences [32]. The method needs to analyze variables’ applicability conditions before ap-plying it, and the CORREL function calculates parameters to obtain a table of correlation between the variables, denoted by r. The closer |r| is to 1, the stronger the correlation is. When r > 0, two variables are positively correlated; when r < 0, it is negatively correlated. Wen |r| < 0.3 is a low level of correlation, 0.3 < |r| < 0.8 means medium level, while |r| > 0.8 is a high level. In addition, a prerequisite for testing the correlation of “r” is “p”; the p-value tells whether the results are statistically significant. Generally, p < 0.05 is considered statistically significant.
4. Results
4.1. Eye movement analysis
4.1.1. Heatmap analysis
For the objectivity of the study, heat maps of forty subjects with different backgrounds (different age groups, majors, and identities) were overlayed for the heatmap analysis (
Figure 3).
Figure 3.
Path “A”/ “B”/ “C” heatmap overlayed analysis.
Figure 3.
Path “A”/ “B”/ “C” heatmap overlayed analysis.
The overlayed heatmap of the path “A” (water) is shown in the first row of
Figure 3. When they walk along the path, people’s lines of sight will be influenced by shrubs and trees along the riverside. Their lines of sight will attempt to cross the railings when this shading is not dense. When shading is dense, their eyes will fall on their side. But people are more likely to be attracted if there are buildings or other attractive objects across the opposite riverbank.
The overlayed heatmap of path “B” (village) is shown in the second row of
Figure 3. It shows that in narrow lane environments, people are easily attracted by details of buildings (such as windows, doors, roofs, etc.), plants (mainly potted plants), and other objects (couplets, lanterns, signs, etc.). Moreover, when some details do not match the overall style (e.g., glass walls), it will be more likely to get people’s attention than others.
The overlayed heatmap of path “C” (mountain) is shown in the third row of
Figure 3. If there are elevation changes in these pictures, people’s sight will focus more on the boundaries of these changes. And people’s eyes will focus on the landscape that unfolds vertically in front of the path, such as houses built on the mountain. When encountering forked roads, people’s sight becomes more distracted, and the level of visual attention decreases. From the dynamic perspective, it indicates that when people walk on these paths, they prefer paths with clear di-rection and guidance, and adding more elevation changes are needed.
These findings highlight that individuals prioritize near views over far ones. However, open environments did attract adequate attention to far views, with relatively minimal focus on paving compared to buildings and natural elements.
4.2. AOI Analysis
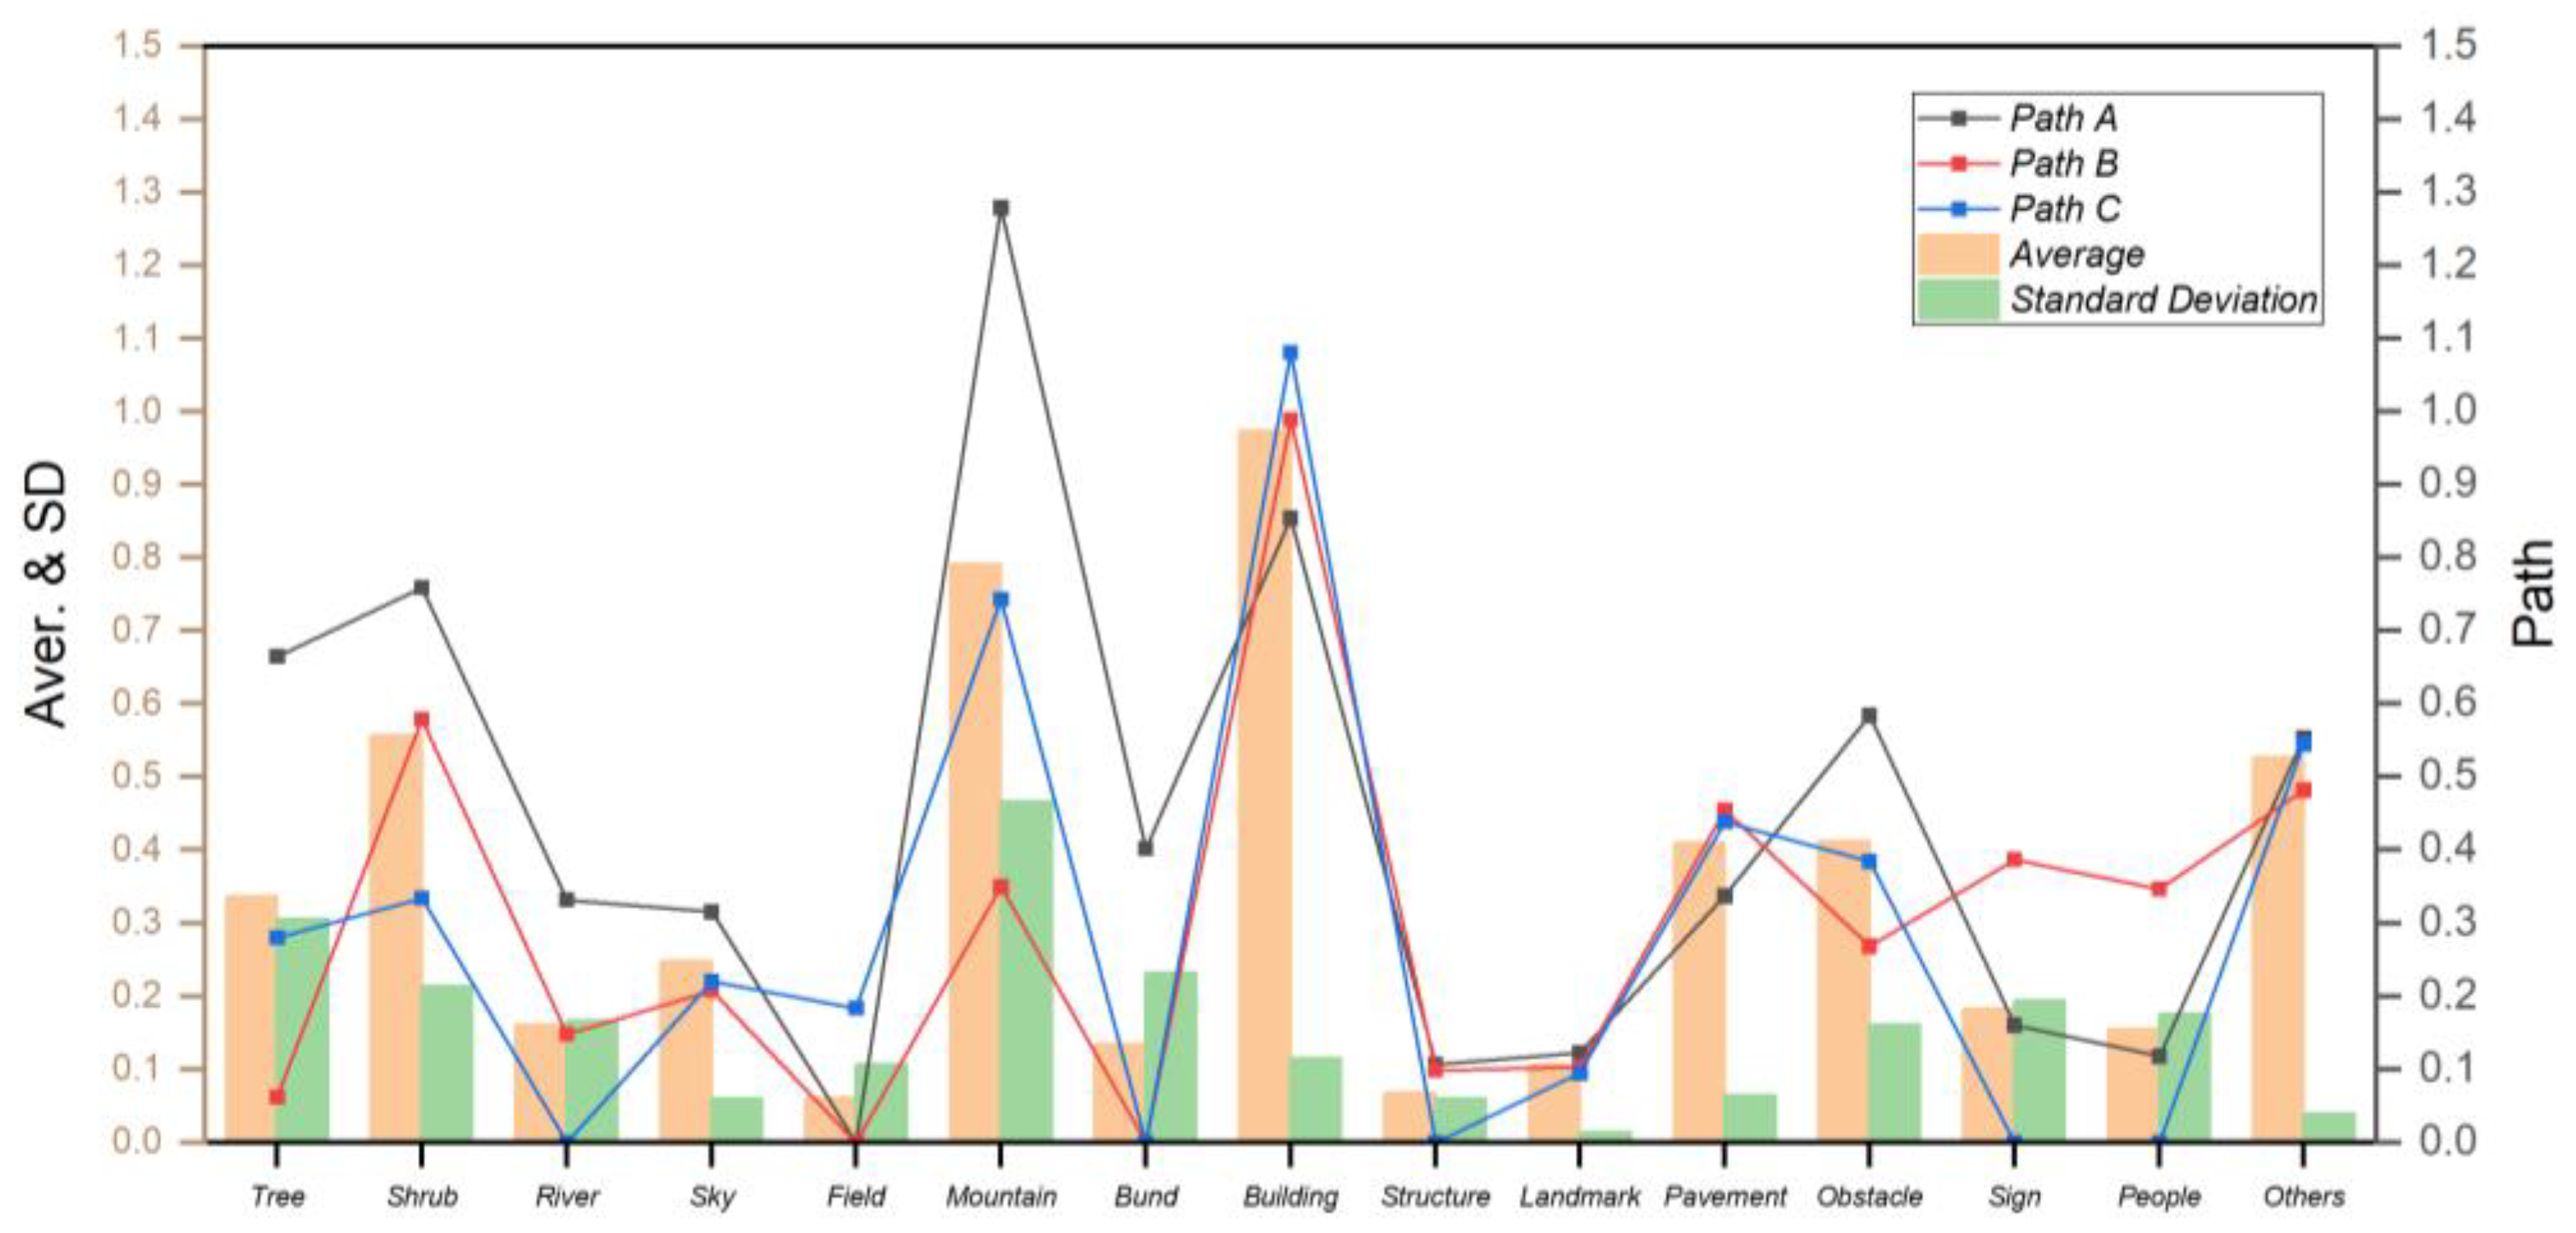
Data on three parameters of AOI were collected on paths “A,” “B,” and “C,” including average and standard deviation values, which revealed some helpful information about these data (
Table 3).
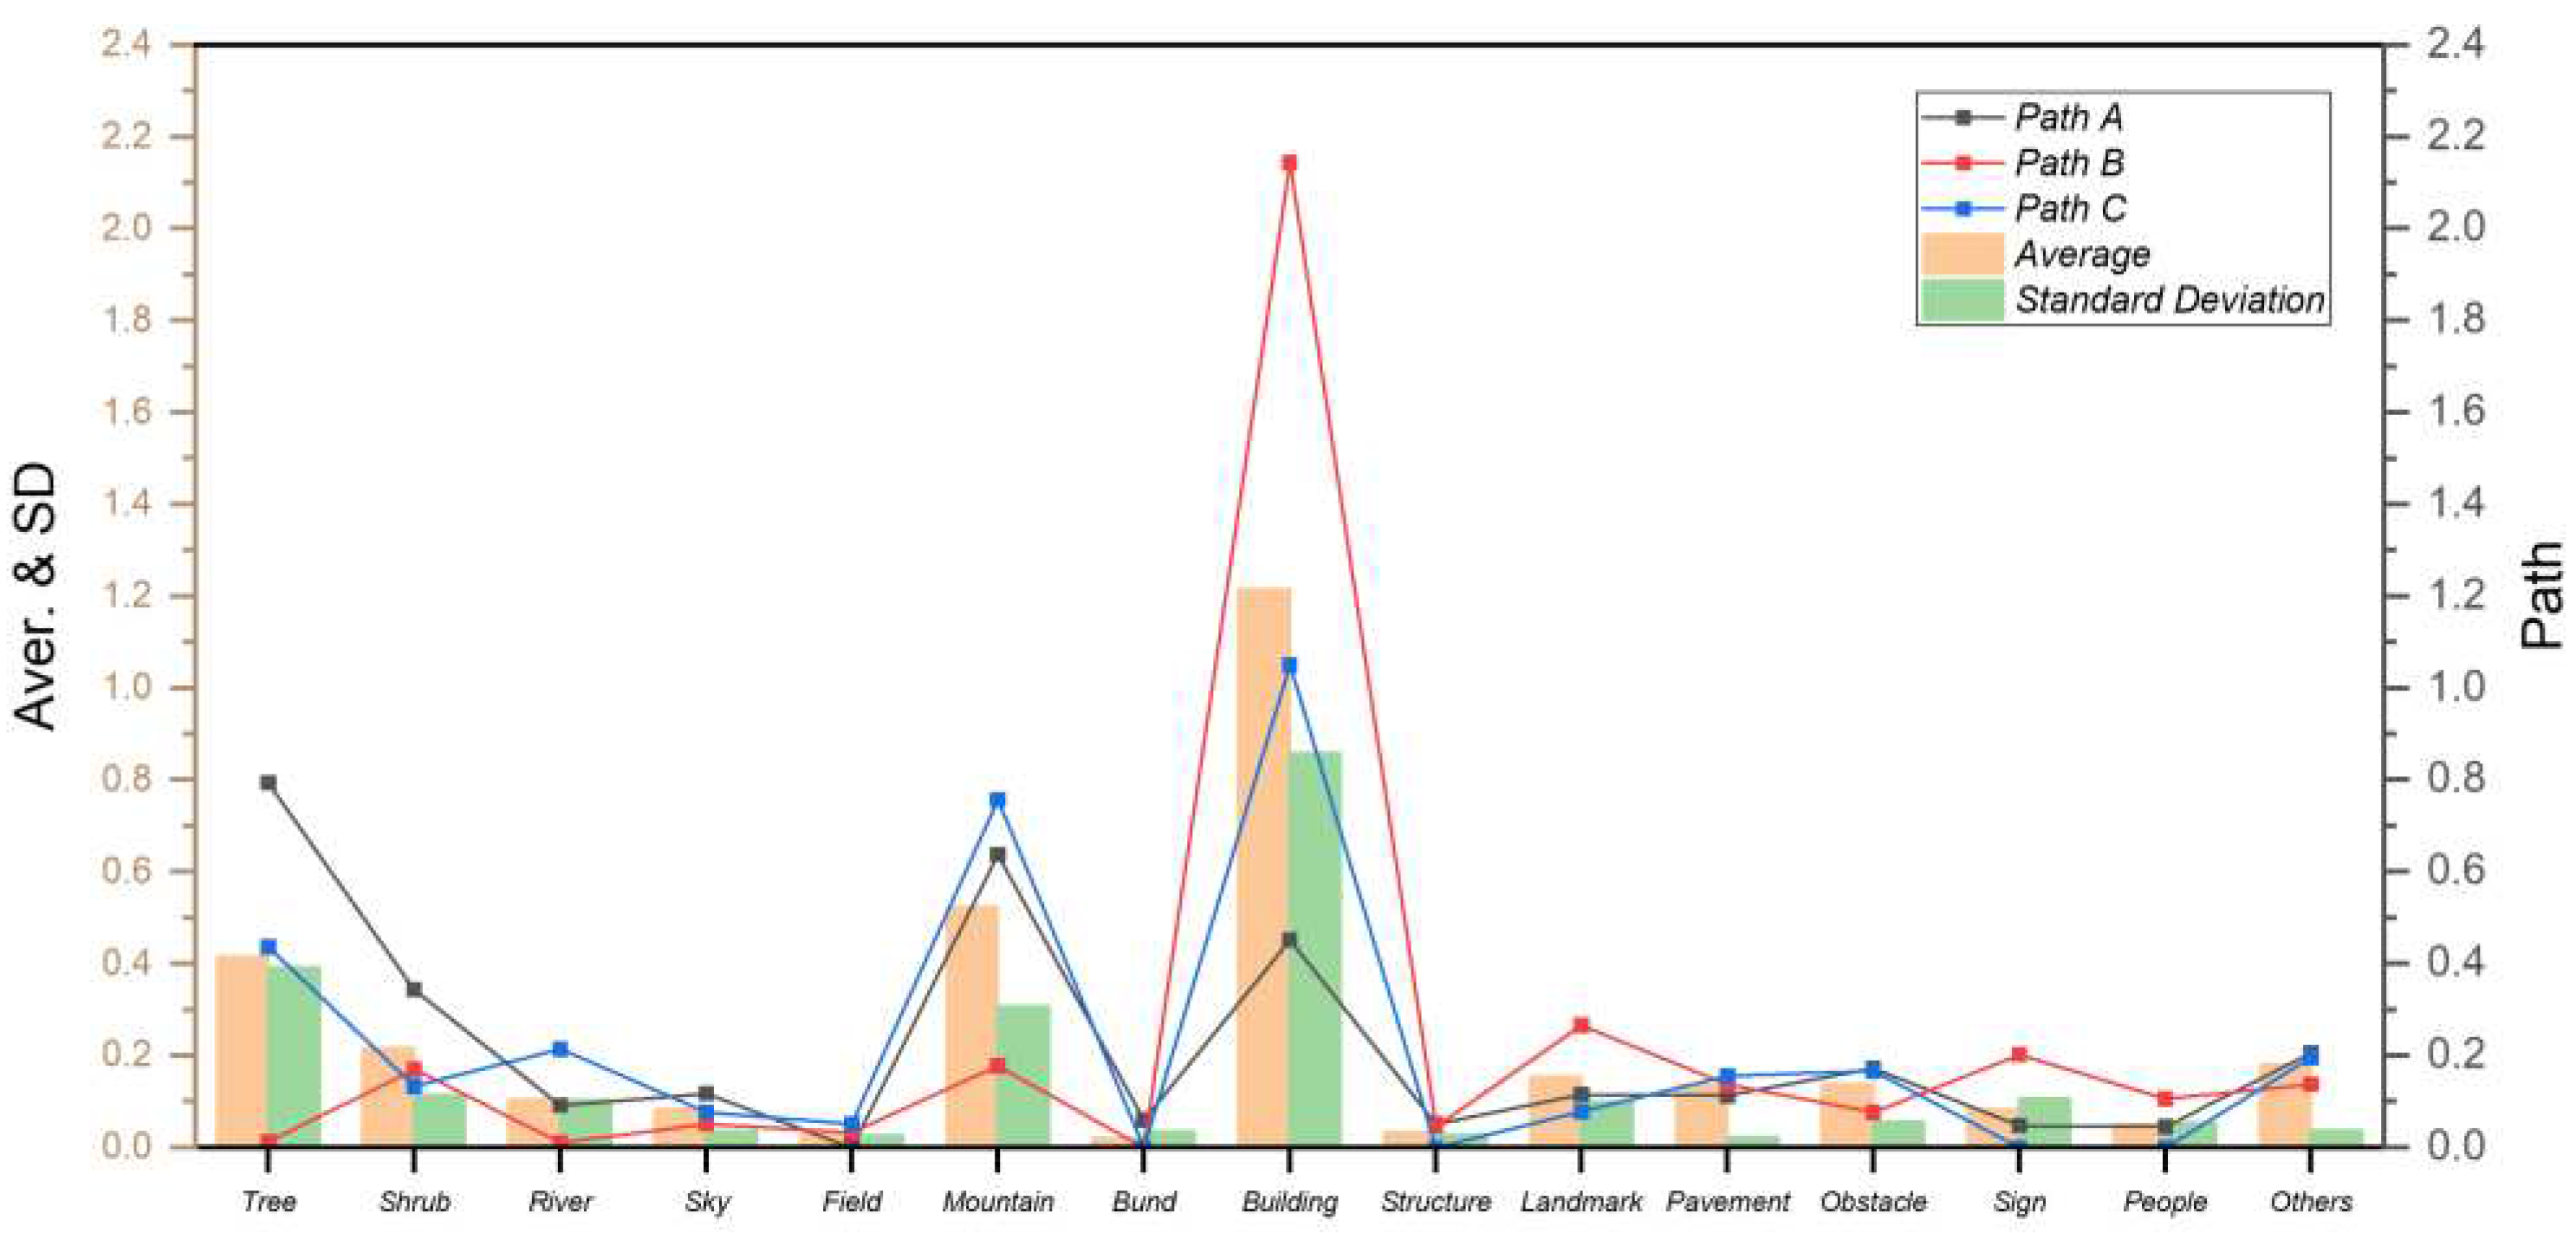
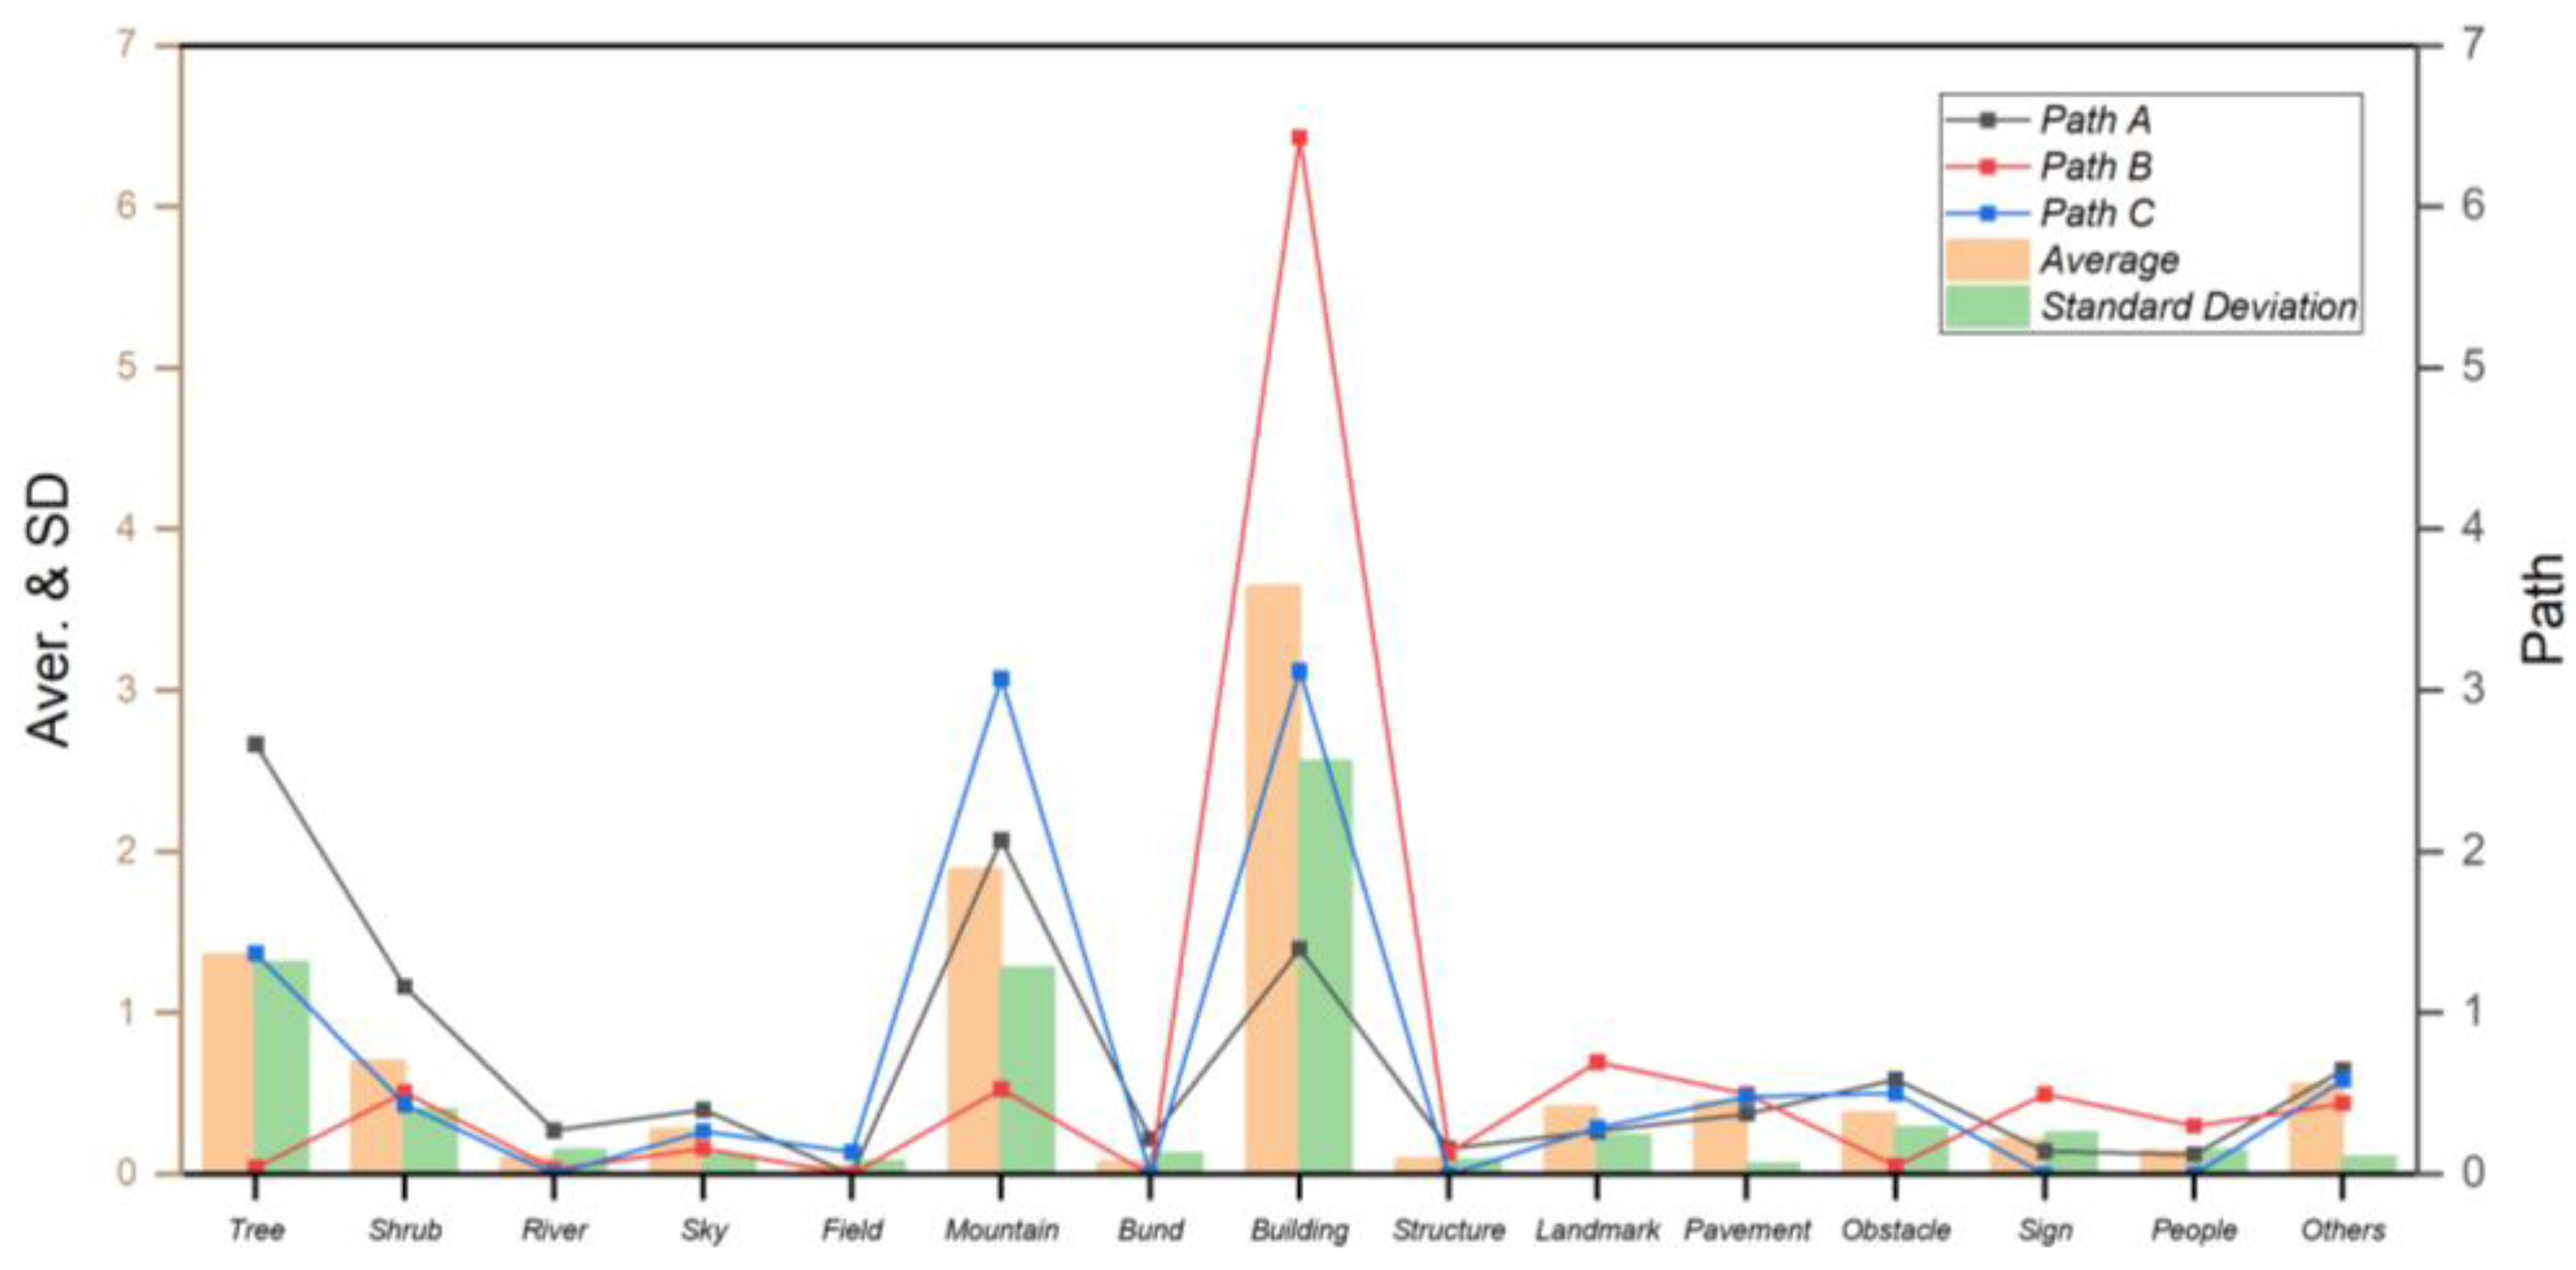
Concerning “fixation duration” (FD), “2-buildings” takes the lead, prominently reflected in the average values of the path “B,” path “C,” and “overall. However, an exception arises in path “A,” where “1-trees” and “1-mountains” command greater attention. This implies that the visual attractiveness of natural elements on the waterfront is stronger than on the non-waterfront in Baofeng. Further analysis reveals that all three paths receive minimal attention to configurational elements, as evident in fixation count data (refer to
Figure 4).
The data of “Time to First Fixation” (TTFF) reveal some facts on the other hand (
Figure 6). It can be observed in the bar charts that “2-Obstacles” and “3-Others” are highly visible, which is not observed in the charts of “FD” and “FC.” This means that they are prioritized at first glance. For “2-Obstacles”, they mainly include elements of railings and steps. In terms of ‘3-Others’, it is possible that their bright colors attract prior attention, but people quickly realize that they are unnecessary, so their bars have lower height in bars charts of “FD” and “FC.” It can also be observed in this picture that the gap between columns is less than in the other two charts, which means that all elements are more even in visual prominence, but natural and building elements attract detailed observations as time becomes longer.
Figure 4.
Data Analysis of Fixation Duration.
Figure 4.
Data Analysis of Fixation Duration.
Figure 5.
Data Analysis of Fixation Count.
Figure 5.
Data Analysis of Fixation Count.
Figure 6.
Data Analysis of Time to First Fixation.
Figure 6.
Data Analysis of Time to First Fixation.
4.3. Semantic Differential Evaluation Analysis
4.3.1. Factors
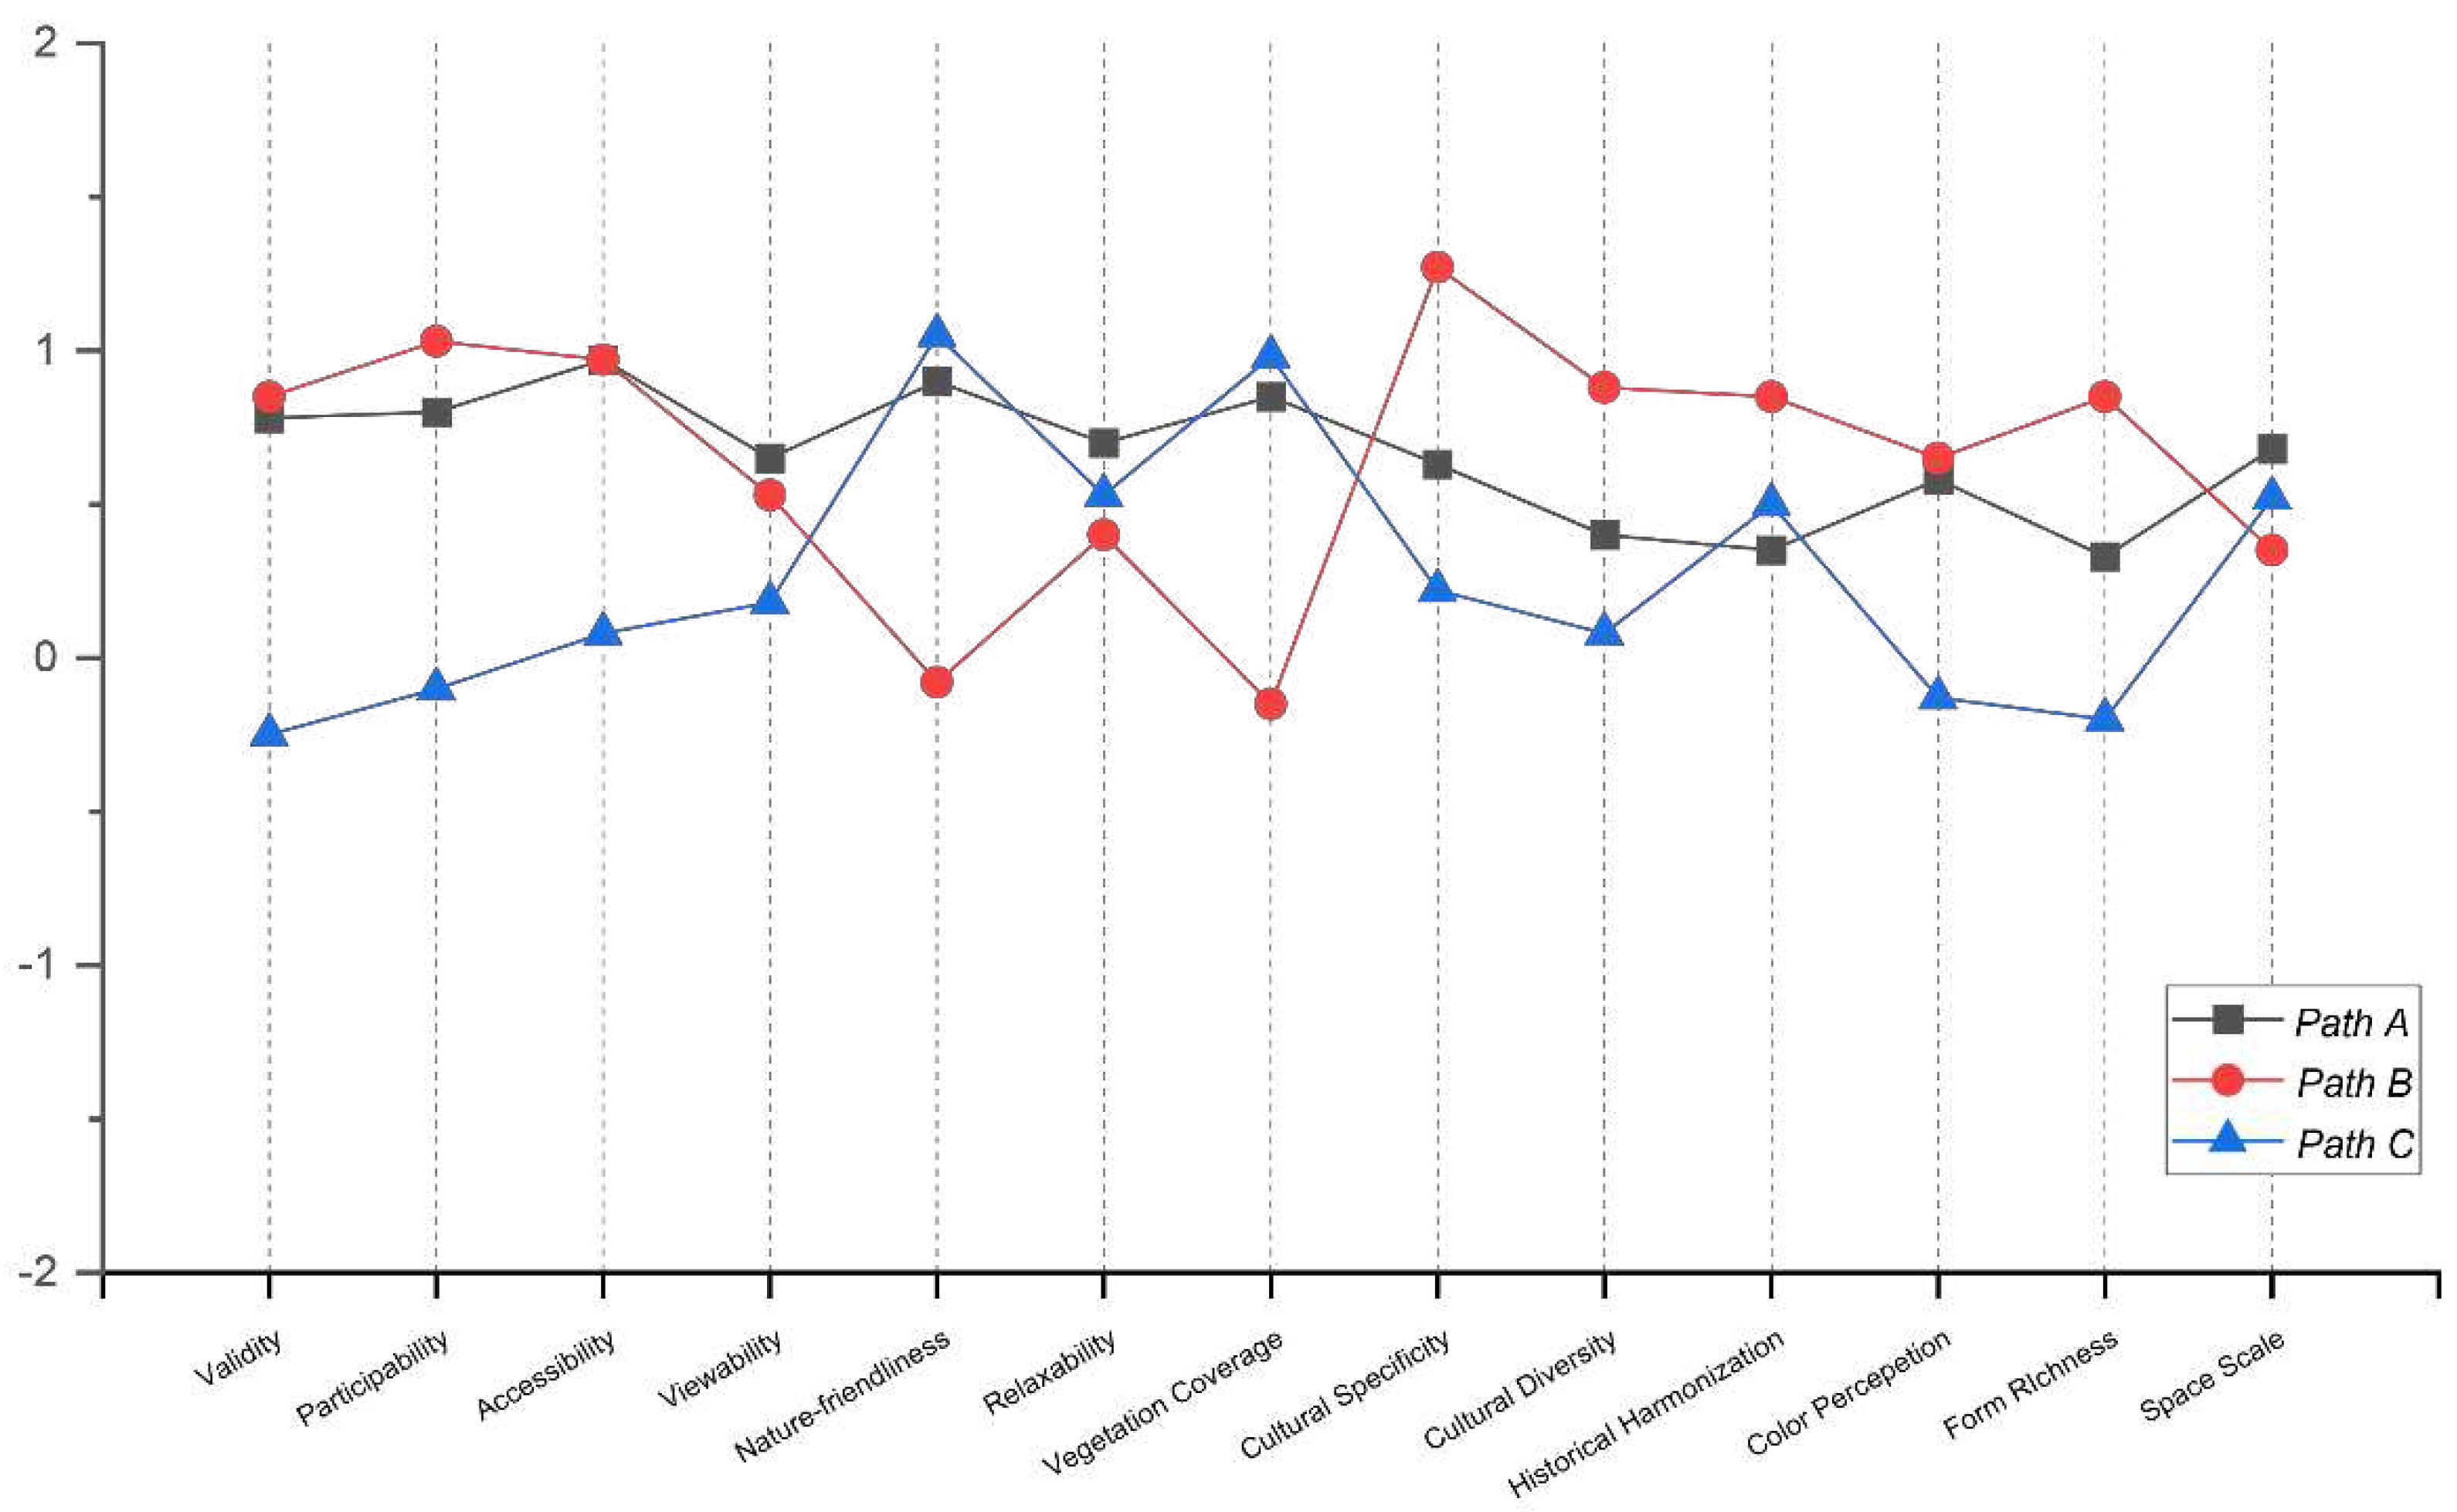
The evaluation line graph of each path is shown in
Figure 7. The overall scores of the 13 factors are within the range of 0.00-1.00, with few over 1.00 or below 0.00, indicating that the visual quality assessment of recreational path landscape is ordinary. Comparing the SD average line of different paths, the curve of path “A” is smooth, and the value is in the range of 0.50-1.00. In path “B,” the” nature friendliness” and the “vegetation coverage” have lower scores, with higher scores for the factors related to culture and form, indicating that this ancient village is well protected. “vitality,” “sense of color,” “form richness” in path “C” are lower than 0.00, with high scores in “naturalness” and “vegetation coverage.” This reflects the mountainous path’s limited appeal due to relatively aged buildings and proximity to nature, but it still holds significant potential because of its better natural environment.
To further analyze these factors, a KMO test is needed. The test value is 0.844 > 0.5, and Bartlett’s test value of P=0.000 < 0.001 meets the requirement of factor analysis. Two common factors were extracted using principal component analysis, explaining 67.414% of the variance in the original variables. The first common factor (F1) was the first seven factors, and the second one (F2) was the last six factors. This alignment indicated the correctness of the pre-grouping.
Figure 7.
SD data of path “A”, “B”, “C”.
Figure 7.
SD data of path “A”, “B”, “C”.
4.3.2. Population variance analysis of SD scores
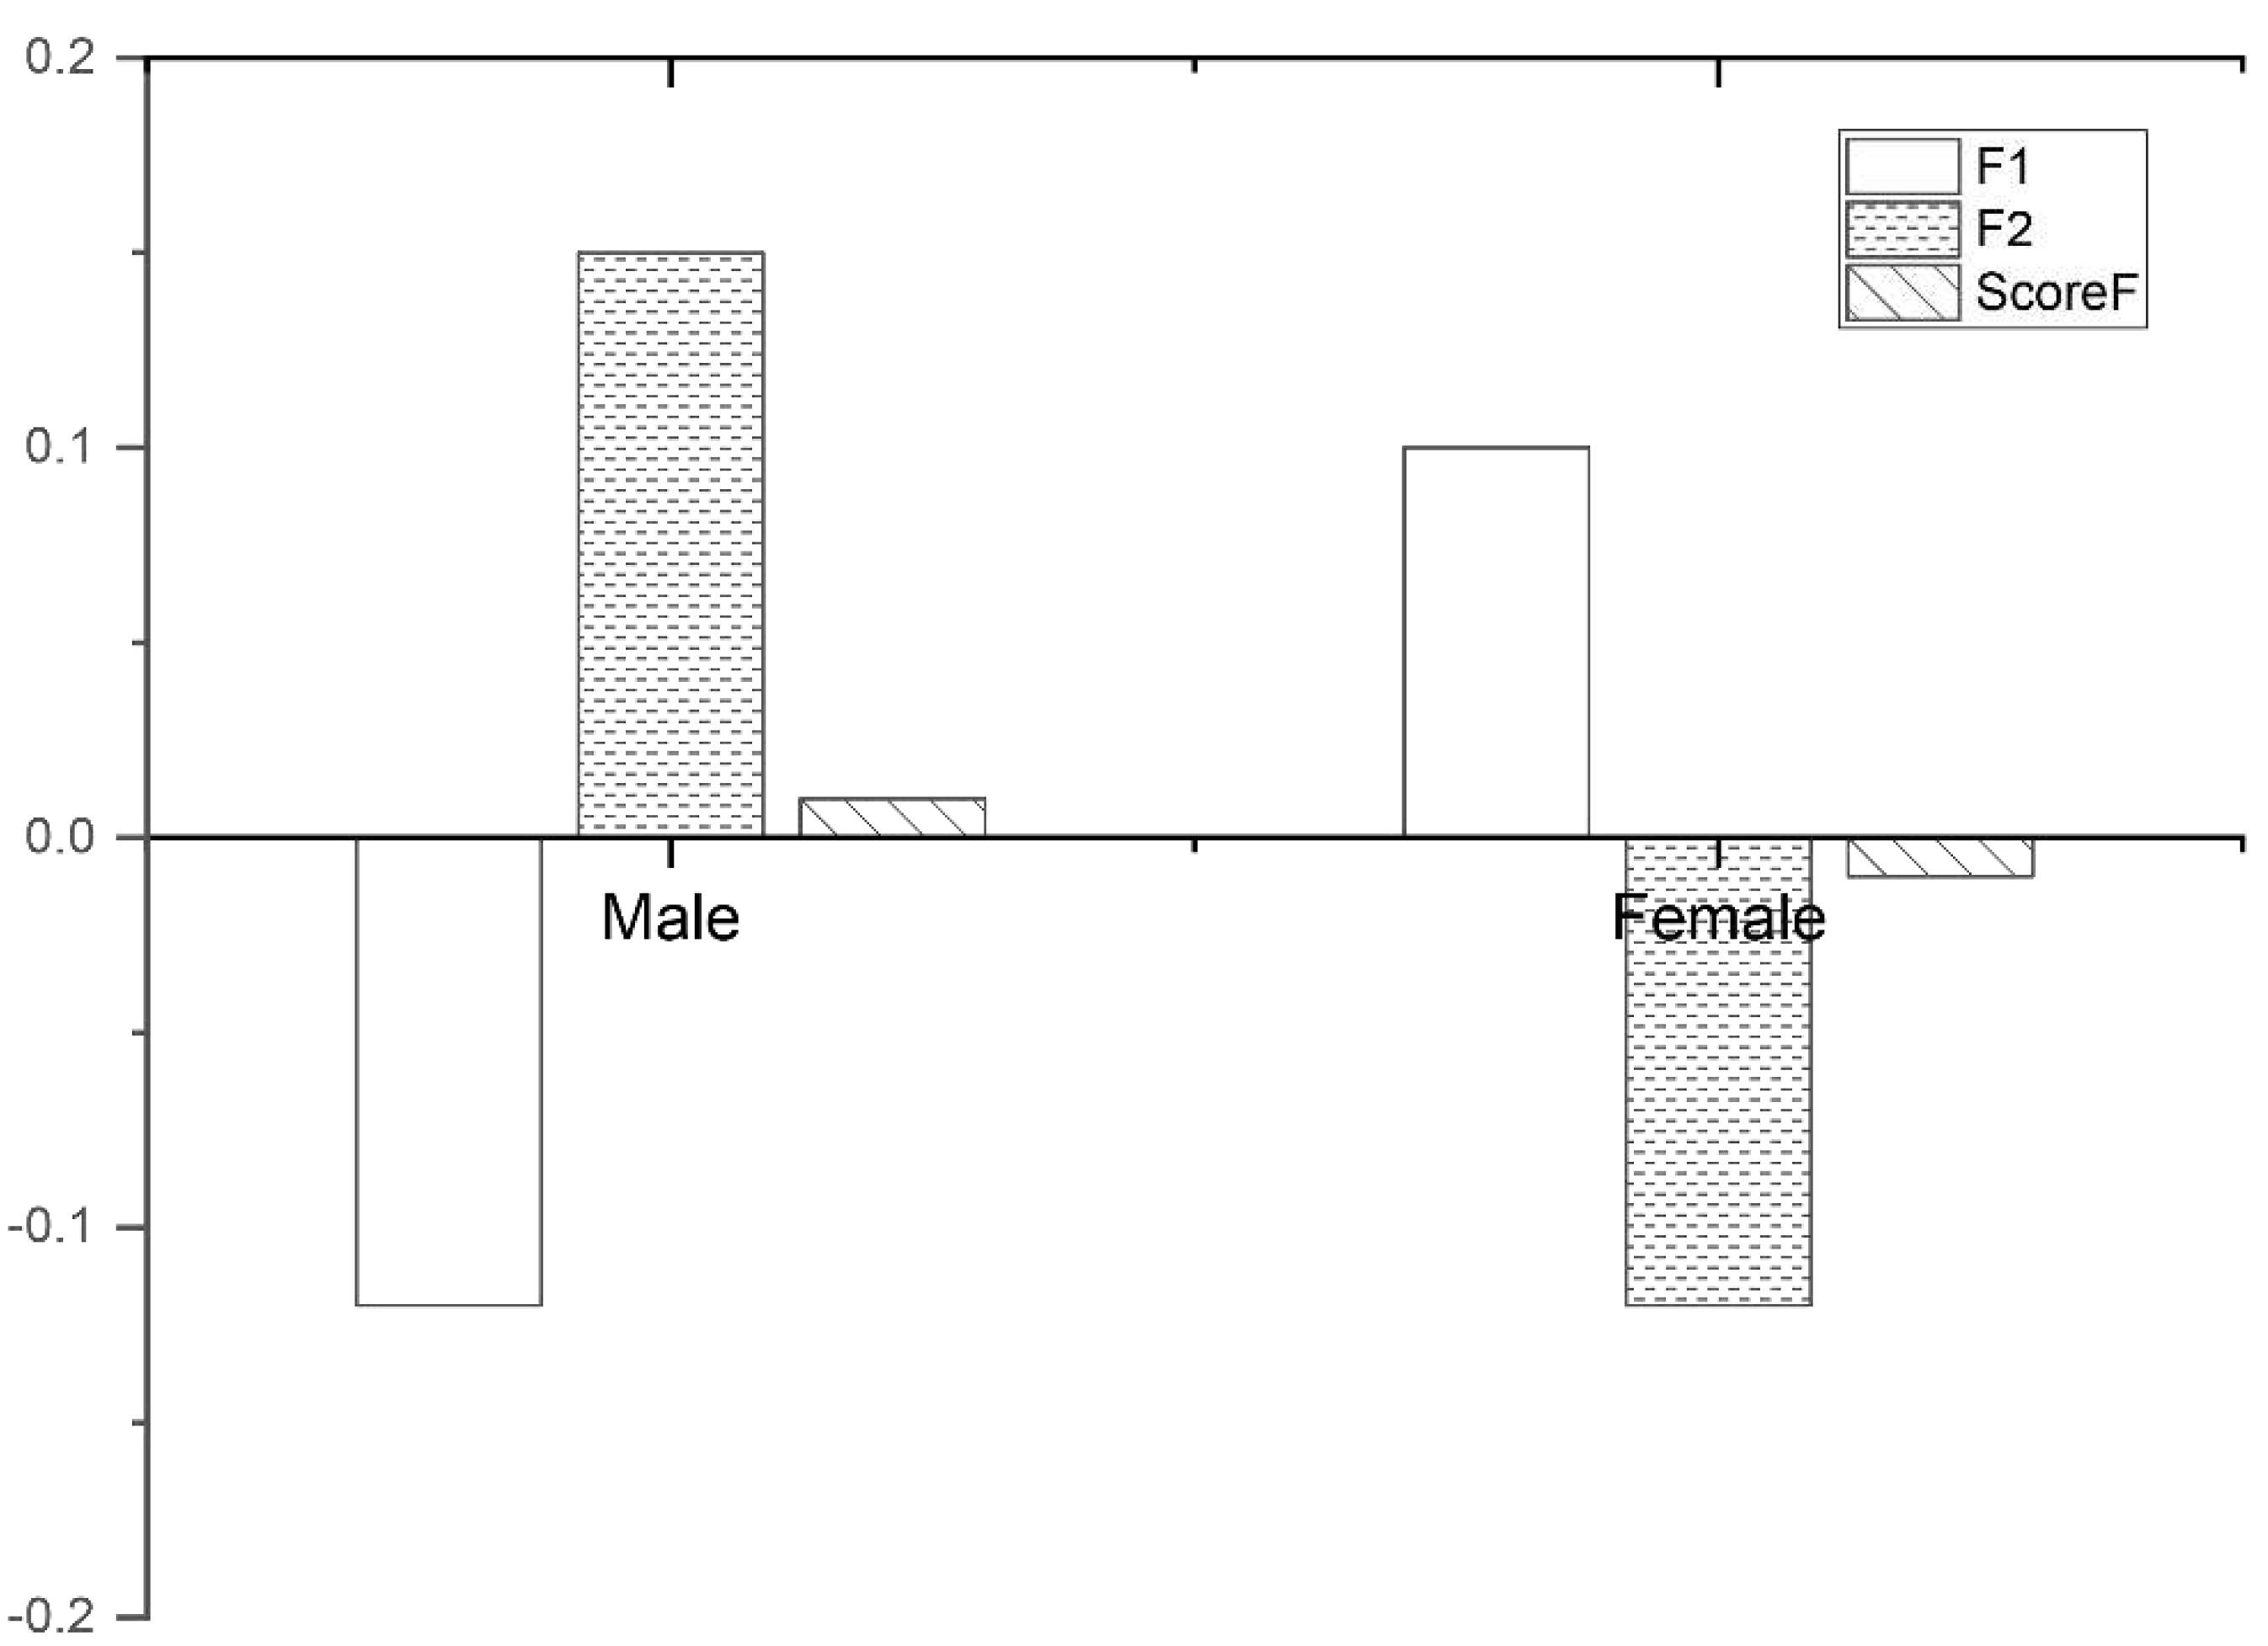
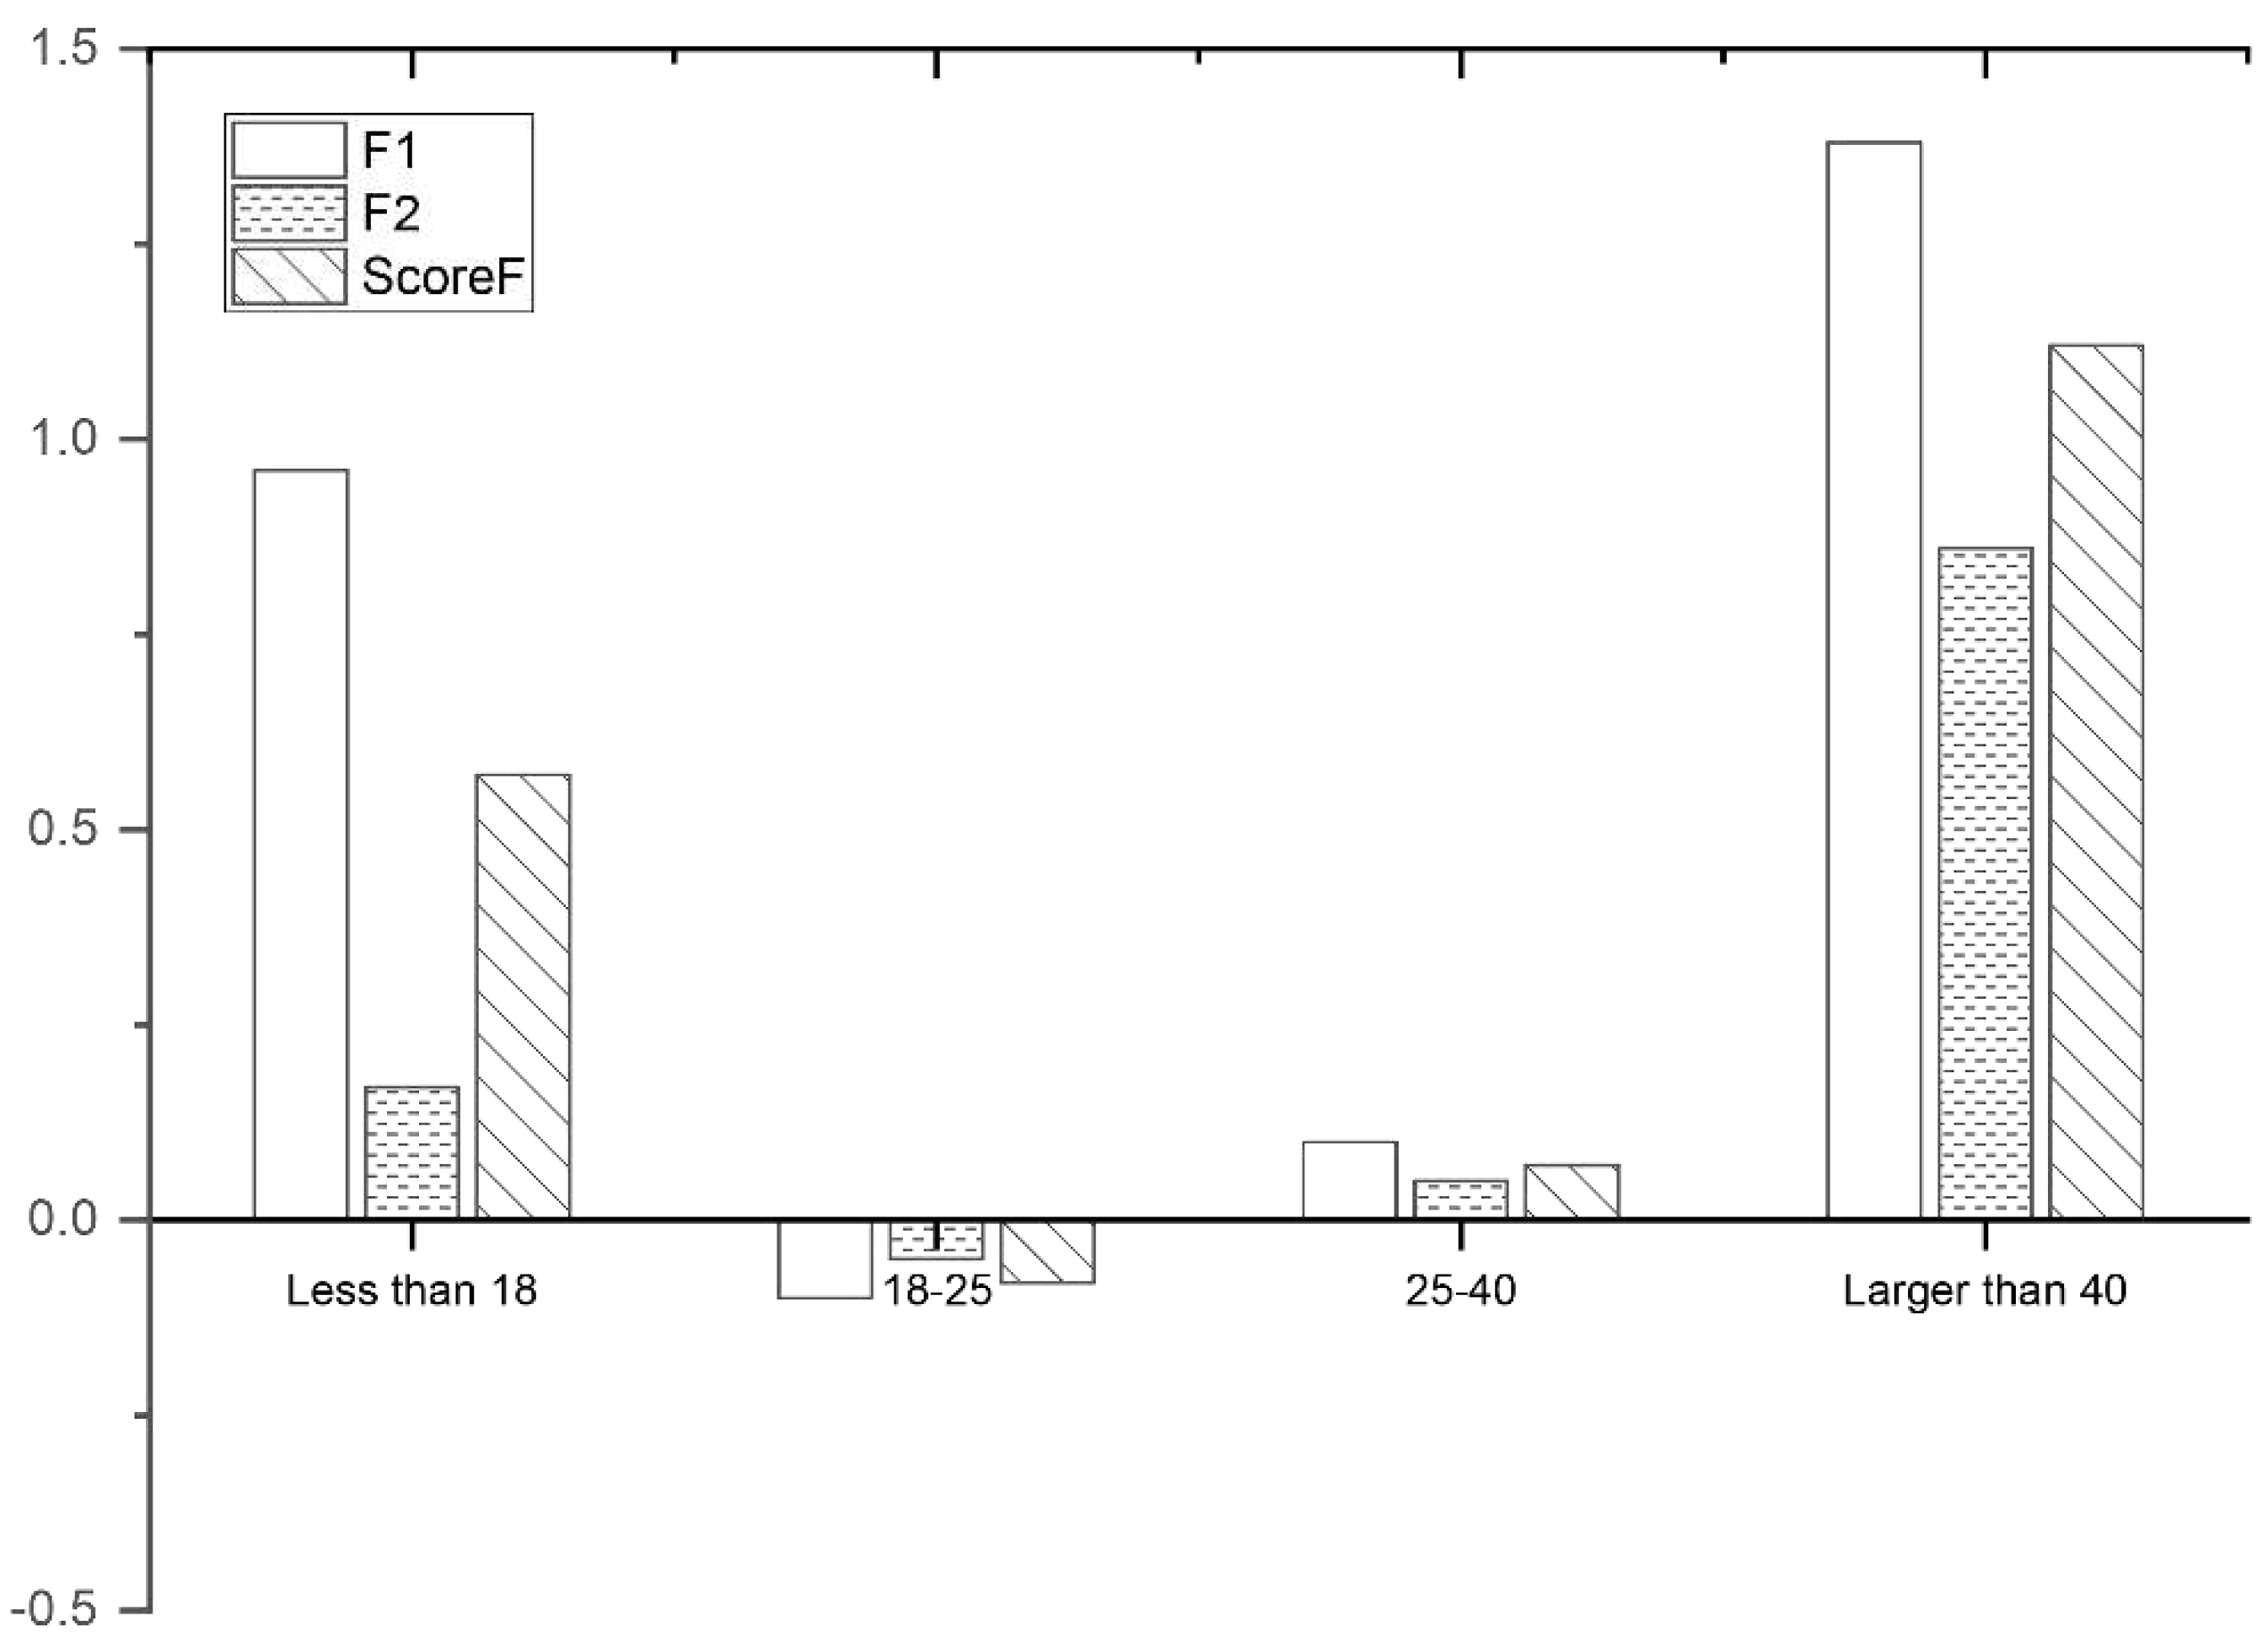
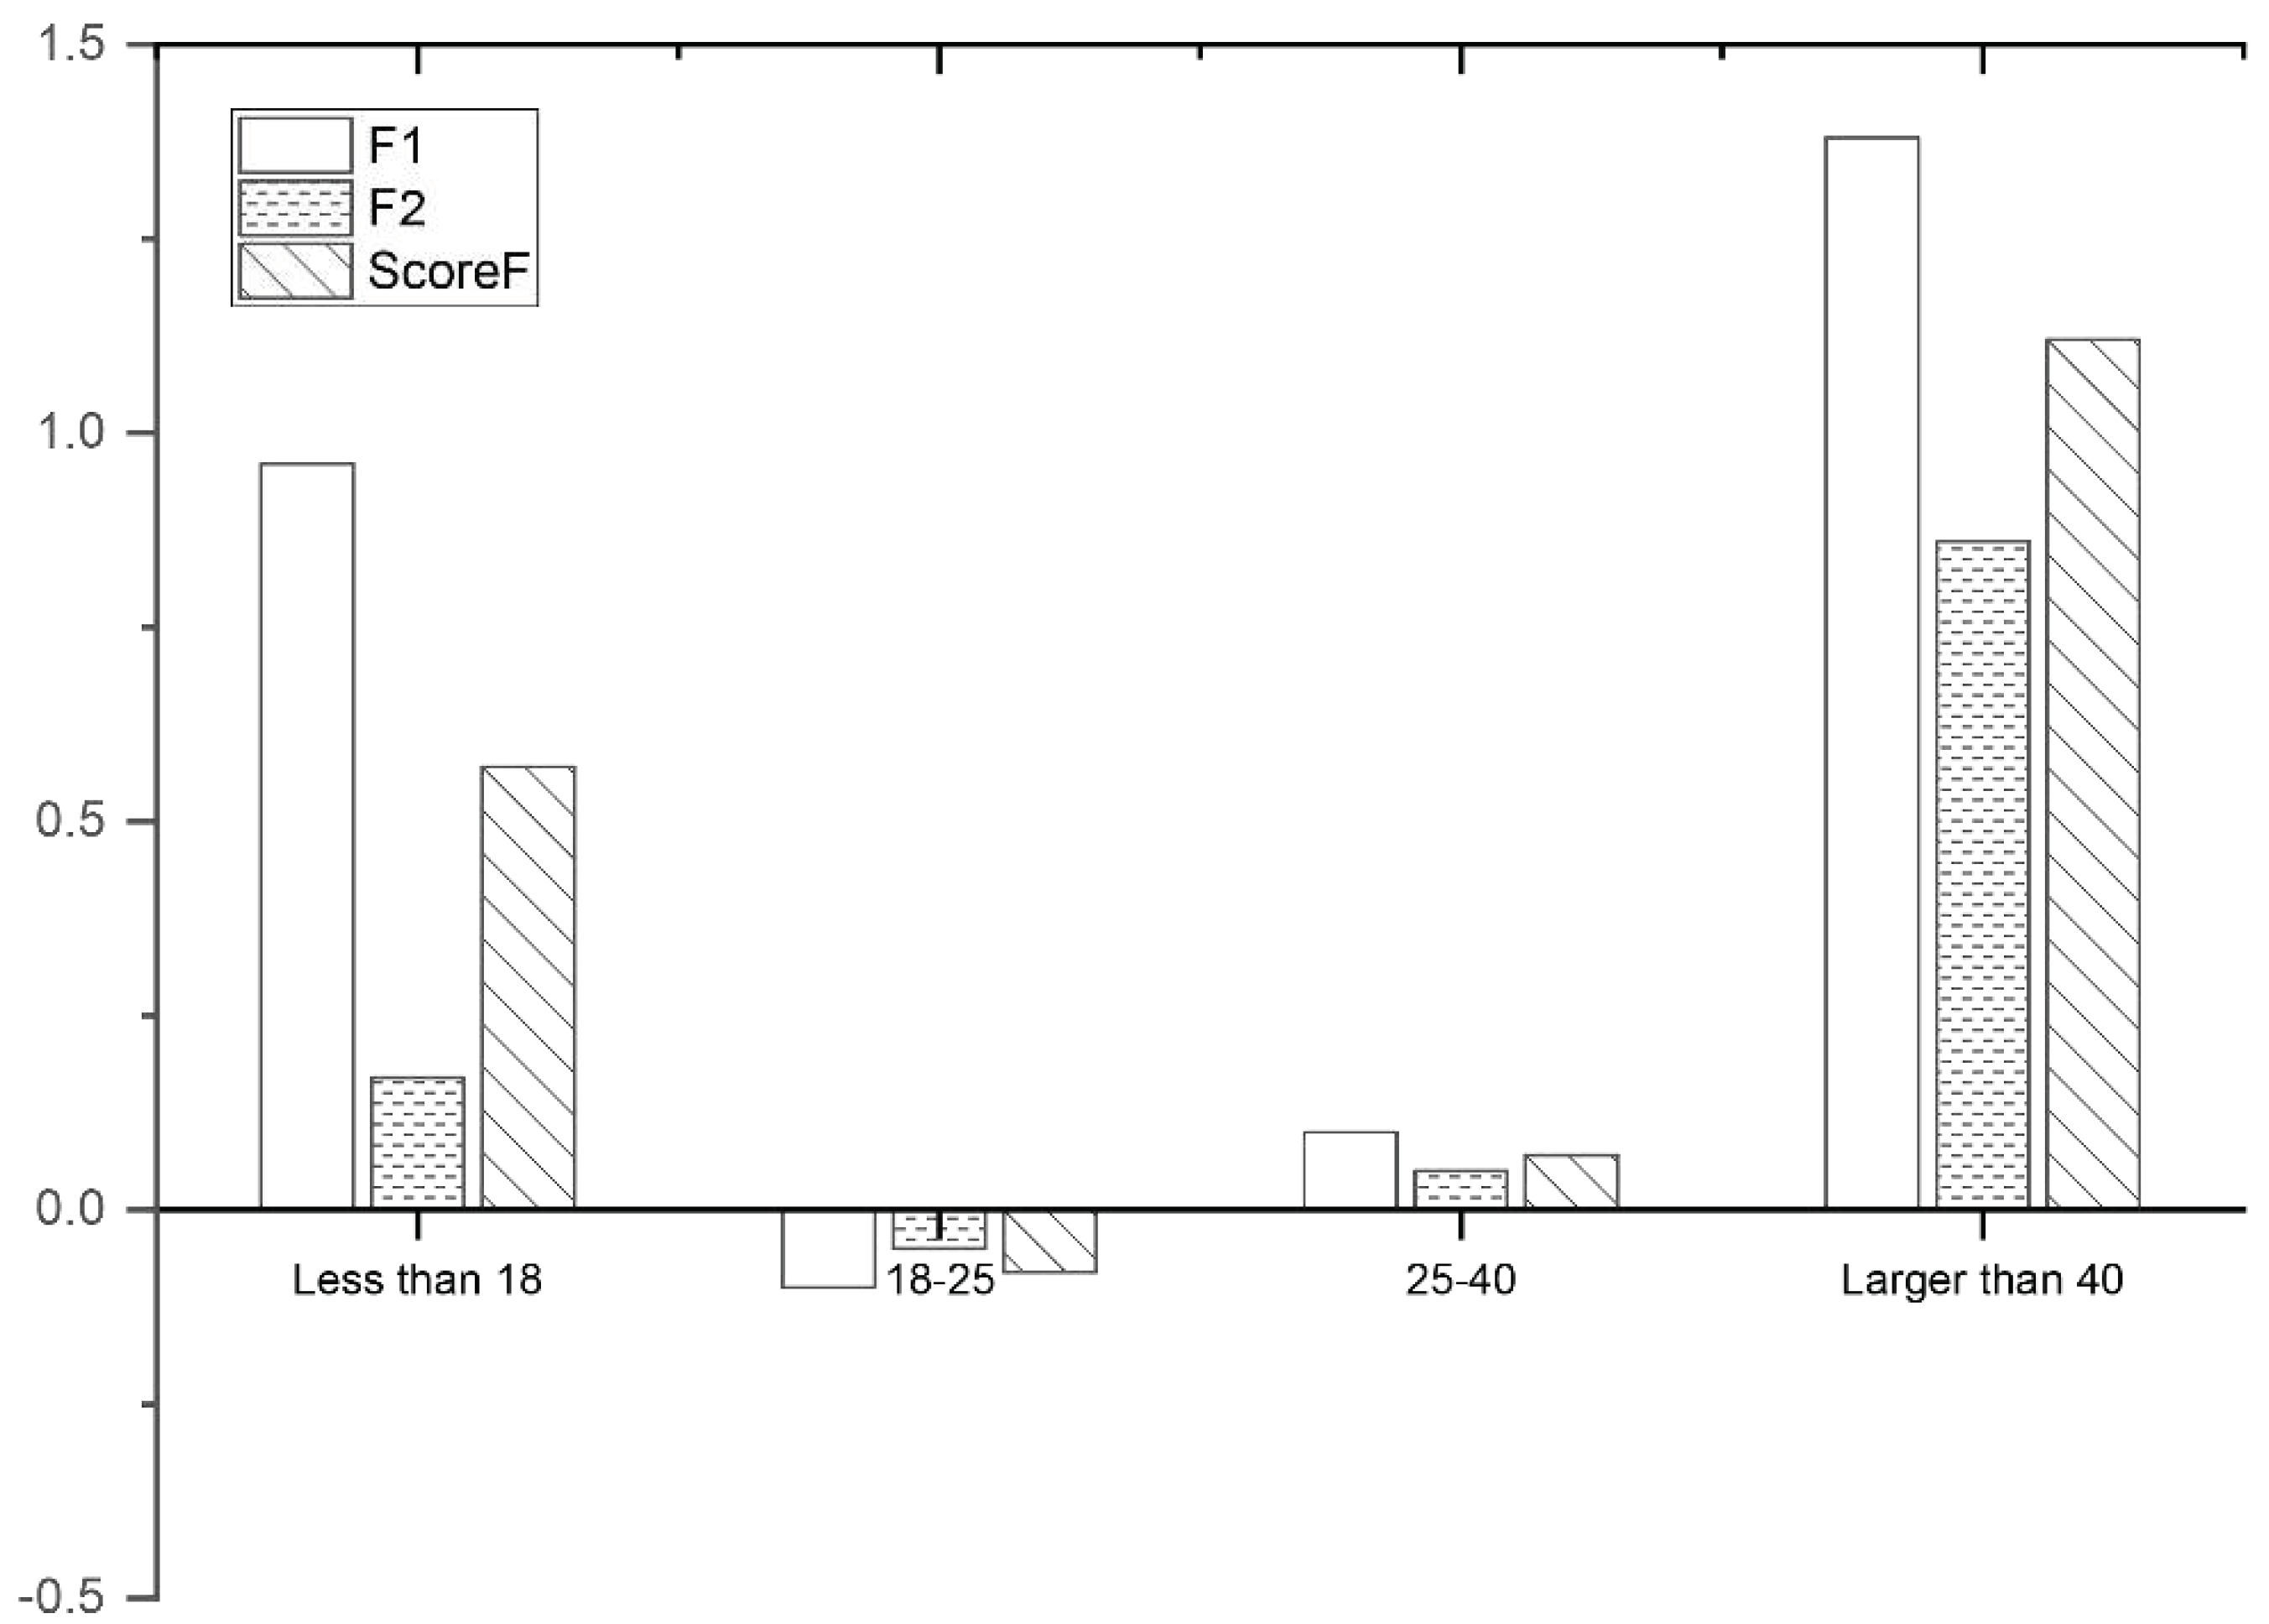
The composite score of the SD factor analysis, ScoreF, is calculated using a weighted formula derived from the percentage of variance obtained from the factor analysis: ScoreF = (34.167* F1 + 33.247 * F2)/67.414. This formula was used to analyze the population differences in SD scores further. The following analysis showed that the visual preference evaluation of recreational path landscapes is a complex system, and the influencing factors of population differences mainly include gender, age, and status.
As shown in Figure 8 (1), males and females have opposite tendencies in subjective scoring preferences. Overall, males provided positive scores, while females offered negative scores. Specifically, males accorded higher ratings to F2, indicating their perception of Baofeng Village as possessing enhanced cultural and morphological elements. In contrast, females assigned higher ratings to F1, implying their belief in Baofeng Village’s greater vitality and favorable natural conditions. People younger than 18 and older than 40 were more visually stimulated and had higher overall ratings compared to the more muted and rational responses of those between 18 and 40. As people get older, they usually prefer and are more able to savor the cultural elements of Baofeng Village and its formal characteristics (Figure 8 (2)).
Identity also exerts an influence on visual preference (Figure 8 (3)). This study classifies individuals into four identity categories based on a binary combination of “student/social person” and “profession-al/non-professional.” In general, professionals, both students and social individuals, tended to provide more negative evaluations, likely attributable to their better spatial capabilities enabling them to discern subtler distinctions. In particular, professional community members assigned the lowest visual quality ratings to the village.
Figure 8(1).
Correlation between subjective and objective data (FD).
Figure 8(1).
Correlation between subjective and objective data (FD).
Figure 8(2).
Correlation between subjective and objective data (FD).
Figure 8(2).
Correlation between subjective and objective data (FD).
Figure 8(3).
Correlation between subjective and objective data (FD).
Figure 8(3).
Correlation between subjective and objective data (FD).
5. Discussion
5.1. Correlation analysis of subjective and objective data
More comprehensive results can be obtained by correlating the subjective SD scores (F1, F2, and ScoreF) with two indicators of AOI, the FD, and the TFD. The reason for removing the “FC” is that” FD” reflected almost the same content as “FC” in the previous study. The correlation of the two variables was analyzed using Pearson’s correlation coefficient, as shown in
Table 4, which indicates that ScoreF has almost no correlation with indicators of AOI. Only F1 and F2 have a low correlation of 0.3 to 0.5 with some natural elements (sky, field, and mountain). Therefore, the correlation between subjective and objective data is relatively weak.
From the above results, the correlation between the two evaluations is not as strong as our daily experience might imply. This must be related to the two evaluation systems being conducted based on different states. The eye-tracking data emphasizes the part of interest within a single image, offering insights into specific elements while overlooking the overall experience. Conversely, the SD evaluation data emphasizes the overall feeling, though it is more subjective. Therefore, these two kinds of data should be integrated to create a more precise and comprehensive description of people’s visual preferences.
Table 4.
Correlation between subjective and objective data (FD).
Table 4.
Correlation between subjective and objective data (FD).
| |
|
1-Tree |
1-Shrub |
1-Water |
1-Sky |
1-Field |
1-Mountain |
1-Embankment |
2-Building |
2-Sturcture |
2-Landmark |
2-Pavement |
2-Obstacle |
3-Sign |
3-People |
3-Others |
| F1 |
r |
-0.248 |
0.008 |
0.002 |
-0.336 |
-0.216 |
-0.225 |
0.107 |
0.082 |
0.000 |
0.184 |
0.039 |
0.071 |
-0.066 |
-0.100 |
-0.115 |
| Sig (2-tailed |
0.123 |
0.959 |
0.988 |
0.034 |
0.181 |
0.164 |
0.512 |
0.063 |
0.999 |
0.256 |
0.810 |
0.662 |
0.686 |
0.539 |
0.479 |
| F2 |
r |
-0.002 |
-0.193 |
0.136 |
-0.092 |
0.352 |
-0.132 |
0.197 |
0.004 |
0.078 |
-0.179 |
0.059 |
0.229 |
0.255 |
0.314 |
0.300 |
| Sig (2-tailed |
0.992 |
0.233 |
0.403 |
0.570 |
0.026 |
0.416 |
0.223 |
0.978 |
0.633 |
0.269 |
0.719 |
0.155 |
0.113 |
0.049 |
0.060 |
| ScoreF |
r |
-0.179 |
-0.129 |
0.097 |
-0.305 |
0.091 |
-0.253 |
0.214 |
0.062 |
0.054 |
0.007 |
0.069 |
0.211 |
0.130 |
0.147 |
0.127 |
| Sig (2-tailed) |
0.270 |
0.429 |
0.554 |
0.055 |
0.576 |
0.115 |
0.185 |
0.703 |
0.740 |
0.967 |
0.672 |
0.192 |
0.423 |
0.365 |
0.436 |
| F1 |
r |
-0.155 |
-0.083 |
-0.248 |
-0.478 |
-0.037 |
-0.358 |
0.034 |
-0.108 |
-0.112 |
0.142 |
-0.098 |
-0.170 |
0.005 |
-0.083 |
-0.041 |
| Sig(双尾) |
0.340 |
0.612 |
0.122 |
0.002 |
0.820 |
0.023 |
0.836 |
0.509 |
0.491 |
0.383 |
0.548 |
0.295 |
0.975 |
0.609 |
0.802 |
| F2 |
r |
0.037 |
0.245 |
0.170 |
-0.053 |
0.011 |
0.142 |
0.290 |
-0.027 |
0.132 |
0.140 |
-0.141 |
0.249 |
-0.082 |
0.157 |
0.238 |
| Sig(双尾) |
0.820 |
0.127 |
0.294 |
0.743 |
0.946 |
0.383 |
0.069 |
0.868 |
0.416 |
0.388 |
0.384 |
0.122 |
0.616 |
0.333 |
0.139 |
| ScoreF |
r |
-0.085 |
0.112 |
-0.059 |
-0.380 |
-0.019 |
-0.158 |
0.227 |
-0.096 |
0.012 |
0.199 |
-0.169 |
0.052 |
-0.053 |
0.050 |
0.137 |
| Sig(双尾) |
0.602 |
0.492 |
0.716 |
0.016 |
0.908 |
0.330 |
0.160 |
0.555 |
0.942 |
0.217 |
0.298 |
0.751 |
0.743 |
0.760 |
0.400 |
5.2. Limitations
Due to time, space, and financial constraints, this study used viewing photographs for the eye-tracking experiment and SD test. This does not provide a complete simulation of real feelings. Pictures cannot replace real rural path landscapes and ignore sensory experiences other than visual. Additionally, viewing static photos offers a fragmented experience compared to the continuous and linear exploration typical of being physically present, potentially affecting the study’s generalizability. This issue could be further studied through supplemental immersive experiments like virtual reality (VR) or field tests.
Regarding the subjects, most of them were young college students with a very small portion of social individuals. While efforts were made to diversify the participant group, it did not comprehensively simulate the full spectrum of tourists, such as families, elderly individuals, and couples. Therefore, further study should enrich user portraits of different types and levels.
Regarding the apparatus, the EyeLab eye-tracker was not equipped with wearables, so the relevant physiological eye movement data yet to be collected completely, such as the saccade amplitude, saccade frequency, etc., so more wearable devices and sensors should be equipped for further research.
6. Conclusions
This study integrates eye-tracking experiments and semantic differential analysis to conduct exploratory research on the visual preference of rural recreational path landscapes, forming a new evaluation model that can offer valuable insights for related design and research endeavors. The results are as follows:
(1) The objective eye movement analysis and subjective SD evaluation indicate an average overall visual quality in Baofeng. People focus more on the near view but neglect the far view. When walking, well-defined paths with rich elevation changes get more attention. In open environments like paths “A” and” C,” people’s line of sight is easily influenced by naturally growing shrubs and trees along the path. In contrast, narrow alleyways tend to draw attention to architectural de-tails. Natural elements are more visually appealing in waterfront paths than in non-waterfront paths; configurational elements are less attractive over a duration of gazing, but they tend to be noticed first; all elements are more evenly attracted in terms of visual prominence, but natural and architectural elements become increasingly attractive over time. Besides, where the line of sight dis-appears, things that contrast markedly with the overall environment receive more attention.
As for subjective evaluation, path “A “does not perform prominently in evaluating each factor, suggesting a need for enhanced utilization of natural and cultural elements. Path “B” indicates that this village’s historical and cultural characteristics and experience are prominent, which indicates the strong attraction of cultural elements in rural landscapes; Path “C” shows potential because of its natural landscape, despite a lower tourist presence due to the crushed buildings and in-complete road system.
(2) In terms of the impact of subject differences, subjects with professional backgrounds were more attentive to details and more critical in their evaluations; males were more concerned with cultural elements, while females were more concerned with natural elements and village vitality; and the older they were, the more they were concerned with cultural elements.
(3) The correlation between subjective and objective analysis is relatively weak. The reasons for the data inconsistency can be further investigated in the following studies. This may be caused by the fact that the two evaluation systems are conducted based on different states, or it may be a problem with the samples or apparatus. However, both methods can be combined to improve the accuracy.
(4) In the current context of sustainable development and rural revitalization, the following design strategies are proposed: 1) Pay attention to the detailed elements of path design, especially elevation changes, near and far views, spatial opening and closure, etc., to form a rich visual sensory experience; 2) Take note of the design of vegetation at key nodes, with different focuses on different landscape types, for example, waterfront paths need a more open view, and therefore vegetation should be slightly lower and sparse; while mountain paths need to use vegetation for appropriate guidance; village paths need to add details with various shrubs. 3) Increase the spatial richness in specific environments. Compared to mountain paths, village paths need to in-crease spatial transitions to provide enjoyment.
Author Contributions
Conceptualization, Z.J.W and H.Y.; methodology, Z.J.W; software, Z.J.W and H.Y.; validation, Z.J.W; formal analysis, Z.J.W and H.Y.; investigation: H.Y. and Z.J.W.; data curation, Z.J.W and H.Y.; writing—original draft preparation, Z.J.W. and H.Y.; writing—review and editing, Z.J.W and H.Y.; visualization, Z.J.W and H.Y.; All authors have read and agreed to the published version of the manuscript.
Funding
Key Laboratory of Ecology and Energy Saving Study of Dense Habitat, Ministry of Education (Tongji University), Open Project Research, TOD Plotting Design Guidelines Research on the Incentive Zoning Sending Area of Urban Base Public Space, No.20220107
Data Availability Statement
Data are available on reasonable request.
Acknowledgments
The authors wish to thank Pro. Leiqing Xu’s Lab in Tongji University for providing experiment apparatus and helpful technical guidance. We also thank all the participants for their time and patience.
Conflicts of Interest
The authors declare no conflict of interest.
References
- Sauer C O. Morphology of Landscape. In: John Leighly (ed). Land and Life. 5th printing. University of California Press, Berkely, Los Angeles, London, 1974; pp. 315-350.
- Cosgrove, Denis E. Social formation and symbolic landscape. Univ of Wisconsin Press, 1998.
- Li, Yuheng, et al. “Urbanization for rural sustainability–Rethinking China’s urbanization strategy.” Journal of Cleaner Production 178 (2018): 580-586. [CrossRef]
- Cheng, Mengyao, and Chengrong Duan. “The changing trends of internal migration and urbanization in China: new evidence from the seventh National Population Census.” China Population and Development Studies 5 (2021): 275-295. [CrossRef]
- Gao S, Huang S, Huang Y. Rural tourism development in China[J]. International journal of tourism research, 2009, 11(5): 439-450.
- Cong, Li, et al. “Understanding tourists’ willingness-to-pay for rural landscape improvement and preference heterogeneity.” Sustainability 11.24 (2019): 7001. [CrossRef]
- O’Hare, Daniel. “Interpreting the cultural landscape for tourism development.” Urban Design International 2 (1997): 33-54. [CrossRef]
- Hansen, Andreas Skriver. “Understanding recreational landscapes–a review and discussion.” Landscape Research 46.1 (2021): 128-141. [CrossRef]
- Chamberlain and Laura. Eye Tracking Methodology; Theory and Practice. Qualitative Market Research: An International Journal, 10(2): 217–20(2007).
- Dupont, Lien, et al. “Comparing saliency maps and eye-tracking focus maps: The potential use in visual impact assessment based on landscape photographs.” Landscape and urban planning 148 (2016): 17-26. [CrossRef]
- Kang, Ning, and Chunqing Liu. “Towards landscape visual quality evaluation: Methodologies, technologies, and recommendations.” Ecological Indicators 142 (2022): 109174. [CrossRef]
- Sang, Kun, Giovanni Luigi Fontana, and Silvia Elena Piovan. “Assessing railway landscape by ahp process with gis: A study of the yunnan-vietnam railway.” Remote Sensing 14.3 (2022): 603. [CrossRef]
- Calvin, J.S., Dearinger, J.A., Curtin, M.E., 1972. An attempt at assessing preferences for natural landscape. Environment and Behavior 4 (4), 447.
- Arriaza, Manuel, et al. “Assessing the visual quality of rural landscapes.” Landscape and urban planning 69.1 (2004): 115-125. [CrossRef]
- Kang, Ning, and Chunqing Liu. “Towards landscape visual quality evaluation: Methodologies, technologies, and recommendations.” Ecological Indicators 142 (2022): 109174. [CrossRef]
- Bishop, Ian D., JoAnna R. Wherrett, and David R. Miller. “Assessment of path choices on a country walk using a virtual environment.” Landscape and urban planning 52.4 (2001): 225-237. [CrossRef]
- Duchowski A T. A Breadth-First Survey of Eye-Tracking Application[J]. Behavior Research Methods, Instruments, &Computers. 2002,34(4): 455-470. [CrossRef]
- Xu, J. “Theory and application of eye trackers in psychological laboratory.” Laboratory Science 3 (2009): 162-163.
- Yan, Guoli, et al. “Review of eye-movement measures in reading research.” Advances in psychological science 21.4 (2013): 589. [CrossRef]
- De Lucio J V, Mohamadian M, Ruiz J P, et al. Visual Landscape Exploration as Revealed by Eye Movement Tracking[J]. Landscape and Urban Planning. 1996,34(2): 135-142.
- Dupont L, Antrop M, Van Eetvelde V. Eye-Tracking Analysis in Landscape Perception Research: Influence of Photograph Properties and Landscape Characterisitics[J]. Landscape Research. 2014,39(4): 417-432. [CrossRef]
- Dupont L, Antrop M, Van Eetvelde V. Does Landscape Related Expertise Influence the Visual Perception of Landscape Photographs? Implications for Participatory Landscape Planning and Management[J]. Landscape and Urban Planning. 2015,[4]: 68-77. [CrossRef]
- Zhang, W. D., et al. “An eye-movement research on city greening landscape appreciation.” Psychol. Sci 32 (2009): 801-803.
- Guo S L,Zhao N X,Zhang J X,et al. Landscape visual quality assessment based on eye movement:college student eye-tracking experiments on tourism landscape pictures[J]. Resources Science, 2017, 39(6): 1137-1147. [CrossRef]
- Wang Min, Zhao Meiting, Lin Mingliang, et al. seeking lost memories _ application of a new visual methodology for heritage protection[J]. Geographical Review, 2020, 110(4): 556-574. [CrossRef]
- Zhang, J. H. “The diagnosis methods in planning and design (16)-SD method.” Chinese Landscape Architecture 20 (2004): 54-58.
- Cao, J., Y. Liang, and J. H. Zhang. “The scenic investigation and assessment of nature reserves in Beijing.” Chinese Landscape Architecture 7 (2004): 67-71.
- Su, Tingting, et al. “Analysis and Optimization of Landscape Preference Characteristics of Rural Public Space Based on Eye-Tracking Technology: The Case of Huangshandian Village, China.” Sustainability 15.1 (2022): 212. [CrossRef]
- Noland, Robert B., et al. “Eye-tracking technology, visual preference surveys, and urban design: Preliminary evidence of an effective methodology.” Journal of Urbanism: International Research on Placemaking and Urban Sustainability 10.1 (2017): 98-110. [CrossRef]
- Li, Jie, et al. “An evaluation of urban green space in Shanghai, China, using eye tracking.” Urban Forestry & Urban Greening 56 (2020): 126903. [CrossRef]
- Heise, David R. “The semantic differential and attitude research.” Attitude measurement 4 (1970): 235-253.
- Xing, Yu, and Jiawei Leng. “Evaluation of Public Space in Traditional Villages Based on Eye Tracking Technology.” Journal of Asian Architecture and Building Engineering just-accepted (2023). [CrossRef]
|
Disclaimer/Publisher’s Note: The statements, opinions and data contained in all publications are solely those of the individual author(s) and contributor(s) and not of MDPI and/or the editor(s). MDPI and/or the editor(s) disclaim responsibility for any injury to people or property resulting from any ideas, methods, instructions or products referred to in the content. |
© 2023 by the authors. Licensee MDPI, Basel, Switzerland. This article is an open access article distributed under the terms and conditions of the Creative Commons Attribution (CC BY) license (http://creativecommons.org/licenses/by/4.0/).
