Preprint
Article

The Efficacy and Safety of High Dose Cholecalciferol Therapy in Hemodialysis Patients

Altmetrics

Downloads

98

Views

48

Comments

0

A peer-reviewed article of this preprint also exists.

Submitted:

06 November 2023

Posted:

07 November 2023

You are already at the latest version

Alerts
Abstract
Vitamin D deficiency and insufficiency are highly prevalent in CKD affecting over 80% of hemodialysis (HD) patients and require therapeutic intervention. Nephrological societies suggest the administration of cholecalciferol according to the guidelines for the general population. The aim of the observational study was to evaluate the efficacy and safety of the therapy with a high dose of cholecalciferol in HD patients with 25(OH)D deficiency and insufficiency to reach the target serum 25(OH)D level > 30 ng/mL. 22 patients (16 M), with an average age of 72.5 ± 13.03 years and 25(OH)D concentration of 13.05 (9.00–17.90) ng/mL were administered cholecalciferol at a therapeutic dose of 70,000 IU/week (20,000 IU + 20,000 IU + 30,000 IU, immediately after each dialysis session). All patients achieved the target value >30 ng/mL, with a mean time of 2.86 ± 1.87 weeks. In the first week, the target level of 25(OH)D (100%) was reached by 2 patients (9.09%), in the second week – by 15 patients (68.18%), in the fourth week – by 18 patients (81.18%) and in the ninth week by all 22 patients (100%). A significant increase in 1,25(OH)2D levels was observed during the study, however, only 2 patients (9.09%) achieved a concentration of 1,25(OH)2D above 25 ng/mL – the lower limit of the reference range. The intact PTH concentrations remained unchanged during the observation period. No episodes of hypercalcemia, and one new episode of hyperphosphatemia were observed. In conclusion, our study showed that the administration of a high therapeutic dose of cholecalciferol allowed for a quick, effective, and safe leveling of 25(OH)D concentration in HD patients.
Keywords: 
Subject: Medicine and Pharmacology  -   Urology and Nephrology

1. Introduction

Vitamin D is crucial for musculoskeletal and general health. Low levels are associated with an increased risk of death and morbidity, including cancer, cardiovascular, autoimmune diseases, and infections. In hemodialysis (HD) patients it plays additionally an important role in the pathogenesis of Chronic Kidney Disease–Mineral And Bone Disorder (CKD-MBD) [1,2,3,4,5]. Serum 25-hydroxycholecalciferol (25(OH)D, calcidiol) concentration is the accepted marker for the evaluation of vitamin D status [6]. Vitamin D deficiency (25(OH)D < 20 ng/mL) and insufficiency (25(OH)D 20–29 ng/mL) are highly prevalent in CKD affecting over 80% of HD patients and require therapeutic intervention [6,7,8,9]. Despite the inadequate activation of vitamin D by hydroxylation in position 1-α in proximal tubules of the kidneys, the presence of extra-renal 1-α-hydroxylase results in the production of the active form of vitamin D, 1,25(OH)2D, calcitriol, in HD patients. That argues for the first-line use of cholecalciferol before the need for active vitamin D analogs [10].
Nephrological societies suggest the measurement of the level of 25(OH)D in CKD patients and the administration of cholecalciferol according to the guidelines for the general population. [11] However current guidelines for the prevention and treatment of vitamin D deficiency reveal a great heterogeneity of the recommendations, and in turn indicate a special approach to CKD patients, so that supplementation should be supervised and carried out cautiously [6,12]. So far no effective and safe cholecalciferol dosing regimen was established in clinical care of HD patients.
The data from literature regarding the correction of vitamin D status in HD patients is miscellaneous and comes from studies with different protocols, dosing schedules, variable doses, and frequency of administration [10,13,14,15,16]. Some of the studies show that HD patients may require higher doses of cholecalciferol than the general population to achieve adequate serum levels of 25(OH)D. High doses appear to be safe, and may be more sufficient to increase 25(OH)D level > 30 ng/mL. However, effects on iPTH 1,25(OH)2D and other laboratory as well as clinical outcomes are ambiguous [14,15,16]. There are also significant knowledge gaps regarding the target level of 25(OH)D and the active metabolite of vitamin D, 1,25(OH)2D) in HD patients, and the role of cholecalciferol in therapy of CKD-MBD and effect on overall outcomes. Therefore, the aim of the study was to evaluate the efficacy and safety of the therapy with a high dose of cholecalciferol in HD patients with 25(OH)D deficiency and insufficiency to reach the target serum 25(OH)D level > 30 ng/mL.

2. Materials and Methods

2.1. Study Design

This was an observational prospective study of a cohort of CKD stage 5, HD patients with vitamin D deficiency or insufficiency given oral cholecalciferol 3 times a week after each dialysis procedure from January 4, 2023 until the patient reached the target level of 25(OH)D > 30 ng/ml. Baseline serum 25(OH)D levels were assessed for all adult patients (n=104) undergoing maintenance hemodialysis at our center in December 2022. The average vitamin 25(OH)D concentration was found to be 24.1±14.95 ng/mL (median 19.15 ng/mL, range 5.3-83.3 ng/mL). A significant part of the patients, 77 out of 104 (74.04%) revealed 25(OH)D levels below 30 ng/mL. Based on exclusion criteria, 22 patients were selected for further analysis (Figure 1). The study protocol was approved by the Medical University of Gdańsk Ethical Committee (NKBBN/783/2022). All subjects provided their written informed consent to participate in the study.

2.2. Treatment with Cholecalciferol

The patients were administered cholecalciferol (Devikap®, soft capsules, cholecalciferol 10,000 IU, 250 µg, POLPHARMA S.A. Starogard Gdański, Poland) at a dose of 70,000 IU/week (20,000 IU + 20,000 IU + 30,000 IU, immediately after each dialysis session). The observation was continued in the patient until the target level of 25(OH)D > 30 ng/mL was reached.

2.3. Laboratory Measurements

25(OH)D, 1,25(OH)2D, calcium, phosphate, and intact PTH (iPTH) concentrations were measured at 1-2 week intervals. Blood was drawn before a dialysis session, at baseline (T0), and in weeks T1, T2, T3, T4, T6, T7, T8, T9 of the treatment until 25(OH)D levels exceeded 30 ng/mL (Tmax). Five milliliters of blood was collected into a plain tube and allowed to clot at room temperature. The blood was then centrifuged and stored at minus 20° C. Serum 1,25(OH)2D and 25(OH)D were measured using the chemiluminescent immunoassay method (LIAISON® XL 1,25 Dihydroxyvitamin D, DiaSorin, Italy; laboratory normal range: 25-86.5 pg/mL, and LIAISON® 25 OH Vitamin D TOTAL Assay, DiaSorin, Italy; optimal range for adults: 30-80 ng/mL). Based on the 95% Reference Interval, the following values were established for 1,25(OH)2D -median 47.8 pg/mL; observed range 2.5th to 97.5th percentile 19.9-79.3 pg/mL. iPTH (intact PTH) was measured by chemiluminescent assay (The DiaSorin LIAISON® N-TACT® PTH II Assay, laboratory normal range: 11–67 pg/mL). Total serum calcium and phosphorus were measured by routine colorimetric method (Abbott GmbH). Serum calcium-phosphorus (CaxP) product was calculated. The evaluation of the safety profile involved monitoring episodes of hypercalcemia (defined as an elevation in calcium serum levels of more than 10.5 mg/dL) and episodes of hyperphosphatemia (defined as phosphorus serum levels of more than 4.6 mg/dL).

2.4. Statistical Analysis

Continuous data is reported as means (± standard derivation, SD) for normally distributed variables or medians (inter-quartile ranges, IQR) for non-normally distributed variables. The Shapiro-Wilk test was used to determine the distribution of continuous variables. Categorical data is reported as percentages of the total. The comparisons of results between the groups were performed using the nonparametric U-Mann–Whitney test. The Wilcoxon signed-rank test or ANOVA was used in the analysis comparing the results of the values of the study periods. Two-sided p<0.05 was considered to be statistically significant. The statistical analysis was performed using the program Statistica 13.3 (TIBCO Software Inc.; Palo Alto, CA, USA).

3. Results

3.1. Characteristics of Patients

22 patients were included in the study, 16 men (73%) and 6 women (27%), with an average age of 72.5±13.03 years. The 25OHD levels measured in the study group averaged 13.75+/-4.83 ng/mL (a range of 6.9-23.9 ng/mL), 19 patients (86.36%) had levels below 20ng/mL (deficiency), and 3 patients (13.64%) between 20 and 30 ng/mL (insufficiency). The dialysis protocols used were as follows: 18 patients underwent high-flux hemodialysis (HD), 2 patients received extended dialysis (HDx), 1 patient underwent online hemodiafiltration with predilution, and 1 patient underwent online hemodiafiltration with postdilution: using a dialysate Ca concentration of 1.25 or 1.5 mmol/L. High-flux membranes (helixone-Fresenius®) or high-flux dialyzers with adequate selectivity for large proteins (Theranova, Baxter®,) and ultrapure water were used. The median HD vintage at baseline was 38.9 months. During the follow-up, the renal replacement therapy protocol and doses of drugs affecting calcium and phosphate metabolism e.g., calcium binders remained unchanged. A description of the study group is presented in Table 1.
3.2.25(. OH)D Levels
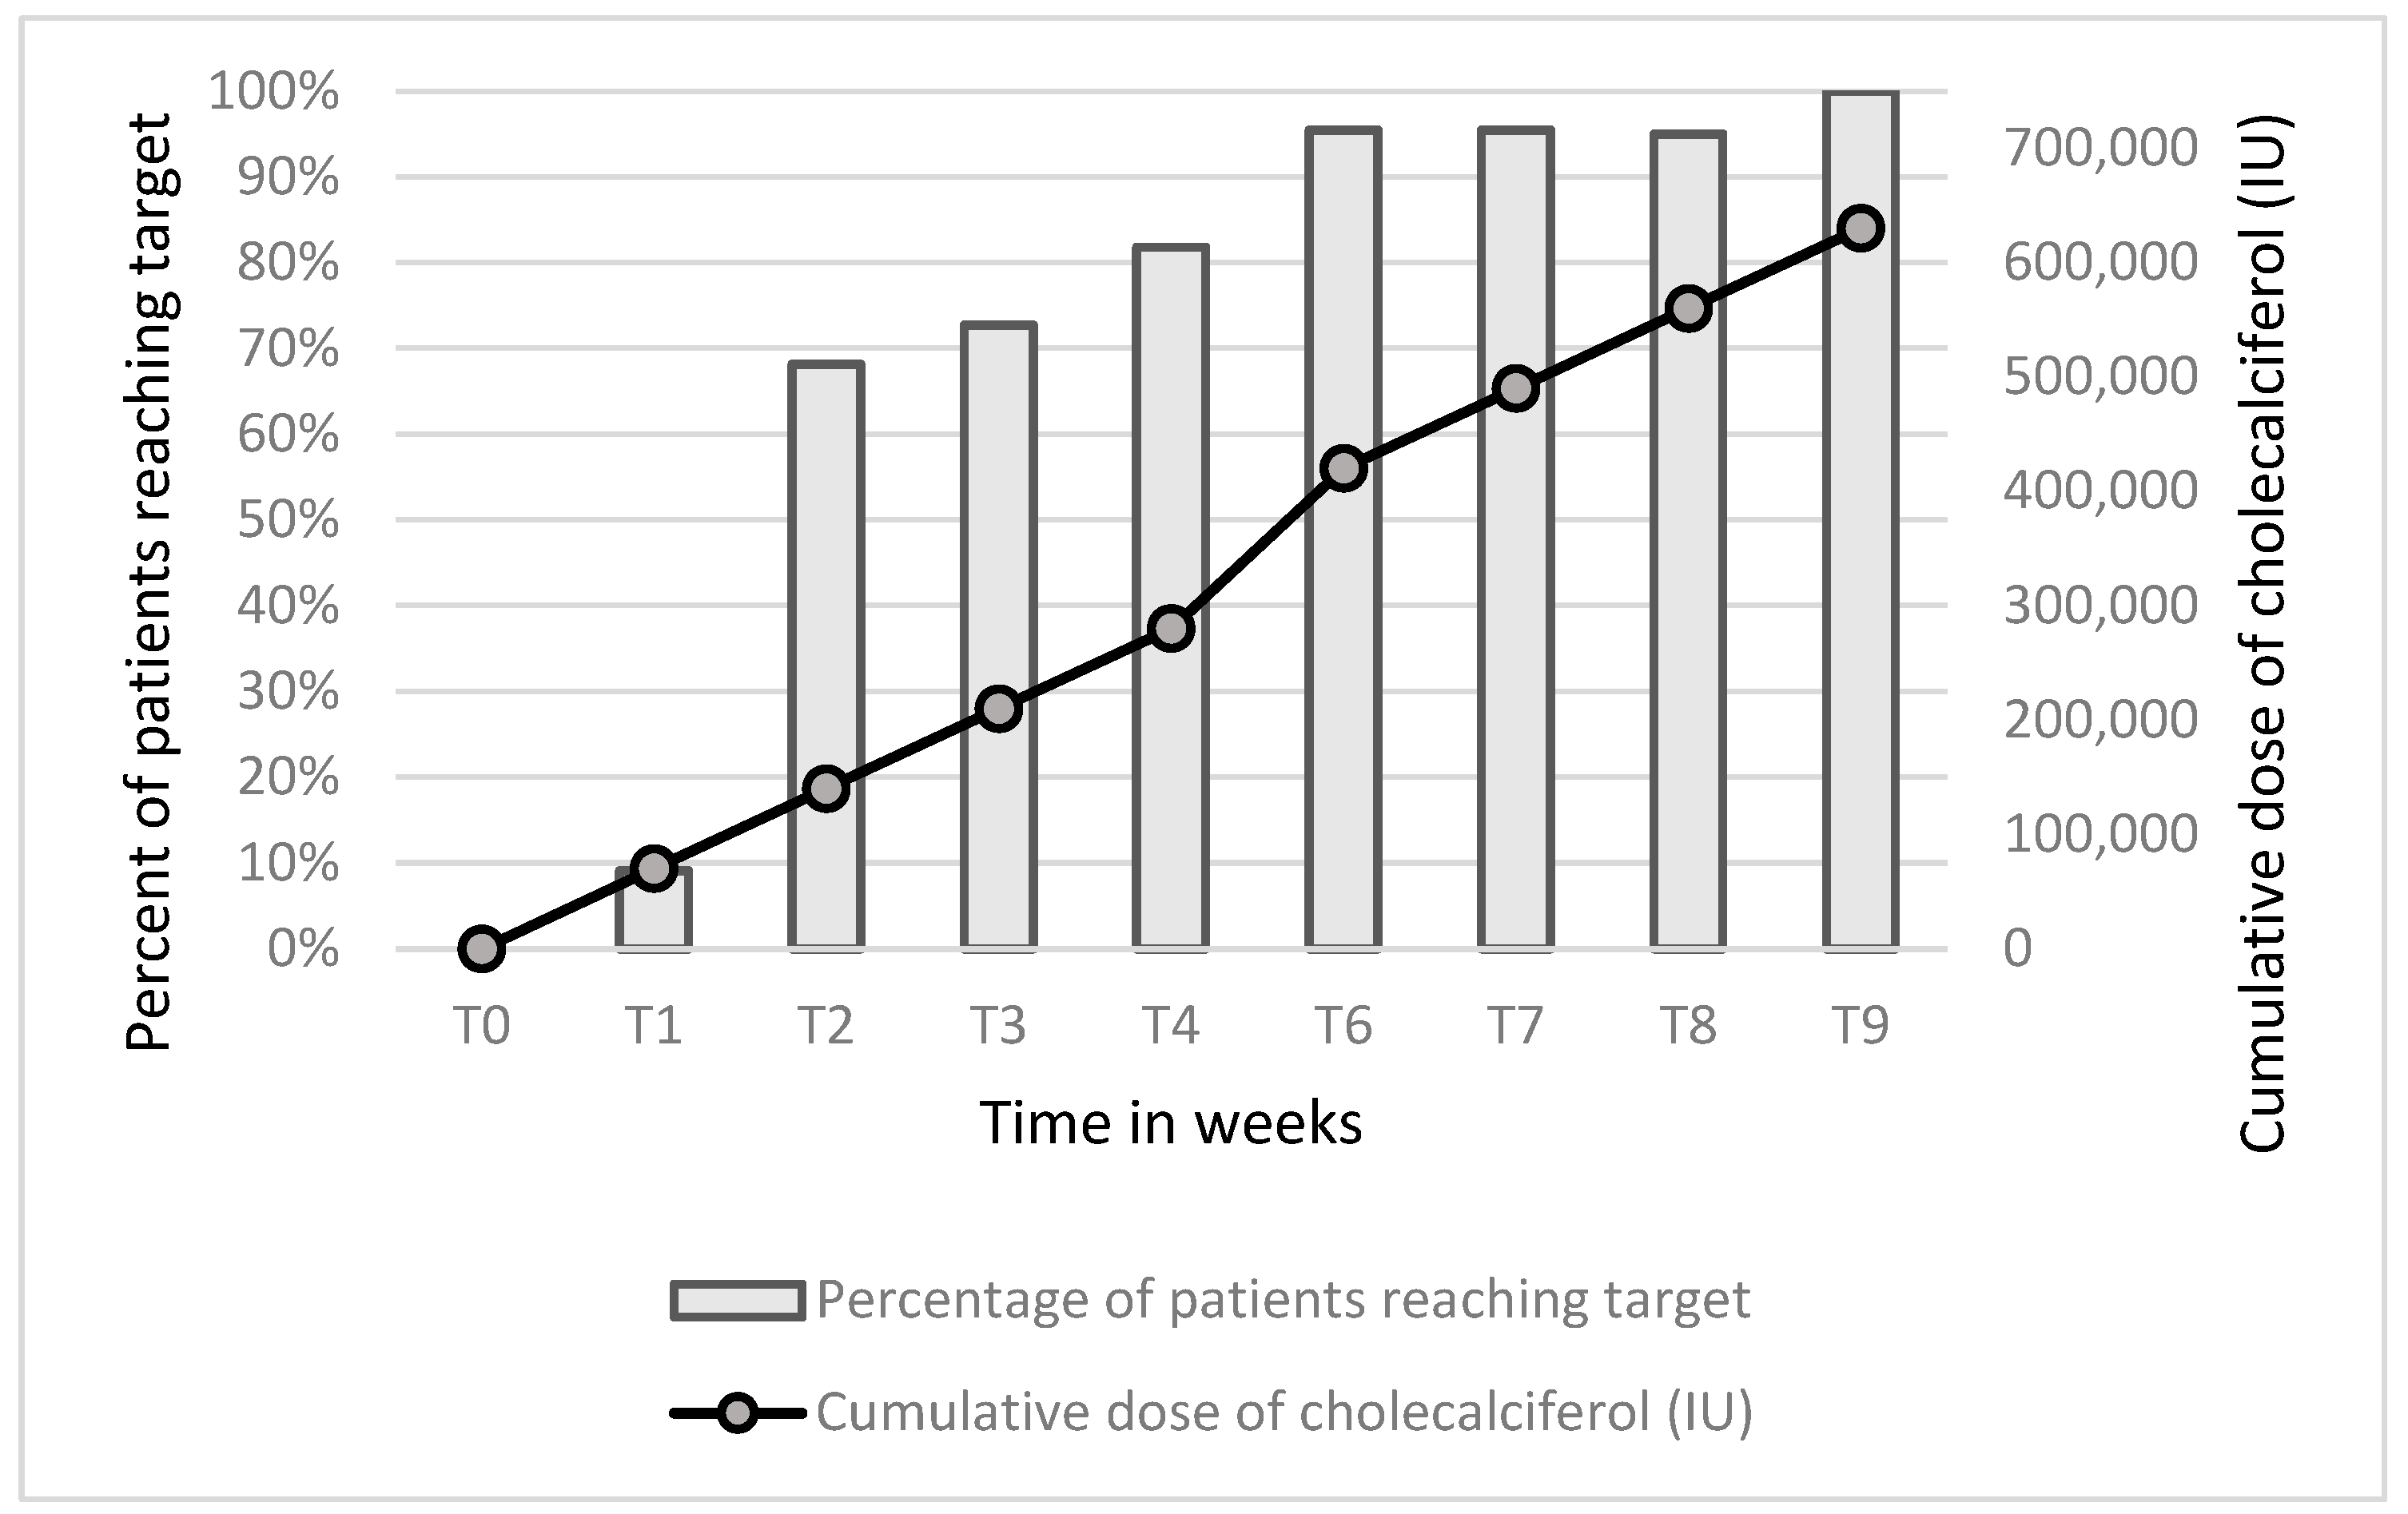
During the study, a statistically significant increase in 25(OH)D levels was observed among all patients (Table 2, Figure 2). All patients achieved the target value >30 ng/mL, with a mean time of 2.86 ± 1.87 weeks. In the first week (T1), the target level of 25(OH)D was reached by 2 patients (9.09%), in T2 – by 15 patients (68.18%), in T4 – by 18 patients (81.18%), in T6 – by 21 patients (95.46%), and in T9 by all 22 patients (100%). The 90th percentile for the cumulative dose to achieve the target 25(OH)D concentration was 420,000 IU of cholecalciferol, while after normalization to body weight and BMI, it was 5,675.7 IU/kg and 14,168.8 IU / [kg/m2], respectively. A presentation of the relationship between the number of patients reaching the 25(OH)D target concentration and the cumulative dose is shown in Figure 2.
3.3.1,25(. OH)2D Levels
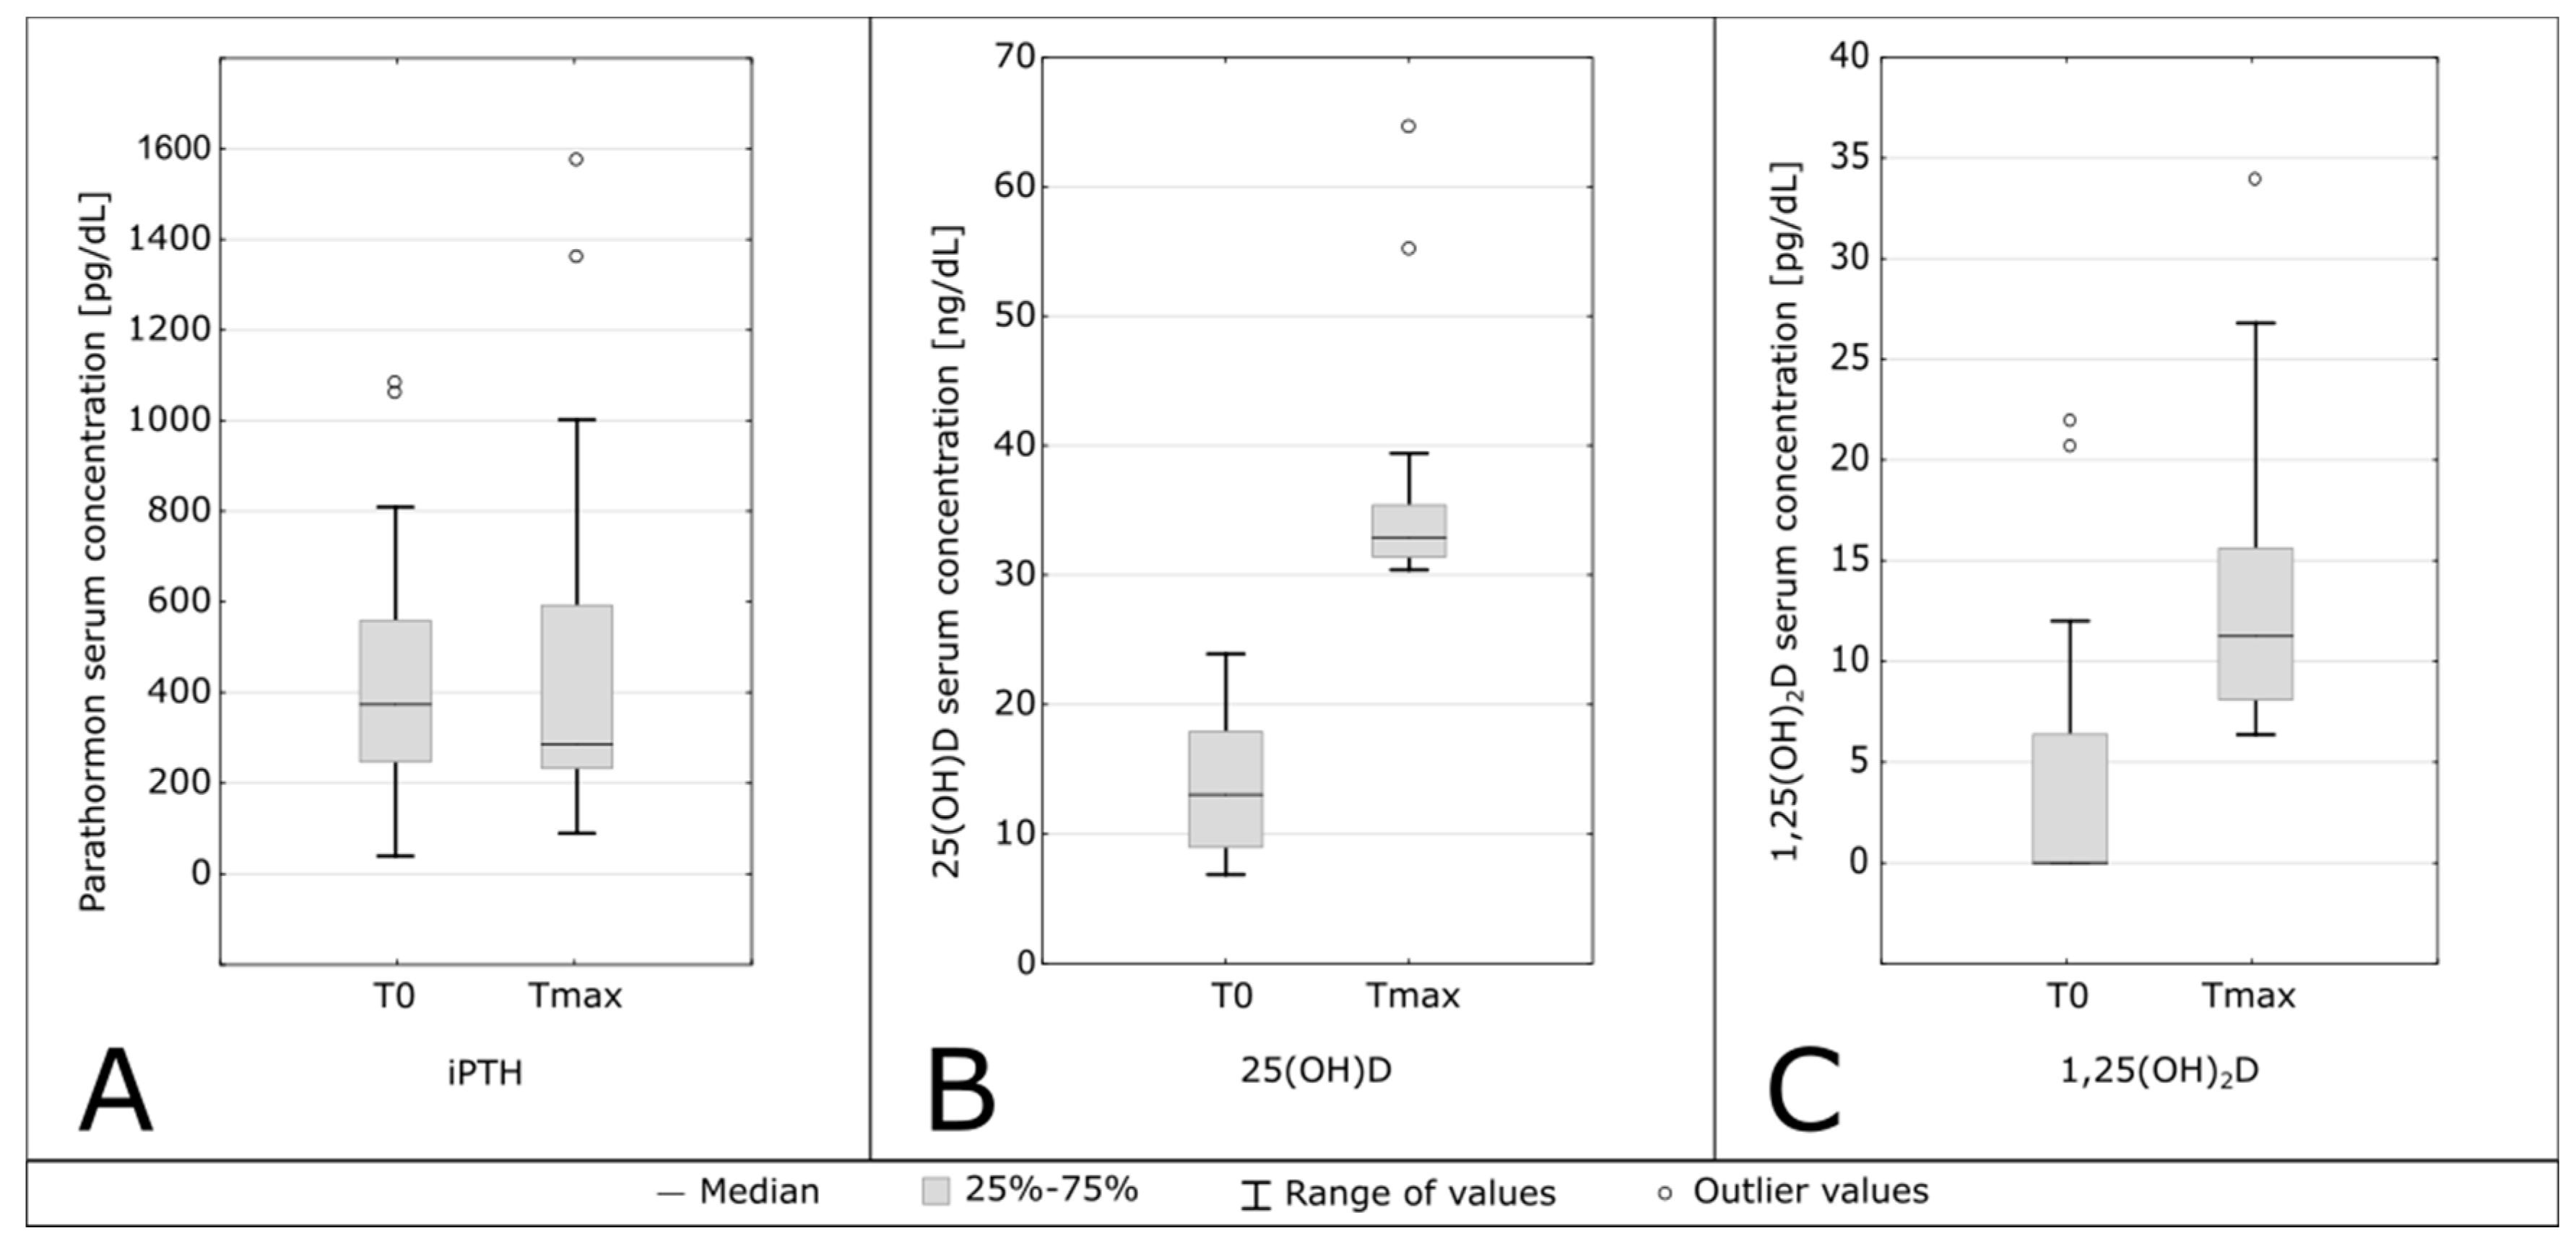
Cholecalciferol administration during the study resulted in the production of active vitamin D, asignificant increase in 1,25(OH)2D levels was observed, (T0 vs Tmax, 0.00 [0.00–6.38] ng/ml vs 6.37 [8.11–15.60] ng/mL, p<0.001, shown in Table 2 and Figure 3C).
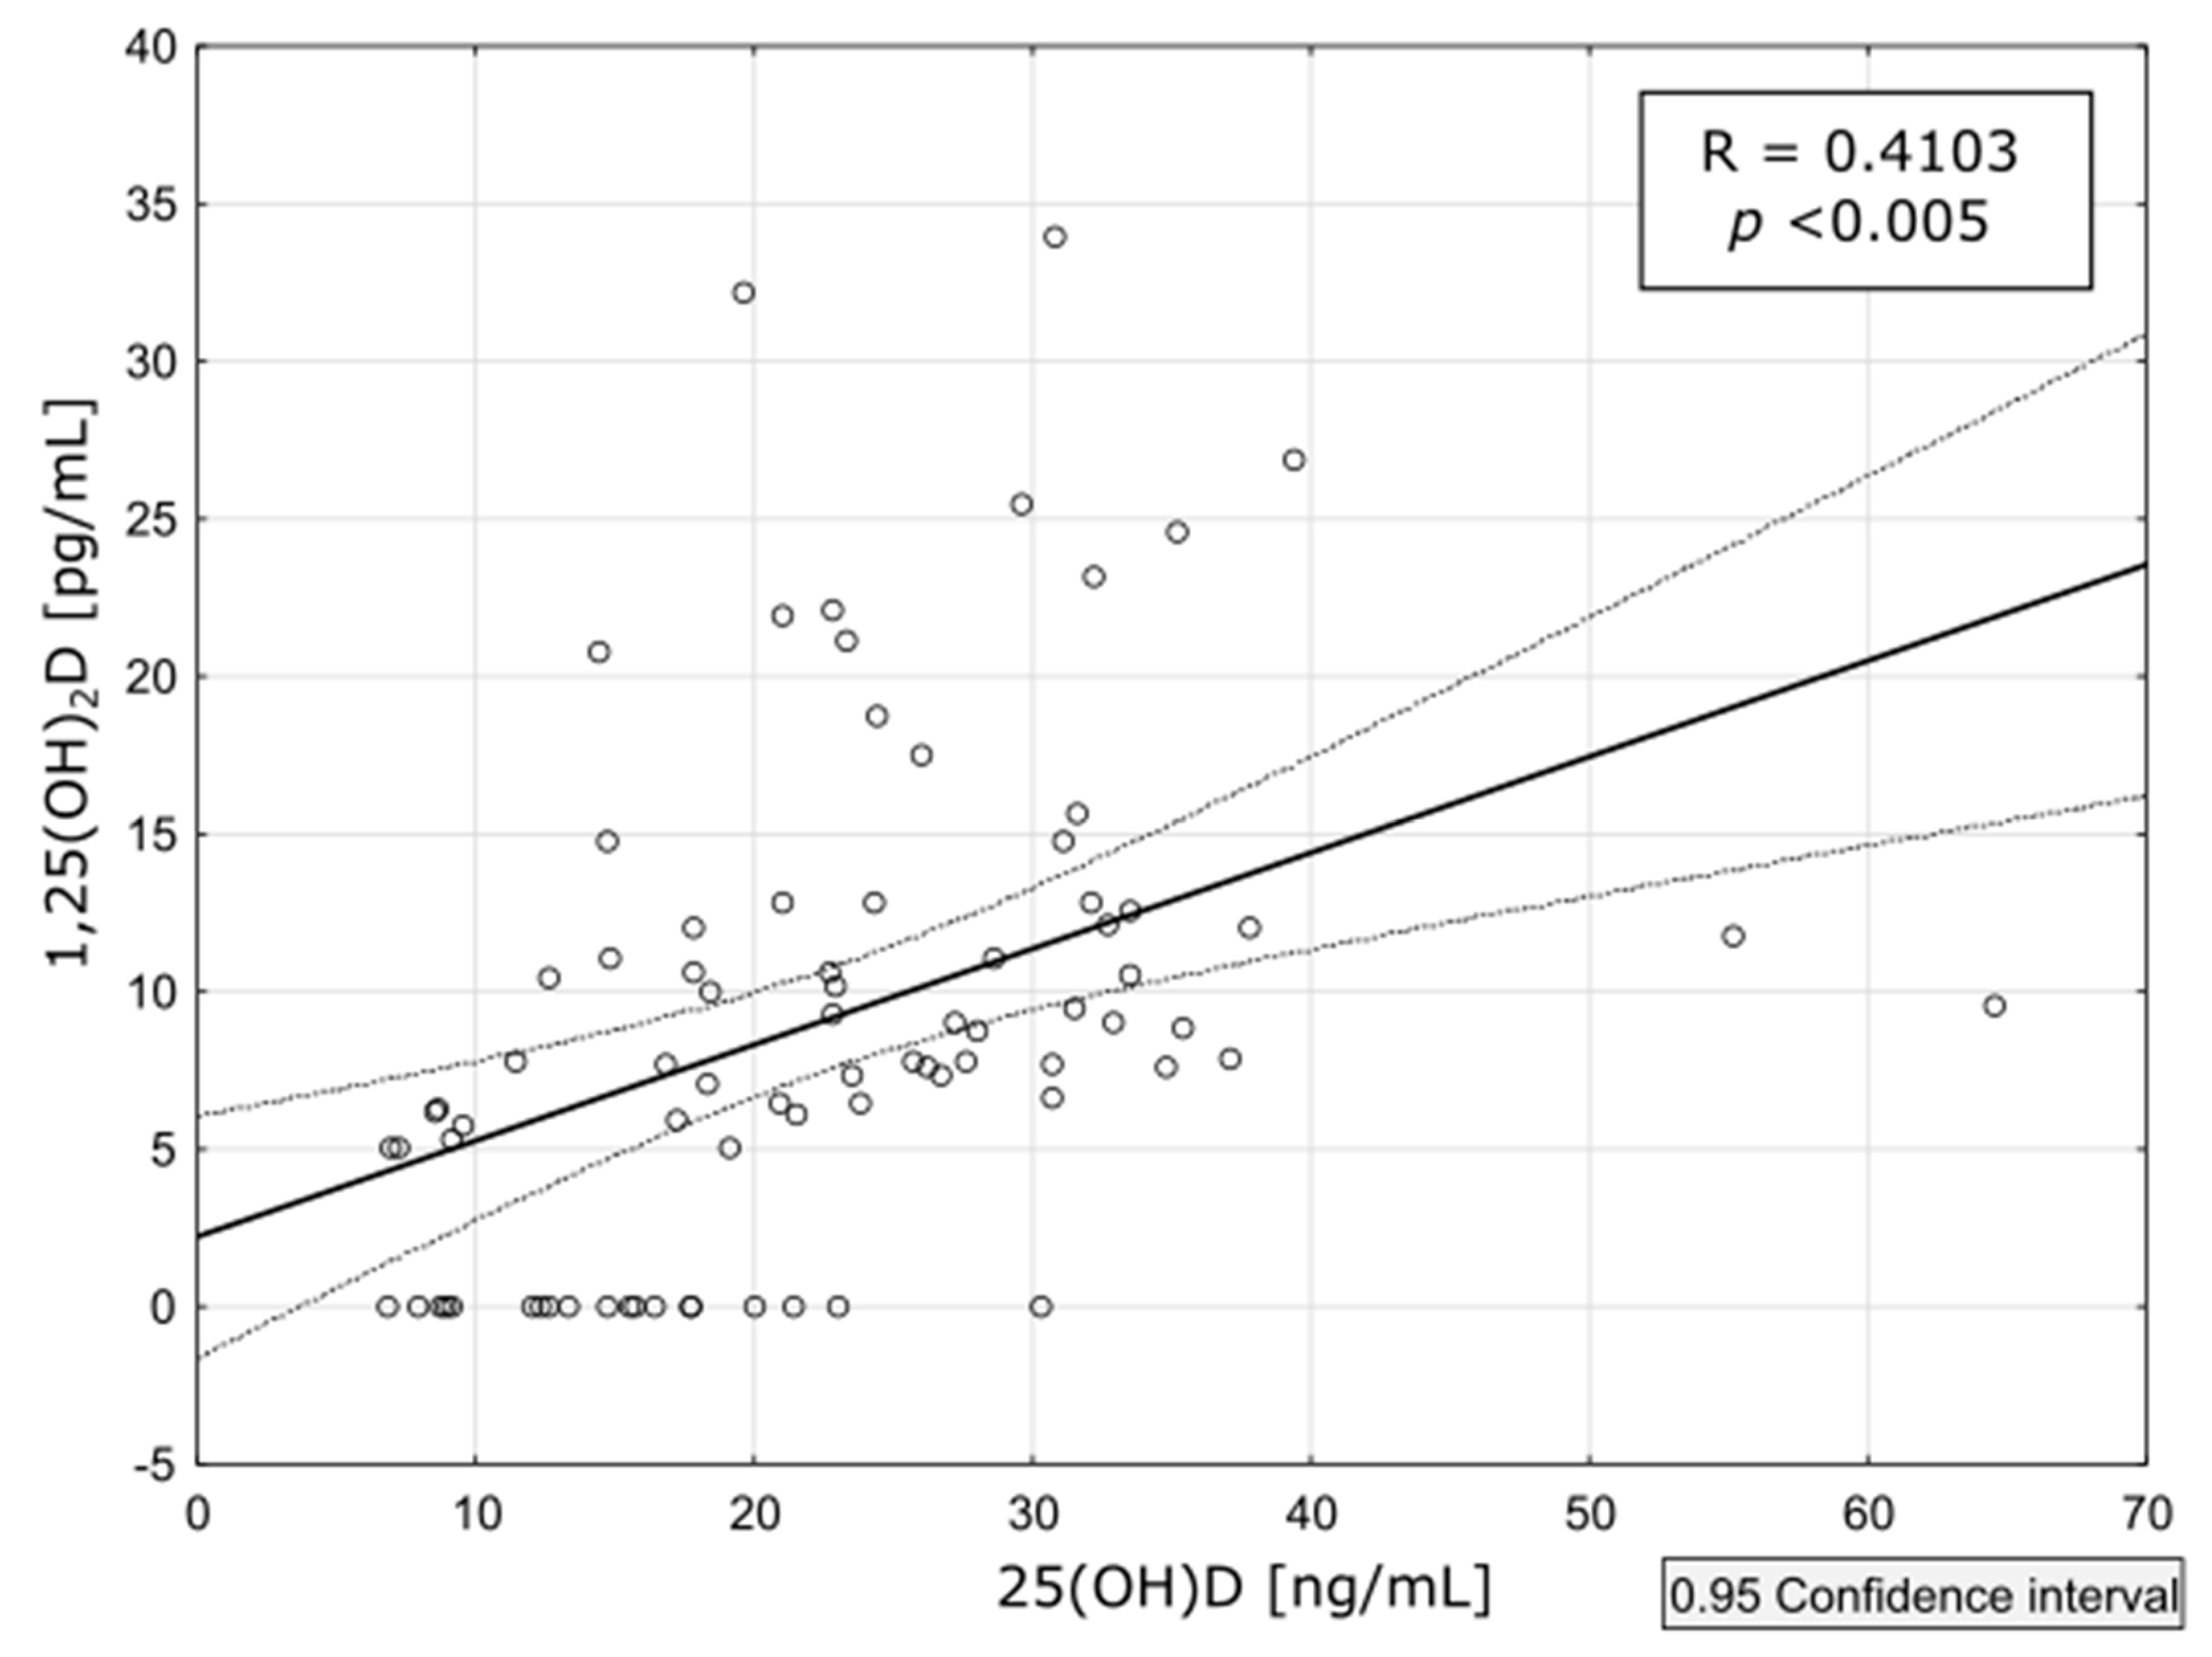
The median value increased during the observation period more than 6 times, however, only 2 patients (9.09%) achieved the lower limit of the reference range of 1,25(OH)2D, a concentration above 25 ng/mL. Moreover, a moderate correlation between 25(OH)D and 1,25(OH)2D concentrations was observed, with every 1 ng/mL increase in 25(OH)D corresponding to a 0.4 pg/mL increase in 1,25(OH)2D (r=0.4102). This proportion 1,25(OH)2D to 25(OH)D decreased with a higher 25(OH)D concentration level: for 25(OH)D concentrations below 30 ng/mL, the ratio was 0.60, and for levels above 30 ng/mL, it was 0.399. The correlation is shown on Figure 4.

3.4. PTH Levels

The intact PTH concentrations did not change significantly during the observation period. Data is shown in Table 2 and Figure 3A.

3.5. Safety Assessment

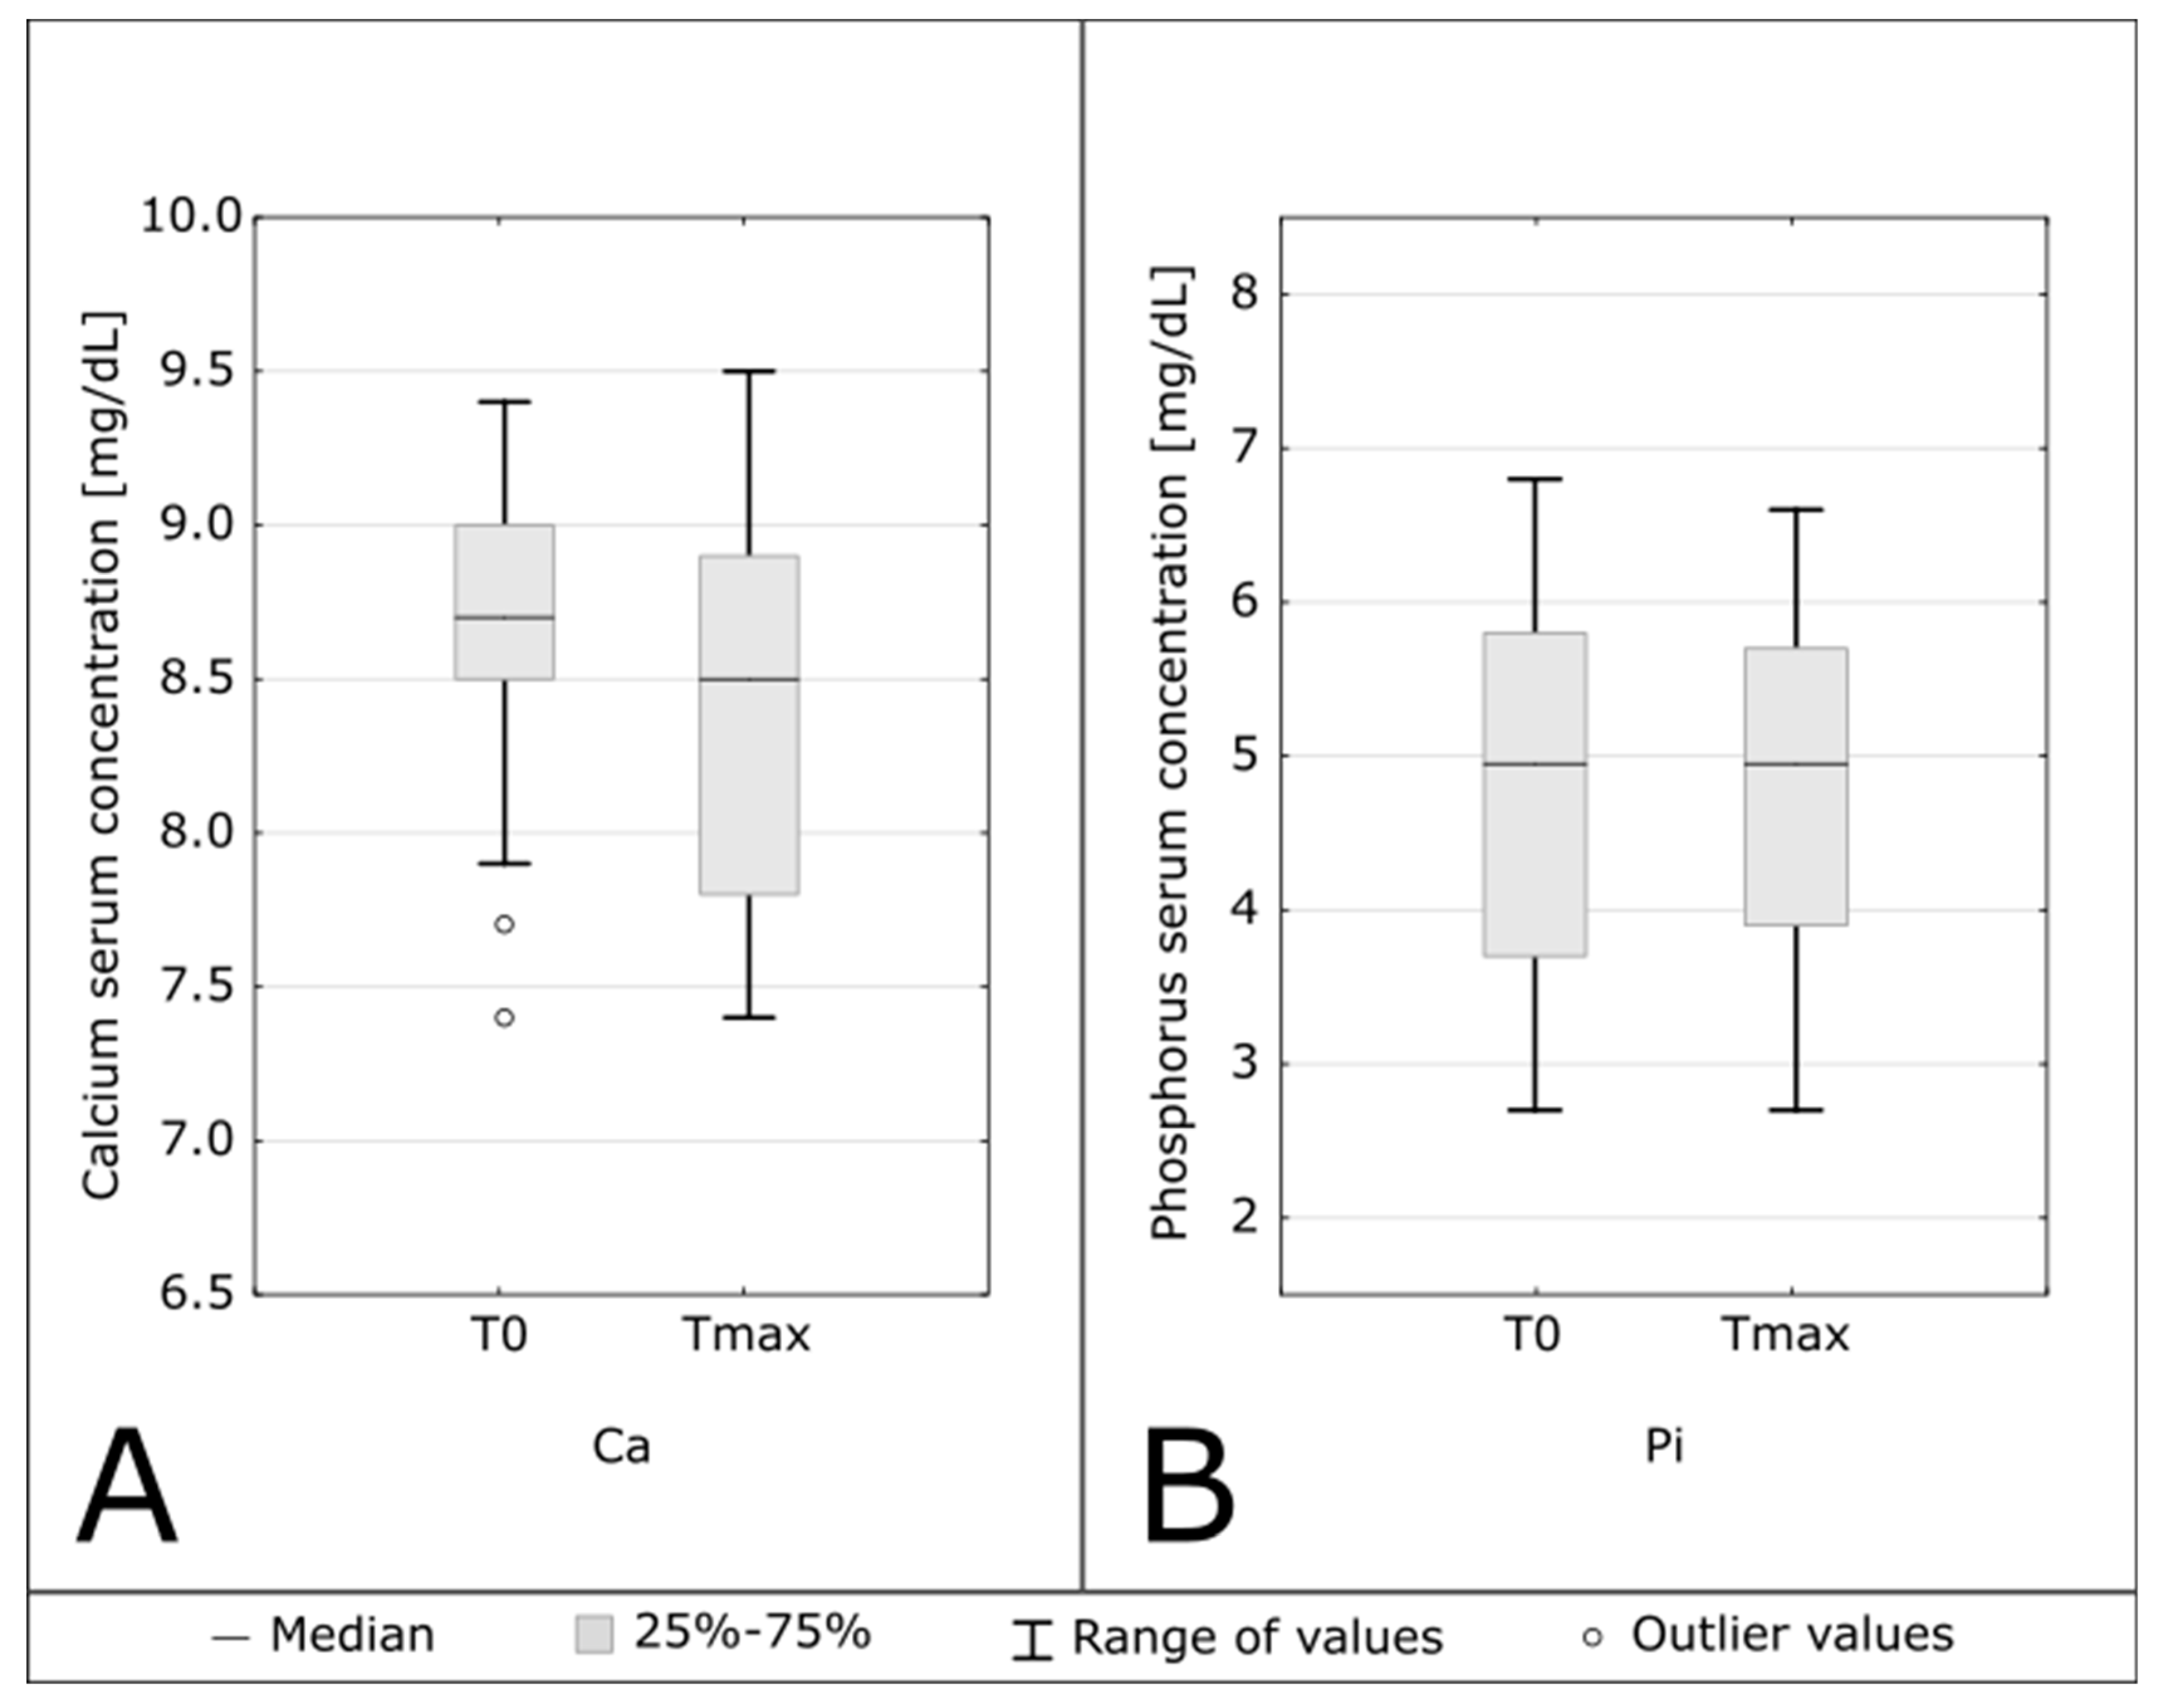
No episodes of hypercalcemia were noticed throughout the observation period, and calcium levels did not increase. 14 of 22 patients (63.63%) had hyperphosphatemia before treatment inclusion. During follow-up, serum phosphorus concentrations were stable and only 1 new episode of hyperphosphatemia was observed. Patients had stable serum phosphorus concentrations, while the group with baseline hyperphosphatemia even experienced a decrease in phosphorus of 2.73%+/-13% on average. During follow-up, the number of patients with hyperphosphatemia decreased from 14 to 12 patients (giving a decrease of 14.3%). Table 2 and Figure 5 present data showing calcium and phosphorus concentrations.

4. Discussion

Our study confirms the high prevalence of vitamin D insufficiency and deficiency in patients with CKD undergoing HD therapy. 74% of patients in our center showed 25(OH)D level below 30 ng/mL. Irrespectively of the factors related with age, gender, race, obesity, some additional factors like impaired metabolism, prescribed dietary restrictions, and decreased sun exposure contribute to a low vitamin D status in CKD patients. Despite this unique situation, guidelines for HD patients are very imprecise, limited to suggesting correction of insufficiency or deficiency using treatment strategies recommended for the general population [11]. Therefore, even though the use of cholecalciferol in HD patients has been studied and implemented for years, variable doses and dosing schedules were used resulting in variable effects in correcting vitamin D status.
The aim of this study was to check the effectiveness and safety of therapy with maximum recommended therapeutic dose of cholecalciferol allowed in the general population. According to the Central and Eastern European Expert Consensus Statement published in 2022, a therapeutic dose up to 10,000 IU of cholecalciferol daily may be used [6]. This dose also corresponds to the maximal physiologic dose rate per day (250 µg), that can be roughly acquired per day through exposure of whole body skin to sun for 30 minutes [17,18].
Cholecalciferol was administred to patients 3 times a week after each dialysis (20,000 IU + 20,000 IU + 30,000 IU of Devikap®). We have demonstrated effective rapid increase of 25(OH)D level > 30 ng/mL in a mean time of 2.86 weeks. Over 80% patients reached sufficient levels after 4 weeks of cholecalciferol input. However, there were patients requiring longer management up to 9 weeks. 25(OH)D levels significantly increased from 13.75 to 35.72 ng/mL. The literature data regarding doses’ timing, and efficacy are very divergent. In many studies the weekly dose was lower than in our study. Mieczkowski et al. proved that even small doses of cholecalciferol, 6,000 IU/week, resulted in a significant rise in medians of 25(OH)D levels after 2 months from 11.3 to 37.5 ng/mL, with sufficient, constant levels in 100% HD patients [19]. This type of effectiveness has not been proven in other studies. Matuszkiewicz et al. showed the rise in 25(OH)D levels from 12.9 to 31.3 ng/mL using 12,000 IU/per week for 13 weeks, and achieving levels >30 ng/mL in 60% of HD patients [13]. Tokmak et al. used a dosing regimen with 20,000 IU cholecalciferol given weekly and mean 25(OH)D levels increased from 6.7 to 31.8 ng/mL at 26 weeks, however only 57% HD patients became vitamin D sufficient [20]. Interestingly, Massart et al. obtained a similar effect using a dose of 25,000 IU weekly for only 13 weeks and reached normalization of 25(OH)D levels in 61%, even though the total dose of cholecalciferol was 2 times lower, most likely because the initial levels were higher (17.1 ng/mL at baseline, 35.2 ng/mL in final) [21]. However, Jean et al. with a higher total dose, 100,000 IU of cholecalciferol given monthly, for 15 months reached the levels > 30 ng/mL in 91% of patients [22]. There is also data on the effectiveness of higher doses and the more rapid correction of vitamin D status in HD patients. Wasse et al. conducted a study with cholecalciferol of 200,000 IU/week for 3 weeks, the mean 25(OH) levels increased from 13.3 to 52.4 ng/mL and 90.5% of subjects achieved serum 25(OH)D concentrations above 30 ng/mL [14]. Recently, Guella et al. was administered 300,000 IU monthly for 9 months. Serum levels of 25(OH)D increased significantly from 14.9 ng/mL to 39.6 ng/mL, and sufficient levels were obtained in 82.6% of the patients [16]. There are also regimens following the dose – response approach with the dose adjusted to 25(OH)D levels. Descombes et al. used an initial dose of 6,000 IU per week for 2 months, and then individualized dose (2,000 – 12,000/week adjusted to the level), after 12 months 86% patients had 25(OH)D levels in the target range of 30-60 ng/mL [23]. Huish et al. used a 25(OH)D level adjusted dose of 40,000 IU per week followed by 20,000 fortnightly and successfully maintaining serum levels between 30-60 ng/mL [24]. Matias et al., using the dose 50,000 IU/per week or 10,000 IU per week depending on the degree of deficiency, and maintenance dose 2,700 IU/ 3 x per week in vitamin D sufficiency, achieved 25(OH)D levels >30 ng/ml in 94% patients at the end of 60-month study [25]. It seems that effectiveness may rely on the total dose, lower doses require a longer time to achieve a similar effect, and regimens that assume 25(OH)D monitoring and dose adjustment may be also effective.
Our regimen demonstrated to correct vitamin D status with relatively low total doses. The 90th percentile for the total, cumulative dose to achieve the target 25(OH)D concentration was 420,000 IU of cholecalciferol, the total doses ranged from 70,000 IU to 630,000 IU. Similar effectiveness with a comparable proportion (at least 80%) of patients achieving levels > 30 ng/ml, was demonstrated in the studies with the total doses of 600,000 IU, 1,600,000 IU, 2,700,000 IU, and also in studies with dose to level adjusted regimens [14,16,22,23,24]. Anyhow, it is difficult to compare the total doses with the latter. Moreover it is possible that the total dose to achieve correction of 25(OH)D depends on the initial levels. Armas et al. tried to quantify 25(OH)D response to cholecalciferol in HD patients, and reported the rise 0.56 ng/mL in 25(OH)D level per 40 IU cholecalciferol input per day, however the findings did not seem to be easily adopted to clinical practice [26]. There are also reports on the use of doses adjusted for body weight, however low weekly doses 100 IU/kg were used and only 27% of initially vitamin D deficient dialysis patients achieved a level >30 ng/m after 26 weeks [27]. Moreover it is difficult to make conclusions about clinical effects in HD patients as patients on peritoneal dialysis and on calcitriol therapy were included to this study.
Regular monitoring of patients calcium, phosphorus was done to assess safety. Our regimen was safe, without incidents of hypercalcemia, and the rise in phosphorus level which is consistent with the literature data, even when the highest doses of native vitamin D were used [14,16]. Hypercalcemia does, however, usually not occur at 25(OH)D concentrations below 150 ng/mL, and until active vitamin D analogs are used [28,29]. Interestingly we observed a decrease in calcium levels and the number of patients with hyperphosphatemia decreased. A similar effect was showed in the study of Matias et al. [25].
The prevailing opinion is that PTH lowering with cholecalciferol in patients with CKD is unproven and clinically insignificant. As in most of the studies, we did not demonstrate the effect on PTH levels [13,19,20]. Hypothetically higher doses of cholecalciferol and/or longer treatment time is necessary to decrease PTH. Jean et al. and Guella et al. demonstrated a decrease in PTH levels using pulse doses of 100,000 IU monthly and 300,000 IU monthly, respectively. The above effect was achieved after 1 and 9 months respectively [16,22]. On the other hand, Wasse et al. using pulse doses of 200,000 IU/per week for 3 weeks did not observe significant decrease in PTH [14]. It also does not seem that the decrease in PTH depended on the achieved 25(OHD) levels. In some studies, a decrease in PTH was achieved with 25(OH)D levels reaching about 40 ng/mL [16,22,25], whereas the others did not demonstrate the effect on PTH even with 25(OH)D concentration of about 50 ng/mL [14,24]. There are also a number of studies showing improvement in PTH control with cholecalciferol, in which HD patients on active vitamin D analogues were not excluded [25,27,30,31]. Actually the effect on PTH may also be dependent on the secondary hyperparathyroidism severity and higher levels of 25(OH)D are required, or the PTH decrease depends on the 1,25(OH)2D correction.
According to literature findings we demonstrated significant increase of active vitamin D - 1,25(OH)2D levels, when 25(OH)D levels were corrected. This confirms that correction of vitamin D deficiencies definitely contributes to the formation of active vitamin D in HD patients, and 1α-hydroxylase deficiency originated from renal tissue is not the clue problem in renal insufficiency, as was believed, since the presence of extra-renal 1-α-hydroxylase results in the production of the active form of vitamin D, 1,25(OH)2D, calcitriol, in HD patients. It is worth noting that the initial concentrations of 1,25(OH)2D were undetectable in many of our patients. Despite of the increase (4.35 to 13.78 pg/mL), the mean levels remained under the laboratory norm (25–86.5 pg/mL), and in only 2 patients 1,25(OH)2D levels reached laboratory norms. Likewise in most of other studies although, significant rise in of 1,25(OH)2D was reported, the levels did not reach the normal values [13,16,19,22]. Perhaps the levels of 1,25(OH)2D, higher but still far below the normal range, explain the lack of episodes of hypercalcemia and hyperphosphatemia, and no effect on PTH in our study. This issue should be the subject of further research.
The main limitations of our study are the relatively small number of patients and short-term observation. The latter should be borne in mind, given the fact vitamin D, being fat-soluble, can accumulate and maintain an action in time.
The study’s strength was the administration of cholecalciferol under supervision at the dialysis unit which ensured good compliance. Another unique strength of the study was that the patients did not take the active form of vitamin D or vitamin D analogues many months before and during the study. Thus, the observed effect could be attributed solely to the cholecalciferol administration. Finally, our study provides real-life data reflecting a relatively diverse cohort of an average dialysis unit. The fact that all subjects achieved the recommended 25(OH)D target, makes our observation readily applicable to any other population of HD patients.

5. Conclusions

In conclusion, our study showed that the administration of a high therapeutic dose of cholecalciferol allowed for a quick, effective and safe leveling of 25(OH)D concentration in HD patients. The significant rise in 1,25(OH)2D and no impact on PTH levels was also shown. Further studies are necessary to determine the safety of high dose cholecalciferol in long-term use, as well as target levels of 25(OH)D with satisfactory impact on 1,25(OH)2D and PTH levels.

Author Contributions

For Conceptualization, A.T. and L.T.; methodology, A.T., M.K., B.B, S.M., M,J., M.D. and L.T.; validation, M.J., M.D., S.M., B.B. and L.T.; formal analysis, M.K. and M.D.; investigation, A.T., M.K., A.Z., B.B., K.J., N.P., M.J., S.M.; writing—original draft preparation, A.T., M.K.; writing—review and editing, B.B., A.D.-Ś., M.J. and S.M. ; visualization, M.K.; supervision, A.D.-Ś. and L.T. All authors have read and agreed to the published version of the manuscript.

Funding

This research received no external funding.

Institutional Review Board Statement

The study was conducted in accordance with the Declaration of Helsinki, and approved by Medical University of Gdańsk Ethical Committee (NKBBN/783/2022), 9.12.2022.

Informed Consent Statement

Informed consent was obtained from all subjects involved in the study.

Data Availability Statement

The data are available from the corresponding authors upon reasonable request.

Conflicts of Interest

The authors declare no conflict of interest.

References

  1. Cao, M.; He, C.; Gong, M.; Wu, S.; He, J. The Effects of Vitamin D on All-Cause Mortality in Different Diseases: An Evidence-Map and Umbrella Review of 116 Randomized Controlled Trials. Front. Nutr. 2023, 10, 1132528. [Google Scholar] [CrossRef] [PubMed]
  2. Chowdhury, R.; Kunutsor, S.; Vitezova, A.; Baena, C. P.; Prabhakaran, D.; Hoshen, M. B.; Feldman, B. S.; Pan, A.; Johnson, L. Vitamin D and Risk of Cause Specific Death : Systematic Review and Meta-Analysis of Observational Cohort and Randomised Intervention Studies. BMJ (Clinical research ed.), 2014, 348, g1903. [CrossRef]
  3. Pilz, S.; Iodice, S.; Zittermann, A.; Grant, W. B.; Gandini, S. Vitamin D Status and Mortality Risk in CKD: A Meta-Analysis of Prospective Studies. Am. J. Kidney Dis. 2011, 58, 374–382. [Google Scholar] [CrossRef] [PubMed]
  4. Jean, G.; Souberbielle, J. C.; Chazot, C. Vitamin D in Chronic Kidney Disease and Dialysis Patients. Nutrients. 2017, 9, 328. [Google Scholar] [CrossRef] [PubMed]
  5. Tylicki, P.; Polewska, K.; Och, A.; Susmarska, A.; Puchalska-Reglí nska, E.; Parczewska, A.; Biedunkiewicz, B.; Szabat, K.; Renke, M.; Tylicki, L.; et al. Angiotensin Converting Enzyme Inhibitors May Increase While Active Vitamin D May Decrease the Risk of Severe Pneumonia in SARS-CoV-2 Infected Patients with Chronic Kidney Disease on Maintenance Hemodialysis. Viruses. 2022, 14(3), 451. [Google Scholar] [CrossRef]
  6. Pludowski, P.; Takacs, I.; Boyanov, M.; Belaya, Z.; Diaconu, C. C.; Mokhort, T.; Zherdova, N.; Rasa, I.; Payer, J.; Pilz, S. Clinical Practice in the Prevention, Diagnosis and Treatment of Vitamin D Deficiency: A Central and Eastern European Expert Consensus Statement. Nutrients. 2022, 14, 1483. [Google Scholar] [CrossRef]
  7. Kim SM, Choi HJ, Lee JP, Kim DK, Oh YK, Kim YS, L. C. Prevalence of Vitamin D Deficiency and Effects of Supplementation with Cholecalciferol in Patients with Chronic Kidney Disease. J Ren Nutr. 2014, 24, 20–25. [Google Scholar] [CrossRef] [PubMed]
  8. Jankowska, M.; Szupryczyńska, N.; Dębska-Ślizień, A.; Borek, P.; Kaczkan, M.; Rutkowski, B.; Małgorzewicz, S. Dietary Intake of Vitamins in Different Options of Treatment in Chronic Kidney Disease: Is There a Deficiency? Transplant. Proc. 2016, 48, 1427–1430. [Google Scholar] [CrossRef]
  9. Jankowska, M.; Rutkowski, B.; Dębska-Ślizień, A. Vitamins and Microelement Bioavailability in Different Stages of Chronic Kidney Disease. Nutrients. 2017, 9, 282. [Google Scholar] [CrossRef]
  10. Jean, G.; Terrat, J. C.; Vanel, T.; Hurot, J. M.; Lorriaux, C.; Mayor, B.; Chazot, C. Evidence for Persistent Vitamin D 1-Alpha-Hydroxylation in Hemodialysis Patients: Evolution of Serum 1,25-Dihydroxycholecalciferol after 6 Months of 25-Hydroxycholecalciferol Treatment. Nephron. Clin. Pract. 2008, 110, c58–65. [Google Scholar] [CrossRef]
  11. Kidney Disease: Improving Global Outcomes (KDIGO) CKD-MBD Update Work Group. KDIGO 2017 Clinical Practice Guideline Update for the Diagnosis, Evaluation, Prevention, and Treatment of Chronic Kidney Disease-Mineral and Bone Disorder (CKD-MBD). Kidney Int. Suppl. 2017, 7, 1–59. [CrossRef]
  12. Płudowski, P.; Kos-kudła, B.; Walczak, M.; Fal, A.; Jackowska, T.; Helwich, E.; Mazur, A. Guidelines for Preventing and Treating Vitamin D Deficiency : A 2023 Update in Poland. Nutrients. 2023, 15(3), 695. [Google Scholar] [CrossRef]
  13. Matuszkiewicz-Rowińska, J.; Kulicki, P.; Zebrowski, P.; Klatko, W.; Sokalski, A.; Niemczyk, S.; Wypych-Birecka, M.; Małyszko, J. Cholecalciferol vs. Small Doses of Alfacalcidol vs. Placebo in Chronic Kidney Disease Patients on Hemodialysis: A Randomized Parallel Group Study. Front. Med. 7811. [Google Scholar] [CrossRef]
  14. Wasse, H.; Huang, R.; Long, Q.; Singapuri, S.; Raggi, P.; Tangpricha, V. Efficacy and Safety of a Short Course of Very-High-Dose Cholecalciferol in Hemodialysis. Am. J. Clin. Nutr. 2012, 95, 522–528. [Google Scholar] [CrossRef] [PubMed]
  15. Tangpricha, V.; Wasse, H. Vitamin D Therapy in Kidney Disease: More Vitamin D Is Necessary. Am. J. Kidney Dis. 2014, 64, 667–669. [Google Scholar] [CrossRef] [PubMed]
  16. Guella, A.; Abduelkarem, A. R.; Hassanein, M. M. The Effects and Safety of High Dose Vitamin D3 in Hemodialysis Patients. Pharm. Pract. (Granada). 2023, 21, 2773. [Google Scholar] [CrossRef] [PubMed]
  17. Vieth, R. Vitamin D Supplementation: Cholecalciferol, Calcifediol, and Calcitriol. Eur. J. Clin. Nutr. 2020, 74, 1493–1497. [Google Scholar] [CrossRef] [PubMed]
  18. Cicarma, E.; Porojnicu, A. C.; Lagunova, Z.; Dahlback, A.; Juzeniene, A.; Moan, J. Sun and Sun Beds : Inducers of Vitamin D and Skin Cancer. Anticancer Res. 2009, 29, 3495–3500. [Google Scholar] [PubMed]
  19. Mieczkowski, M.; Żebrowski, P.; Wojtaszek, E.; Stompór, T.; Przedlacki, J.; Bartoszewicz, Z.; Sierdziński, J.; Wańkowicz, Z.; Niemczyk, S.; Matuszkiewicz-Rowińska, J. Long-Term Cholecalciferol Administration in Hemodialysis Patients: A Single-Center Randomized Pilot Study. Med. Sci. Monit. 2014, 20, 2228–2234. [Google Scholar] [CrossRef] [PubMed]
  20. Tokmak, F.; Quack, I.; Schieren, G.; Sellin, L.; Rattensperger, D.; Holland-letz, T.; Weiner, S. M.; Rump, L. C. High-Dose Cholecalciferol to Correct Vitamin D Deficiency in Haemodialysis Patients. Nephrol Dial Transpl. 2008, 23 (July), 4016–4020. [Google Scholar] [CrossRef]
  21. Massart, A.; Debelle, F. D.; Racape, J.; Gervy, C.; Husson, C.; Dhaene, M.; Wissing, K. M.; Nortier, L. Original Investigation Biochemical Parameters After Cholecalciferol Repletion in Hemodialysis: Results From the VitaDial Randomized Trial. Am J Kidney Dis. 2014, 64, 696–705. [Google Scholar] [CrossRef]
  22. Jean, G.; Souberbielle, J.C.; Chazot, C. Monthly Cholecalciferol Administration in Haemodialysis Patients : A Simple and Efficient Strategy for Vitamin D Supplementation. Nephrol Dial Transpl. 2009, 24, 3799–3805. [Google Scholar] [CrossRef]
  23. Descombes, E.; Fellay, B.; Hemett, O. M.; Magnin, J. L.; Fellay, G. Oral Postdialysis Cholecalciferol Supplementation in Patients on Maintenance Hemodialysis: A Dose-Response Approach. Int. J. Nephrol. 2014, 30–39. [Google Scholar] [CrossRef]
  24. Huish, S. A.; Jenkinson, C.; Dunn, J. A.; Meredith, D. J.; Bland, R.; Hewison, M. Low Serum 1,25(OH)2D3 in End-Stage Renal Disease : Is Reduced 1α-Hydroxylase the Only Problem ? Endocr. Connect. 2021, 10, 1291–1298. [Google Scholar] [CrossRef] [PubMed]
  25. Matias, P. J.; Laranjinha, I.; Ávila, G.; Azevedo, A.; Jorge, C.; Ferreira, C.; Aires, I.; Amaral, T.; Gil, C.; Ferreira, A. Long-Term Cholecalciferol Supplementation in Hemodialysis Patients: Effects on Mineral Metabolism, Inflammation, and Cardiac Parameters. Semin. Dial. 2023, 36, 29–36. [Google Scholar] [CrossRef] [PubMed]
  26. Armas, L. A. G.; Andukuri, R.; Barger-Lux, J.; Heaney, R. P.; Lund, R. 25-Hydroxyvitamin D Response to Cholecalciferol Supplementation in Hemodialysis. Clin. J. Am. Soc. Nephrol. 2012, 7, 1428–1434. [Google Scholar] [CrossRef] [PubMed]
  27. Zitt, E.; Sprenger-Mähr, H.; Mündle, M.; Lhotta, K. Efficacy and Safety of Body Weight-Adapted Oral Cholecalciferol Substitution in Dialysis Patients with Vitamin D Deficiency. BMC Nephrol. 2015, 16, 128. [Google Scholar] [CrossRef] [PubMed]
  28. Marcinowska-Suchowierska E, Kupisz-Urbańska M, Łukaszkiewicz J, Płudowski P, J. G. Vitamin D Toxicity – A Clinical Perspective. Front Endocrinol (Lausanne). 2018, 20, 550. [CrossRef]
  29. Brandenburg, V.; Ketteler, M. Vitamin D and Secondary Hyperparathyroidism in Chronic and the Future. Nutrients, 2022, 14, 3009. [CrossRef]
  30. Marckmann, P.; Agerskov, H.; Thineshkumar, S.; Bladbjerg, E. M.; Sidelmann, J. J.; Jespersen, J.; Nybo, M.; Rasmussen, L. M.; Hansen, D.; Scholze, A. Randomized Controlled Trial of Cholecalciferol Supplementation in Chronic Kidney Disease Patients with Hypovitaminosis D. Nephrol. Dial. Transplant. 2012, 27, 3523–3531. [Google Scholar] [CrossRef]
  31. Friedl, C.; Zitt, E. Vitamin D Prohormone in the Treatment of Secondary Hyperparathyroidism in Patients with Chronic Kidney Disease. Int J Nephrol Renov. Dis. 2017, 10, 109–122. [Google Scholar] [CrossRef]
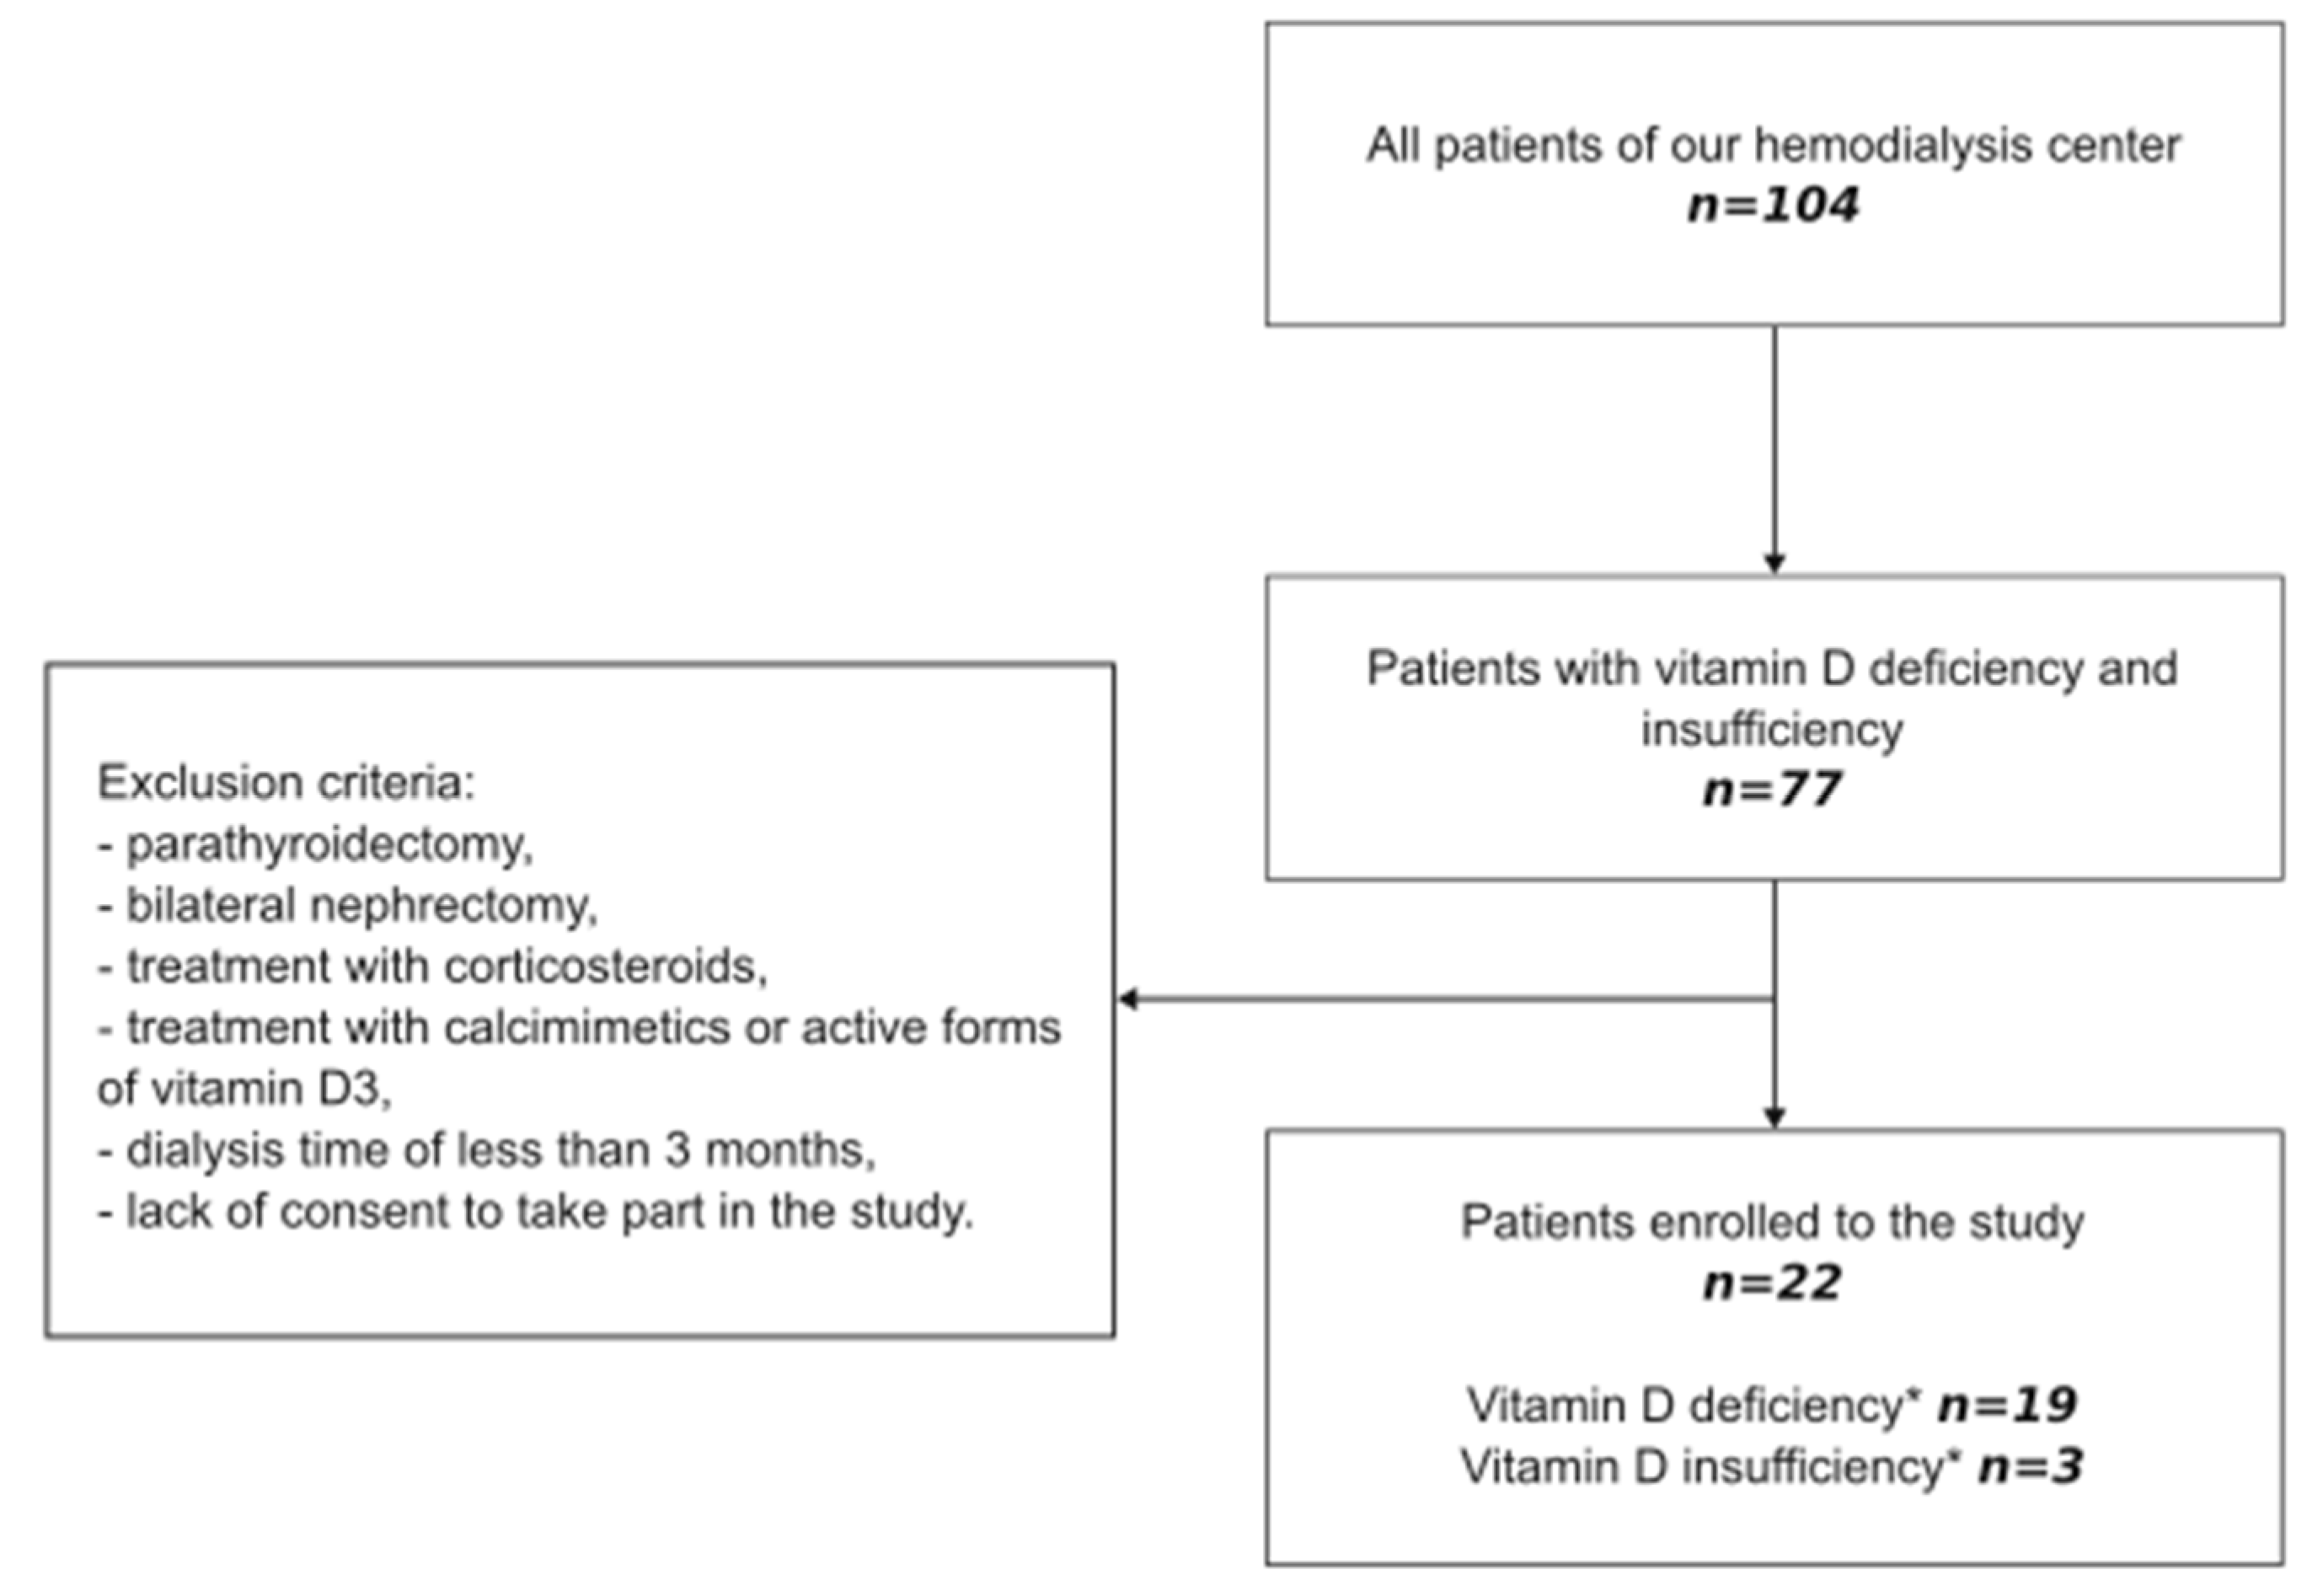
Figure 1. The flow diagram of patients selection.
Preprints 89754 g001
Figure 2. Number of patients who reached the target 25(OH)D concentration (bars) and the cumulative dose of cholecalciferol (line).
Preprints 89754 g002
Figure 3. Serum concentrations of intact parathormone (iPTH, part A), calcidiol (25(OH)D, part B), and calcitriol (1,25(OH)2D, part C) before supplementation (T0) and after reaching the target serum 25(OH)D concentration (Tmax).
Preprints 89754 g003
Figure 4. Correlation between serum concentrations of calcidiol (25(OH)D), and calcitriol (1,25(OH)2D) during the therapy with cholecalciferol.
Preprints 89754 g004
Figure 5. Serum concentrations of calcium (Ca, part A), and phosphorus (Pi, part B) before supplementation (T0) and after reaching the target serum calcidiol concentration (Tmax).
Preprints 89754 g005
Table 1. Characteristics of the study group.
Gender (Men/Women) 16/6
Causes of ESRD (n/%)
Ischemic nephropathy/ no histology 5 / 22.7
Autosomal dominant polycystic kidney disease 4 / 18.2
Diabetic nephropathy in type 2 diabetes/no histology 6 / 27.7
Glomerulonephritis/no histology 2 / 9.1
Chronic hypertensive nephropathy/no histology 1 / 4.5
Congenital renal malformation 1 / 4.5
Unknown 2 / 9.1
Age (years) 72.5 (67–81)
Charlson Comorbidity Index (points) 8 (2–14)
Dialysis vintage (months) 25.0 (12–56)
Body Mass Index (kg/m2) 25.27 (22.50–28.76)
Table 2. Comparison of parameters at the starting point of the study (T0) and at the point of achieving the target 25(OH)D concentration (Tmax).
Parameters T0 Tmax p
25(OH)D [ng/mL] 13.05 (9.00–17.90) 32.9 (31.4–35.4) <0.001
1,25(OH)2 D [pg/mL] 0.00 (0.00–6.38) 6.37 (8.11–15.60) <0.001
iPTH [pg/mL] 373.50 (247–558) 236 (146–537.5) 0.70
Calcium [mg/dL] 8.7 (8.5–9.0) 8.5 (7.8–8.9) 0.048
Phosphorus [mg/dL] 4.95 (3.7–5.8) 4.95 (3.9–5.7) 0.68
Serum CaxP [mg2/dL2] 48.778 (42.416–52.7) 43.7 (36.16–48.36) 0.046
T0, before supplementation; Tmax, at the time when 25(OH)D concentration reached level above 30 ng/mL.
Disclaimer/Publisher’s Note: The statements, opinions and data contained in all publications are solely those of the individual author(s) and contributor(s) and not of MDPI and/or the editor(s). MDPI and/or the editor(s) disclaim responsibility for any injury to people or property resulting from any ideas, methods, instructions or products referred to in the content.
Copyright: This open access article is published under a Creative Commons CC BY 4.0 license, which permit the free download, distribution, and reuse, provided that the author and preprint are cited in any reuse.
Prerpints.org logo

Preprints.org is a free preprint server supported by MDPI in Basel, Switzerland.

Subscribe

© 2024 MDPI (Basel, Switzerland) unless otherwise stated