1. Introduction
The construction industry, as one of the major energy-consuming industries in China, plays a crucial role in achieving the dual carbon goals through its low-carbon development. To address this issue, building photovoltaics, with their efficient carbon reduction effect, have become an important green building measure for achieving building low-carbonization. The Ministry of Housing and Urban-Rural Development and the National Development and Reform Commission issued the Carbon Peaking Plan for the Urban and Rural Construction Field, which clearly outlines the carbon reduction targets and paths for China's urban and rural construction, aiming to achieve a coverage rate of 50% for new public institutional buildings and new factory building roofs with rooftop photovoltaics by 2025, and to retrofit existing public building roofs with solar photovoltaic systems.
Compared to general civil buildings, industrial plants have a more diverse and rich range of structural forms in the treatment of building space, with larger roof areas, single roof forms, favorable lighting conditions, and better conditions for the installation of solar photovoltaic panels. Industrial buildings have high self-energy consumption and production energy consumption, and also cause a large amount of pollution to the environment. The installation of photovoltaic power generation systems can help reduce the self-energy consumption and carbon emissions of industrial plants.
Moreira M.O [
1] proposed a new method based on artificial neural networks (ANN) to forecast solar power generation in the next week using an ANN ensemble. The Design of experiments (DOE) method was applied to photovoltaic time series factors and ANN factors. She then conducted cluster analysis to select the best network. The versatility of the proposed method allows for changes in experimental arrangements, prediction models, and the number of factors used in the required prediction range, thereby enhancing the determinacy of the prediction. Mellit A [
2] studied and compared the application of different types of deep learning neural networks (DLNNs) in short-term power output prediction for solar photovoltaic power generation. The results showed that the DLNNs studied had good accuracy. Gong Diyang [
3] utilized a multi-scale regional solar power prediction method based on sequence encoding reconstruction to maintain a good multi-scale regional solar power prediction effect under conditions of limited data and low data collection costs. Compared to the naive prediction method, the accuracy of the proposed model was improved. Othman M.M [
4] proposed an artificial intelligence method using artificial neural networks (ANN) and random forests (RF) for short-term photovoltaic (PV) output current prediction (STPCF) for the next 24 hours. The Levenberg-Marquardde optimization technique was used as the backpropagation algorithm for the ANN, and bagging-based bootstrapping technique was used in the RF to improve the prediction results.
2. Research and Analysis of Industrial Plants in Ningxia
The Ningxia Hui Autonomous Region, located in the middle and upper reaches of the Yellow River in northwestern China, is situated between latitude 35°14′-39°23′and longitude 104°17′′-107°39′. The region enjoys abundant solar radiation and solar energy resources. The average sunshine duration can reach 2180 to 3080 hours, with a solar radiation rate of 60% to 70%. The rich solar resources in Ningxia are due to its geographical location and climate conditions, which provide a unique advantage for the development of solar energy industry in Ningxia.
2.1. Analysis of Total Annual Horizontal Surface Radiation in Yinchuan Area
In this paper, meteorological data from Yinchuan, the capital city of the Ningxia Hui Autonomous Region, were selected and analyzed using PVsyst software to obtain the monthly horizontal irradiance and annual horizontal total irradiance in the Yinchuan area, as shown in
Table 1.
The development of building-integrated photovoltaics (BIPV) in the Ningxia region is relatively late, but in recent years, with the support of policies and the advancement of technology, BIPV has achieved some achievements. Currently, some large-scale buildings in the Ningxia region have adopted BIPV technology, such as the library of the new campus of Ningxia University and the Ningxia Autonomous Region People's Hospital. In addition, the Ningxia region has also issued a series of policies to encourage and support the development of BIPV, such as the "Ningxia Hui Autonomous Region Solar Photovoltaic Power Generation Application Plan".
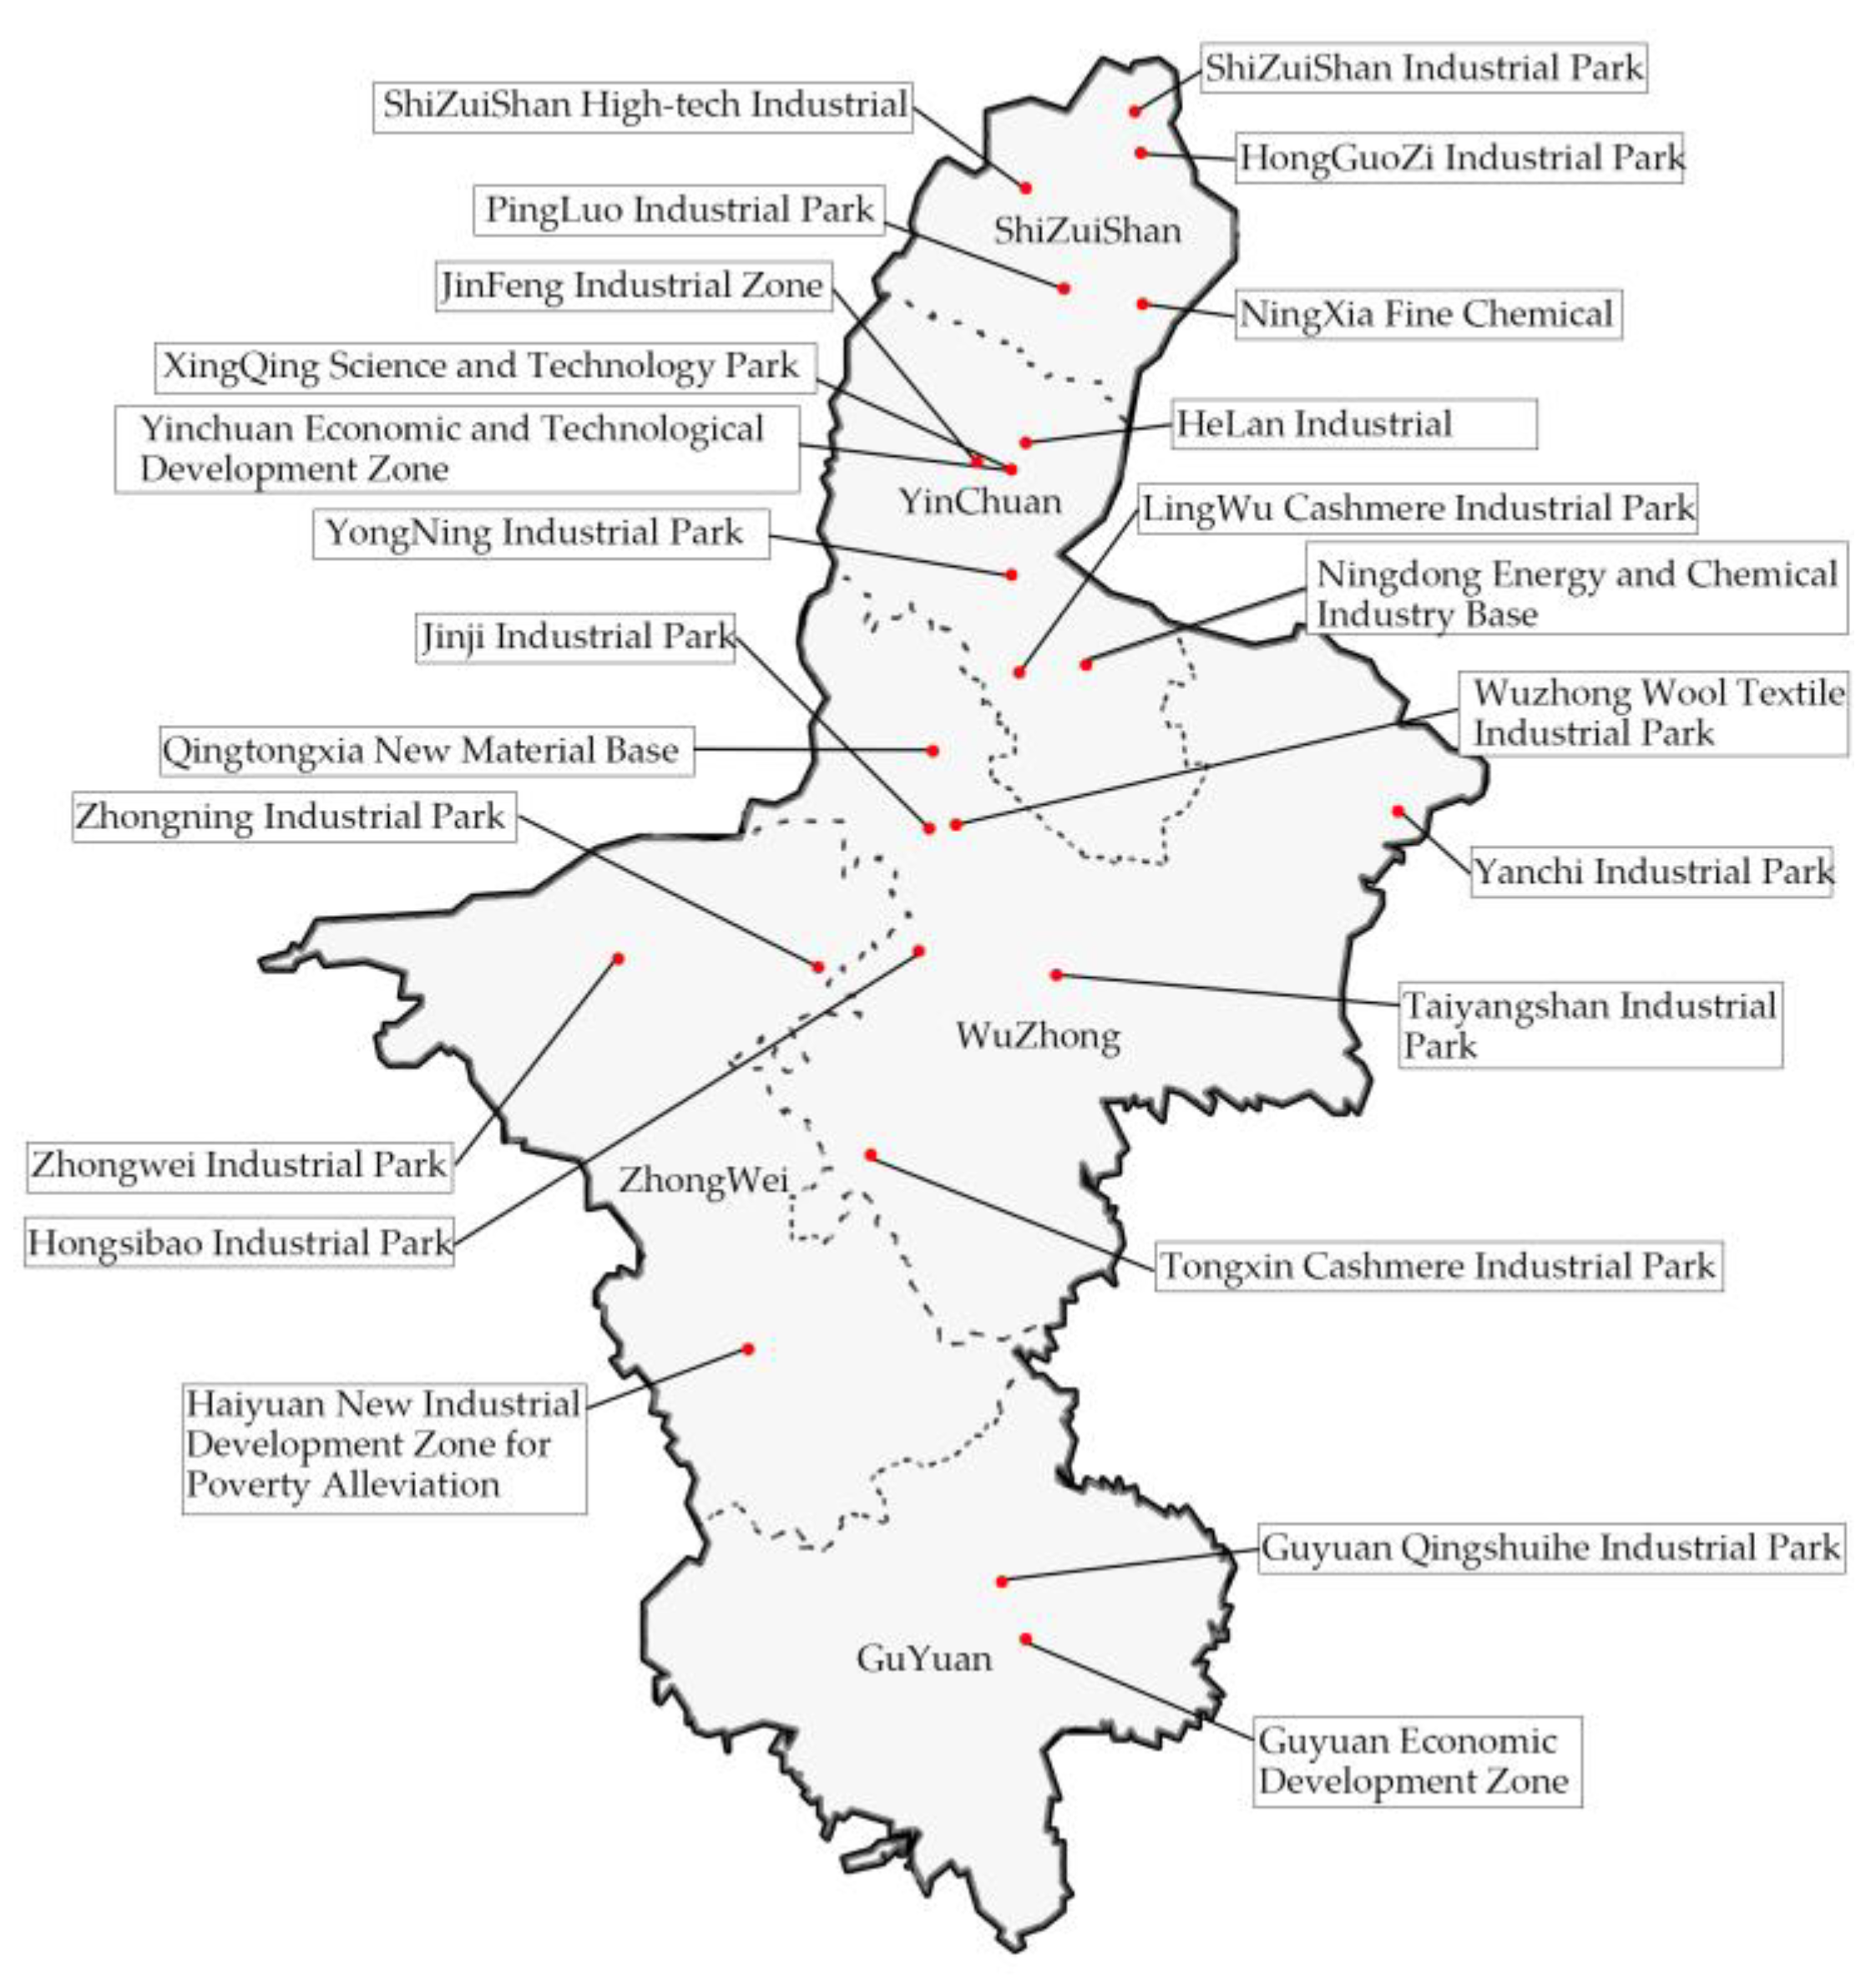
Figure 1.
Distribution of industries in Ningxia
Figure 1.
Distribution of industries in Ningxia
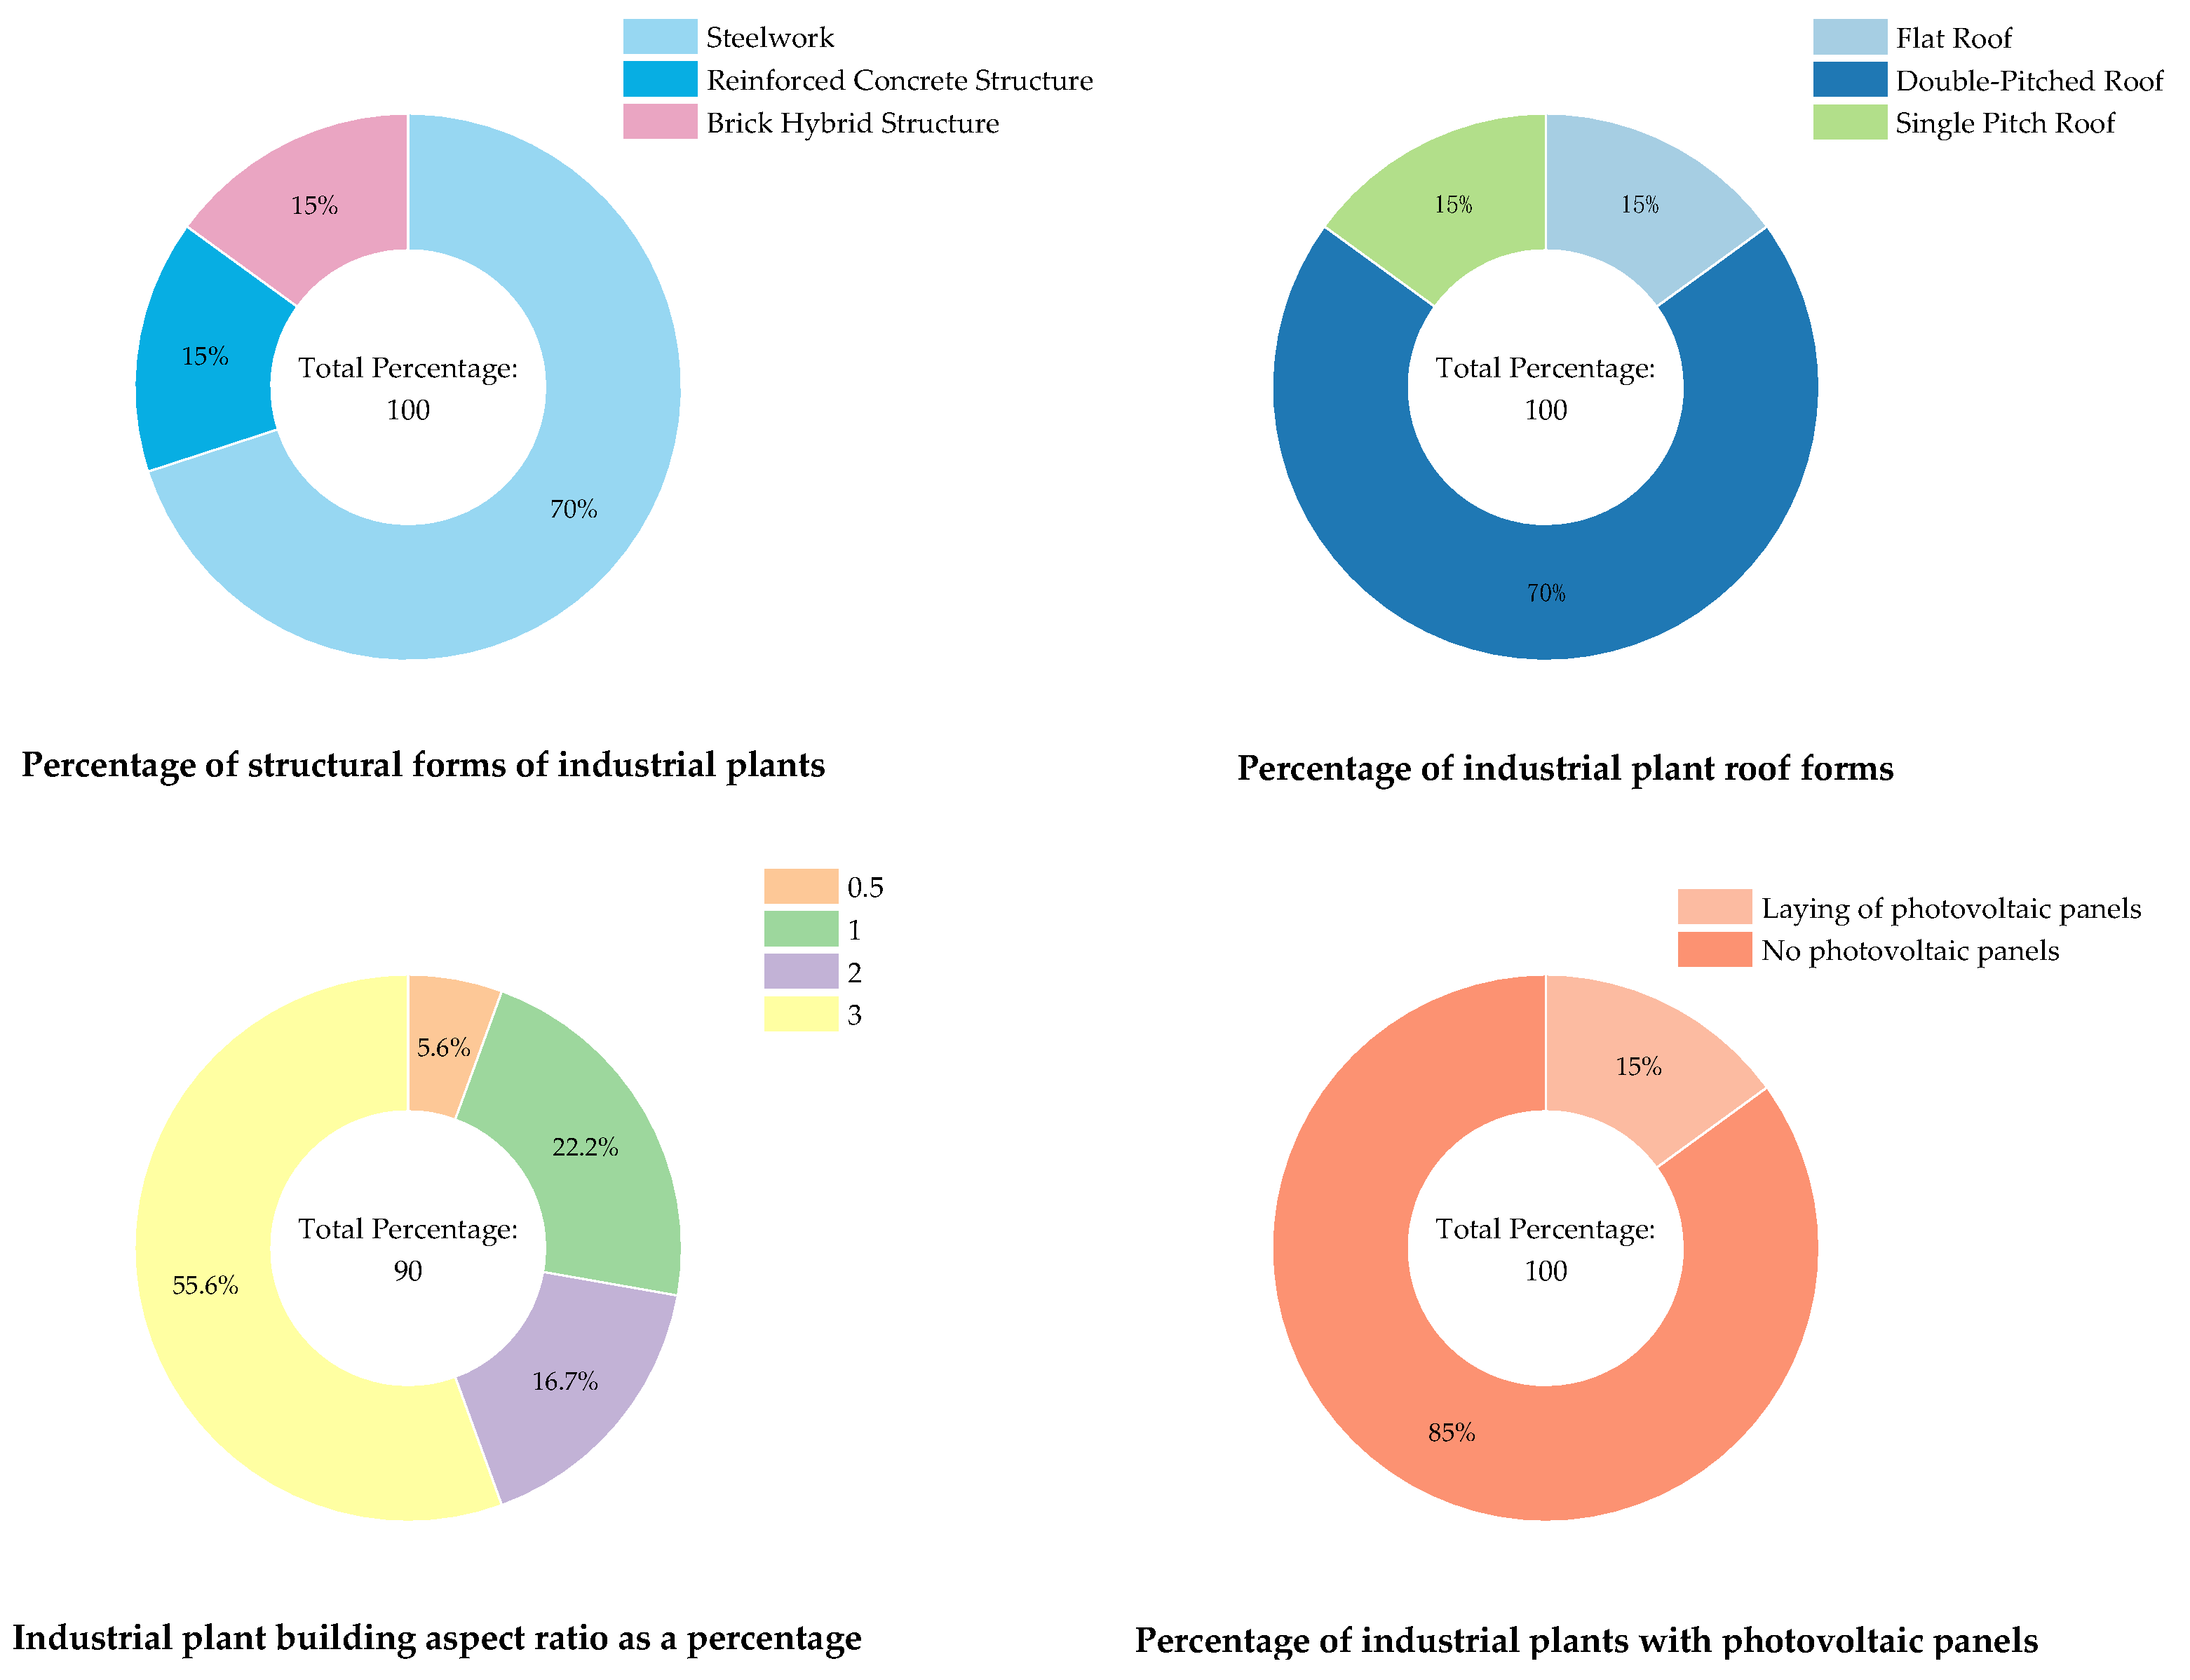
By analyzing the industrial plant buildings in the Ningxia region in
Figure 2, it can be seen that the steel structure type accounts for 70% of the industrial plant structures in the Ningxia region, making it the main structure form. In terms of roof form, 70% of the roof forms are double slope roofs with a roof slope of about 15°. In terms of building width-to-height ratio, the buildings with a width-to-height ratio of 3:1 account for 55.6%. Only 15% of the buildings have installed photovoltaic panels, and 85% of the buildings have not installed solar photovoltaic power generation systems. Therefore, based on the survey and analysis of industrial plant buildings in the Ningxia region, the basic information of industrial plant buildings in four aspects is statistically summarized, and the industrial plant buildings will be modeled from these four aspects in the next section. The dominant forms are extended based on the data ratio in the survey results, and the photovoltaic power generation amount and carbon emissions of different forms of industrial plant buildings are compared. By using neural network optimization algorithms, new reference data and theoretical basis are provided for the optimization design of industrial plant buildings.
3. Analysis of Factors Affecting Photovoltaic Power Generation in Industrial Plants
3.1. Plant Aspect Ratio
The height-to-width ratio of a building is the ratio of its height to width, and serves as a reinforcement index for building height. It is a macroscopic control of the structural stiffness, overall stability, load-bearing capacity, and economic rationality of buildings. It reflects the selection standards of buildings from a more stringent perspective [
5]. Philip Mckeen [
6] conducted research on the energy consumption of different height-to-width ratios in diverse residential buildings in Canadian cities and concluded that the height-to-width ratio is one of the most important factors determining energy efficiency. Nelson Y.O.Tong [
7] conducted research on the relationship between building height-to-width ratio and pollutant gas emissions and found a correlation with building heating.
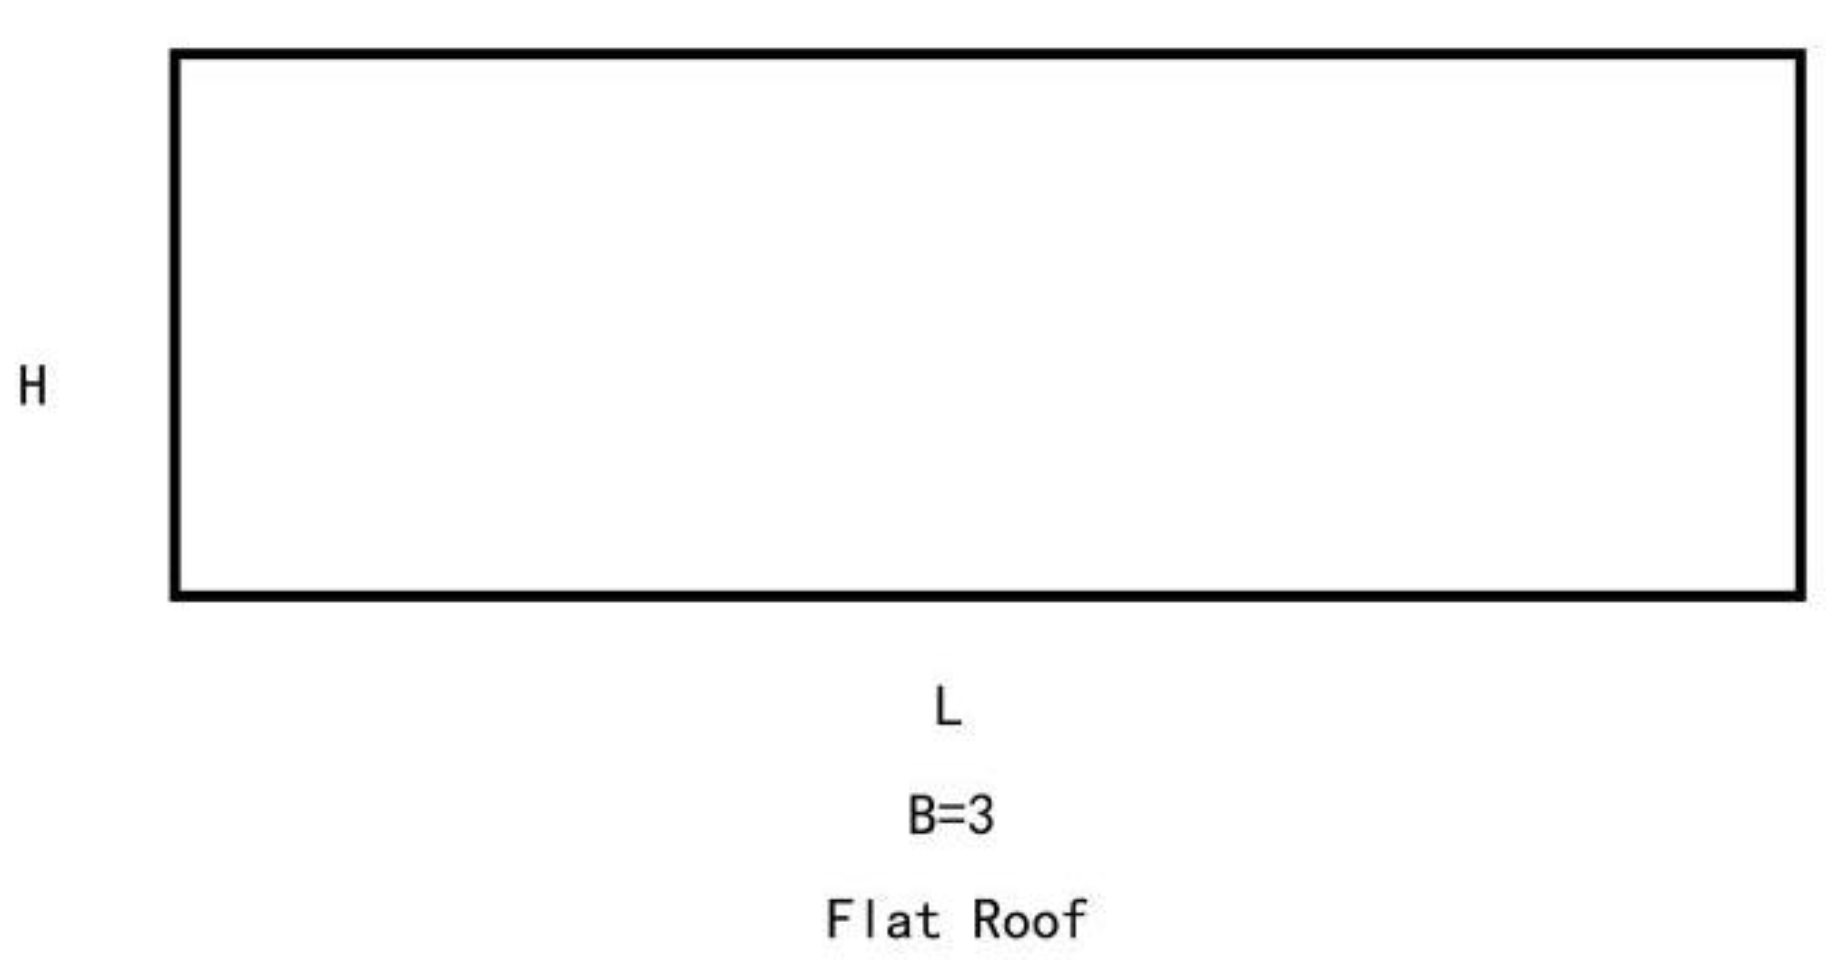
In this study, the width-to-height ratio of the factory walls, B, is divided into four cases: B=3, B=2, B=1, and B=0.5, as shown in
Figure 3, with a flat roof.
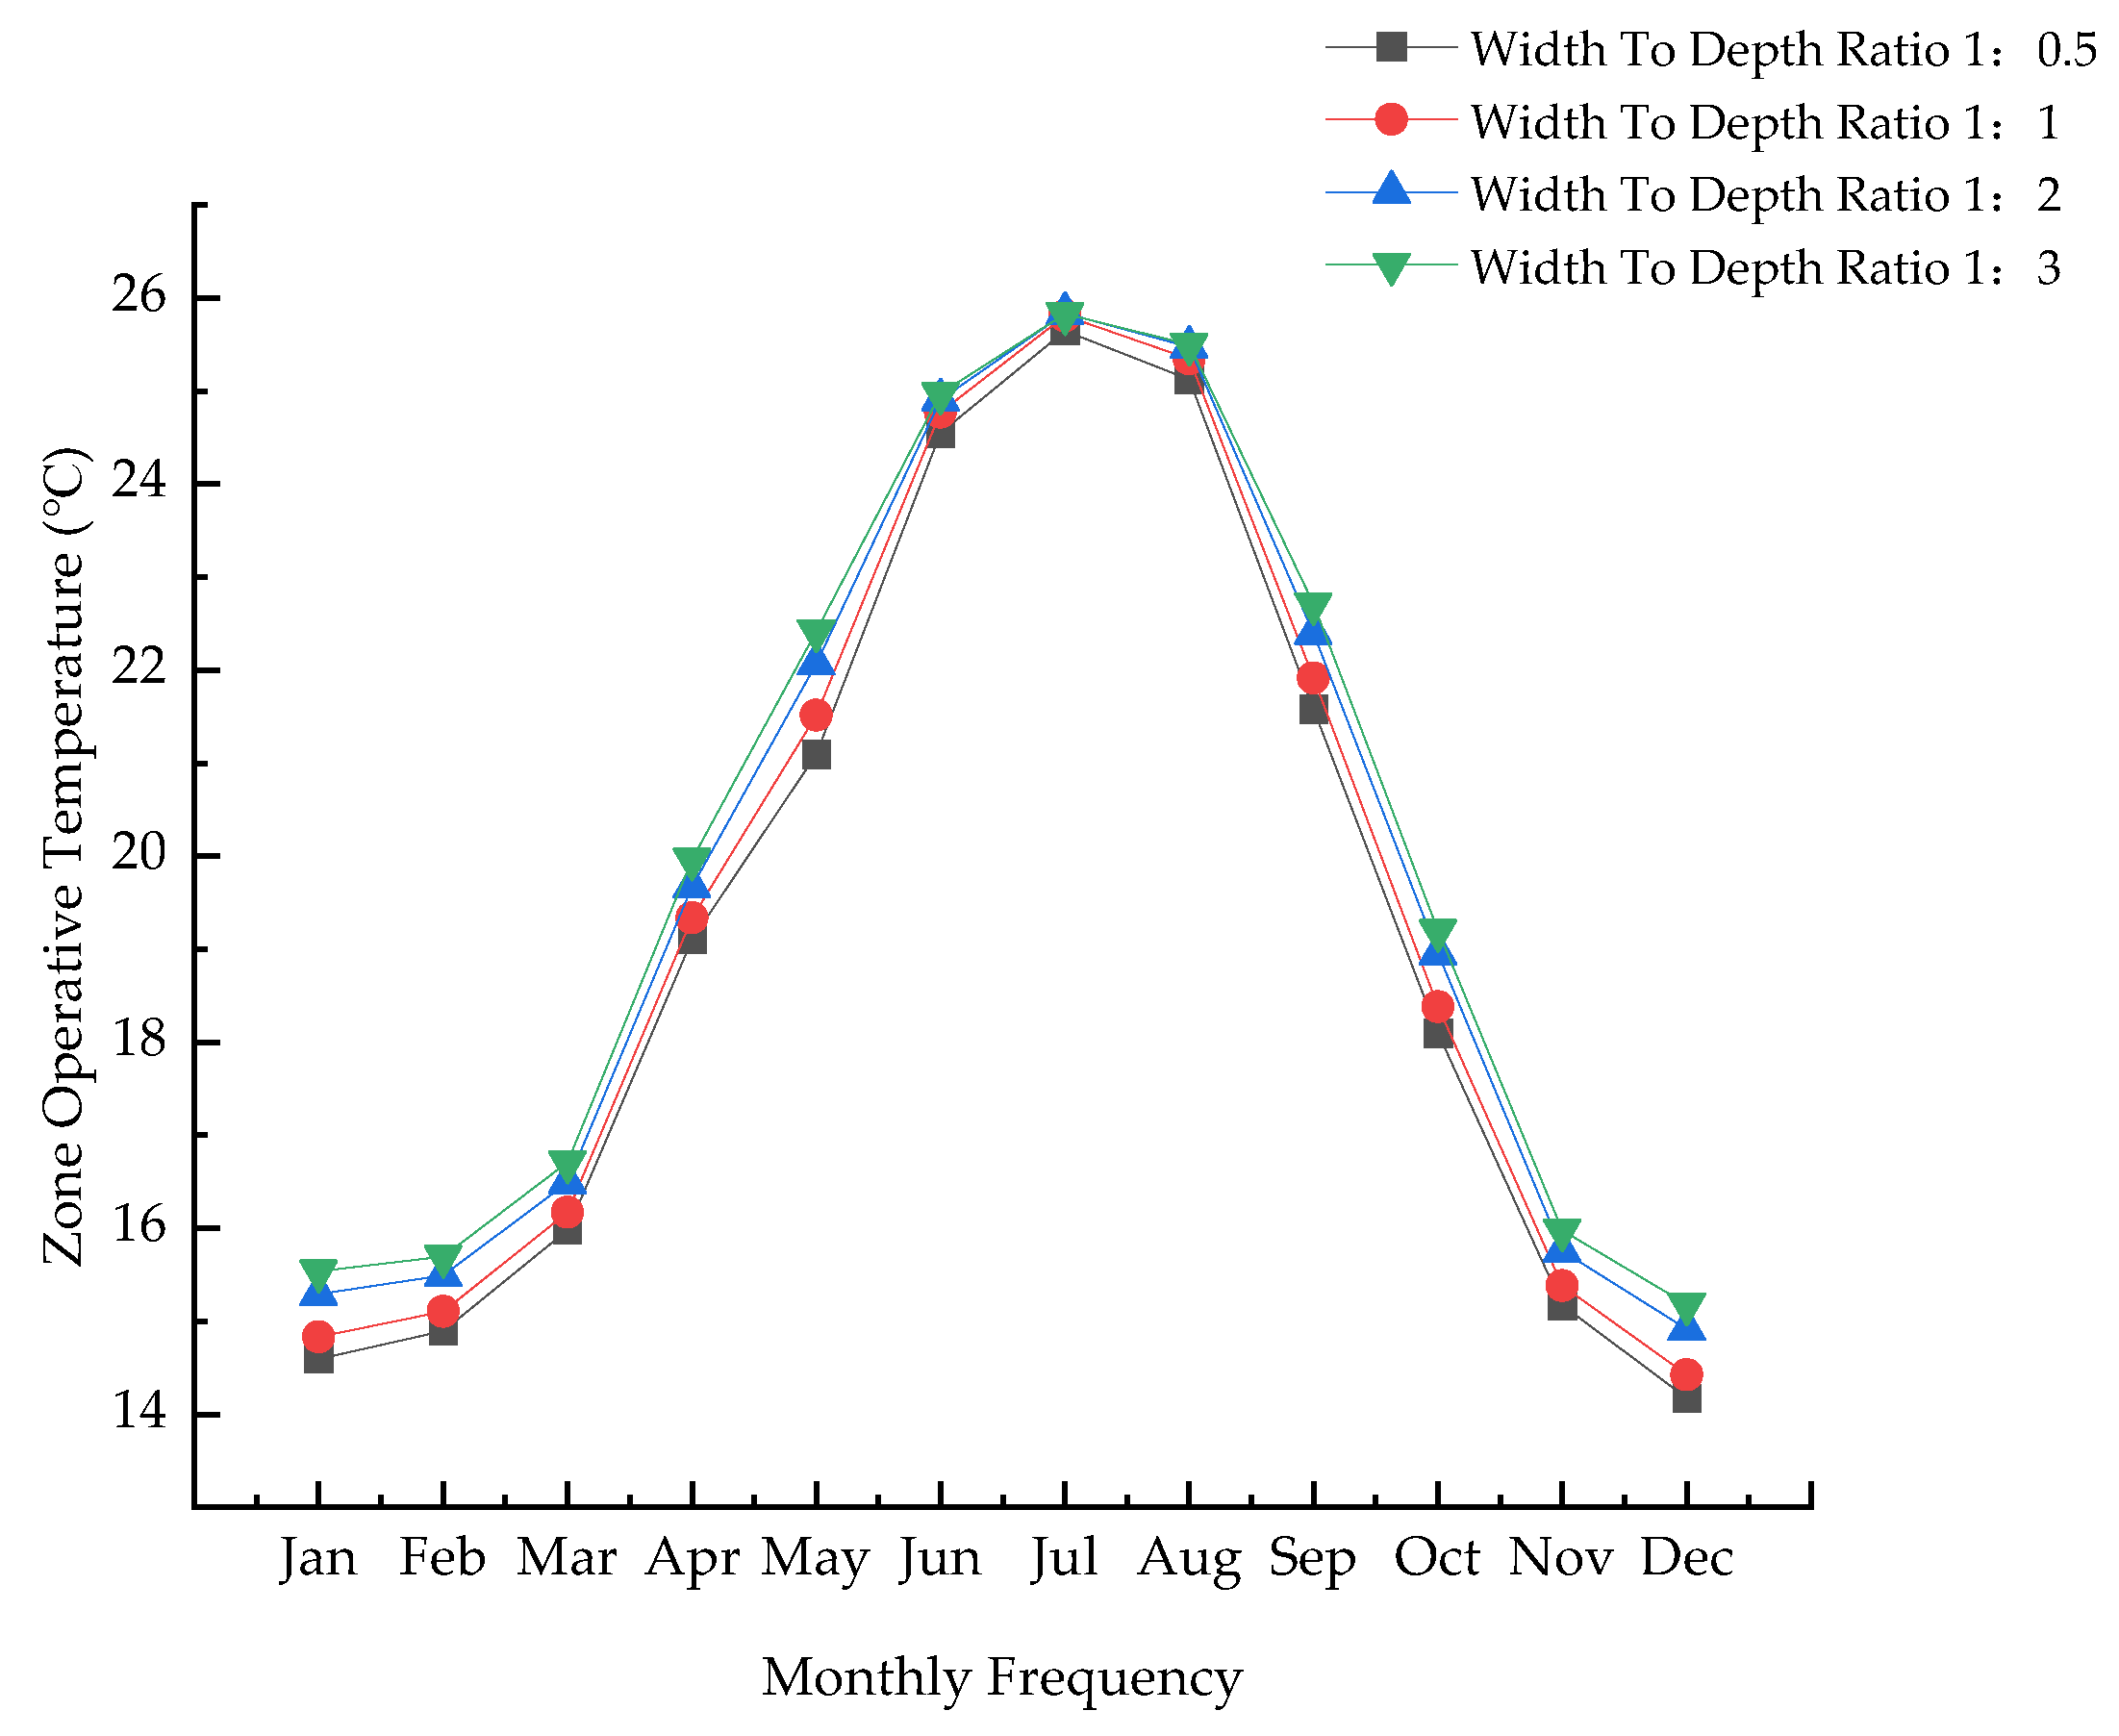
Based on the variable of the width-to-height ratio of factory walls, B, divided into four cases: B=3, B=2, B=1, and B=0.5, and a flat roof, window-to-wall ratio of 0.3, and other factors kept constant, a modeling analysis was carried out. The simulated model building length was 50m, width L=15m, and height was divided into three heights, H=5m, H=7.5m, and H=15m, according to different width-to-height ratios. From the analysis results, it can be seen that when the wall width-to-height ratio of the building is B=3 (building width of 15 meters and height of 5 meters), the average indoor temperature in the space environment is better than the other two width-to-height ratios, especially when the external environment temperature is low, with better insulation effect. When the external environment temperature is high, the indoor temperature control is lower, as shown in
Figure 4.
3.2. Roof Forms
Industrial plant roof forms mainly include flat roofs, sloping roofs, domes, multi-span roofs, and multi-gable roofs. Common industrial plant roof forms mainly include flat roofs, double slope roofs, and domes, which are similar in terms of the installation of solar photovoltaic panels. The main factors affecting their power generation efficiency are the roof slope (radius) and azimuth angle. Therefore, based on the results of
Section 2.1 with a width-to-height ratio of B=3, studies were conducted on flat roof and sloping roof industrial plants, and domed industrial plants were not described in detail.
3.2.1. Sloping Roof
Double-pitched industrial plants with roof slopes of 10°, 20°, and 30°were selected as research objects, as shown in
Figure 5. The plant parameters are listed in
Table 2.
From
Table 2, it can be seen that as the slope of the industrial plant roof increases, the usable area of the roof increases, and so does the area for the installation of photovoltaic panels.
3.2.2. Flat Roof
Compared to sloped roofs, flat roofs have a single structural form. In this simulation analysis, the industrial plant with a width-to-height ratio of B=3, as shown in
Figure 6, was selected as the research object according to the experimental results in
Section 2.1. The plant parameters are listed in
Table 3.
3.3. Photovoltaic Panel Laying Methods
The two key factors that determine the photovoltaic power generation efficiency are the area of photovoltaic panel installation and the installation angle. The advantage of industrial plant roofs compared to other types of buildings is that they have enough space to install photovoltaic panels. For flat roof industrial plants, the installation forms of photovoltaic panels can be divided into flat and inclined. For other roof types with slopes, considering the structural safety, flat installation is usually adopted. Compared to the independent photovoltaic systems with tracking ability, the installation angle of building photovoltaic panels is usually kept constant and cannot be maintained in real time to achieve the maximum solar radiation [
8]. he following analysis considers the different options brought by the two installation modes, flat and inclined, for the same industrial plant roof.
3.3.1. Flat Roof Laying Methods
Based on the model in
Section 2.1, a flat roof industrial plant with a width-to-height ratio of B=3, building width of 15m, height of 5m, and length of 50m was selected as the research object. Its roof usable area is 750m
2. When installed in a flat manner, the theoretical maximum area of photovoltaic panels can reach 750m
2. When installed with an inclined angle, the area of photovoltaic panels will be affected by the spacing between photovoltaic arrays. The spacing between photovoltaic arrays D is determined by the fixed photovoltaic array spacing calculation formula [
9], as shown in equation (1).
In the calculation formula, the length L of the inclined surface of the photovoltaic panel is taken as 1.956m; β is the inclined angle of the photovoltaic panel, which is the angle between the photovoltaic panel and the horizontal plane. The best horizontal tilt angle in Yinchuan, Ningxia is 30° [
10] ; W is the latitude, and the latitude of Yinchuan, Ningxia is 38°47′. According to the formula, the spacing between photovoltaic arrays D is determined to be 4.4m, which can weaken the shading effect between photovoltaic panels. In the inclined installation mode, the theoretical maximum area of photovoltaic panels that can be installed on a 750m
2 roof is 391.2m
2.
Table 4 shows a comparison of the power generation benefits of flat roof industrial plant photovoltaic panels in flat and inclined installation modes. It can be seen from the table that the installation area of photovoltaic panels is increased by the flat installation mode compared to the inclined installation, with the annual power generation total increasing from 123109 kW·h to 201186 kW·h, while the average annual power generation of photovoltaic panels only decreases by 46.45 kW·h/m
2.
3.3.2. Sloped Roof Laying Methods
Compared to flat roof industrial plants, sloped roofs are simpler in terms of photovoltaic panel installation, and usually use a flat installation method. The power generation benefits of photovoltaic panels on sloped roofs depend on the influence of roof slope and installation area. As the slope increases, the roof area for installing photovoltaic panels also increases, as does the annual total power generation, but as the slope increases, the amount of solar radiation received by the north slope gradually decreases, and the average annual power generation per unit area shows a downward trend, as shown in
Table 5.
3.4. Azimuth
To allow photovoltaic components to receive more solar radiation, it is necessary to set appropriate tilt angle and azimuth angle. The influence of azimuth angle on power generation characteristics is derived from the changes in the direction of direct radiation in a day [
11]. Building photovoltaics usually adopt fixed photovoltaic forms, so it is necessary to consider the best orientation in a fixed state to maximize the total power generation of photovoltaics over the entire year cycle. Wei Zidong [
12] simulated the rules of solar altitude and azimuth angles in the entire year cycle in Yinchuan, Ningxia, and analyzed the annual power generation of photovoltaic panels with different tilt angles and orientations in Yinchuan. The results showed that the most advantageous orientation for photovoltaic power generation in Yinchuan is facing the south, that is, when the azimuth angle is 0°, the annual power generation is the largest among all orientations. Considering the changes in azimuth angle due to site restrictions or factory arrangements in practical projects, the relationship between the orientation of photovoltaic panels and the roof area for installing photovoltaic panels will be explored. The following will compare and analyze the relationship between the orientation of photovoltaic panels, the roof area for installing photovoltaic panels, and the annual power generation amount from azimuth angles of 0°, 15°, 30°, 45°, 60°, 75°, 90°, 105°, 120°, 135°, 150°, 165°, and 180°, and calculate the photovoltaic power generation amount using Pvsyst software.
3.4.1. Flat Roof Azimuth
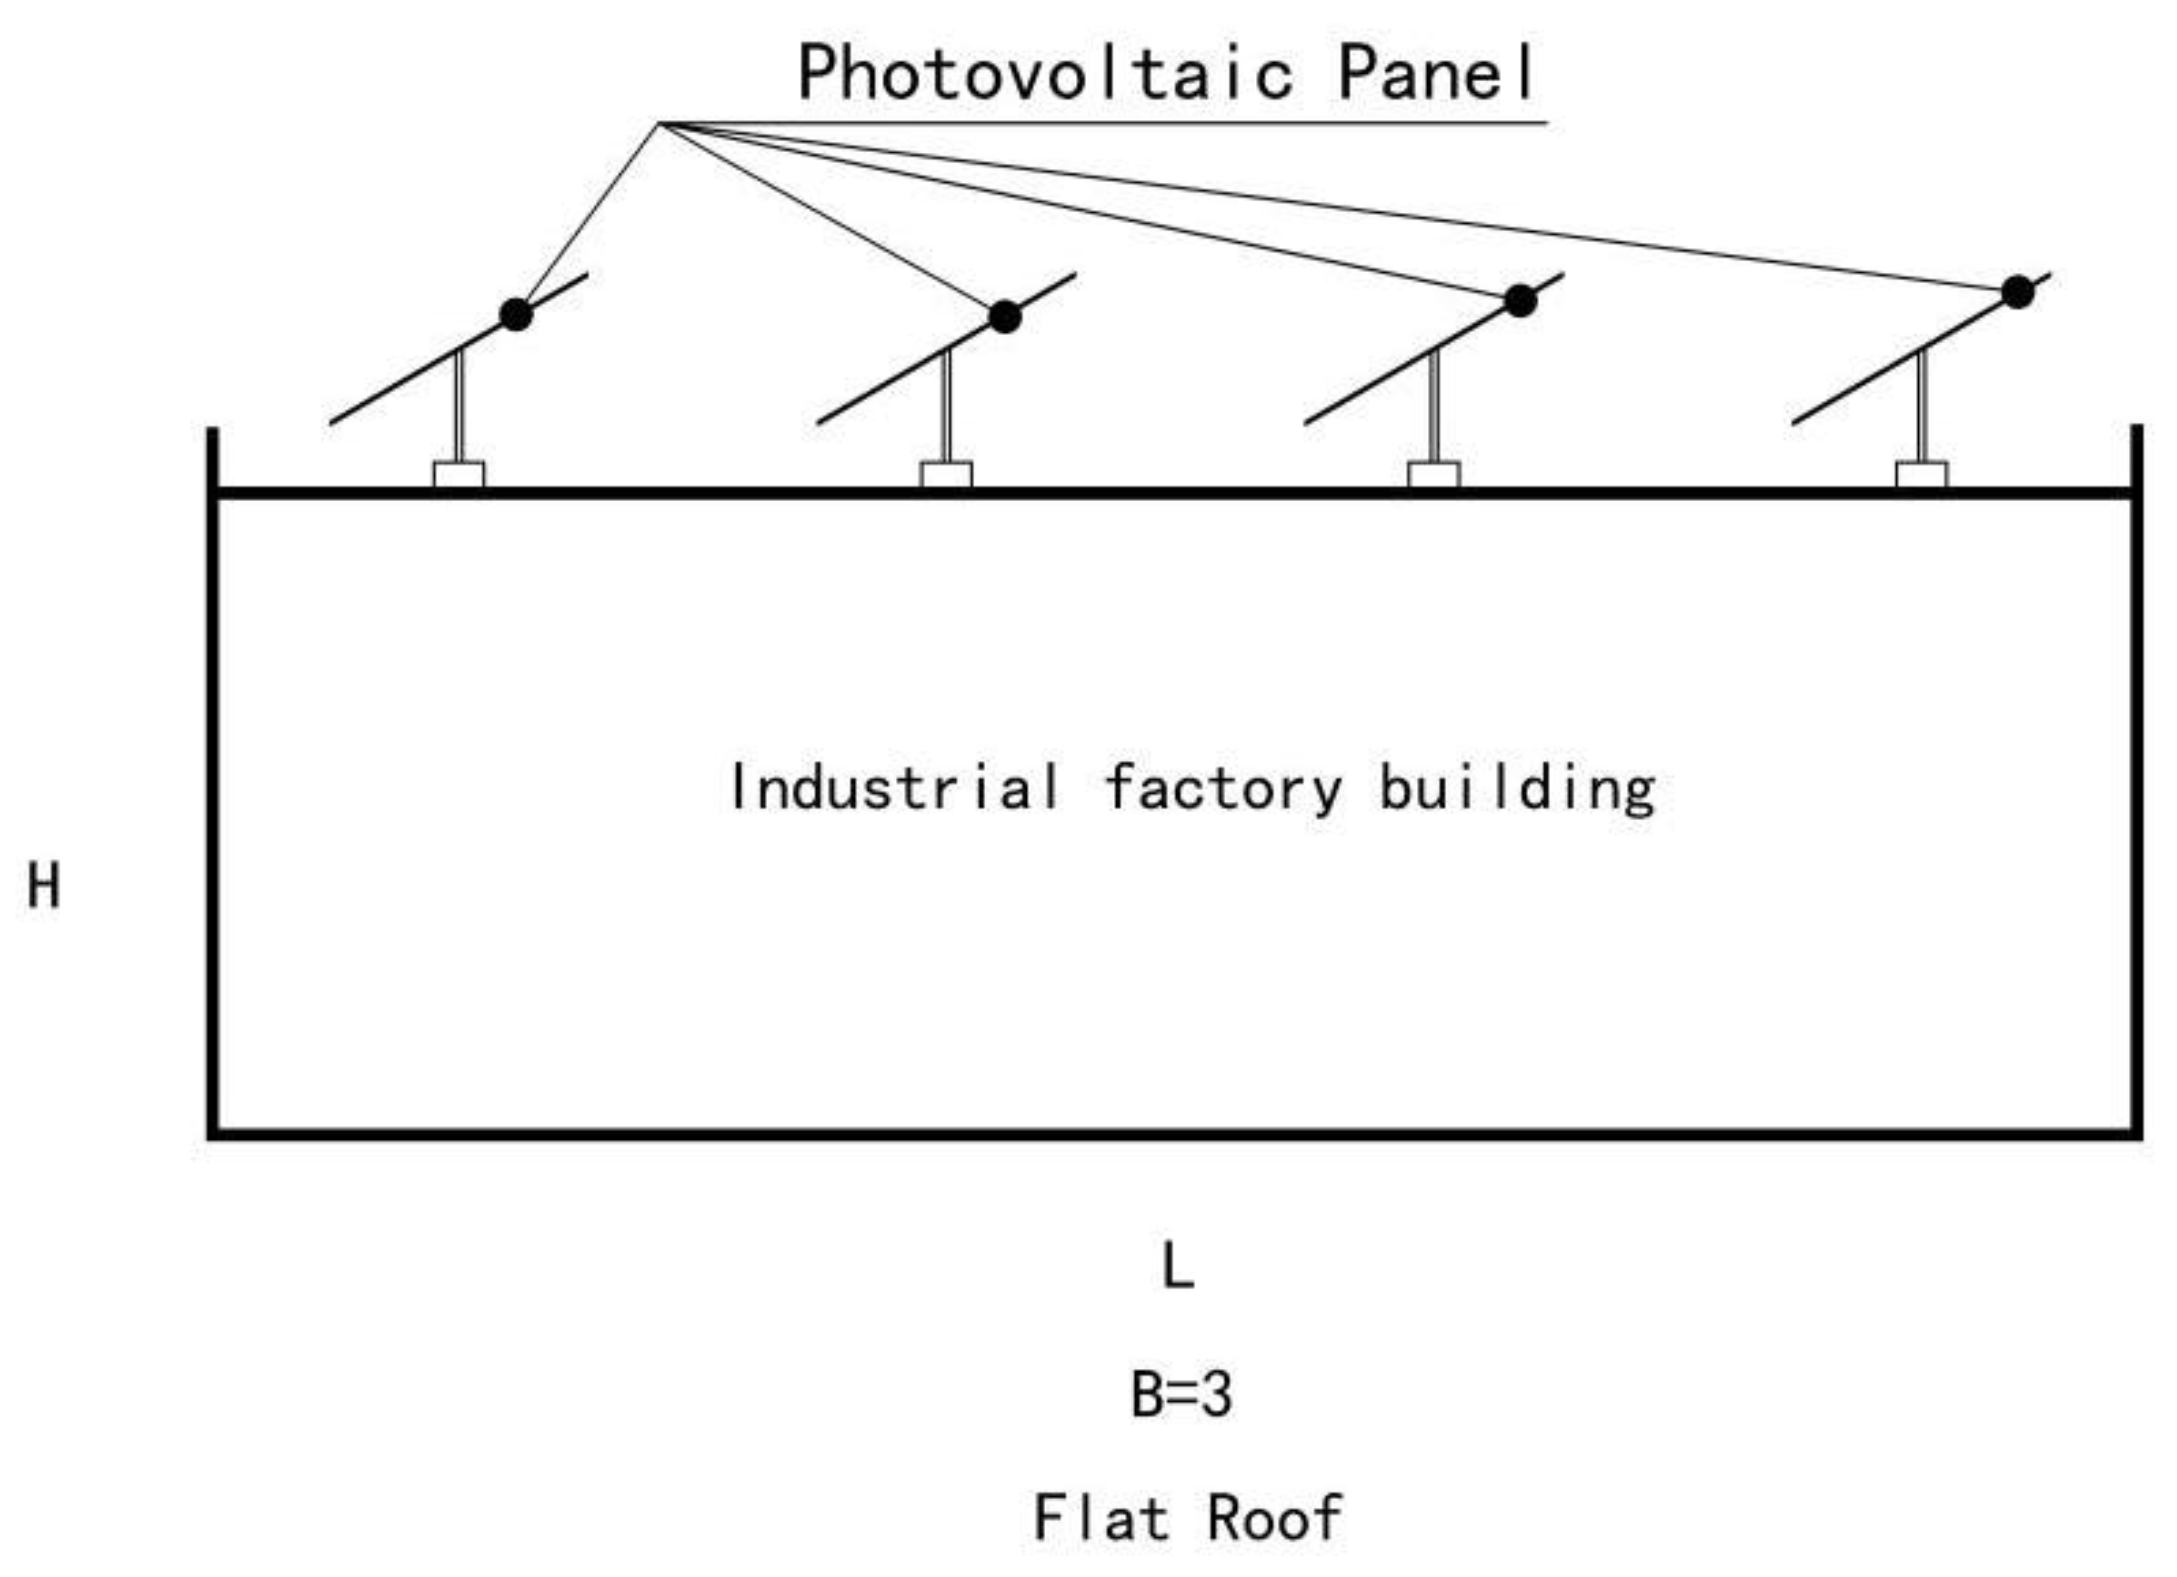
For flat roof industrial plants, when using a flat installation method, the total solar radiation received by photovoltaic panels will not change due to differences in azimuth angle, and the annual total power generation of photovoltaic panels will not change either. However, for inclined installation, the best orientation of solar photovoltaic panels will change with changes in azimuth angle, and the power generation will also change. The inclined installation of solar photovoltaic panels is shown in
Figure 7.
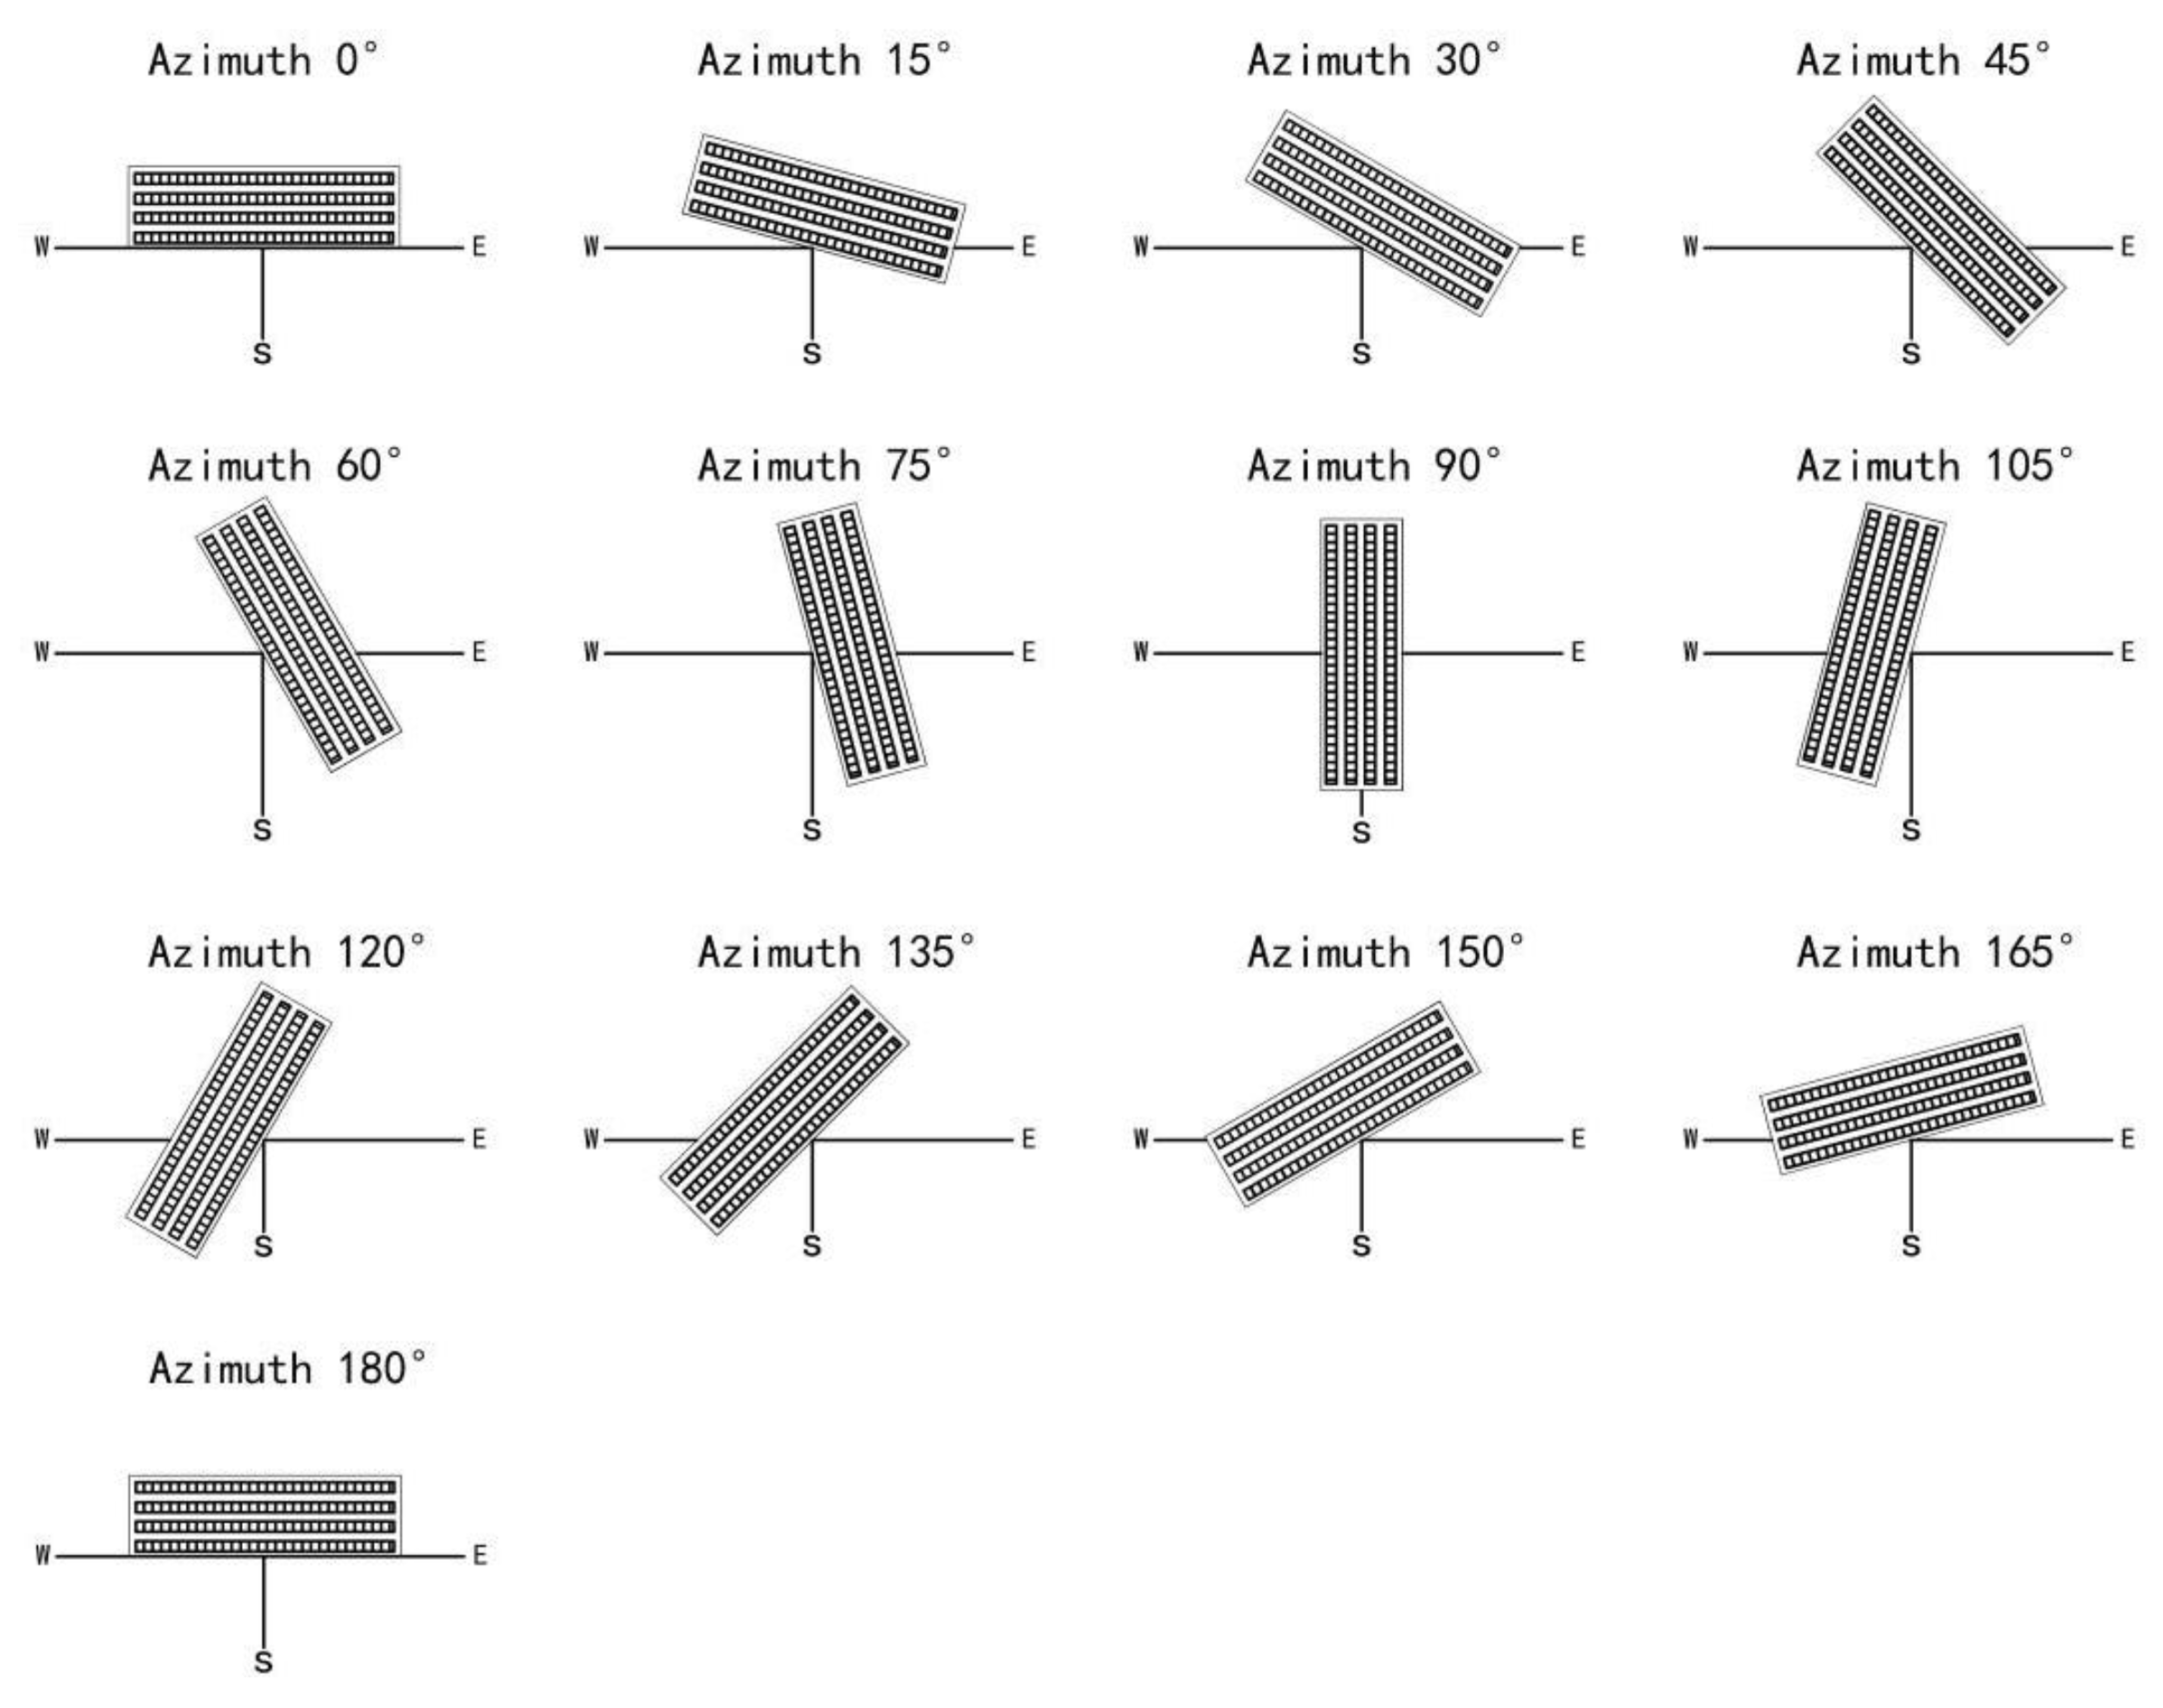
If the orientation angle of the factory building is changed, the orientation angle of the solar photovoltaic panels in the factory building remains the same. In this case, the area of the photovoltaic panels does not change, but the amount of solar radiation received by the photovoltaic panels will change due to the change in the orientation angle, and so will the power generation benefits. As shown in
Figure 8.
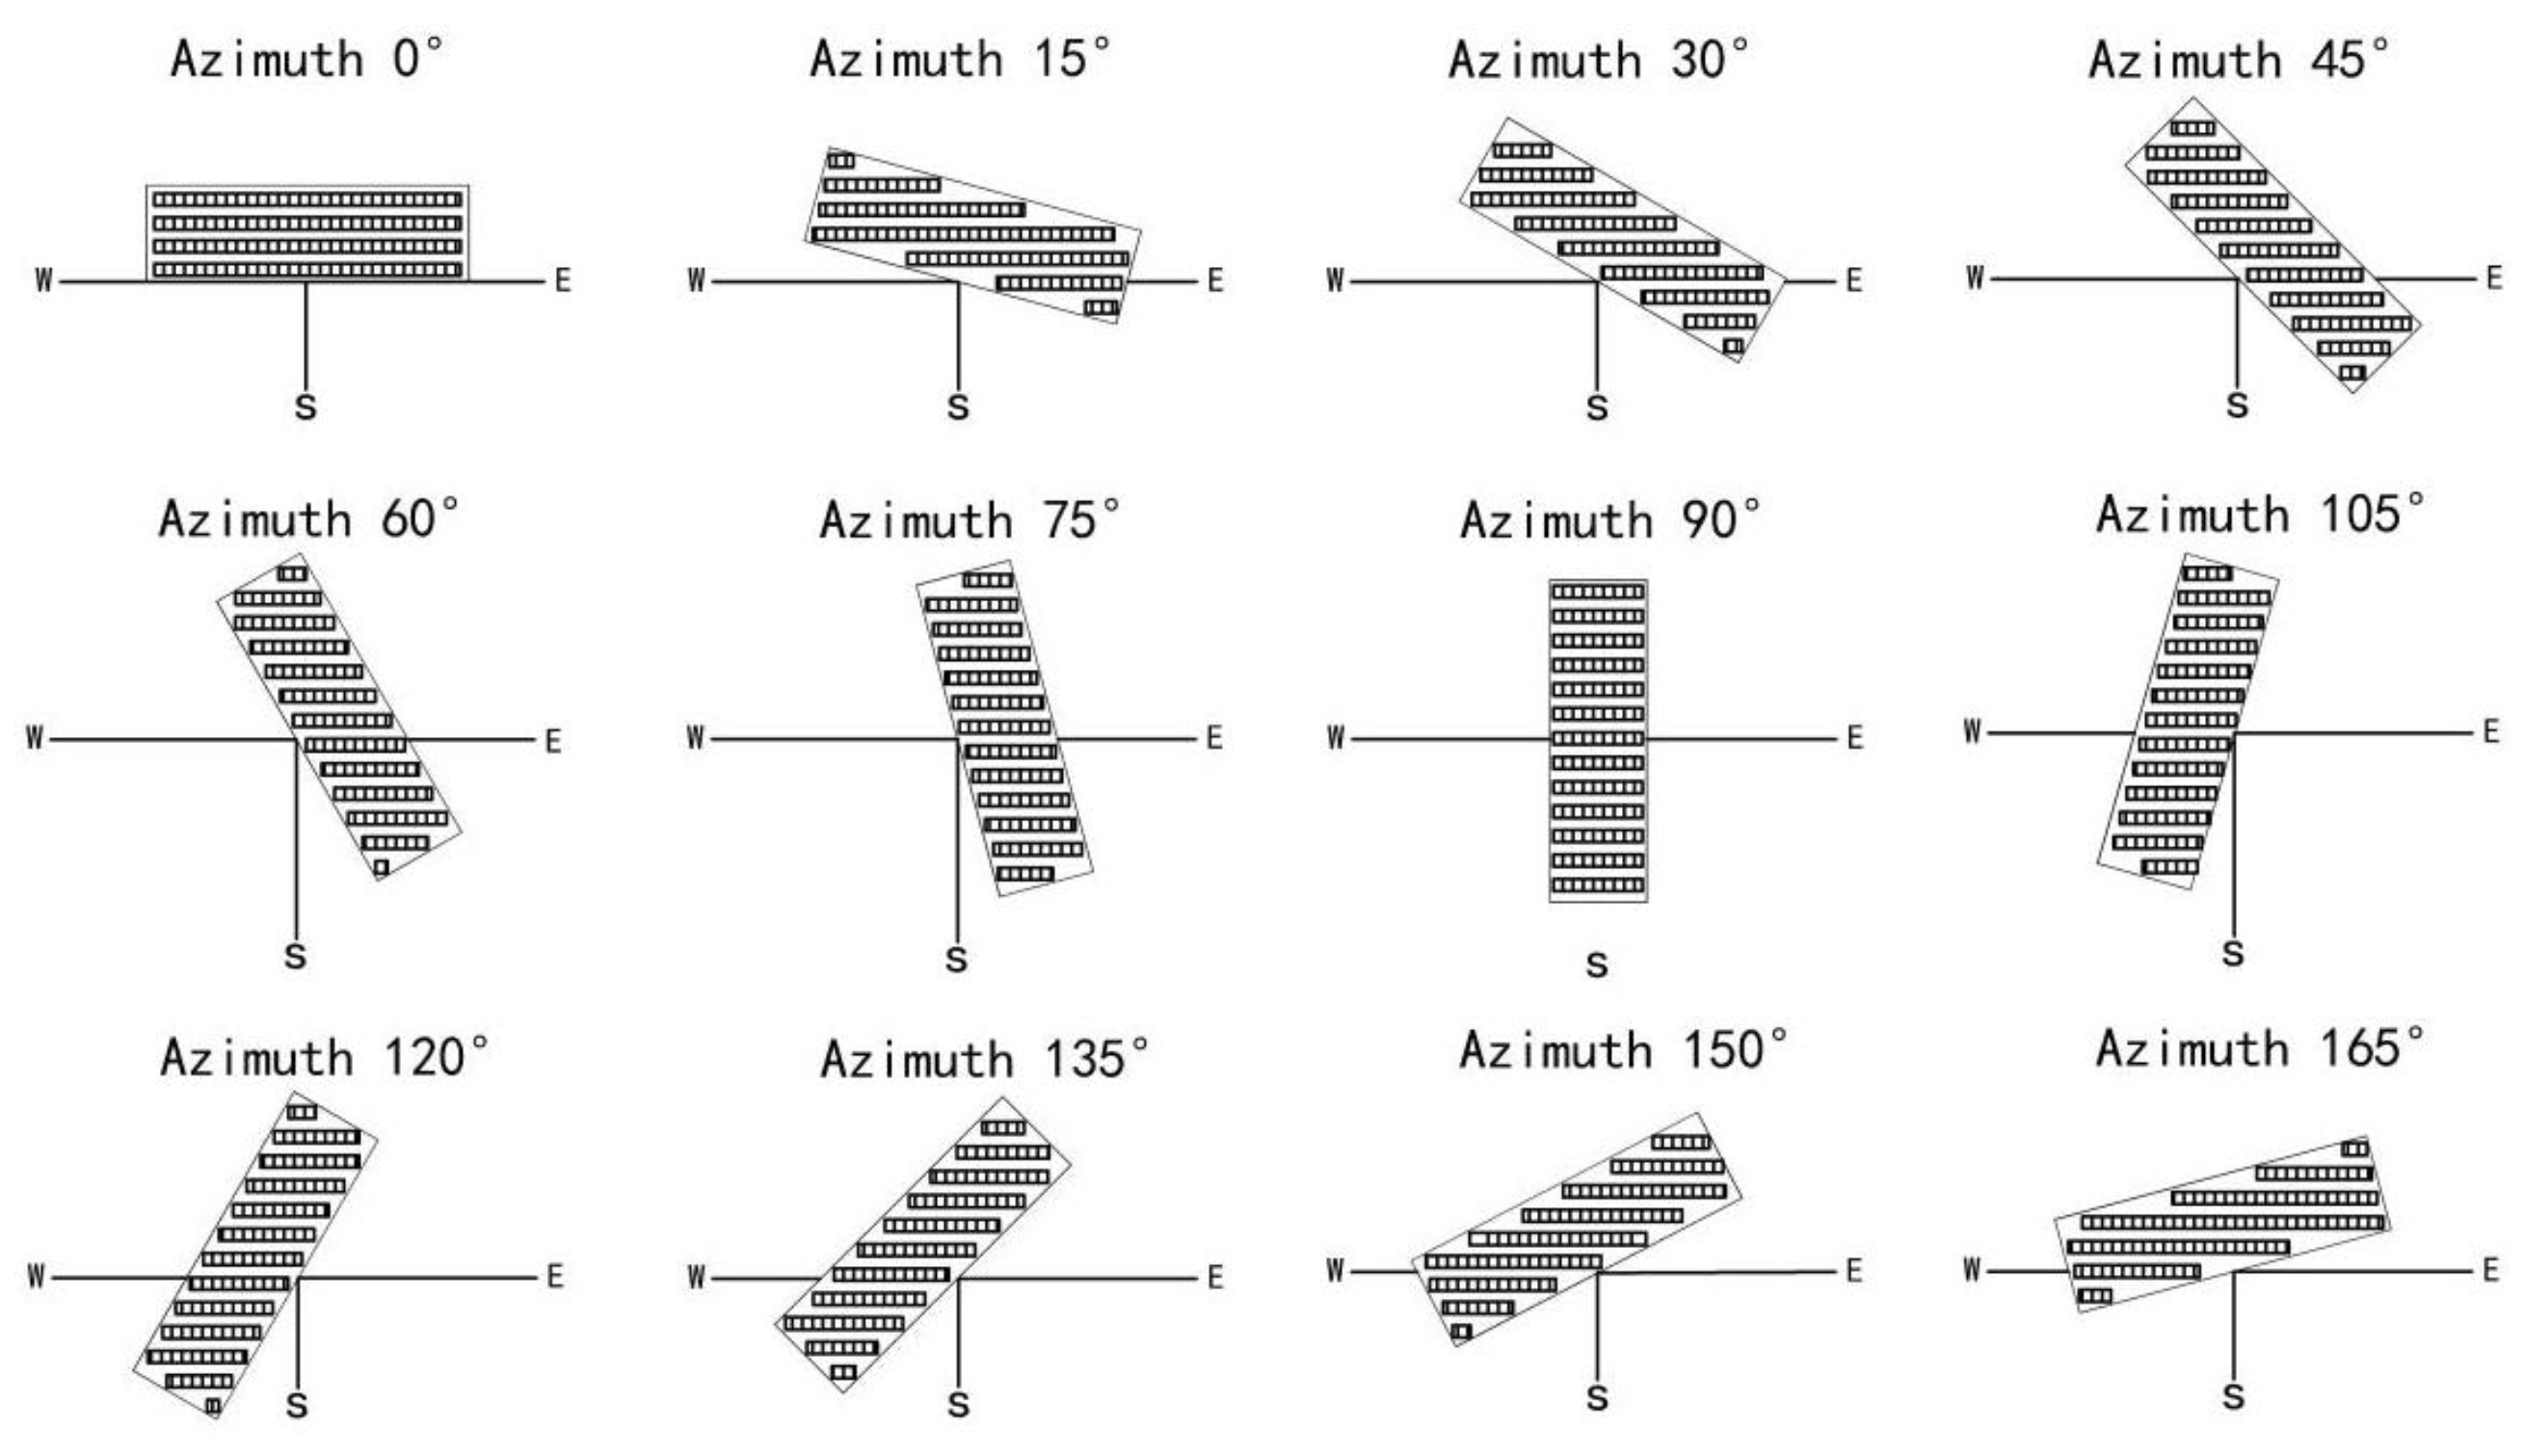
If the orientation angle of the factory building is changed, the orientation of the solar photovoltaic panels is kept at the optimal orientation angle. In this case, the roof area for installing photovoltaic panels will change accordingly, and so will the power generation benefits. As shown in
Figure 9.
After calculation, the inclined installation of solar photovoltaic panels on the flat roof industrial plant has the largest installation area of photovoltaic panels, which is 391.2m
2 when the azimuth angle is 0°. When the orientation angle of the factory building changes and the orientation angle of the photovoltaic panels is not changed, the installation area of the photovoltaic panels also changes, but it is always less than the installation area when the azimuth angle is 0°. When the orientation angle of the factory building and the photovoltaic panels changes together, the maximum installation area of rooftop photovoltaic panels can be referred to the layout in
Figure 8. The specific parameter statistics are shown in
Table 6.
3.4.2. Sloped Roof Azimuth
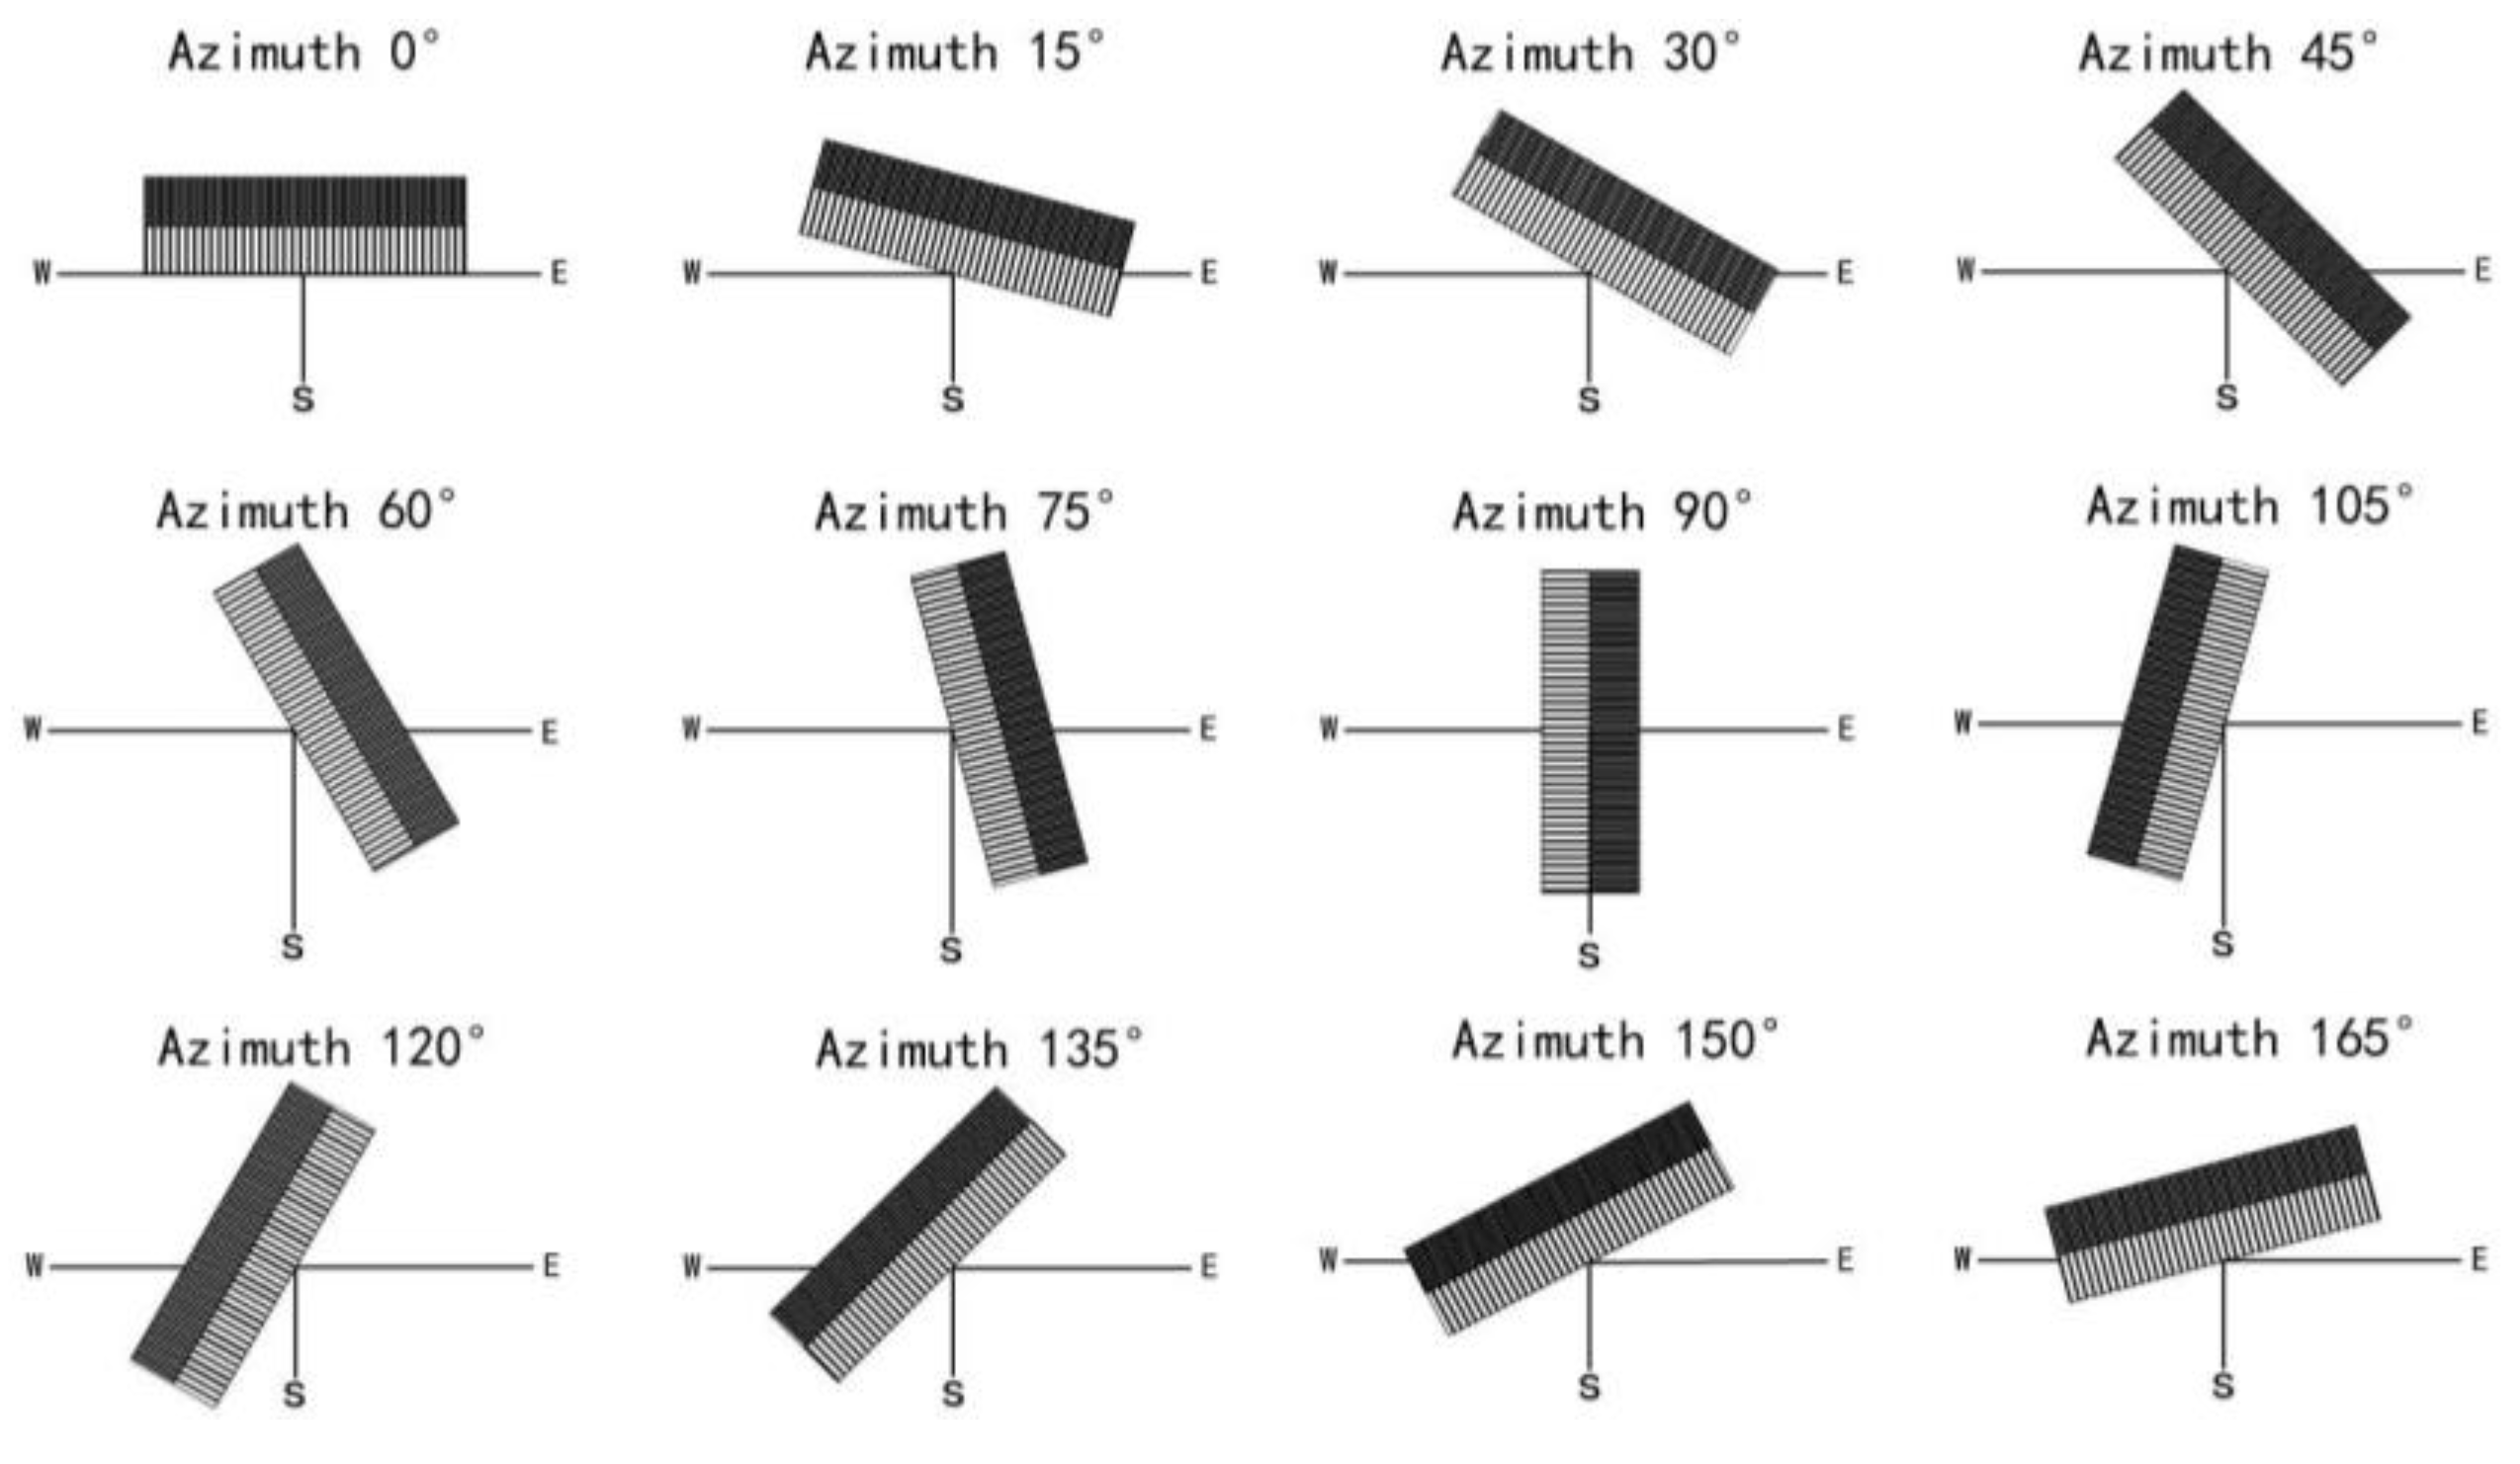
Sloped roofs generally adopt a flat installation method for solar photovoltaic panels due to their roof construction, and the power generation of photovoltaic panels is affected by the roof slope and azimuth angle. As shown in section 2.3.2, the power generation of photovoltaic panels increases with the increase of slope, and the power generation is the largest when the slope reaches the optimal slope angle in the region. The roof area for installing photovoltaic panels on sloped roofs is different from that on flat roofs, and is generally installed using a flat installation method. The installation area of photovoltaic panels usually does not change with different azimuth angles.
Figure 10 shows the layout diagrams of sloped roofs with different azimuth angles.
3.5. PV Module Material Parameters
The parameters of photovoltaic module materials are one of the factors affecting the efficiency of photovoltaic power generation, and many scholars have conducted a large amount of research and verification on the performance of different types of photovoltaic materials. Nazek EI-Atab [
13] used laser ripple technology to develop single-crystalline silicon solar cells with world-record stretchability (95%) and efficiency (19%). Chen Wenhao [
14] achieved three different activation phosphorus concentrations of polycrystalline silicon by adjusting the PH3 flow rate, SiOx thickness, and activation temperature, thus improving the efficiency of polycrystalline silicon solar cells. Zheng Guang-Fu [
15] explored a novel semiconductor photovoltaic (PV) active material Culn 1-x Ga x Se 2 (CIGS) and thin film electrodeposit (ED) technology, which obtained high-quality CIGS polycrystalline thin films, reduced costs, and improved efficiency.
Currently, the most commonly used photovoltaics are single-crystalline silicon, polycrystalline silicon, and thin film photovoltaics. Scholars generally believe that single-crystalline silicon photovoltaics have high conversion efficiency and stability, but are relatively expensive; polycrystalline silicon photovoltaics have slightly lower conversion efficiency than single-crystalline silicon photovoltaics, but are superior in terms of low cost and short payback period for transformation costs; thin film photovoltaics have lower photoelectric conversion rates than crystalline silicon photovoltaics under sufficient light conditions, and are more expensive than crystalline silicon photovoltaics, but have good weak-light effects and better decorative effects. The following are several common photovoltaic module parameter tables, as shown in
Table 7.
4. Analysis of Photovoltaic Power Generation Based on PVsyst Software
4.1. Flat Roof Power Generation Analysis
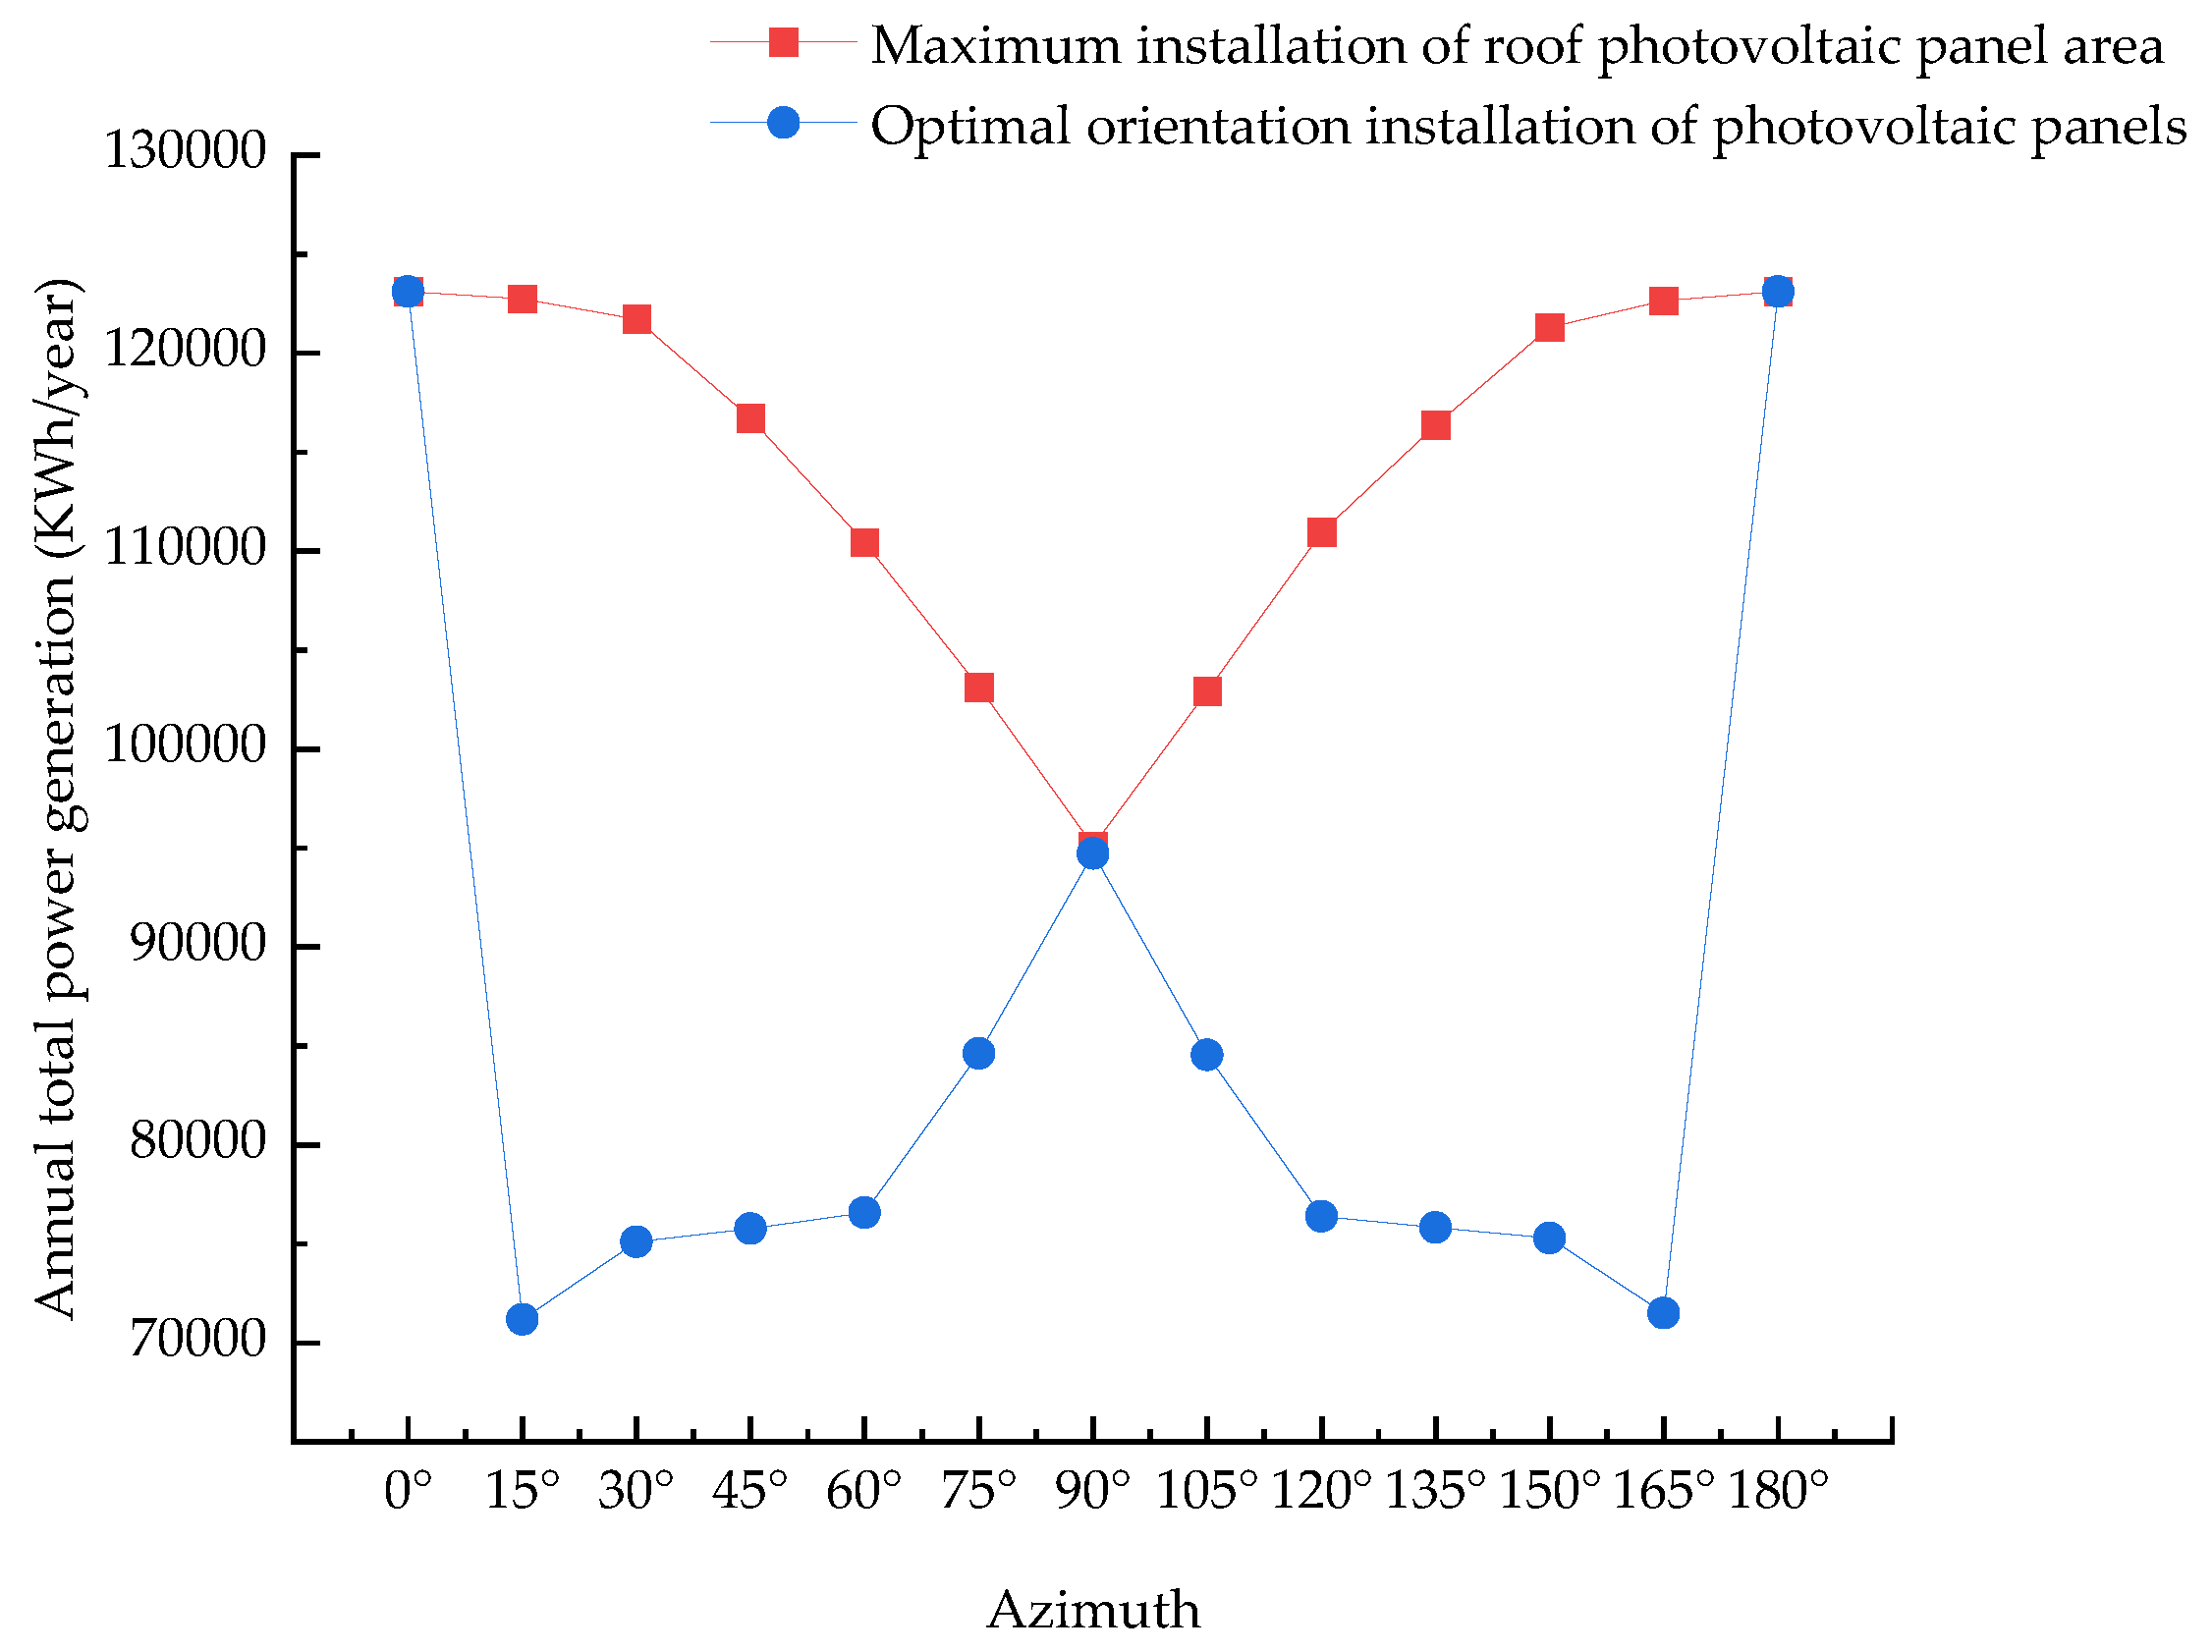
This paper takes M-Si (polycrystalline silicon) as the research object and discusses the annual power generation of industrial plants on flat roofs under different azimuth angles and different photovoltaic panel installation areas based on the statistical data in
Table 5, as shown in
Figure 11.
From
Figure 11, it can be concluded that for the flat roof industrial plant, the annual power generation amount of the photovoltaic panels installed in an inclined manner with a constant installation area and a changing orientation angle, decreases first and then increases with the increase of the orientation angle. When the orientation angle is 90°, the power generation amount reaches the minimum value, and the maximum value is reached when the orientation angle is 0° or 180°. When the orientation angle of the photovoltaic panels is kept unchanged and always at 0°, and the orientation angle of the building is changed, the roof area for installing photovoltaic panels also changes. When the orientation angle is 0° to 15°, the power generation amount decreases; when the orientation angle is 15° to 90°, the power generation amount increases; when the orientation angle is 90° to 165°, the power generation amount decreases; and when the orientation angle is 165° to 180°, the power generation amount increases. The reason for the large change in power generation amount when the orientation angle is between 0° and 15° and 165° and 180° is that the roof area for installing photovoltaic panels decreases when the orientation angle is 15° and 165°, and the roof space utilization is at its lowest value.
4.2. Analysis of Power Generation on Sloping Roofs
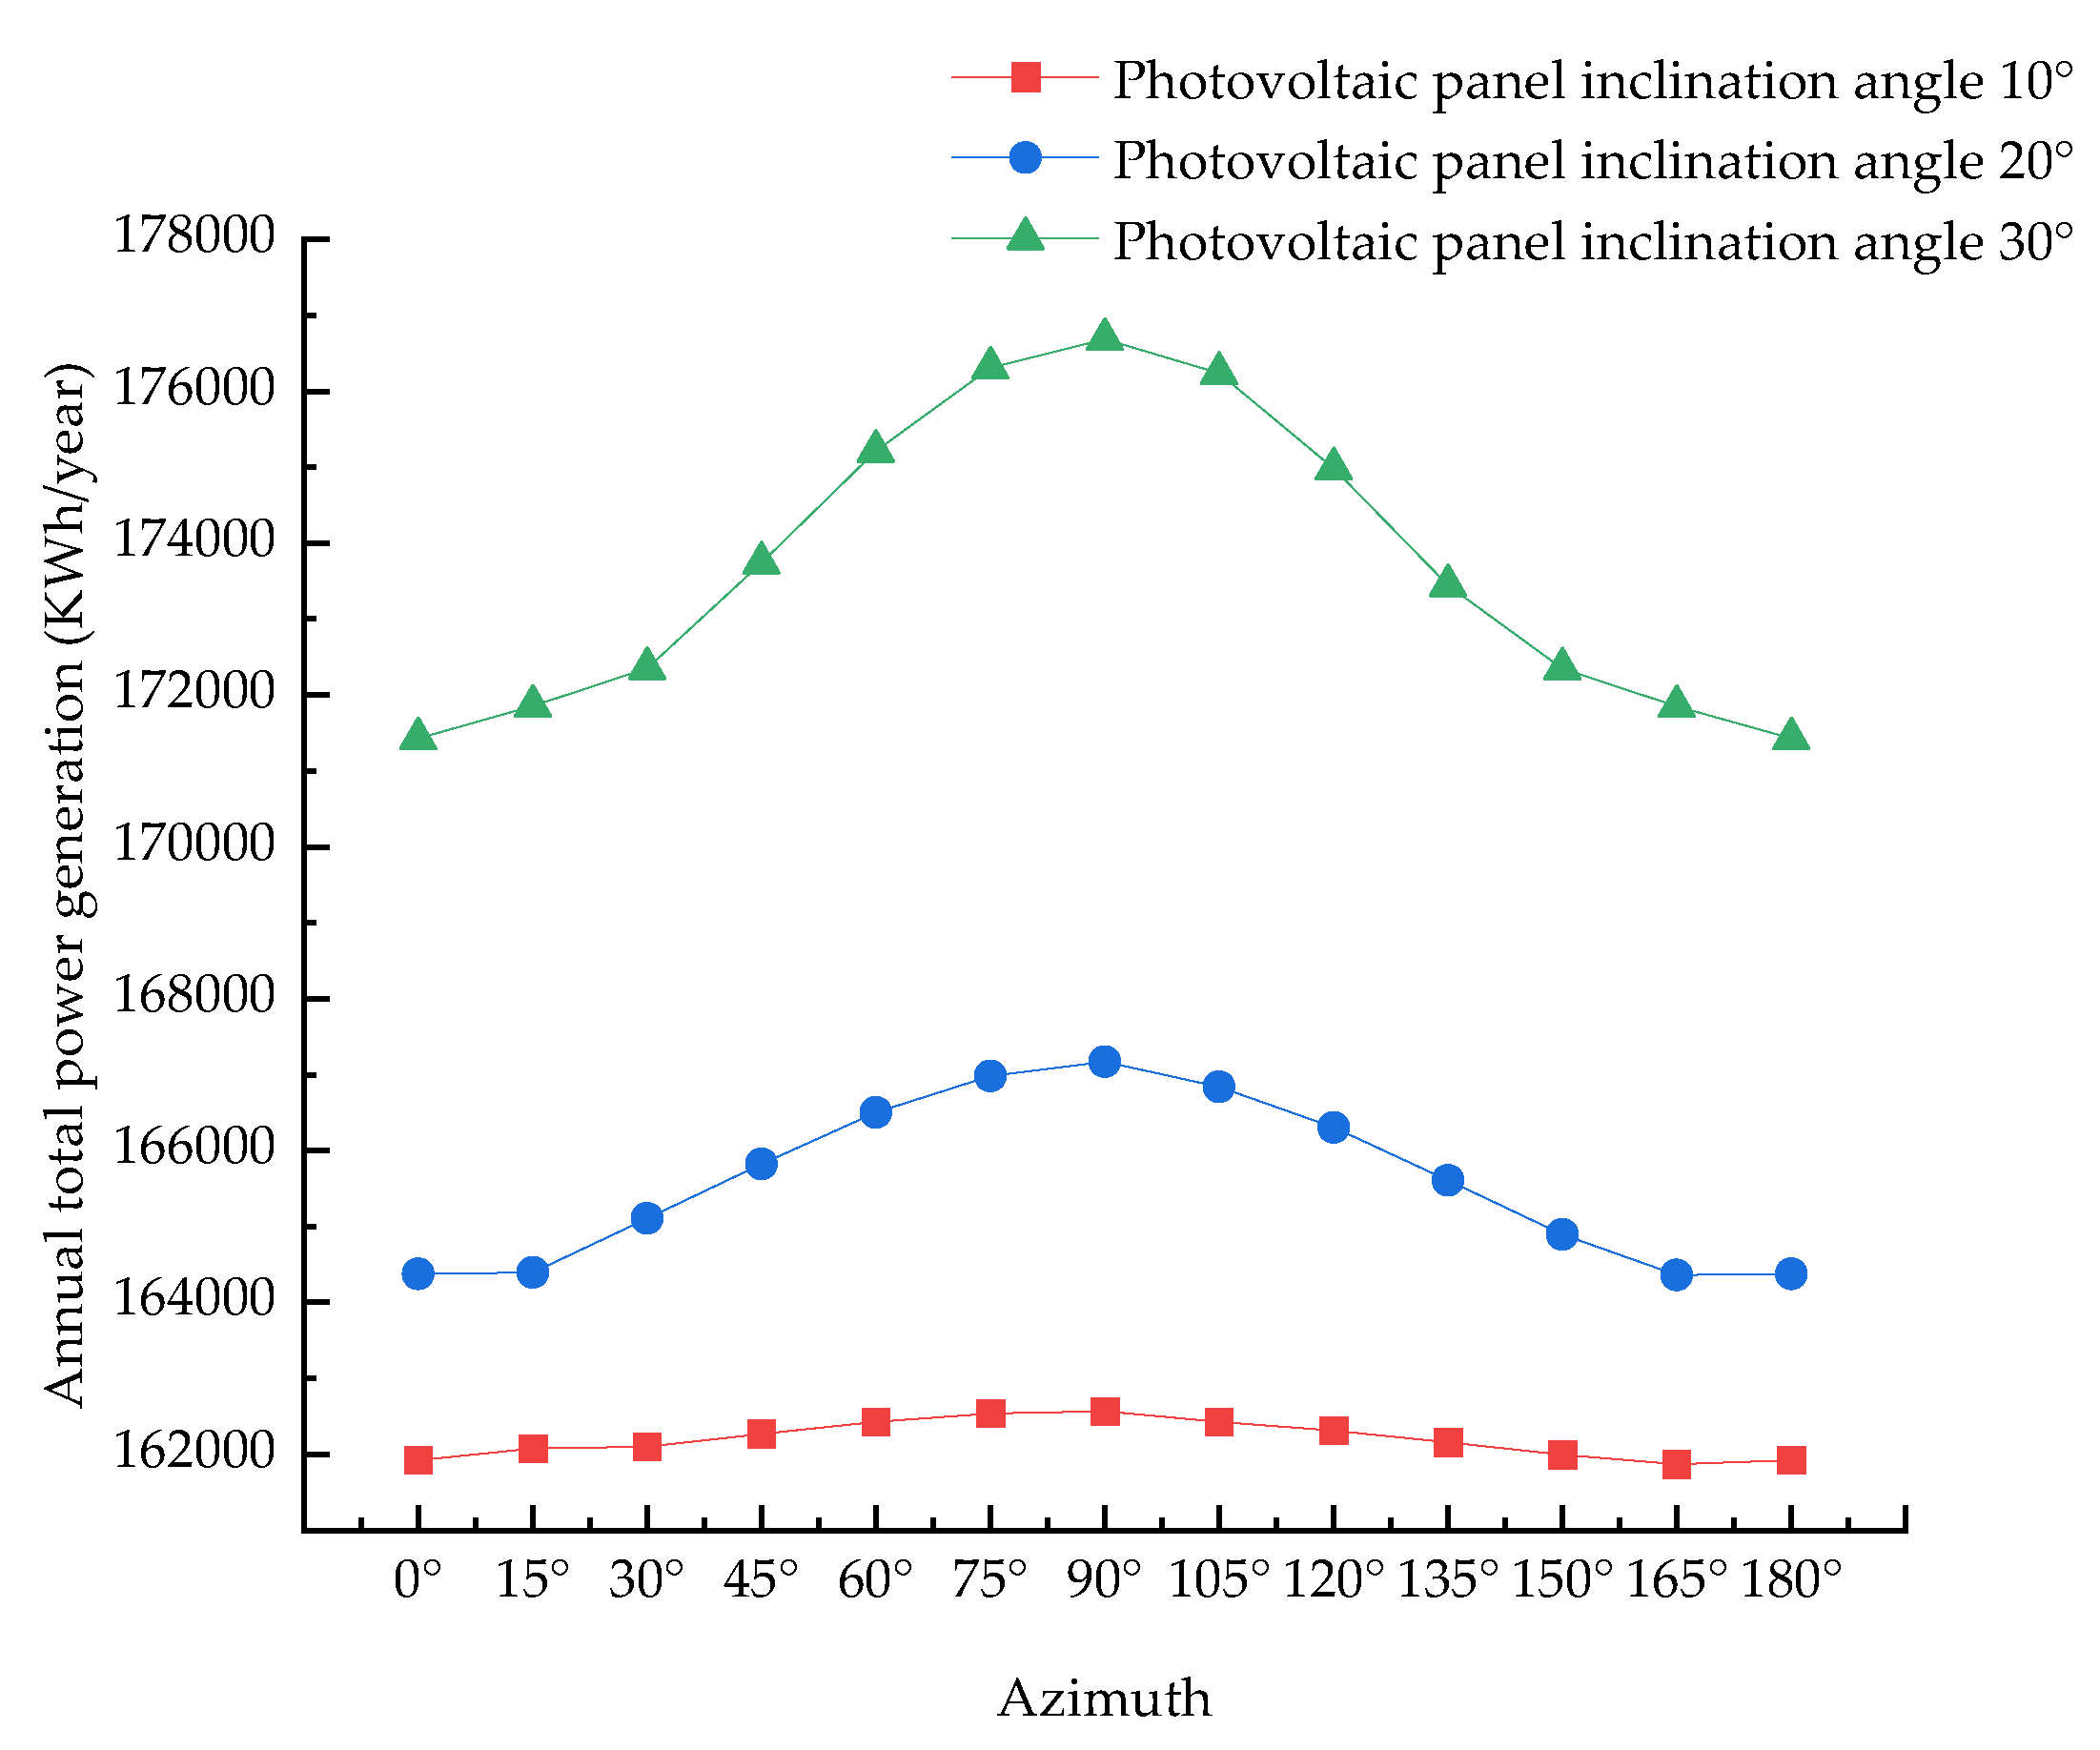
This paper takes M-Si (polycrystalline silicon) as the research object and discusses the annual power generation of industrial plants on sloped roofs under different azimuth angles and different photovoltaic panel installation areas based on the statistical data in
Table 4, as shown in
Figure 12.
From
Figure 10, it can be concluded that for sloped roof industrial plants, the annual power generation amount increases with the increase of azimuth angle within the range of 0°~90°, and the growth ratio is positively correlated with the slope of the roof. The larger the slope of the roof, the larger the azimuth angle, and the more power generation amount of the photovoltaic panels. When the azimuth angle reaches 90°, the power generation amount tends to reach the maximum value. When the azimuth angle is within the range of 90°~180°, the annual power generation amount decreases with the increase of azimuth angle, and the reduction ratio is positively correlated with the slope of the roof. The magnitude of the increase in power generation amount is also related to the slope of the roof. When the slope approaches the optimal solar photovoltaic tilt angle in the local area, the power generation amount is more.
5. Design Optimization Based on MIV-BP Neural Network
5.1. Description of the BP Neural Network Model
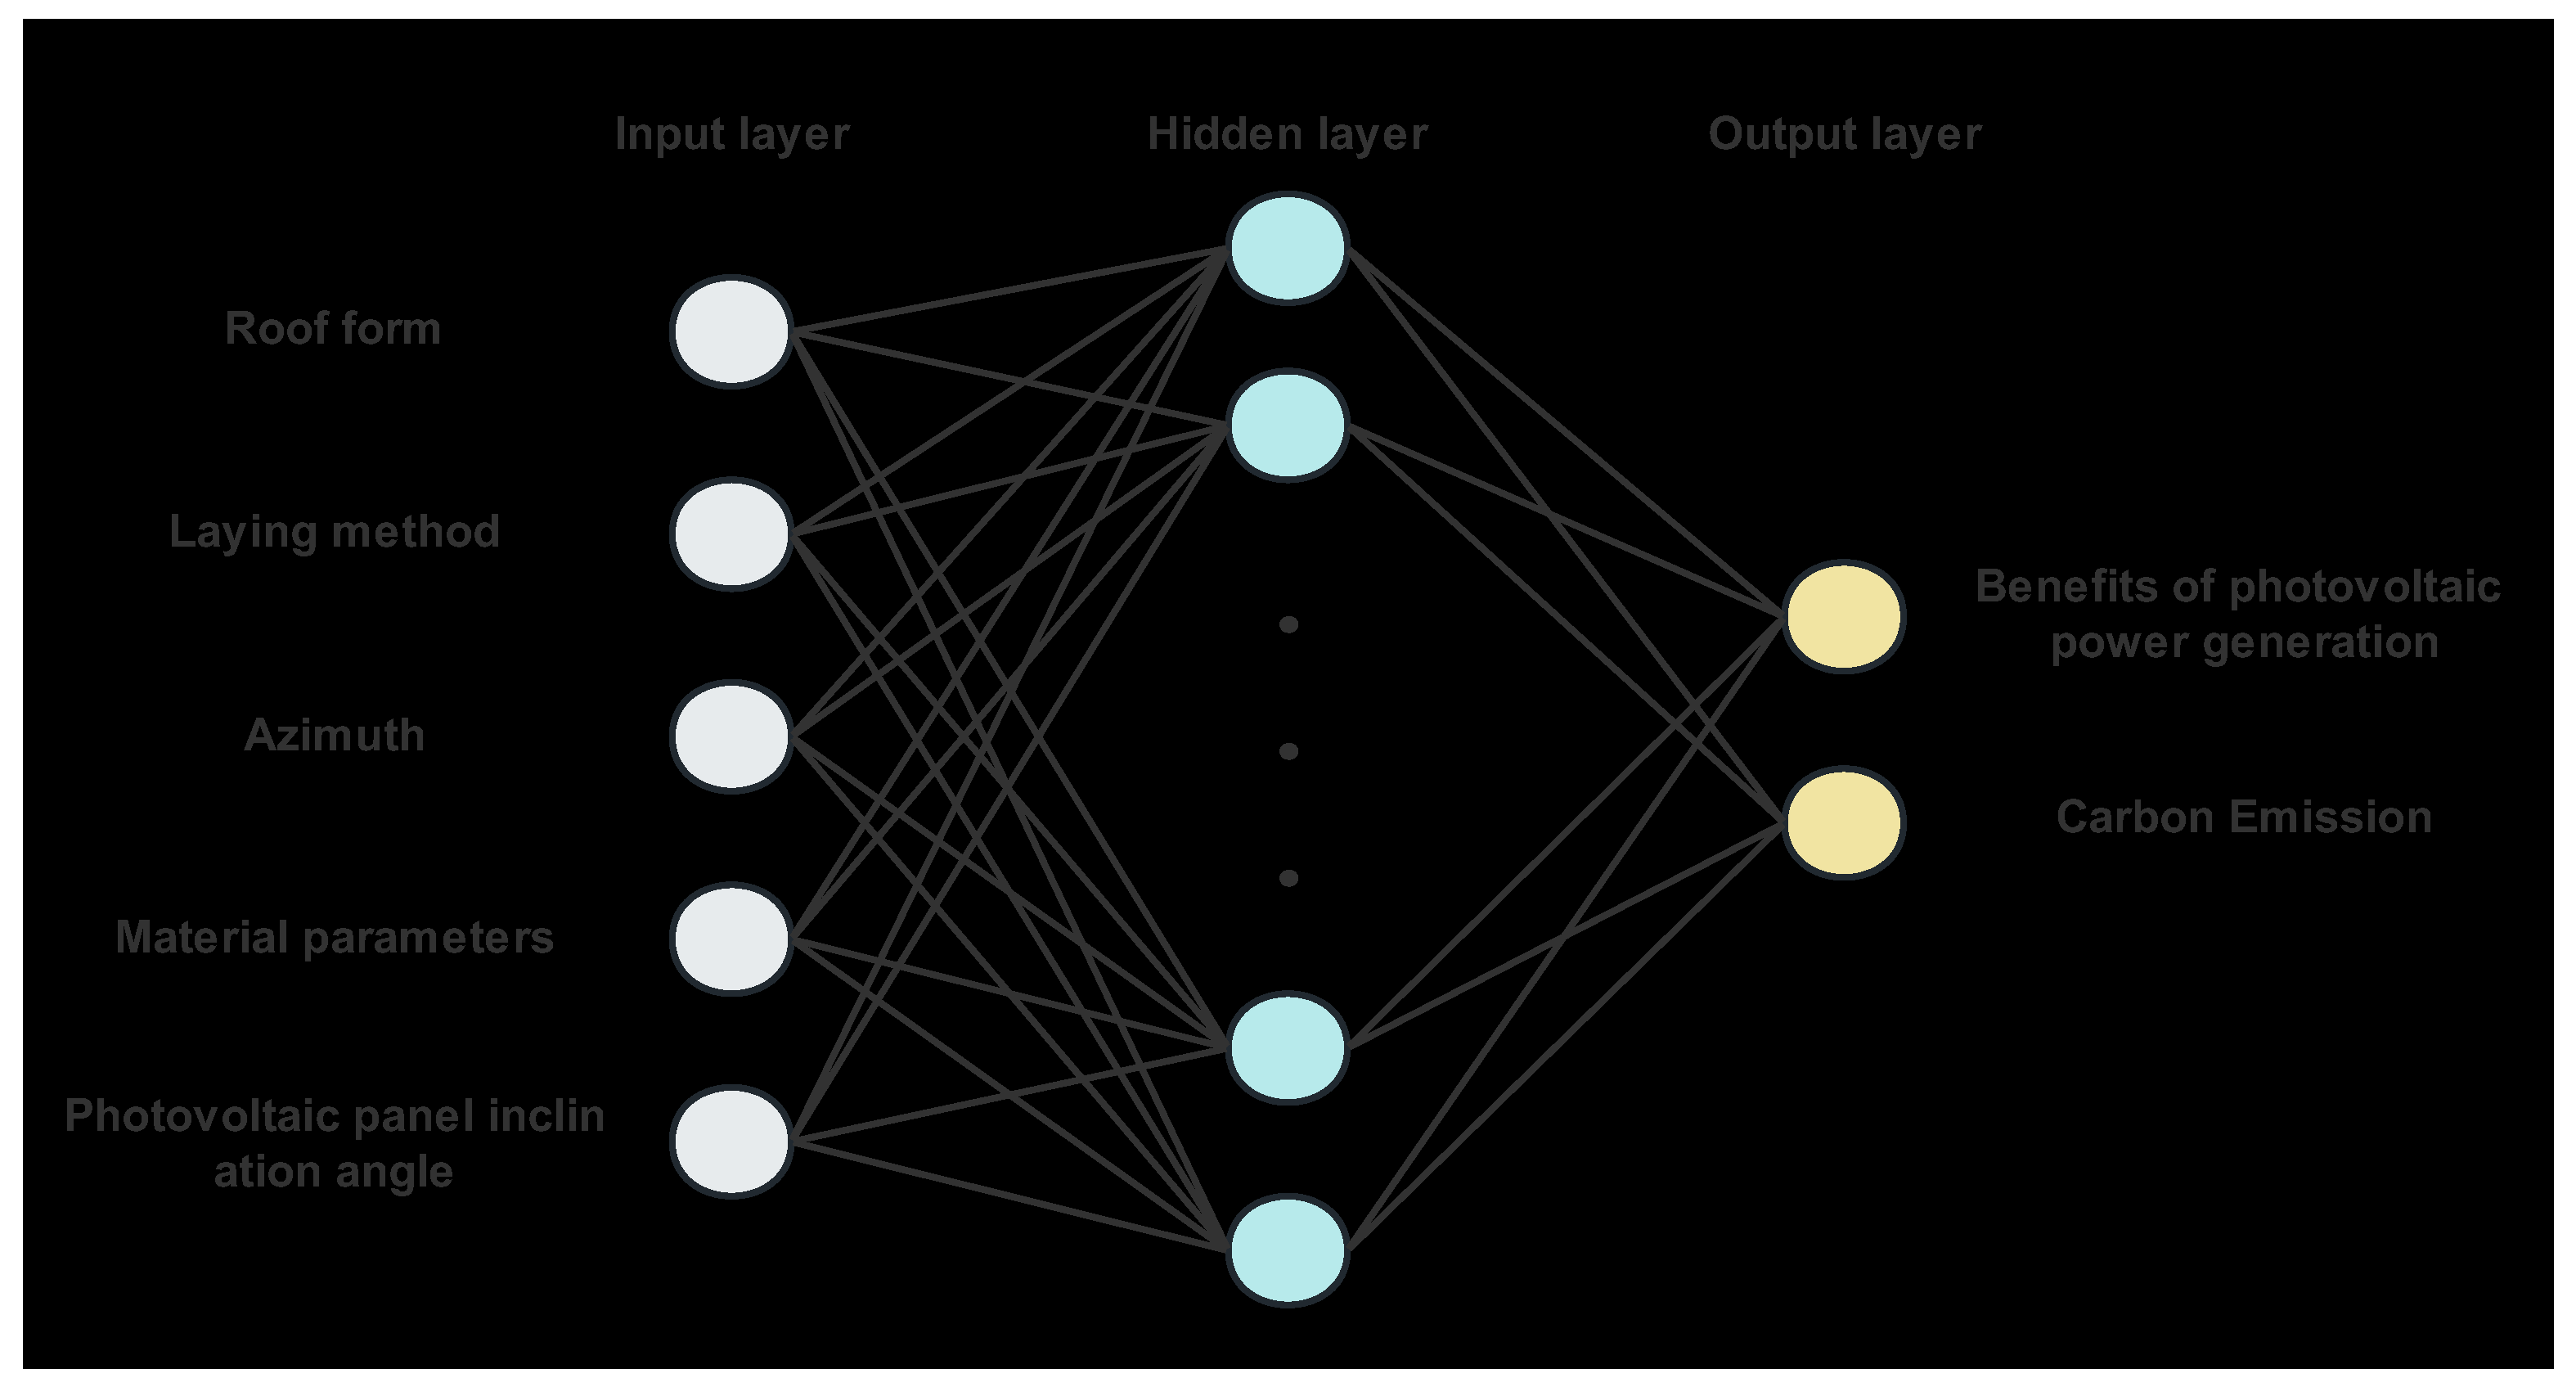
BP neural network, as a kind of artificial neural network, is a multi-layer neural network with three or more layers. It has self-learning, arbitrary function approximation and fast seeking of optimal solutions. In selecting feature parameters of neural networks, the Mean Impact Value (MIV) method can reflect the impact of input feature parameters on the prediction results, which can be used to enhance the stability of the output results and improve the accuracy of the model in BP neural networks. In this study, a BP neural network model with one input layer, one hidden layer and one output layer was developed. The initial weights were randomly set, and then modified according to the difference between the calculation values during the training process and the actual simulation results. The BP neural network model developed in this study selects the building roof form, photovoltaic panel layout, photovoltaic panel tilt angle, azimuth angle and photovoltaic module material parameters as input parameters, and the life cycle photovoltaic power generation benefits and carbon emission reduction values as output parameters. In addition, the activation function of the hidden layer is the Tansig function, as shown in equation 2.
Select the linear activation function, Purelin function, as the activation function for the output layer to transmit from the hidden layer to the output layer:
The BP neural network model with 5 neurons in the input layer and 2 neurons in the output layer is shown in
Figure 13.
5.2. Data Preparation and Number of Hidden Neurons
In this study, the 360 samples generated in the previous simulation were randomly divided into two groups, used for training (80%) and testing (20%) of the BP neural network model. To improve the training and prediction efficiency, all data should be normalized to the range of 0 and 1. The calculation formula is as shown in equation 4.
Where y
i is the normalized data [-], x
i is the original data [kwh], x
min is the minimum value of the original data [kwh], and x
max is the maximum value of the original data [kwh]. After preprocessing all the data used, one of the most important steps is to determine the number of neurons in the hidden layer, which can be calculated using equation 5.
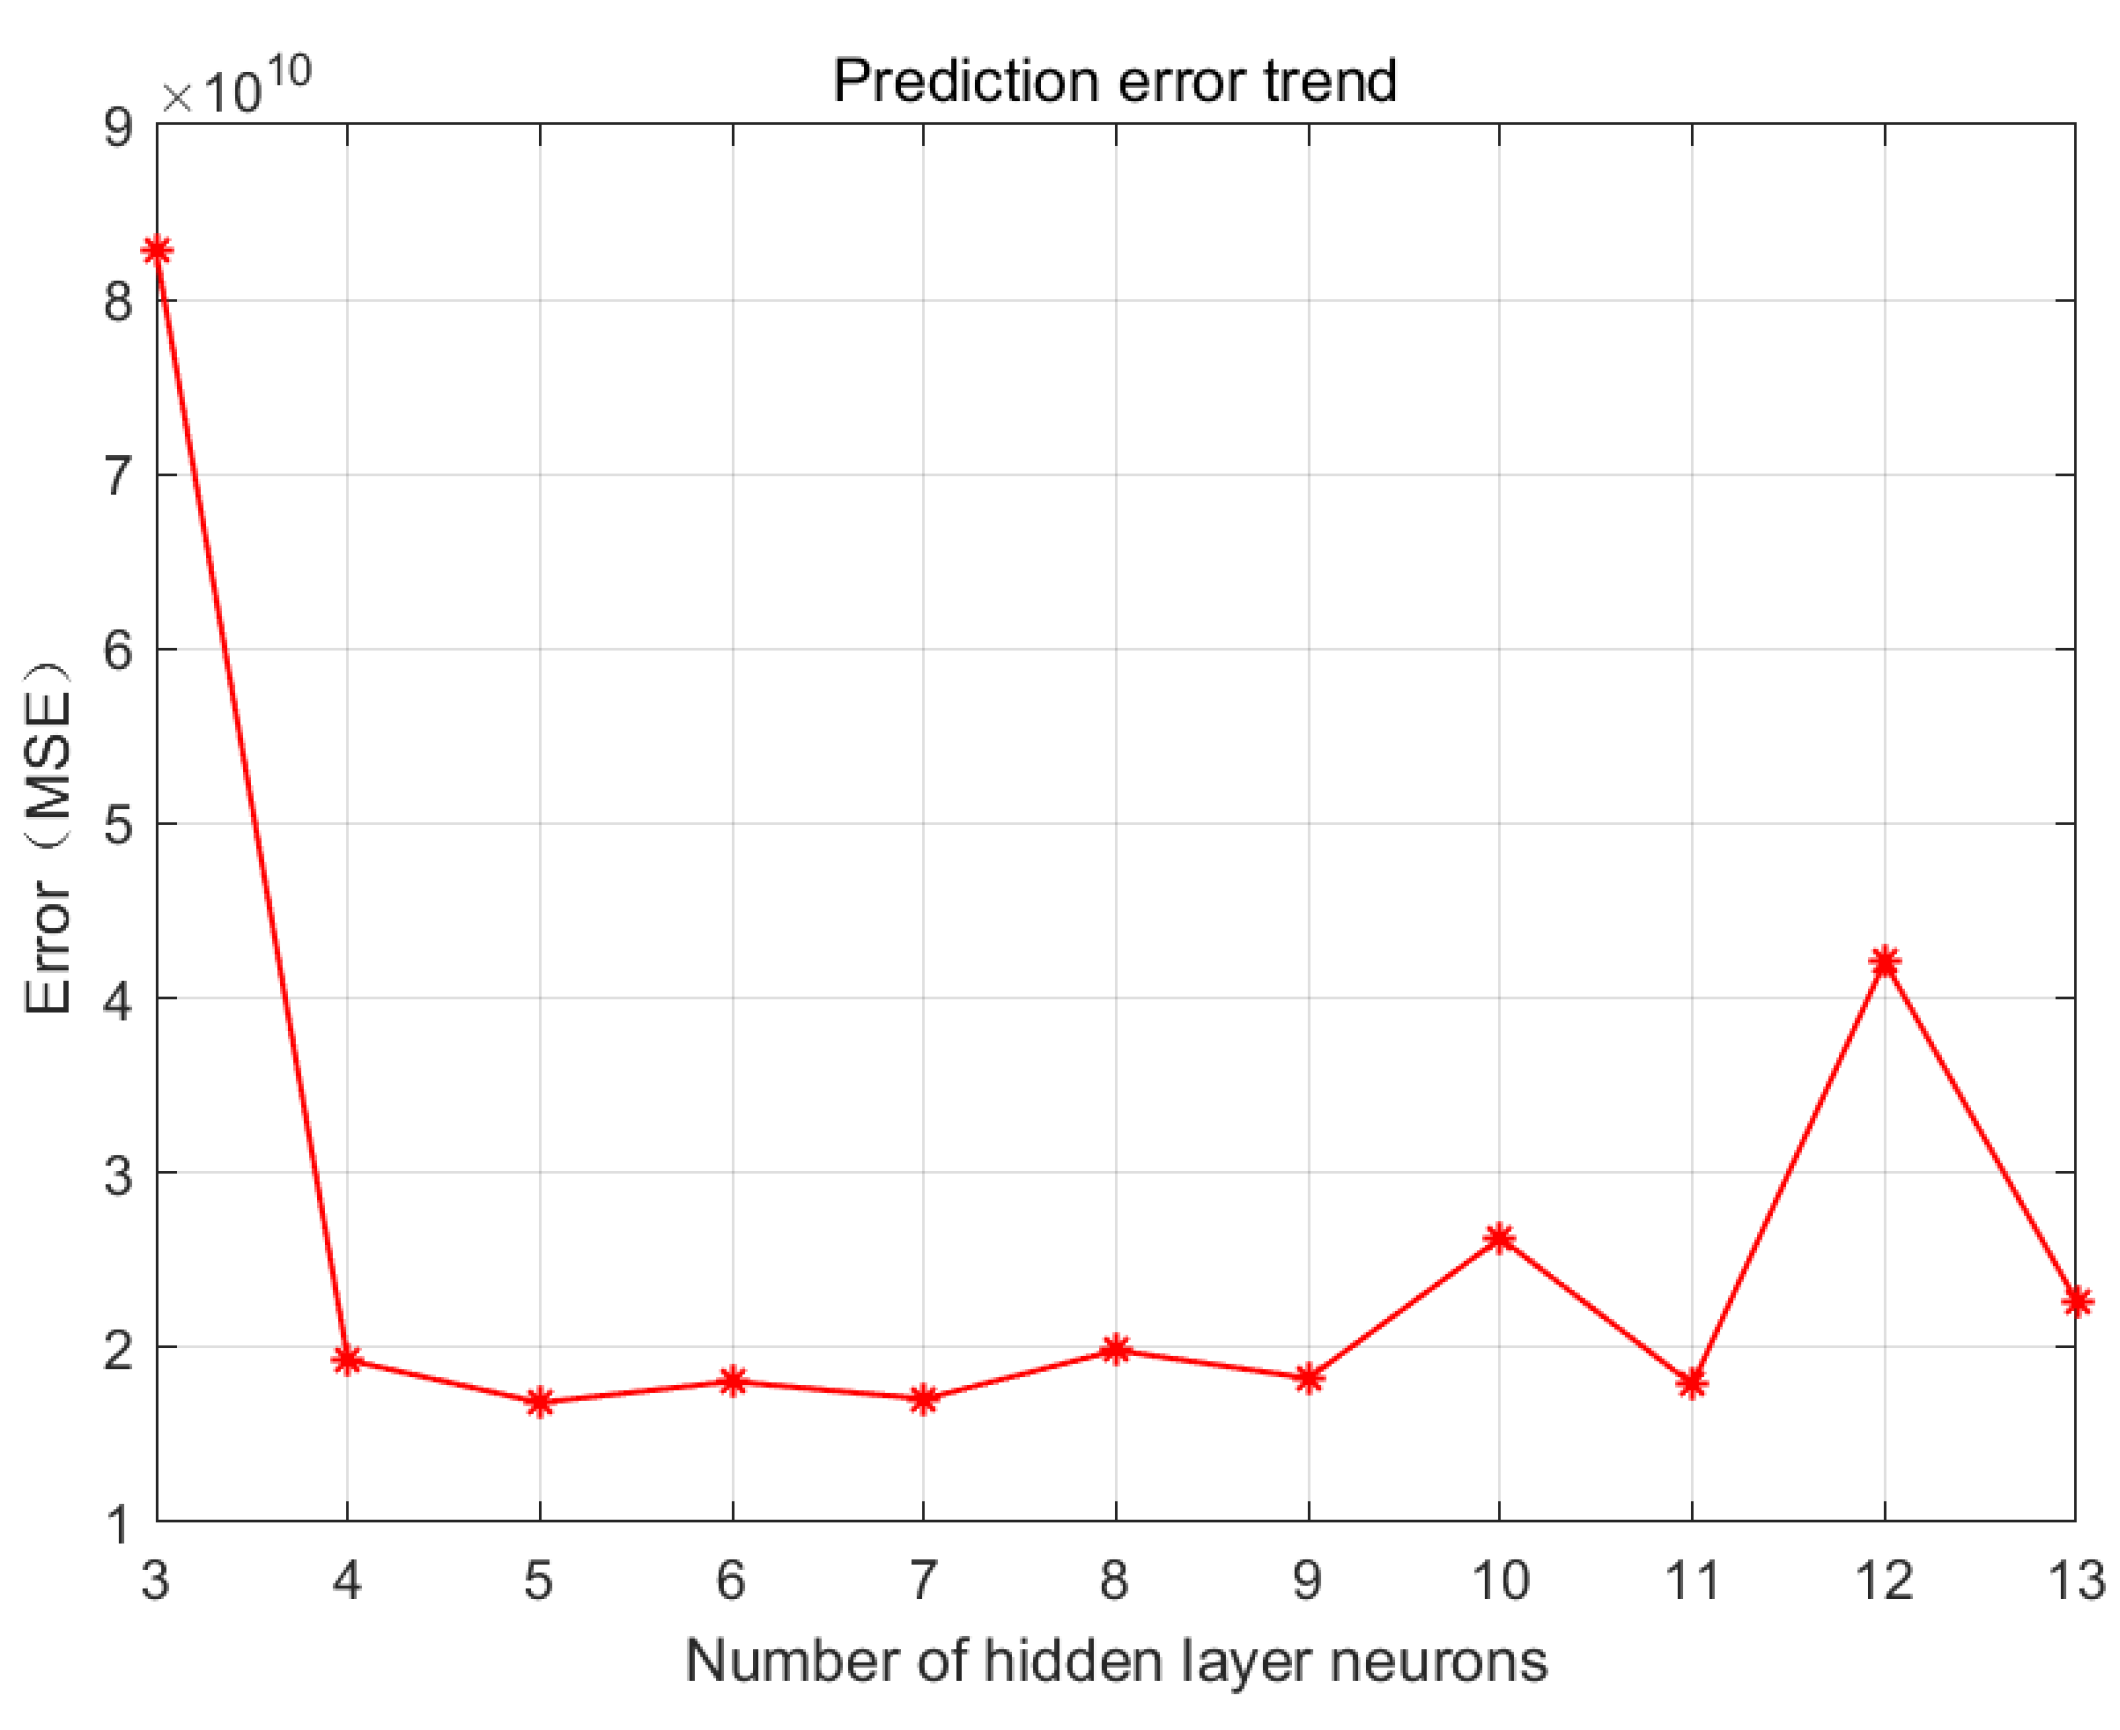
Where M is the number of neurons in the hidden layer, n is the number of neurons in the input layer, f is the number of neurons in the output layer, and e is a constant in the range of 1 to 10. According to equation (5), the number of neurons in the hidden layer is between 3 and 13. To determine the optimal number of neurons in the hidden layer, a BP neural network model was established using MATLAB 2022b, and the training was carried out by changing the number of neurons in the hidden layer. The change trend of the mean squared error (MSE) with different hidden layer neurons is shown in
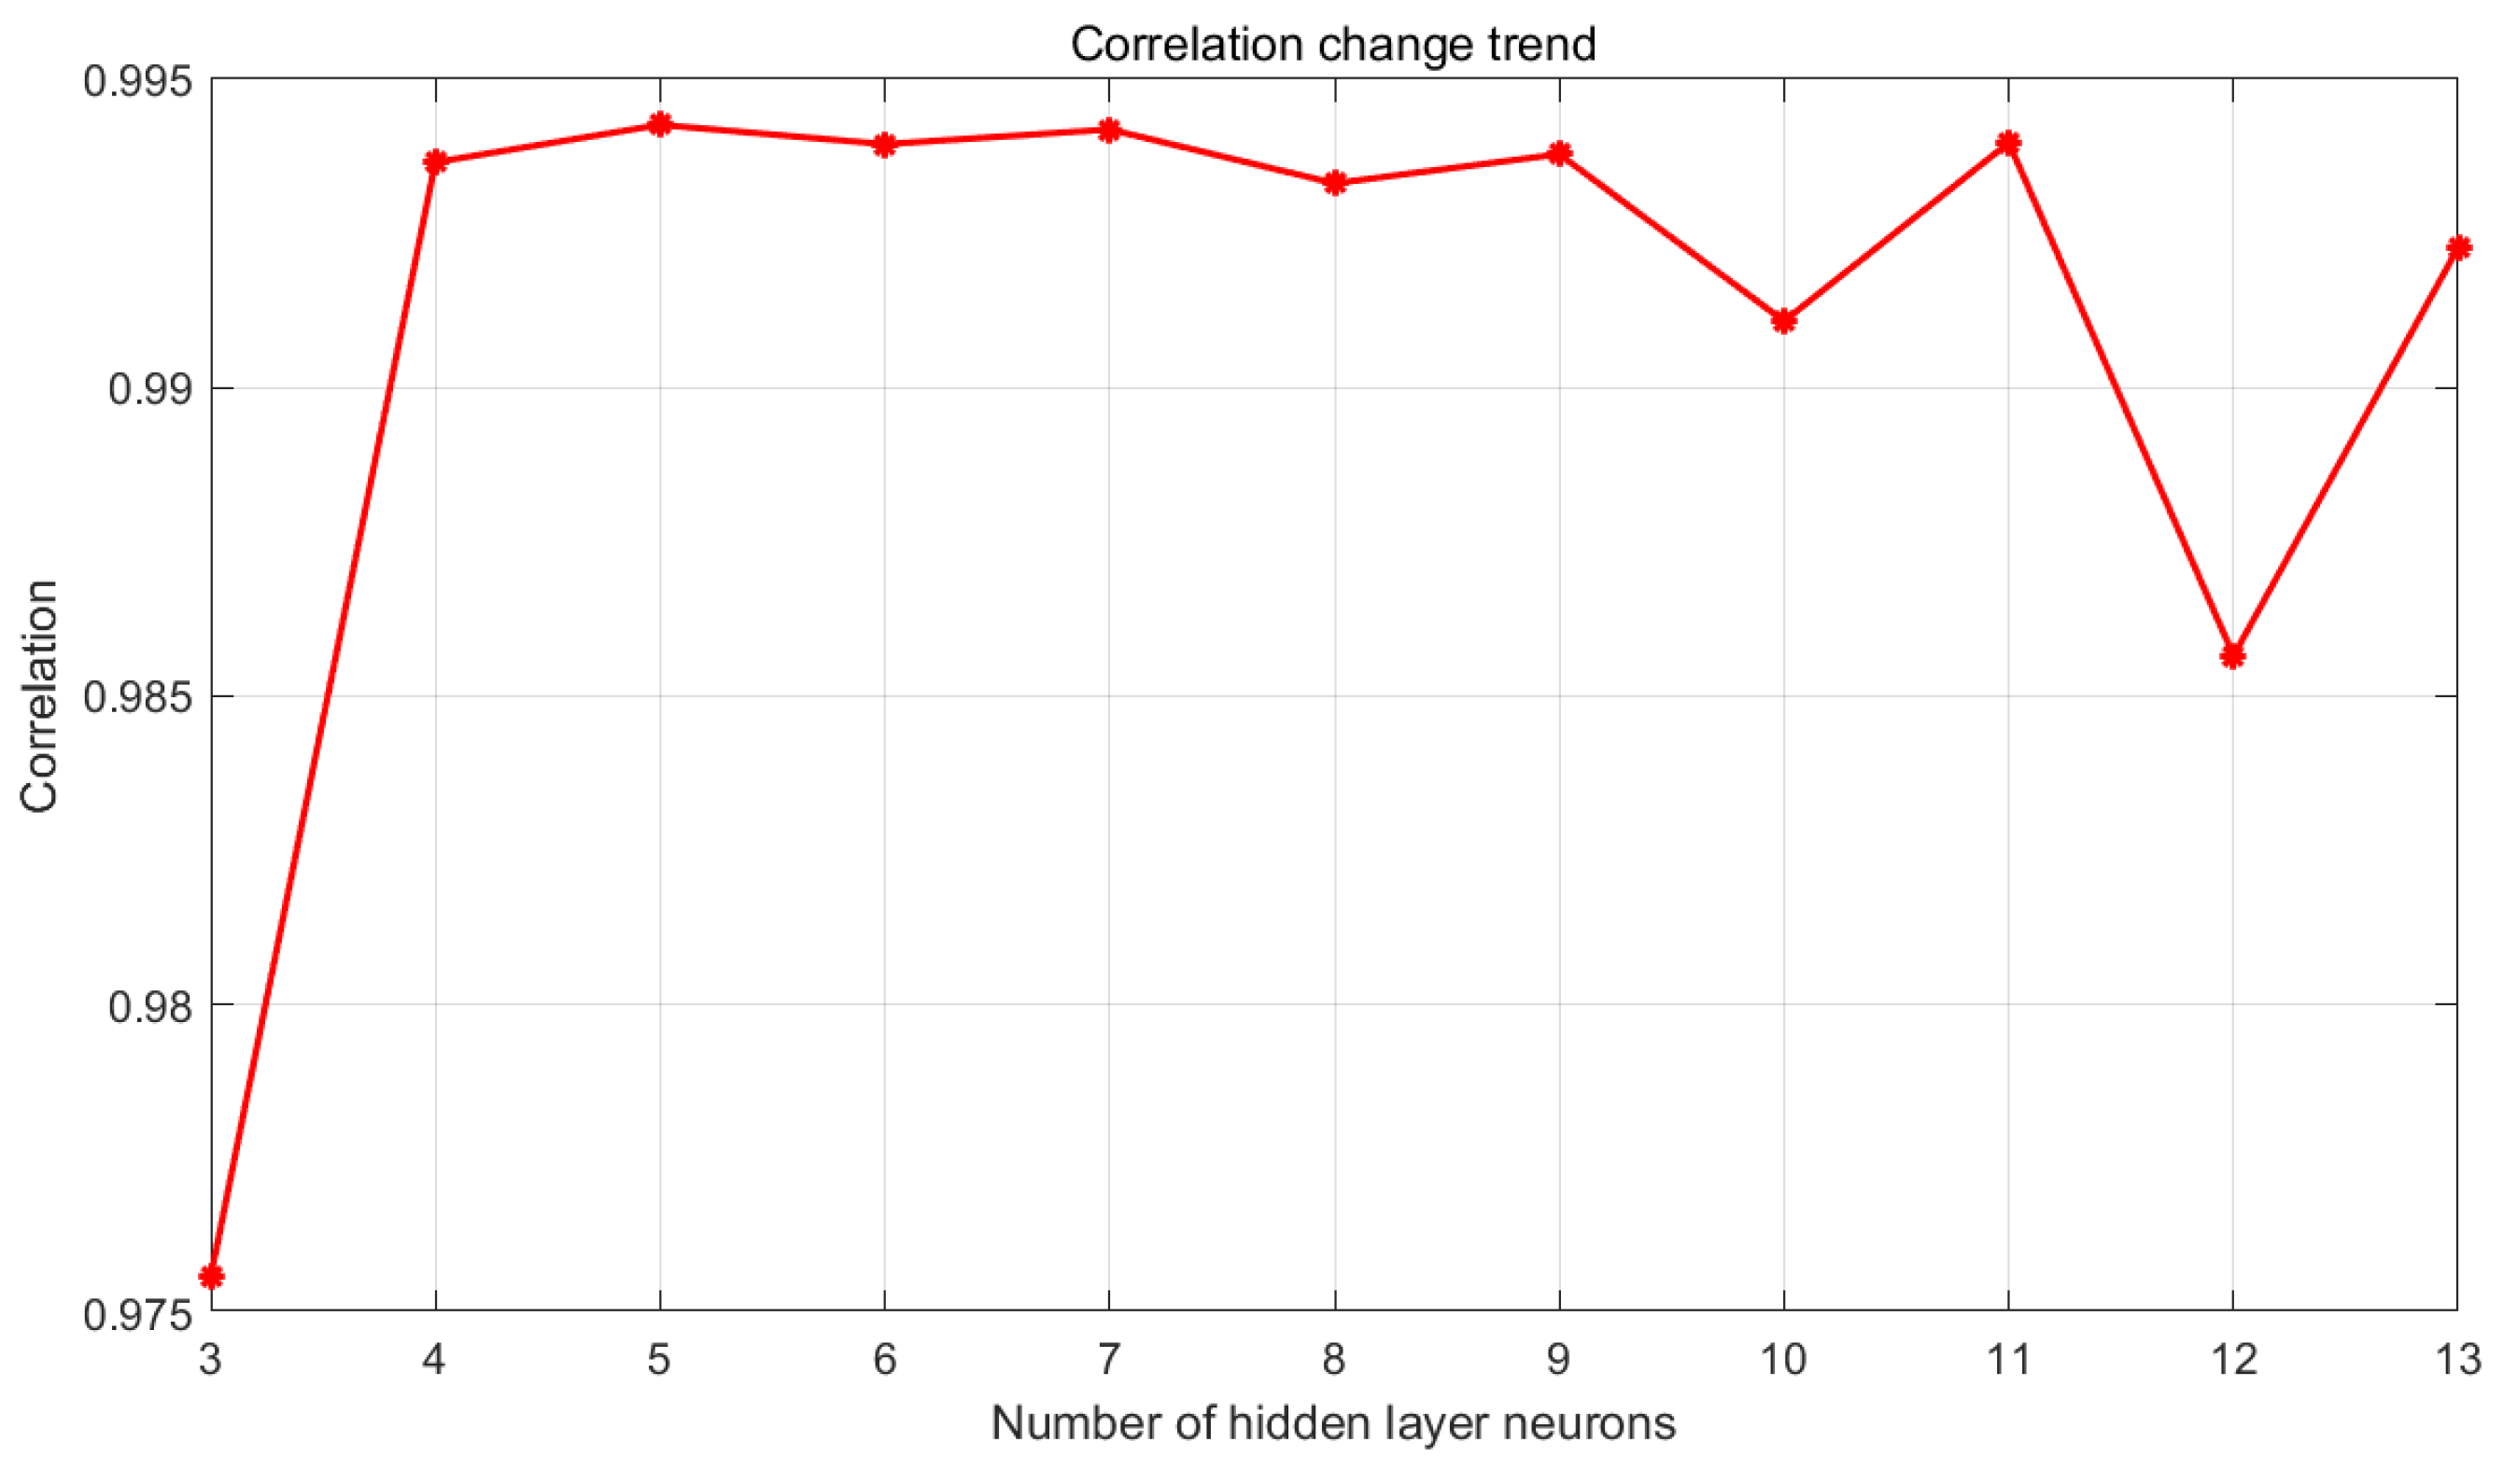
Figure 14. The change trend of the correlation with different hidden layer neurons is shown in
Figure 15.
The lower the error (MSE) value, the more accurate the data results; the higher the change value of the correlation, the closer the number of neurons in the hidden layer is to the real data. As can be seen from
Figure 14 and
Figure 15, when the number of neurons in the hidden layer is 5, the error (MSE) value is the lowest and the correlation is the highest. Therefore, it can be determined that the model with 5 neurons in the hidden layer has an ideal validation effect.
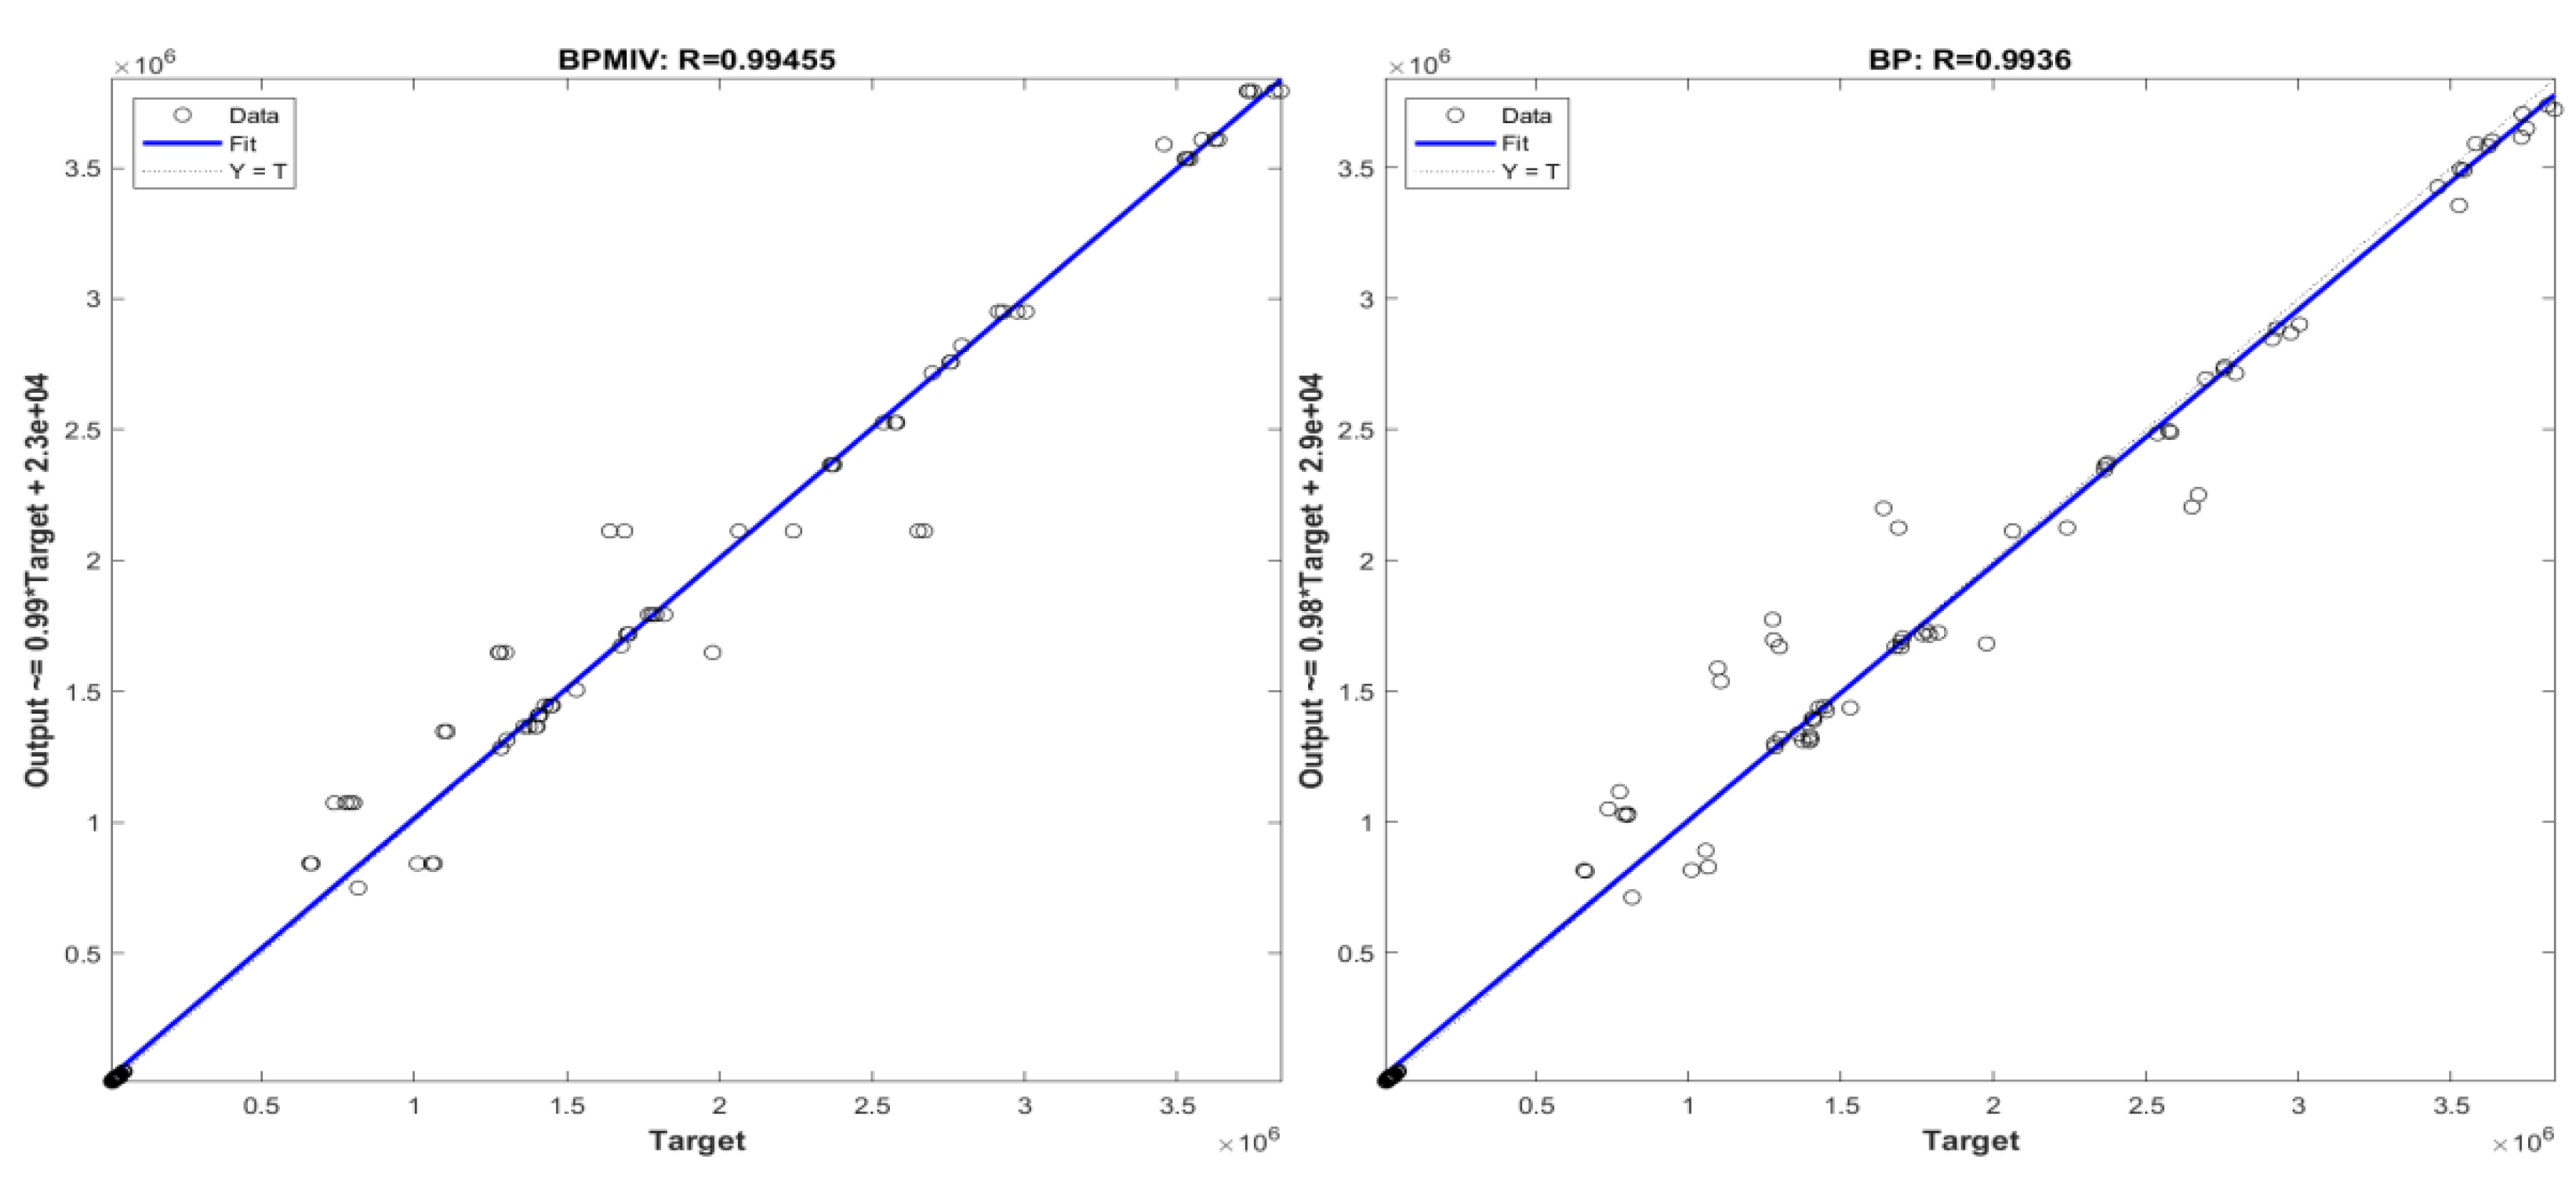
The R value is usually used to measure the correlation between the output and the target. An R value close to 1 indicates a close relationship between the predicted results and the output data, indicating a high degree of accuracy in the predictions.
Figure 16 shows the regression effect of the true values and predicted values of the testing dataset with 5 hidden layer neurons (BP) and the regression effect of the true values and predicted values of the testing dataset with feature selection (MIV-BP). The R values obtained were 0.9936 and 0.99455 when the number of hidden neurons was 5. Compared with the original algorithm, the error precision was improved by 0.095%, further indicating that the MIV-BP neural network in this study has a good predictive effect. Therefore, the number of neurons in the hidden layer is defined as 5.
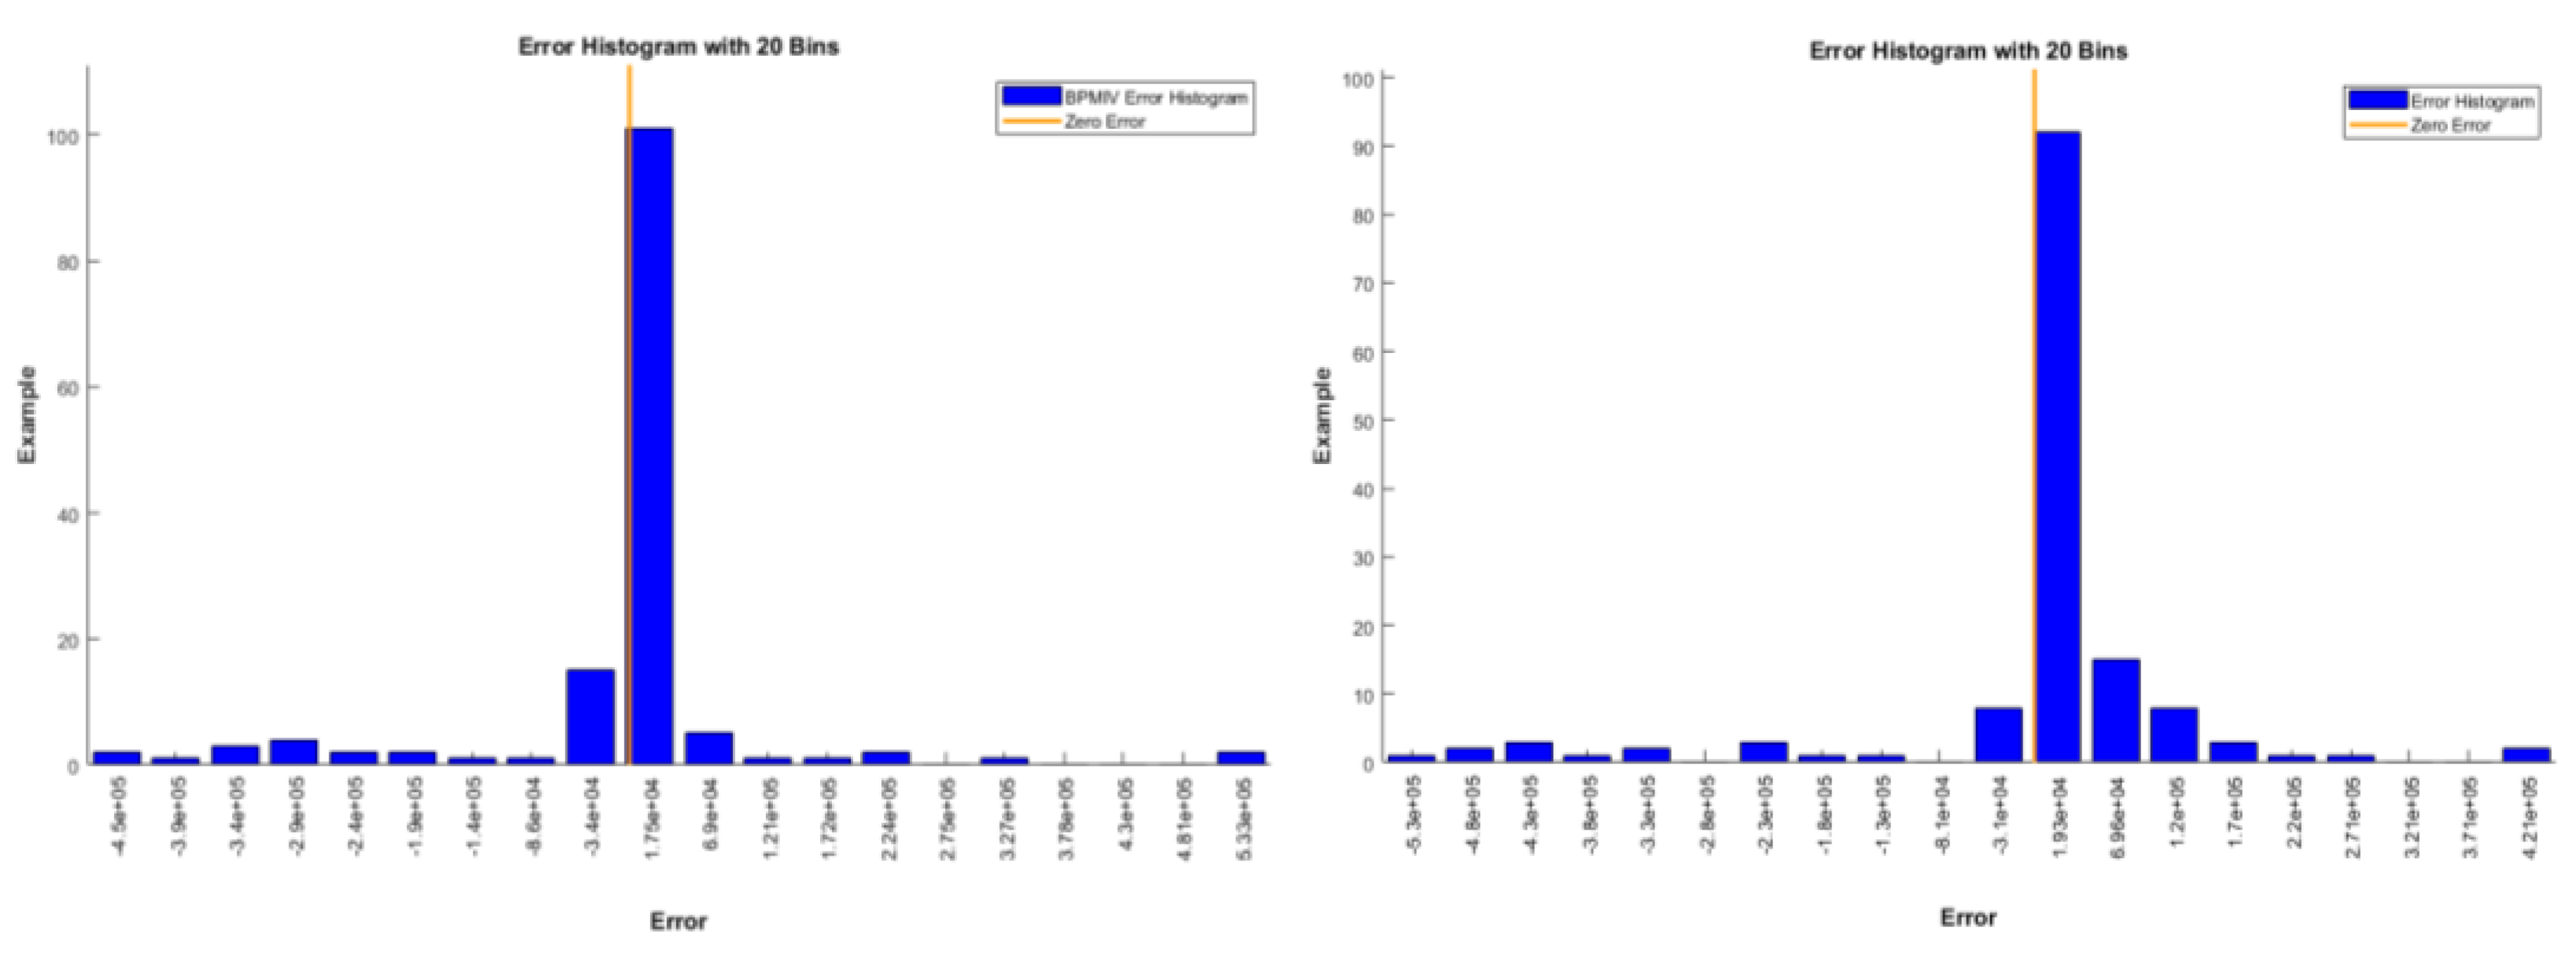
As can be seen from
Figure 17, the error distribution of the true values and predicted values of the testing dataset with 5 hidden layer neurons (BP) is mostly concentrated in the interval of -3.1e+04 to 1.2e+05; the sample error of the true values and predicted values of the testing dataset with feature selection (MIV-BP) is mostly concentrated in the interval of -3.4e+04 to 6.9e+04.
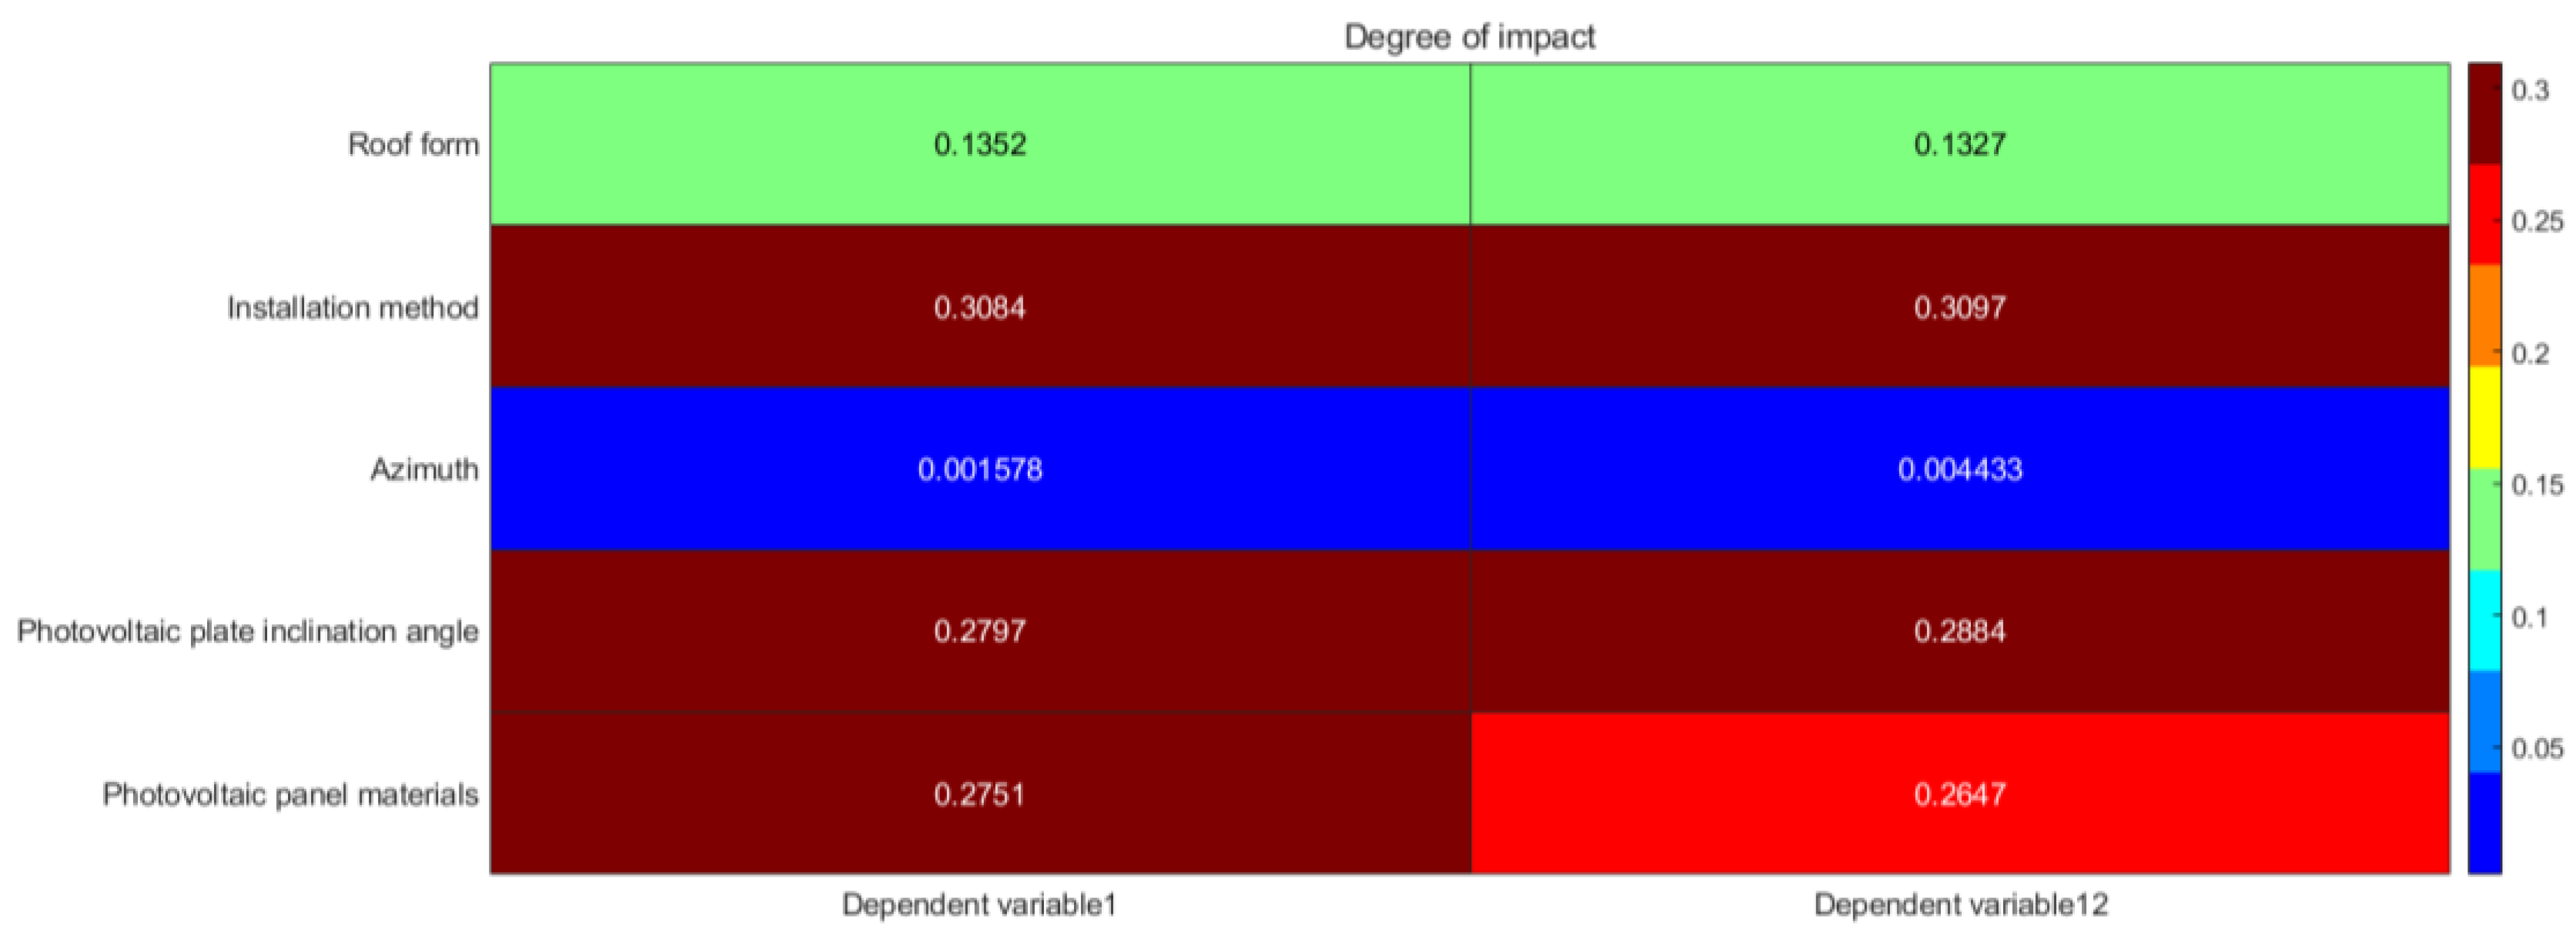
To determine the impact of the features used in this study on the life cycle photovoltaic power generation benefits and carbon emission reduction values, the MIV method was used to screen the 5 features. Two completely new datasets were obtained by increasing and decreasing each feature by 10%, respectively, and then inputted into the model for prediction. This process was repeated to obtain the impact of the 5 features on the life cycle photovoltaic power generation benefits and carbon emission reduction values, as shown in
Figure 18.
In the figure, the darker the color, the higher the impact degree. As shown in the figure, the main factors affecting photovoltaic power generation benefits and carbon emission reduction are the solar panel tilt angle, solar panel material parameters, and installation method. Among them, the installation method has the highest proportion, reaching 30.84% and 30.97%; in this study, the impact of azimuth angle on photovoltaic power generation benefits and carbon emission reduction is the smallest.
5.3. Forecasting Results and Optimization Analysis
This study established a MIV-BP neural network model with a hidden layer containing 5 neurons. Normalized data was input into the model for training, with 80% of the data used as learning samples and 20% of the data used to validate the trained model. Then, the validated model was used to predict the remaining samples' photovoltaic power generation benefits and carbon emission reduction values. The predicted results were denormalized using equation 5.
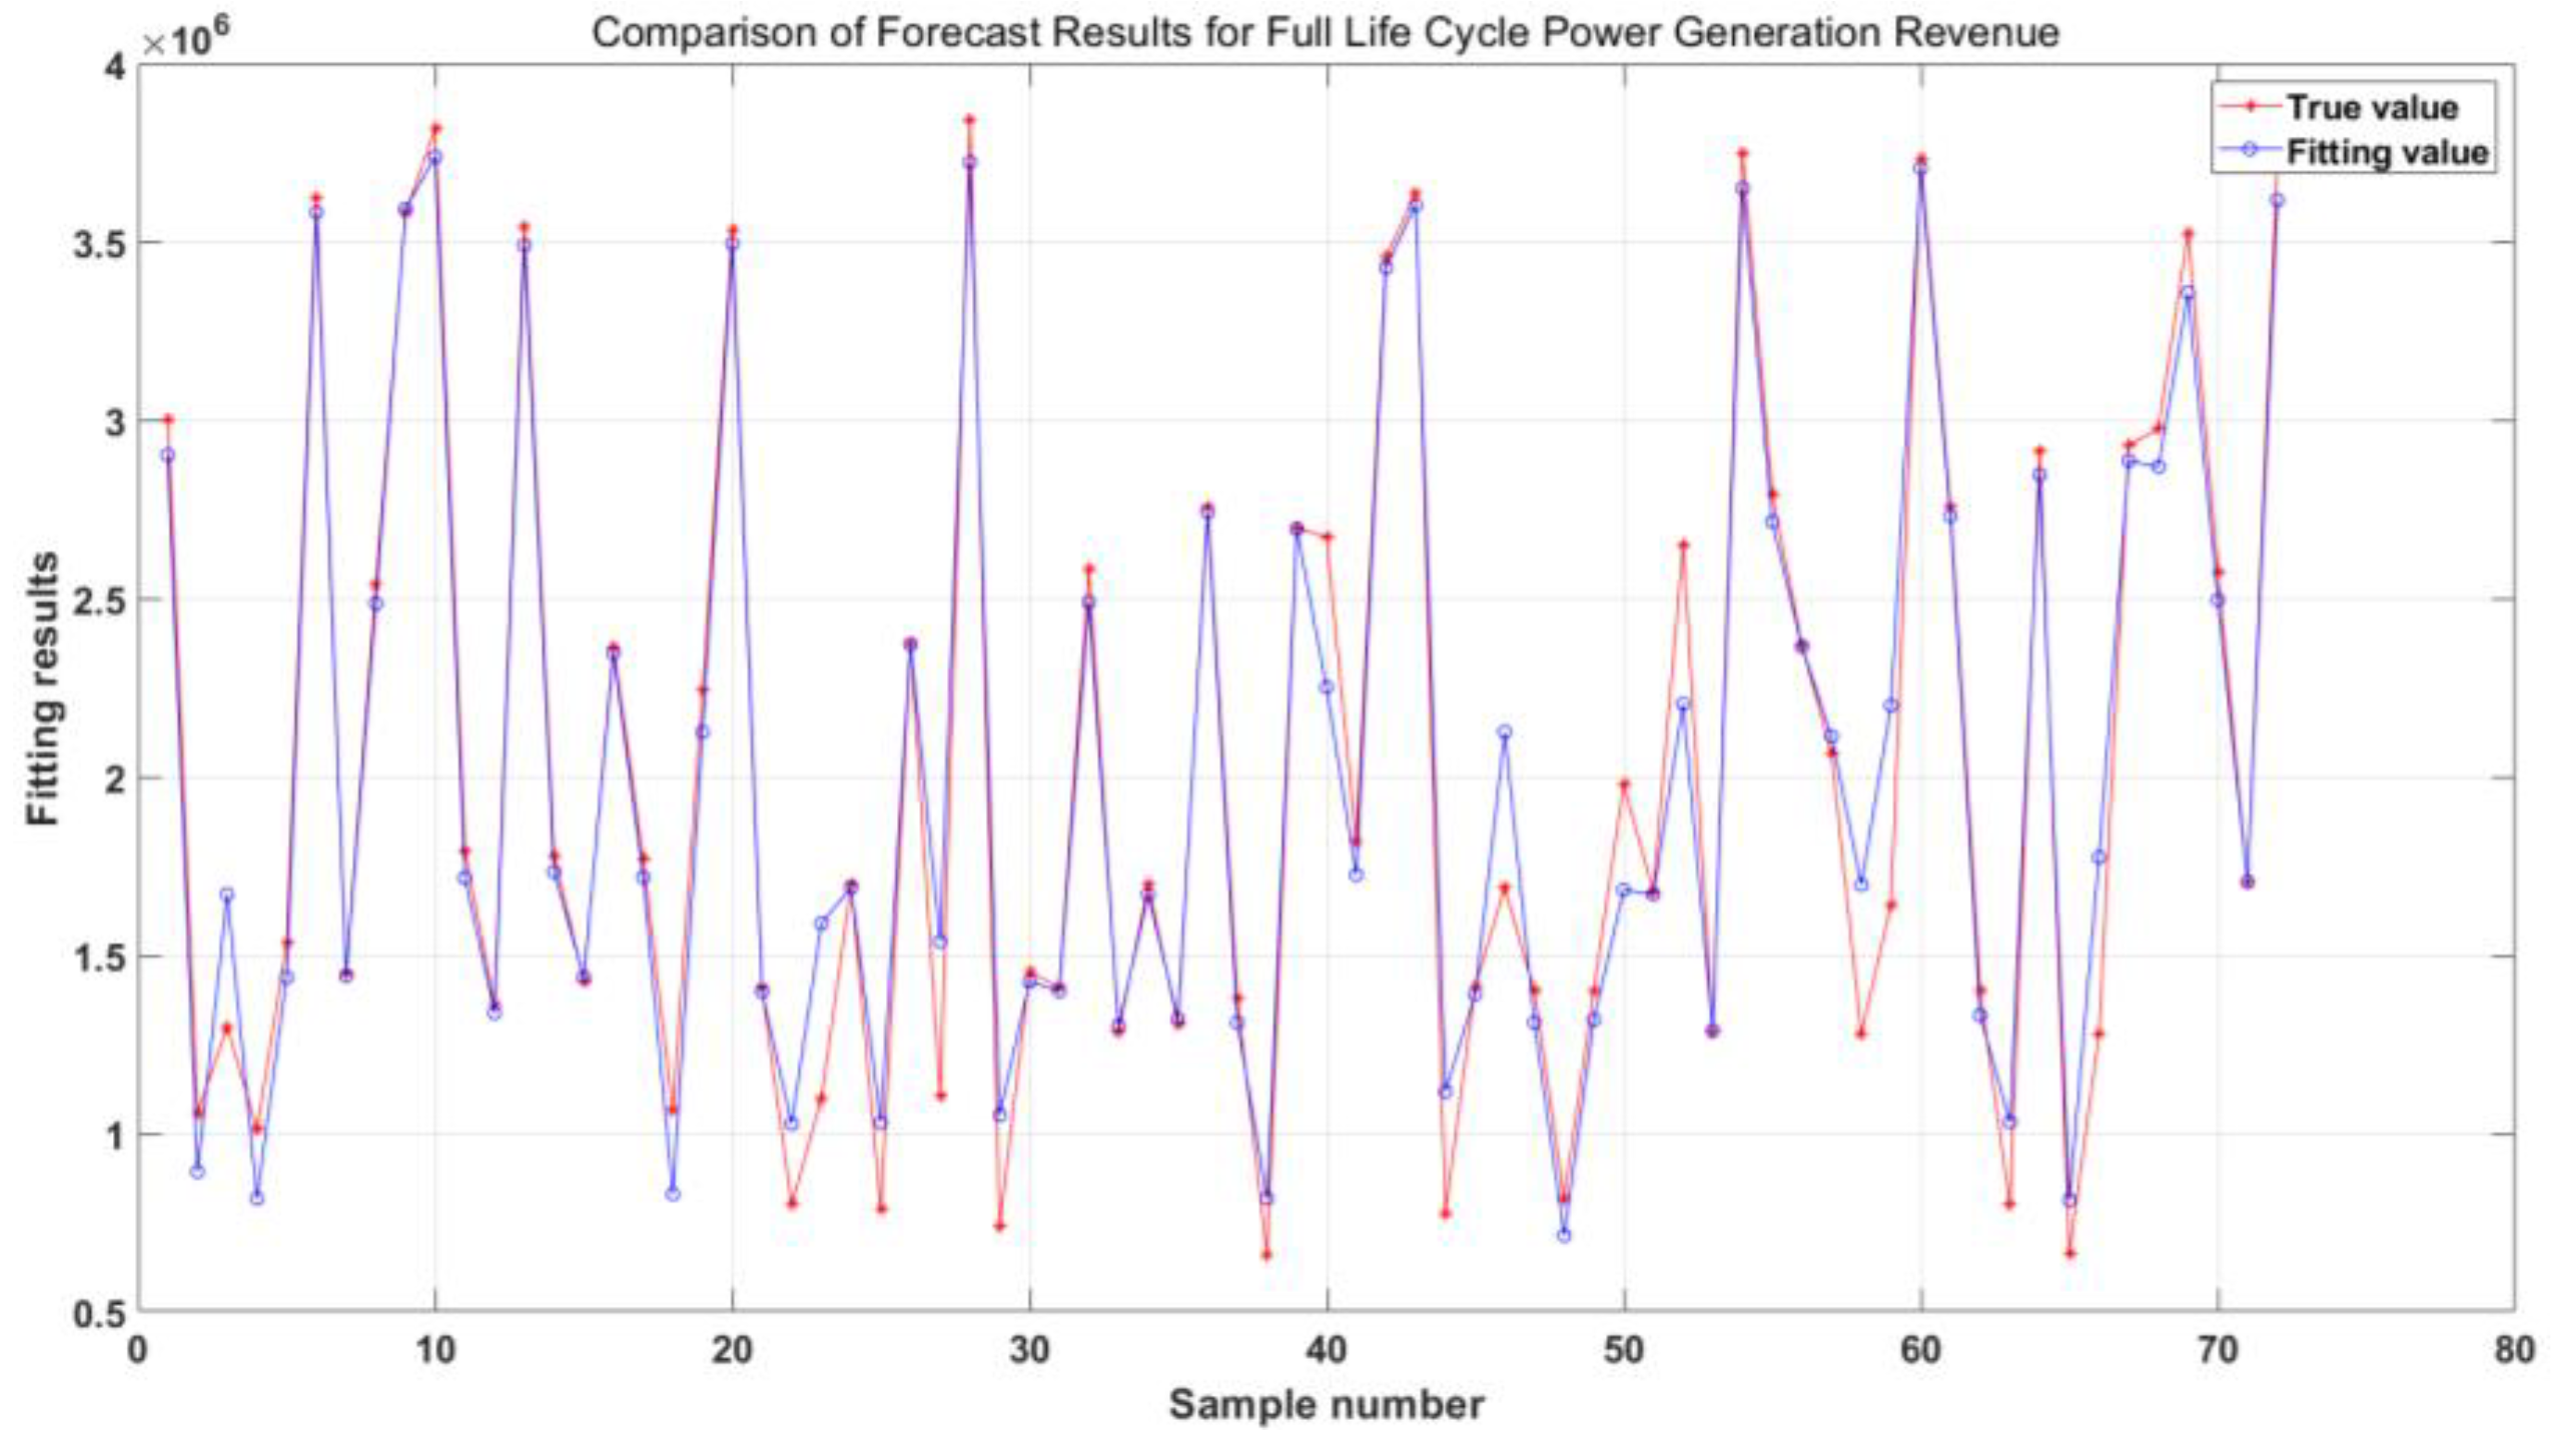
Seventy-two data sets were imported into the BP neural network model for validation and the life cycle photovoltaic power generation benefits data were obtained. They were fitted with real data, as shown in
Figure 19.
As shown in
Figure 19, the results simulated by the trained model have a high degree of fit with the real values, with an average error of 4.12% for the 72 pieces of data. This proves that the model has a good predictive effect.
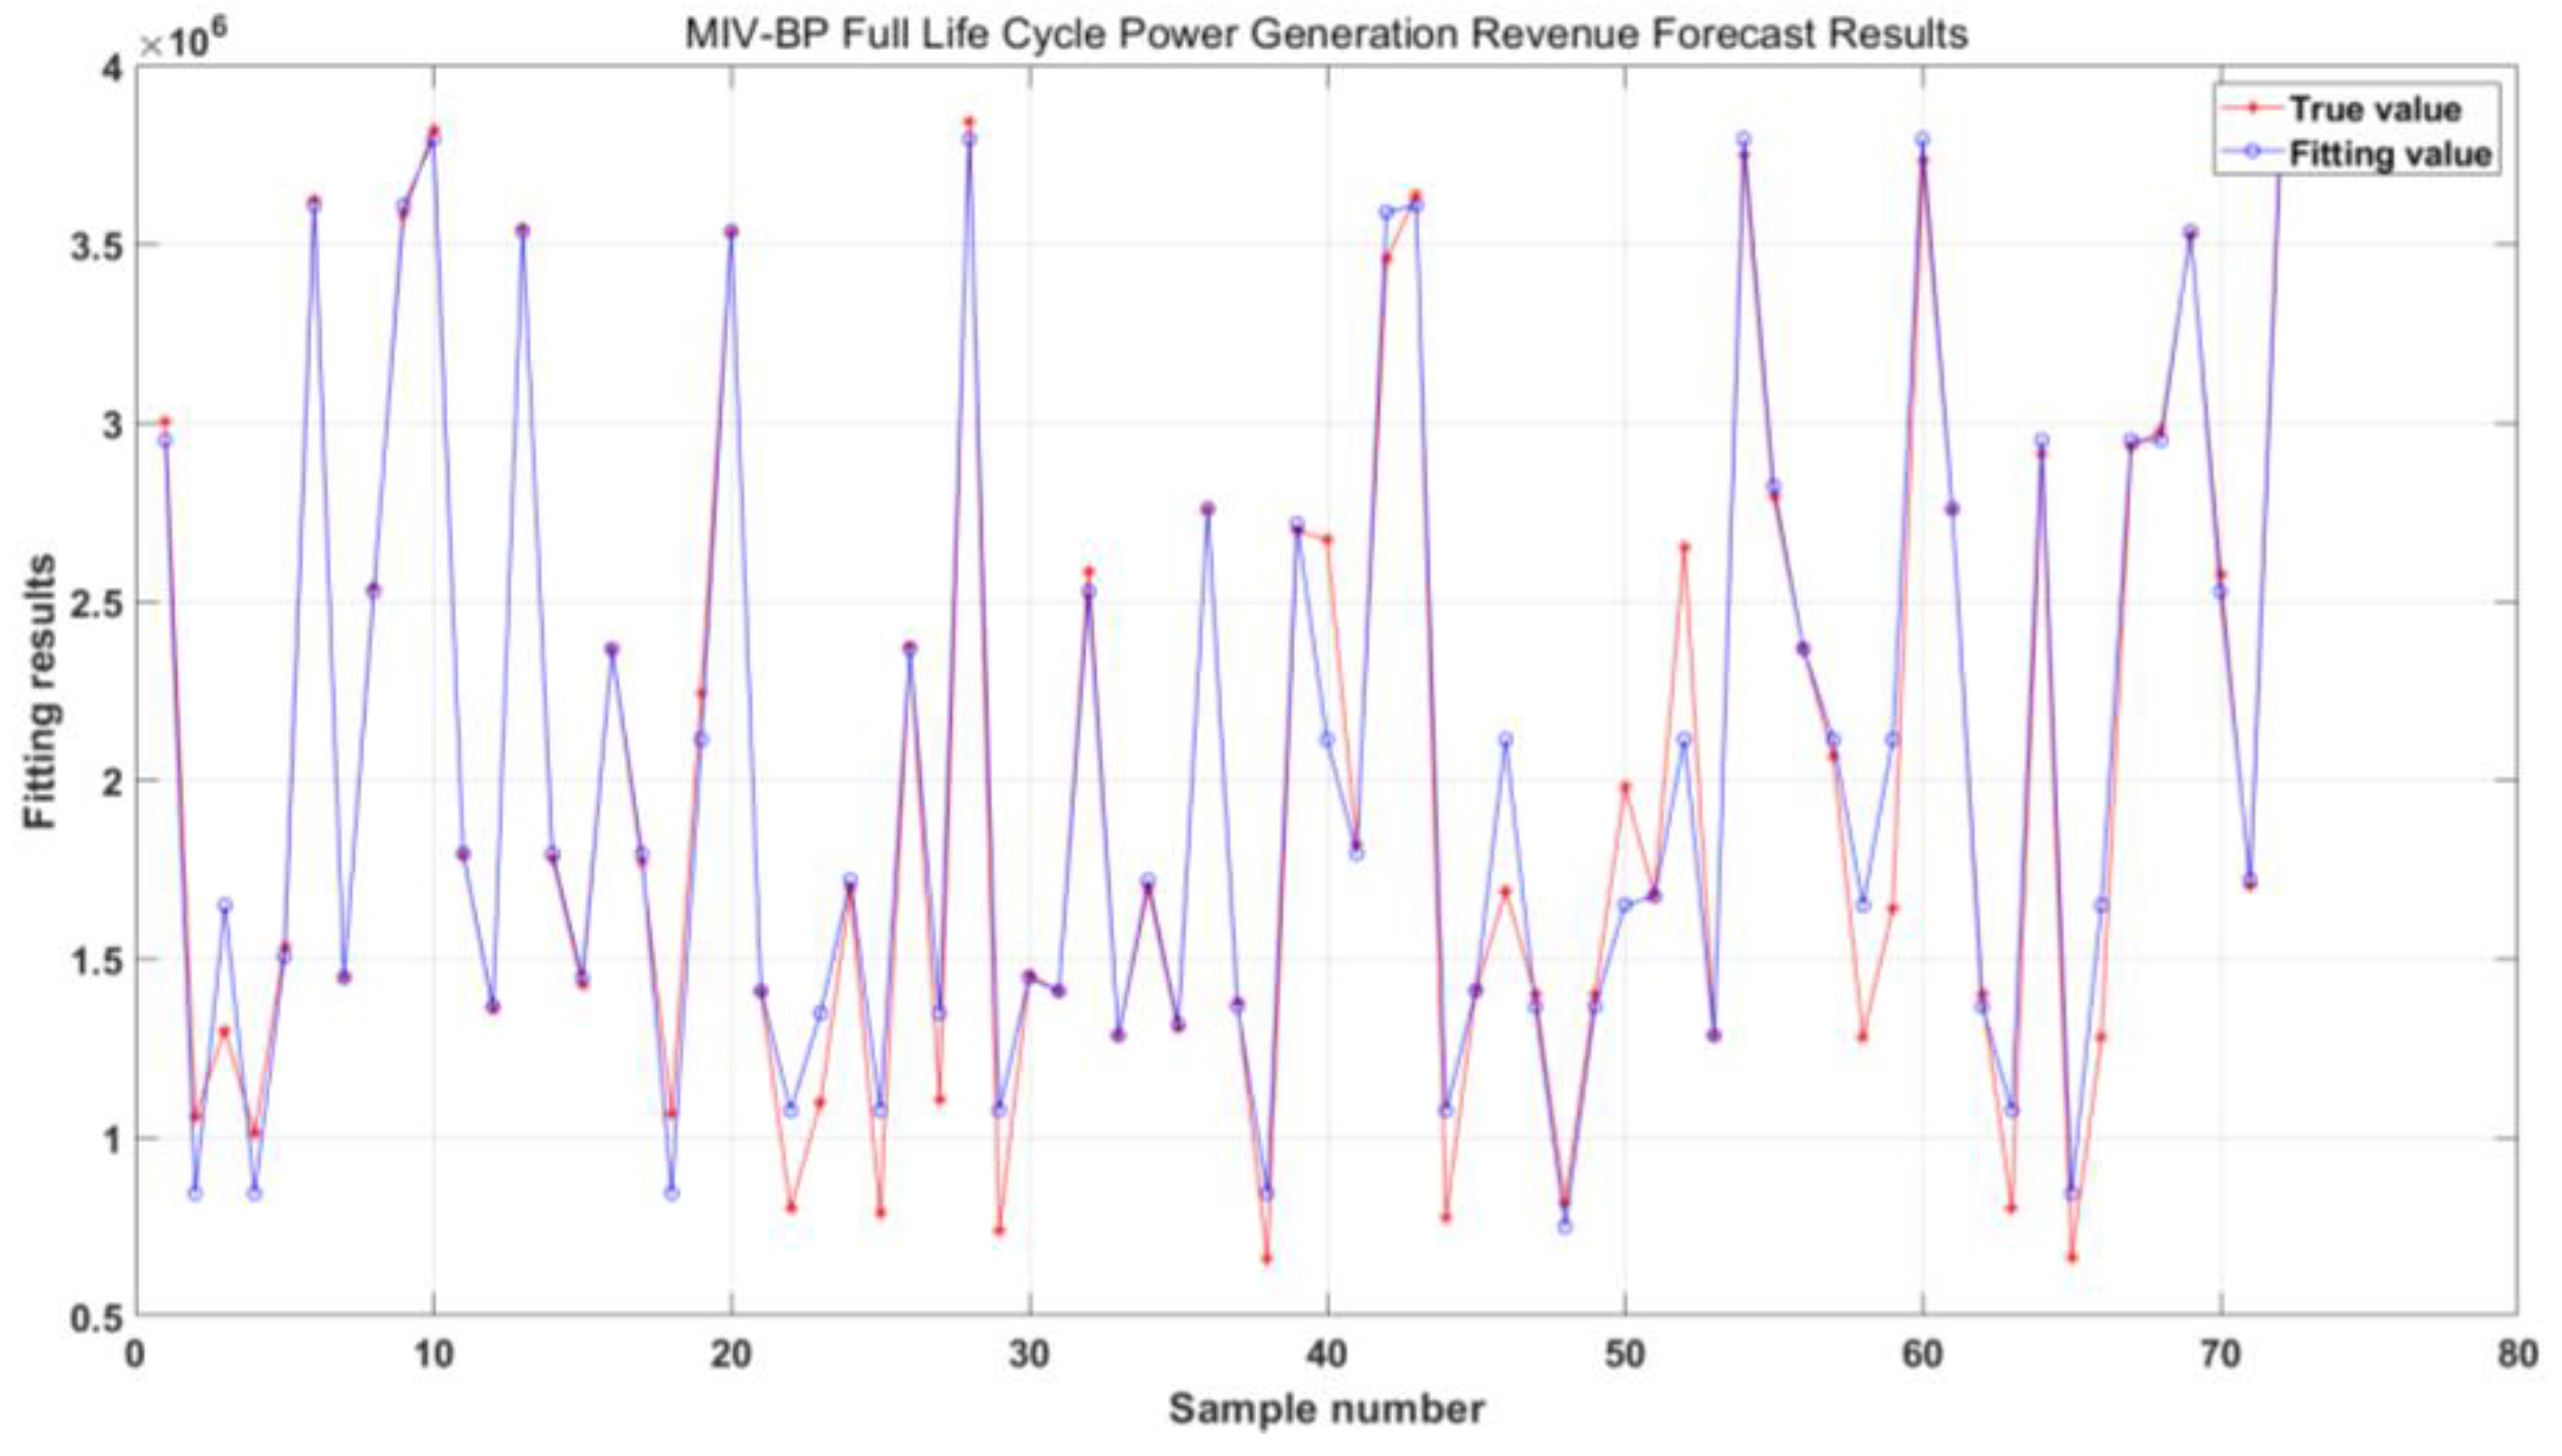
After optimizing the data through MIV by removing feature parameters, the optimized data was imported into the model for verification, and the results are shown in
Figure 20.
As shown in
Figure 20, the results simulated by the optimized data imported into the model after MIV feature elimination have a higher degree of fit with the real values, with an average error of 3.45%. This proves that the optimization effect of MIV is significant, improving the accuracy of the model.
6. Conclusions
The purpose of this study was to assess the impact of passive design feature parameters on the photovoltaic power generation benefits of industrial buildings, and then optimize the values of passive design feature parameters using the MIV-BP neural network model. The study simulated the power generation and carbon emission reduction values of different passive feature parameters over the entire life cycle of research buildings. The results showed that passive design feature parameters, including roof form, photovoltaic panel layout, photovoltaic panel tilt angle, azimuth angle, and photovoltaic module material parameters, had a significant impact on power generation benefits and carbon emission reduction.
In this study, a MIV-BP neural network model with one input layer, one hidden layer, and one output layer was developed. The five design parameters were used as input parameters, and the photovoltaic power generation benefits and carbon emission reduction values calculated from the photovoltaic panels' annual generation were used as output parameters. The number of hidden layer neurons was determined to be 5. The predictive effect of the BP neural network was measured using the MSE of 18829813560.8108 and the R value of 0.9936 for all data. The predicted results for power generation benefits and carbon emission reduction were then compared with the calculated values, with small differences further indicating the accuracy of the BP neural network model. In addition, by selecting passive feature parameter values within their range using MIV, the impact of passive parameters on the results was obtained. The comparative analysis of the prediction results indicated that the best passive feature parameters were the photovoltaic panel layout, photovoltaic panel tilt angle, and photovoltaic material parameters.
Author Contributions
“Conceptualization, Wu.Weidong. and Huang.Yunfeng.; methodology, Wu.Weidong.; software, Huang.Qi.; validation, Huang.Qi., Ye.Peng. and Yan.Qixiang.; formal analysis, Li.Hao.; investigation, Huang.Qi.; resources, Huang.Qi.; data curation, Ye.Peng.; writing—original draft preparation, Huang.Qi.; writing—review and editing, Wu.Weidong.; visualization, Wu.Weidong.; supervision, Huang.Yunfeng.; project administration, Huang.Yunfeng.; funding acquisition, Huang.Qi. All authors have read and agreed to the published version of the manuscript.”.
Funding
“This research was funded by Research Fund of Anhui Provincial Department of Education, grant number 2022AH040233”.
Conflicts of Interest
“The funders had no role in the design of the study; in the collection, analyses, or interpretation of data; in the writing of the manuscript; or in the decision to publish the results”.
References
- Moreira M O, Balestrassi P P, Paiva A P, et al. Design of experiments using artificial neural network ensemble for photovoltaic generation forecasting[J]. Renewable and Sustainable Energy Reviews, 2021, 135: 110450. [CrossRef]
- Mellit A, Pavan A M, Lughi V. Deep learning neural networks for short-term photovoltaic power forecasting[J]. Renewable Energy, 2021, 172: 276-288. [CrossRef]
- Gong D, Ji Q, Tang Y, et al. Multi-scale regional photovoltaic power generation forecasting method based on sequence coding reconstruction[J]. Energy Reports, 2023, 9: 135-143. [CrossRef]
- Othman M M, Fazil M F A M, Harun M H H, et al. Performance comparison of artificial intelligence techniques in short term current forecasting for photovoltaic system[J]. International Journal of Power Electronics and Drive Systems, 2019, 10(4): 2148. [CrossRef]
- YANG Wei, L. Y., YANG Linlin, XUE Sihao. (2012). "Researching the effect of industrial workshop’s different aspect ratio on indoor temperature distribution." JOURNAL OF CIVIL AND ENVIRONMENTAL ENGINEERING 34(Z2): 29-32. (in Chinese).
- McKeen P, Fung A S. The effect of building aspect ratio on energy efficiency: A case study for multi-unit residential buildings in Canada[J]. Buildings, 2014, 4(3): 336-354. [CrossRef]
- Tong N Y O, Leung D Y C. Effects of building aspect ratio, diurnal heating scenario, and wind speed on reactive pollutant dispersion in urban street canyons[J]. Journal of Environmental Sciences, 2012, 24(12): 2091-2103. [CrossRef]
- Jiang L, Liu W, Liao H, et al. Investigation of the Geometric Shape Effect on the Solar Energy Potential of Gymnasium Buildings[J]. Energies, 2020, 13(23): 6369. [CrossRef]
- GB 50797-2012, Design specification for photovoltaic power plants [S].
- Wei, Z., et al. (2012). "Simulation and analysis on the optimum horizontal dip angle and aspect of a fixed Py---Taking Yinchuan city of Nincxia as a case." J. Xi'an Univ. of Arch. & Tech. (Natural Science Edition) 44(05): 700-706. (in Chinese).
- Zonglin W, Yadong F, Jianguo W, et al. IMPACT OF TILT ANGLE AND AZIMUTH ON PHOTOVOLTAIC POWER GENERATION CHARACTERISTICS IN ZHANGBEI AREA[J]. Acta Energiae Solaris Sinica, 2022, 43(10): 73.
- Wei, Z., et al. (2012). "Simulation and analysis on the optimum horizontal dip angle and aspect of a fixed Py---Taking Yinchuan city of Nincxia as a case." J. Xi'an Univ. of Arch. & Tech. (Natural Science Edition) 44(05): 700-706. (in Chinese).
- El-Atab N, Qaiser N, Bahabry R, et al. Corrugation enabled asymmetrically ultrastretchable (95%) monocrystalline silicon solar cells with high efficiency (19%)[J]. Advanced Energy Materials, 2019, 9(45): 1902883. [CrossRef]
- Chen W, Liu X, Liu W, et al. Optimization of activated phosphorus concentration in recrystallized polysilicon layers for the n-TOPCon solar cell application[J]. Solar Energy Materials and Solar Cells, 2023, 252: 112206. [CrossRef]
- Zheng G F, Yang H, Man C H, et al. Novel semiconductor CIGS photovoltaic material and thin-film ED technology[J]. Pan Tao Ti Hsueh Pao/Chinese Journal of Semiconductors, 2001, 22(11): 1357-1363.
Figure 2.
Characteristic analysis of industrial plant buildings in Ningxia
Figure 2.
Characteristic analysis of industrial plant buildings in Ningxia
Figure 3.
Four different aspect ratios for flat roofs
Figure 3.
Four different aspect ratios for flat roofs
Figure 4.
Monthly analysis of ambient temperature of indoor space
Figure 4.
Monthly analysis of ambient temperature of indoor space
Figure 5.
Schematic diagram of industrial buildings with different slopes
Figure 5.
Schematic diagram of industrial buildings with different slopes
Figure 6.
Schematic diagram of flat roof plant
Figure 6.
Schematic diagram of flat roof plant
Figure 7.
Schematic diagram of PV panel tilting mounting
Figure 7.
Schematic diagram of PV panel tilting mounting
Figure 8.
Schematic diagram of laying of PV panels for flat roof plant with change of azimuth angle
Figure 8.
Schematic diagram of laying of PV panels for flat roof plant with change of azimuth angle
Figure 9.
Schematic layout of PV panels for flat roof plant with constant azimuth angle
Figure 9.
Schematic layout of PV panels for flat roof plant with constant azimuth angle
Figure 10.
Schematic diagram of different azimuths of a sloped-roof factory building
Figure 10.
Schematic diagram of different azimuths of a sloped-roof factory building
Figure 11.
Comparison of annual electricity generation of flat roof plants with different azimuths and PV panel laying areas
Figure 11.
Comparison of annual electricity generation of flat roof plants with different azimuths and PV panel laying areas
Figure 12.
Comparison of annual electricity generation of sloped-roof plants with different roof slopes and different azimuths
Figure 12.
Comparison of annual electricity generation of sloped-roof plants with different roof slopes and different azimuths
Figure 13.
BP neural network model framework
Figure 13.
BP neural network model framework
Figure 14.
Trends in forecast errors
Figure 14.
Trends in forecast errors
Figure 15.
Trends in correlation
Figure 15.
Trends in correlation
Figure 16.
Regression analysis of the model.
Figure 16.
Regression analysis of the model.
Figure 17.
Histogram of error for 20 intervals
Figure 17.
Histogram of error for 20 intervals
Figure 18.
Graph analyzing the degree of influence of features on the results
Figure 18.
Graph analyzing the degree of influence of features on the results
Figure 19.
Comparison of Life Cycle Generation Benefit Projections
Figure 19.
Comparison of Life Cycle Generation Benefit Projections
Figure 20.
Comparison of MIV-BP whole life cycle power generation benefit prediction results
Figure 20.
Comparison of MIV-BP whole life cycle power generation benefit prediction results
Table 1.
Horizontal radiation in Yinchuan
Table 1.
Horizontal radiation in Yinchuan
| Meteo for YinChuan-Synthetical generated data from monthly values |
|---|
| Interval beginning |
Jan |
Feb |
Mar |
Apr |
May |
Jun |
Jul |
Aug |
Sep |
Oct |
Nov |
Dec |
Year |
GlobHor
kWh/m2/mth |
82.7 |
98.4 |
136.3 |
166.8 |
199.4 |
193.4 |
191.1 |
172.3 |
140.8 |
115.7 |
84.8 |
73.3 |
1654.8 |
Table 2.
Parameters of sloped-roof industrial buildings
Table 2.
Parameters of sloped-roof industrial buildings
| Elevation |
Aspect Ratios |
Building widths/m |
Length of building/m |
Site Area
/m2
|
Roof Area
/m2
|
| 10° |
3 |
15 |
50 |
750 |
761 |
| 20° |
3 |
15 |
50 |
750 |
798 |
| 30° |
3 |
15 |
50 |
750 |
866 |
Table 3.
Parameters of sloped-roof industrial buildings
Table 3.
Parameters of sloped-roof industrial buildings
| Roof Slope |
Aspect Ratios |
Building widths/m |
Length of building/m |
Site Area
/m2
|
Roof Area
/m2
|
| 0° |
3 |
15 |
50 |
750 |
750 |
Table 4.
Comparison of power generation benefits of flat-roofed and tilted photovoltaic panels for flat-roofed plants.
Table 4.
Comparison of power generation benefits of flat-roofed and tilted photovoltaic panels for flat-roofed plants.
| Installation Forms |
Photovoltaic system parameters |
Total area of photovoltaic panels
/m2
|
Total annual power generation
/(kW·h) |
Average annual power generation per unit area
/(kW·h/m2) |
| Photovoltaic conversion efficiency |
Integrated system efficiency |
| Tilting Type |
0.17 |
0.893 |
391.2 |
123109 |
314.70 |
| Pavement |
0.17 |
0.881 |
750 |
201186 |
268.25 |
Table 5.
Comparison of power generation benefits of flat photovoltaic panels for sloping roof plants.
Table 5.
Comparison of power generation benefits of flat photovoltaic panels for sloping roof plants.
| Elevation |
Installation Forms |
Site Area
/m2
|
Roof Area
/m2
|
Total annual power generation
/(kW·h) |
Average annual power generation per unit area
/(kW·h/m2) |
| 10° |
Pavement |
750 |
761 |
161923 |
212.78 |
| 20° |
Pavement |
750 |
798 |
164376 |
205.98 |
| 30° |
Pavement |
750 |
866 |
171429 |
197.95 |
Table 6.
Schematic representation of the area of PV panels that can be installed at different azimuths in industrial buildings with flat roofs
Table 6.
Schematic representation of the area of PV panels that can be installed at different azimuths in industrial buildings with flat roofs
| Azimuth |
Mounting Inclination |
Installation form |
RoofArea/㎡ |
Maximum installation area/㎡ |
Optimally orientated installation area/㎡ |
| 0° |
30° |
Tilting Type |
750 |
391.2 |
391.2 |
| 15° |
30° |
Tilting Type |
750 |
391.2 |
230 |
| 30° |
30° |
Tilting Type |
750 |
391.2 |
235 |
| 45° |
30° |
Tilting Type |
750 |
391.2 |
237 |
| 60° |
30° |
Tilting Type |
750 |
391.2 |
239 |
| 75° |
30° |
Tilting Type |
750 |
391.2 |
244 |
| 90° |
30° |
Tilting Type |
750 |
391.2 |
293 |
| 105° |
30° |
Tilting Type |
750 |
391.2 |
244 |
| 120° |
30° |
Tilting Type |
750 |
391.2 |
239 |
| 135° |
30° |
Tilting Type |
750 |
391.2 |
237 |
| 150° |
30° |
Tilting Type |
750 |
391.2 |
235 |
| 165° |
30° |
Tilting Type |
750 |
391.2 |
230 |
| 180° |
30° |
Tilting Type |
750 |
391.2 |
391.2 |
Table 7.
Parameters of 6 types of PV modules
Table 7.
Parameters of 6 types of PV modules
| PV Module |
Module Area/m2
|
Rated Power/W |
Efficiency/% |
| A-Si |
1.12 |
64 |
6.3 |
| CdTe |
0.72 |
50 |
6.9 |
| CIS |
1.73 |
60 |
8.2 |
| P-Si |
0.64 |
75 |
11.6 |
| M-Si |
1.26 |
170 |
13.5 |
| HIT |
1.18 |
180 |
17.3 |
|
Disclaimer/Publisher’s Note: The statements, opinions and data contained in all publications are solely those of the individual author(s) and contributor(s) and not of MDPI and/or the editor(s). MDPI and/or the editor(s) disclaim responsibility for any injury to people or property resulting from any ideas, methods, instructions or products referred to in the content. |
© 2023 by the authors. Licensee MDPI, Basel, Switzerland. This article is an open access article distributed under the terms and conditions of the Creative Commons Attribution (CC BY) license (http://creativecommons.org/licenses/by/4.0/).
