Submitted:
07 November 2023
Posted:
07 November 2023
You are already at the latest version
Abstract
Keywords:
1. Introduction
2. Retrofit solutions
3. Seismic analyses
3.1. Numerical model
3.2. Model validation
3.3. Results
4. Energy performance analyses
4.1. Numerical model
4.1.1. Geometry and materials
4.1.2. Model description
4.1.3. Steady-state regime
4.1.4. Periodic regime
4.1.5. Dynamic regime
4.1.6. Mesh selection
4.2. Results and discussion
5. Conclusions
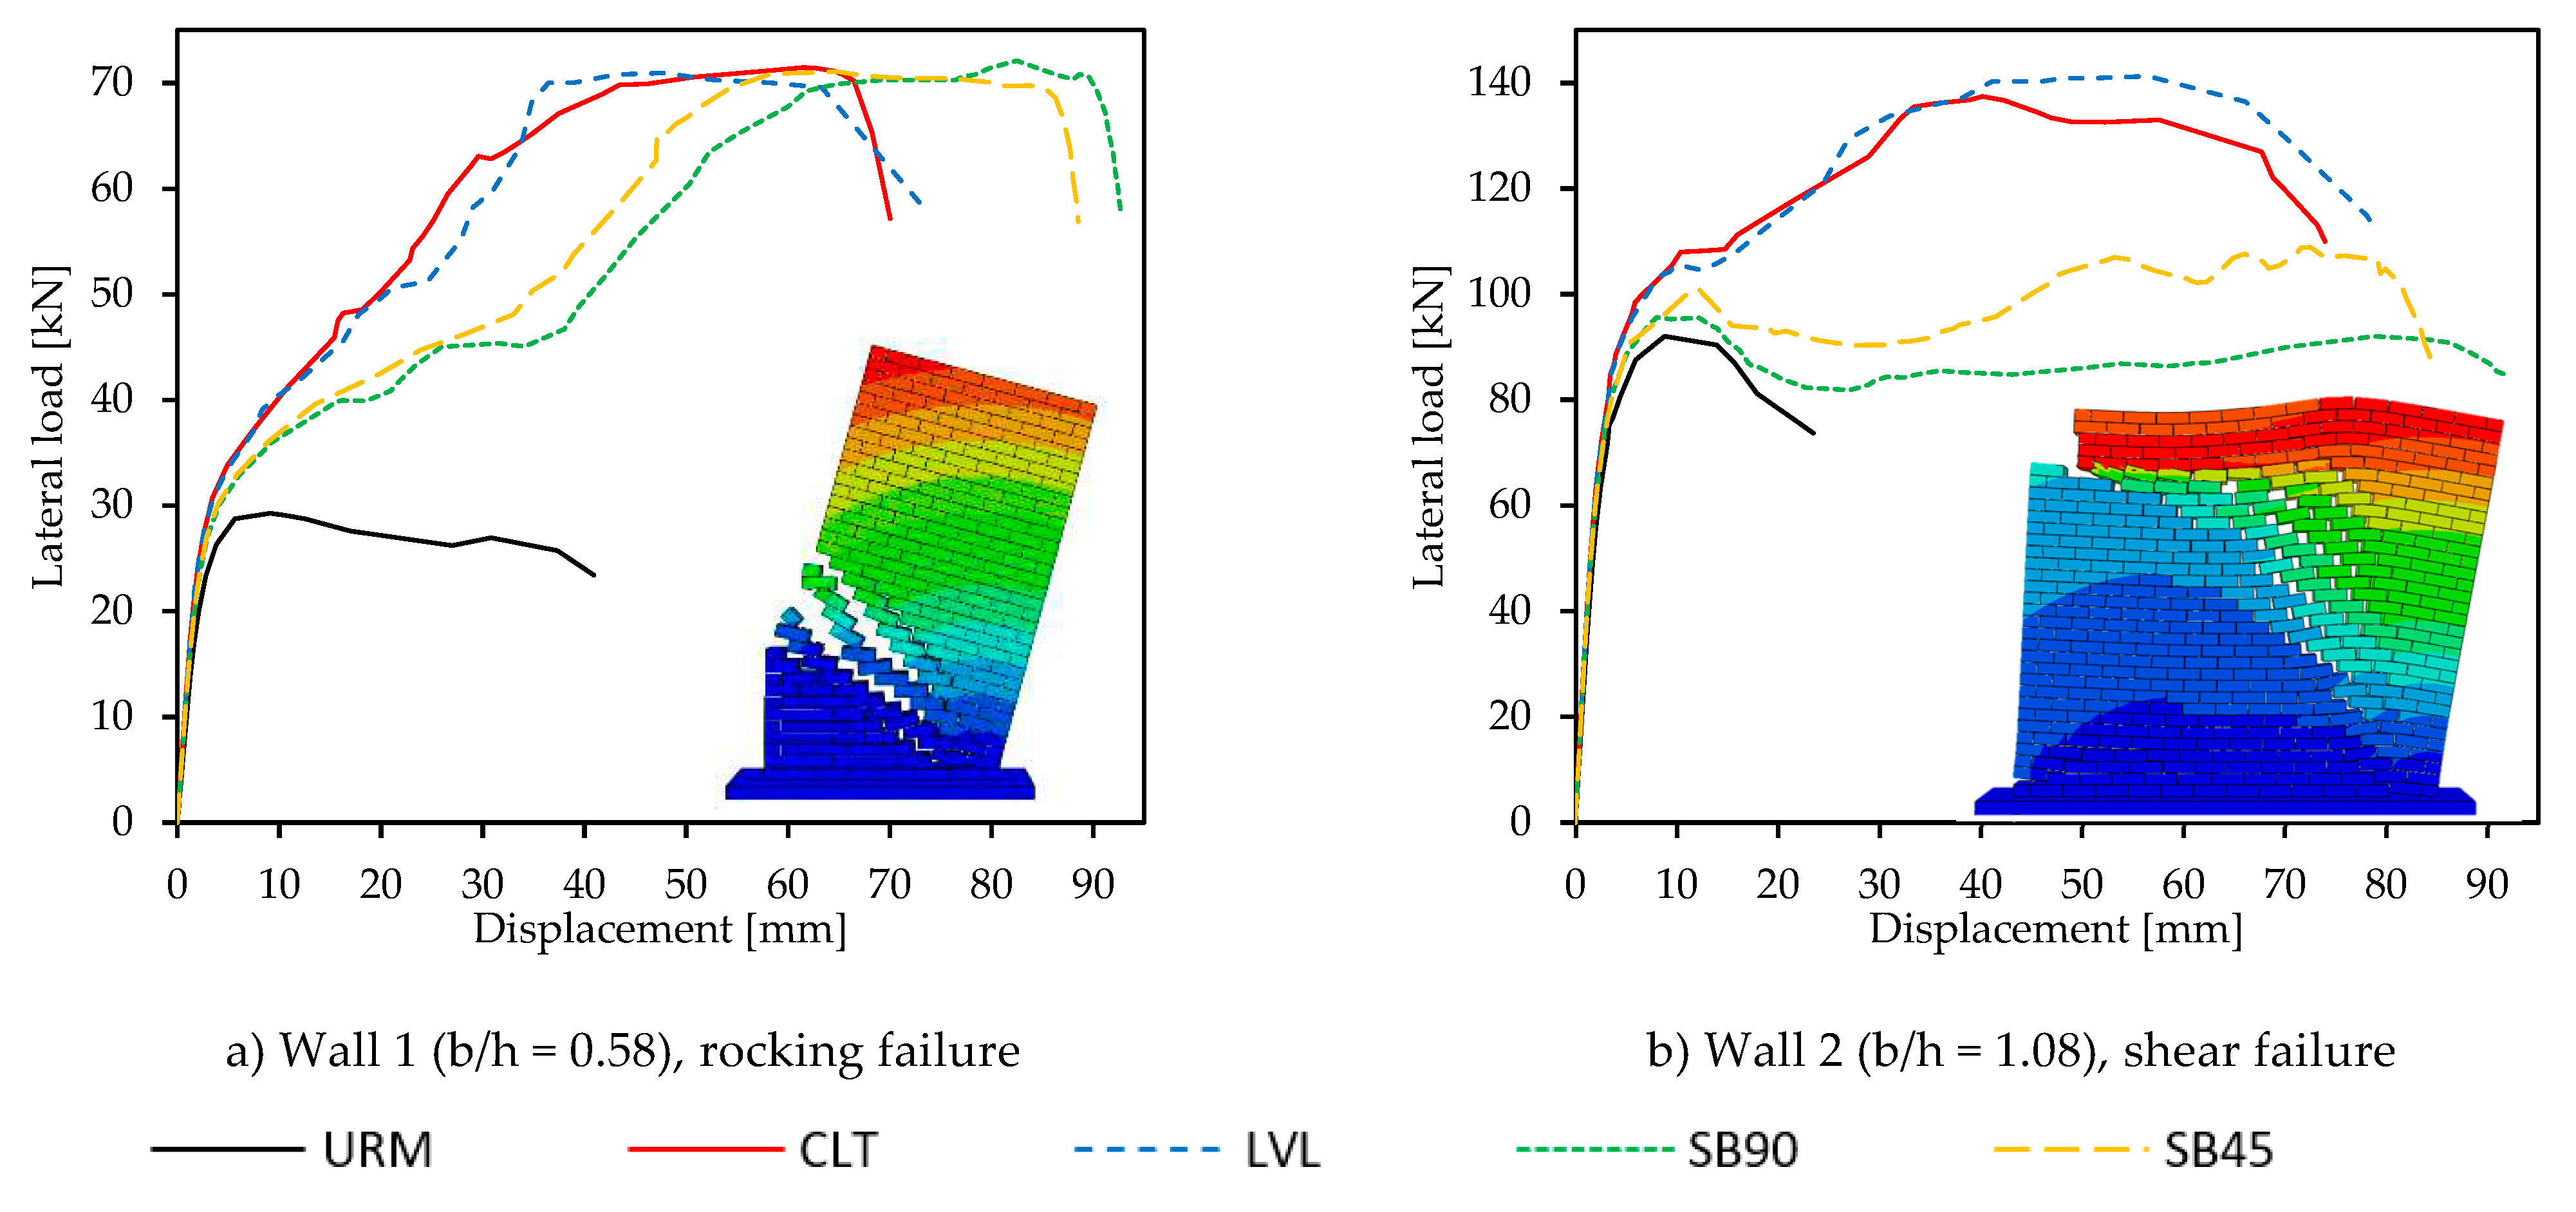
- The timber panel retrofits (i.e., CLT and LVL panels) proved to be more effective than the solutions with the timber frame and the OSB sheathing (i.e., SB90 and SB45) in improving the in-plane mechanical behavior of double-leaf masonry walls. Increases in lateral load-carrying capacity of 145% and 52% and in displacement capacities of 70% and 226% were obtained for the timber panel retrofits in the cases of rocking and shear failure modes, respectively.
- In the case of rocking behavior, the solutions with the timber frame and the OSB sheathing exhibited the same load carrying capacity as the panel-based retrofits (as the wall capacity was limited by the strength of the tension anchors at the base) even though the maximum capacity was engaged at larger drift values (>1.80%), exceeding the limits typically adopted for masonry structures. In the case of shear failure, the solutions SB45 and SB90 produced a considerable increase only in the wall displacement capacity (increases > 265%).
- The energy performance of the masonry walls was noticeably improved by the application of the retrofit solutions. Reductions in the thermal transmittance (U) up to 87% and of the periodic thermal transmittance (Yie) up to 97% were noticed.
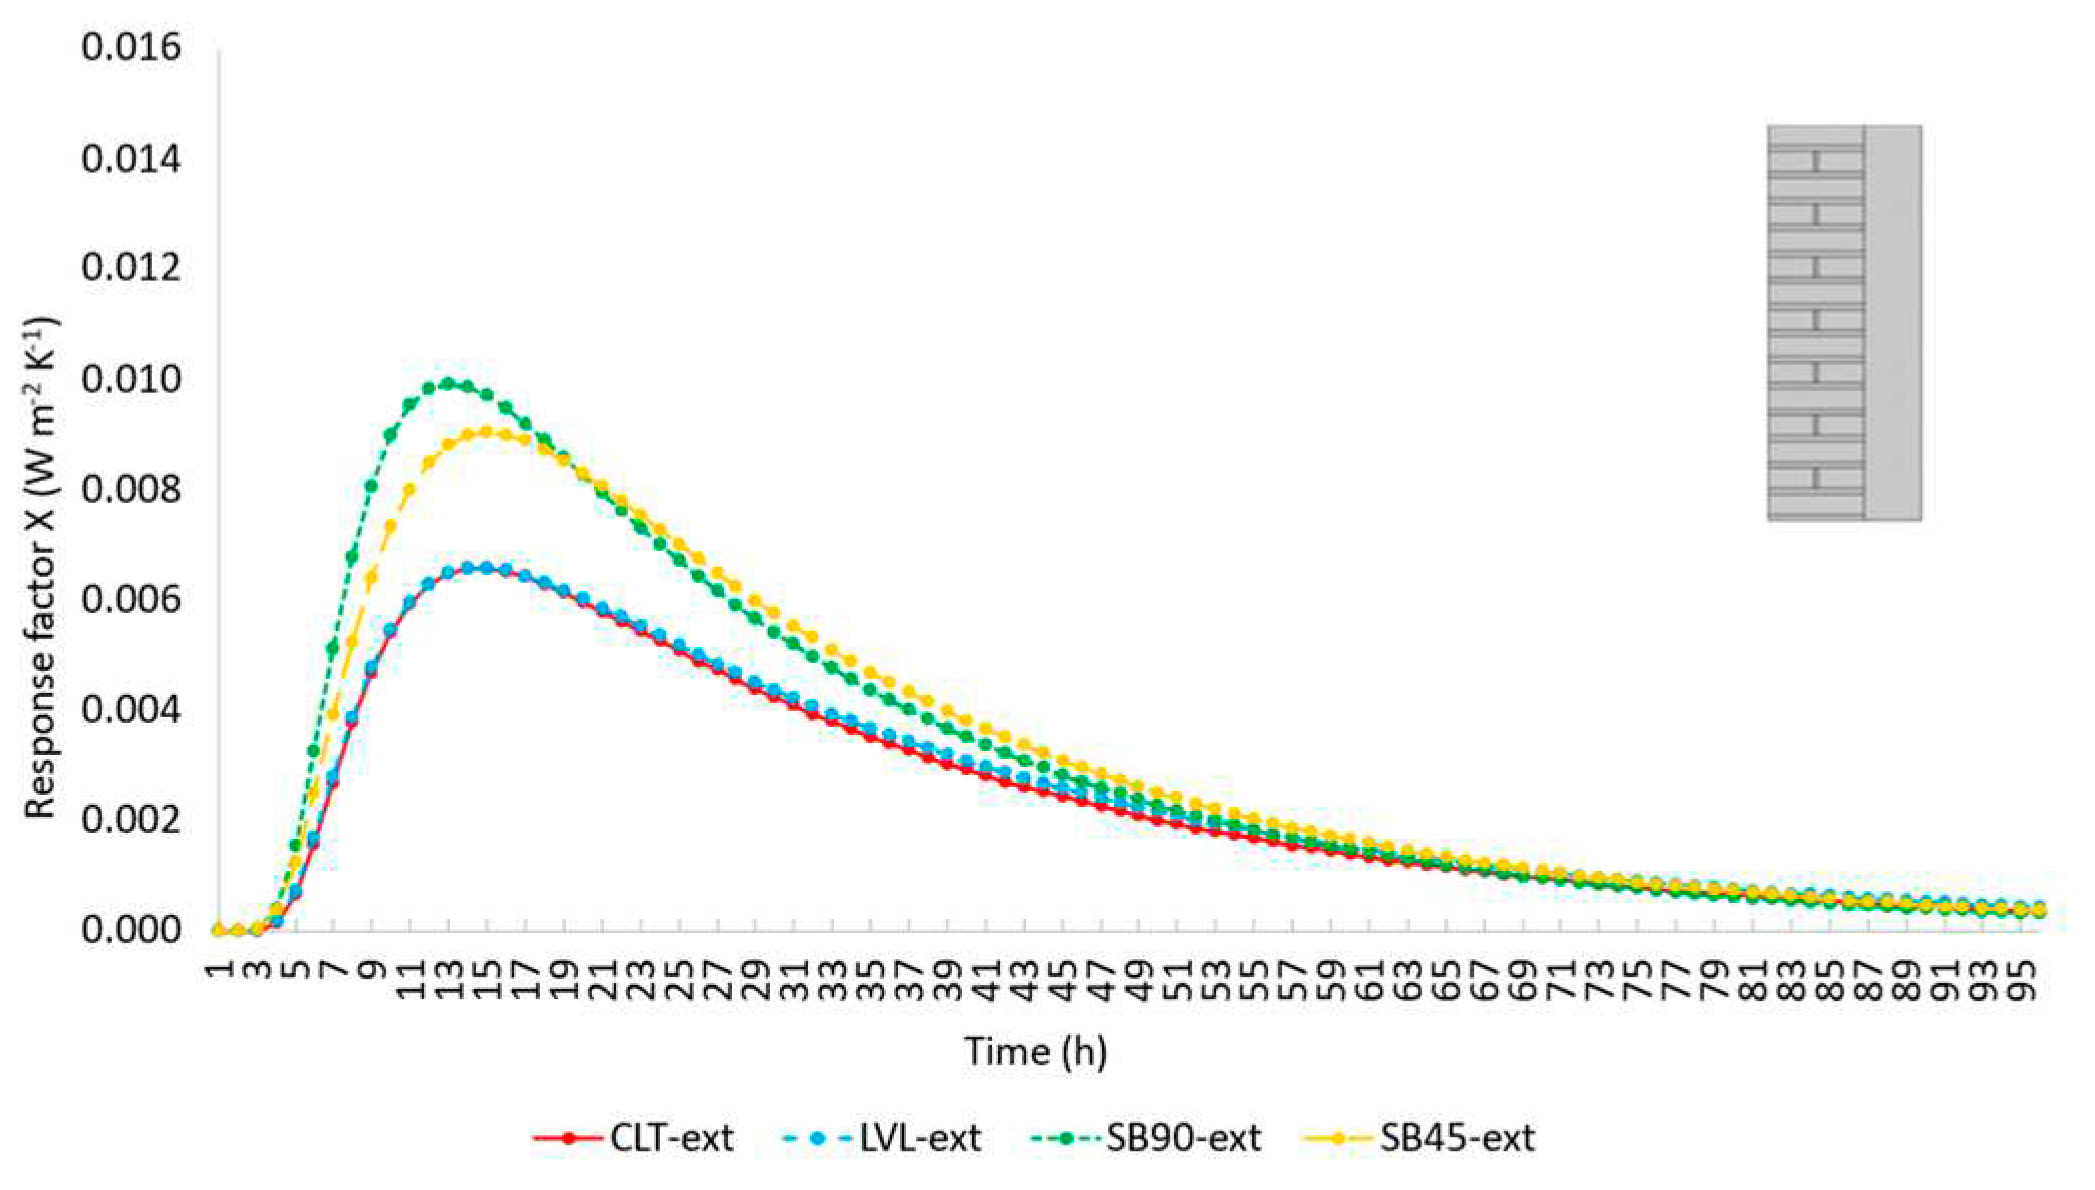
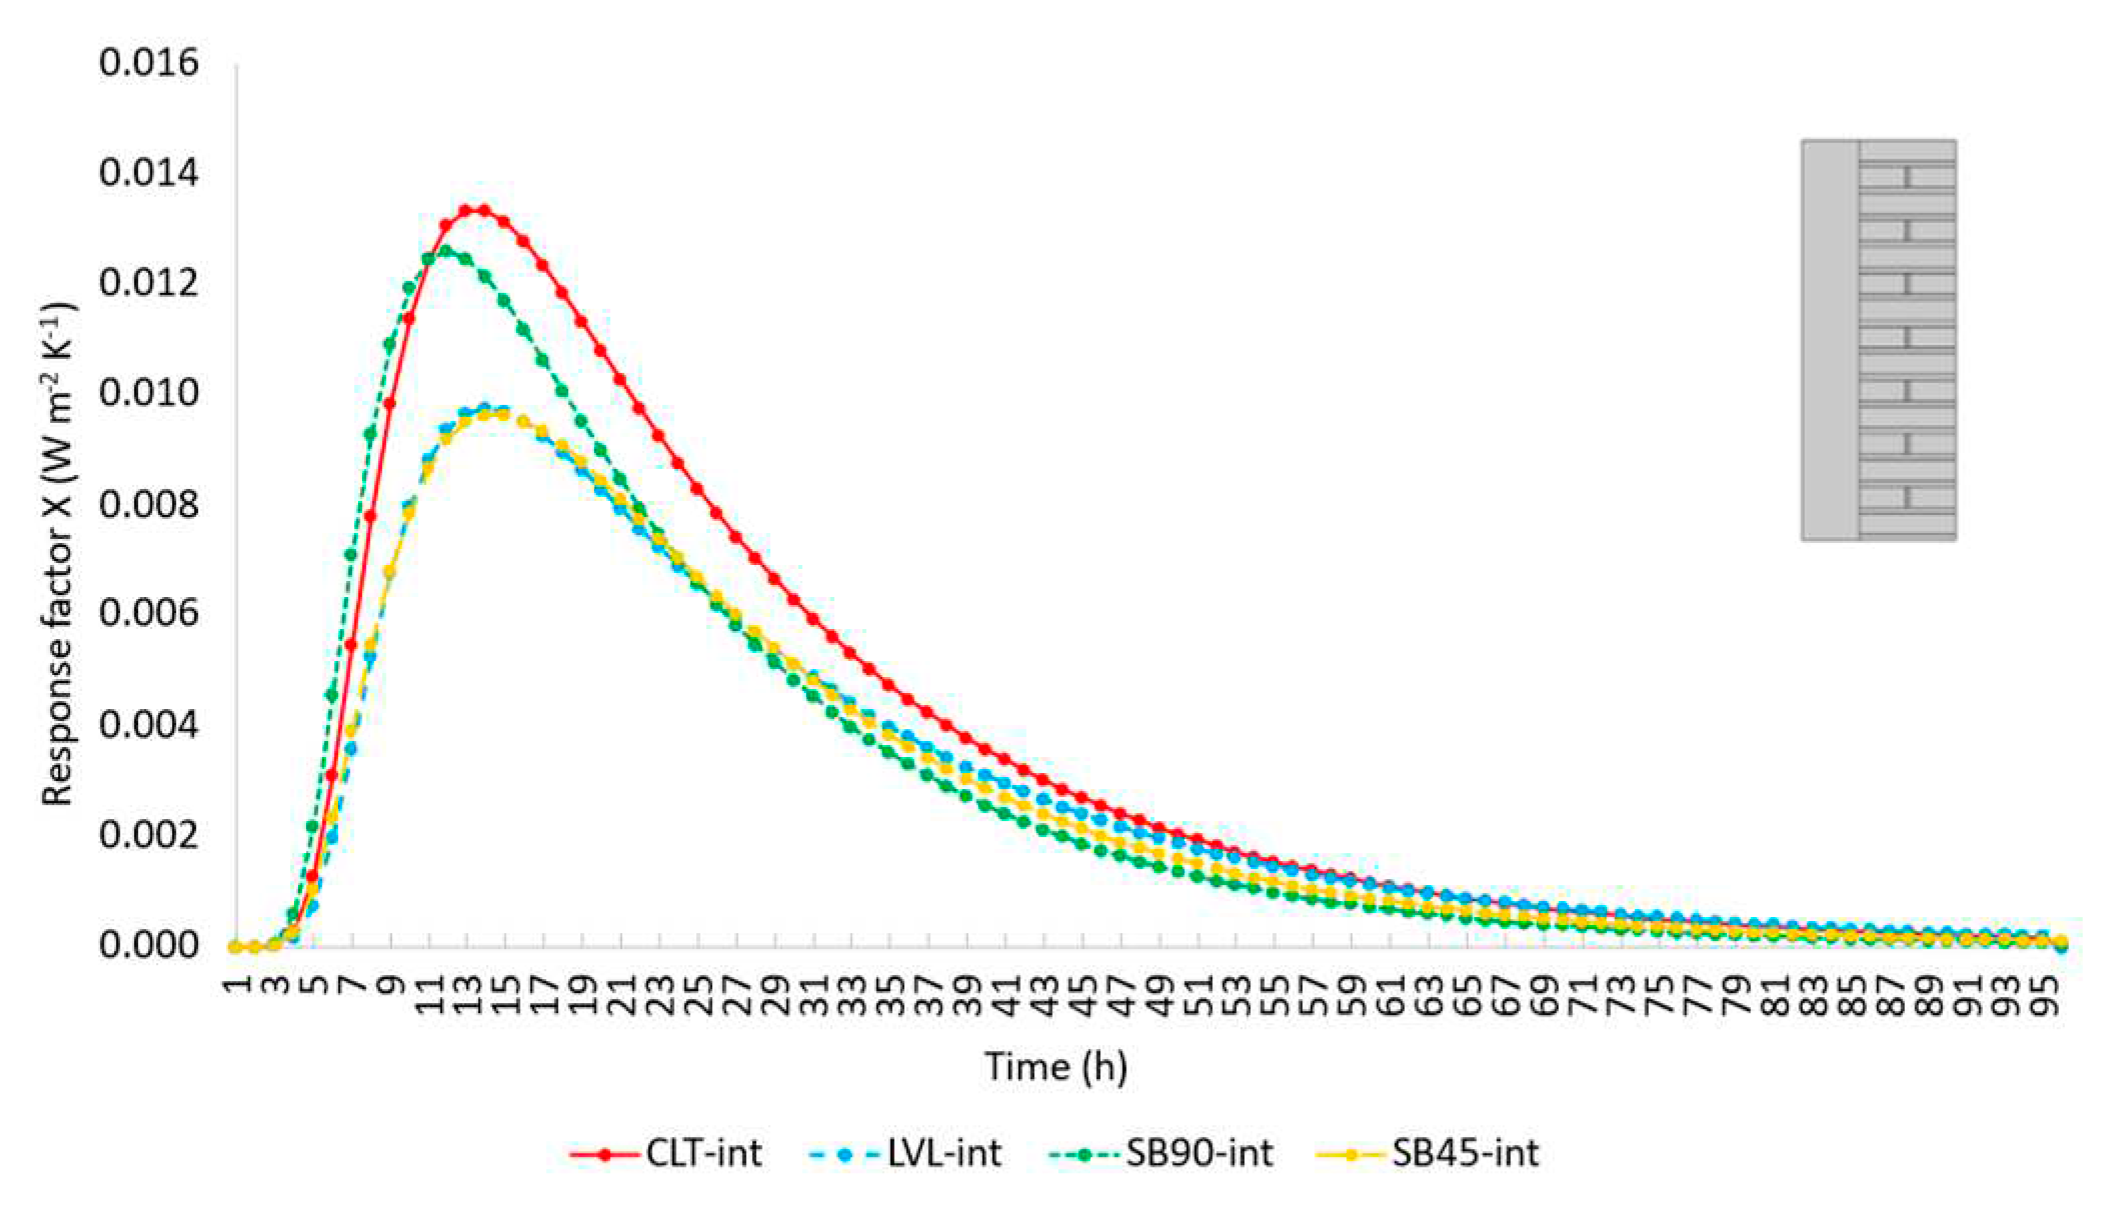
- The most effective solutions in terms of energy retrofit (both in winter and summer seasons) are the external solutions CLT-ext and the LVL-ext. However, if the retrofit is applied on the internal side, it is suggested to adopt either the LVL-int or the SB45-int solutions. As expected, the thickness of the insulation layer plays a major role in determining the effectiveness of the solutions. Consequently, if a limitation to the total thickness of the intervention is considered (i.e., for the internal solutions), the possibility of inserting the insulation layers between the timber elements allows larger improvements in the wall thermophysical properties.
- The assessment of the U-value by adopting the response factor theory (i.e., by applying a triangular temperature profile of air’s temperature) instead of performing a stationary simulation seems being a promising technique also in the experimental field, where stationary tests are usually extremely time consuming. Deviations with respect to the stationary U-value are negligible for less massive walls, such as the internal retrofit solutions, while are more significant in the case of external retrofit because of the longer response time. However, these deviations remain below the threshold of measurement uncertainty.
- The retrofit solution with the LVL panels appeared to be the best performing, improving both the mechanical and the thermophysical properties of the URM walls considerably. However, all the analyzed solutions can be considered quite promising and worthy of further study.
Author Contributions
Funding
Institutional Review Board Statement
Informed Consent Statement
Data Availability Statement
Acknowledgments
Conflicts of Interest
References
- Gkatzogias, K.; Crowley, H.; Veljkovic, A.; Pohoryles, D.A.; Norl´en, H.; Tsionis, G.; Bournas, D.A. REEBUILD: integrated techniques for the seismic strengthening and energy efficiency of existing buildings – prioritising EU regions for building renovation: seismic risk, EUR 31149, Publications Office of the European Union, Luxembourg, in: Energy Efficiency, Socioeconomic Vulnerability, 2022. ISBN 978-92-76-55022-8, doi:10.2760/263803, JRC128988.
- European Commission. Energy Performance of Buildings. Text, July 31, Energy - European Commission, 2014, https://ec.europa.eu/energy/en/topics/ energy-efficiency/energy-performance-of-buildings/overview.
- Ricci, P.; De Luca, F.; Verderame, G.M: 6th April 2009 L’Aquila earthquake, Italy: reinforced concrete building performance, Bull. Earthq. Eng. 9 (1) (2011) 285–305.
- Indirli, M.; Kouris, L.A.S.; Formisano, A.; Borg, R.P.; Mazzolani, F.M. Seismic damage assessment of unreinforced masonry structures after the Abruzzo 2009 earthquake: the case study of the historical centers of L’Aquila and castelvecchio subequo, January 1, Int. J. Architect. Herit. 7 (5) (2013) 536–578, https:// doi.org/10.1080/15583058.2011.654050.
- Bournas, D.A.; Negro, P.; Taucer, F.F. Performance of industrial buildings during the Emilia earthquakes in Northern Italy and recommendations for their strengthening. Bull. Earthq. Eng. 12 (5) (2014) 2383–2404, . [CrossRef]
- European Commission, The European green Deal - Communication from the Commission to the European Parliament, the European Council, the Council, the European Economic and Social Committee and the Committee of the Regions, European Commission, Brussels, November 12, 2019.
- International Energy Agency (IEA) Net Zero by 2050 - A Roadmap for the Global Energy Sector. 2021, 224.
- Iovane, G.; Sandoli, A.; Marranzini, D.; Landolfo, R.; Prota, A.; Faggiano, B. Timber based systems for the seismic and energetic retrofit of existing structures. In Proceedings of the XIX ANIDIS Conference, Seismic Engineering in Italy, 2023, Procedia Structural Integrity 44 1870–1876.
- Giongo, I.; Schiro, G.; Piazza, M. On the Use of Timber-Based Panels for the Seismic Retrofit of Masonry Structures. In Proceedings of the 3rd International Conference on PROTECTION OF HISTORICAL CONSTRUCTIONS; Lisbon, Portugal, July 12 2017.
- Riccadonna, D.; Giongo, I.; Schiro, G.; Rizzi, E.; Parisi, M.A. Experimental Shear Testing of Timber-Masonry Dry Connections for the Seismic Retrofit of Unreinforced Masonry Shear Walls. Construction and Building Materials 2019, 211, 52–72, doi:10.1016/j.conbuildmat.2019.03.145.
- Rizzi, E.; Giongo, I.; Riccadonna, D.; Piazza, M. Testing of irregular stone masonry strengthened with cross-laminated timber. In Proceedings of the 4th International Conference on Protection of Historical Constructions; Athens, Greece, 2021.
- Giongo, I.; Rizzi, E.; Riccadonna, D.; Piazza, M. On-Site Testing of Masonry Shear Walls Strengthened with Timber Panels. Proceedings of the Institution of Civil Engineers - Structures and Buildings 2021, 174, 389–402, doi:10.1680/jstbu.19.00179.
- Cassol, D.; Giongo, I.; Piazza, M. Numerical Study on Seismic Retrofit of URM Walls Using Timber Panels. In Proceedings of the 8 th ECCOMAS Thematic Conference on Computational Methods in Structural Dynamics and Earthquake Engineering; Athens, Greece, June 27 2021.
- Cassol, D.; Nagliati, E.; Giongo, I. Seismic retrofit of a URM building with timber-based coating: a numeric study. In Proceedings of the SAHC 2032 - 13th International Conference on Structural Analysis of Historical Constructions, Kyoto Japan, 12-15 September 2023.
- Borri, A.; Sisti, R.; Corradi, M. Combined Reinforcement of Rubble Stone Walls with CLT Panels and Steel Cords. Structures and Buildings 2021.
- Pozza, L.; Marchi, L.; Trutalli, D.; Scotta, R. In-Plane Strengthening of Masonry Buildings with Timber Panels. Proceedings of the Institution of Civil Engineers - Structures and Buildings 2021, 174, 345–358, doi:10.1680/jstbu.19.00121.
- Lucchini, A.; Mazzucchelli, E.; Mangialardo, S.; Persello, M. Façadism and CLT Technology: An Innovative System for Masonry Construction Refurbishment. In Proceedings of the 4th IAHS World Congress on Housing—Sustainable Housing Construction; Funchal, Portugal, December 16 2014.
- Iuorio, O.; Dauda, J.A. Retrofitting Masonry Walls against Out-Of-Plane Loading with Timber Based Panels. Applied Sciences 2021, 11, 5443, doi:10.3390/app11125443.
- Sustersic, I.; Dujic, B. Seismic Strengthening of Existing Buildings with Cross Laminated Timber Panels. World 2012, 15, 19.
- Giaretton, M.; Ingham, J.; Dizhur, D. Timber Strong-Backs as Cost-Effective Seismic Retrofit Method for URM Buildings. In Proceedings of the NZSEE Conference; Wellington, New Zealand, April 27 2017.
- Dizhur, D.Y.; Giaretton, M.; Giongo, I.; Ingham, J.M. Seismic Retrofit of Masonry Walls Using Timber Strong-Backs. SESOC Journal 2017, 30, 30–44.
- Cassol, D.; Giongo, I.; Ingham, J.; Dizhur, D. Seismic Out-of-Plane Retrofit of URM Walls Using Timber Strong-Backs. Construction and Building Materials 2021, 269, 121237, doi:10.1016/j.conbuildmat.2020.121237.
- Damiani, N.; Miglietta, M.; Guerrini, G.; and Graziotti, F. An innovative timber system for the seismic retrofit of unreinforced brick masonry buildings. In Brick and Block Masonry-From Historical to Sustainable Masonry, 2020 pp. 508-516.
- Guerrini, G.; Damiani, N.; Miglietta, M.; Graziotti, F. Cyclic Response of Masonry Piers Retrofitted with Timber Frames and Boards. Proceedings of the Institution of Civil Engineers - Structures and Buildings 2021, 174, 372–388, doi:10.1680/jstbu.19.00134.
- Miglietta, M.; Damiani, N.; Guerrini, G.; and Graziotti, F. Full-scale shake-table tests on two unreinforced masonry cavity-wall buildings: Effect of an innovative timber retrofit. Bulletin of Earthquake Engineering, 2021 19(6), 2561-2596.
- Busselli, M.; Cassol, D.; Prada, A.; Giongo, I. Timber Based Integrated Techniques to Improve Energy Efficiency and Seismic Behaviour of Existing Masonry Buildings. Sustainability 2021, 13, 10379. [CrossRef]
- Cassol, D.; Busselli, M.; Prada, A.; Giongo, I. Timber-based integrated solutions for the seismic retrofit of URM walls. In Proceedings of CEES 2021 - International Conference on Construction, Energy, Environment and Sustainability, Coimbra Portugal, 12-15 October 2021.
- Valluzzi, M.R.; Saler, E.; Vignato, A.; Salvalaggio, M.; Croatto, G.; Dorigatti, G.; Turrini, U. Nested Buildings: An Innovative Strategy for the Integrated Seismic and Energy Retrofit of Existing Masonry Buildings with CLT Panels. Sustainability 2021, 13, 1188, doi:10.3390/su13031188.
- Applicazione delle metodologie di calcolo delle prestazioni energetiche e definizione delle prescrizioni e dei requisiti minimi degli edifici, Appendice B: requisiti specifici per gli edifici esistenti soggetti a riqualificazione energetica, Decreto interministeriale 26 giugno, Italia 2015.
- ABAQUS Computer Software and User’s Manual; Simulia; Dassault Systèmes: Providence, RI 02919, USA;
- Lubliner, J.; Oliver, S.; Oñate, E. A Plastic-Damage Model for Concrete. International Journal of Solid and Structures 1989, 25, 299–326.
- Lee, J.; Fenves, G.L. Plastic-Damage Model for Cyclic Loading of Concrete Structures.
- EN 1996-1-1:2013, Eurocode 6 – Design of masonry structures – Part 1-1: General rules for reinforced and unreinforced masonry structures, European Committee for Standardization: Brussels Belgium, 2013.
- Lourenço, P.B.; João, M.P. Seismic Retrofitting Project: Recommendations for Advanced Modeling of Historic Earthen Sites; Los Angeles: Getty Conservation Institute: Guimarães, Portugal: TecMinho–University of Minho, 2018;
- Ministero delle Infrastrutture e dei Trasporti DECRETO 17 Gennaio 2018 Aggiornamento delle. In Norme Tecniche per le Costruzioni; Ministero delle Infrastrutture e dei Trasporti: Rome, Italy, 2018.
- UNI EN 338, Structural Timber – Strength Classes; European Committee for Standardization: Brussels, Belgium, 2016;
- UNI EN 14279:2009, Laminated Veneer Lumber (LVL) - Definitions, Classification and Specifications; European Committee for Standardization: Brussels, Belgium, 2009;
- 38. UNI EN 300, 2006, Oriented Strain Boards (OSB) – Definitions, classification and specifications, European Committee for Standardization, Brussels, 2006.
- M. Piazza, T. Sartori, ‘Caratterizzazione Meccanica Attraverso Prove Monotone e Cicliche Dei Principali Dispositivi Di Connessione Utilizzati Negli Edifici Multipiano in Legno’, ReLUIS 2015-PR4_Allegato_01-UR_UNITN, 2015.
- A. Hossain, I. Danzig, T. Tannert, Cross-Laminated Timber Shear Connections with Double-Angled Self-Tapping Screw Assemblies. J. Struct. Eng. 2016, 142, 04016099, doi:10.1061/(ASCE)ST.1943-541X.0001572.
- T. Sartori and R. Tomasi, ‘Experimental investigation on sheathing-to-frame connections in wood shear walls’, Engineering Structures 56 2197-2205, 2013.
- Morandi, P.; Albanesi, L.; Magenes, G. In-plane test campaign on different load-bearing URM typologies with thin shell and web clay units. Proceedings of the 16th International Brick and Block Masonry Conference, Padova, Italy, 2016.
- COMSOL Multiphysics® v. 6.1. www.comsol.com. COMSOL AB, Stockholm, Sweden.
- EN ISO 6946:2018, Building Components and Building Elements - Thermal Resistance and Thermal Transmittance - Calculation Methods; European Committee for Standardization: Brussels, Belgium, 2018.
- Mitalas, G. and Stephenson, D.G. Room thermal response factors, ASHRAE Trans.73 (1) (1967) 1–10.
- Stephenson D.G. and Mitalas, G.P. Cooling load calculations by the thermal response factor method, ASHRAE Trans., 73 1967.
- G.P. Mitalas and D.G. Stephenson, Calculation of heat flows through walls and roofs, ASHRAE Trans., 74 (1968) 182-188.
- Li, X.Q.; Chen, Y.; Spitler, J.D.; Fisher, D. Applicability of calculation methods for conduction transfer function of building constructions. Int. J. Therm. Sci., 48 (7) (2009), pp. 1441-1451, https://doi:10.1016/j.ijthermalsci.2008.11.006.
- Bettanini, E.; Brunello, P. F. Lezioni di impianti tecnici. CLEUP Editore, 1990, vol.2.
- Davies, M. G. 2004. Building Heat Transfer. WILEY.
- Hittle, D. Response Factors and Conduction Transfer Functions, 1992. www.web.mit.edu.
- U.S. Department of Energy’s (DOE) Building Technologies Office (BTO), and managed by the National Renewable Energy Laboratory (NREL). Energyplus. California, USA 1996. https://energyplus.net/.
- University of Wisconsin--Madison. Solar Energy Laboratory. TRNSYS, a Transient Simulation Program. Madison, Wis. :The Laboratory, 1975. https://www.trnsys.com/.
- Rasooli, A.; Itard, L.; Ferreira, C.I. A response factor-based method for the rapid in-situ determination of wall’s thermal resistance in existing buildings, Energy Build., 119 (Supplement C) (2016), pp. 51-61. [CrossRef]
- European Standards, ENI SO 8990, Thermal insulation – Determination of steady-state thermal transmission properties – Calibrated and guarded hot box, 1996.
- EN 1934: Ente nazionale italiano di unificazione UNI 2000. UNI EN 1934. Thermal performance of buildings - Determination of thermal resistance by hot box method using heat flow meter – Masonry.


| Material | E [MPa] | G [MPa] | fc [MPa] | ft [MPa] | c [MPa] |
|---|---|---|---|---|---|
| Clay bricks | 3000 | 1200 | 20.00 | 2.00 | - |
| Mortar | 300 | 120 | 1.30 | 0.05 | 0.15 |
| Materials | Thickness [mm] | ρ [kg/m3] 1 | λ [W/(mK)] 2 | cp [J/(kgK)] 3 |
|---|---|---|---|---|
| Clay brick masonry | 250 | 1800 | 0.800 | 840 |
| CLT panel | 60 | 420 | 0.120 | 1600 |
| LVL panel | 40 | 530 | 0.130 | 2720 |
| OSB panel | 15 | 650 | 0.130 | 1700 |
| PIR | 40 – 60 - 90 | 36 | 0.022 | 1453 |
| PIR (ETICS application) | 40 - 80 - 90 | 35 | 0.028 - 0.026 | 1464 |
| Plaster | 12 | 1000 | 0.250 | 2000 |
| Fibre-cement board | 15 | 950 | 0.300 | 1000 |
| Skim-coating | 10 | 950 | 0.310 | 950 |
| Plasterboard | 12-24 | 1800 | 0.900 | 910 |
| Vapour barrier | 0.02 | 500 | 0.390 | 1700 |
| Breathable membrane | 0.03 | 250 | 0.300 | 1800 |
| Breathable and reflective membrane |
0.05 | 300 | 0.300 | 1800 |
| Configuration | Mesh size | |||||
|---|---|---|---|---|---|---|
| Normal | Fine | Finer | Extra Fine | Extremely Fine | ||
| URM | - | 0.00% | 0.00% | 0.00% | 0.00% | |
|
INTERNAL RETROFIT |
CLT | - | 0.00% | 0.00% | 0.00% | 0.00% |
| LVL | - | 0.00% | 0.00% | 0.00% | 0.00% | |
| SB90 | - | 0.00% | 0.00% | -0.01% | -0.02% | |
| SB45 | - | 0.00% | 0.00% | -0.01% | -0.02% | |
|
EXTERNAL RETROFIT |
CLT | - | 0.00% | 0.00% | 0.00% | 0.00% |
| LVL | - | 0.00% | 0.00% | 0.00% | 0.00% | |
| SB90 | - | 0.00% | 0.00% | 0.00% | -0.01% | |
| SB45 | - | 0.00% | 0.00% | 0.00% | -0.01% | |
| Configuration | Stationary | Periodic | |||
|---|---|---|---|---|---|
| U (W m-2 K-1) | Yie (W m-2 K-1) | f (-) | (h) | ||
| URM | 2.072 | 0.894 | 0.432 | 7.4 | |
| INTERNAL RETROFIT | CLT | 0.354 | 0.052 | 0.148 | 12.9 |
| LVL | 0.282 | 0.037 | 0.131 | 13.2 | |
| SB90 | 0.297 | 0.052 | 0.176 | 11.9 | |
| SB45 | 0.270 | 0.035 | 0.129 | 13.2 | |
| EXTERNAL RETROFIT | CLT | 0.244 | 0.023 | 0.094 | 13.0 |
| LVL | 0.257 | 0.023 | 0.089 | 12.9 | |
| SB90 | 0.316 | 0.038 | 0.119 | 12.3 | |
| SB45 | 0.319 | 0.030 | 0.095 | 13.0 | |
| Configurations | Response factor | ||
|---|---|---|---|
| (W m-2 K-1) | Error (%) | ||
| URM | 2.072 | 0.02% | |
|
INTERNAL RETROFIT |
CLT | 0.351 | -0.29% |
| LVL | 0.279 | -1.25% | |
| SB90 | 0.296 | -0.35% | |
| SB45 | 0.268 | -0.77% | |
|
EXTERNAL RETROFIT |
CLT | 0.235 | -4.02% |
| LVL | 0.244 | -5.27% | |
| SB90 | 0.309 | -2.18% | |
| SB45 | 0.310 | -2.95% | |
Disclaimer/Publisher’s Note: The statements, opinions and data contained in all publications are solely those of the individual author(s) and contributor(s) and not of MDPI and/or the editor(s). MDPI and/or the editor(s) disclaim responsibility for any injury to people or property resulting from any ideas, methods, instructions or products referred to in the content. |
© 2023 by the authors. Licensee MDPI, Basel, Switzerland. This article is an open access article distributed under the terms and conditions of the Creative Commons Attribution (CC BY) license (http://creativecommons.org/licenses/by/4.0/).


