Submitted:
05 November 2023
Posted:
08 November 2023
Read the latest preprint version here
Abstract
Keywords:
1. Introduction
2. Materials and Methods
2.1. Antibodies and animals
2.2. Cell lines
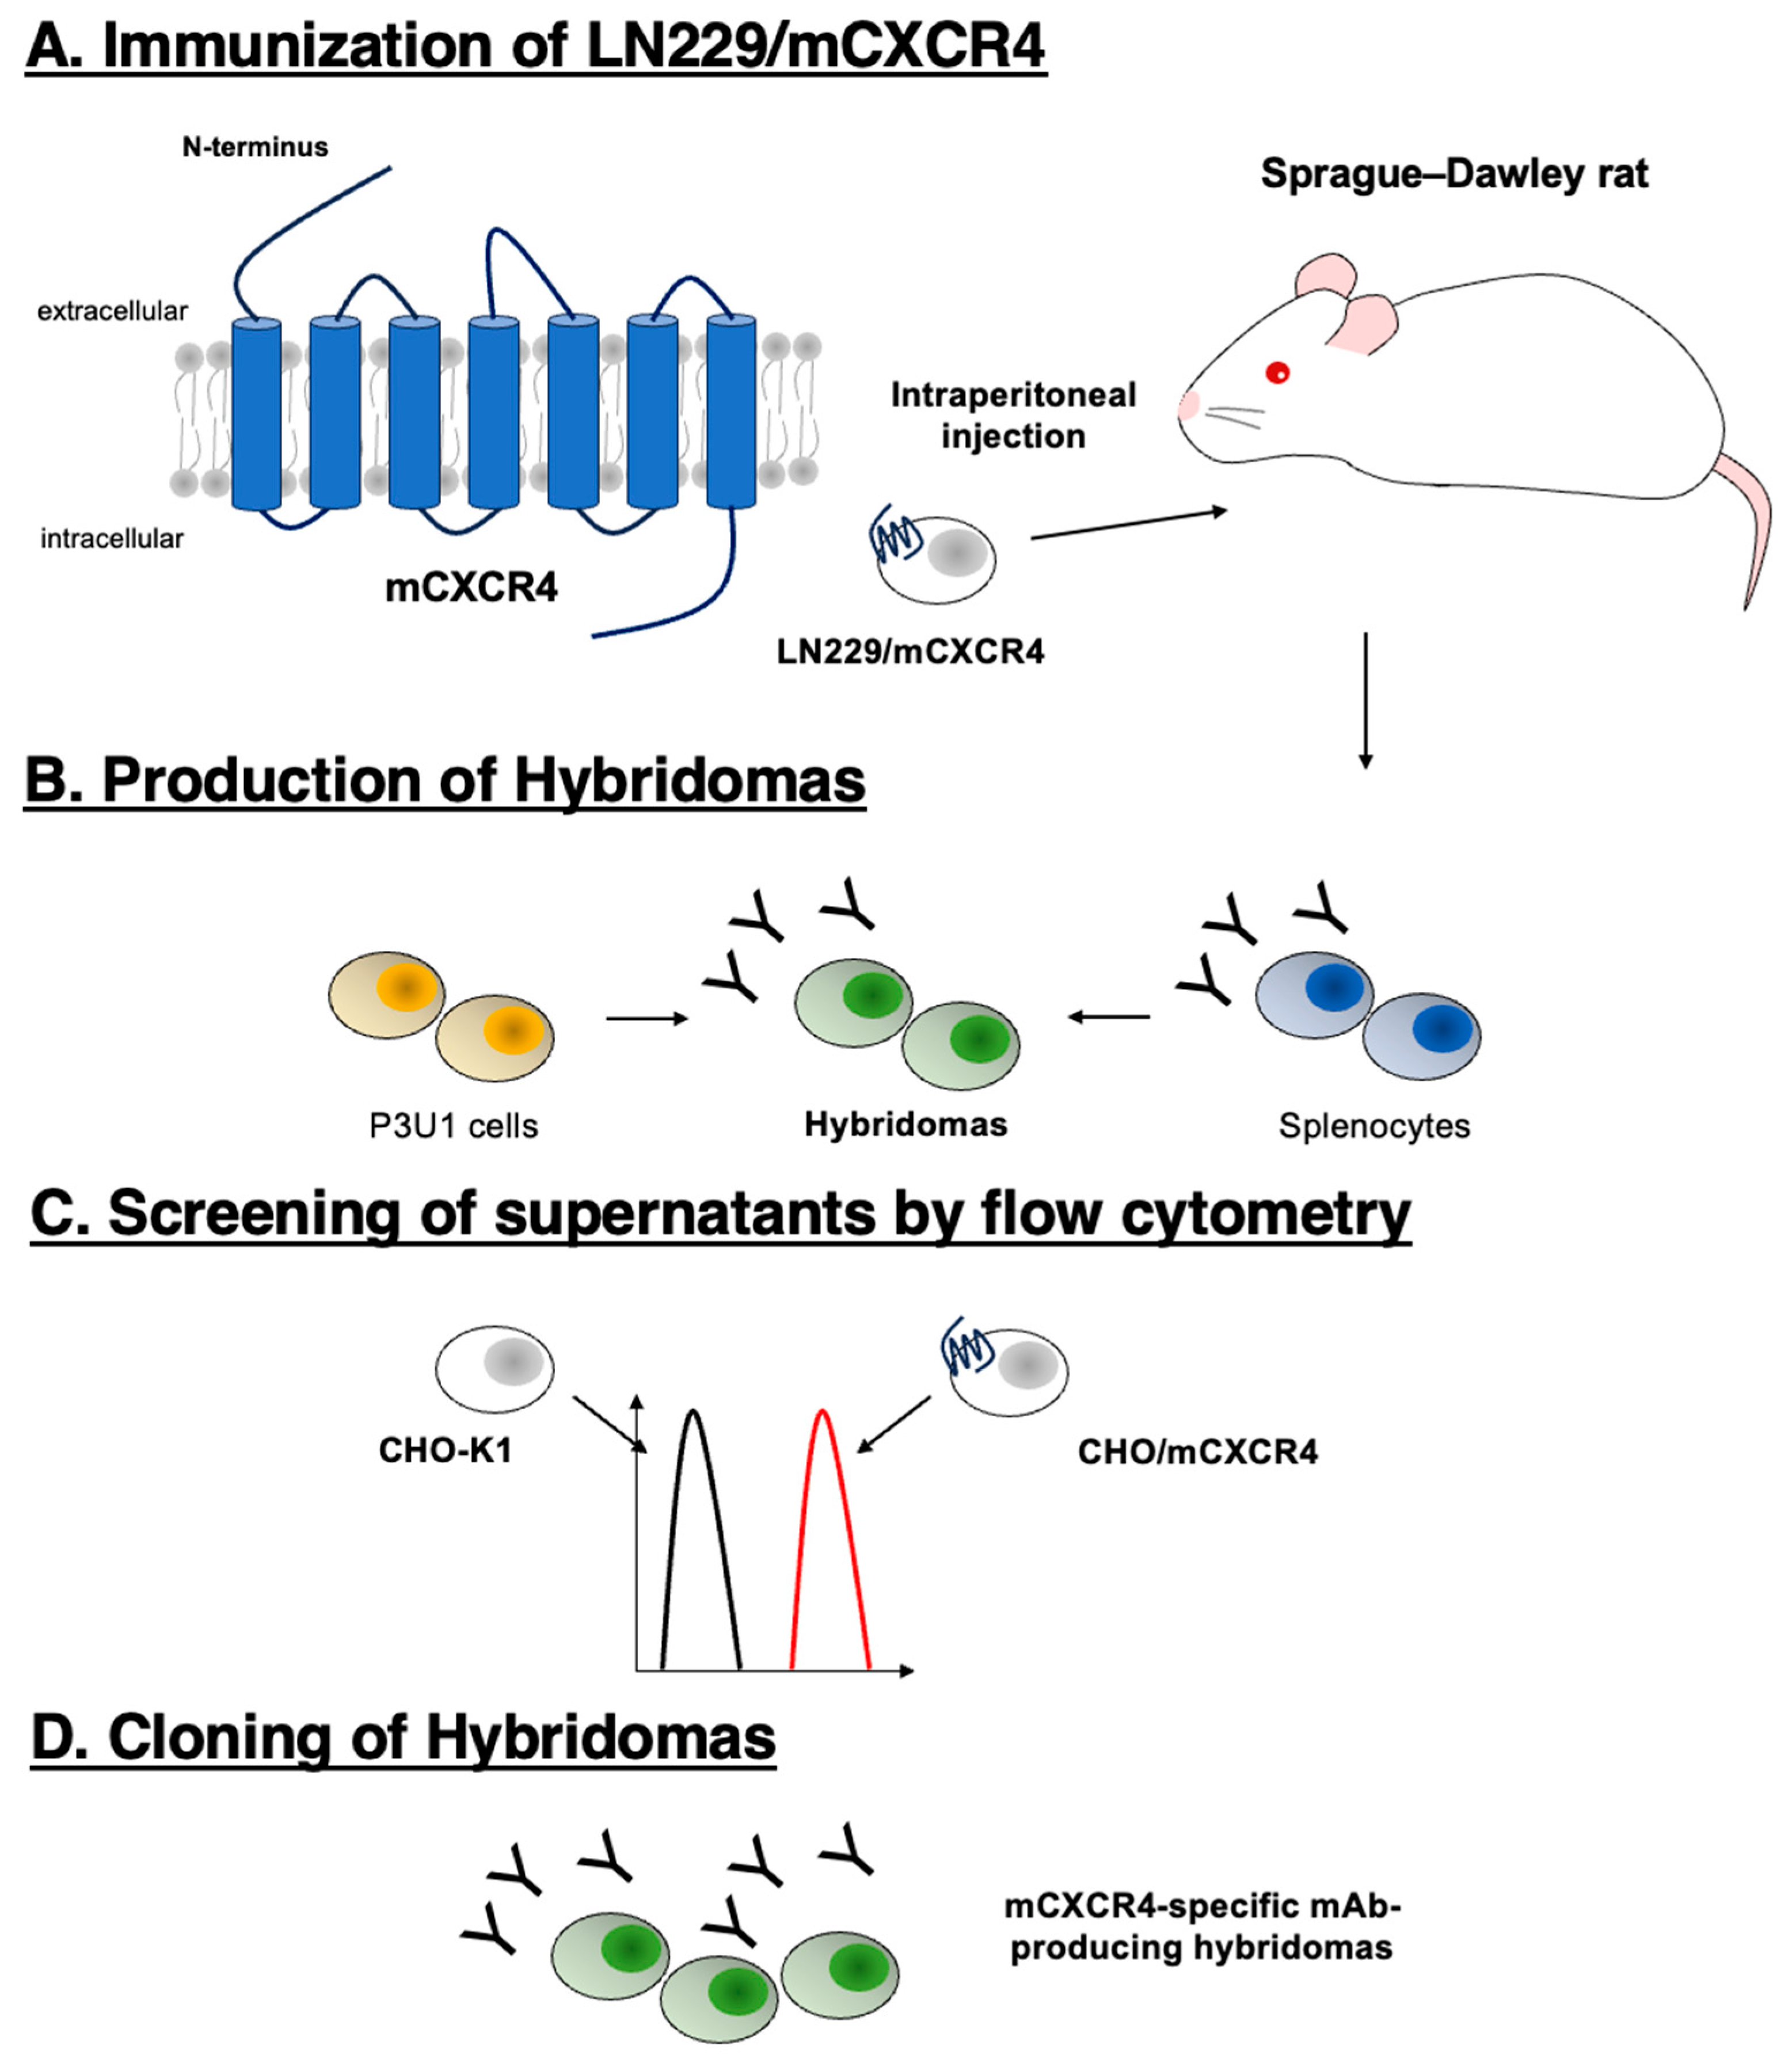
2.3. Production of hybridomas
2.4. Flow cytometry
3. Results
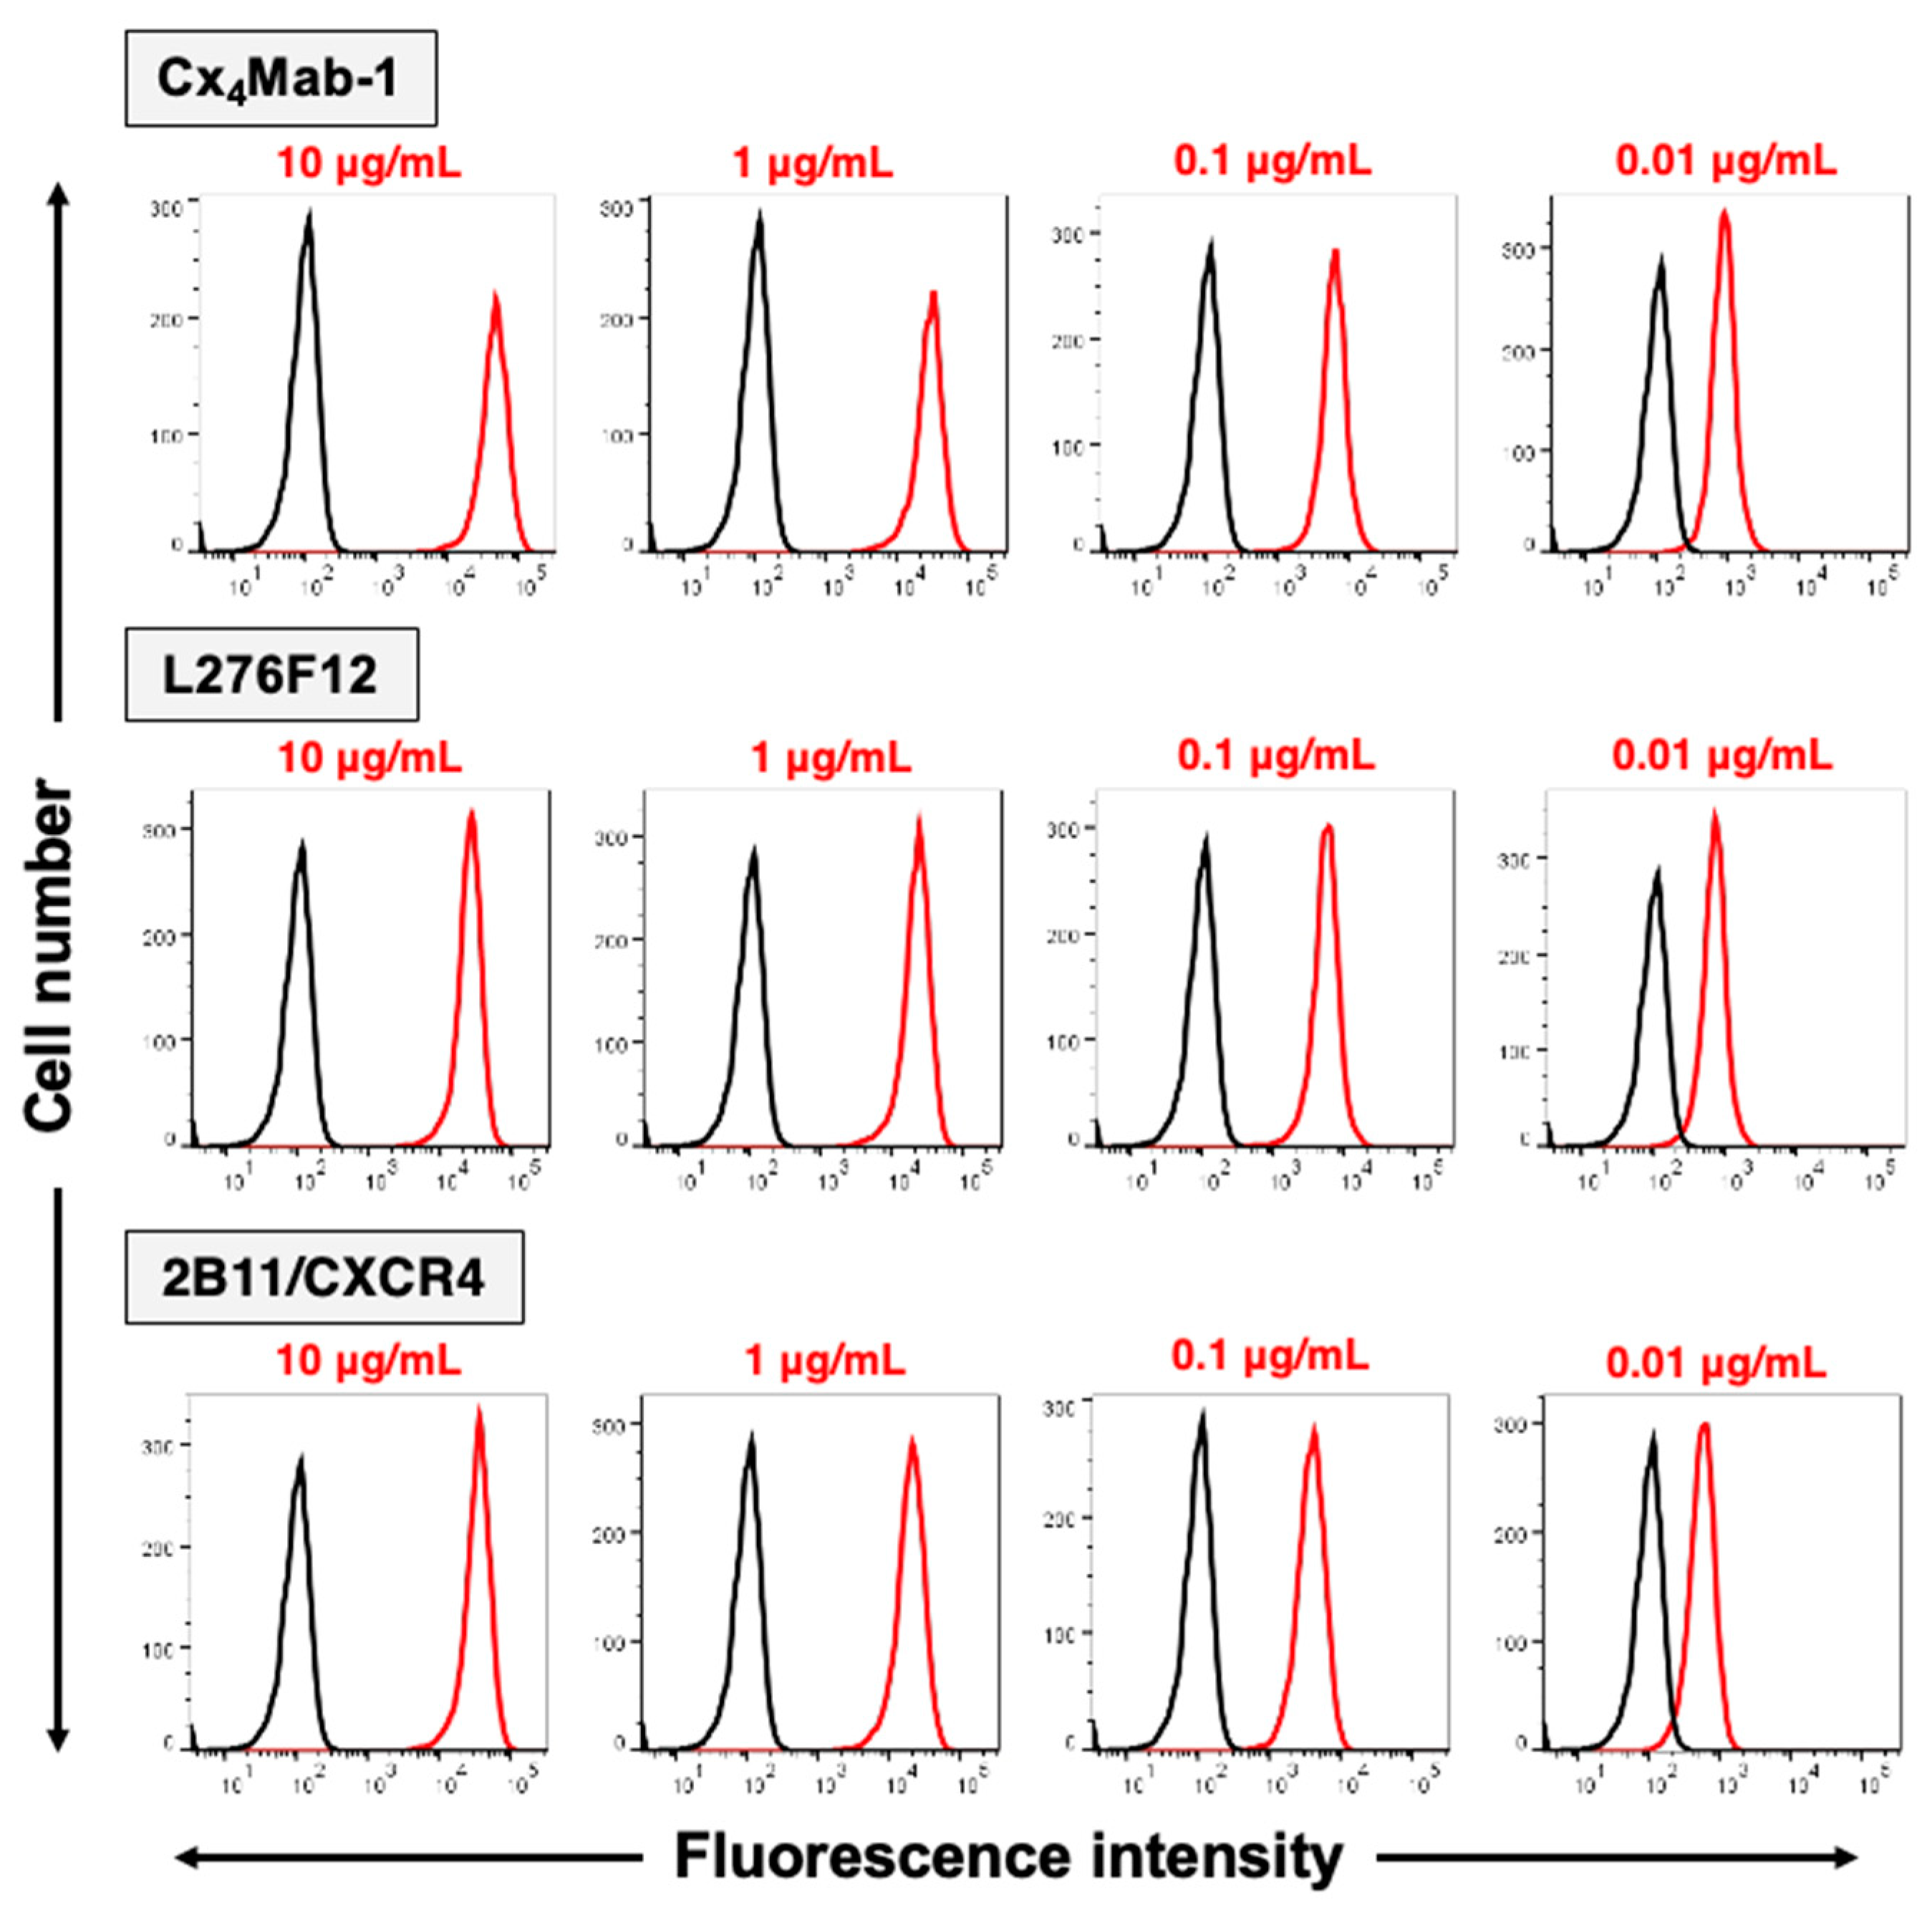
3.1. Establishment of a novel anti-mouse CXCR4 (mCXCR4) antibody
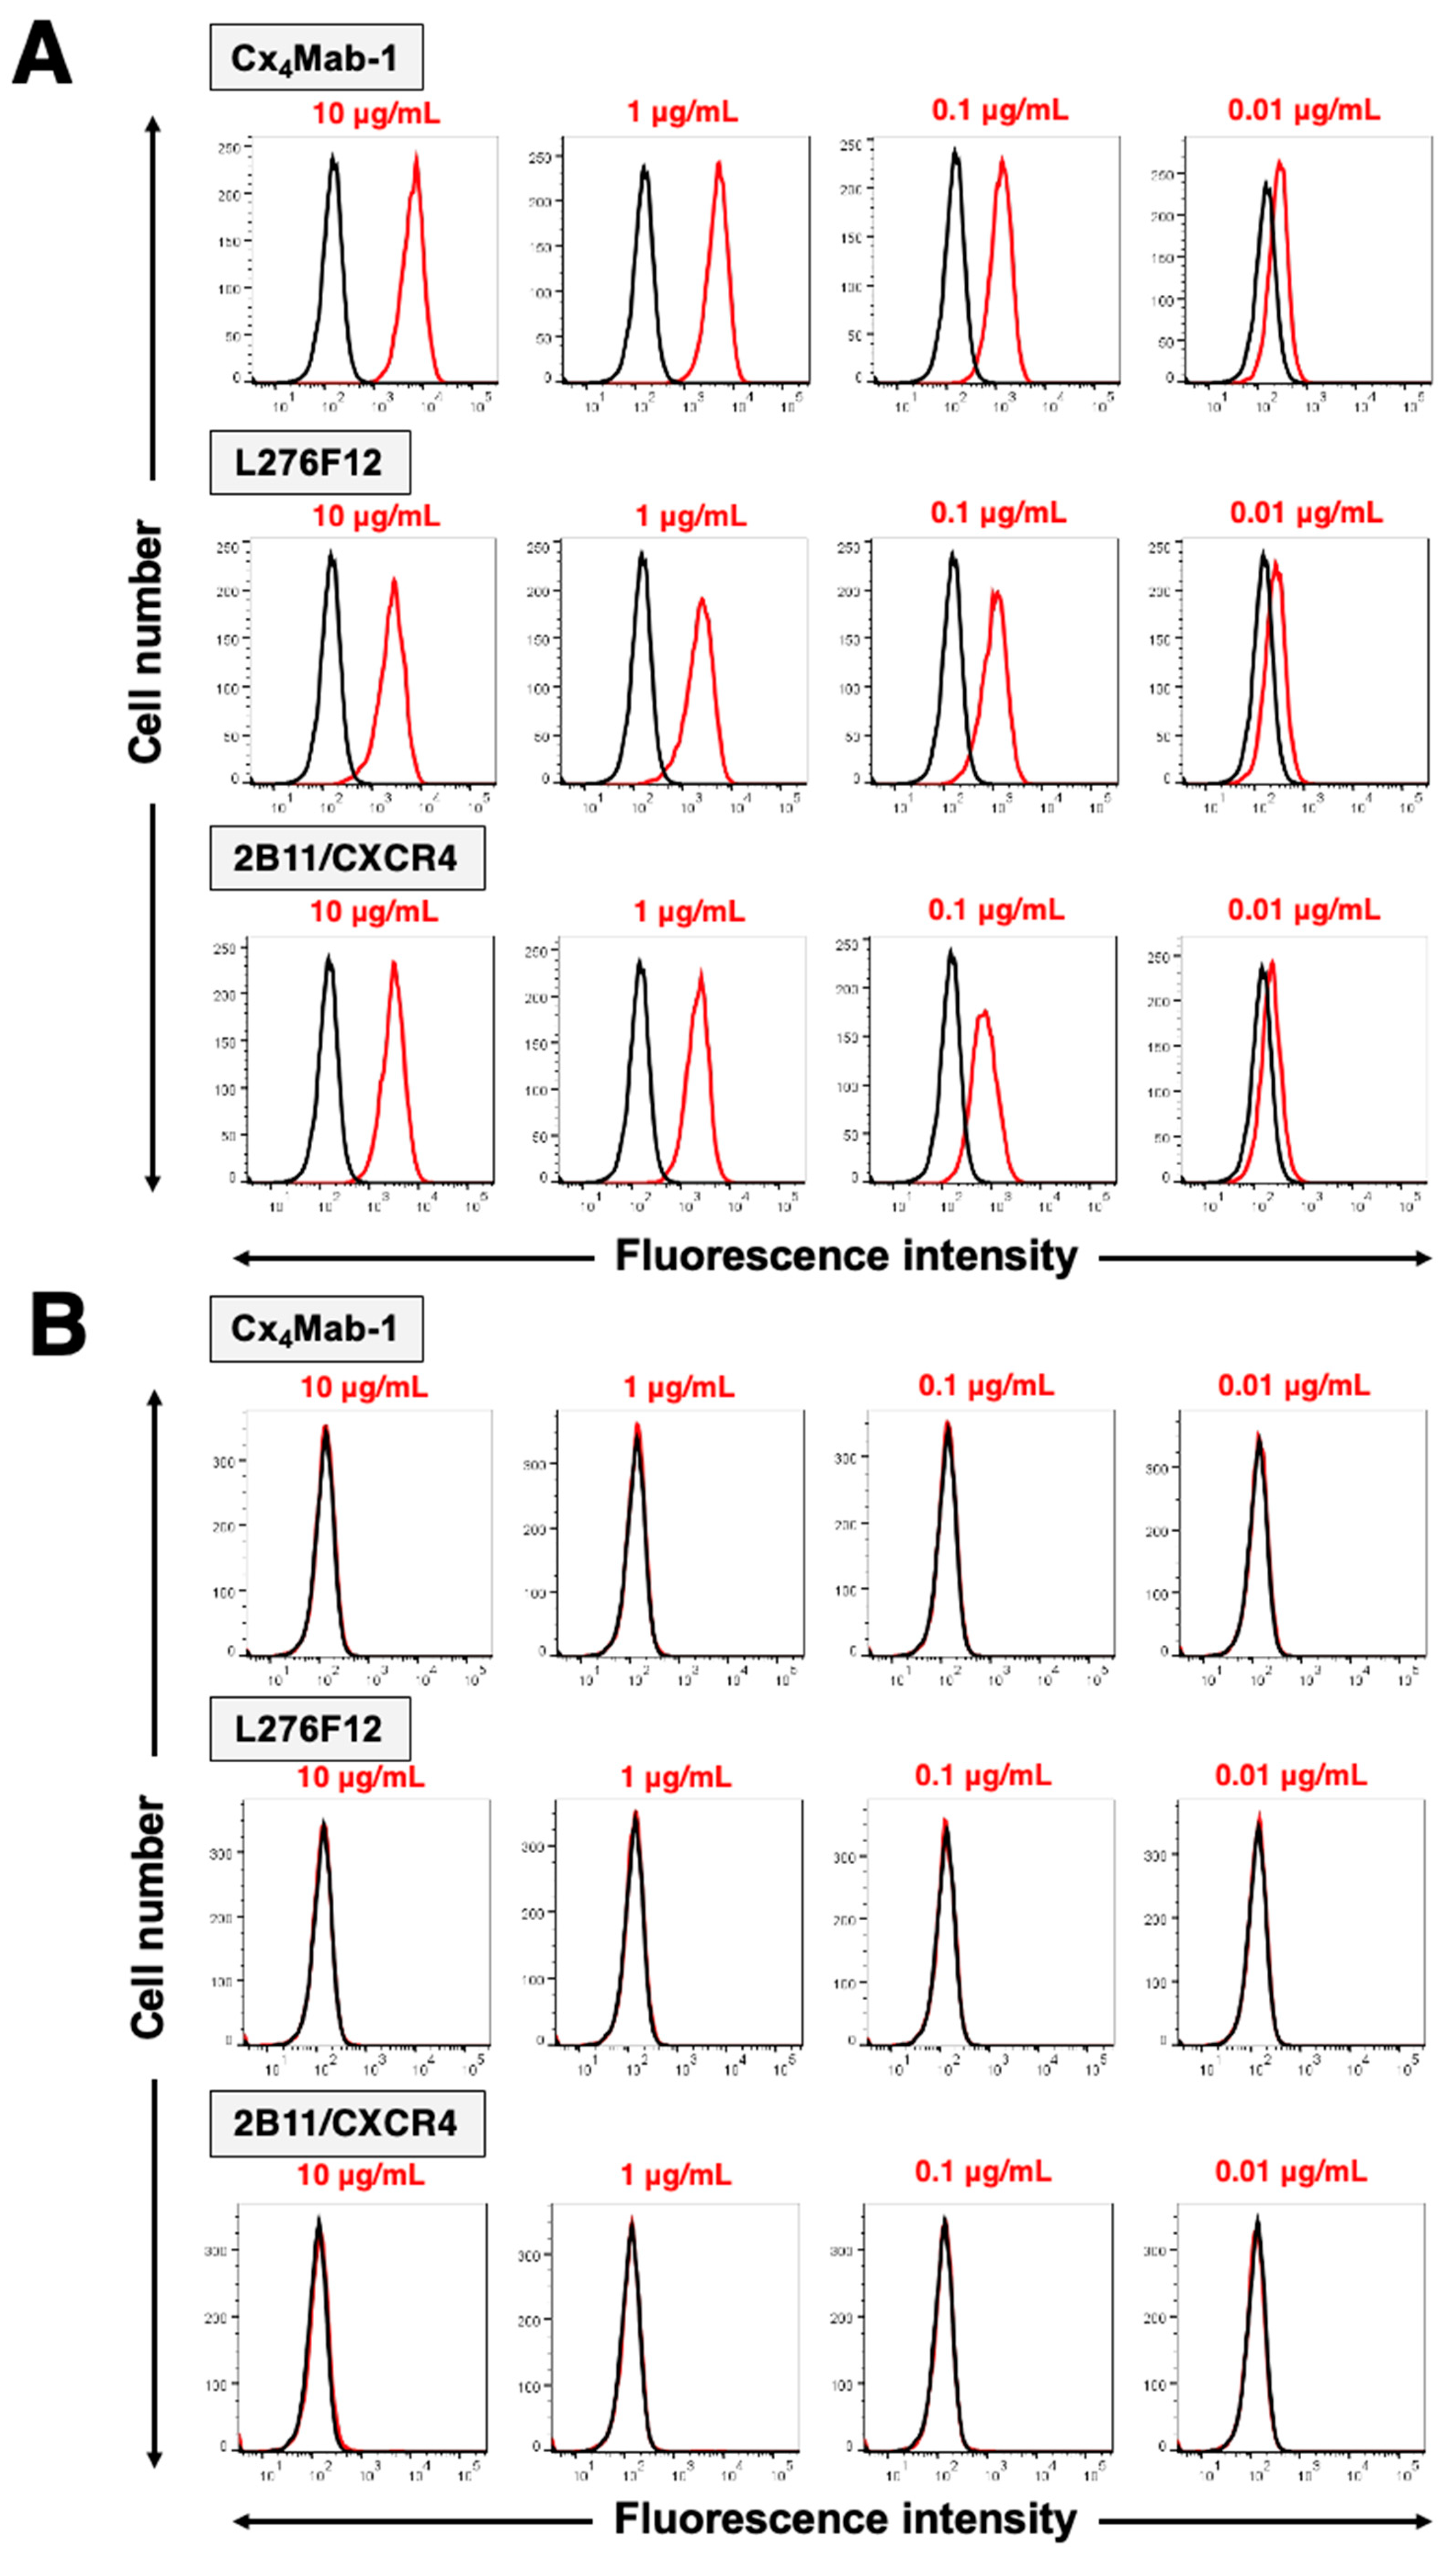
3.2. Specificity of Cx4Mab-1 in flow cytometry
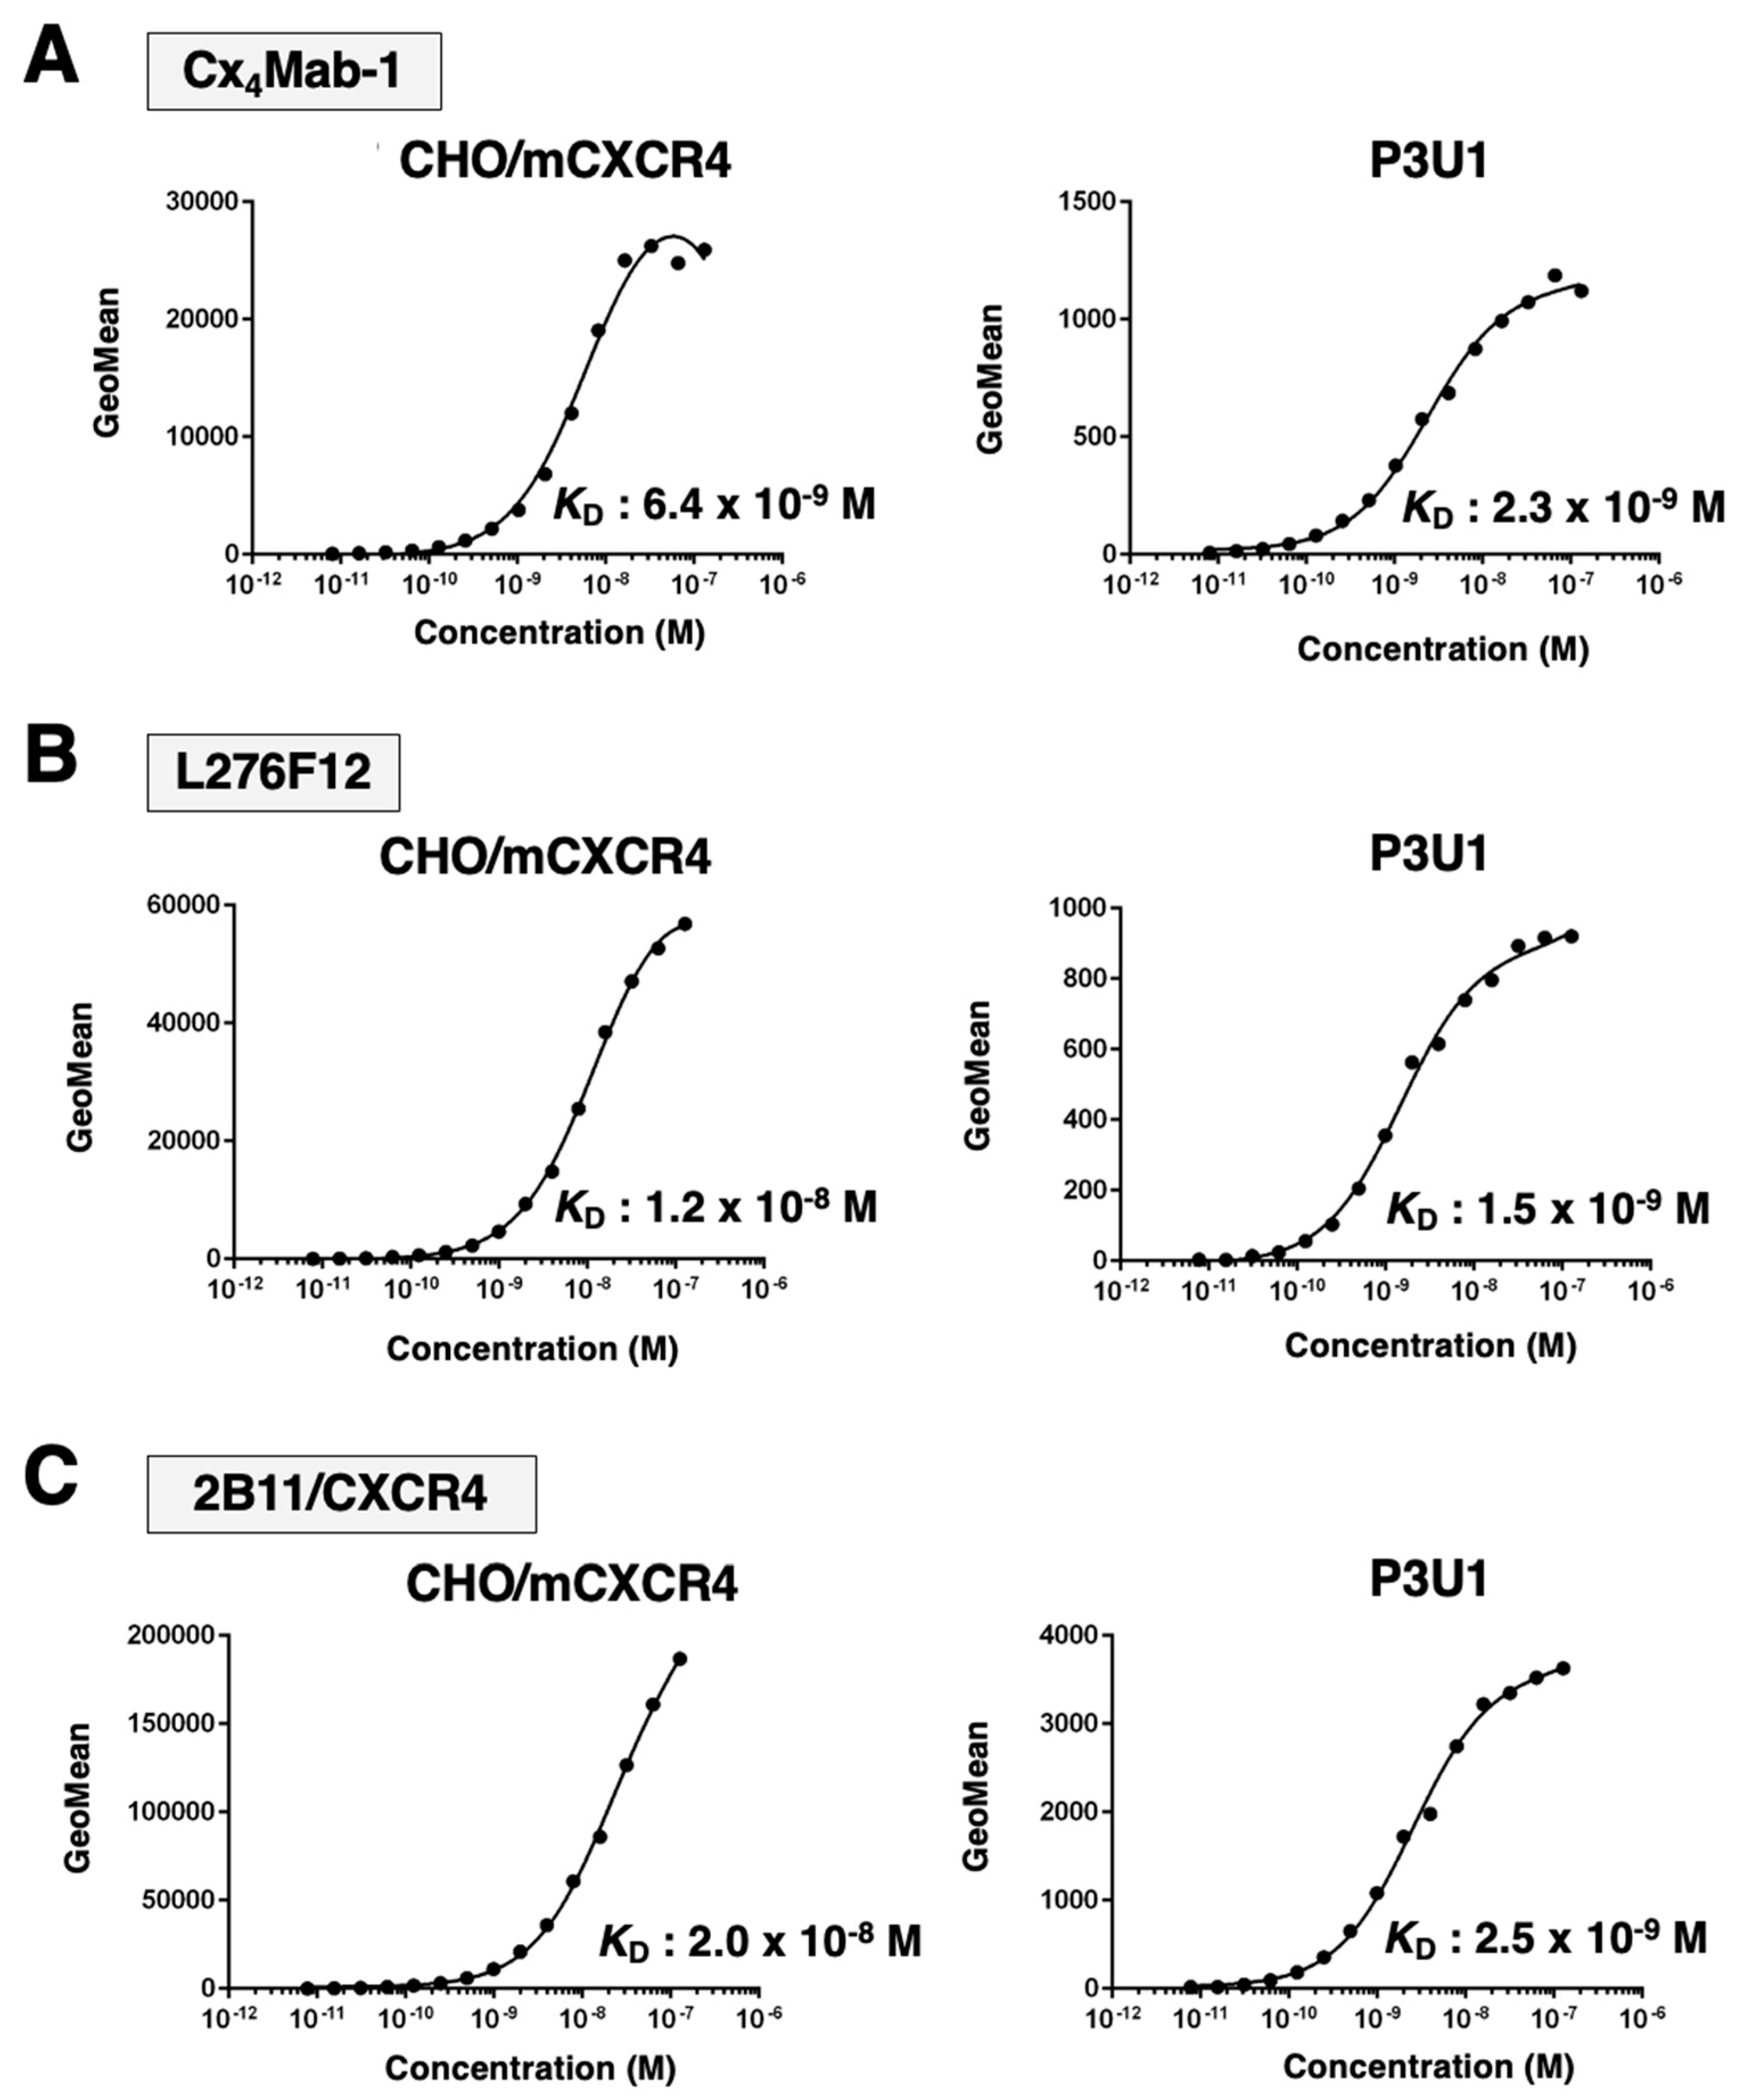
3.3. Affinity of Cx4Mab-1 against mCXCR4-expressing cells
4. Discussion
Supplementary Materials
References
- Bleul, C.C.; Farzan, M.; Choe, H.; Parolin, C.; Clark-Lewis, I.; Sodroski, J.; Springer, T.A. The lymphocyte chemoattractant SDF-1 is a ligand for LESTR/fusin and blocks HIV-1 entry. Nature 1996, 382, 829–833. [Google Scholar] [CrossRef]
- Oberlin, E.; Amara, A.; Bachelerie, F.; Bessia, C.; Virelizier, J.L.; Arenzana-Seisdedos, F.; Schwartz, O.; Heard, J.M.; Clark-Lewis, I.; Legler, D.F.; et al. The CXC chemokine SDF-1 is the ligand for LESTR/fusin and prevents infection by T-cell-line-adapted HIV-1. Nature 1996, 382, 833–835. [Google Scholar] [CrossRef]
- Lee, B.; Sharron, M.; Montaner, L.J.; Weissman, D.; Doms, R.W. Quantification of CD4, CCR5, and CXCR4 levels on lymphocyte subsets, dendritic cells, and differentially conditioned monocyte-derived macrophages. Proc Natl Acad Sci U S A 1999, 96, 5215–5220. [Google Scholar] [CrossRef]
- Nie, Y.; Waite, J.; Brewer, F.; Sunshine, M.J.; Littman, D.R.; Zou, Y.R. The role of CXCR4 in maintaining peripheral B cell compartments and humoral immunity. J Exp Med 2004, 200, 1145–1156. [Google Scholar] [CrossRef]
- Schabath, R.; Muller, G.; Schubel, A.; Kremmer, E.; Lipp, M.; Forster, R. The murine chemokine receptor CXCR4 is tightly regulated during T cell development and activation. J Leukoc Biol 1999, 66, 996–1004. [Google Scholar] [CrossRef]
- Chatterjee, S.; Behnam Azad, B.; Nimmagadda, S. The intricate role of CXCR4 in cancer. Adv Cancer Res 2014, 124, 31–82. [Google Scholar] [CrossRef]
- Busillo, J.M.; Benovic, J.L. Regulation of CXCR4 signaling. Biochim Biophys Acta 2007, 1768, 952–963. [Google Scholar] [CrossRef]
- Nagasawa, T.; Tachibana, K.; Kishimoto, T. A novel CXC chemokine PBSF/SDF-1 and its receptor CXCR4: their functions in development, hematopoiesis and HIV infection. Semin Immunol 1998, 10, 179–185. [Google Scholar] [CrossRef]
- Ma, Q.; Jones, D.; Borghesani, P.R.; Segal, R.A.; Nagasawa, T.; Kishimoto, T.; Bronson, R.T.; Springer, T.A. Impaired B-lymphopoiesis, myelopoiesis, and derailed cerebellar neuron migration in CXCR4- and SDF-1-deficient mice. Proc Natl Acad Sci U S A 1998, 95, 9448–9453. [Google Scholar] [CrossRef]
- Tachibana, K.; Hirota, S.; Iizasa, H.; Yoshida, H.; Kawabata, K.; Kataoka, Y.; Kitamura, Y.; Matsushima, K.; Yoshida, N.; Nishikawa, S.; et al. The chemokine receptor CXCR4 is essential for vascularization of the gastrointestinal tract. Nature 1998, 393, 591–594. [Google Scholar] [CrossRef]
- Hjazi, A.; Nasir, F.; Noor, R.; Alsalamy, A.; Zabibah, R.S.; Romero-Parra, R.M.; Ullah, M.I.; Mustafa, Y.F.; Qasim, M.T.; Akram, S.V. The pathological role of C-X-C chemokine receptor type 4 (CXCR4) in colorectal cancer (CRC) progression; special focus on molecular mechanisms and possible therapeutics. Pathol Res Pract 2023, 248, 154616. [Google Scholar] [CrossRef]
- Amara, S.; Chaar, I.; Khiari, M.; Ounissi, D.; Weslati, M.; Boughriba, R.; Hmida, A.B.; Bouraoui, S. Stromal cell derived factor-1 and CXCR4 expression in colorectal cancer promote liver metastasis. Cancer Biomark 2015, 15, 869–879. [Google Scholar] [CrossRef]
- Xu, C.; Zheng, L.; Li, D.; Chen, G.; Gu, J.; Chen, J.; Yao, Q. CXCR4 overexpression is correlated with poor prognosis in colorectal cancer. Life Sci 2018, 208, 333–340. [Google Scholar] [CrossRef]
- Yoshitake, N.; Fukui, H.; Yamagishi, H.; Sekikawa, A.; Fujii, S.; Tomita, S.; Ichikawa, K.; Imura, J.; Hiraishi, H.; Fujimori, T. Expression of SDF-1 alpha and nuclear CXCR4 predicts lymph node metastasis in colorectal cancer. Br J Cancer 2008, 98, 1682–1689. [Google Scholar] [CrossRef]
- Kim, J.; Takeuchi, H.; Lam, S.T.; Turner, R.R.; Wang, H.J.; Kuo, C.; Foshag, L.; Bilchik, A.J.; Hoon, D.S. Chemokine receptor CXCR4 expression in colorectal cancer patients increases the risk for recurrence and for poor survival. J Clin Oncol 2005, 23, 2744–2753. [Google Scholar] [CrossRef]
- Matsusue, R.; Kubo, H.; Hisamori, S.; Okoshi, K.; Takagi, H.; Hida, K.; Nakano, K.; Itami, A.; Kawada, K.; Nagayama, S.; et al. Hepatic stellate cells promote liver metastasis of colon cancer cells by the action of SDF-1/CXCR4 axis. Ann Surg Oncol 2009, 16, 2645–2653. [Google Scholar] [CrossRef]
- Zeelenberg, I.S.; Ruuls-Van Stalle, L.; Roos, E. The chemokine receptor CXCR4 is required for outgrowth of colon carcinoma micrometastases. Cancer Res 2003, 63, 3833–3839. [Google Scholar]
- Xu, J.; Liang, J.; Meng, Y.M.; Yan, J.; Yu, X.J.; Liu, C.Q.; Xu, L.; Zhuang, S.M.; Zheng, L. Vascular CXCR4 Expression Promotes Vessel Sprouting and Sensitivity to Sorafenib Treatment in Hepatocellular Carcinoma. Clin Cancer Res 2017, 23, 4482–4492. [Google Scholar] [CrossRef]
- Yoshida, S.; Kawai, H.; Eguchi, T.; Sukegawa, S.; Oo, M.W.; Anqi, C.; Takabatake, K.; Nakano, K.; Okamoto, K.; Nagatsuka, H. Tumor Angiogenic Inhibition Triggered Necrosis (TAITN) in Oral Cancer. Cells 2019, 8. [Google Scholar] [CrossRef]
- Ireson, C.R.; Alavijeh, M.S.; Palmer, A.M.; Fowler, E.R.; Jones, H.J. The role of mouse tumour models in the discovery and development of anticancer drugs. Br J Cancer 2019, 121, 101–108. [Google Scholar] [CrossRef]
- Chulpanova, D.S.; Kitaeva, K.V.; Rutland, C.S.; Rizvanov, A.A.; Solovyeva, V.V. Mouse Tumor Models for Advanced Cancer Immunotherapy. Int J Mol Sci 2020, 21. [Google Scholar] [CrossRef]
- Asano, T.; Nanamiya, R.; Takei, J.; Nakamura, T.; Yanaka, M.; Hosono, H.; Tanaka, T.; Sano, M.; Kaneko, M.K.; Kato, Y. Development of Anti-Mouse CC Chemokine Receptor 3 Monoclonal Antibodies for Flow Cytometry. Monoclon Antib Immunodiagn Immunother 2021, 40, 107–112. [Google Scholar] [CrossRef]
- Tanaka, T.; Nanamiya, R.; Takei, J.; Nakamura, T.; Yanaka, M.; Hosono, H.; Sano, M.; Asano, T.; Kaneko, M.K.; Kato, Y. Development of Anti-Mouse CC Chemokine Receptor 8 Monoclonal Antibodies for Flow Cytometry. Monoclon Antib Immunodiagn Immunother 2021, 40, 65–70. [Google Scholar] [CrossRef]
- Fujii, Y.; Kaneko, M.; Neyazaki, M.; Nogi, T.; Kato, Y.; Takagi, J. PA tag: a versatile protein tagging system using a super high affinity antibody against a dodecapeptide derived from human podoplanin. Protein Expr Purif 2014, 95, 240–247. [Google Scholar] [CrossRef]
- Kashyap, M.K.; Kumar, D.; Jones, H.; Amaya-Chanaga, C.I.; Choi, M.Y.; Melo-Cardenas, J.; Ale-Ali, A.; Kuhne, M.R.; Sabbatini, P.; Cohen, L.J.; et al. Ulocuplumab (BMS-936564 / MDX1338): a fully human anti-CXCR4 antibody induces cell death in chronic lymphocytic leukemia mediated through a reactive oxygen species-dependent pathway. Oncotarget 2016, 7, 2809–2822. [Google Scholar] [CrossRef]
- Ghobrial, I.M.; Liu, C.J.; Redd, R.A.; Perez, R.P.; Baz, R.; Zavidij, O.; Sklavenitis-Pistofidis, R.; Richardson, P.G.; Anderson, K.C.; Laubach, J.; et al. A Phase Ib/II Trial of the First-in-Class Anti-CXCR4 Antibody Ulocuplumab in Combination with Lenalidomide or Bortezomib Plus Dexamethasone in Relapsed Multiple Myeloma. Clin Cancer Res 2020, 26, 344–353. [Google Scholar] [CrossRef]
- Kashyap, M.K.; Amaya-Chanaga, C.I.; Kumar, D.; Simmons, B.; Huser, N.; Gu, Y.; Hallin, M.; Lindquist, K.; Yafawi, R.; Choi, M.Y.; et al. Targeting the CXCR4 pathway using a novel anti-CXCR4 IgG1 antibody (PF-06747143) in chronic lymphocytic leukemia. J Hematol Oncol 2017, 10, 112. [Google Scholar] [CrossRef]
- Sugiyama, T.; Kohara, H.; Noda, M.; Nagasawa, T. Maintenance of the hematopoietic stem cell pool by CXCL12-CXCR4 chemokine signaling in bone marrow stromal cell niches. Immunity 2006, 25, 977–988. [Google Scholar] [CrossRef]
- Larochelle, A.; Krouse, A.; Metzger, M.; Orlic, D.; Donahue, R.E.; Fricker, S.; Bridger, G.; Dunbar, C.E.; Hematti, P. AMD3100 mobilizes hematopoietic stem cells with long-term repopulating capacity in nonhuman primates. Blood 2006, 107, 3772–3778. [Google Scholar] [CrossRef]


Disclaimer/Publisher’s Note: The statements, opinions and data contained in all publications are solely those of the individual author(s) and contributor(s) and not of MDPI and/or the editor(s). MDPI and/or the editor(s) disclaim responsibility for any injury to people or property resulting from any ideas, methods, instructions or products referred to in the content. |
© 2023 by the authors. Licensee MDPI, Basel, Switzerland. This article is an open access article distributed under the terms and conditions of the Creative Commons Attribution (CC BY) license (http://creativecommons.org/licenses/by/4.0/).


