Submitted:
07 November 2023
Posted:
08 November 2023
You are already at the latest version
Abstract
Sweetpotato is an important miscellaneous grain crop in China, which is threatened by a variety of diseases and insect pests in the process of cultivation and production. sweetpotato stem rot is one of the common sweetpotato diseases, which seriously affects the yield and quality of sweetpotato. However, there are few studies on the mechanism of resistance to stem rot in sweetpotato. In this study, transcriptome sequencing analysis was carried out on the samples at different stages (T1, T2, T3) of stem rot pathogen infecting Xushu 48, and 44839 (T1-VS-T2), 81436 (T1-VS-T2) and 61932 (T2-VS-T3) differentially expressed genes (DEGs) were obtained. The DEGs were mainly concentrated in Alanine, aspartate and glutamate metabolism (ko00250), Carbon fixation in photosynthetic organisms (ko00710) and Amino sugar and nucleotide sugar metabolism (ko00520) and some candidate genes related to plant pathogen infection, such as receptor-like protein kinase (RLK5, RLK7), LRR receptor-like serine/threonine-protein kinase (SERK1), bHLH137, ERF9, MYB73 and NAC053, were screened. The results of this study provide genetic resources for the research on stem rot resistance of sweetpotato and provide theoretical basis for sweetpotato resistance breeding.
Keywords:
Sweetpotato
; Stem rot
; Transcriptome
; Gene
; Transcription factor
1. Introduction
Sweetpotato is widely cultivated in China and has been used as an important food source, feed material and industrial raw material because it is rich in carbohydrates, nutrients, and functional ingredients [1]. The planting area and output of sweetpotato in China rank first in the world. However, the continuous planting of sweetpotato for many years has led to the occurrence and accumulation of a variety of diseases. Sweetpotato stem rot is one of the most serious sweetpotato diseases in China in recent years, which occurs in Zhejiang, Guangdong, Hebei, Henan and other provinces [2,3]. sweetpotato stem rot occurs seriously in land, which often causes serious seedling death and yield loss, and seriously affects the quality. sweetpotato stem and root rot can occur in all life stages of sweetpotato, such as seedling stage, growing period and even storage stage. The main feature of the disease is that dark brown and waterlogged disease spots are produced on the stem or petiole of sweetpotato. With the aggravation of the disease, the stem segment softens and dissociates, and the plant wilts and dies [4].
Sweetpotato stem rot was first discovered and reported in the United States in 1974 [5]. The pathogen causing sweetpotato stem rot was identified as Erwinia chrysanthemi, which was later classified as Pectobacterium according to 16s rDNA sequence analysis [6]. With the emergence of new identification techniques, some species of the pathogen of stem rot are retained in the genus Pectinobacillus, while other species are classified into the new genus Dickeya [7]. The identification of the pathogen of sweetpotato stem rot started late in China. Through molecular biology identification and sequencing identification, it was found that E.chrysanthemi and Dickeya dadantii were the main pathogens of sweetpotato in China [3,4,8]. The pathogen of sweetpotato stem rot in Zhejiang Province was also identified as D.dadantii [9]. D.dadantii has a wide host range and can infect more than 60 kinds of host plants , including ornamental plants such as Convolvulaceae, Compositae and Orchidaceae, and agricultural plants such as Solanaceae, Leguminosae, Gramineae, Dioscorea and Cruciferae, especially important food crops, such as sweetpotato, rice, corn, onion, eggplant, pepper, carrot, tomato and so on [10]. Therefore, D.dadantii is considered to be one of the top ten plant pathogenic bacteria in molecular plant pathology [11].
In recent years, sweetpotato stem rot has seriously occurred in growing areas in China, which poses a great threat to the development of sweetpotato industry and has become the bottleneck of the development of sweetpotato industry. At present, single chemical control, agricultural control and other means have been unable to control the harm of sweetpotato stem rot. Moreover, there are no varieties of sweetpotato with high resistance and immunity to stem rot [9], so there is an urgent need to screen and cultivate sweetpotato resources resistant to stem rot. Therefore, the key to cultivate resistant varieties is to excavate plant disease resistance genes. As a powerful analytical tool, RNA-seq sequencing technology has been widely used in different kinds of plants. There have been many reports on transcriptome of plant pathogens under stress, from which a large number of stress response genes of pathogens have been identified, and their disease resistance mechanism has been discussed. Xiao et al used wheat resistant and susceptible materials for transcriptome sequencing and found that PR5 and PR14 were significantly up-regulated in resistant wheat [12]. During the response of lettuce to Botrytis cinerea infection, RNA-seq data showed that the expression of genes related to phenylpropane and terpenoid synthesis was up-regulated, while the photosynthetic pathway was inhibited [13]. A resistance gene SWC was isolated and identified from capsicum by RNA-seq technique. The protein encoded by this gene can recognize the effect factor AvrBs4 released by Xanthomonas [14]. With the continuous development of RNA-seq sequencing technology, with the help of this technology, we can carry out more detailed and in-depth sequencing of plant transcriptome in response to pathogen infection. By studying the differential expression changes of plant genes, we can mine more and more reliable candidate genes for disease resistance and provide important information for further exploration of the molecular mechanism of plant disease resistance. Therefore, in this paper, using the medium-resistant sweetpotato variety Xushu 48 as material, the expression of stem rot response genes in different stages of stem rot infection was analyzed by transcriptome, and the sweetpotato stem rot resistance genes were excavated to provide theoretical basis for sweetpotato resistance breeding.
2. Materials and Methods
2.1. Plant materials and treatments
Xushu 48 is a fresh sweetpotato variety selected by Xuzhou Agricultural Science Research Institute in Xuhuai region of Jiangsu Province and is resistant to stem rot. sweetpotato stem rot pathogen (Dickeya dadantii) was collected, isolated, identified and preserved by the Institute of Plant Protection and Microbiology of Zhejiang Academy of Agricultural Sciences, Dd1 and Dd2. The mixed strains of Dd1 and Dd2 were used to identify the resistance of sweetpotato to stem rot in laboratory[15]. Pathogen inoculation: activate and preserve strain Dd1 and Dd2, pick up single colony on NA medium, culture at 28 ℃ for 36 h, rinse bacterial moss with sterile water on NA plate, and prepare bacterial suspension with concentration of 107/mL for resistance test and acupuncture inoculation[9].
Resistance identification: the indoor inoculation resistance of vermiculite potato seedlings was identified by the method developed by the Institute of Plant Protection and Microbiology of Zhejiang Academy of Agricultural Sciences. Fill the 500ml Guangkou tissue culture bottle with vermiculite with fully wet sterile water, gently wipe out the wound from the stem base of 5cm with sandpaper with 3-4 leaves, and then cut it into vermiculite, so that part of the wound is not in vermiculite, the other part is exposed to the air, sprinkle the 1ml solution to the scratch of sweetpotato seedlings with a transfer gun, and then place it in a temperature-controlled and light-controlled culture room at 30 ℃. The air relative humidity is 80%. Aseptic water-drenched seedlings were used as control. Tissue culture bottle vermiculite cuttage each glass bottle 1 plant, each treatment 10 plants, set up 3 repeats. After being placed in the culture room, the incidence was observed and recorded day by day, and samples were taken at non-infection (T1), infection 3 days (T2), and infection 6 days (T3).
2.2. RNA isolation cDNA library preparation and RNA-Seq
Total RNA was extracted from three sweetpotato cultivars roots treated at 60℃ and CK using Trizol reagent kit (Invitrogen, Carlsbad, CA,USA) according to the manufacturer’s protocol. RNA quality was assessed on an Agilent 2100 Bioanalyzer (Agilent Technologies, Palo Alto, CA, USA) and checked using RNase free agarose gel electrophoresis. After total RNA was extracted, eukaryotic mRNA was enriched by Oligo (dT) beads, while prokaryotic mRNA was enriched by removing rRNA by Ribo-ZeroTM Magnetic Kit (Epicentre, Madison, WI, USA). Then the enriched mRNA was fragmented into short fragments using fragmentation buffer and reverse transcripted into cDNA with random primers. Second-strand cDNA were synthesized by DNA polymerase I, RNase H, dNTP and buffer. Then the cDNA fragments were purified with QiaQuick PCR extraction kit (Qiagen, Venlo, The Netherlands), end repaired, poly(A) added, and ligated to Illumina sequencing adapters. The ligation products were size selected by agarose gel electrophoresis, PCR amplified, and sequenced using Illumina HiSeq2500 by Gene Denovo Biotechnology Co. (Guangzhou, China).
2.3. Analysis of DEGs (differentially expressed genes)
RNAs differential expression analysis was performed by DESeq2 software [16] between two different groups (and by edgeR [17] between two samples). The genes/transcripts with the parameter of false discovery rate (FDR) ≤ 0.05 and absolute fold change ≥ 2 were considered as differentially expressed genes/transcripts[18].
2.4. GO (Gene ontology) and KEGG (Kyoto Encyclopedia of Genes and Genomes) enrichment analysis
GO[19] and KEGG[20] pathways of these DEGs were analyzed to determine the significant abundance of GO terms and metabolic pathways. GOSeqR software package was used for GO enrichment analysis, and KEGG Orthology software was used for KEGG pathway analysis. Functional terms and pathways of DEGs were considered to be significantly different when the P < 0.05. The WEGO software was used to classify the functional classification of the GO annotations.
2.5. qRT-PCR (Real-time quantitative PCR) validation
A number of nine randomly selected unigenes were used for quantitative RT-PCR assays using QuantStudio TM 6 Flex Real-Time PCR System by Thermo Fisher Scientific. Total RNA was extracted from sweetpotato storage roots by Total RNA rapid extraction kit(GK3016,Shanghai Generay Biotech Co.,Ltd.,Shanghai,Chain)and was reverse-transcribed into cDNA using ReverTra Ace® qPCR RT Master Mix with gDNA Remover Kit (FSQ-301,TOYOBO Co.,Ltd.,Japan). The qRT-PCR reaction protocol was conducted using SYBR Green Real Time PCR Master Mix (10 μL), PCR Forward / Reverse Primer (10 μM, 0.5μL), cDNA template (1 μL), ddH2O (8 μL), and ARF (JX177359) was used as internal control (reference gene)[21]. qRT-PCR primers of each unigene were designed using primer 3 Plus software are shown in Supplementary Table S1. The data from three independent experiments were calculated with the 2−△△Ct method[22] .
2.6. Statistical analysis
Means, standard errors and significance analysis of differences were calculated by SPSS 22.0 software. Tukey's multiple comparison test was used to determine the significance of differences between samples. The determination of physical and chemical indexes of samples and transcriptome sequencing carried out at least 3 biological repeats. The figures in this paper were drawn by origin 8.0 and photoshop C5 software.
3. Results
3.1. Phenotypic analysis of sweetpotato after inoculation
The isolated sweetpotato stem rot pathogen was inoculated into healthy Xushu 48 plants in the laboratory, and the phenotypic changes of sweetpotato plants were observed (Figure 1). The results showed that the stems and leaves of the uninoculated sweetpotato plants were green, there were no black spots, and the leaves extended normally. Three days after inoculation with sweetpotato stem rot pathogen, the sweetpotato stem appeared black-brown disease spot, and the leaves began to lose water and droop. Six days after inoculation with sweetpotato stem rot pathogen, the stem segment of sweetpotato rotted and died, the water loss of stem and leaf was serious, and the plant began to die.
3.2. Transcriptome analysis
The samples of stem rot pathogen infecting the stem segment of Xushu 48 in different periods (T1, T2, T3) were analyzed by principal component and heat map analysis. It was found that there was a large degree of dispersion in the three periods and a good coincidence among three repeats in each period (Figure 2A/B). The results showed that the transcriptome data were stable and reliable. Thirteen different expressed genes were selected and their expressions were determined by RT-qPCR. Through correlation analysis, it was found that there was a good correlation between the fold change of FPKM in the transcriptome data and RT-qPCR of the 13 different expressed genes (R2 = 0.826). This shows that the transcriptome data is accurate and reliable. Transcriptional group data analysis found that the amount of sequencing data of each sample was more than 6GB, and the proportion of cleandate was more than 99%, indicating that the amount of sequencing data met the expected requirements (Supplementary Table S2).
3.3. Identification of differentially expressed genes (DEGs) and analysis
The DEGs in different stages of stem rot pathogen infecting Xushu 48 were analyzed. The results showed that there were 44839 DEGs between T2 and T1, including 17351 up-regulated genes and 27488 down-regulated genes. There were 81436 DEGs between T3 and T1, including 16820 up-regulated genes and 64616 down-regulated genes. There were 61932 DEGs between T3 and T2, including 11369 up-regulated genes and 50563 down-regulated genes (Figure 3).
3.4. Enrichment of GO terms and KEGG pathway analysis
By GO annotation analysis, it was found that the differential genes in the three periods were mainly enriched in five GO terms, such as cellular process, metabolic process, banding, catalytic activiy and cellular anatomical entily. With the extension of infection time of stem rot pathogen, the number of DEGs in the five main GO terms increased at first and then decreased, and the number of DEGs was the most in T2 period, indicating that T2 stage may be the key period for plants to resist pathogen invasion. (Figure 4). Among the top 20 GO terms with significant enrichment of DEGs compared with T1 and T2, a large number of DEGs were enriched in catalytic activity (GO:0016194), oxidoreductase activity (GO:0003824) and small molecule metabolic process (GO:0044281). With the prolongation of infection time, DEGs were mainly enriched in cytoplasm (GO:00005737), organonitrogen compound biosynthetic process (GO:1901566) and small molecule metabolic process (GO:0044281) in T3 and T1 comparison groups, with 20994, 10101 and 16605 DEGs respectively. In T2 and T3 groups, DEGs were widely enriched in cytoplasm (GO:00005737), organonitrogen compound biosynthetic process (GO:1901566) and cellular nitrogen metabolic process (GO:0034641) (Figure 5).
KEGG pathway enrichment analysis showed that the DEGs in the three groups were mainly enriched in global and overviwe maps, carbohydrate metabolism, transcription, signal transduction and other biological pathways (Figure 6A). Metabolic pathway association analysis showed that metabolic pathway (ko01100) was associated with other metabolic pathways including glycolysis / gluconeogenesis (ko00010), Carbon fixation in photosynthetic organisms (ko00710)/Amino sugar and nucleotide sugar metabolism (ko00520) and fructose and mannose metabolism (ko00051) in T1 and T2 comparison groups (Figure 6B). In the T1 and T3 comparison groups, there were three associated node metabolic pathways connected with other metabolic pathways, which were Alanine, aspartate and glutamate metabolism (ko00250), Carbon fixation in photosynthetic organisms (ko00710) and Amino sugar and nucleotide sugar metabolism (ko00520) respectively (Figure 6C). In T2 and T3 groups, the main metabolic pathway node was Alanine, aspartate and glutamate metabolism (ko00250), which was also associated with Amino sugar and nucleotide sugar metabolism (ko00520) and glycolysis / gluconeogenesis (ko00010) (Figure 6D). The above results suggest that carbohydrate metabolism may play an important role in the resistance of sweetpotato to stem rot pathogen.
3.5. Analysis of expression trend of DEGs
The expression trends of DEGs in three periods were grouped and 8 modules were obtained. With the extension of the infection time of stem rot pathogen, the expression of genes related to stem rot infection may increase or decrease. Therefore, we will focus on the differentially expressed genes in module 0 and module 7 in the future. There were 20767 DEGs in module 0 and 4422 DEGs in module 7 (Figure 7). Many genes related to infection and defense of plant pathogens were screened in module 0 and module 7, such as receptor-like protein kinase (RLK5 (Ibat.Brg.05B_G013520), RLK7 (Ibat.Brg.08C_G006740)), LRR receptor-like serine/threonine-protein kinase (SERK1 (Ibat.Brg.06B_G025950)), sserine/threonine-protein kinase 11-interacting protein-like (STK11IP (Ibat.Brg.10A_G016990)). Thirteen plant disease resistance related genes were selected and their relative expressions were determined by q-PCR. Compared with the transcriptome data, it was found that the expression trend of these genes was consistent (Supplementary Table S3).
3.6. Analysis of differentially expressed transcription factors
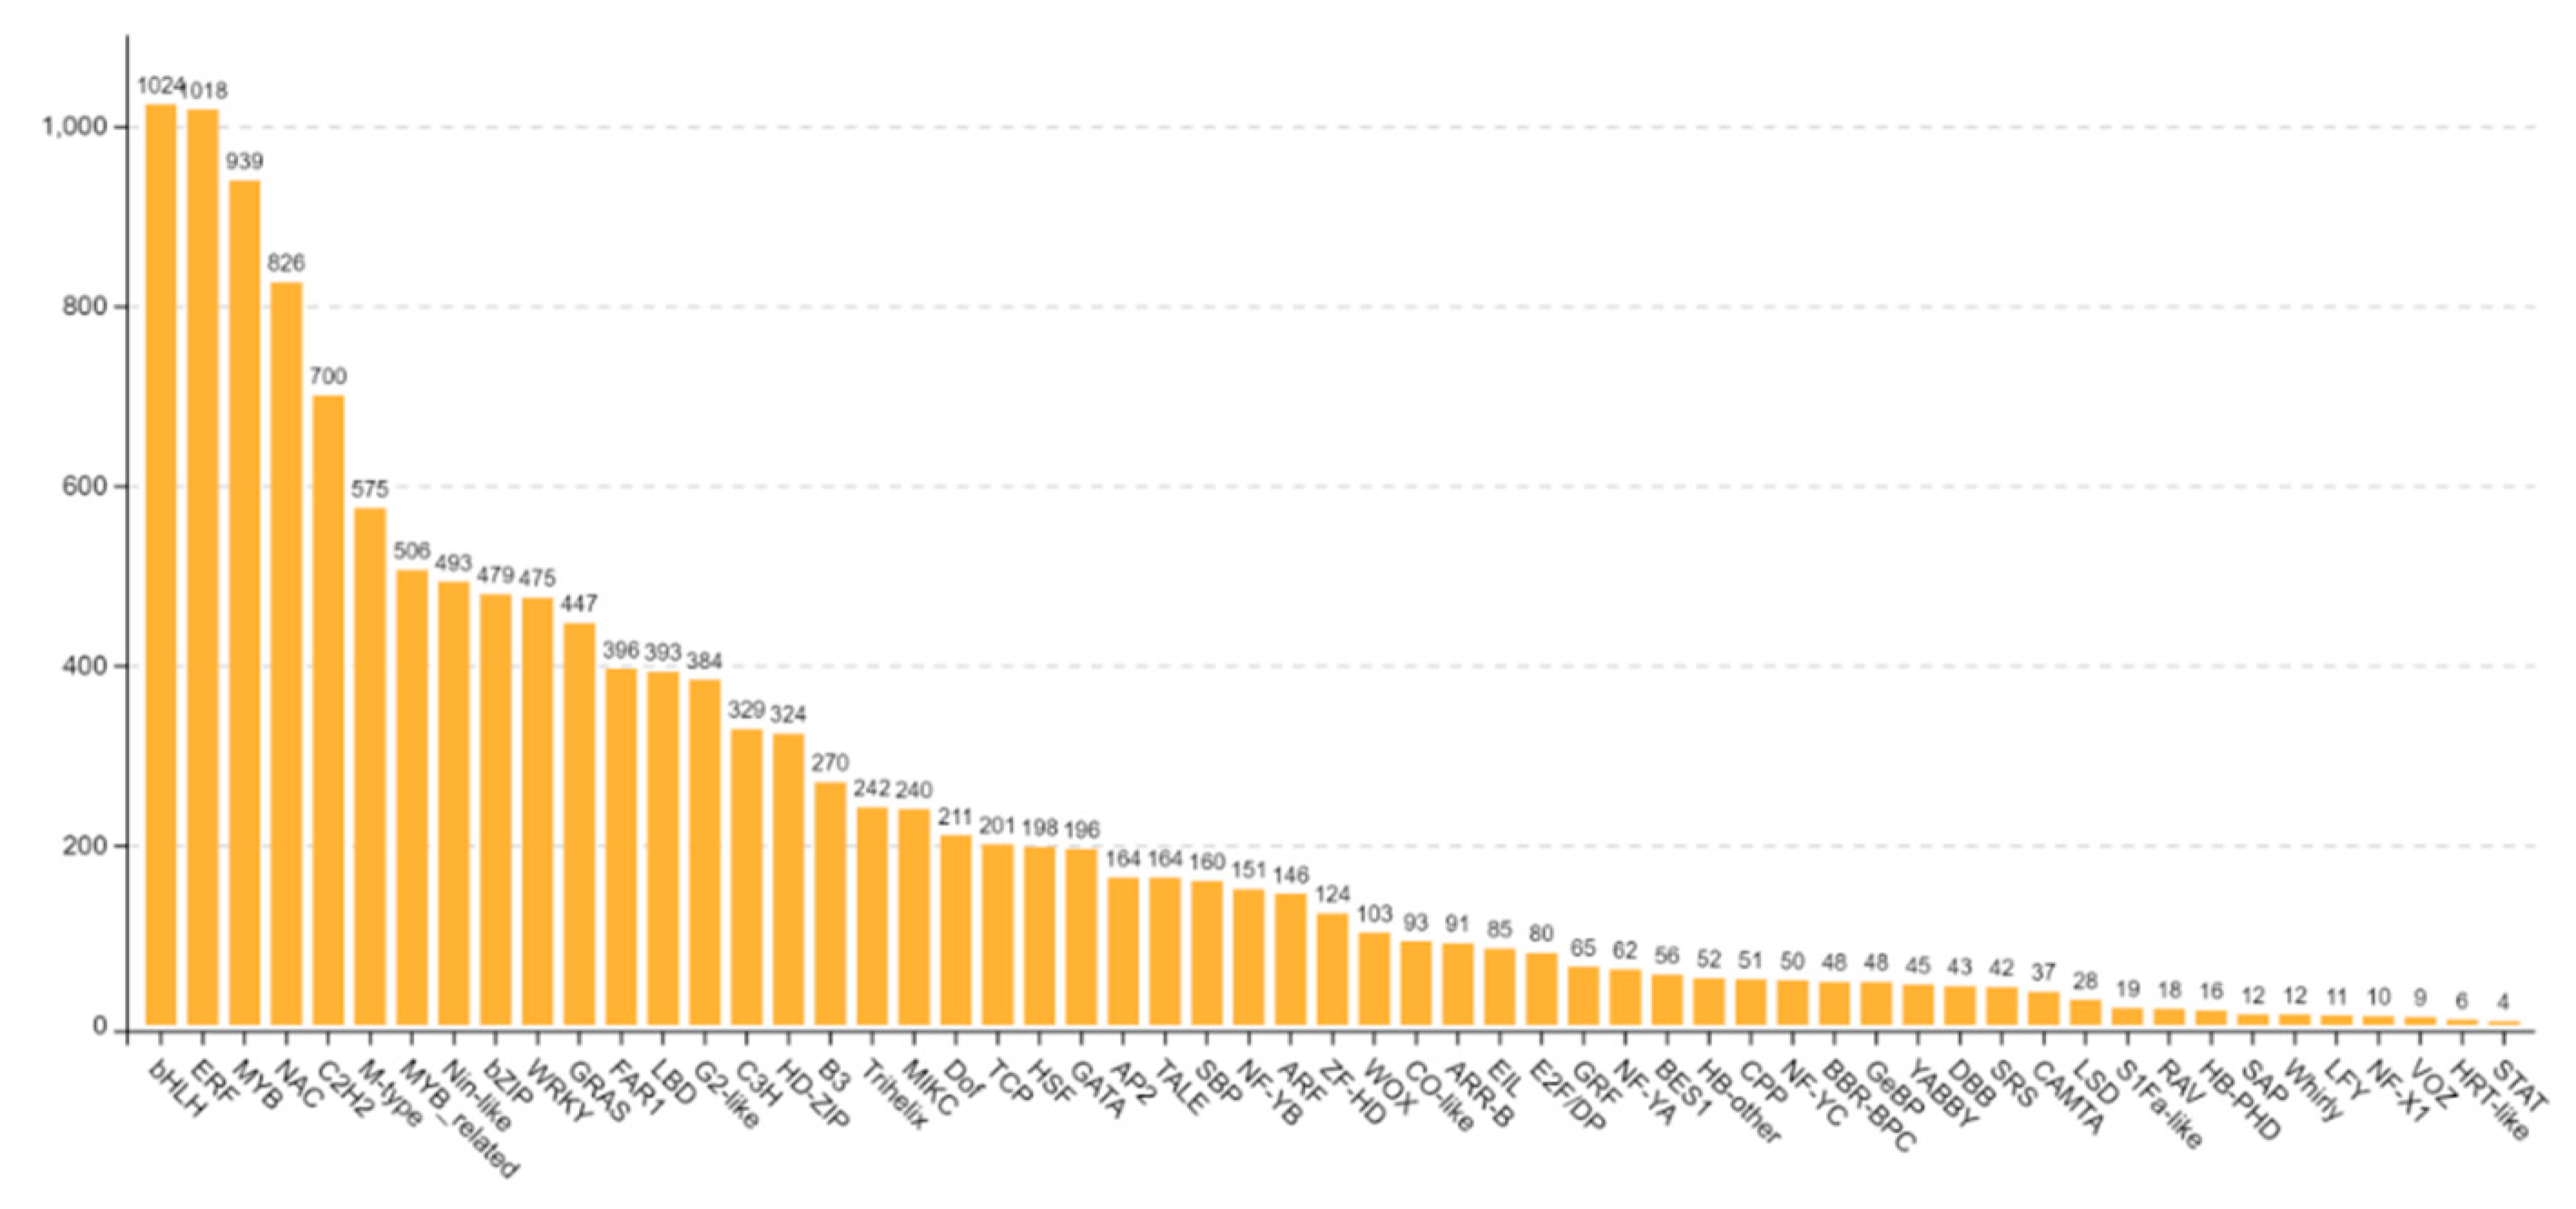
The family and number of transcription factors were analyzed. The results showed that there were a large number of bHLH, ERF, MYB, NAC and C2H2 transcription factor families, including 1024 differential transcription factors in the bHLH transcriptome family and 1018 members in the ERF transcription factor family. Secondly, the number of MYB, NAC and C2H2 transcription factor families was 939,826,700 respectively (Figure 8). The number of the first five transcription factor families accounted for 34.75% of the total, indicating that bHLH, ERF, MYB, NAC and C2H2 transcription factor members may be related to sweetpotato stem rot infection. Members of bHLH, ERF, MYB transcription factor family play an important role in plant growth and development and in both biotic and abiotic stresses. In the transcriptome data, it was found that bHLH family member bHLH137 (Ibat.Brg.04D_G021250), bHLH162 (Ibat.Brg.06B_G028170), ERF transcription factor family member ERF9 (Ibat.Brg.09A_G006830), ERF4 (Ibat.Brg.10F_G018750), and MYB family member MYB73 (Ibat.Brg.01F_G031560), MYB2 (Ibat.Brg.02A_G015020) may respond to the infection of sweetpotato stem rot. NAC transcription factors are plant-specific transcription factors, which play an important role in the regulation of plant stress resistance. A total of 820 NAC transcription factor family members or transcripts were obtained in the transcriptome, including a number of significantly up-regulated and down-regulated members, such as NAC053 (Ibat.Brg.02B_G005540), NAC078 (Ibat.Brg.02F_G003820), NAC081 (Ibat.Brg.03E_G007680), NAC021 (Ibat.Brg.04D_G028260).
4. Discussion
Like other crops, the production and cultivation of sweetpotato are infected by various pathogens, and stem rot is one of the common diseases of sweetpotato. The incidence of stem rot seriously affects the yield and nutritional quality of sweetpotato. Sweetpotato stem rot was first discovered and reported in the United States in 1974 [5]. In recent years, the pathogen of sweetpotato stem rot has been isolated and identified as D.dadantii [2]. However, there are few studies on the mechanism of stem rot resistance in sweetpotato, and there are few reports on the mining of stem rot resistance genes in sweetpotato. Therefore, in this study, transcriptome was used to determine the gene expression level of Xushu 48, moderately resistant to stem rot, in different stages of stem rot infection.
Plants rely on innate immunity to perceive and resist potential pathogens. Plant innate immune system consists of two related systems: Pathogen-associated molecular patterns-triggered immunity (PTI) and Effector-triggered immunity (ETI). PTI is the first layer of the plant immune system [23]. Most invasive pathogens can be recognized by a transmembrane plant protein called Pattern recognition receptors (PRRs). After identifying the pathogen, PRRs transmits the immunity signal downstream through the Botrytis-induced kinase 1 (BIK1) [24], Mitogen-activated protein kinase (MAPK) and Calcium-dependent protein kinase (CDPK) [25], and then activates the corresponding immune response, such as the accumulation of reactive oxygen species (ROS) and callose. In the transcriptome data, we also found significant differentially expressed Mitogen-activated protein kinase genes and Calcium-dependent protein kinase genes, such as MAPK20 (Ibat.Brg.05A_G019550),MAPK18 (Ibat.Brg.06E_G014790) and CPK1 (Ibat.Brg.01E_G026440). In addition, GO annotation analysis showed that the number of DEGs enriched by catalytic activity (GO:0016194), oxidoreductase activity (GO:0003824) was more in the early stage of stem rot infection, while in the later stage of infection, the number of DEGs enriched in organonitrogen compound biosynthetic process (GO:1901566) and small molecule metabolic process (GO:0044281) was more. The expression pattern of these DEGs is consistent with the biological process of infection by plant resistant pathogens.
With the continuous evolution of pathogens, the effectors of some pathogens can avoid PTI into plants. Accordingly, plants have evolved the second layer of the immune system: ETI [26,27] . Plants have evolved a specific resistance gene: r gene. Most R genes encode a receptor that binds to leucine-rich repeats (NLR). NLR receptors can sense toxic proteins directly or indirectly in cells and trigger a series of immune responses to achieve plant disease resistance. Similarly, there are a large number of DEGs related to leucine-rich repeats and their related regulatory kinases in transcriptome data, such as LRR receptor-like serine/threonine-protein kinase (FEI1, Ibat.Brg.01D_G026840), plant intracellular Ras-group-related LRR protein (PIRL2, Ibat.Brg.07D_G004510). These candidate genes may be important regulatory genes for sweetpotato to resist the invasion of stem rot pathogen.
Transcription factor family also plays an important role in the process of plant resistance to pathogens. Among the transcription factors induced by MTI, WRKY transcription factor is the most prominent. 15 WRKY-TFs are strongly induced, including WRKY18, WRKY33 and WRKY40 [28]. These three WRKY genes are also considered to be important node genes in the WRKY regulatory network [29]. A total of 475 WRKY family members or transcripts were screened from transcriptome data, including WRKY33 (Ibat.Brg.15B_G007050) and WRKY40 (Ibat.Brg.S022350). In addition, bHLH [30], ERF [31], NAC [32,33], MYB [34] and other transcription factor families have also been reported to be related to plant disease resistance or biological stress. A large number of transcription factors, such as bHLH137 (Ibat.Brg.04D_G021250), bHLH162 (Ibat.Brg.06B_G028170), ERF9 (Ibat.Brg.09A_G006830), ERF4 (Ibat.Brg.10F_G018750), MYB73 (Ibat.Brg.01F_G031560), and MYB2 (Ibat.Brg.02A_G015020), were also screened. These candidate transcription factors provide valuable genetic resources for studying the molecular mechanism of stem rot resistance of sweetpotato.
5. Conclusions
In this study, transcriptome sequencing analysis was carried out on the samples at different stages (T1, T2, T3) of stem rot pathogen infecting Xushu 48, and 44839 (T1-VS-T2), 81436 (T1-VS-T2) and 61932 (T2-VS-T3) differentially expressed genes (DEGs) were obtained. The DEGs were mainly concentrated in Alanine, aspartate and glutamate metabolism (ko00250), Carbon fixation in photosynthetic organisms (ko00710) and Amino sugar and nucleotide sugar metabolism (ko00520) and some candidate genes related to plant pathogen infection, such as receptor-like protein kinase (RLK5, RLK7), LRR receptor-like serine/threonine-protein kinase (SERK1), bHLH137, ERF9, MYB73 and NAC053, were screened. The results of this study provide genetic resources for the research on stem rot resistance of sweetpotato and provide theoretical basis for sweetpotato resistance breeding.
Supplementary Materials
The following supporting information can be downloaded at: www.mdpi.com/xxx/s1, Table S1: Primer sequence; Table S2: Data filtering statistical table; Table S3: Comparison of q-PCR and transcriptome data..
Author Contributions
Conceptualization, Y.-G.Z. and M.K.; methodology, W.-H.S., M.-Q.J., Q.L. and L.-R.C.; software, H.-H.J and M.K.; validation, H.-H.J. and ; formal analysis, L.Z.; investigation, M.-Q.J.; resources, Q.L. and M.K.; data curation, C.L.; writing—original draft preparation, C.L.; writing—review and editing, L.Z., W.-H.S. and M.K.; visualization, Z.-Y.Z and L.-R.C.; supervision, Z.-Y.Z.; project administration, Y.-G.Z.; funding acquisition, Q.L. and L.-R.C.. All authors have read and agreed to the published version of the manuscript.
Funding
This research was funded by 2021 Academy-locality cooperation project in Jinhua , grant number 202104, Major Science and technology special project on breeding of new varieties for agriculture (Breeding of new dry grain varieties) in Zhejiang province, Breeding of new potato varieties , grant number 2021C02064-1, and the earmarked fund for CARS-10-Sweetpotato.
Institutional Review Board Statement
Not applicable.
Informed Consent Statement
Not applicable.
Data Availability Statement
The data used to support the findings of this study can be made available by the corresponding author upon request.
Conflicts of Interest
The authors declare no conflict of interest.
References
- Li, Q.; Zhao, H.; Jin, Y.L.; Zhu, J.C.; Ma, D.F. Analysis and perspectives of sweetpotato industry contributing to national food security in china. Jiangsu J. Agric. Sci. 2022, 38, 1484–1491. [Google Scholar]
- Huang, L.F.; Fang, B.P.; Luo, Z.X.; Chen, J.Y.; Zhang, X.J.; Wang, Z.Y. First Report of Bacterial Stem and Root Rot of Sweetpotato Caused by a Dickeya sp. (Erwinia chrysanthemi) in China. Plant Dis. 2010, 94, 1503. [Google Scholar] [CrossRef]
- Qin, S.Y.; Huang, L.F.; Ge, C.B.; Liu, Z.J.; Zhang, Y.Y.; Li, J.G.; Fang, B.P. Molecular identification of a new bacterial stem rot disease of sweetpotato in Henan. Crops 2013, 52–55. [Google Scholar] [CrossRef]
- Huang, L.F.; Luo, Z.X.; Fang, B.P.; Chen, J.Y.; Zhang, X.J.; Wang, Z.Y. A new bacterial stem and root rot disease of sweetpotato in Guangdong, China. Acta Phytopathol Sin 2011, 41, 18–23. [Google Scholar]
- Schaad, N.W. A Bacterial Wilt and Root Rot of Sweet Potato Caused by Erwinia chrysanthemi. Phytopathology 1977, 77, 302. [Google Scholar] [CrossRef]
- Hauben, L.; Moore, E.R.; Vauterin, L.; Steenackers, M.; Mergaert, J.; Verdonck, L.; Swings, J. Phylogenetic Position of Phytopathogens within the Enterobacteriaceae. Syst. Appl. Microbiol. 1998, 21, 384–397. [Google Scholar] [CrossRef] [PubMed]
- Samson, R.; Legendre, J.B.; Christen, R.; Saux, M.F.-L.; Achouak, W.; Gardan, L. Transfer of Pectobacterium chrysanthemi (Burkholder et al. 1953) Brenner et al. 1973 and Brenneria paradisiaca to the genus Dickeya gen. nov. as Dickeya chrysanthemi comb. nov. and Dickeya paradisiaca comb. nov. and delineation of four novel species, Dickeya dadantii sp. nov., Dickeya dianthicola sp. nov., Dickeya dieffenbachiae sp. nov. and Dickeya zeae sp. nov. Int. J. Syst. Evol. Microbiol. 2005, 55, 1415–1427. [Google Scholar] [CrossRef] [PubMed]
- Huang, L.F.; Fang, B.P.; Luo, Z.X.; Chen, J.Y.; Wang, Z.Y. First Report of Bacterial Stem and Root Rot of Sweetpotato Caused by a Dickeya sp. (Erwinia chrysanthemi) in China. Plant Dis. Int. J. Appl. Plant Pathol. 2010, 25, 325–333. [Google Scholar] [CrossRef] [PubMed]
- Lou, B.G.; Shen, X.L.; Lu, G.Q.; Lin, X.B.; Li, Y.H.; Zhang, Y.; Lu, Y. Analysis of resistance to stem rot in sweetpotato germplasm resources. J. Zhejiang Agric. Sci. 2018, 59, 2204–2207. [Google Scholar] [CrossRef]
- Ma, B.; Hibbing, M.E.; Kim, H.-S.; Reedy, R.M.; Yedidia, I.; Breuer, J.; Breuer, J.; Glasner, J.D.; Perna, N.T.; Kelman, A.; et al. Host Range and Molecular Phylogenies of the Soft Rot Enterobacterial GeneraPectobacteriumandDickeya. Phytopathology 2007, 97, 1150–1163. [Google Scholar] [CrossRef]
- Mansfield, J.; Genin, S.; Magori, S.; Citovsky, V.; Sriariyanum, M.; Ronald, P.; Dow, M.; Verdier, V.; Beer, S.V.; Machado, M.A.; et al. Top 10 plant pathogenic bacteria in molecular plant pathology. Mol. Plant Pathol. 2012, 13, 614–629. [Google Scholar] [CrossRef] [PubMed]
- Xiao, J.; Jin, X.; Jia, X.; Wang, H.; Cao, A.; Zhao, W.; Pei, H.; Xue, Z.; He, L.; Chen, Q.; et al. Transcriptome-based discovery of pathways and genes related to resistance against Fusariumhead blight in wheat landrace Wangshuibai. BMC Genom. 2013, 14, 197. [Google Scholar] [CrossRef] [PubMed]
- DE Cremer, K.; Mathys, J.; Vos, C.; Froenicke, L.; Michelmore, R.W.; Cammue, B.P.A.; DE Coninck, B. RNAseq-based transcriptome analysis of Lactuca sativa infected by the fungal necrotroph Botrytis cinerea. Plant, Cell Environ. 2013, 36, 1992–2007. [Google Scholar] [CrossRef] [PubMed]
- Strauß, T.; van Poecke, R.M.P.; Strauß, A.; Römer, P.; Minsavage, G.V.; Singh, S.; Wolf, C.; Strauß, A.; Kim, S.; Lee, H.-A.; et al. RNA-seq pinpoints a Xanthomonas TAL-effector activated resistance gene in a large-crop genome. Proc. Natl. Acad. Sci. USA 2012, 109, 19480–19485. [Google Scholar] [CrossRef] [PubMed]
- Shen, X.L.; Lin, C.; Qian, J.T.; Chou, Z.L.; Chen, J.B.; Sun, C.; Yi, J.P.; Lou, B.G. Characterization of stem and root rot symptoms of sweetpotato and the causal pathogen of the disease. Acta Phytopathol Sin 2018, 48, 25–34. [Google Scholar]
- Love, M.I.; Huber, W.; Anders, S. Moderated estimation of fold change and dispersion for RNA-seq data with DESeq2. Genome Biol. 2014, 15, 550. [Google Scholar] [CrossRef]
- Robinson, M.D.; McCarthy, D.J.; Smyth, G.K. EdgeR: A Bioconductor package for differential expression analysis of digital gene expression data. Bioinformatics 2010, 26, 139–140. [Google Scholar] [CrossRef]
- Storey, J.D.; Tibshirani, R. Statistical significance for genomewide studies. Proc. Natl. Acad. Sci. USA 2003, 100, 9440–9445. [Google Scholar] [CrossRef]
- Ashburner, M.; Ball, C.A.; Blake, J.A.; Botstein, D.; Butler, H.; Cherry, J.M.; Davis, A.P.; Dolinski, K.; Dwight, S.S.; Eppig, J.T.; et al. Gene ontology: Tool for the unification of biology. Nat. Genet. 2000, 25, 25–29. [Google Scholar] [CrossRef]
- Kanehisa, M.; Goto, S. KEGG: Kyoto Encyclopedia of Genes and Genomes. Nucleic Acids Res. 2000, 28, 27–30. [Google Scholar] [CrossRef]
- Park, S.-C.; Kim, Y.-H.; Ji, C.Y.; Park, S.; Jeong, J.C.; Lee, H.-S.; Kwak, S.-S. Stable Internal Reference Genes for the Normalization of Real-Time PCR in Different Sweetpotato Cultivars Subjected to Abiotic Stress Conditions. PLoS ONE 2012, 7, e51502. [Google Scholar] [CrossRef] [PubMed]
- Livak, K.J.; Schmittgen, T.D. Analysis of relative gene expression data using real-time quantitative PCR and the 2−ΔΔCT Method. Methods 2001, 25, 402–408. [Google Scholar] [CrossRef] [PubMed]
- Dangl, J.L.; Horvath, D.M.; Staskawicz, B.J. Pivoting the Plant Immune System from Dissection to Deployment. Science 2013, 341, 746–751. [Google Scholar] [CrossRef]
- Lu, D.; Wu, S.; He, P.; Shan, L. Phosphorylation of receptor-like cytoplasmic kinases by bacterial Flagellin. Plant Signal. Behav. 2010, 5, 598–600. [Google Scholar] [CrossRef]
- Boudsocq, M.; Sheen, J. CDPKs in immune and stress signaling. Trends Plant Sci. 2012, 18, 30–40. [Google Scholar] [CrossRef]
- Thomma, B.P.H.J.; Nürnberger, T.; Joosten, M.H.A.J. Of PAMPs and Effectors: The Blurred PTI-ETI Dichotomy. Plant Cell 2011, 23, 4–15. [Google Scholar] [CrossRef]
- Schulmeyer, K.H.; Yahr, T.L. Post-transcriptional regulation of type III secretion in plant and animal pathogens. Curr. Opin. Microbiol. 2017, 36, 30–36. [Google Scholar] [CrossRef]
- Zipfel, C.; Robatzek, S.; Navarro, L.; Oakeley, E.J.; Jones, J.D.G.; Felix, G.; Boller, T. Bacterial disease resistance in Arabidopsis through flagellin perception. Nature 2004, 428, 764–767. [Google Scholar] [CrossRef]
- Birkenbihl, R.P.; Kracher, B.; Roccaro, M.; Somssich, I.E. Induced Genome-Wide Binding of Three Arabidopsis WRKY Transcription Factors during Early MAMP-Triggered Immunity. Plant Cell 2016, 29, 20–38. [Google Scholar] [CrossRef] [PubMed]
- Li, H.; Sun, J.; Xu, Y.; Jiang, H.; Wu, X.; Li, C. The bHLH-type transcription factor AtAIB positively regulates ABA response in Arabidopsis. Plant Mol. Biol. 2007, 65, 655–665. [Google Scholar] [CrossRef]
- Lorenzo, O.; Piqueras, R.; Sánchez-Serrano, J.J.; Solano, R. ETHYLENE RESPONSE FACTOR1 Integrates Signals from Ethylene and Jasmonate Pathways in Plant Defense[W]. Plant Cell 2003, 15, 165–178. [Google Scholar] [CrossRef]
- Nakashima, K.; Tran, L.P.; Van Nguyen, D.; Fujita, M.; Maruyama, K.; Todaka, D.; Ito, Y.; Hayashi, N.; Shinozaki, K.; Yamaguchi-Shinozaki, K. Functional analysis of a NAC-type transcription factor OsNAC6 involved in abiotic and biotic stress-responsive gene expression in rice. Plant J. 2007, 51, 617–630. [Google Scholar] [CrossRef]
- Mao, X.; Zhang, H.; Qian, X.; Li, A.; Zhao, G.; Jing, R. TaNAC2, a NAC-type wheat transcription factor conferring enhanced multiple abiotic stress tolerances in Arabidopsis. J. Exp. Bot. 2012, 63, 2933–2946. [Google Scholar] [CrossRef]
- Wang, H.T.; Jiang, J.L.; Wang, Q.; Wei, L.N.; Hu, J. Research progress on the mechanism of R2R3-MYB transcription factors in response to plant stress tolerance. Mol. Plant Breeding 2023, 1–16. [Google Scholar]
Figure 1.
phenotype of different stages of stem rot infection of Xushu 48. The red arrow indicates that the sweetpotato stem is infected by stem rot. T1, T2 and T3 were uninfected, infected by stem rot for 3 days and infected by stem rot for 6 days, respectively..
Figure 1.
phenotype of different stages of stem rot infection of Xushu 48. The red arrow indicates that the sweetpotato stem is infected by stem rot. T1, T2 and T3 were uninfected, infected by stem rot for 3 days and infected by stem rot for 6 days, respectively..
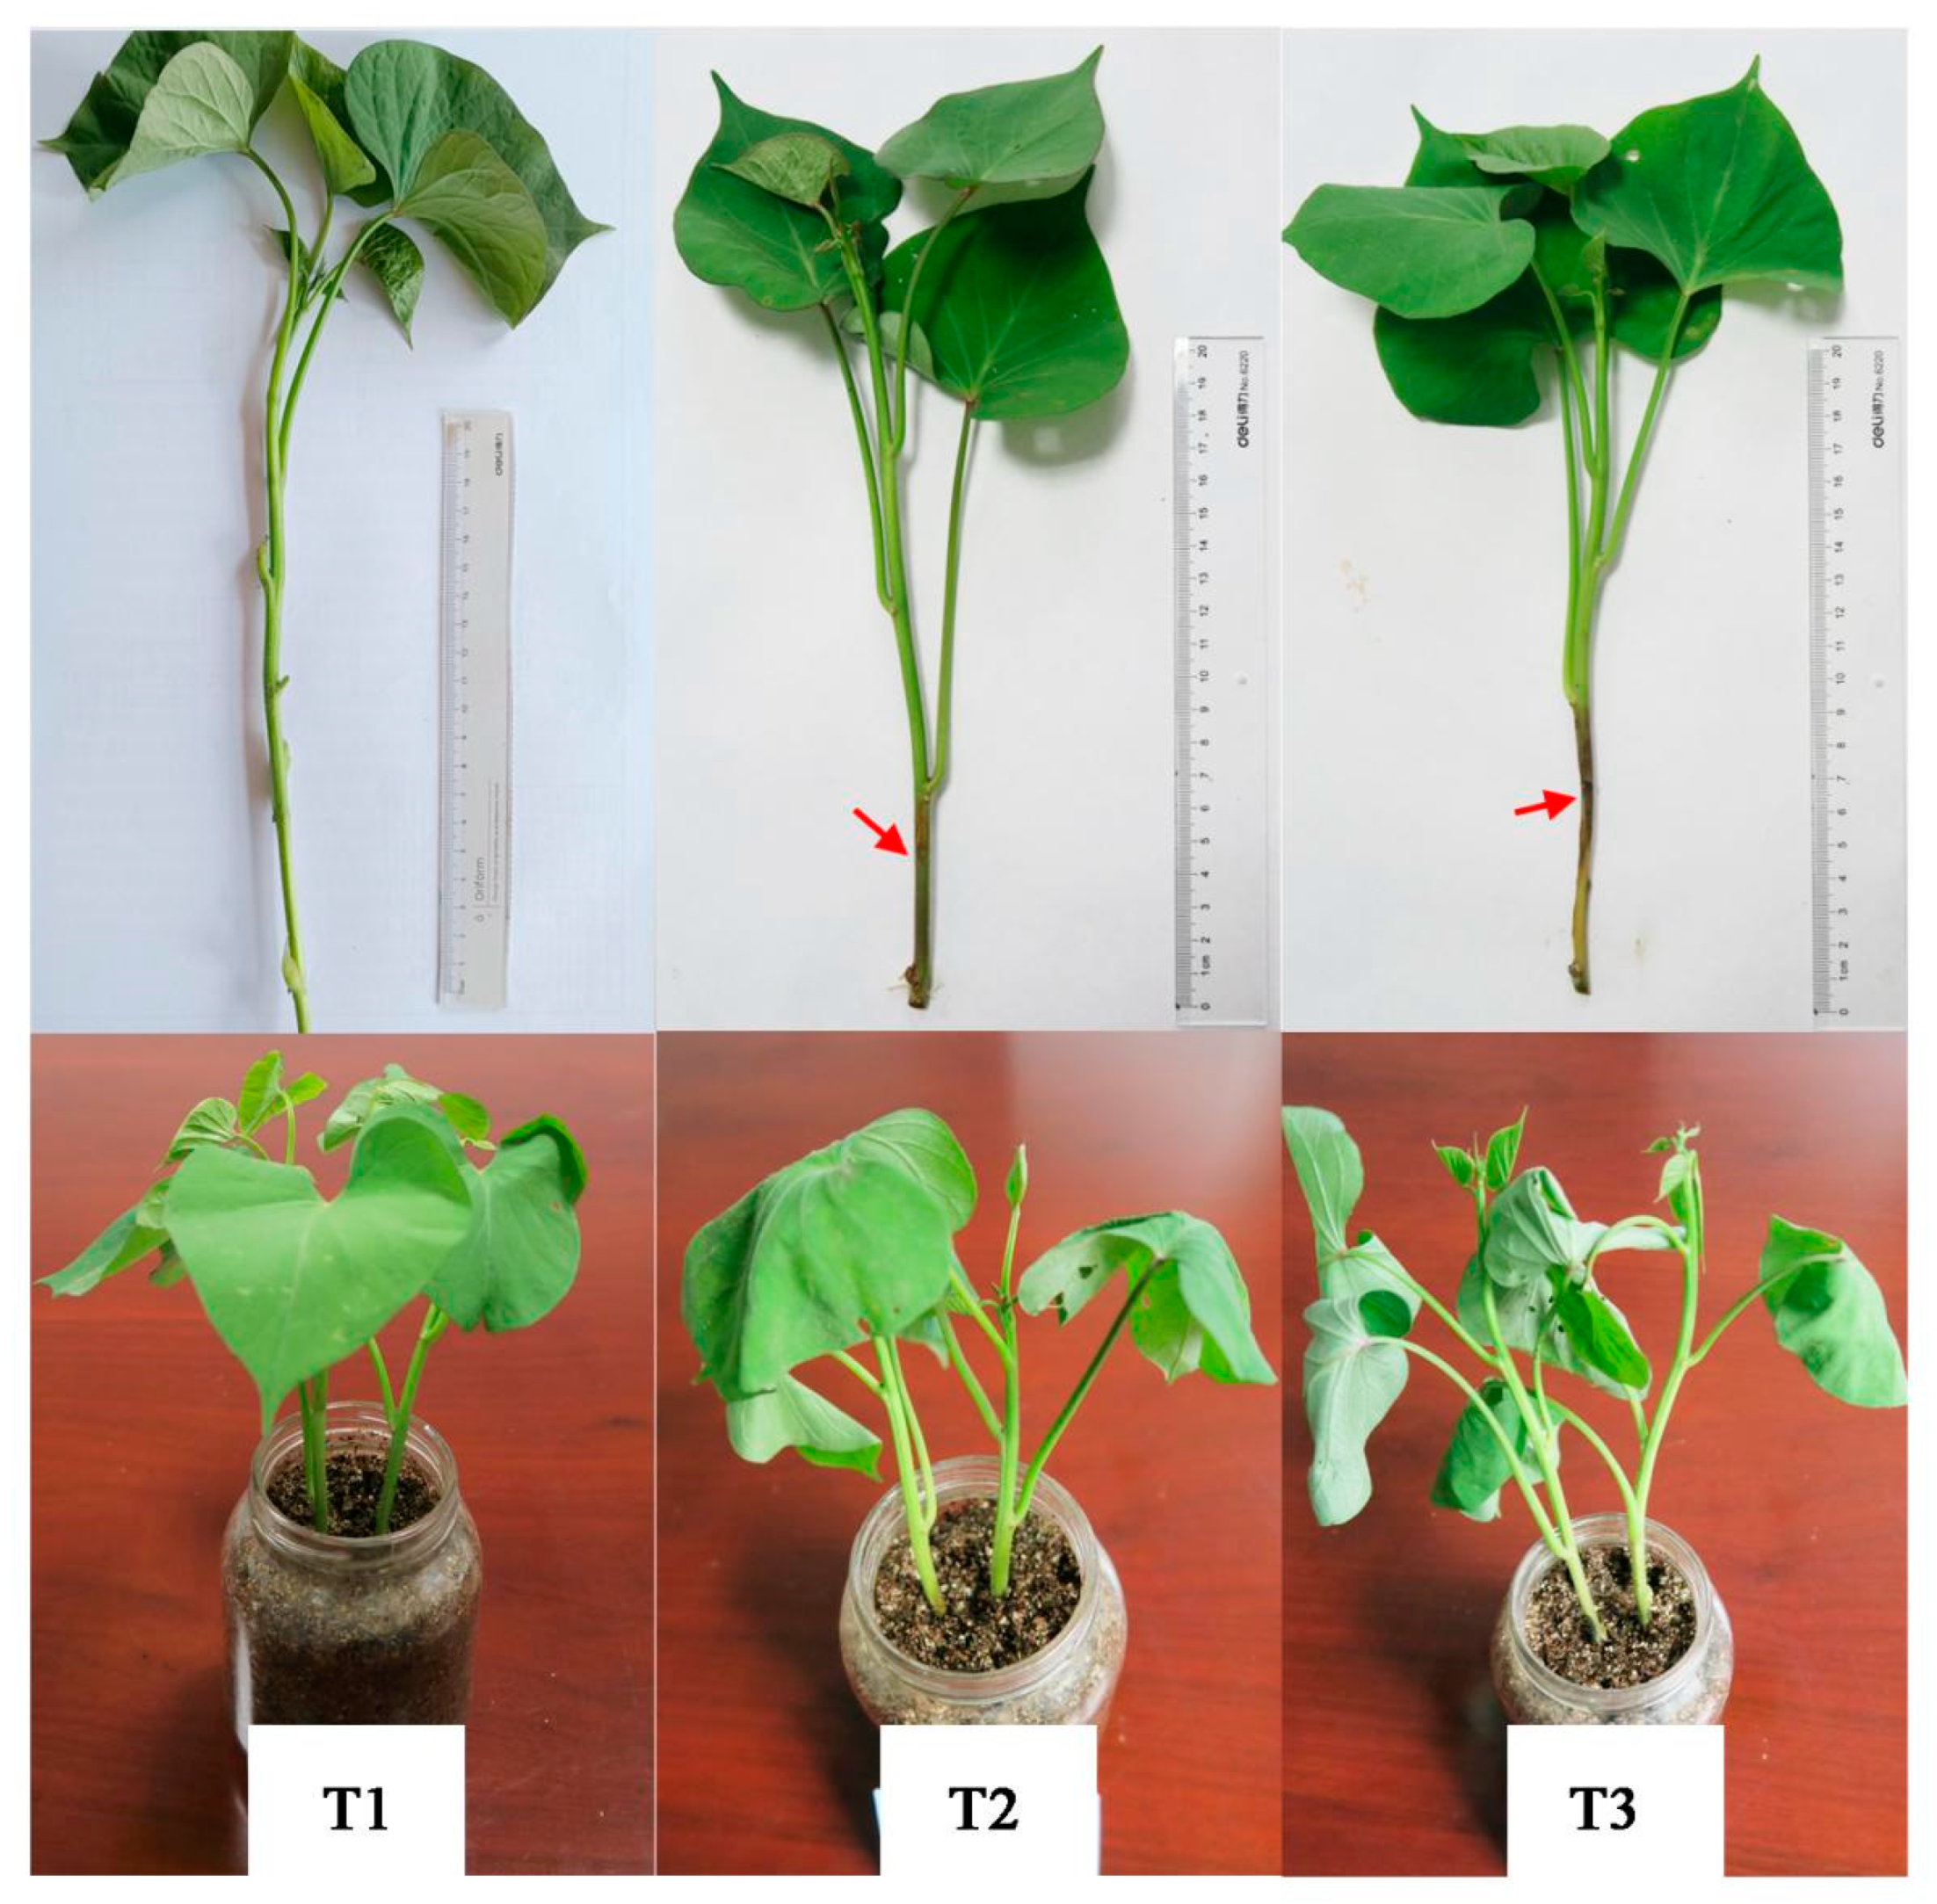
Figure 2.
Transcriptome sample relationship analysis and RT-qPCR verification. Principal component (A) and heat map analysis(B) analysis of stem rot pathogen infecting stem segments of Xushu 48 at different stages. (C) Correlation analysis of FPKM in transcriptome data and fold change of RT-qPCR.
Figure 2.
Transcriptome sample relationship analysis and RT-qPCR verification. Principal component (A) and heat map analysis(B) analysis of stem rot pathogen infecting stem segments of Xushu 48 at different stages. (C) Correlation analysis of FPKM in transcriptome data and fold change of RT-qPCR.
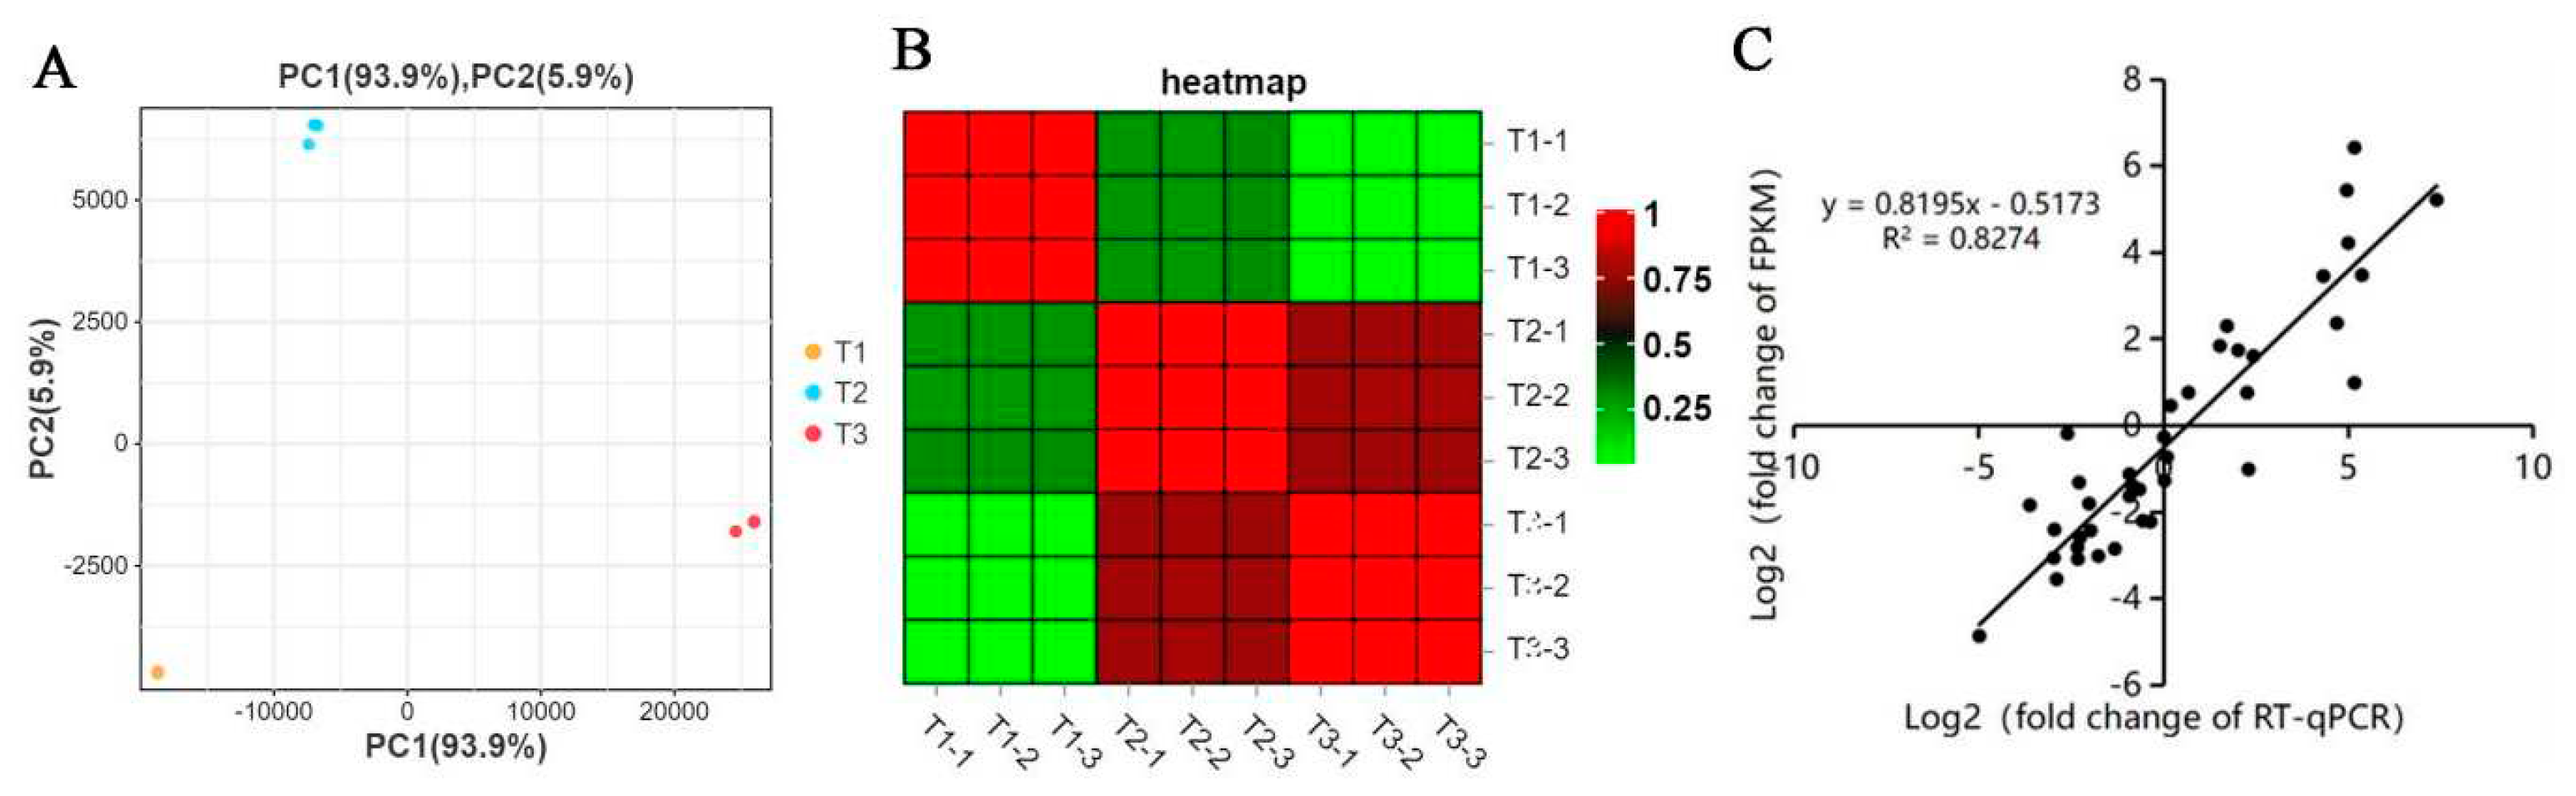
Figure 3.
Total number of DEGs in stem rot pathogen infecting stem segments of Xushu 48 at different stage. (A) Venn diagram of DEG. The number in each circle represents the number of DEG in the corresponding group. The overlap of the circle represents the common number of DEG between groups. (B) Multi-point difference scatter diagrams of different comparison groups.Red and green dots represent differentially expressed genes up-regulated and down-regulated, respectively.
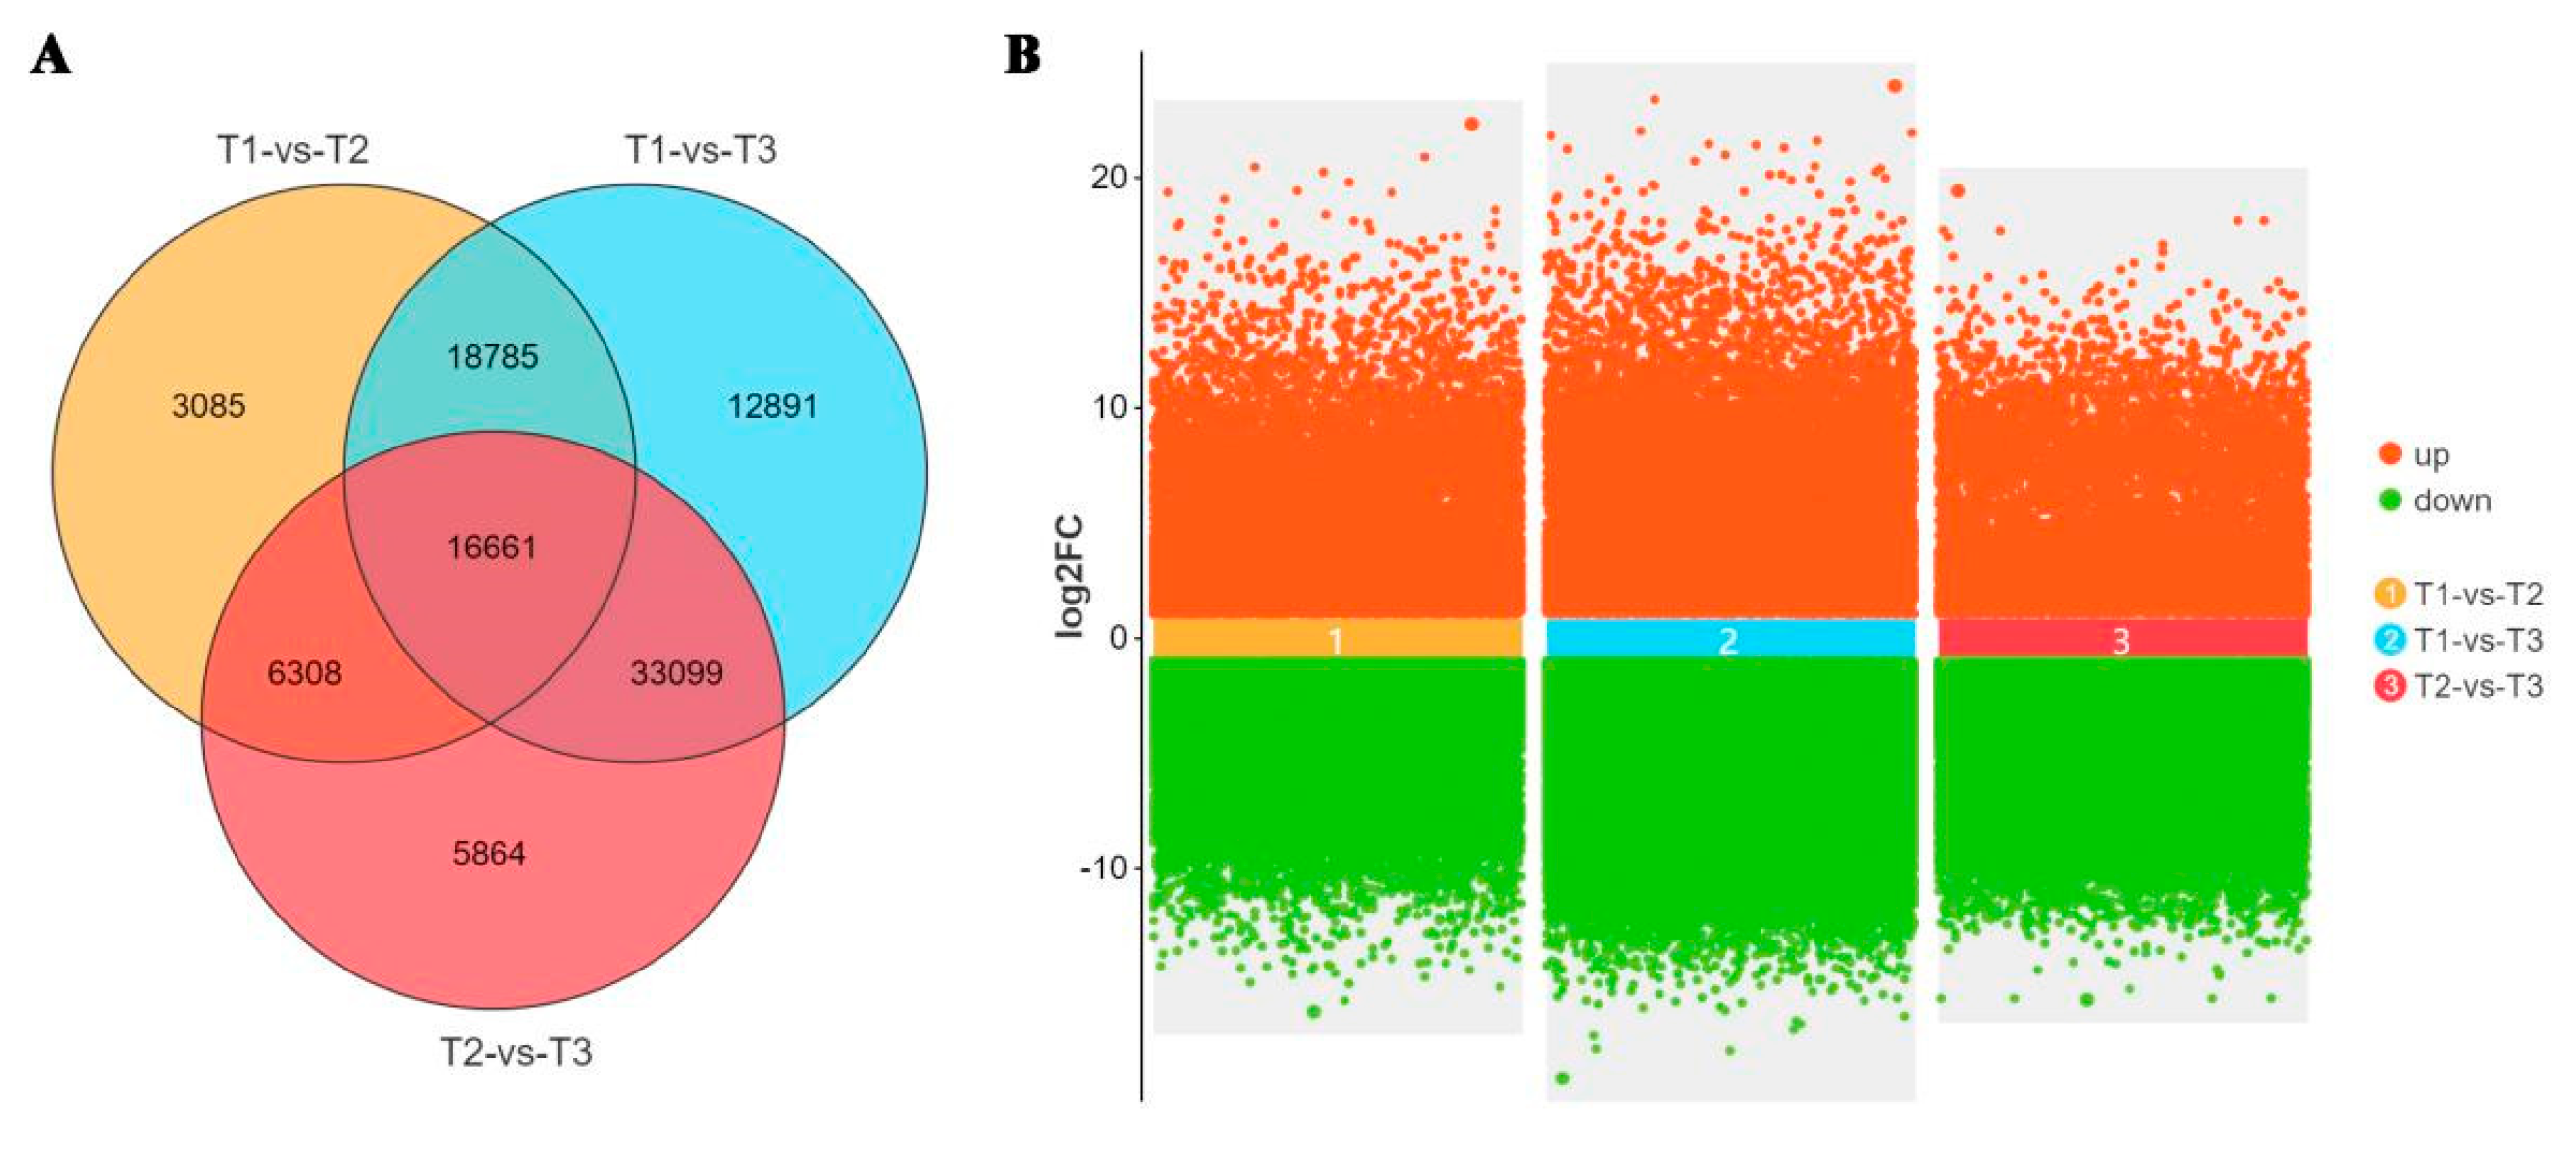
Figure 4.
GO annotation analysis of DEGs in stem rot pathogen infecting stem segments of Xushu 48 at different stage. The orange column indicates the number of DEGs up-regulated. The blue column indicates the number of DEGs down-regulated.
Figure 4.
GO annotation analysis of DEGs in stem rot pathogen infecting stem segments of Xushu 48 at different stage. The orange column indicates the number of DEGs up-regulated. The blue column indicates the number of DEGs down-regulated.
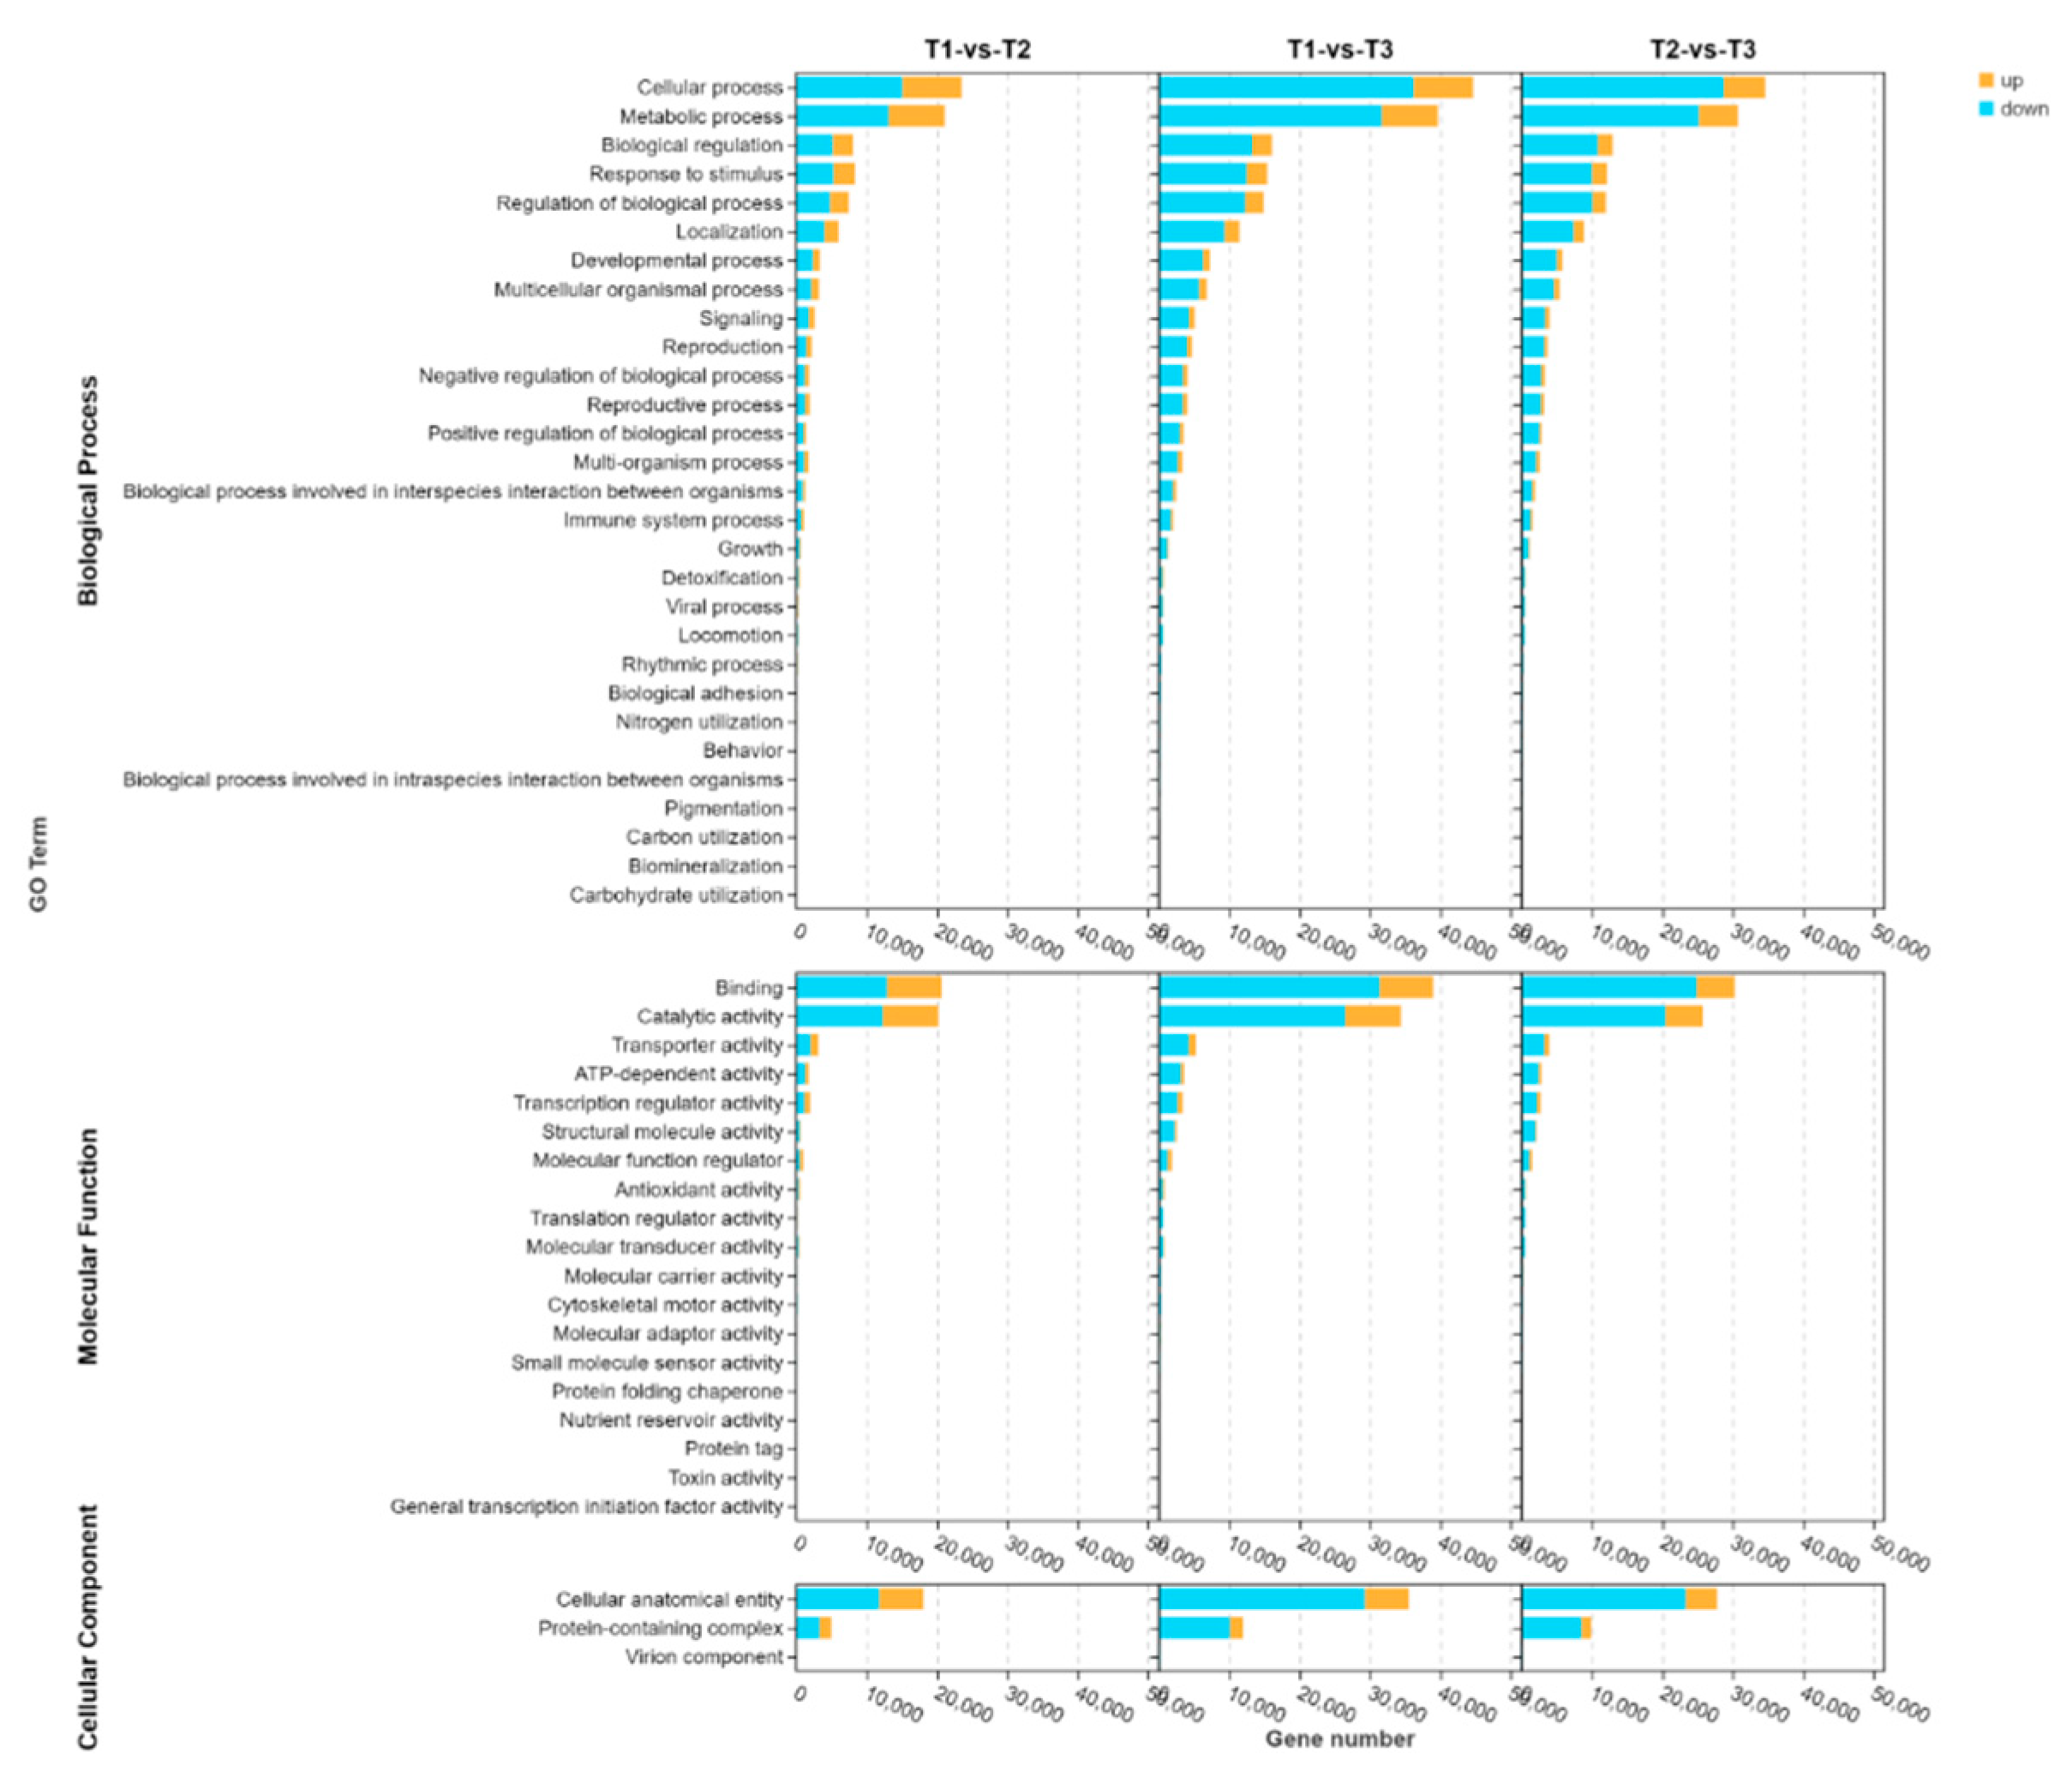
Figure 5.
Figure 5. Top 20 significantly enriched GO terms. (A) TOP 20 GO terms with significant enrichment of DEGs compared with T1 and T2. (B) TOP 20 GO terms with significant enrichment of DEGs compared with T1 and T3. (C) TOP 20 GO terms with significant enrichment of DEGs compared with T2 and T3.
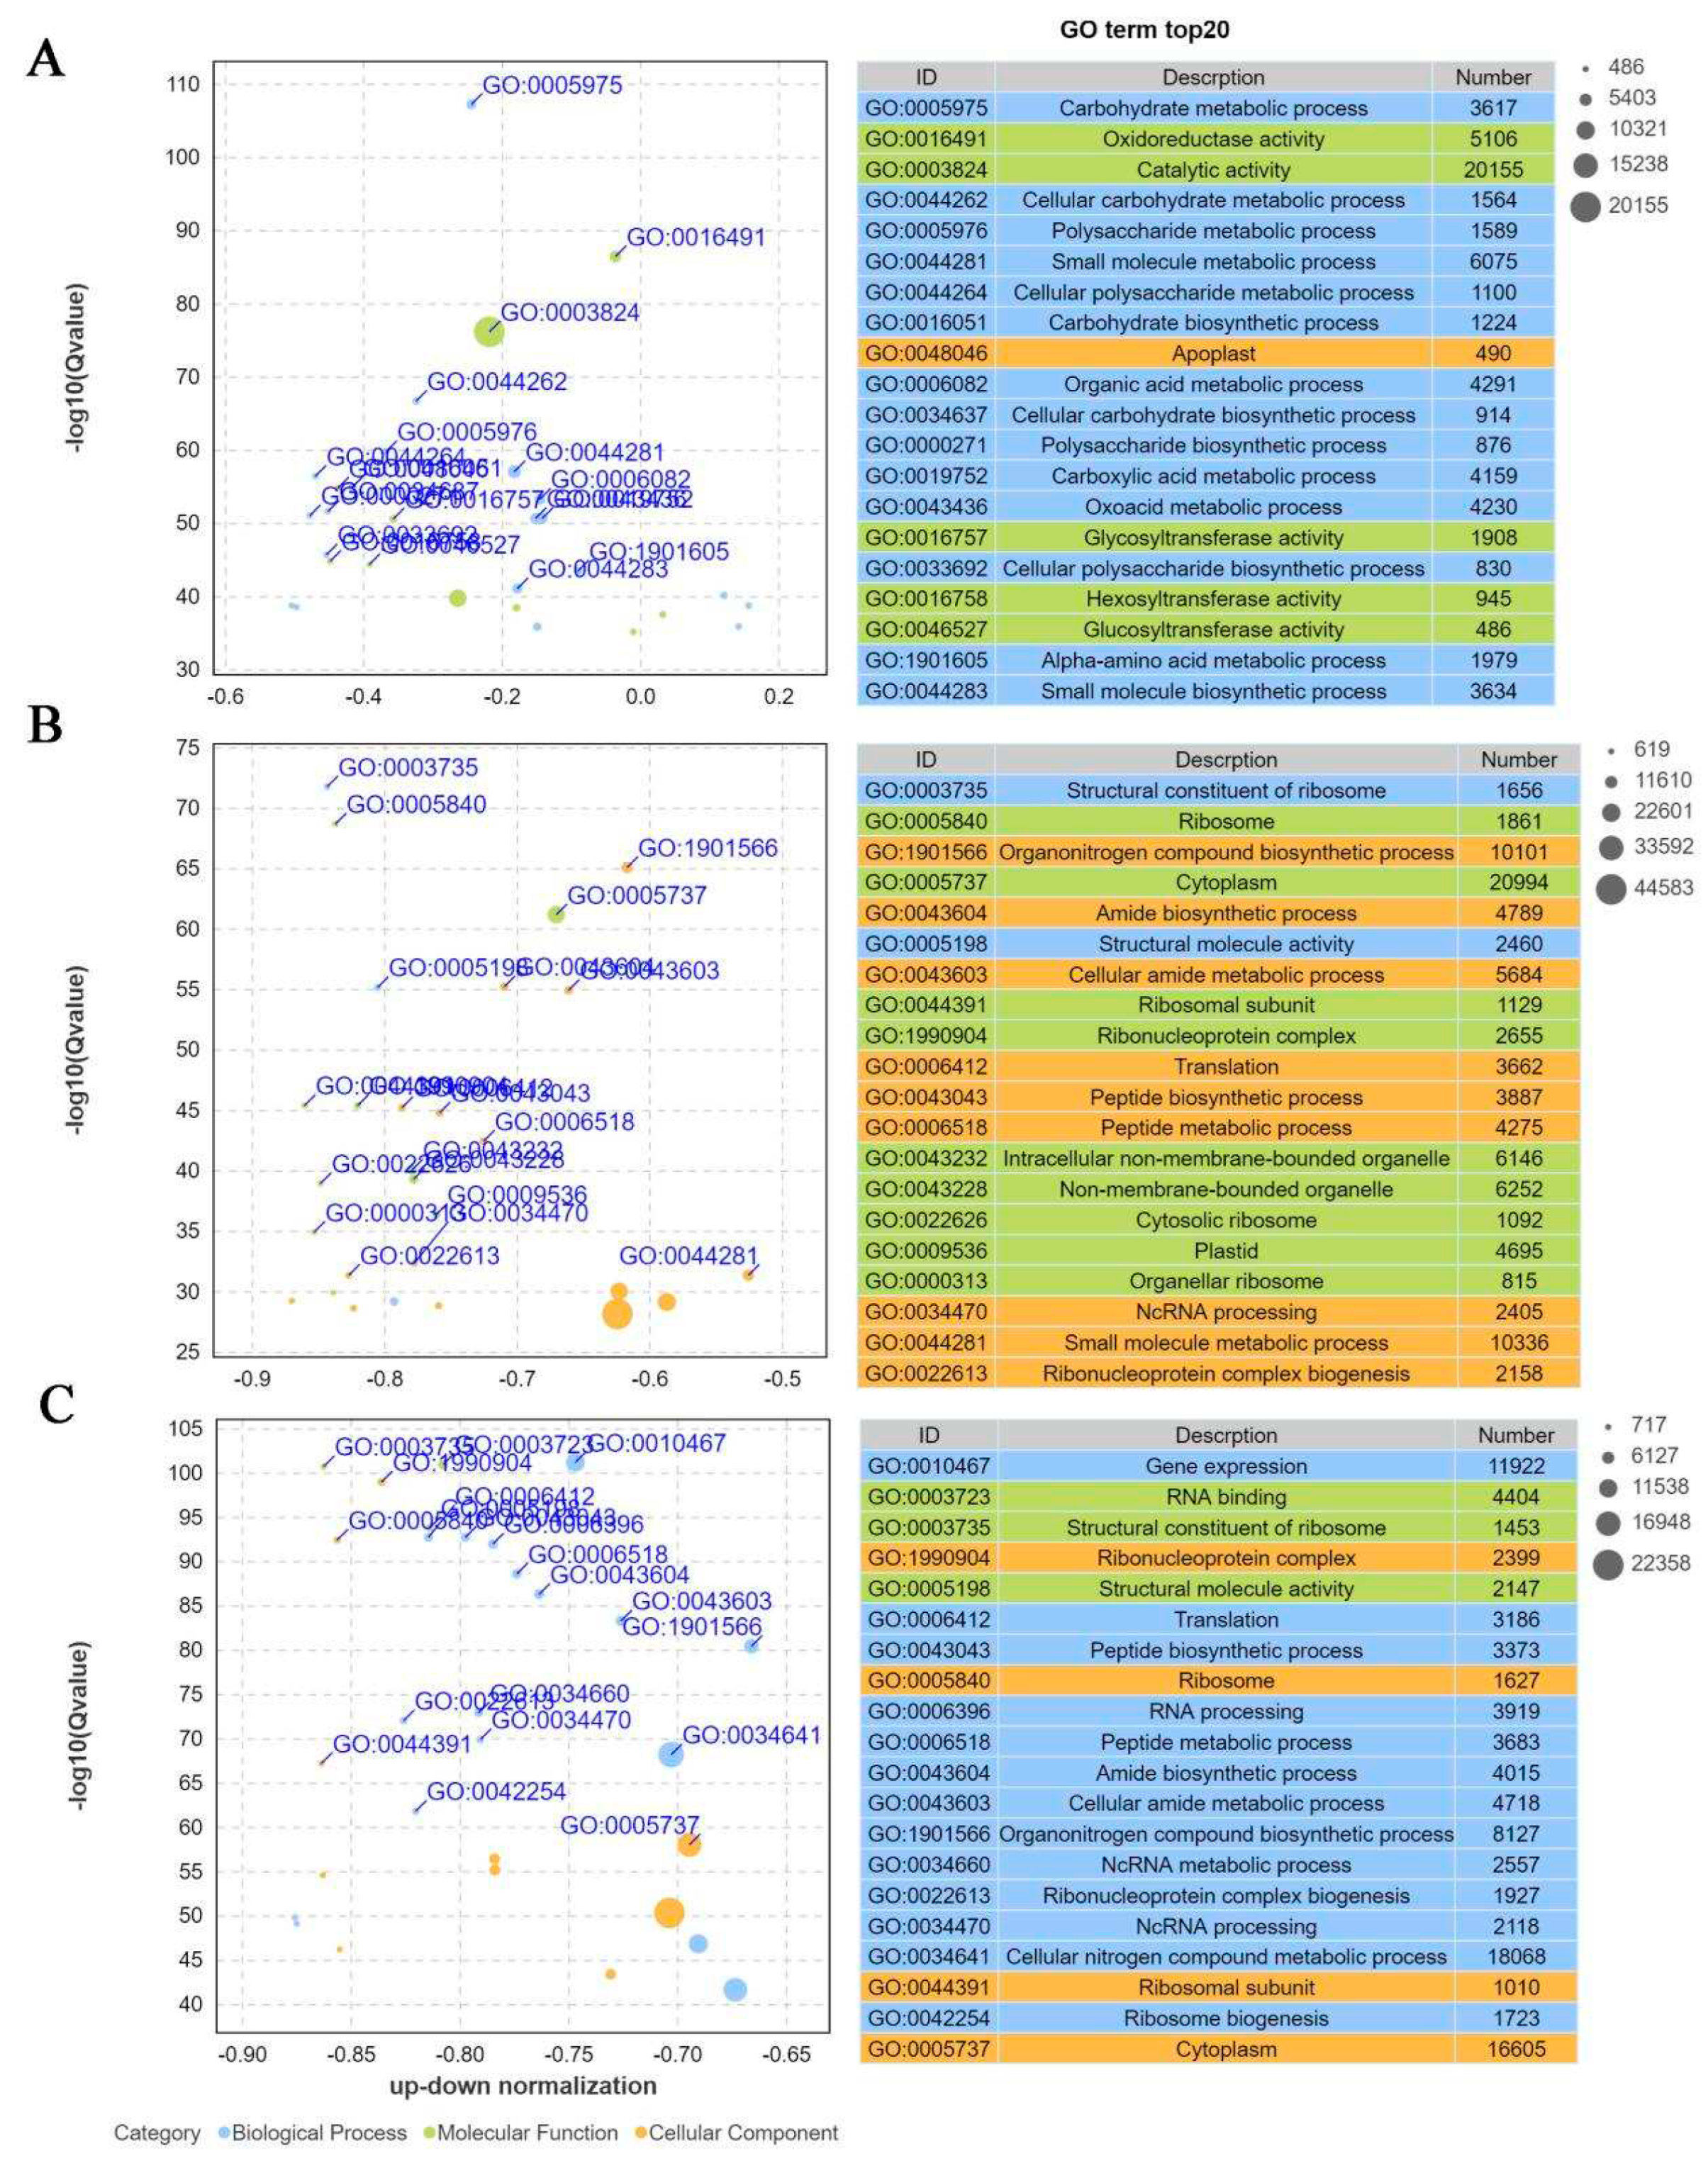
Figure 6.
KEGG pathway enrichment analysis of DEGs in stem rot pathogen infecting stem segments of Xushu 48 at different stage. (A) Quantitative statistics of DEGs enriched in different metabolic pathways. Orange, blue, red, green and yellow columns represent the number of DEGs enriched in metabolism, genetic information processing, environmental information processing, organismal systems and cellular processes, respectively. The height of the column indicates the number of DEGs. Correlation analysis of metabolic pathway by DEGs in T1 and T2 (B), T1 and T3 (C) and T2 and T3 (D) comparison groups, respectively.
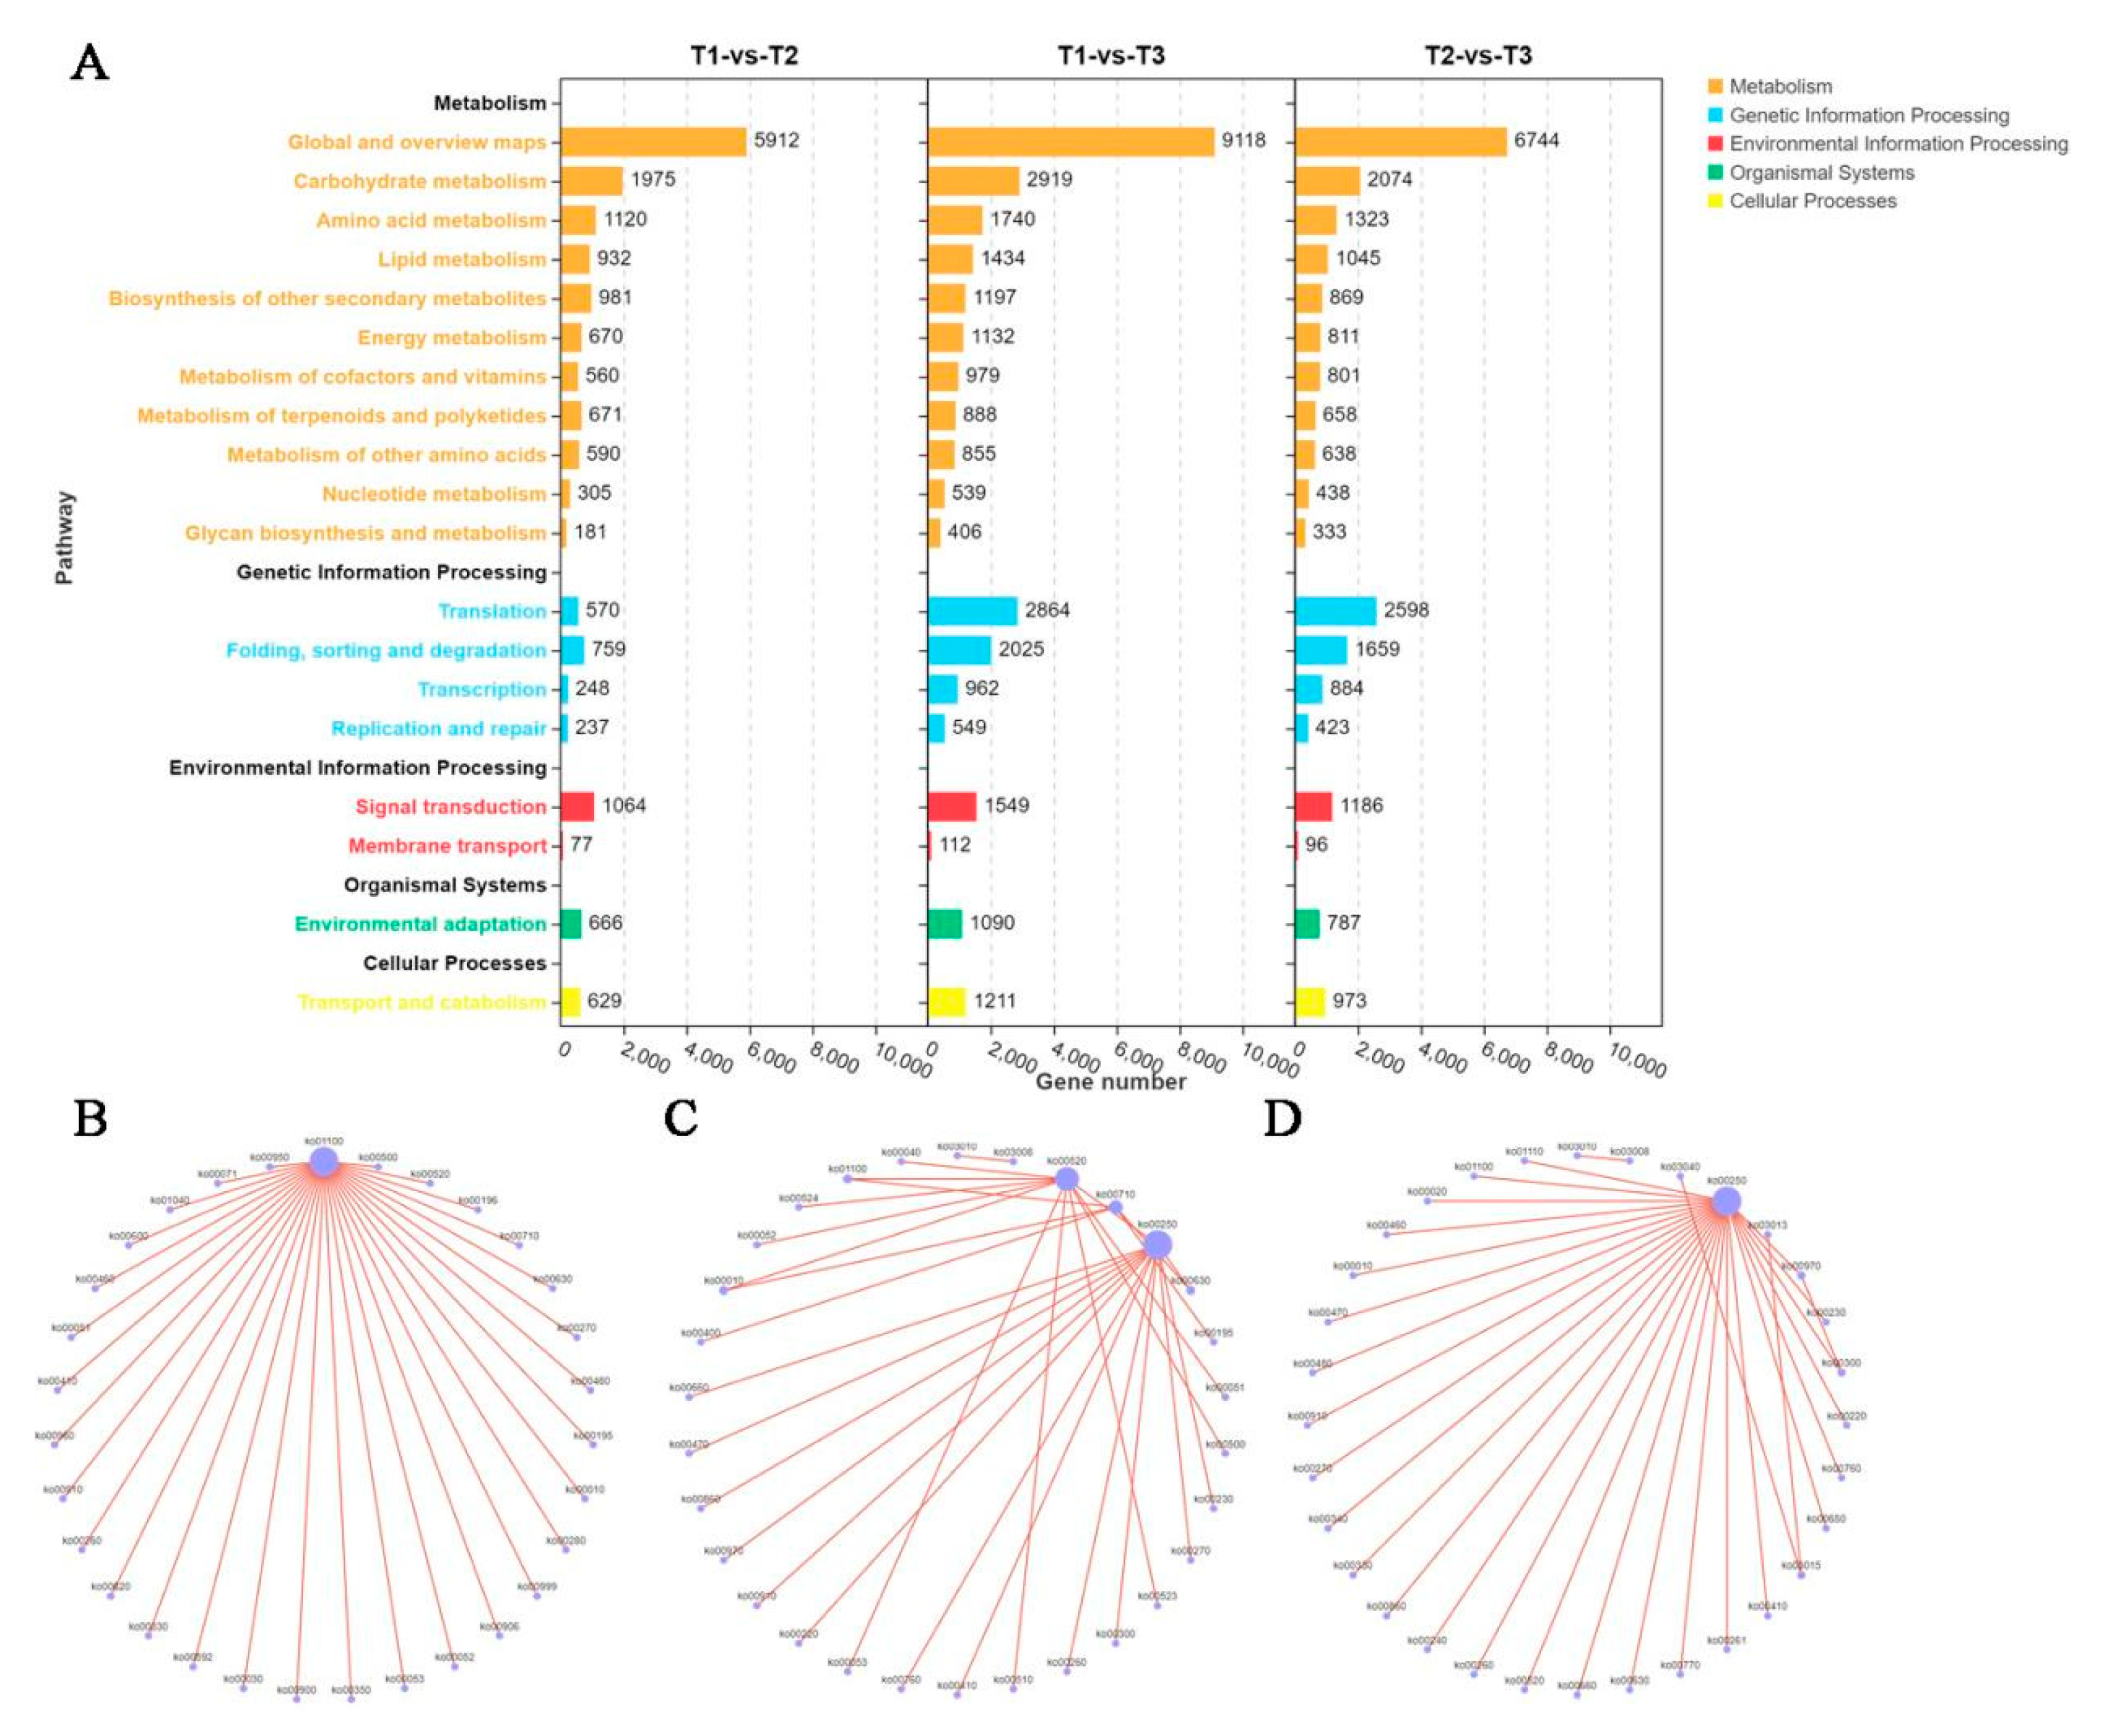
Figure 7.
Analysis of expression trend of DEGs in stem rot pathogen infecting stem segments of Xushu 48 at different stage. (A) the significance analysis of DEGs in each module. (B) the number of DEGs in each module.
Figure 7.
Analysis of expression trend of DEGs in stem rot pathogen infecting stem segments of Xushu 48 at different stage. (A) the significance analysis of DEGs in each module. (B) the number of DEGs in each module.
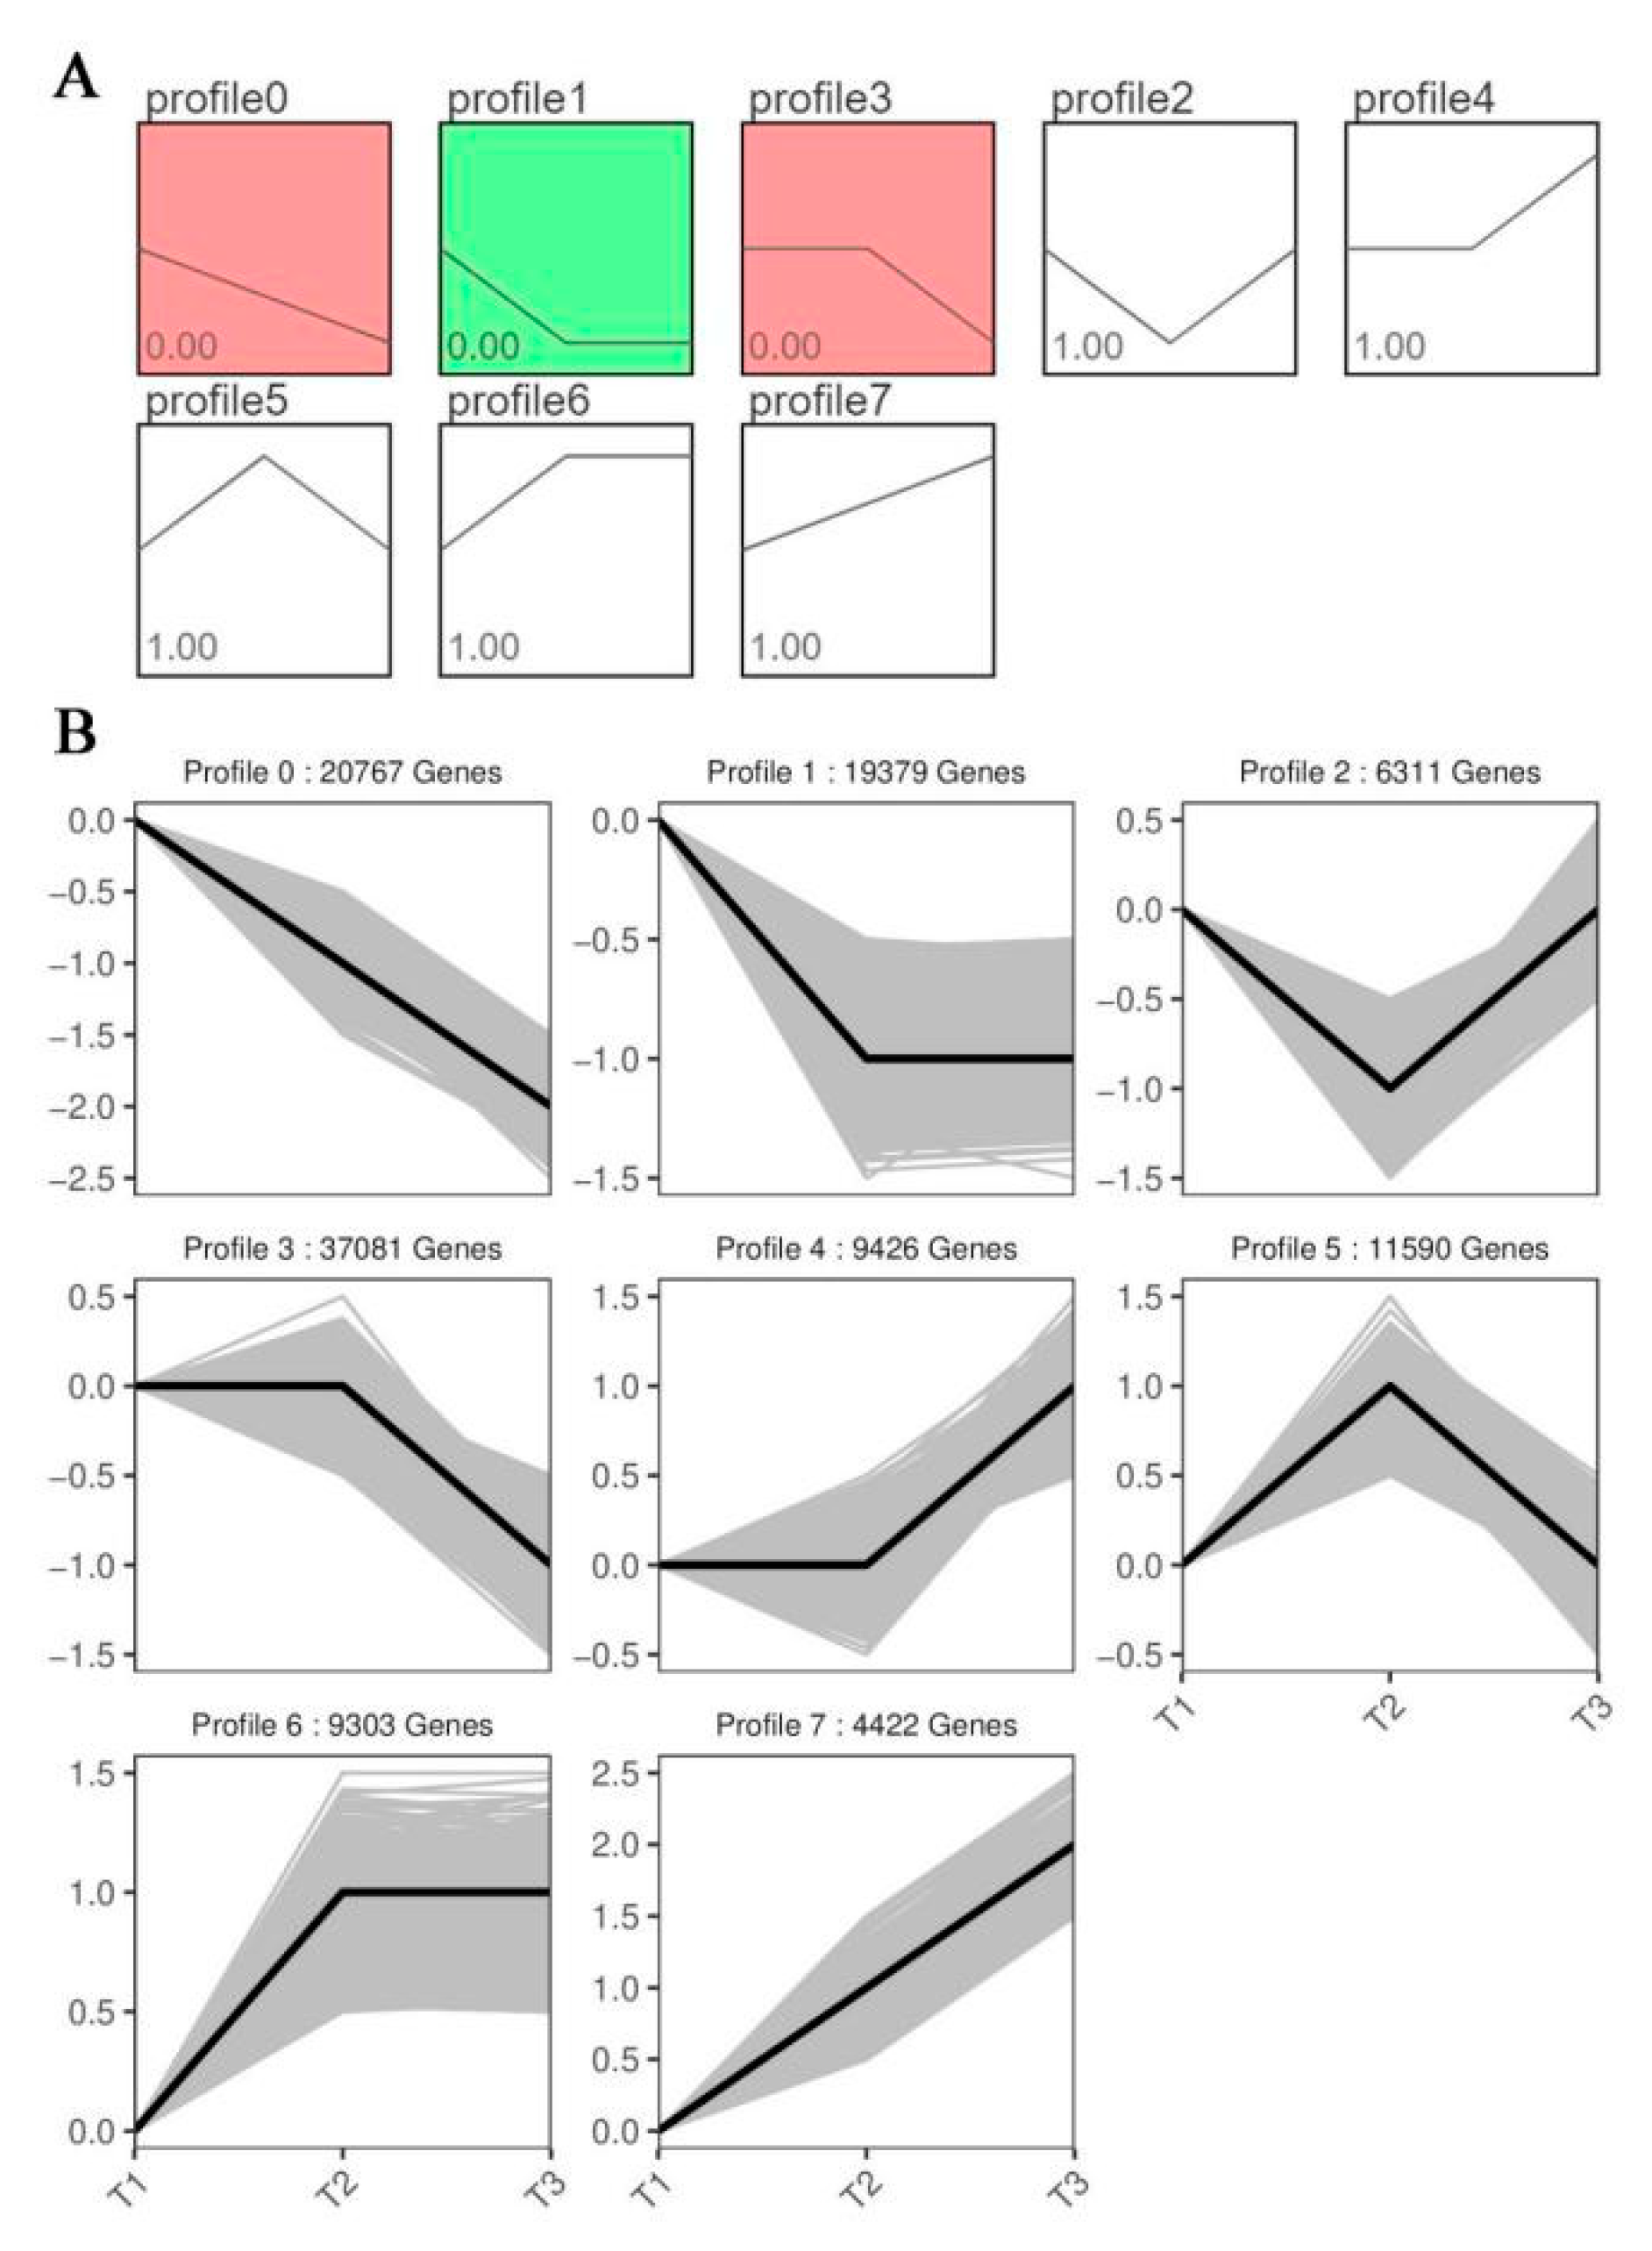
Figure 8.
Quantitative analysis of differentially expressed transcription factors. The number on each column indicates the number of corresponding transcription factor family members or transcripts.
Figure 8.
Quantitative analysis of differentially expressed transcription factors. The number on each column indicates the number of corresponding transcription factor family members or transcripts.
Disclaimer/Publisher’s Note: The statements, opinions and data contained in all publications are solely those of the individual author(s) and contributor(s) and not of MDPI and/or the editor(s). MDPI and/or the editor(s) disclaim responsibility for any injury to people or property resulting from any ideas, methods, instructions or products referred to in the content. |
© 2023 by the authors. Licensee MDPI, Basel, Switzerland. This article is an open access article distributed under the terms and conditions of the Creative Commons Attribution (CC BY) license (http://creativecommons.org/licenses/by/4.0/).
Copyright: This open access article is published under a Creative Commons CC BY 4.0 license, which permit the free download, distribution, and reuse, provided that the author and preprint are cited in any reuse.


