Preprint
Article

Physiological Effects of Weighted-Vest in Trail Running Athletes: A Pilot Study

Altmetrics

Downloads

132

Views

65

Comments

0

Submitted:

08 November 2023

Posted:

08 November 2023

You are already at the latest version

Alerts
Abstract
The need to carry different items, which become an extra load, is a characteristic of trail running. The aim of this study is to determine physiological-metabolic changes produced by running with extra load. Four male well-trained trail runners completed three treadmill maximal metabolic tests carrying different loads (0% (L0), 5% (L5), and 10% (L10) of their body mass) in a weighted vest. Gasses exchange was monitored to assess ventilatory thresholds 1 (VT1), and 2 (VT2), zone of maximal fat oxidation, and peak oxygen consumption (VO2peak). Heart rate (HR), power and velocity (V) were tracked for comparing their behavior. A repeated measures ANOVA showed significant differences in V (p<.001; ηp2= 0.910) as a limitation for reaching peak velocity (Vpeak) with L10 respect to L0 (p=0.001), and L5 (p=0.011). Power expression showed differences (p=0.068; ηp2= 0.592). It tended to be greater with L10 than L0 (p=0.057), despite achieving lower V. VT2 tended to occur at different %VO2peak (p=0.069; ηp2= 0.591). L5 VT2 was reached at higher %VO2peak than L0 (p=0.062), and L10 (p=0.071). ANOVA also showed a tendency to signification for V at this point (p= 0.098; ηp2= 0.538). In conclusion, L10 seems to limit Vpeak while L5 may delay VT2 expression.
Keywords: 
Subject: Biology and Life Sciences  -   Anatomy and Physiology

1. Introduction

Trail running (TR) races are characterized by courses that mostly cover natural ground (at most 25% road), and do not require orienteering skills for the runners. This combination of unique characteristics has contributed to a remarkable growth in both the volume of participants and the professionalization of TR as a sport [1,2]. Furthermore, TR includes a wide variety of modalities. These go from shorter races such as vertical kilometer (1000m of elevation gain without exceeding 5km length) to mountain ultra-marathons (longer than marathon) [3].
Metabolic requirements and performance factors for TR have been proven different from road running [4,5,6,7]. One of the main reasons for these differences is the different slopes that are part of the courses, and that produce biomechanical, neuromuscular and metabolic changes within running [8]. Although irregular terrain generates irregular running patterns [9], during uphill running (UR) athletes tend to take smaller steps with greater ground contact time and usually stepping with the forefoot [8]. On the other hand, athletes tend to take greater steps with smaller ground contact times while stepping with the rear foot while downhill running (DR) [8]. The need to create movement during UR versus the need to brake during DR also results in neuromuscular differences [10]. While UR relies more on concentric muscle actions, DR requires repeated eccentric muscle actions [10]. The nature of these muscle contractions also leads to greater muscle damage as well as lower energy expenditure during DR [8,11,12,13,14].
TR athlete’s performance relies on different factors. Aerobic capacity, expressed as high VO2max, and well-optimized lactate thresholds, has been described as an important characteristic [6,15,16]. Low body fat mass has also been shown relevant to TR performance [17].
As an endurance sport, TR metabolic demands usually require nutritional as well as water intake, especially during longer races [18]. In fact, many participants choose to self-carry provisioning, which becomes an additional load. This extra load can be considered another particular characteristic of TR, and the effect it can have on athletes needs to be understood. This overload characteristic presents a disadvantage for athletes and coaches in shaping training strategies.
Resisted running has been widely studied as a training method for developing speed, change of direction, and other neuromuscular actions. Sleds, parachutes, loaded running (LR) with vests and other devices have been used for this purpose [19,20,21,22]. When sprinting with a vest, higher loads seem to limit maximal speed and flight time while increasing contact time [23]. Similar results have been obtained for submaximal velocities with an extra load [24]. Shorter flight time and steps, and greater ground contact time were again characteristics associated with running with heavier loads [24].
In the other hand, there is limited evidence about metabolic changes induced by loaded walking or LR. Some studies have shown how an increase in slope when walking with extra load can lead to an increase in metabolic demands such as an increase in oxygen consumption (VO2), heart rate (HR), respiratory exchange ratio (RER), ventilation (V’E), energy expenditure (EE), and carbohydrates (CHO) or lipids oxidation [25,26]. The other way around, an increase in load at a fixed slope may also increase the metabolic demands of walking [27]. As for LR, the present research suggests greater CHO utilization when LR respect to running without an additional load [25,28]. In addition, blood lactate has also been found to reach higher values when LR [25], but there is no evidence about the behavior of other biochemical parameters such as pH or oxygen saturation (sO2). The changes in metabolic zones during training or competition under overload compared to normal conditions have not yet been described in the scientific literature. The determination of metabolic zones, such as ventilatory thresholds 1 and 2 (VT1 and VT2), maximal fat oxidation zone (FatMax), and/or maximal/peak oxygen consumption (VO2max/VO2peak) is decisive for configuring training loads and paces. Therefore, understanding the behavior of these zones is fundamental when working with overload conditions.
The aim of this study is to analyze physiological-metabolic changes produced by different loads in trail runners when performing a maximal incremental metabolic test. We hypothesized that extra load would trigger differences with respect to unloaded running.

2. Materials and Methods

2.1. Experimental design

The present study was designed as a cross-over pilot study and it was approved by the Ethics Committee from the Catholic University of Murcia (CE012104). The protocols used for the investigation were also in compliance with the World Medical Association’s Declaration of Helsinki (2013) [29]. Three different loads (0% (L0), 5% (L5), and 10% (L10) of body mass (Bm) in a weighted vest (WV)) were used by athletes during three maximal tests to analyze physiological differences.

2.2. Participants

Four male, well-trained trail runners (Table 1) took part of the present investigation. They all met the inclusion criteria established: (i) male 18 to 35 years old, (ii) no injuries that prevented training for more than a week during the previous 4 months, (iii) at least 4 training sessions per week, (iv) at least one year of experience in TR, (v) not taking any supplements 2 weeks prior to the study, and (vi) not having any pathology. All participants were informed about the study procedures and signed informed consent.

2.3. Procedures

Participants visited five times the laboratory at least 6 days apart. First visit was scheduled as an introduction to the procedures and following visits were arranged for taking maximal incremental tests with a metabolic cart (Figure 1). In all visits, athletes were asked to follow an established diet and not to train during previous 24 hours.
Visit 1: The athletes obtained medical approval (resting electrocardiogram and medical exam). Anthropometry measurements following the International Society for the Advancement of Kinanthropometry (ISAK) restricted profile [30] were also taken during this first visit. Fat mass percentage was then calculated using Yuhasz equation (1974) [31].
Visits 2, 3, 4 and 5: First trial (visit 2) was carried out as familiarization with the maximal incremental test, and was done with a randomized load (L0, L5 or L10). Randomization was performed using software (Randomizer) to assign codes to the groups generated in this study [32]. Subsequent trials were then performed carrying each of the loads (L0, L5 and L10) in a randomized order. The average L5 was 3.12 kg and average L10 was up to 6.25 kg. All trials were held at the same time in the day, and during tests described as performed with extra 0% of BM participants wore the WV (330g) without added load. The day before visit 3, 4 and 5, athletes consumed a standardized diet, composed of 9.0 g/BM carbohydrate, 1.5 g/BM protein and 0.9 g/BM fat. Additionally, participants were instructed to consume a standardized breakfast 2 h before the rectangular test, which consisted of 1.3 g/BM carbohydrate, 0.43 g/BM protein and 0.57 g/BM fat.

2.4. Tests

2.4.1. Incremental test

Maximal incremental metabolic test was performed as a two-phase protocol on a treadmill (Technogym Excite Med. Cesena, Italy). This combined method was used to assess ventilatory thresholds 1 and 2 with a step phase, followed by a ramp phase to assess peak values [33,34,35]. Step phase started at 5 km/h and velocity (V) increased by steps of 1 km/h each 2 minutes. This first phase ended when RER reached a value of 1 for more than 30 seconds in the same step. At this point athletes were asked to indicate their effort perception on a modified Borg Scale (RPE) from 1 to 10 [36]. Participants then proceeded to rest for 5 minutes either standing or walking slowly. The objective of this resting period was to ensure the maximality of the second phase by reducing fatigue associated to the first one [37]. Second phase started at final first phase V, and increased 1.5 km/h each minute as a final ramp, ending at exhaustion. Athletes again indicated RPE at this point.
Gas exchange was monitored with a gas analyzer (Cortex metalyzer 3B. Leipzig, Germany). The data collection was averaged each 30 seconds to calculate all variables. VT1 was obtained using the ventilatory equivalent method described by Wasserman [38]. VT2 was assessed when RER reached a value of 1 for more than 30 seconds. FatMax was calculated as the percentage of VO2 where the maximum fat contribution occurs, using Frayn equation [39]. Running economy was assessed as the VO2 consumed per BM per and kilometer (mL/Kg/Km).
Other variables were also kept track of to analyze their behavior during FatMax, VT1, VT2 and peak values with each of the loads. HR was monitored with chest band (Polar H10. Kempele, Finland).

2.4.2. Power sensor

Stryd power sensor (Stryd 1. Boulder, Colorado, USA) was placed on top of each athlete’s shoe to assess power during all trials.

2.4.3. ABL-90 (blood gas analyzer)

Previous to each of the tests resting blood lactate, pH and sO2 were analyzed in a gasometer (ABL90 flex, radiometer. Copenhagen, Denmark). This same procedure was repeated at the end of each maximal incremental test. At this point blood lactate, pH and sO2 were analyzed to assess the maximality of each trial [36,40] (Figure 2).

2.5. Statistical analysis

Statistical analysis was performed using Jamovi 2.3.18 (Jamovi, Sydney, Australia) and all descriptive statistics were presented as mean ± standard deviation (SD). Levene’s and Shapiro–Wilk tests checked for homogeneity and normality of the data, respectively. Different variables at FatMax, VT1, VT2 and peak values were analyzed using repeated measures ANOVA. Post hoc analysis was carried out if significance was found in the ANOVA models. Trials performed with L0 were taken as a reference. Statistical significance was set for p ≤ 0.05 while p < 0.10 was considered a trend to statistical significance. Partial eta square (ηp2) thresholds were used as follow: <0.01 irrelevant; ≥0.01, small; ≥0.059, moderate; ≥0.138, large [41].

3. Results

3.1. Peak values

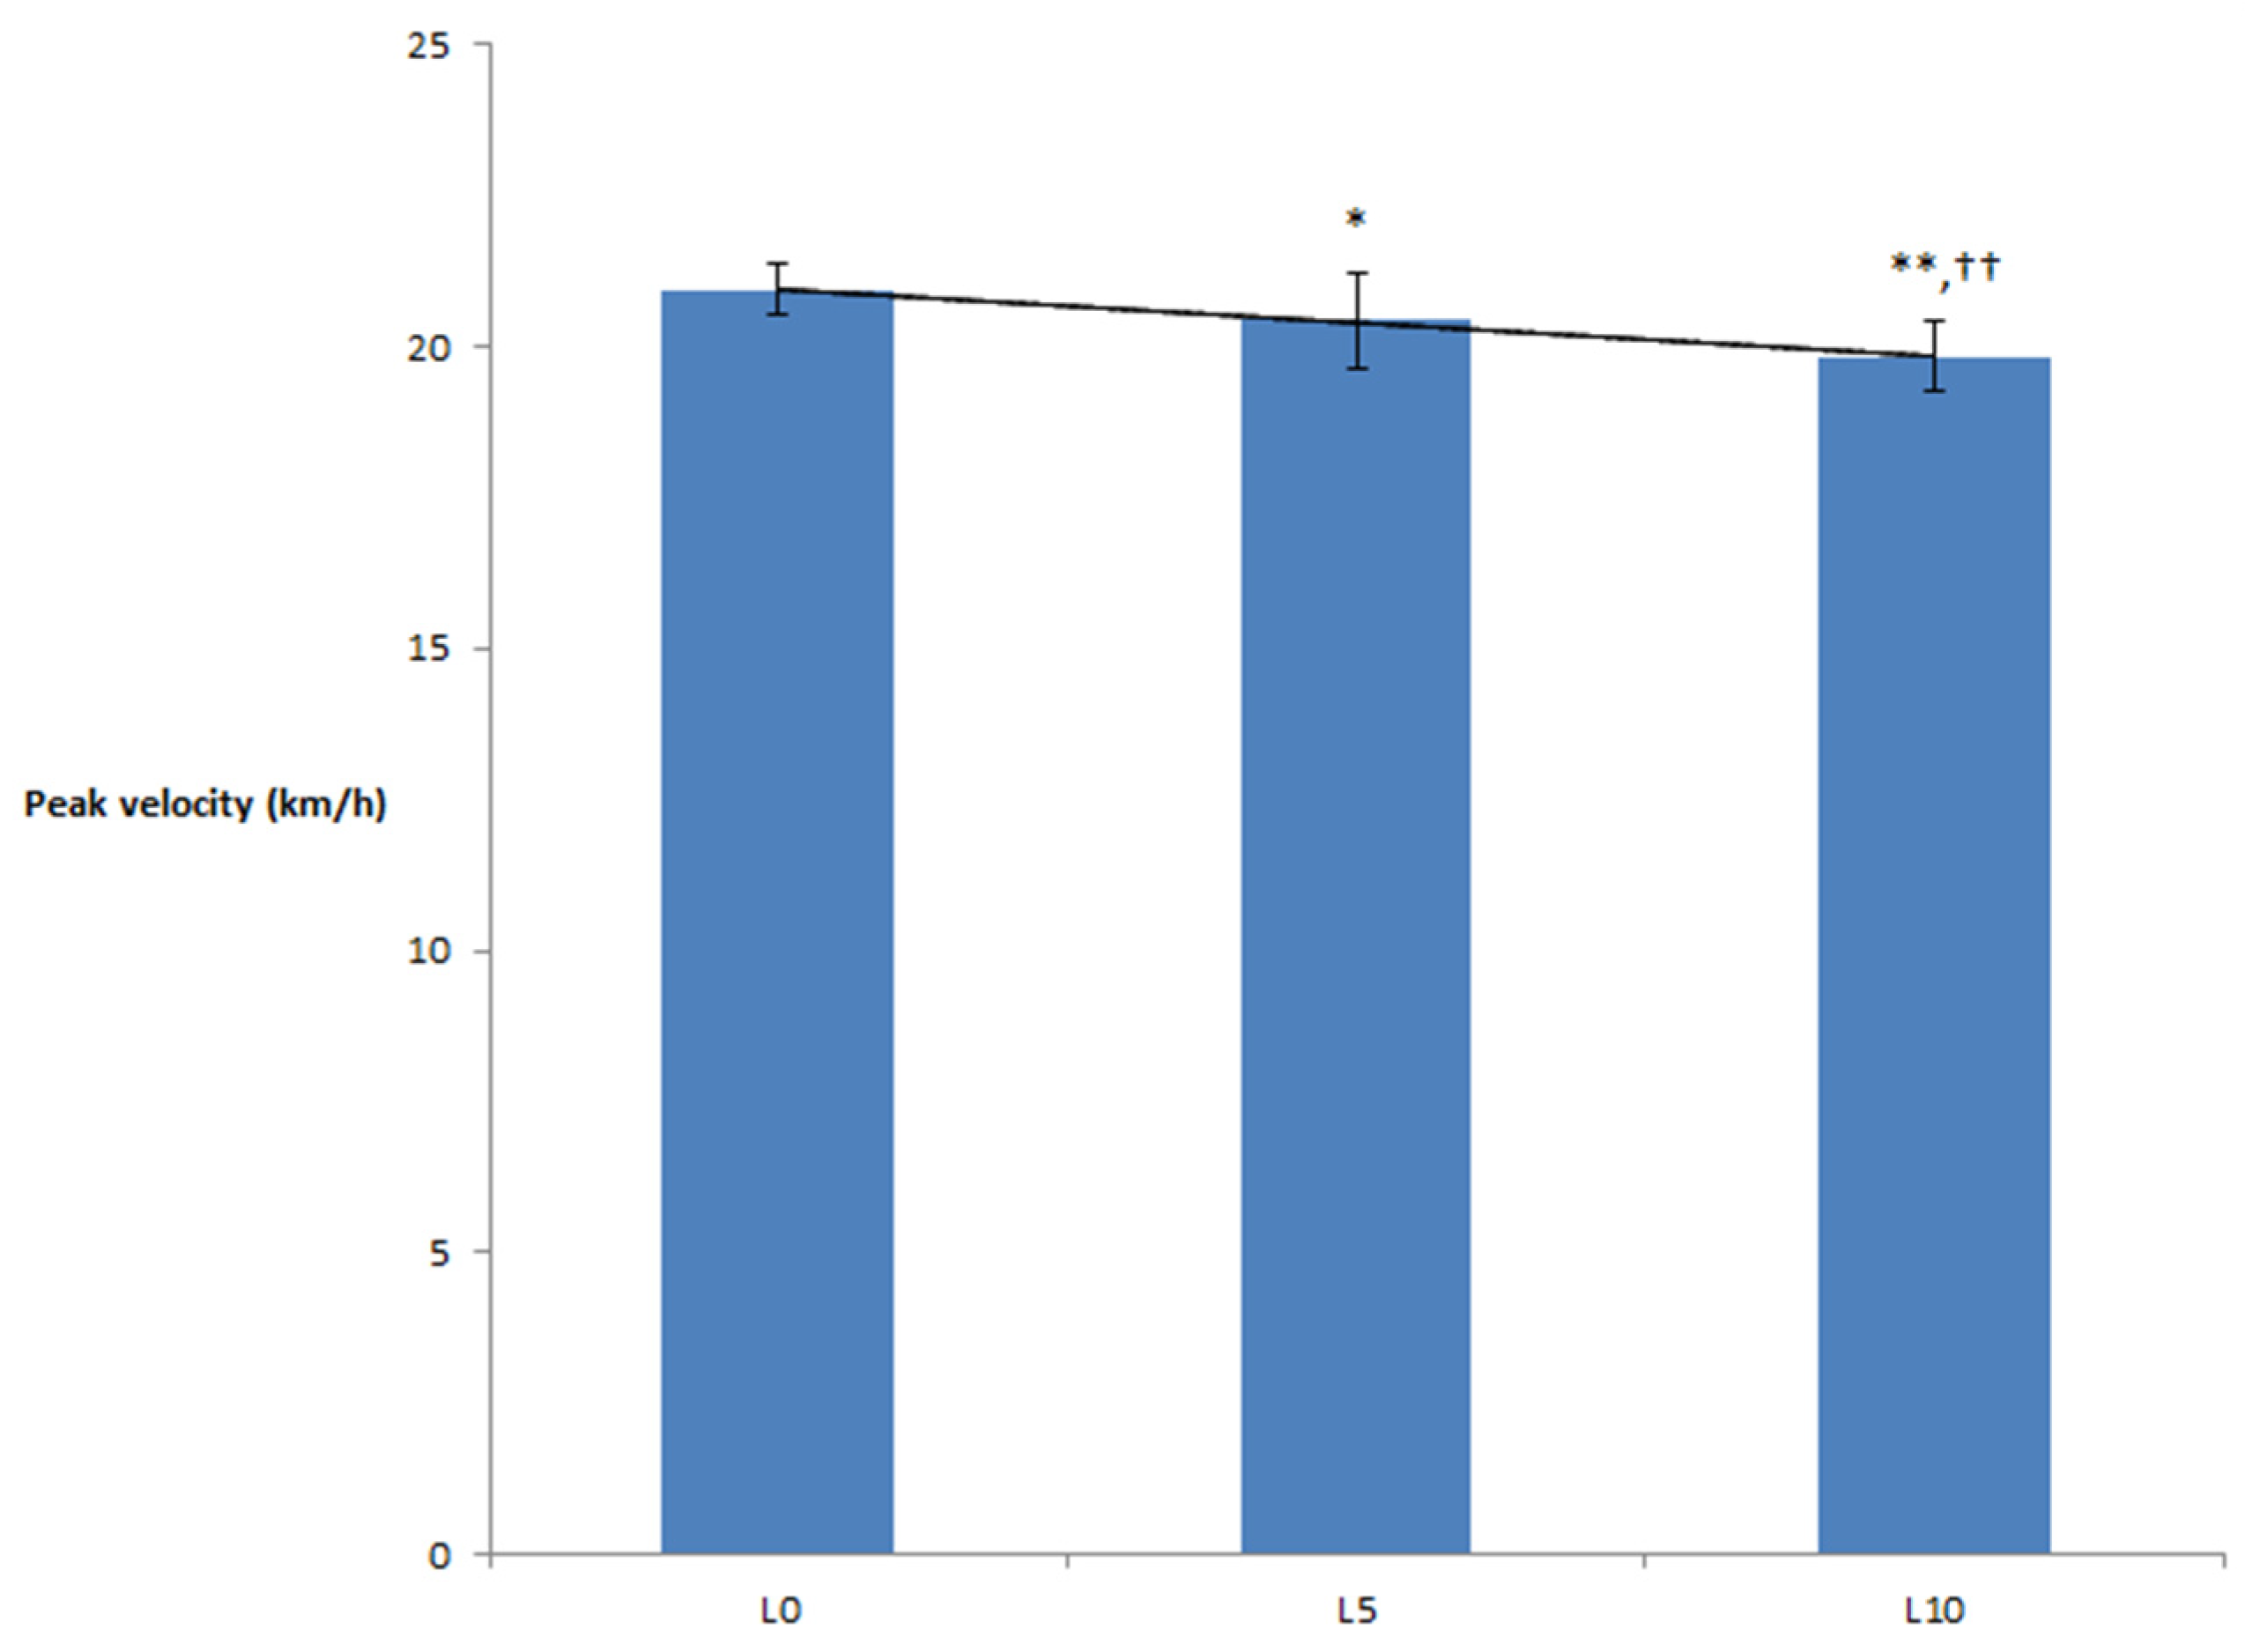
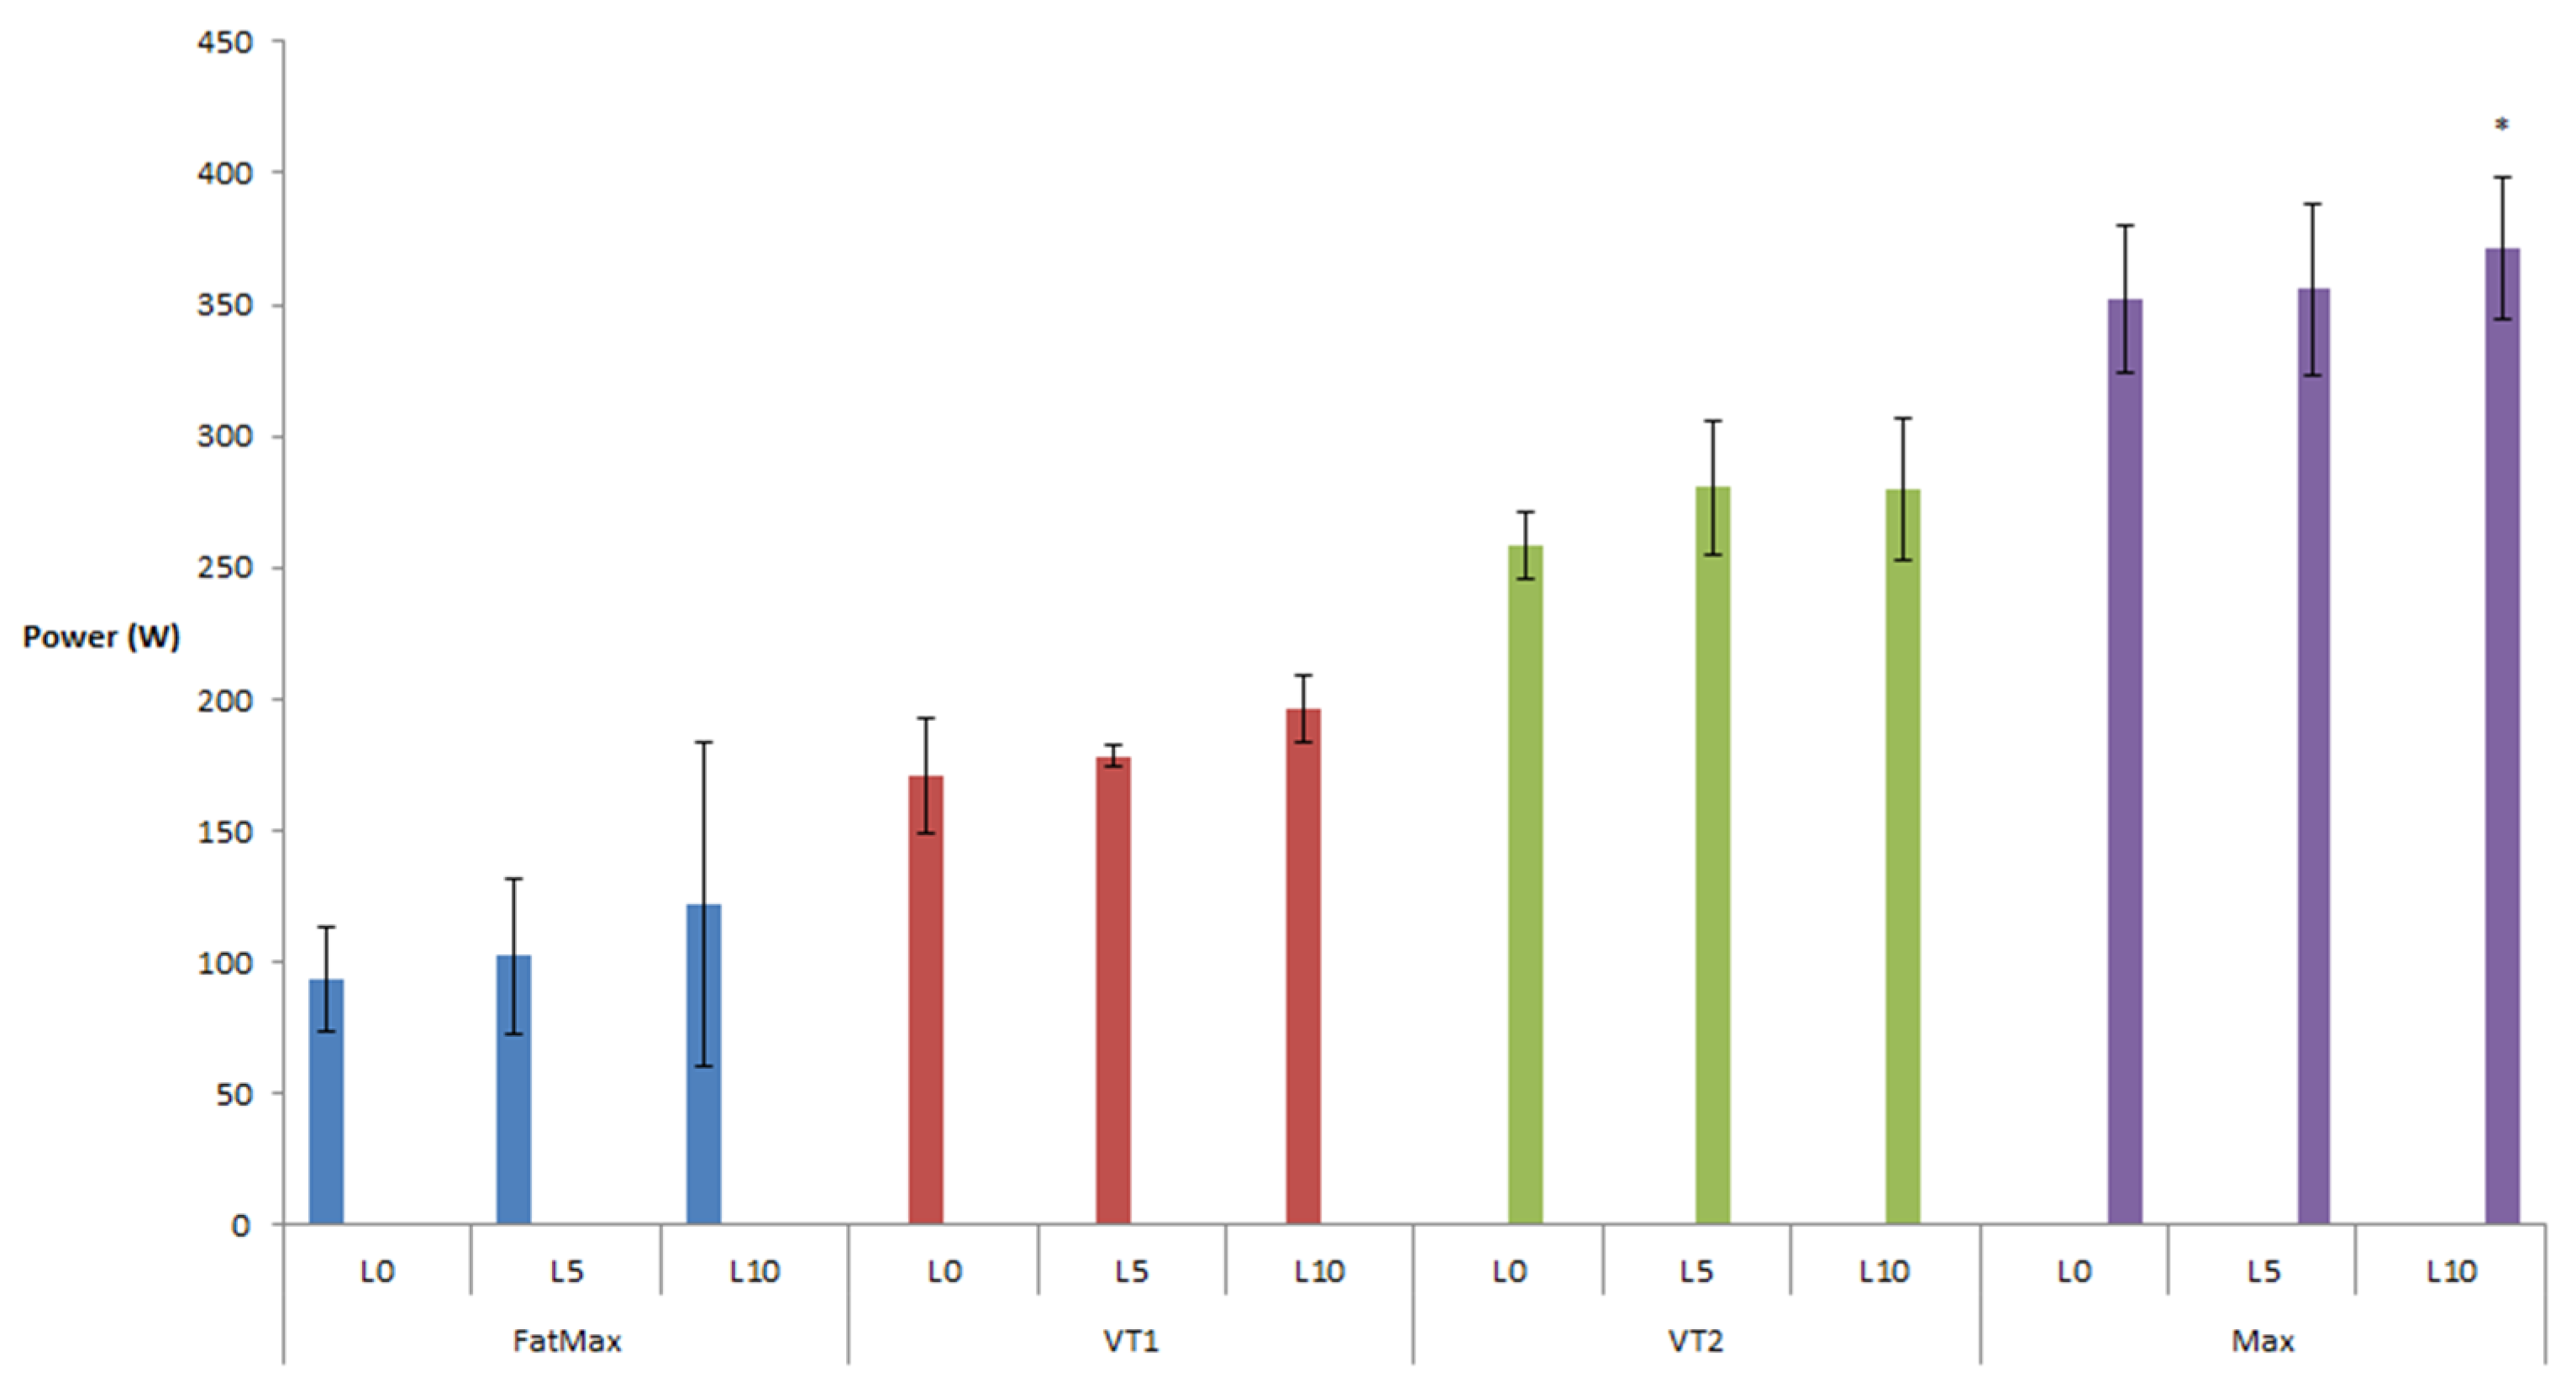
ANOVA did not find significant differences for relative VO2peak (p = 0.781) or absolute VO2peak (p = 0.694) when performing the tests with different loads. However, other parameters were different at this point. Trials duration showed significant differences (p = 0.022; ηp2 = 0.720). Post hoc revealed longer duration for L0 trials than L10 (p = 0.029), and also for L5 than L10 (p=0.040). Thus, peak velocity (Vpeak) also presented differences (p<.001; ηp2 = 0.910). Post hoc analysis showed differences between L0 and L10, (p = 0.001) and between L5 and L10 (p = 0.011) (Figure 3). Relative and absolute power may also be affected by load (p = 0.068; ηp2 = 0.592; and p = 0.047; ηp2 = 0.639 respectively) (Figure 4). Last, RERpeak (p = 0.008; ηp2 = 0.803) reached higher values during L0 respect L5 tests (p = 0.002) (Table 2).

3.2. VT1

ANOVA did not show significant differences for physiological parameters, but RER (p = 0.476; ηp2 = 0.219), HR (p = 0.381; ηp2 = 0.275) and %VO2peak (p = 0.256; ηp2 = 0.365) showed large effect sizes. Furthermore, loads showed a trend on both relative (p = 0.083; ηp2 = 0.563) and absolute (p = 0.092; ηp2 = 0.548) power expression. L10 trials showed a trend towards a greater power output than L5 for both absolute (p = 0.066) and relative (p = 0.062) (Table 3).

3.3. VT2

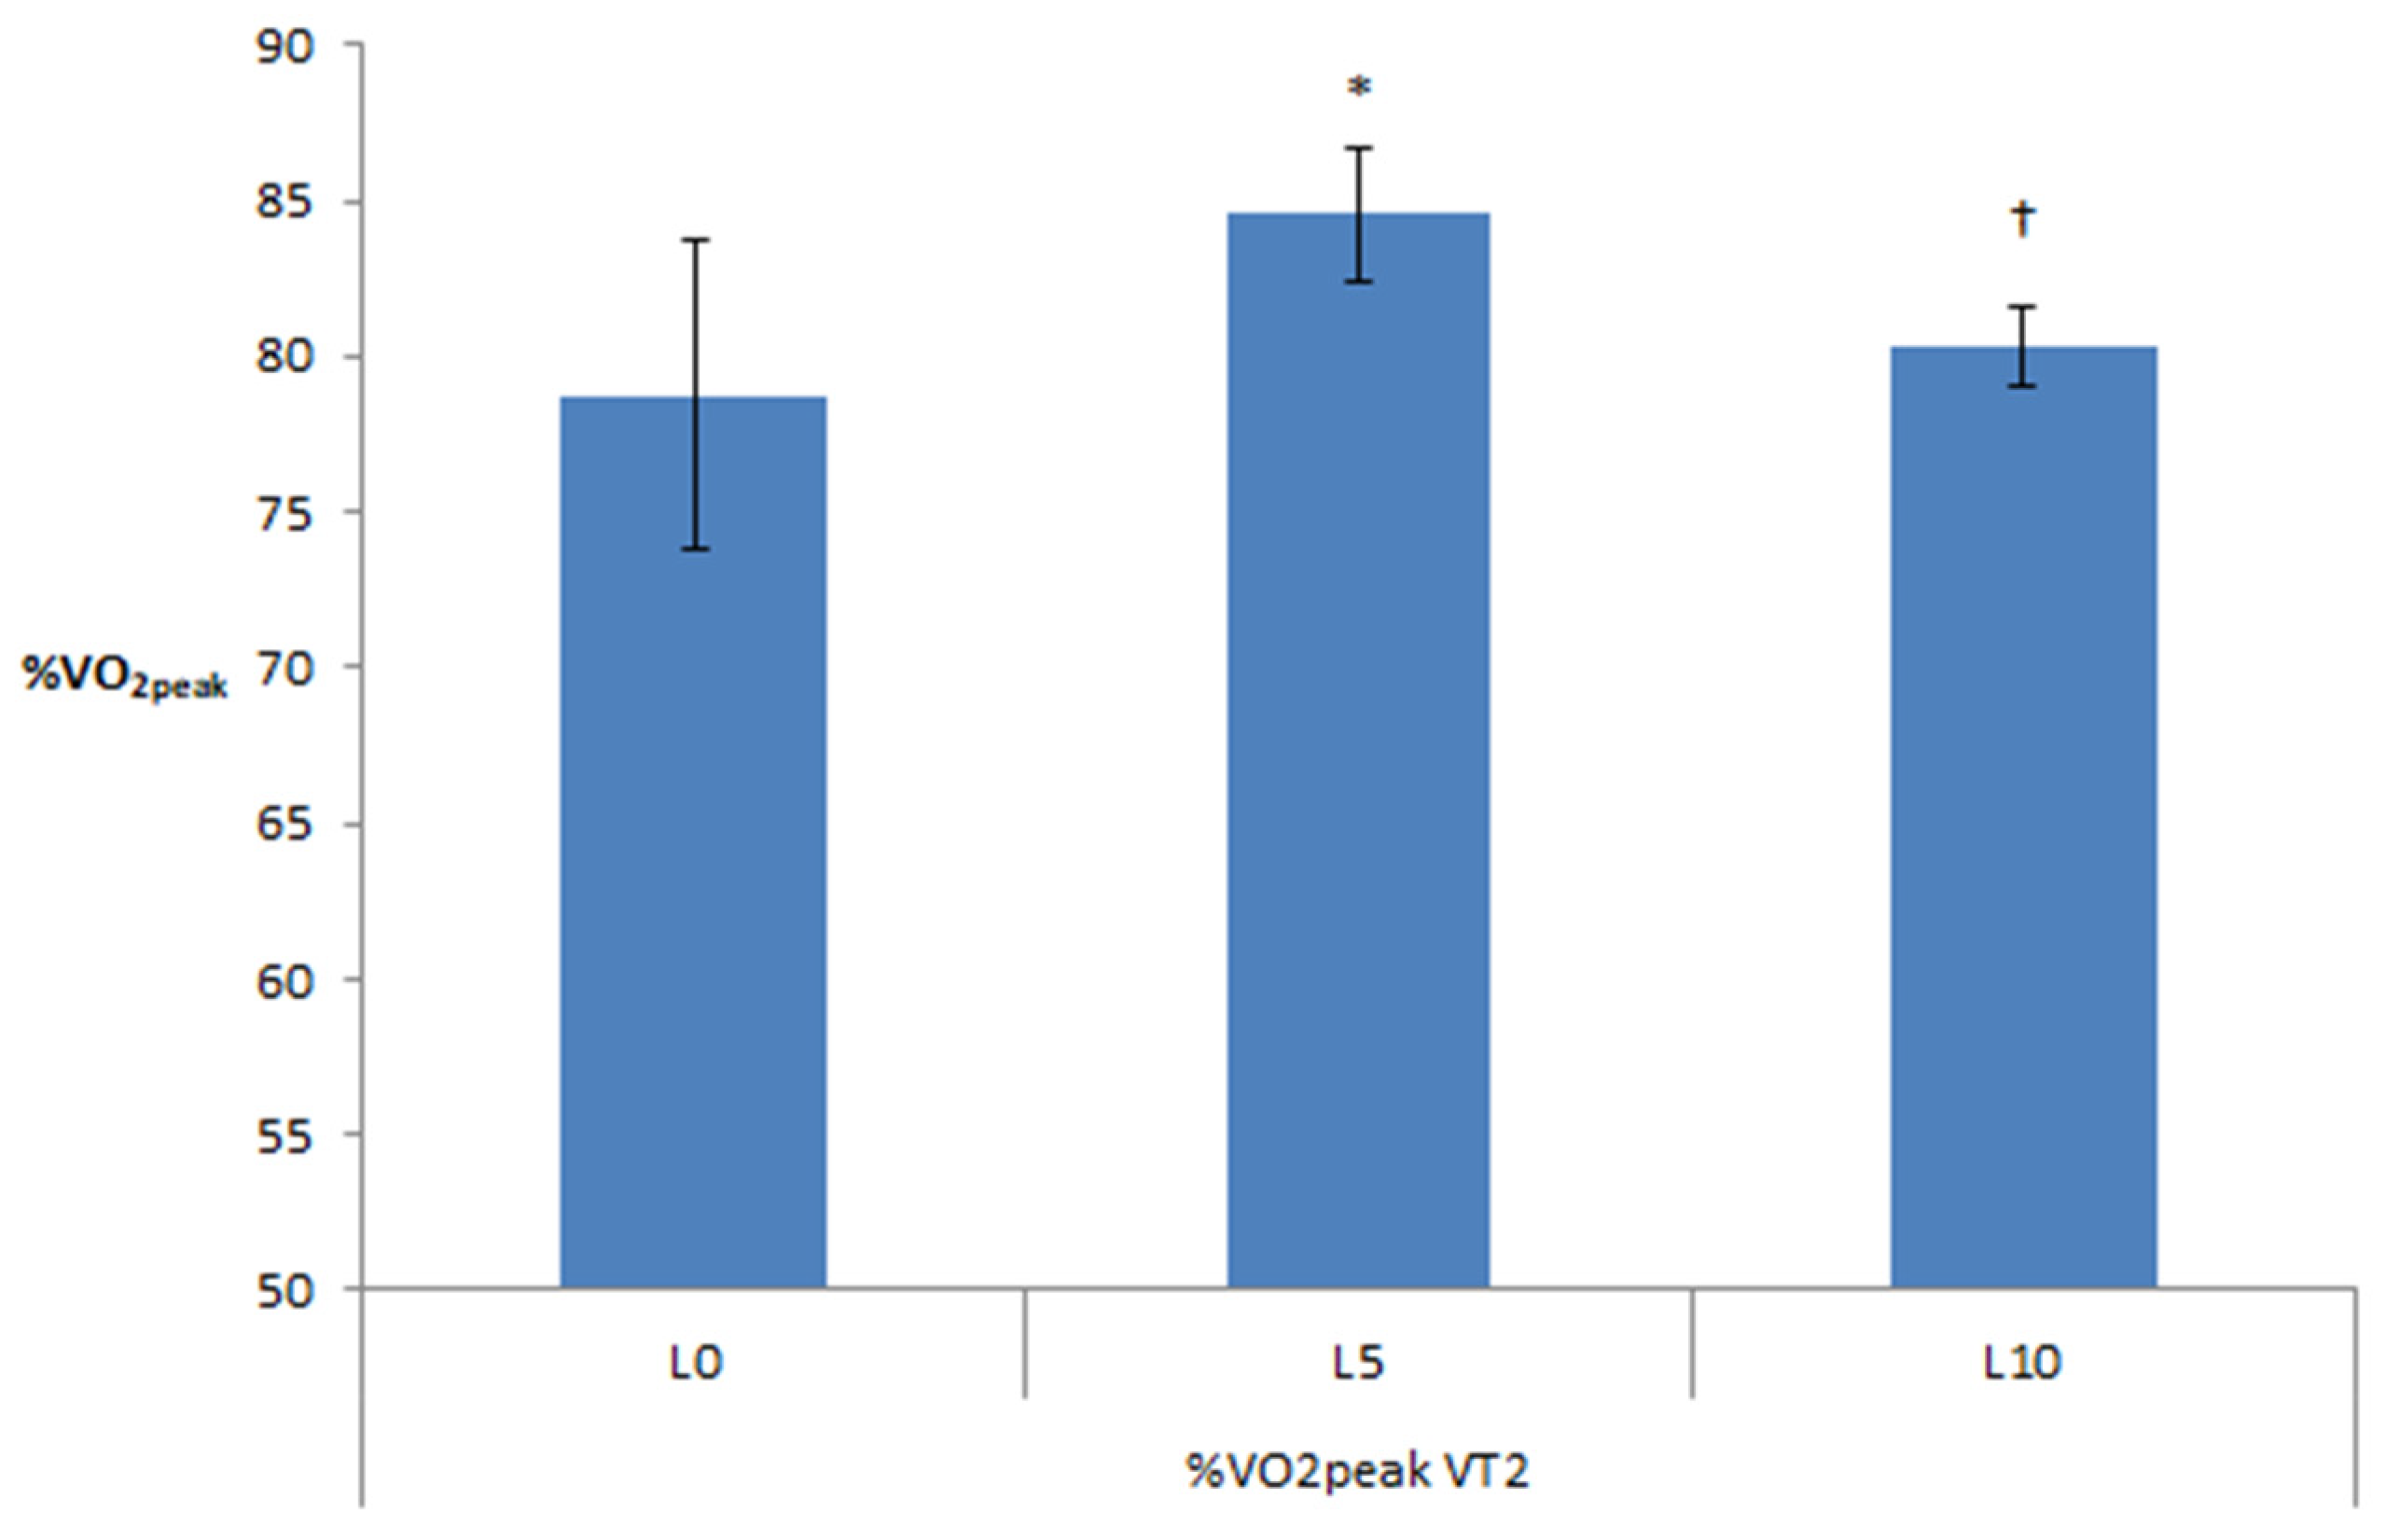
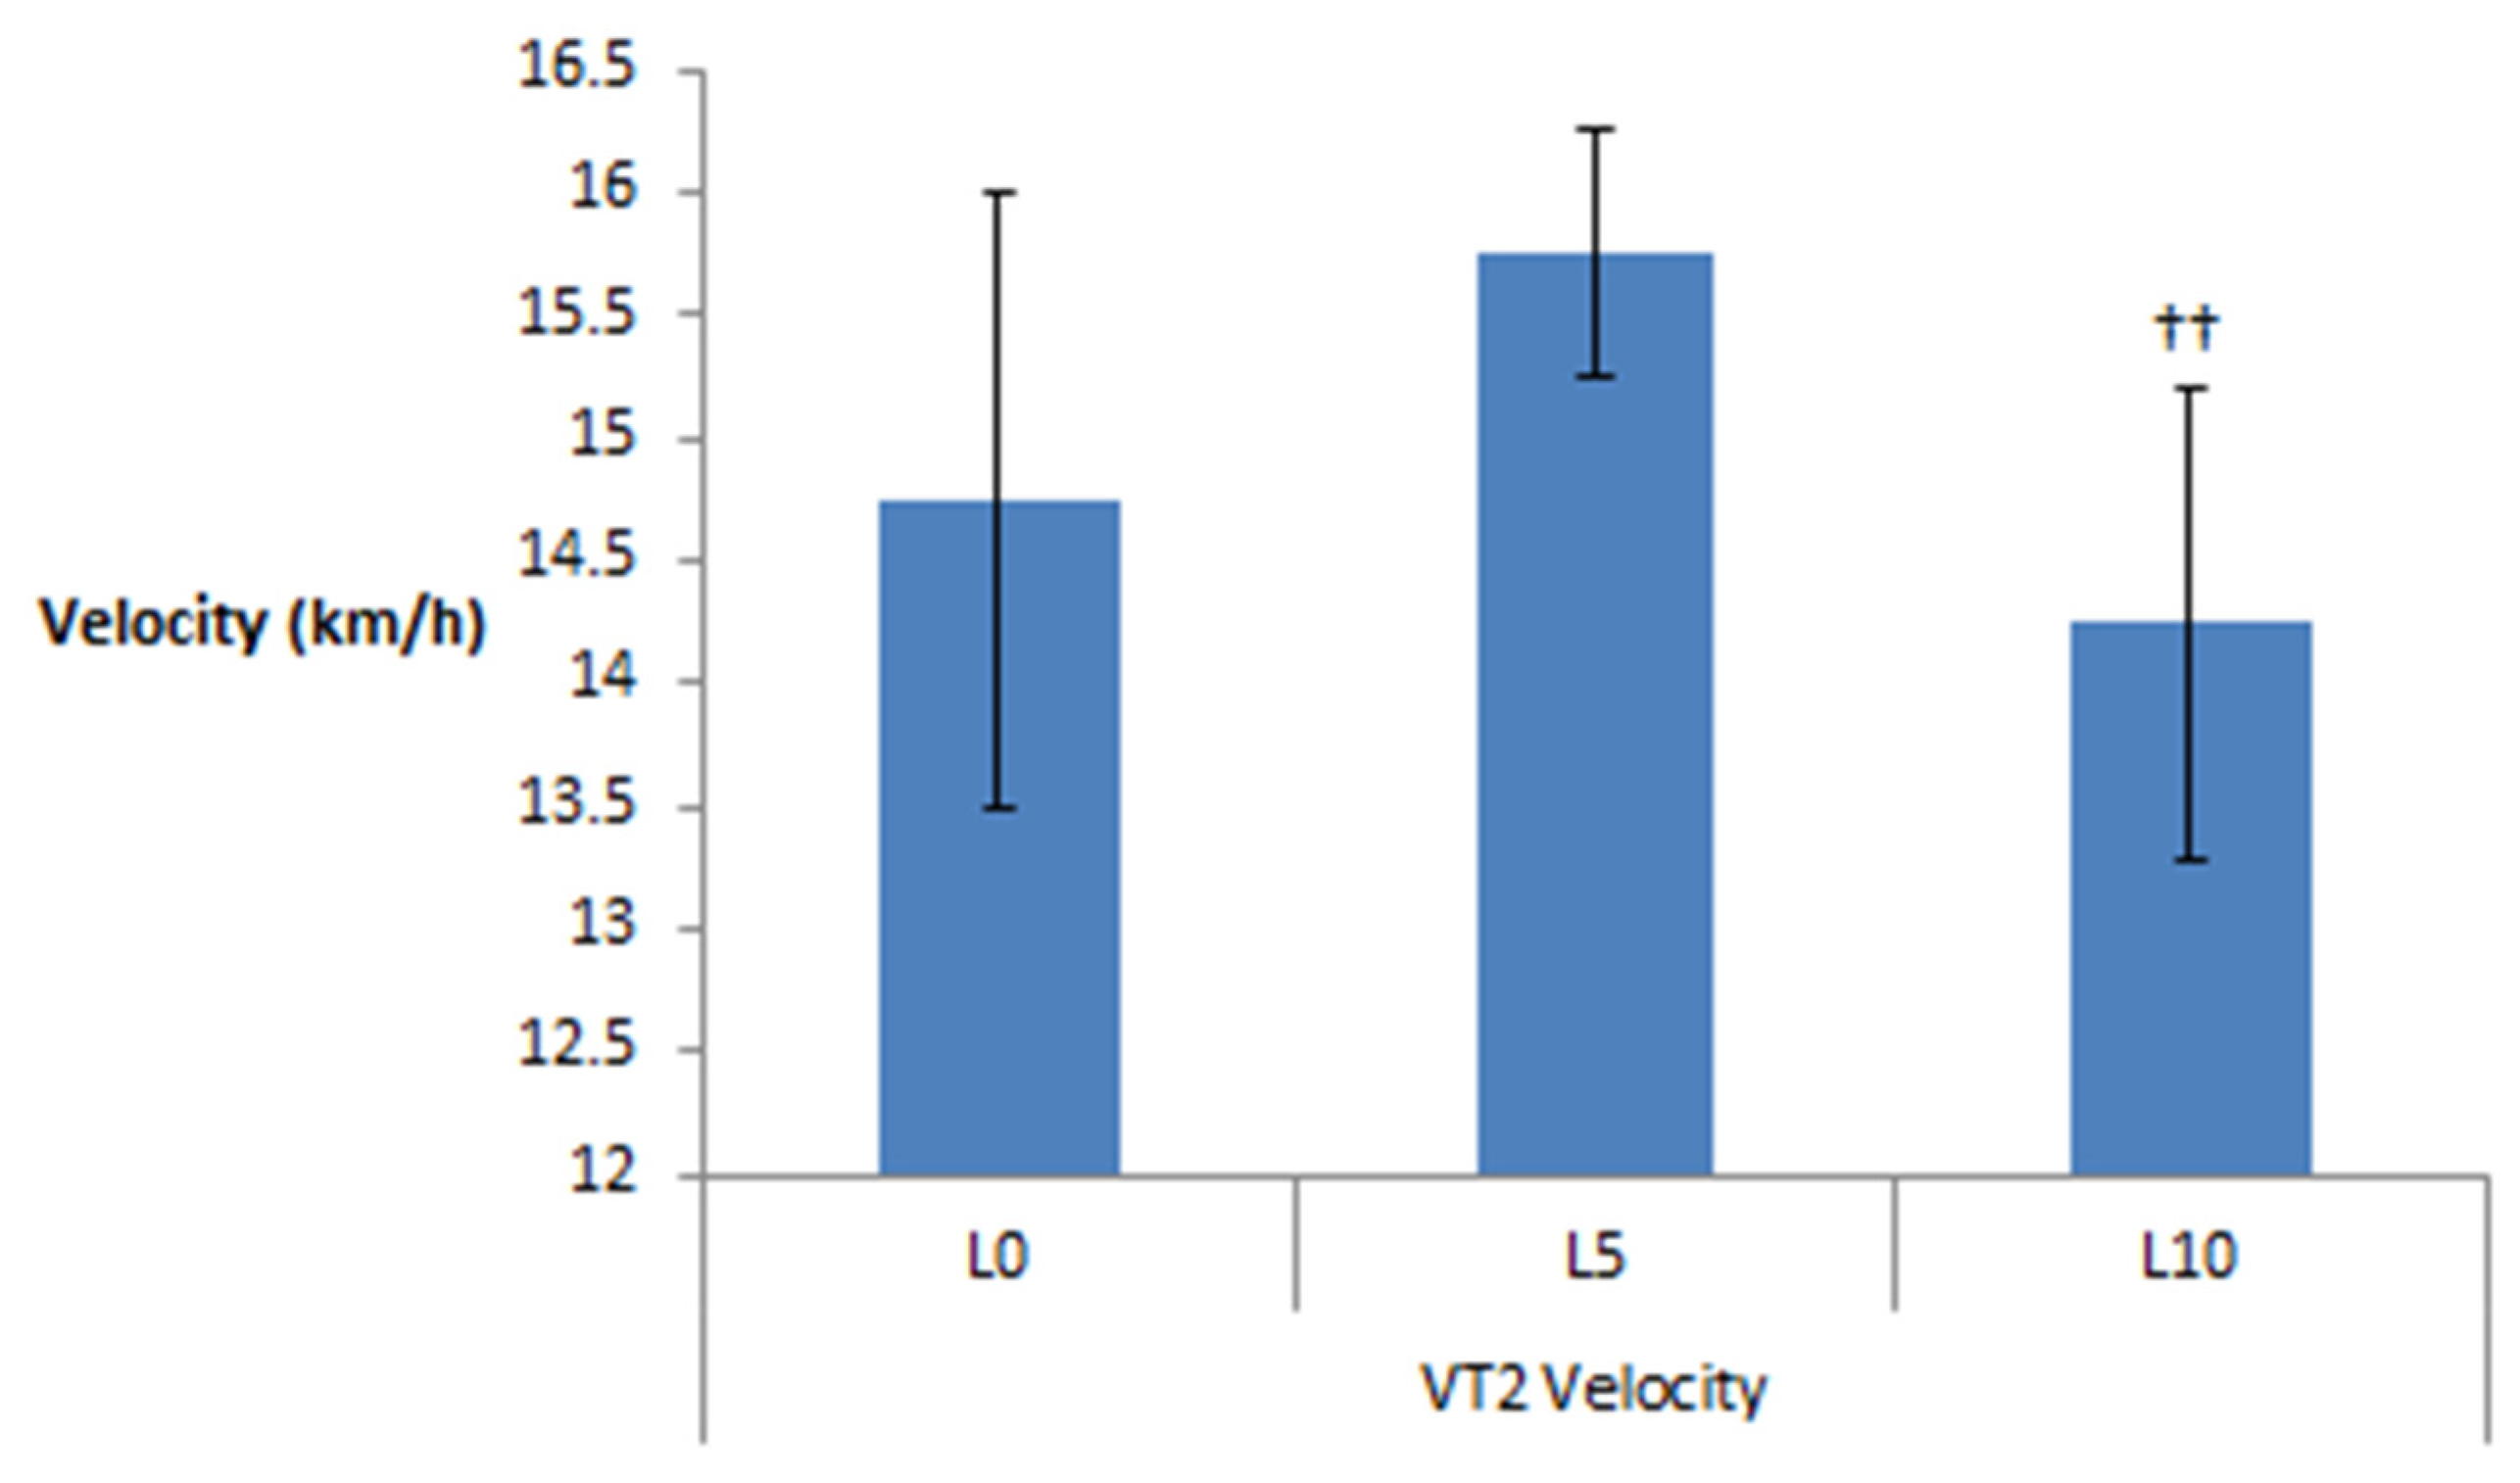
Participants showed a significant tendency to reach VT2 at different %VO2peak (p = 0.069; ηp2 = 0.591). VT2 tended to be achieved at a higher %VO2peak with L5 than with L0 and L10 (p= 0.062 and p = 0.071 respectively) (Figure 5). V reached at this milestone (p = 0.098; ηp2 = 0.538) was also higher with L5 than with L10 (p = 0.014) (Figure 6). Furthermore, although HR did not show significant differences (p = 0.180; ηp2 = 0.436), it showed a large effect (Table 3).
Last, significant differences were not found for developing both relative power (p = 0.209; ηp2 = 0.407) or absolute power (p = 0.161; ηp2 = 0.456) but large size effects were again found (Table 3).

3.4. FatMax

FatMax showed no differences for any parameter, but %VO2peak (p = 0.484; ηp2 = 0.215), RER (p = 0.167; ηp2 = 0.449), HR (p = 0.530; ηp2 = 0.191), V (p = 0.433; ηp2 = 0.250), absolute power (p = 0.503; ηp2 = 0.205), relative power (p = 0.516; ηp2 = 0.198) showed large size effects (Table 4).

3.5. Blood lactate, pH, sO2 and RPE

Blood lactate, pH and sO2 did not show statistical differences before the test (p = 0.456; ηp2 = 0.230)(p = 0.354; ηp2 = 0.293)(p = 0.176; ηp2 = 0.440) or at the end of it (p = 0.902; ηp2 = 0.034)(p = 0.576 ; ηp2 = 0.168)(p = 0.367; ηp2 = 0.284) with different loads. At the end of step phase (p = 0.523; ηp2 = 0.194) and once finished the ramp phase (p = 0.422; ηp2 = 0.250), RPE did not show differences between the different loads (Table 5).

4. Discussion

To the best of our knowledge, this is the first investigation in TR that aims to understand the physiological differences produced by running with different loads (L0, L5, and L10) in a maximal incremental test. The experimental design has being developed as a pilot study. Thus, results only show some tendencies that need to be proven with a larger sample and with some protocol adaptations, following feedback obtained during the trials. As hypothesized, running with extra load seems to trigger differences with respect to running without additional load. L10 appears to create differences in Vpeak and power values while L5 might bring out differences within physiological parameters at submaximal velocities.
WV showed an effect on Vpeak reached during the tests. Vpeak reached for L5 and L10 represented 97,6% and 94,7% respectively of Vpeak reached for L0. On the other hand, relative and absolute power achieved tended to reach greater values with greater loads regardless of Vpeak. With respect to physiological parameters, only RER showed differences, and it reached higher values in L0 than in L5. There is only one other study that has investigated the effects of running at speeds close to maximum VO2 with WV [24]. However, it focused on other biomechanical variables such as flight and contact time, frequency, and stride length so a direct comparison cannot be made. Vpeak in a maximal incremental test is a crucial variable for performance control and race time prediction in TR [6].
VT2 occurred at intensities between 79.1% and 87.5% of VO2peak. These intensities are around the highest intensity used by Purdom et al. [28] compares energy expenditure and substrate utilization at different fixed intensities with different added loads in recreational runners. These researchers suggested higher EE with L10 compared to L0 and L5 during the last minute of 3-minute intervals of running at 65%, 70%, 75%, and 80% of previously tested maximal aerobic speed (MAS). Although the present work does not aim to study EE, it has been found that L5, but not L10, might bring changes compared to the other loads. VT2 with L5 tends to occur at a higher %VO2peak, allowing greater V than with L10. These differences could be due to the characteristics of the sample, as TR practitioners may be lighter (62.5 ± 3.8 versus 78.6 ± 3.9) and could be more adapted to this load, while the recreational runners might not be.
An explanation to understand this outcome could involve a greater contribution of the elastic component of the muscle-tendon system when running with L5. Although running economy showed no differences at any point (VT1, VT2, FatMax), a potentiation warm-up [42], and more recently as an intra-trial effect [43] have been previously described. Cartón-Llorente et al. [43] used similar loads as used for the present investigation and showed higher leg spring stiffness for L5 than L0 and L10. A second explanation to understand why this has only been observed in trail runners could be an upper load limit. In other cases, this limit might be reached by either higher BM or by lack of specific strength and adaptation.
On the other hand, VT1 was observed at intensities between 42.4% and 59.4% of VO2peak. Gaffney et al. [25] used intensity within that range (55% VO2max) to observe physiological differences in a 30-minute run in CrossFit practitioners. At the corresponding speed to unloaded 55% VO2max, the addition of a WV of 9.07 kg for men and 6.35 kg for women resulted in significant physiological changes. Significant VO2 (+0.22 L/min in men, p < 0.01; +0.07 L/min in women, p < 0.05), HR (7% men, p < 0.01; 7% women, p < 0.05), and RER (+0.04 in men, p < 0.001; +0.02 in women, p < 0.05) increases were reported [25]. Speeds and %VO2peak at which VT1 occurred in the current investigation were not different with different loads (p = 0.670 and p = 0.256 respectively). Also, observing the increase in RER values experienced by CrossFit practitioners with higher loads [25], the same increase could be expected for TR athletes when running with the extra load. Contrary to that, RER showed no significant differences. RER is a parameter of interest at submaximal intensities (below VT2) due to the fact that changes in this variable reflect bioenergetic behavior, showing different macronutrient contributions.
Considering that, there seem to be differences compared to the existing evidence [25]. This could be due to various reasons, such as the weight of the external added load, the duration of the test, and the characteristics of the athletes. First, the additional load used by Gaffney et al. [25] represents a higher BM percentage for men (12.99% relative to average sample BM) than our highest load (L10), and it is close to equal for women (9.94% relative to average BM). Moreover, the test duration was longer. Participants ran at that fixed speed for 30 minutes, whereas athletes of the present study reached that range of speeds after 10 to 12 minutes of running at lower intensities. Lastly, subjects’ characteristics, such as BM (the difference between average BM was up to 14.25 kg for men and 1.45 kg for women), and familiarization with the stimulus could be key for showing these differences.
Although Purdom et al. (2019) studied fat consumption at different intensities, they did not determine FatMax. Additionally, no value reported any statistical difference at this point. It’s important to note that FatMax is a parameter that usually shows high variability due to additional conditions of carbohydrate and fat intake and absorption. Therefore, considering the small sample size, a significant dispersion of values is normal despite controlling for previous 24-hour diet.
Unlike previous evidence that described an increase in blood lactate (+0.6 mmol/L, p < 0.05) associated to loaded running [25], final blood lactate in this study showed no differences. However, this could be due because, despite matching the speed, participants in that other study exerted efforts at different intensities in different tests. On the other hand, our trail runners reached almost maximum intensity with each load.
Lastly, the results of different studies could support the idea that greater changes in different variables might occur in UR. It has been shown how a positive slope results in greater concentric load and greater energy expenditure [8], while BMI has been proven a predictor of UR performance [6]. The mass of the vest would artificially increase that BMI, while the predominance of concentric contraction would eliminate the hypothetical increased stiffness that a certain load might provide in level running [43]. Additionally, an increase in load has been used in previous studies [27] to raise metabolic intensity in uphill walking.
The nature of this pilot study brings some limitations. First of all, the small sample size (n = 4) needs to be increased for future investigations in order to either corroborate or deny the results obtained. Another limitation identified after carrying out this pilot study is the discomfort created by the WV. We suggest the use of proper TR vests for future trials in order to minimize discomfort and to assess the most specificity possible.
Also in order to understand more specific conditions of TR different slopes, both positive and negative, should be taken into account. Finally, different samples of TR subpopulations (elite, females, recreational) should be tested to observe possible differences between groups.

5. Conclusions

In conclusion, an intermediate load (L5) could bring out certain interesting physiological changes compared to the other two loads (L0 and L10) such as a VT2 right-hand displacement. Additionally, higher loads might limit maximum speed of the test and favor greater absolute and relative power expression. Our results show for the first time how overload affects different metabolic zones (FatMax, VT1, VT2 and VO2peak) during an incremental maximal test in trail runners. With this first pilot approach, sports scientists can gain insight into how to adjust training loads and monitor competition based on the overload under which the athlete is running.

Author Contributions

Conceptualization, GJR, FJMN, PEA and CMP; methodology, GJR, FJMN and CMP; software, GJR, FJMN and CMP; formal analysis, GJR, FJMN and CMP; investigation, GJR, FJMN and CMP; resources, FJMN, PEA and CMP; data curation, GJR, FJMN and CMP; writing—original draft preparation, GJR, FJMN and CMP; writing—review and editing, GJR, FJMN, PEA and CMP; visualization, GJR, FJMN, PEA and CMP; supervision, CMP; project administration, GJR, FJMN and CMP; funding acquisition, PEA and CMP. All authors have read and agreed to the published version of the manuscript.

Funding

This research received no external funding.

Institutional Review Board Statement

The study was conducted according to the guidelines of the Declaration of Helsinki, and approved by the Ethics Committee from the Catholic University of Murcia (CE012104).

Informed Consent Statement

Informed consent was obtained from all subjects involved in the study.

Data Availability Statement

The original data report is available to reviewers by contacting the corresponding author.

Conflicts of Interest

The authors declare no conflicts of interest.

References

  1. Urbaneja JS, Inés Farias E. El trail running (carreras de o por montaña) en España. Inicios, evolución y (actual) estado de la situación (Trail running in Spain. Origin, evolution and current situation; natural áreas). Retos. 2017 Sep 15;(33):123–8.
  2. itra.run [Internet]. 2022. WMTRC: World Mountain & Trail Running Championship 2022. Available from: https://itra.run/Races/RaceResults/World.Mountain...Trail.Running.Championship.Long.Trail.80K/2022/79126.
  3. International Skyrunning Federatio General Assembly. International Skyrunning Federation Rules [Internet]. 2023 Oct. Available from: https://www.skyrunning.com/rules/.
  4. Ehrström S, Tartaruga MP, Easthope CS, Brisswalter J, Morin JB, Vercruyssen F. Short Trail Running Race: Beyond the Classic Model for Endurance Running Performance. Med Sci Sports Exerc. 2018 Mar;50(3):580–8. [CrossRef]
  5. Lemire M, Falbriard M, Aminian K, Millet GP, Meyer F. Level, Uphill, and Downhill Running Economy Values Are Correlated Except on Steep Slopes. Front Physiol. 2021 Jul 1;12:697315. [CrossRef]
  6. Lemire M, Hureau TJ, Favret F, Geny B, Kouassi BYL, Boukhari M, et al. Physiological factors determining downhill vs. uphill running endurance performance. J Sci Med Sport. 2021 Jan;24(1):85–91. [CrossRef]
  7. Balducci P, Clémençon M, Trama R, Blache Y, Hautier C. Performance Factors in a Mountain Ultramarathon. Int J Sports Med. 2017 Oct;38(11):819–26. [CrossRef]
  8. Vernillo G, Giandolini M, Edwards WB, Morin JB, Samozino P, Horvais N, et al. Biomechanics and Physiology of Uphill and Downhill Running. Sports Med. 2017 Apr;47(4):615–29. [CrossRef]
  9. Giandolini M, Pavailler S, Samozino P, Morin JB, Horvais N. Foot strike pattern and impact continuous measurements during a trail running race: proof of concept in a world-class athlete. Footwear Sci. 2015 May 4;7(2):127–37. [CrossRef]
  10. Giandolini M, Horvais N, Rossi J, Millet GY, Morin JB, Samozino P. Acute and delayed peripheral and central neuromuscular alterations induced by a short and intense downhill trail run: Fatigue after a downhill trail run. Scand J Med Sci Sports. 2016 Nov;26(11):1321–33. [CrossRef]
  11. Easthope CS, Hausswirth C, Louis J, Lepers R, Vercruyssen F, Brisswalter J. Effects of a trail running competition on muscular performance and efficiency in well-trained young and master athletes. Eur J Appl Physiol. 2010 Dec;110(6):1107–16. [CrossRef]
  12. Varesco G, Coratella G, Rozand V, Cuinet B, Lombardi G, Mourot L, et al. Downhill running affects the late but not the early phase of the rate of force development. Eur J Appl Physiol. 2022 Sep;122(9):2049–59. [CrossRef]
  13. Lemire M, Hureau TJ, Remetter R, Geny B, Kouassi BYL, Lonsdorfer E, et al. Trail Runners Cannot Reach V˙O2max during a Maximal Incremental Downhill Test. Med Sci Sports Exerc. 2020 May;52(5):1135–43. [CrossRef]
  14. Lemire M, Remetter R, Hureau TJ, Kouassi BYL, Lonsdorfer E, Geny B, et al. High-intensity downhill running exacerbates heart rate and muscular fatigue in trail runners. J Sports Sci. 2021 Apr 3;39(7):815–25. [CrossRef]
  15. Sabater-Pastor F, Tomazin K, Millet GP, Verney J, Féasson L, Millet GY. VO2max and Velocity at VO2max Play a Role in Ultradistance Trail-Running Performance. Int J Sports Physiol Perform. 2023 Mar 1;18(3):300–5. [CrossRef]
  16. Scheer V, Vieluf S, Janssen TI, Heitkamp H. Predicting Competition Performance in Short Trail Running Races with Lactate Thresholds. J Hum Kinet. 2019 Oct 18;69(1):159–67. [CrossRef]
  17. Alvero-Cruz JR, Parent Mathias V, Garcia Romero J, Carrillo De Albornoz-Gil M, Benítez-Porres J, Ordoñez FJ, et al. Prediction of Performance in a Short Trail Running Race: The Role of Body Composition. Front Physiol. 2019 Oct 16;10:1306. [CrossRef]
  18. Costa RJS, Knechtle B, Tarnopolsky M, Hoffman MD. Nutrition for Ultramarathon Running: Trail, Track, and Road. Int J Sport Nutr Exerc Metab. 2019 Mar 1;29(2):130–40. [CrossRef]
  19. Alcaraz PE, Carlos-Vivas J, Oponjuru BO, Martínez-Rodríguez A. The Effectiveness of Resisted Sled Training (RST) for Sprint Performance: A Systematic Review and Meta-analysis. Sports Med. 2018 Sep;48(9):2143–65. [CrossRef]
  20. Alcaraz PE, Palao JM, Elvira JLL, Linthorne NP. Effects of Three Types of Resisted Sprint Training Devices on the Kinematics of Sprinting at Maximum Velocity. J Strength Cond Res. 2008 May;22(3):890–7. [CrossRef]
  21. Carlos-Vivas J, Marín-Cascales E, Freitas TT, Perez-Gomez J, Alcaraz PE. Force-Velocity-Power Profiling During Weighted-Vest Sprinting in Soccer. Int J Sports Physiol Perform. 2019 Jul 1;14(6):747–56. [CrossRef]
  22. Clark KP, Stearne DJ, Walts CT, Miller AD. The Longitudinal Effects of Resisted Sprint Training Using Weighted Sleds vs. Weighted Vests. J Strength Cond Res. 2010 Dec;24(12):3287–95. [CrossRef]
  23. Cross MR, Brughelli ME, Cronin JB. Effects of Vest Loading on Sprint Kinetics and Kinematics. J Strength Cond Res. 2014 Jul;28(7):1867–74. [CrossRef]
  24. Carretero-Navarro G, Márquez G, Cherubini D, Taube W. Effect of different loading conditions on running mechanics at different velocities. Eur J Sport Sci. 2019 May 28;19(5):595–602. [CrossRef]
  25. Gaffney CJ, Cunnington J, Rattley K, Wrench E, Dyche C, Bampouras TM. Weighted vests in CrossFit increase physiological stress during walking and running without changes in spatiotemporal gait parameters. Ergonomics. 2022 Jan 2;65(1):147–58. [CrossRef]
  26. Moore KJ, Penry JT, Gunter KB. Development of a Walking Aerobic Capacity Test for Structural Firefighters. J Strength Cond Res. 2014 Aug;28(8):2346–52. [CrossRef]
  27. Klimek AT, Klimek A. The weighted walking test as an alternative method of assessing aerobic power. J Sports Sci. 2007 Jan 15;25(2):143–8. [CrossRef]
  28. Purdom TM, Mermier C, Dokladny K, Moriarty T, Lunsford L, Cole N, et al. Predictors of Fat Oxidation and Caloric Expenditure With and Without Weighted Vest Running. J Strength Cond Res [Internet]. 2019 Feb 18 [cited 2023 Aug 1];Publish Ahead of Print. Available from: https://journals.lww.com/00124278-900000000-94868. [CrossRef]
  29. World Medical Association Declaration of Helsinki: Ethical Principles for Medical Research Involving Human Subjects. JAMA. 2013 Nov 27;310(20):2191. [CrossRef]
  30. Norton KI. Standards for Anthropometry Assessment. In: Norton K, Eston R, editors. Kinanthropometry and Exercise Physiology [Internet]. 4th ed. Fourth Edition. | New York: Routledge, 2018. | Roger G. Eston is the principal editor of the third edition published 2009. | “First edition published by Routledge 2001”—T.p. verso.: Routledge; 2018 [cited 2023 Jul 26]. p. 68–137. Available from: https://www.taylorfrancis.com/books/9781315385655/chapters/10.4324/9781315385662-4.
  31. Dimitrijevic M, Lalovic D, Milovanov D. Correlation of Different Anthropometric Methods and Bioelectric Impedance in Assessing Body Fat Percentage of Professional Male Athletes. Serbian J Exp Clin Res. 2021 May 29;0(0):000010247820210026. [CrossRef]
  32. Urbaniak, G. C., & Plous, S. (2013). Research Randomizer (Version 4.0) [Computer software]. Retrieved on June 22, 2013, from http://www.randomizer.org/.
  33. Zuniga JM, Housh TJ, Camic CL, Bergstrom HC, Traylor DA, Schmidt RJ, et al. Metabolic parameters for ramp versus step incremental cycle ergometer tests. Appl Physiol Nutr Metab. 2012 Dec;37(6):1110–7. [CrossRef]
  34. Larson RD. Physiologic Responses to Two Distinct Maximal Cardiorespiratory Exercise Protocols. Int J Sports Exerc Med [Internet]. 2015 Aug 31 [cited 2023 Aug 2];1(3). Available from: https://clinmedjournals.org/articles/ijsem/ijsem-1-013.php?jid=ijsem. [CrossRef]
  35. Binder RK, Wonisch M, Corra U, Cohen-Solal A, Vanhees L, Saner H, et al. Methodological approach to the first and second lactate threshold in incremental cardiopulmonary exercise testing. Eur J Cardiovasc Prev Rehabil. 2008 Dec;15(6):726–34. [CrossRef]
  36. Scherr J, Wolfarth B, Christle JW, Pressler A, Wagenpfeil S, Halle M. Associations between Borg’s rating of perceived exertion and physiological measures of exercise intensity. Eur J Appl Physiol. 2013 Jan;113(1):147–55. [CrossRef]
  37. Mier CM, Alexander RP, Mageean AL. Achievement of VO2max Criteria During a Continuous Graded Exercise Test and a Verification Stage Performed by College Athletes. J Strength Cond Res [Internet]. 2012;26(10). Available from: https://journals.lww.com/nsca-jscr/fulltext/2012/10000/achievement_of_v_combining_dot_above_o2max.6.aspx. [CrossRef]
  38. Wasserman K, Whipp BJ, Koyl SN, Beaver WL. Anaerobic threshold and respiratory gas exchange during exercise. J Appl Physiol. 1973 Aug;35(2):236–43. [CrossRef]
  39. Frayn KN. Calculation of substrate oxidation rates in vivo from gaseous exchange. J Appl Physiol. 1983 Aug 1;55(2):628–34. [CrossRef]
  40. Poole DC, Wilkerson DP, Jones AM. Validity of criteria for establishing maximal O2 uptake during ramp exercise tests. Eur J Appl Physiol. 2008 Mar;102(4):403–10. [CrossRef]
  41. Cohen J. Statistical power analysis for the behavioral sciences. 2. ed., reprint. New York, NY: Psychology Press; 2009. 567 p. [CrossRef]
  42. Barnes KR, Hopkins WG, McGuigan MR, Kilding AE. Warm-up with a weighted vest improves running performance via leg stiffness and running economy. J Sci Med Sport. 2015 Jan;18(1):103–8. [CrossRef]
  43. Cartón-Llorente A, Rubio-Peirotén A, Cardiel-Sánchez S, Roche-Seruendo LE, Jaén-Carrillo D. Training Specificity in Trail Running: A Single-Arm Trial on the Influence of Weighted Vest on Power and Kinematics in Trained Trail Runners. Sensors. 2023 Jul 14;23(14):6411. [CrossRef]
Figure 1. Procedure. L0 = 0% body mass load, L5 = 5% body mass load; L10 = 10% body mass load.
Preprints 89983 g001
Figure 2. Testing protocol. VT1 = Ventilatory threshold 1; VT2 = Ventilatory threshold 2.
Preprints 89983 g002
Figure 3. Peak velocity. L0 = 0% body mass load, L5 = 5% body mass load; L10 = 10% body mass load; ** = Significant difference respect to L0; * = Significant tendency respect to L0; †† = Significant difference respect to L5.
Preprints 89983 g003
Figure 4. Absolute Power at FatMax, VT1, VT2. L0 = 0% body mass load, L5 = 5% body mass load; L10 = 10% body mass load; * = significant tendency respect to L0.
Preprints 89983 g004
Figure 5. %VO2peak differences at VT2. L0 = 0% body mass load, L5 = 5% body mass load; L10 = 10% body mass load; † = Significant tendency respect to L5; VT2 = Ventilatory threshold 2.
Preprints 89983 g005
Figure 6. Velocity differences at VT2. L0 = 0% body mass load, L5 = 5% body mass load; L10 = 10% body mass load; †† = Significant difference respect to L5; VT2 = Ventilatory threshold 2.
Preprints 89983 g006
Table 1. General participants characteristics.
N = 4 Age (years) Weight (kg) Height (cm) Distance/week (km) Elevation gain/week (m) Fat mass (%)
28.0 (8.7) 62.5 (3.8) 173.3 (0.5) 58.8 (2.5) 1662.5 (110.9) 9.3 (0.7)
Table 2. Peak values.
Zone Variables L0 L5 L10 p ηp2
Peak HR (bpm) 186.0 (12.8) 184.8 (10.7) 186.3 (14.0) 0.660 0.129
RER 1.15 (0.03) 1.09** (0.03) 1.12 (0.02) 0.008 ## 0.803
VO2Rpeak (ml/kg/min) 66.8 (2.5) 66.3 (2.1) 67.3 (1.0) 0.781 0.079
VO2peak (L/min) 4.15 (0.32) 4.10 (0.26) 4.18 (0.28) 0.694 0.115
V (km/h) 21 (0.4) 20.5* (0.8) 19.8**,†† (0.6) <.001## 0.910
AbsPw (W) 352.4 (27.9) 355.7 (39.6) 371.4* (26.8) 0.047## 0.639
Pw/BM (W/kg) 5.64 (0.21) 5.65 (0.27) 5.95* (0.34) 0.068# 0.592
Trial duration (seconds) 1621.8 (65.9) 1606.8 (59.0) 1517.8**,†† (79.9) 0.022## 0.720
Peak = Peak values; HR = Heart rate; RER = Respiratory Exchange ratio; VO2peak = Absolute maximum oxygen consumption; VO2Rpeak = Relative maximum oxygen consumption; V = velocity; AbsPw =Absolute power; Pw/BM = Relative to body mass power; L0 = 0% body mass load, L5 = 5% body mass load; L10 = 10% body mass load; # = significant tendency in ANOVA interaction; ## = significant ANOVA interaction; * = significant tendency respect to L0; ** = Significant difference respect to L0; †† = Significant difference respect to L5.
Table 3. VT1 and VT2.
Zone Variables L0 L5 L10 p ηp2
VT1 HR (bpm) 123.3 (7.1) 132.0 (15.4) 133.3 (13.2) 0.381 0.275
RER 0.92 (0.03) 0.90 (0.02) 0.92 (0.03) 0.476 0.219
%VO2peak 49.44 (6.62) 55.11 (3.95) 55.77 (0.97) 0.256 0.365
V (km/h) 9.5 (0.6) 10.0 (0.8) 9.8 (1,0) 0.670 0.125
AbsPw (W) 171.1 (22.0) 178.5 (3.9) 196.1 (12.5) 0.092 # 0.548
Pw/BM (W/kg) 2.73 (0.19) 2.85 (0.10) 3.15 (0.28) 0.209 0.407
RE (mL/Kg/Km) 314.7 (57.6) 366.5 (54.7) 365.7 (38.2) 0.393 0.268
VT2 HR (bpm) 165.0 (12.2) 170.3 (10.5) 167.8 (16.0) 0.180 0.436
%VO2peak 78.75 (4.97) 84.57* (2.17) 80.30 (1.28) 0.069 # 0.591
V (km/h) 14.8 (1.3) 15.8 (0.5) 14.3†† (0.96) 0.098 # 0.538
AbsPw (W) 258.2 (12.7) 280.4 (31.0) 279.9 (26.8) 0.161 0.456
Pw/BM (W/kg) 4.15 (0.31) 4.45 (0.16) 4.48 (0.40) 0.161 0.456
RE (mL/Kg/Km) 214.8 (21.5) 213.5 (7.6) 228.2 (17.4) 0.265 0.358
VT1 = Ventilatory threshold 1; VT2 = Ventilatory threshold 2; HR = heart rate; RER = respiratory Exchange ratio; %VO2peak = VO2Rpeak = Relative maximum oxygen consumption; V = velocity; AbsPw = Absolute power; Pw/BM = Relative to body weight power; Re = Running Economy; L0 = 0% body mass load, L5 = 5% body mass load; L10 = 10% body mass load; # = significant tendency in ANOVA interaction; ## = significant ANOVA interaction; † = significant tendency respect to L5; ** = Significant difference respect to L0; †† = Significant difference respect to L5.
Table 4. FatMax.
Table 4. FatMax.
Zone Variables L0 L5 L10 p ηp2
FatMax HR (bpm) 92.3 (12.3) 96.5 (16.1) 102.8 (22.8) 0.530 0.191
RER 0.80 (0.05) 0.81 (0.08) 0.83 (0.09) 0.167 0.449
%VO2peak 28.59 (5.31) 32.71 (6.75) 36.55 (13.96) 0.484 0.215
V (km/h) 6.0 (0.8) 6.3 (1.3) 7.0 (2.7) 0.433 0.250
AbsPw (W) 93.2 (19.7) 102.2 (35.9) 121.6 (61.6) 0.503 0.205
Pw/Bm (W/kg) 1.50 (0.32) 1.65 (0.58) 1.96 (1.04) 0.516 0.198
FatMax = maximum fat oxidation zone; HR = heart rate; RER = respiratory Exchange ratio; %VO2peak = VO2Rpeak = Relative maximum oxygen consumption; V = velocity; AbsPw = Absolute power; Pw/BM = Relative to body weight power; RE = Running Economy; L0 = 0% body mass load, L5 = 5% body mass load; L10 = 10% body mass load.
Table 5. Blood lactate, pH and sO2.
Variables L0 L5 L10 p ηp2
Lactate pre (mmol/L) 1.3 (0.3) 1.6 (0.6) 1.5 (0.3) 0.456 0.230
Lactate post (mmol/L) 11.3 (1.8) 10.9 (1.1) 10.8 (0.6) 0.902 0.034
pH pre 7.39 (0.02) 7.41 (0.03) 7.41 (0.01) 0.354 0.293
pH post 7.27 (0.03) 7.27 (0.05) 7.25 (0.07) 0.576 0.168
sO2 pre (%) 91.1 (2.3) 93.7 (0.9) 93.3 (2.4) 0.176 0.440
sO2 post (%) 94.7 (1.0) 95.7 (1.5) 94.8 (0.9) 0.367 0.284
Step phase RPE 7.5 (0.9) 8.0 (0.9) 8.1 (0.9) 0.523 0.194
Ramp phase RPE 9.6 (0.5) 9.6 (0.5) 9.9 (0.3) 0.422 0.250
RPE = rate of perceived exertion; L0 = 0% body mass load, L5 = 5% body mass load; L10 = 10% body mass load.
Disclaimer/Publisher’s Note: The statements, opinions and data contained in all publications are solely those of the individual author(s) and contributor(s) and not of MDPI and/or the editor(s). MDPI and/or the editor(s) disclaim responsibility for any injury to people or property resulting from any ideas, methods, instructions or products referred to in the content.
Copyright: This open access article is published under a Creative Commons CC BY 4.0 license, which permit the free download, distribution, and reuse, provided that the author and preprint are cited in any reuse.
Prerpints.org logo

Preprints.org is a free preprint server supported by MDPI in Basel, Switzerland.

Subscribe

© 2024 MDPI (Basel, Switzerland) unless otherwise stated