Submitted:
08 November 2023
Posted:
09 November 2023
You are already at the latest version
Abstract
Keywords:
1.0. Introduction
2. Materials and Methods
2.1. Materials and Chemical Reagents
2.2. Preliminary Selection of Extraction Solvent
2.3. Heat-assisted Extraction of Bioactive Compounds
2.4. Box-Behnken Experimental Design and Modeling
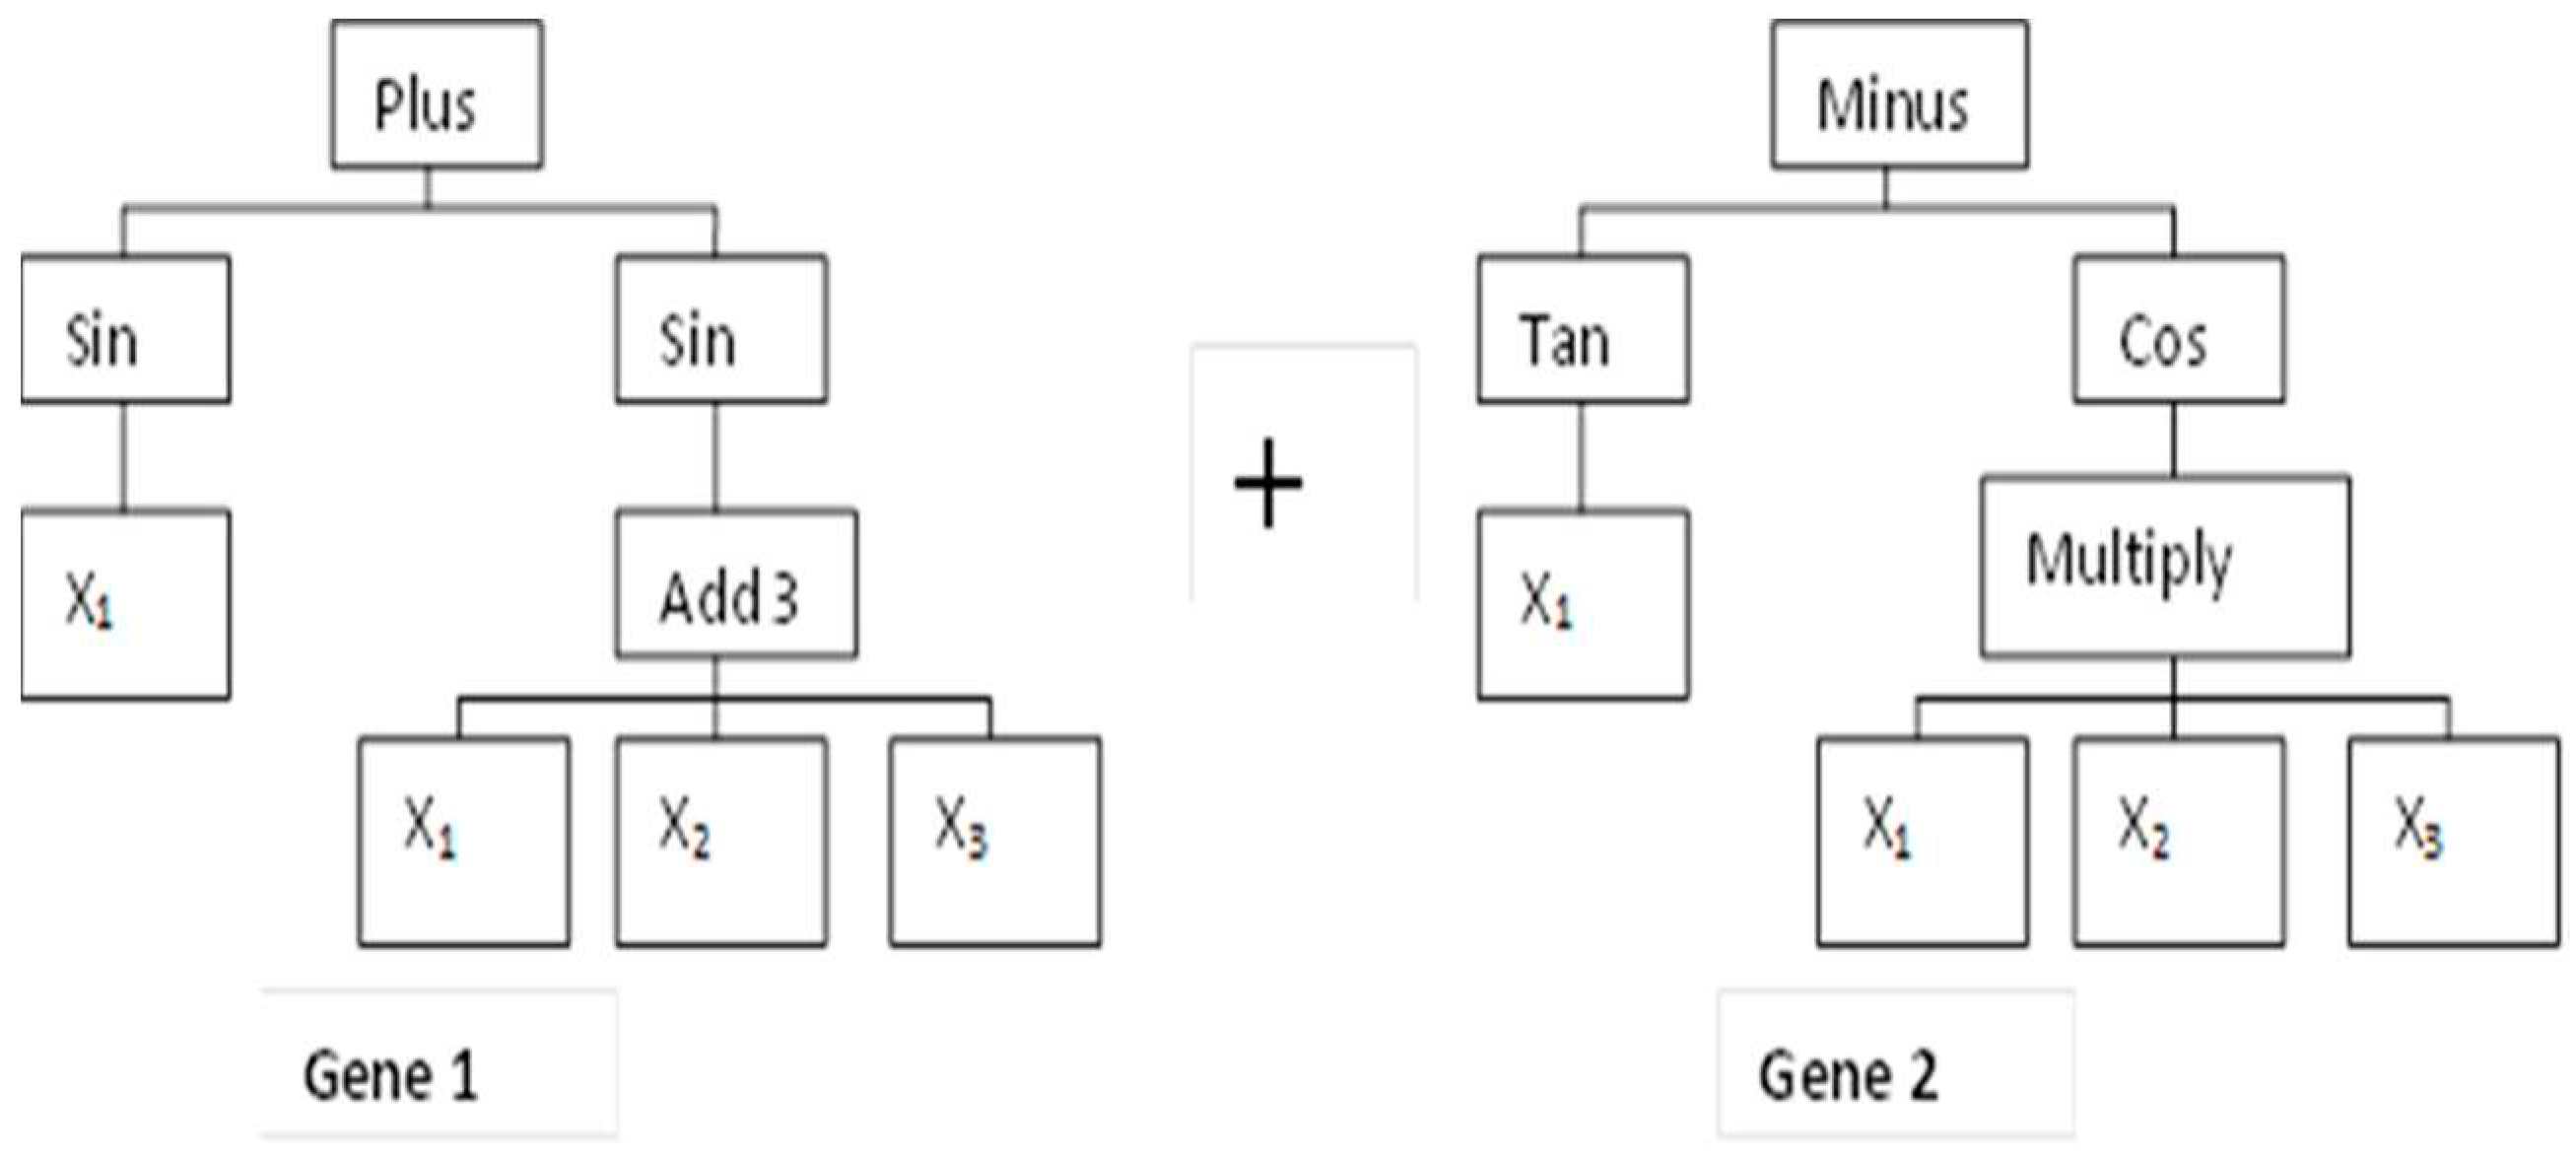
2.5. MGGP-Based Predictive Modeling Theory and Model Development
2.5.1. MGGP Theory
2.5.2. MGGP Model Development
2.6. Numerical Process Optimization and Validation
2.7. Determination of Extract Yield
2.8. Determination Total Phenolic Content
2.9. Determination of Antioxidant Activity
2.10. High Performance Liquid Chromatography Profiling of Extract
2.11. Reliability Assessment of BBD-RSM-based Predictive Models
3. Results
3.1. Preliminary solvent mixture selection for the bioactive compound’s extraction
3.2. Effects of process parameters on the recovery of bioactive extract form P. emblica leaves
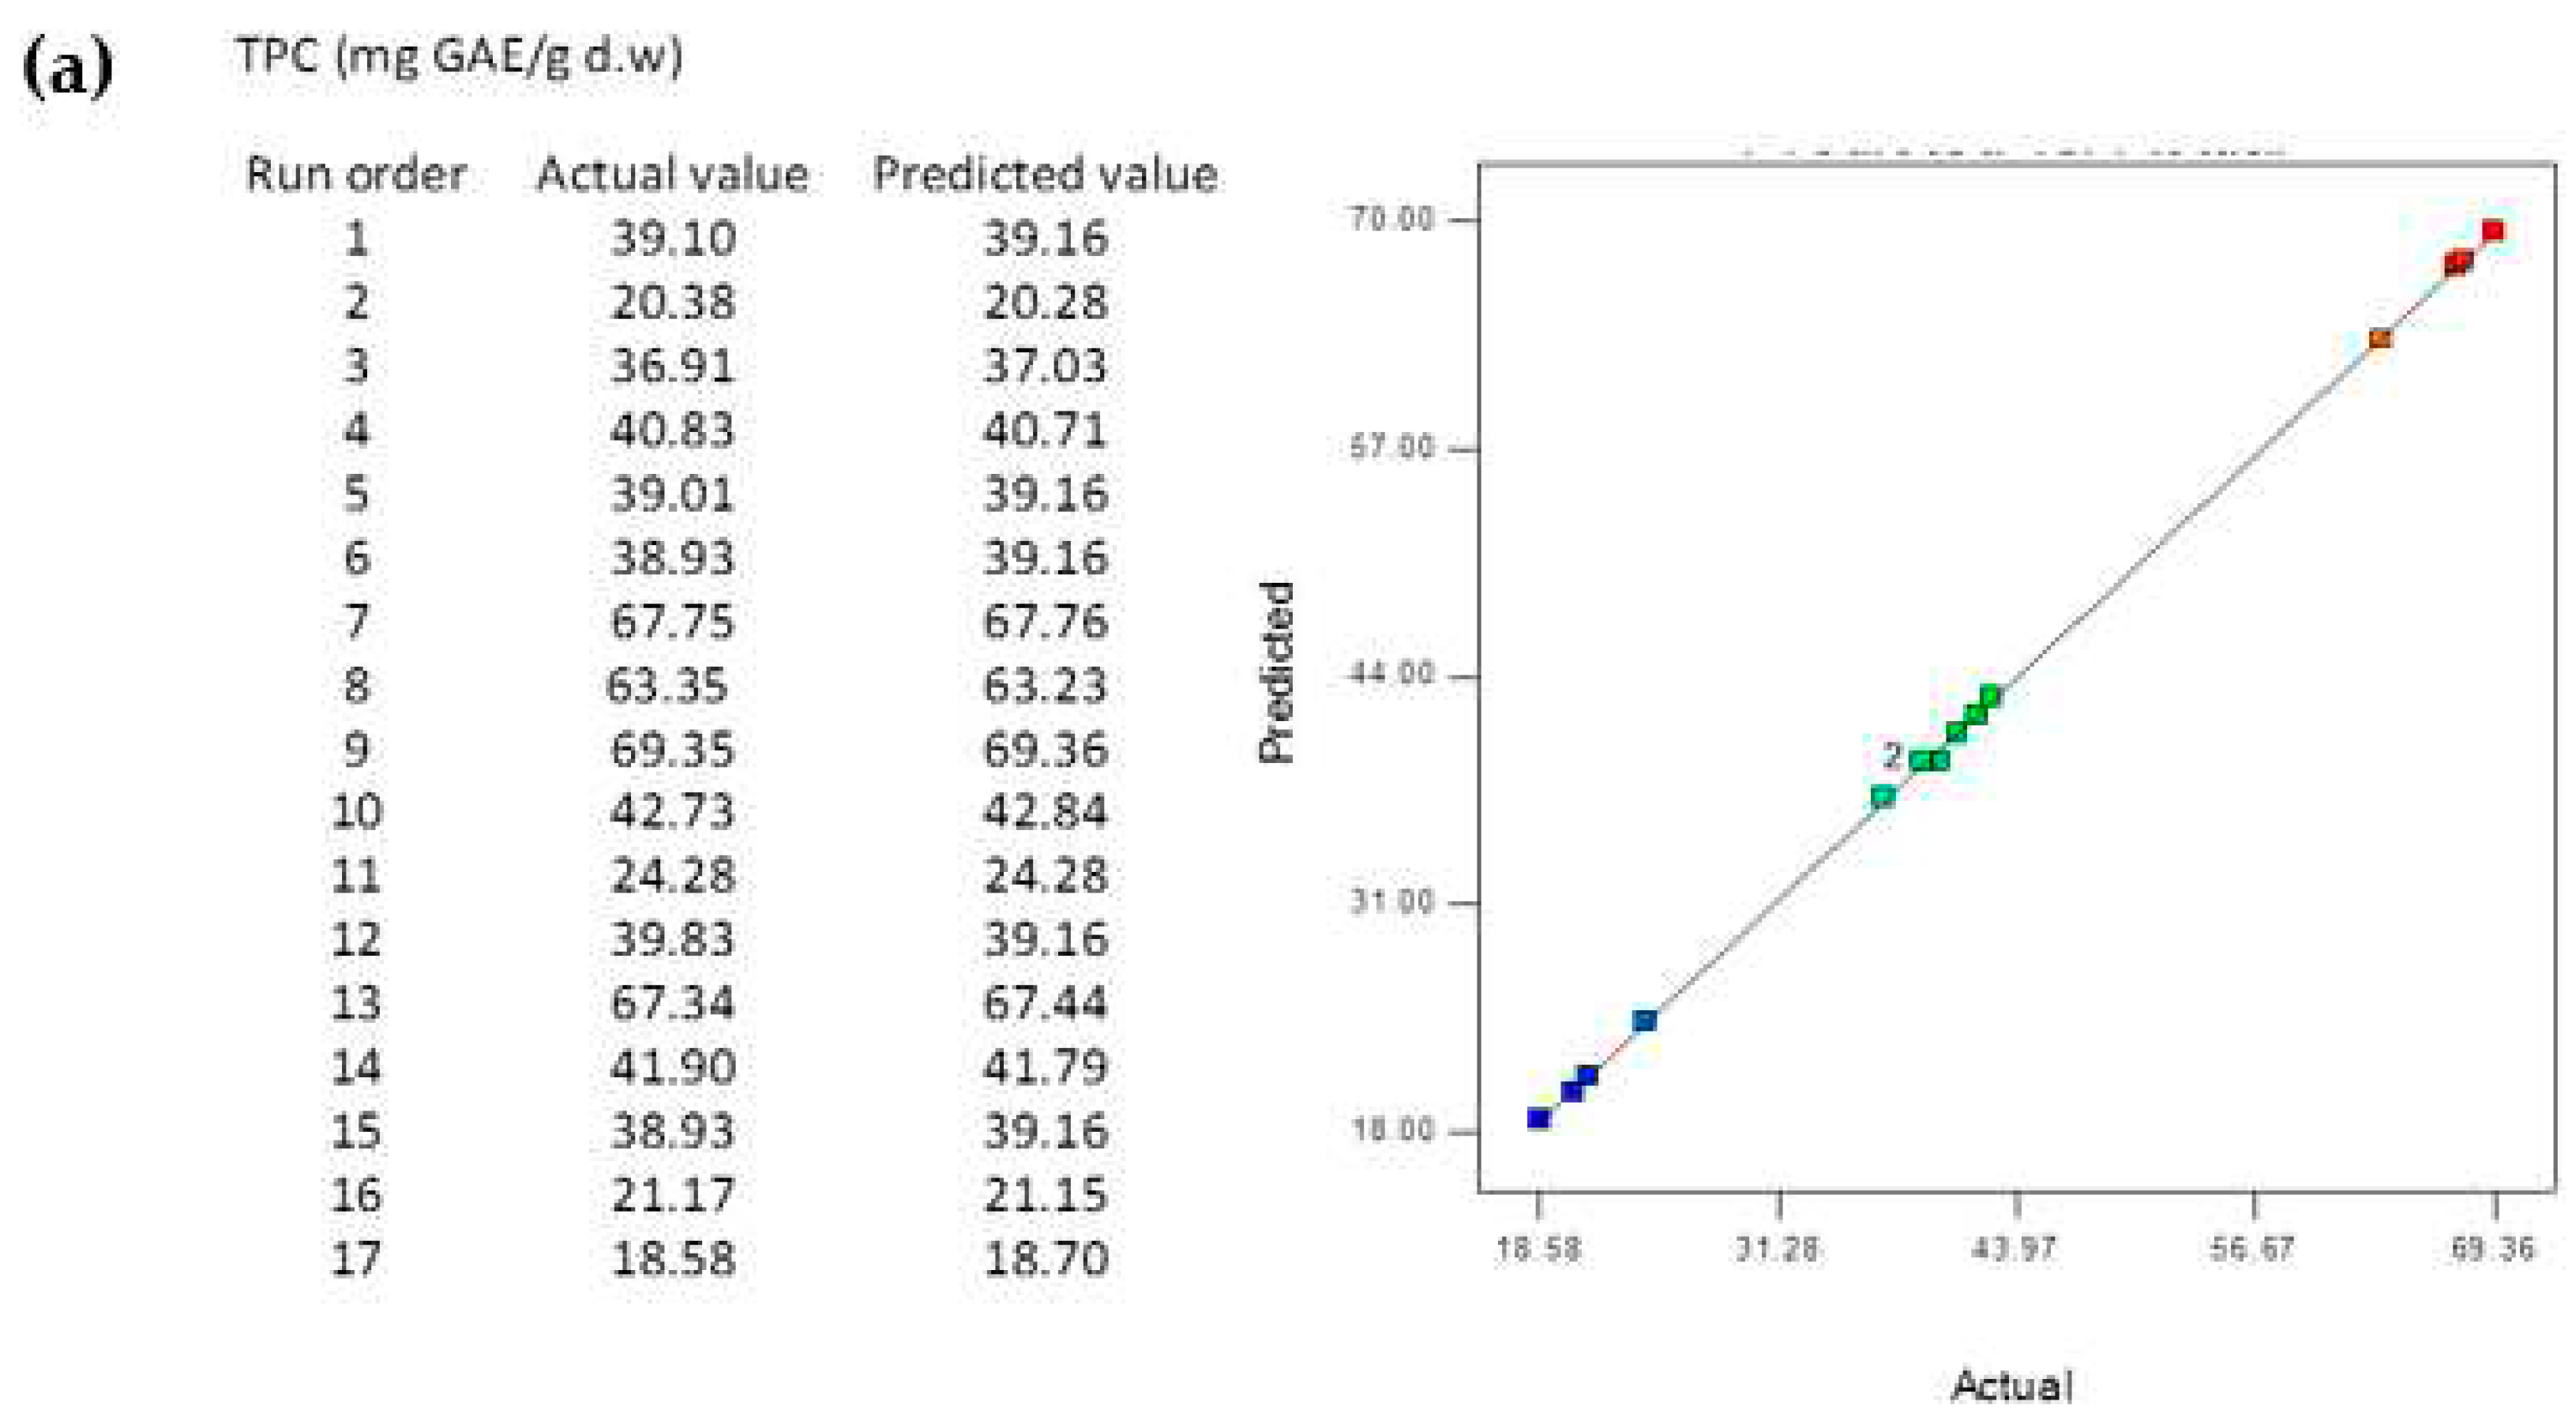
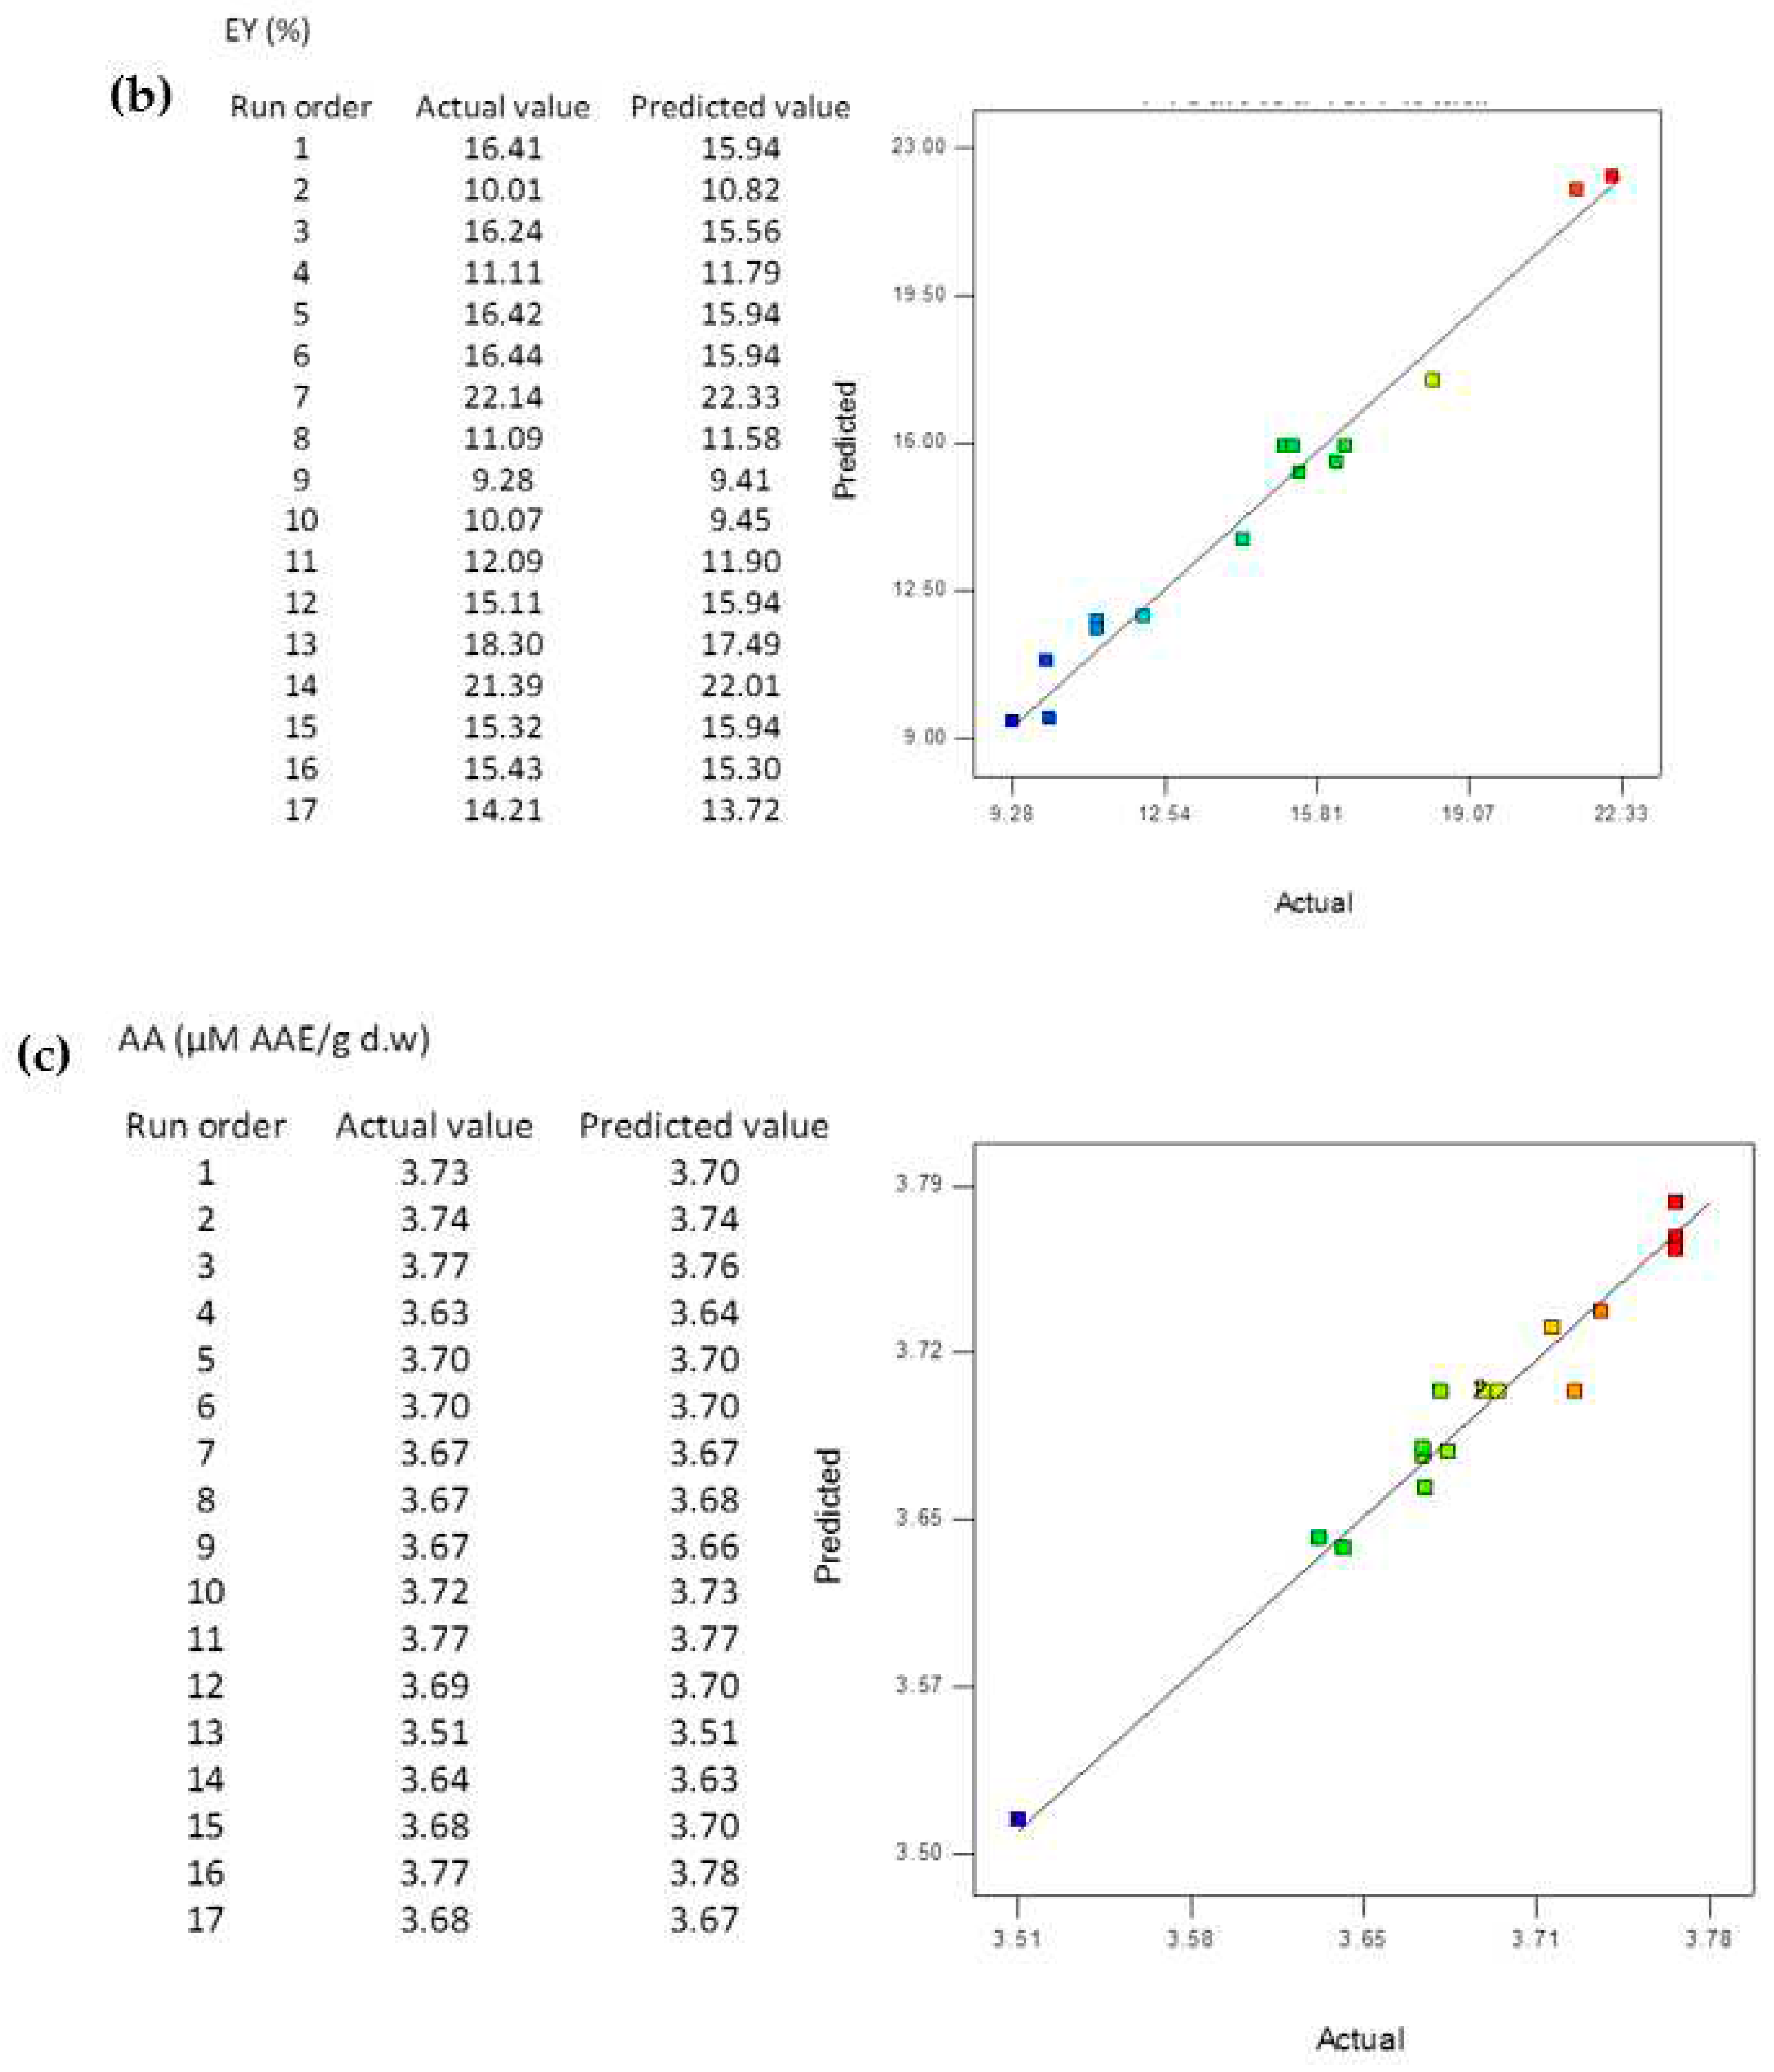
3.3. BBD-RSM modelling, model adequacies and statistical analysis
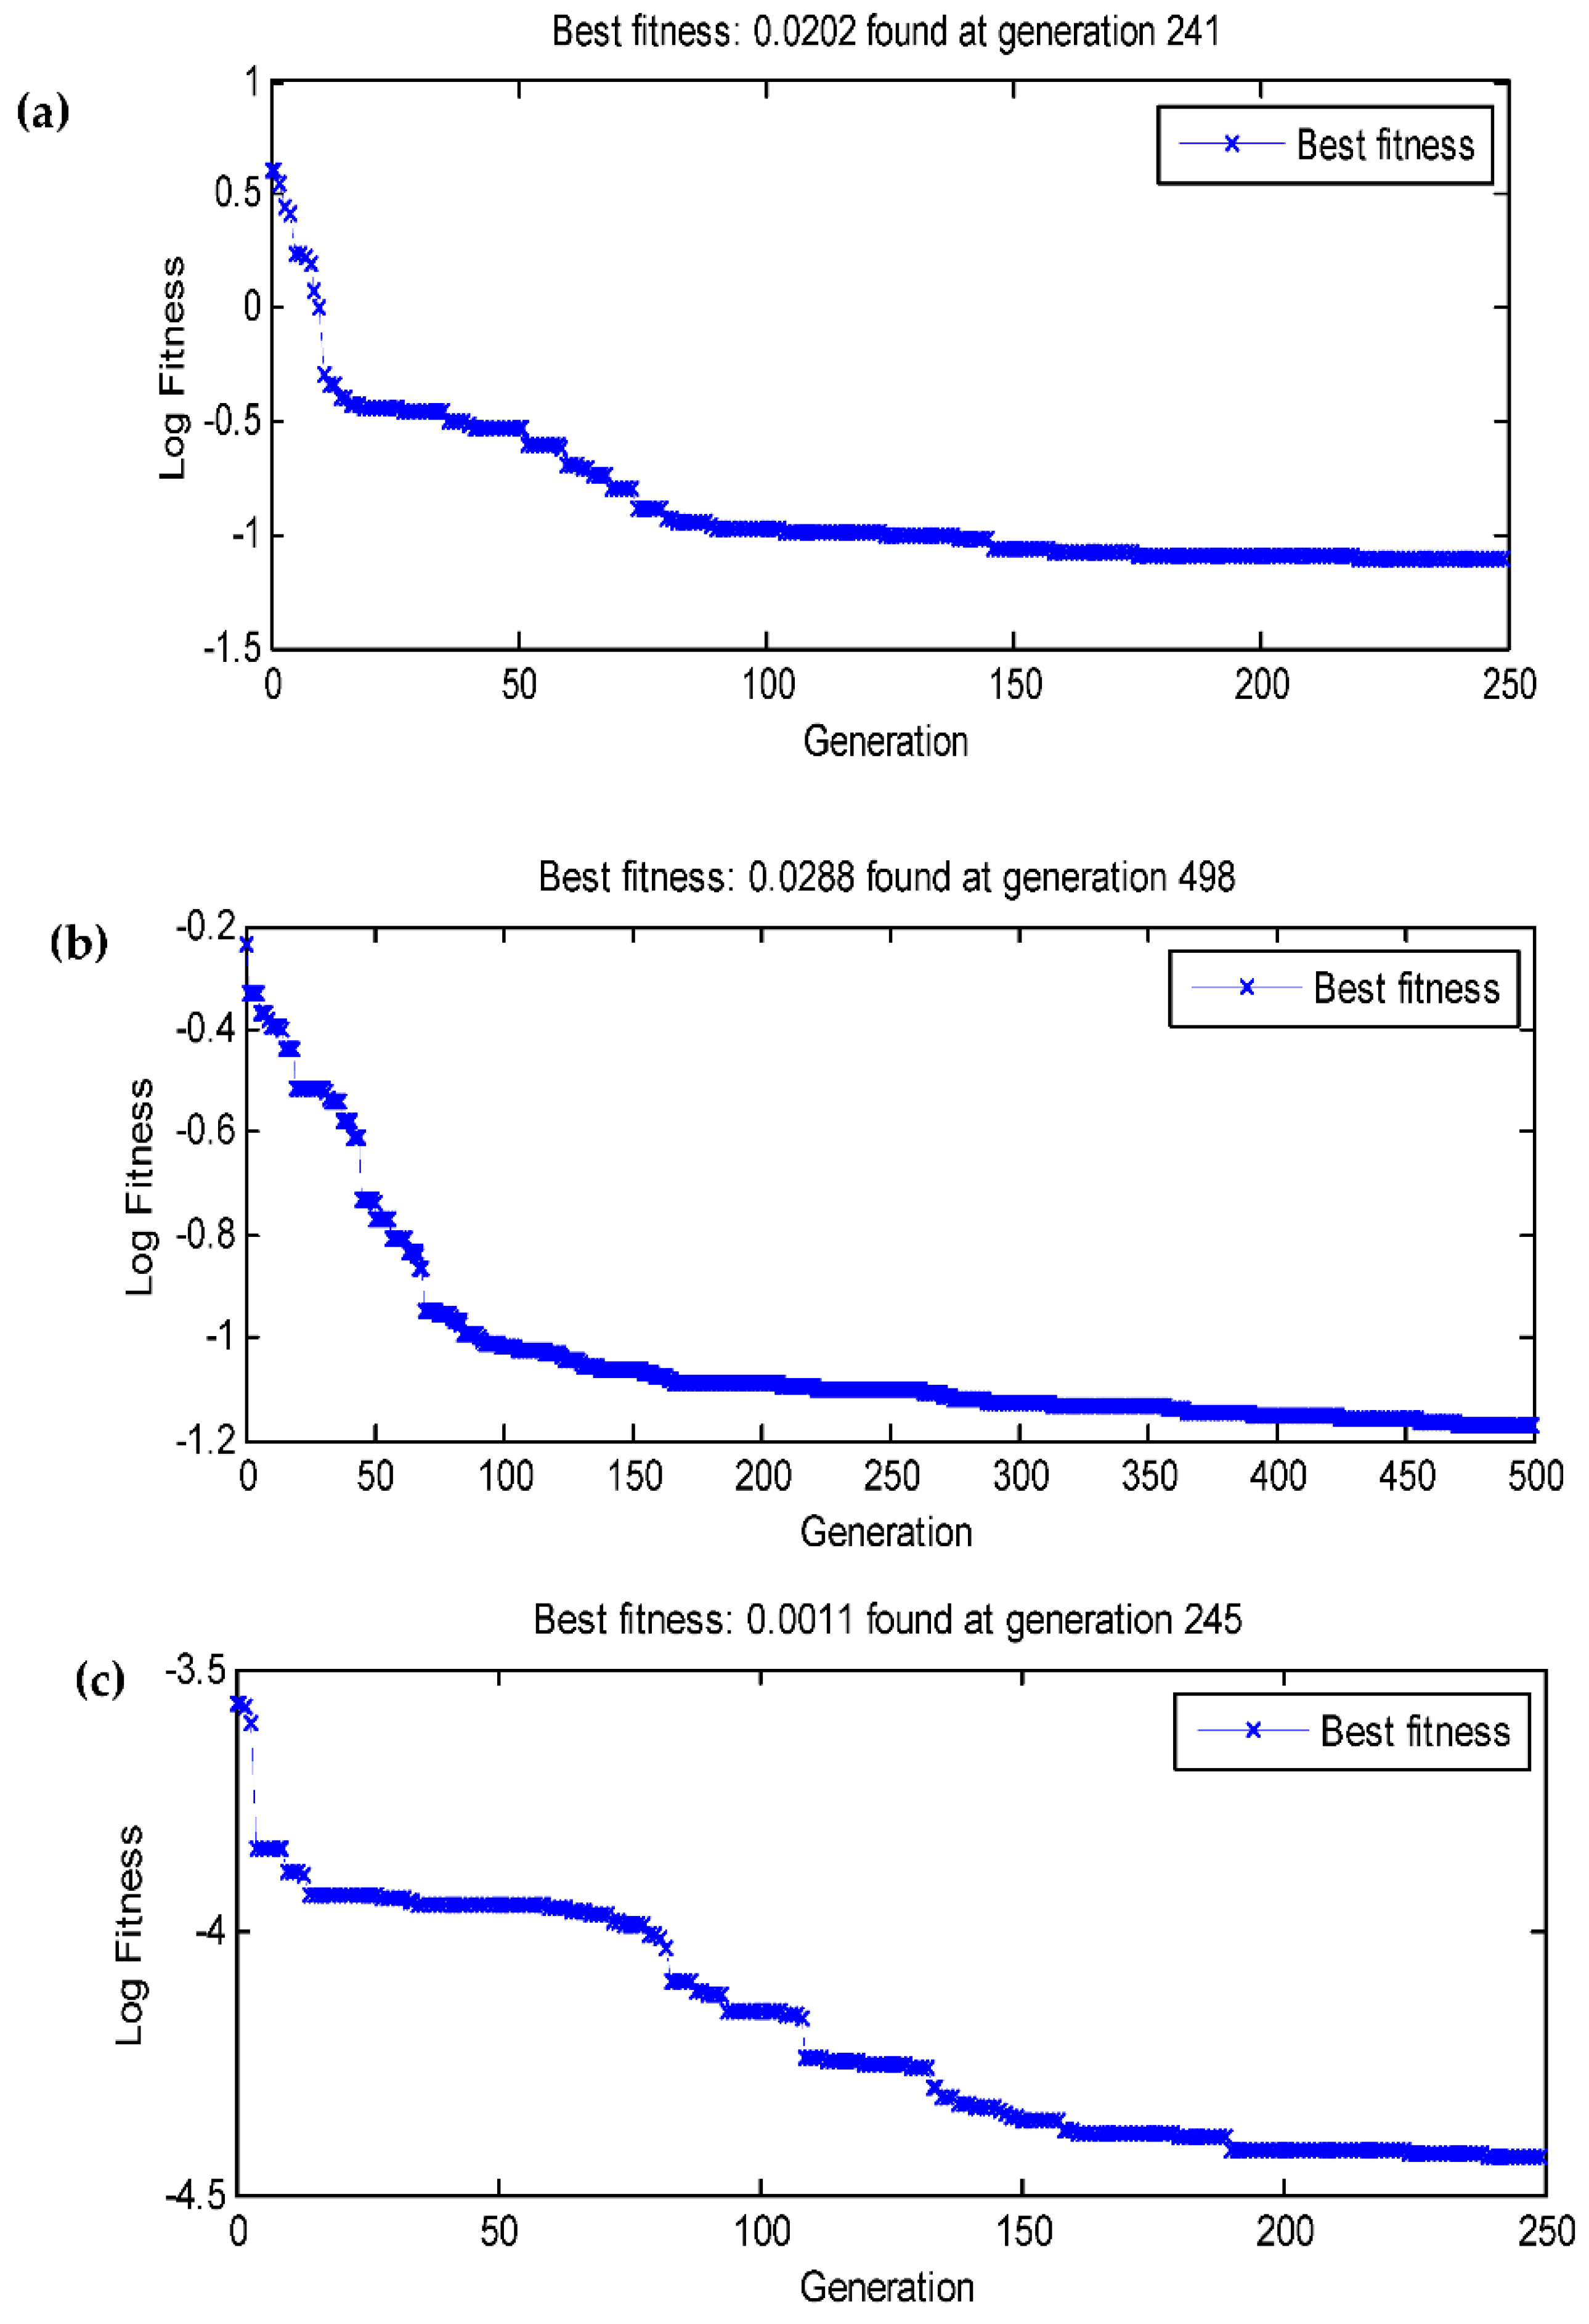
3.4. Data statistics and multi-gene genetic programming modelling
3.5. Comparison of the BBD-RSM and MGGP - based predictive models
3.6. Numerical optimization and validation
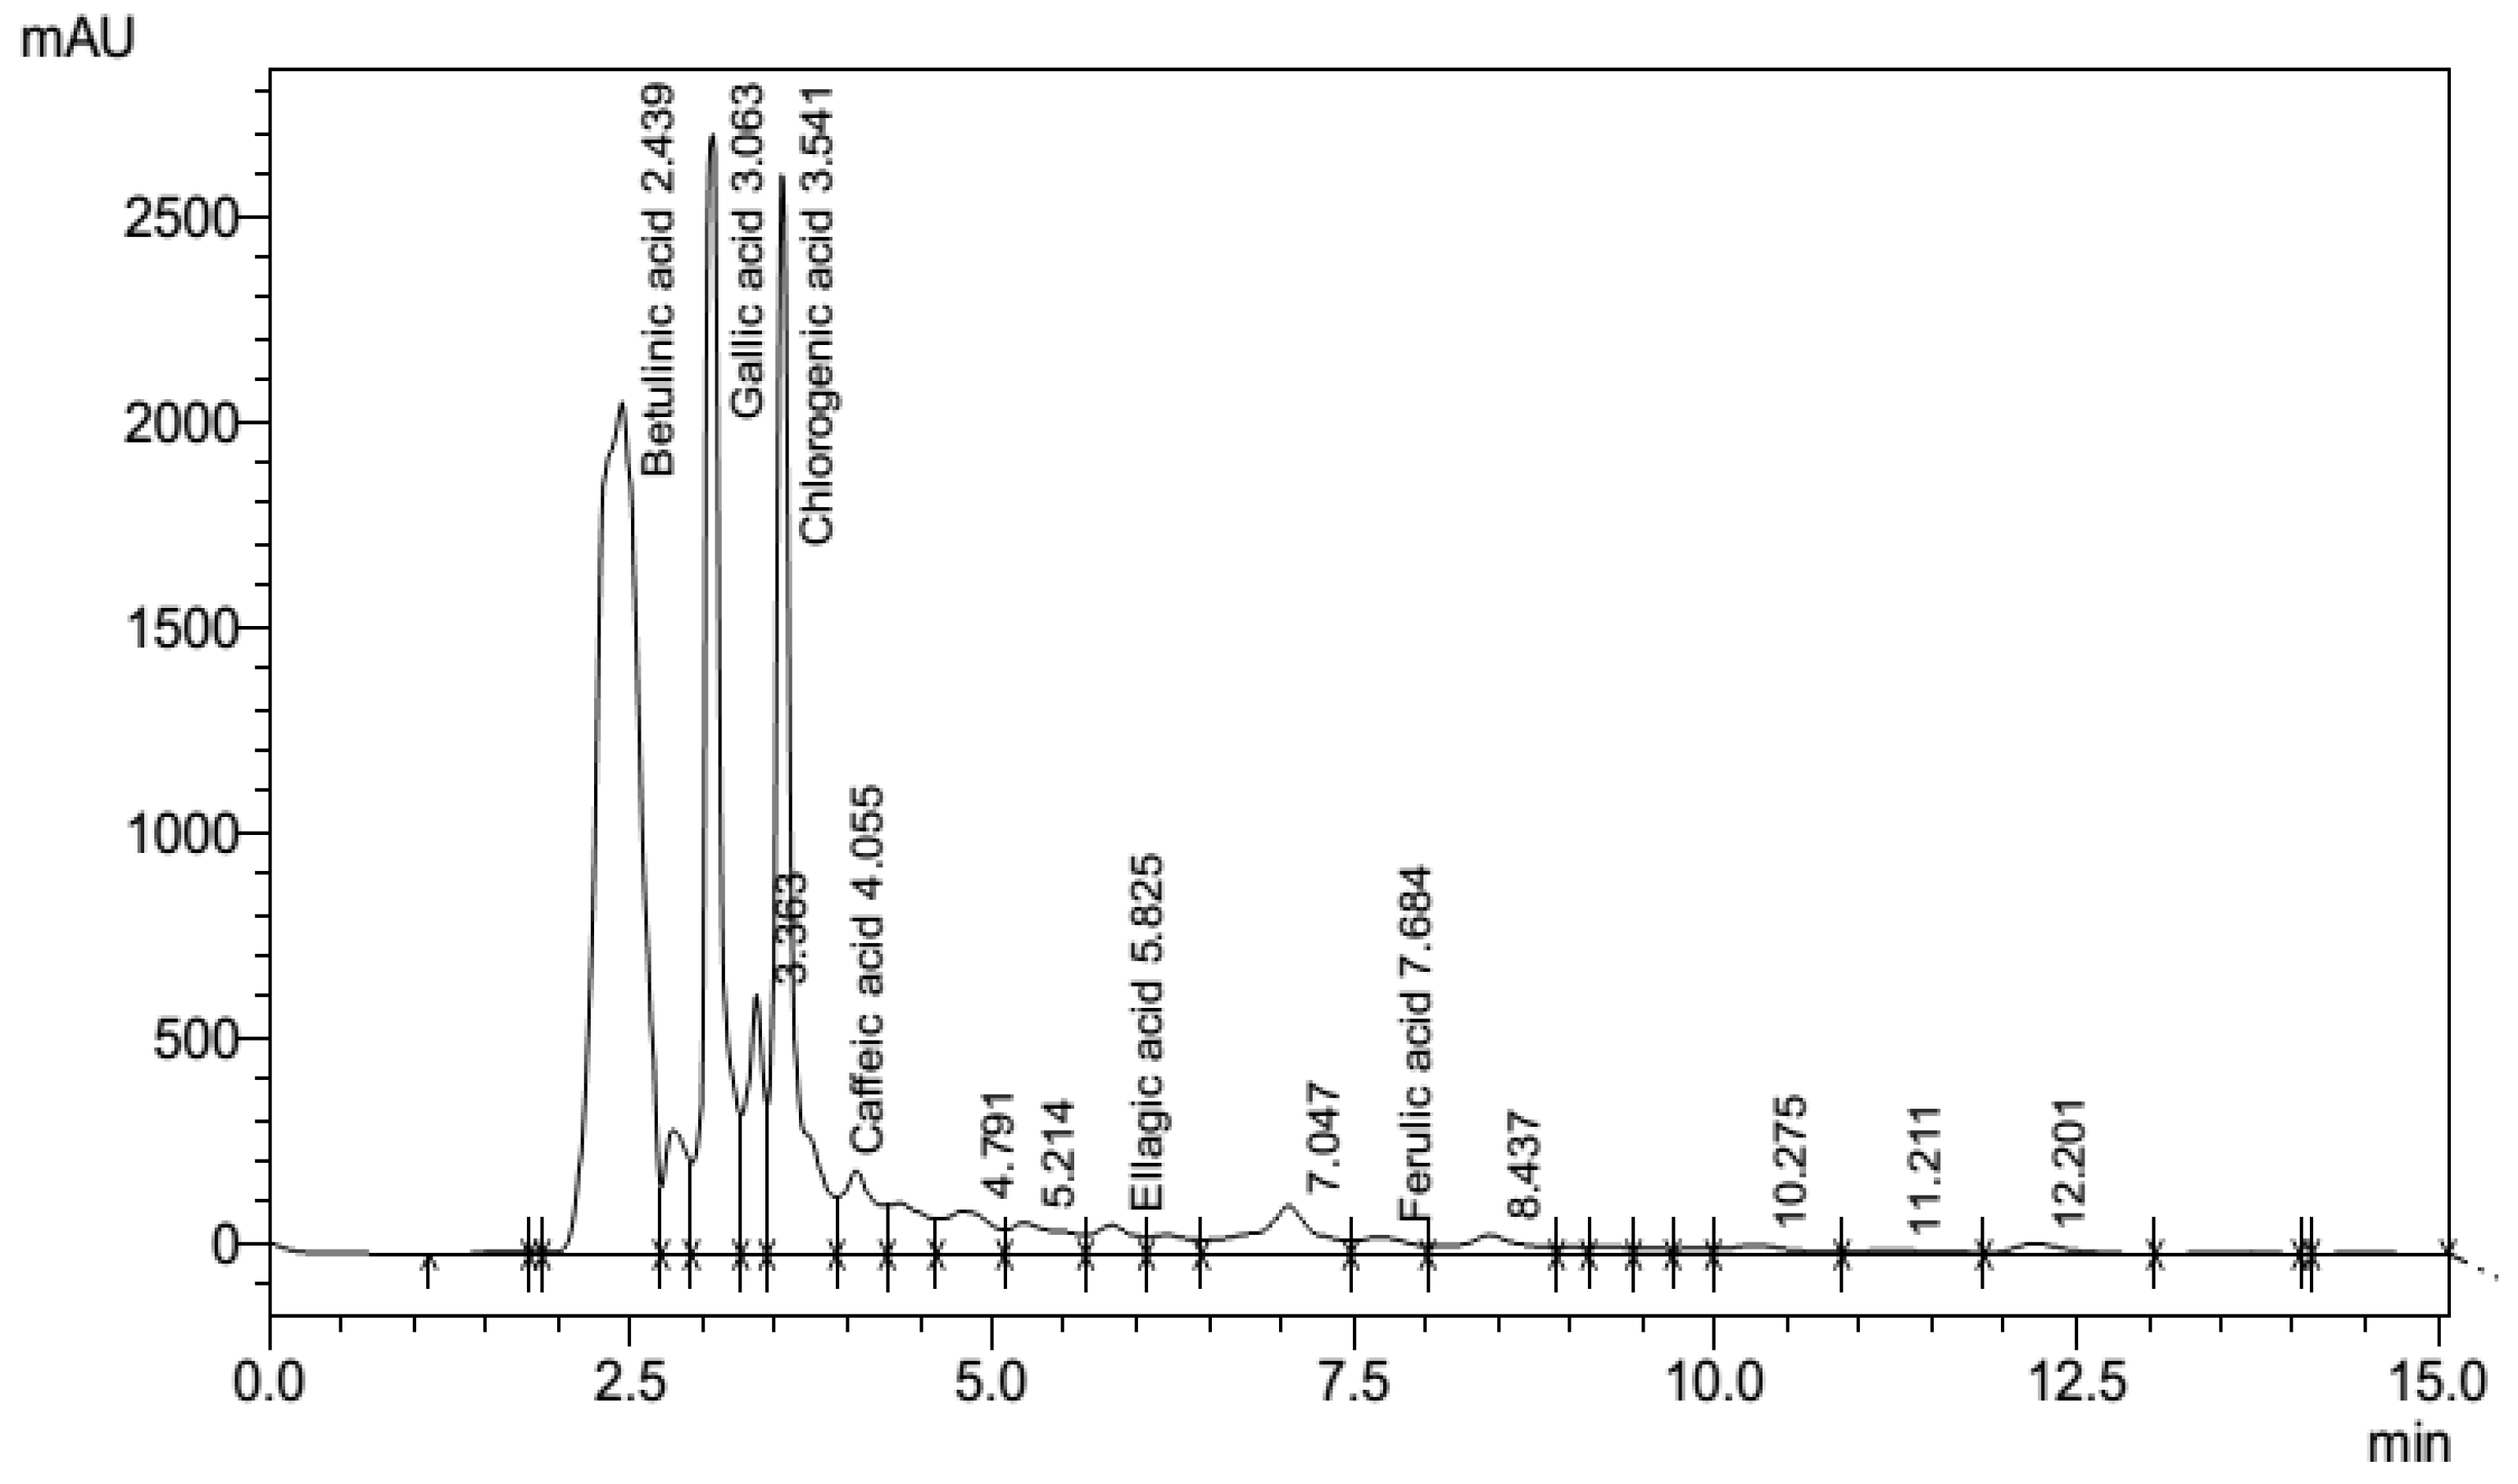
3.7. Phenolic fingerprints of P. emblica leaf extract
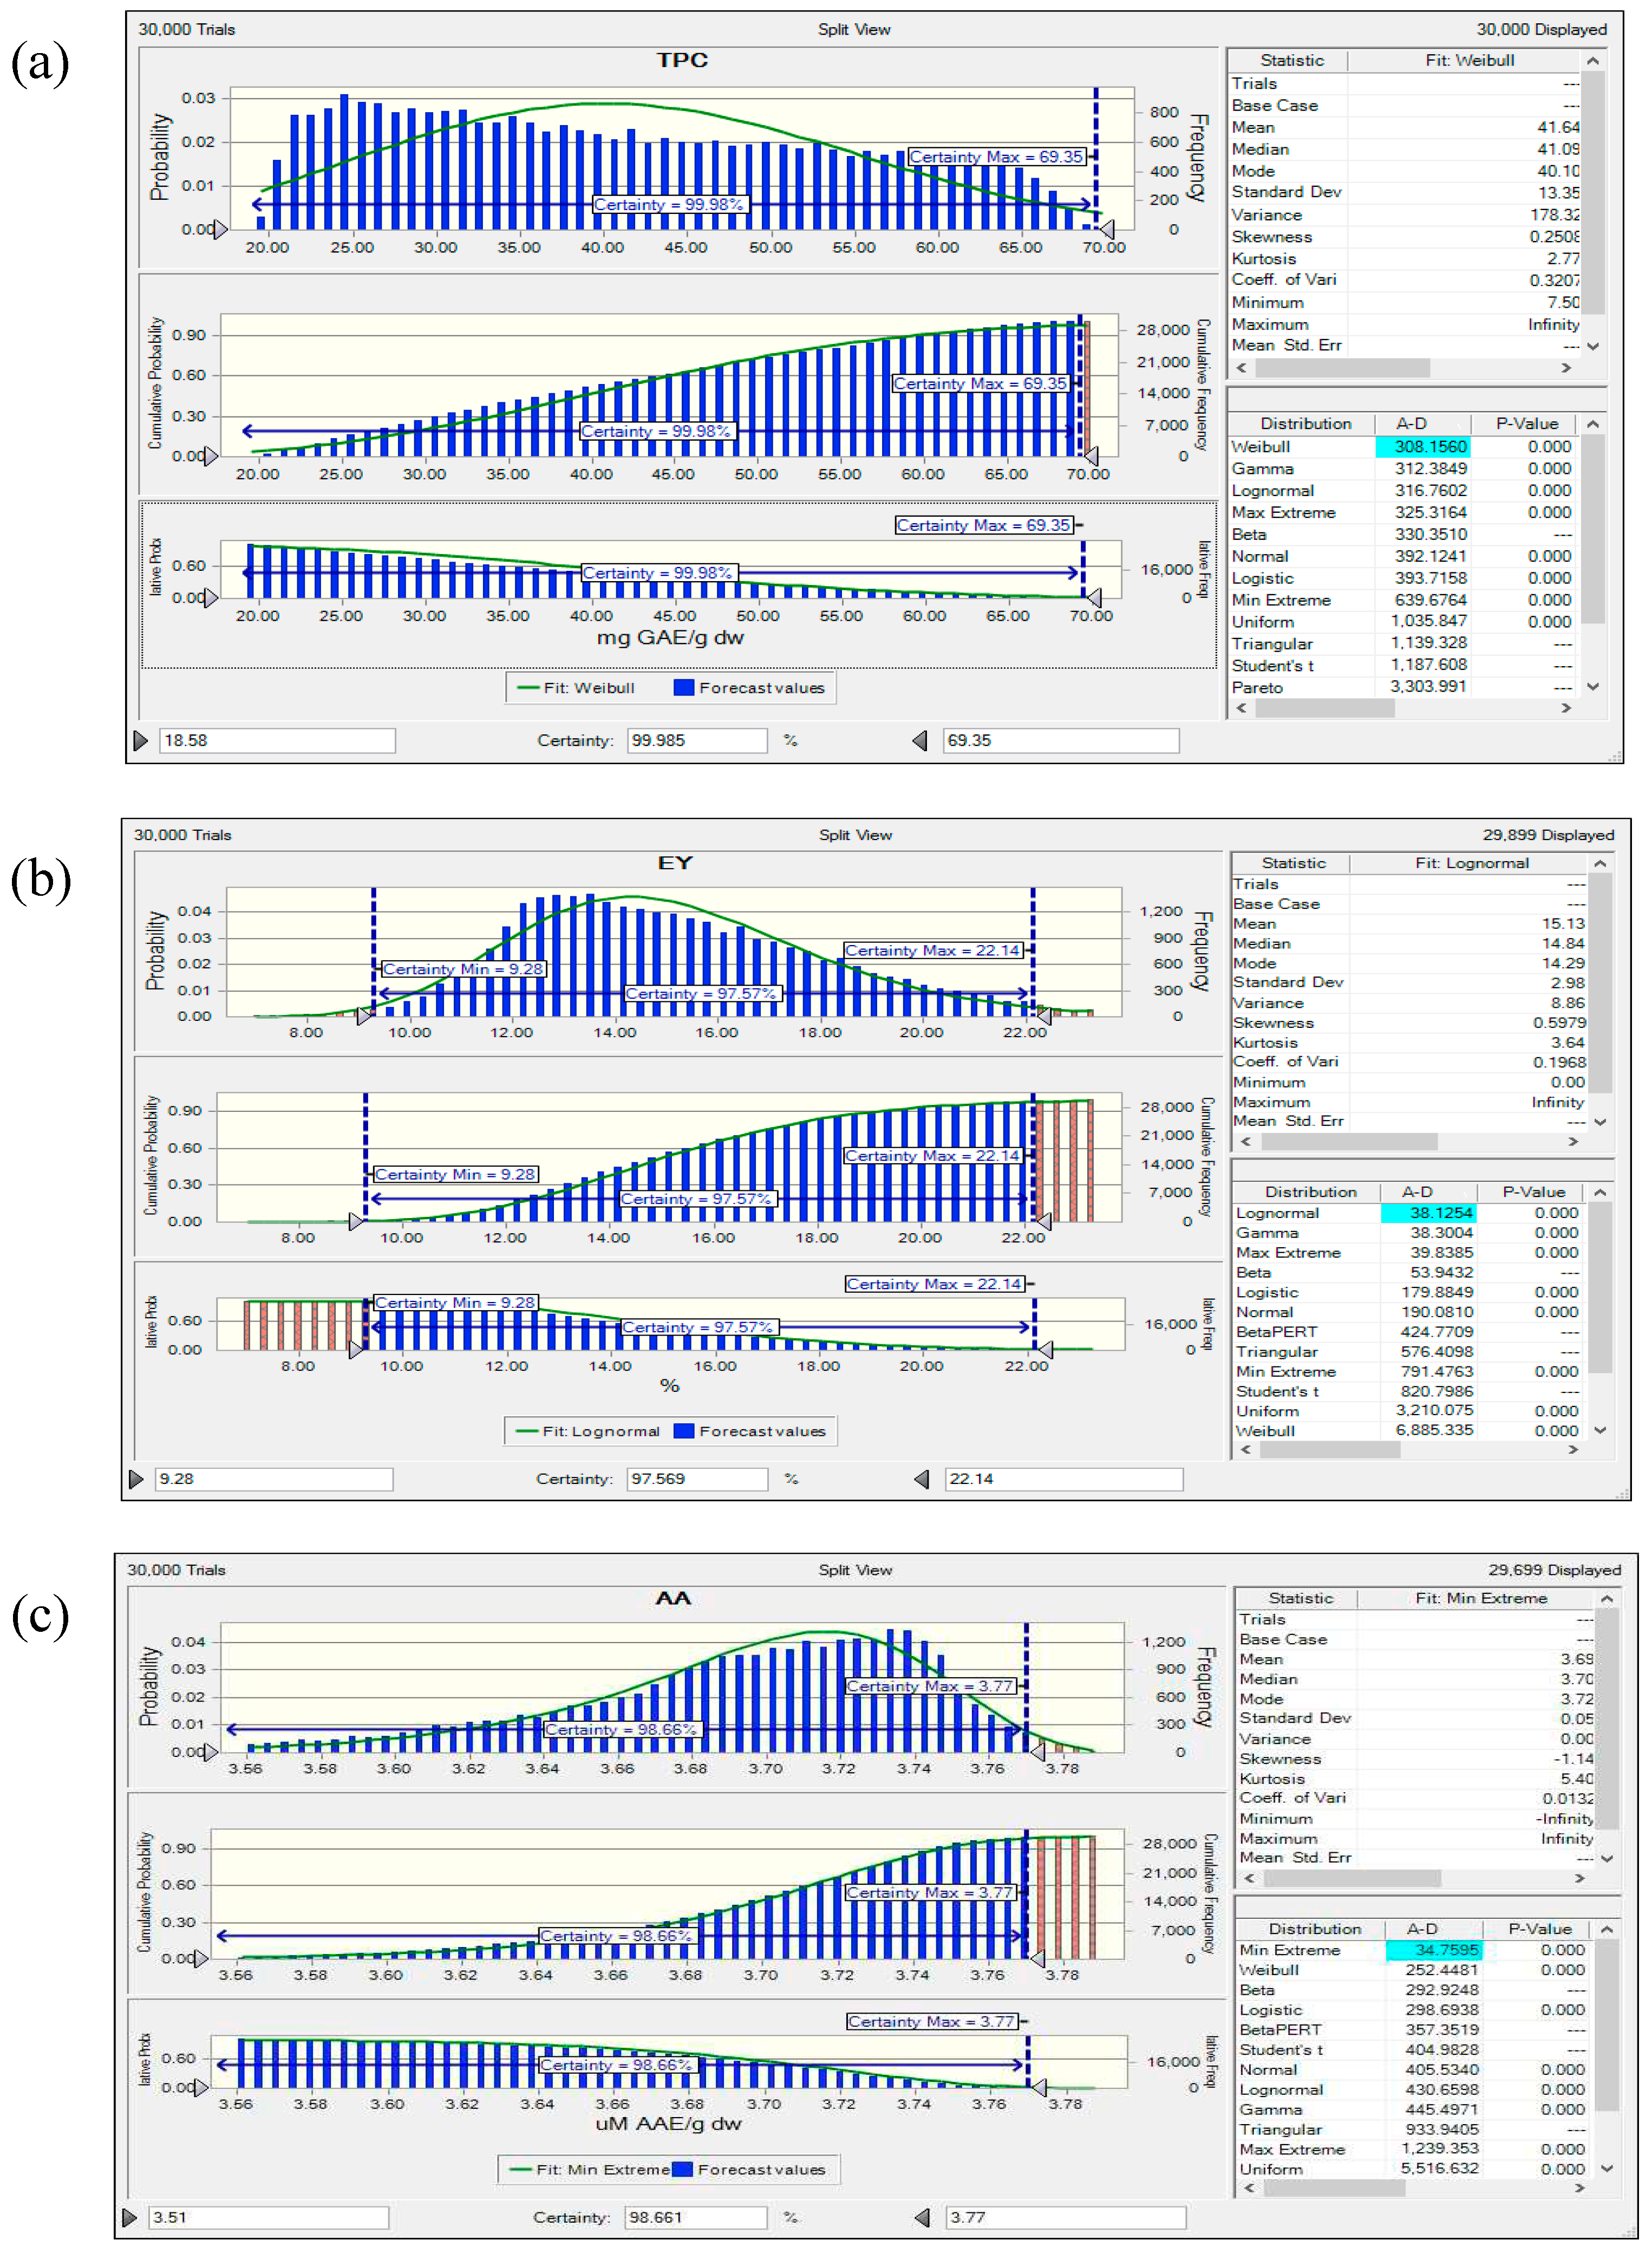
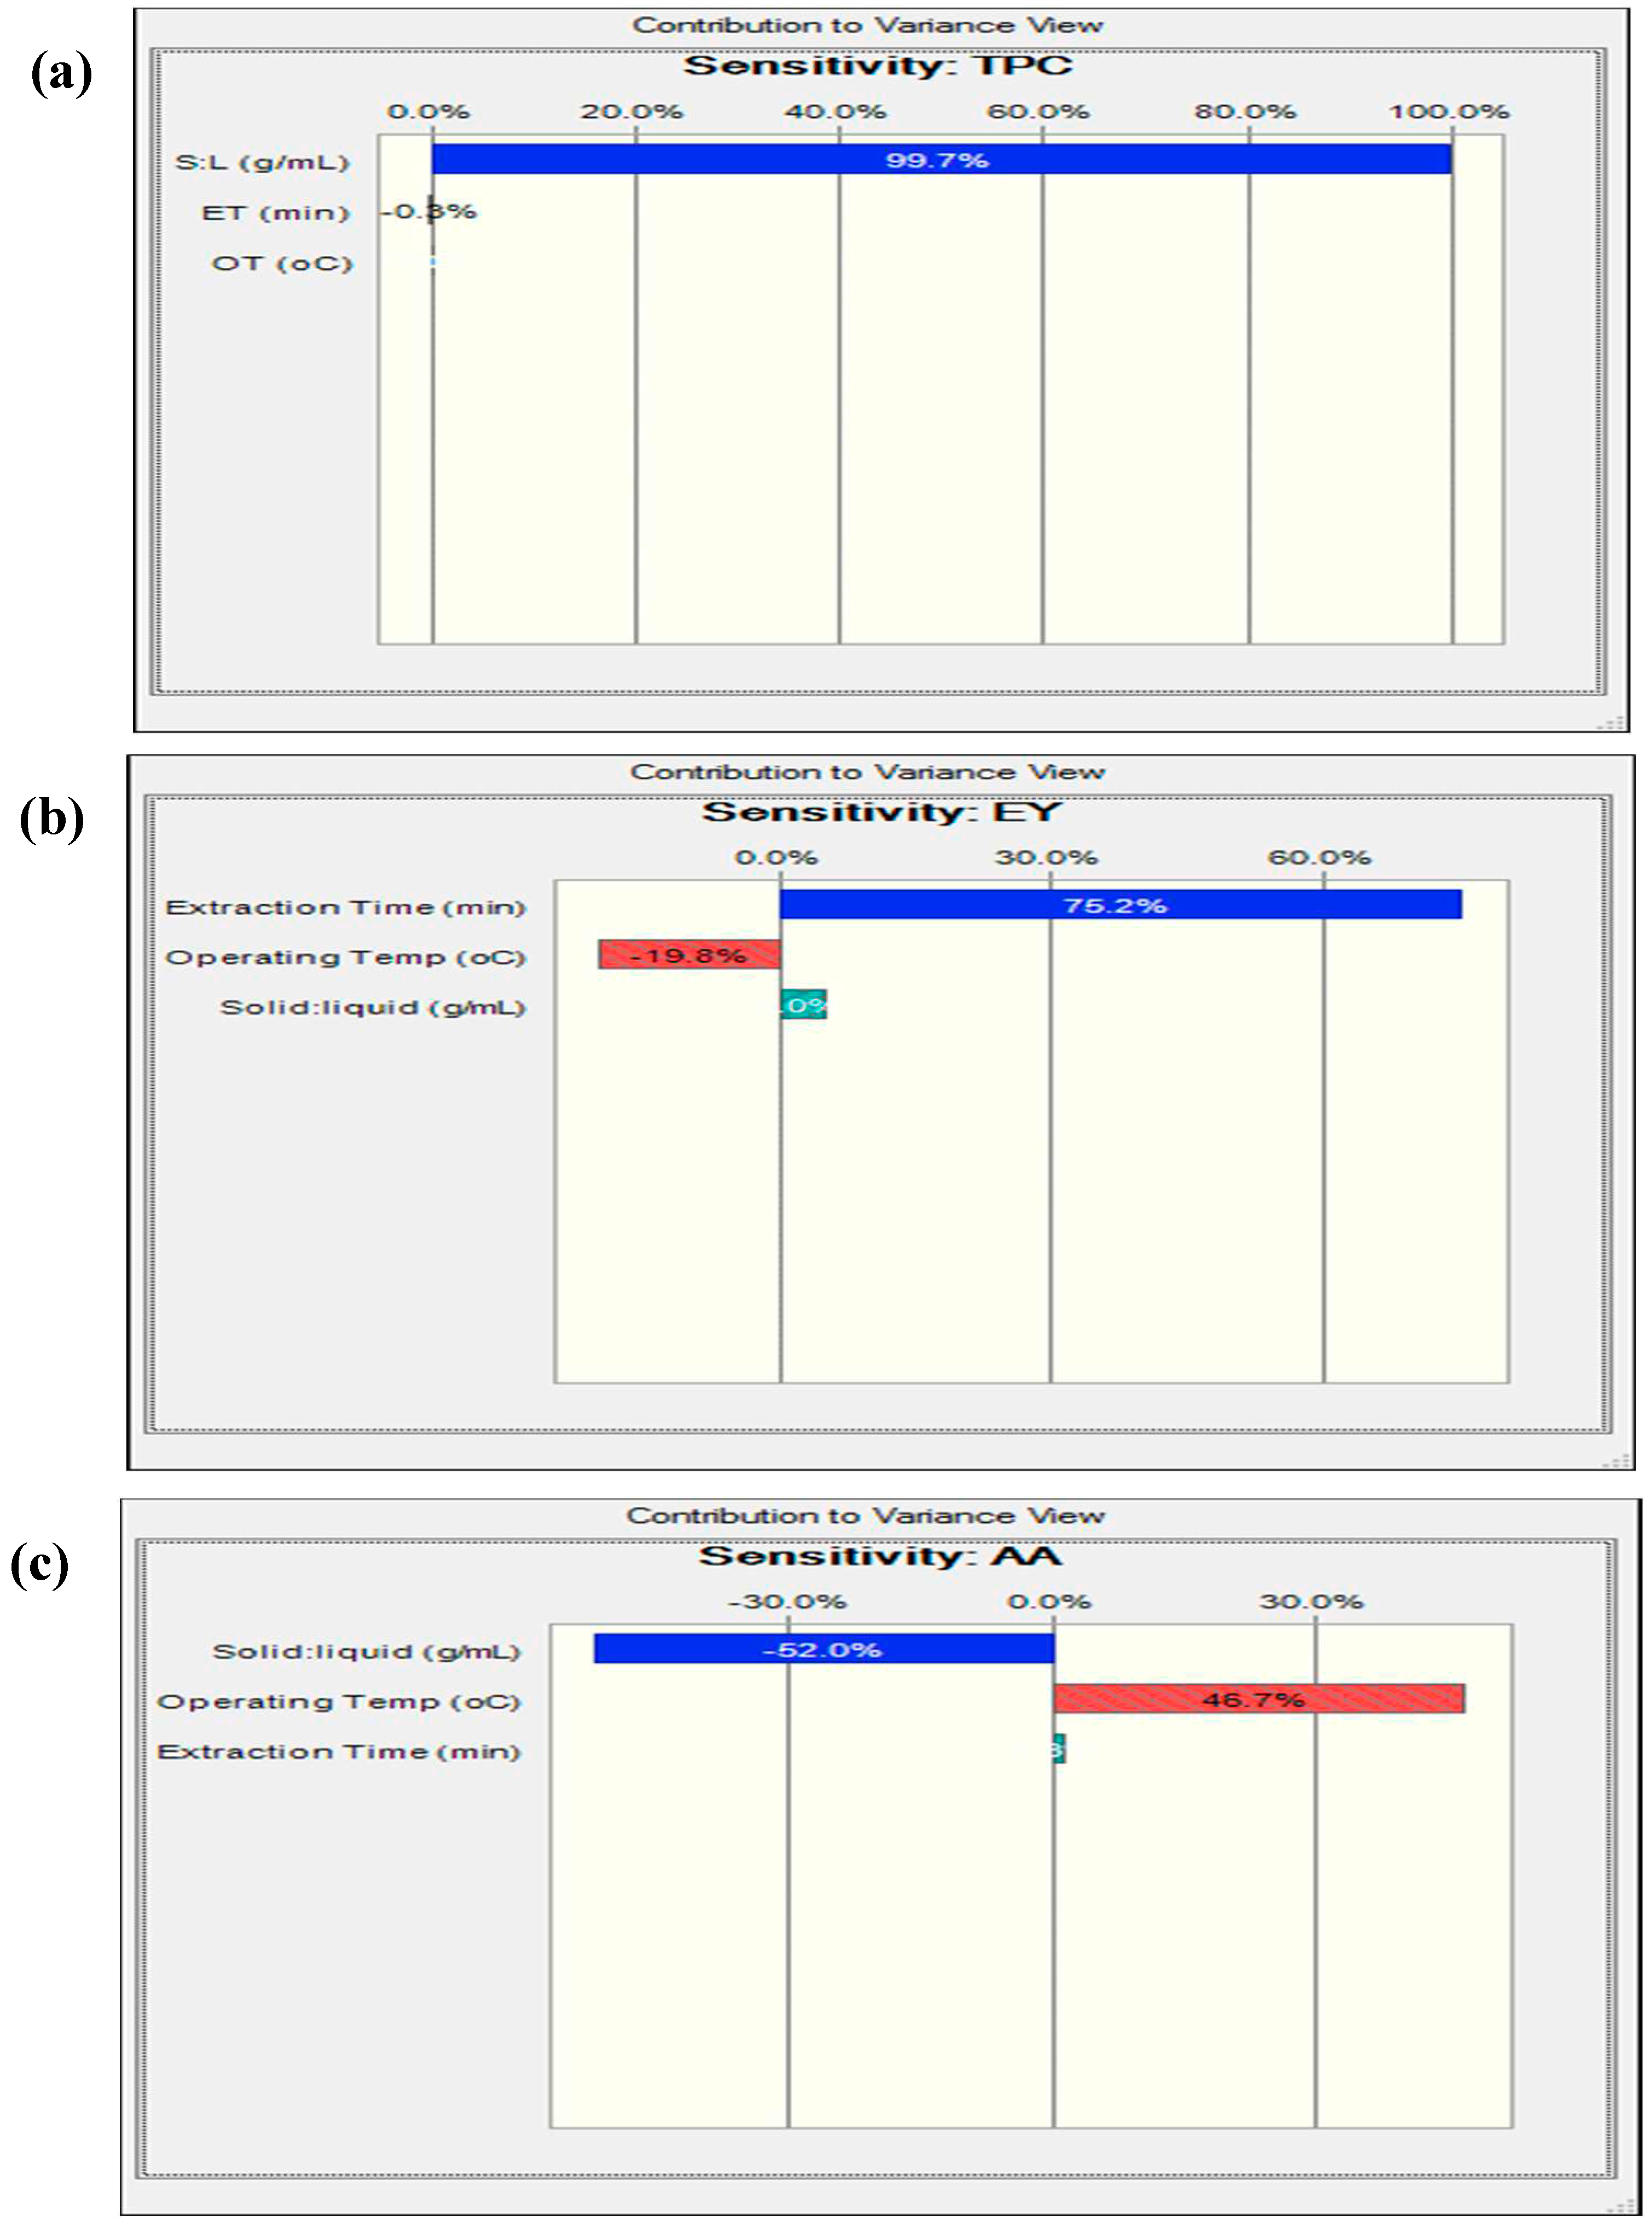
3.8. Reliability Assessment of BBD-RSM based Predictive Models
4.0. Conclusion
Author Contributions
Funding
Data Availability Statement
Acknowledgments
Conflicts of Interest
References
- Saini, R., Sharma, N., Oladeji, O. S., Sourirajan, A., Dev, K., Zengin, G., ... & Kumar, V. (2022). Traditional uses, bioactive composition, pharmacology, and toxicology of Phyllanthus emblica fruits: A comprehensive review. Journal of ethnopharmacology, 282, 114570.
- Ahmad, B., Hafeez, N., Rauf, A., Bashir, S., Linfang, H., Rehman, M. U., ... & Rengasamy, K. R. (2021). Phyllanthus emblica: A comprehensive review of its therapeutic benefits. South African Journal of Botany, 138, 278-310.
- Mirunalini, S., & Krishnaveni, M. (2010). Therapeutic potential of Phyllanthus emblica (amla): the ayurvedic wonder. Journal of basic and clinical physiology and pharmacology, 21(1), 93-105.
- Adeyi, O., Adeyi, A. J., Oke, E. O., Ajayi, O. K., Oyelami, S., Otolorin, J. A., ... & Isola, B. F. (2022). Adaptive neuro fuzzy inference system modeling of Synsepalum dulcificum L. drying characteristics and sensitivity analysis of the drying factors. Scientific Reports, 12(1), 13261.
- Olalere, O. A., Abdurahman, H. N., & Gan, C. Y. (2019). Microwave-enhanced extraction and mass spectrometry fingerprints of polyphenolic constituents in Sesamum indicum leaves. Industrial Crops and Products, 131, 151-159.
- Olalere, O. A., Abdurahman, N. H., bin Mohd Yunus, R., Alara, O. R., & Ahmad, M. M. (2019). Mineral element determination and phenolic compounds profiling of oleoresin extracts using an accurate mass LC-MS-QTOF and ICP-MS. Journal of King Saud University-Science, 31(4), 859-863.
- Olalere, O. A., Gan, C. Y., Taiwo, A. E., Nour, A. H., Dominguez, B. C., Adeyi, O., ... & Adiamo, O. Q. (2023). Heat-reflux processing of black peppercorn into bioactive antioxidant oleoresins: a three-functioned Taguchi-based grey relational grading. Journal of Food Measurement and Characterization, 1-9.
- Chuo, S. C., Nasir, H. M., Mohd-Setapar, S. H., Mohamed, S. F., Ahmad, A., Wani, W. A., ... & Alarifi, A. (2022). A glimpse into the extraction methods of active compounds from plants. Critical reviews in analytical chemistry, 52(4), 667-696.
- Oke, E. O., Adeyi, O., Okolo, B. I., Adeyi, J. A., Ayanyemi, J., Osoh, K. A., & Adegoke, T. S. (2020). Phenolic compound extraction from Nigerian Azadirachta indica leaves: response surface and neuro-fuzzy modelling performance evaluation with Cuckoo search multi-objective optimization. Results in Engineering, 8, 100160.
- Pinela, J., Prieto, M. A., Pereira, E., Jabeur, I., Barreiro, M. F., Barros, L., & Ferreira, I. C. (2019). Optimization of heat-and ultrasound-assisted extraction of anthocyanins from Hibiscus sabdariffa calyces for natural food colorants. Food chemistry, 275, 309-321.
- Tchabo, W., Ma, Y., Kwaw, E., Xiao, L., Wu, M., & T. Apaliya, M. (2018). Impact of extraction parameters and their optimization on the nutraceuticals and antioxidant properties of aqueous extract mulberry leaf. International Journal of Food Properties, 21(1), 717-732.
- Olalere, O. A., & Gan, C. Y. (2021). Investigating the heat stability, calorimetric degradations and chromatographic polyphenolic profiling of edible macerated hog-tree apple leaf (Morinda lucida Benth). Chemical Papers, 75, 1291-1299.
- Alara, O. R., Abdurahman, N. H., Afolabi, H. K., & Olalere, O. A. (2018). Efficient extraction of antioxidants from Vernonia cinerea leaves: Comparing response surface methodology and artificial neural network. Beni-Suef University Journal of Basic and Applied Sciences, 7(3), 276-285.
- Adeyi, A. J., Adeyi, O., Oke, E. O., Olalere, O. A., Oyelami, S., & Ogunsola, A. D. (2021). Effect of varied fiber alkali treatments on the tensile strength of Ampelocissus cavicaulis reinforced polyester composites: Prediction, optimization, uncertainty and sensitivity analysis. Advanced Industrial and Engineering Polymer Research, 4(1), 29-40.
- Adeyi, O., Adeyi, A. J., Oke, E. O., Okolo, B. I., Olalere, A. O., Otolorin, J. A., & Taiwo, A. E. (2021). Techno-economic and uncertainty analyses of heat-and ultrasound-assisted extraction technologies for the production of crude anthocyanins powder from Hibiscus sabdariffa calyx. Cogent Engineering, 8(1), 1947015.
- Adeyi, O., Adeyi, A. J., Oke, E. O., Okolo, B. I., Olalere, O. A., Taiwo, A. E., ... & Ogunsola, A. D. (2023). Heat-assisted extraction of phenolic-rich bioactive antioxidants from Enantia chlorantha stem bark: multi-objective optimization, integrated process techno-economics and profitability risk assessment. SN Applied Sciences, 5(6), 153.
- Olalere, O. A., & Gan, C. Y. (2023). Process optimisation of defatted wheat germ protein extraction in a novel alkaline-based deep eutectic solvent (DES) via Box–Behnken experimental design (BBD). Food Chemistry, 409, 135224.
- Rajewski, J., & Dobrzyńska-Inger, A. (2021). Application of response surface methodology (RSM) for the optimization of chromium (III) synergistic extraction by supported liquid membrane. Membranes, 11(11), 854.
- Alenezi, H., & Al-Qabandi, O. (2023). Prediction of adsorption parameters for hydrogen sulfide removal from synthetic wastewater using Box-Behnken design. Journal of Engineering Research, 11(2), 100067.
- Bezerra, M. A., Santelli, R. E., Oliveira, E. P., Villar, L. S., & Escaleira, L. A. (2008). Response surface methodology (RSM) as a tool for optimization in analytical chemistry. Talanta, 76(5), 965-977.
- Breig, S. J. M., & Luti, K. J. K. (2021). Response surface methodology: A review on its applications and challenges in microbial cultures. Materials Today: Proceedings, 42, 2277-2284.
- Alara, O. R., Abdurahman, N. H., & Olalere, O. A. (2018). Optimization of microwave-assisted extraction of flavonoids and antioxidants from Vernonia amygdalina leaf using response surface methodology. Food and bioproducts processing, 107, 36-48.
- Kumari, M., & Gupta, S. K. (2019). Response surface methodological (RSM) approach for optimizing the removal of trihalomethanes (THMs) and its precursor’s by surfactant modified magnetic nanoadsorbents (sMNP)-An endeavor to diminish probable cancer risk. Scientific Reports, 9(1), 1-11.
- Gandomi, A. H., & Alavi, A. H. (2012)a. A new multi-gene genetic programming approach to non-linear system modeling. Part II: geotechnical and earthquake engineering problems. Neural Computing and Applications, 21, 189-201.
- Gandomi, A. H., & Alavi, A. H. (2012)b. A new multi-gene genetic programming approach to nonlinear system modeling. Part I: materials and structural engineering problems. Neural Computing and Applications, 21, 171-187.
- Niazkar, M. (2023). Multigene genetic programming and its various applications. Handbook of Hydroinformatics, 321-332.
- Kusznir, T., & Smoczek, J. (2022). Multi-Gene Genetic Programming-Based Identification of a Dynamic Prediction Model of an Overhead Traveling Crane. Sensors, 22(1), 339.
- Ghareeb, W. T., & El Saadany, E. F. (2013, October). Multi-gene genetic programming for short term load forecasting. In 2013 3rd International Conference On Electric Power And Energy Conversion Systems (pp. 1-5). IEEE.
- Haroonabadi, H., & Haghifam, M. R. (2011). Generation reliability assessment in power markets using Monte Carlo simulation and soft computing. Applied Soft Computing, 11(8), 5292-5298.
- Dao, D. V., Adeli, H., Ly, H. B., Le, L. M., Le, V. M., Le, T. T., & Pham, B. T. (2020). A sensitivity and robustness analysis of GPR and ANN for high-performance concrete compressive strength prediction using a Monte Carlo simulation. Sustainability, 12(3), 830.
- Olalere, O. A., & Gan, C. Y. (2021). Microwave-assisted extraction of phenolic compounds from Euphorbia hirta leaf and characterization of its morphology and thermal stability. Separation Science and Technology, 56(11), 1853-1865.
- Huaman-Castilla, N. L., Martínez-Cifuentes, M., Camilo, C., Pedreschi, F., Mariotti-Celis, M., & Pérez-Correa, J. R. (2019). The impact of temperature and ethanol concentration on the global recovery of specific polyphenols in an integrated HPLE/RP process on Carménère pomace extracts. Molecules, 24(17), 3145.
- Altıok, E., Bayçın, D., Bayraktar, O., & Ülkü, S. (2008). Isolation of polyphenols from the extracts of olive leaves (Olea europaea L.) by adsorption on silk fibroin. Separation and Purification Technology, 62(2), 342-348.
- Cheaib, D., El Darra, N., Rajha, H. N., Maroun, R. G., & Louka, N. (2018). Systematic and empirical study of the dependence of polyphenol recovery from apricot pomace on temperature and solvent concentration levels. The Scientific World Journal, 2018.
- Mohammadi Bayazidi, A., Wang, G. G., Bolandi, H., Alavi, A. H., & Gandomi, A. H. (2014). Multigene genetic programming for estimation of elastic modulus of concrete. Mathematical Problems in Engineering, 2014.
- Noh, H., Kwon, S., Seo, I. W., Baek, D., & Jung, S. H. (2020). Multi-gene genetic programming regression model for prediction of transient storage model parameters in natural rivers. Water, 13(1), 76.
- Ghattas, B., & Manzon, D. (2023). Machine Learning Alternatives to Response Surface Models. Mathematics, 11(15), 3406.
- Yu, M., Gouvinhas, I., Rocha, J., & Barros, A. I. (2021). Phytochemical and antioxidant analysis of medicinal and food plants towards bioactive food and pharmaceutical resources. Scientific reports, 11(1), 10041.
- Tsang, M.S., Jiao, D., Chan, B.C., Hon, K.L., Leung, P.C., Lau, C.B., Wong, E.C., Cheng, L., Chan, C.K., Lam, C.W. and Wong, C.K., (2016). Anti-inflammatory activities of pentaherbs formula, berberine, gallic acid and chlorogenic acid in atopic dermatitis-like skin inflammation. Molecules, 21(4), p.519.
- Ranjha, M.M.A.N., Shafique, B., Wang, L., Irfan, S., Safdar, M.N., Murtaza, M.A., Nadeem, M., Mahmood, S., Mueen-ud-Din, G. and Nadeem, H.R., (2021). A comprehensive review on phytochemistry, bioactivity and medicinal value of bioactive compounds of pomegranate (Punica granatum). Advances in Traditional Medicine, pp.1-21.
- Gupta, A., Atanasov, A.G., Li, Y., Kumar, N. and Bishayee, A., (2022). Chlorogenic acid for cancer prevention and therapy: Current status on efficacy and mechanisms of action. Pharmacological Research, p.106505.
- Manivel, P., & Chen, X. (2021). Chlorogenic, Caffeic, and Ferulic Acids and Their Derivatives in Foods. Handbook of Dietary Phytochemicals, 1033-1063.
| Parameter | Value |
| Population size range | 100, 250, 500 |
| Number of generation range | 100, 250, 500 |
| Tournament size Maximum tree depth |
4 |
| Elitism fraction | 0.25 of population |
| Termination value | 0.001 |
| Maximum gene Crossover event Mutation event Subtree mutation |
5 |
| Node Function | Minus, times , rdivide, plus, plog, psqroot, tanh, square, pdivide, iflte, exp, sin, cos |
| S/N | Solvent | Extract yield (%) | Total phenolic content (mg GAE/g d.w) | Antioxidant activity (μM AAE/g d.w) |
| 1 | Absolute ethanol | 5.87±0.01 | 13.67±0.04 | 1.98±0.11 |
| 2 | 80% ethanol solution | 8.41±0.25 | 20.10±0.12 | 2.99±0.05 |
| 3 | 60% ethanol solution | 11.36±0.08 | 23.76±0.04 | 3.66±0.09 |
| 4 | 50% ethanol solution | 12.07±0.02 | 24.25±0.03 | 3.76±0.01 |
| 5 | 40% ethanol solution | 11.11±0.03 | 22.98±0.12 | 3.52±0.11 |
| 6 | 20% ethanol solution | 8.67±0.13 | 19.73±0.02 | 3.31±0.10 |
| 7 | 100% distilled water | 8.33±0.19 | 19.11±0.02 | 2.81±001 |
| Run | Extraction conditions | Response values | ||||
| OT (oC) | S:L (g/mL) | ET (min) | EY (w/w %) | TPC (mg GAE/g d.w) | AA (µM AAE/g) | |
| 1 | 40.00 | 1:40 | 112.50 | 15.11 | 39.83 | 3.69 |
| 2 | 30.00 | 1:20 | 112.50 | 14.21 | 18.58 | 3.68 |
| 3 | 40.00 | 1:40 | 112.50 | 16.41 | 39.10 | 3.73 |
| 4 | 30.00 | 1:60 | 112.50 | 18.30 | 67.34 | 3.51 |
| 5 | 40.00 | 1:60 | 180.00 | 22.14 | 67.75 | 3.67 |
| 6 | 40.00 | 1:20 | 45.00 | 12.09 | 24.28 | 3.77 |
| 7 | 40.00 | 1:20 | 180.00 | 15.43 | 21.17 | 3.77 |
| 8 | 50.00 | 1:20 | 112.50 | 10.01 | 20.38 | 3.74 |
| 9 | 40.00 | 1:40 | 112.50 | 15.32 | 38.93 | 3.68 |
| 10 | 30.00 | 1:40 | 180.00 | 21.39 | 41.90 | 3.64 |
| 11 | 40.00 | 1:60 | 45.00 | 9.28 | 69.35 | 3.67 |
| 12 | 30.00 | 1:40 | 45.00 | 11.11 | 40.83 | 3.63 |
| 13 | 40.00 | 1:40 | 112.50 | 16.42 | 39.01 | 3.70 |
| 14 | 50.00 | 1:60 | 112.50 | 11.09 | 63.35 | 3.67 |
| 15 | 40.00 | 1:40 | 112.50 | 16.44 | 38.93 | 3.70 |
| 16 | 50.00 | 1:40 | 180.00 | 16.24 | 36.91 | 3.77 |
| 17 | 50.00 | 1:40 | 45.00 | 10.07 | 42.73 | 3.72 |
| Source | TPC (mg GAE/g d.w) | EY (%) | AA (µM AAE/g d.w) | |||||||||
| Sum of squares | df | F-value | P-value P>F | Sum of squares | df | F-value | P-value P>F | Sum of squares | df | F-value | P-value P>F | |
| Model | 4340.17 | 9 | 4947.4 | <0.0001 | 225.75 | 9 | 32.58 | <0.0001 | 0.062 | 9 | 22.86 | 0.0002 |
| A - OT | 3.48 | 1 | 35.71 | 0.0006 | 38.72 | 1 | 50.29 | 0.0002 | 0.025 | 1 | 80.77 | <0.0001 |
| B – S:L | 11.21 | 1 | 115.01 | <0.0001 | 133.25 | 1 | 173.1 | < 0.0001 | 4 E-004 | 1 | 1.38 | 0.2778 |
| C - ET | 4203.67 | 1 | 4203.6 | <0.0001 | 10.28 | 1 | 13.35 | 0.0081 | 0.024 | 1 | 79.32 | <0.0001 |
| A2 | 3.38 | 1 | 34.66 | 0.0006 | 6.95 | 1 | 9.03 | 0.0198 | 6 E-003 | 1 | 22.57 | 0.0021 |
| B2 | 22.64 | 1 | 234.31 | <0.0001 | 9.5E-003 | 1 | 0.012 | 0.9147 | 3 E-003 | 1 | 12.39 | 0.0097 |
| C2 | 72.45 | 1 | 743.32 | <0.0001 | 6.61 | 1 | 8.58 | 0.0221 | 4 E-004 | 1 | 1.35 | 0.2842 |
| AB | 11.88 | 1 | 121.86 | <0.0001 | 4.22 | 1 | 5.48 | 0.0517 | 3 E-004 | 1 | 1.25 | 0.3001 |
| AC | 8.38 | 1 | 85.98 | <0.0001 | 2.27 | 1 | 2.94 | 0.1300 | 2 E-003 | 1 | 8.23 | 0.0240 |
| BC | 0.58 | 1 | 5.90 | 0.0455 | 22.66 | 1 | 29.43 | 0.0010 | 2 E-007 | 1 | 8.2E-004 | 0.9779 |
| Residual | 0.68 | 7 | 5.39 | 7 | 2 E-003 | 7 | ||||||
| Lack of fit | 0.10 | 3 | 0.23 | 0.8693 | 3.62 | 3 | 2.72 | 0.1793 | 6 E-004 | 3 | 0.60 | 0.6473 |
| Pure error | 0.58 | 4 | 1.77 | 4 | 1 E-003 | 3 | ||||||
| Cor. Total | 4340.85 | 16 | 231.14 | 16 | 0.065 | 16 | ||||||
| CV% | 0.75 | 5.94 | 0.47 | |||||||||
| PRESS | 2.53 | 60.62 | 0.013 | |||||||||
| Adeq Precision | 211.576 | 19.201 | 20.041 | |||||||||
| R2 | 0.9998 | 0.9967 | 0.9671 | |||||||||
| Adj R2 | 0.9996 | 0.9467 | 0.9248 | |||||||||
| Pred R2 | 0.9994 | 0.7077 | 0.8009 | |||||||||
| Statistical parameters | OT (oC) | S:L (g/mL) | ET (min) | EY (w/w %) | TPC (mg GAE/g d.w) | AA (µM AAE/g) |
| Mean | 40 | 40 | 112.5 | 14.7682352 | 41.7864705 | 3.6905882 |
| Standard error | 1.7149858 | 3.4299717 | 11.5761544 | 0.9218337 | 3.9948426 | 0.0153745 |
| Median | 40 | 40 | 112.5 | 15.32 | 39.1 | 3.69 |
| Mode | 40 | 40 | 112.5 | N/A | 38.93 | 3.67 |
| Standard Deviation | 7.0710678 | 14.1421356 | 47.7297077 | 3.8008177 | 16.4711581 | 0.0633907 |
| Sample Variance | 50 | 200 | 2278.1250 | 14.4462154 | 271.2990492 | 0.0040183 |
| Kurtosis | -0.7428571 | - 0.7428571 | - 0.7428571 | - 0.4367377 | - 0.6261143 | 3.1818297 |
| Skewness | 6.2912E-17 | 0 | 0 | 0.3321146 | 0.4519267 | -1.2675914 |
| Range | 20 | 40 | 135 | 12.86 | 50.77 | 0.26 |
| Minimum | 30 | 20 | 45 | 9.28 | 18.58 | 3.51 |
| Maximum | 50 | 60 | 180 | 22.14 | 69.35 | 3.77 |
| Sum | 680 | 680 | 1912.5 | 251.06 | 710.37 | 62.74 |
| Count | 17 | 17 | 17 | 17 | 17 | 17 |
| Population size | No of generation | R2 (TPC) | R2 (EY) | R2 (AA) |
| 100 | 100 | 0.9859 | 0.9157 | 0.7595 |
| 100 | 250 | 0.9858 | 0.9285 | 0.8290 |
| 100 | 500 | 0.9861 | 0.9480 | 0.8758 |
| 250 | 100 | 0.9859 | 0.9187 | 0.8350 |
| 250 | 250 | 0.9858 | 0.9382 | 0.9622 |
| 250 | 500 | 0.9858 | 0.9936 | 0.8291 |
| 500 | 100 | 0.9861 | 0.9291 | 0.8713 |
| 500 | 250 | 0.9998 | 0.9511 | 0.8416 |
| 500 | 500 | 0.9921 | 0.9351 | 0.8732 |
| Statistics | RSM | MGGP | ||||
| TPC | EY | AA | TPC | EY | AA | |
| R2 | 0.9998 | 0.9967 | 0.9671 | 0.9998 | 0.9936 | 0.9622 |
| RMSE | 0.2005 | 0.0171 | 0.0113 | 0.0202 | 0.0288 | 0.0011 |
| Name | Goal | Lower limit | Upper limit | Lower weight | Upper weight | Importance |
| OT (oC) | is in range | 30 | 50 | 1 | 1 | 3 |
| S : L (g/mL) | is in range | 1:20 | 1:50 | 1 | 1 | 3 |
| ET (min) | is in range | 45 | 180 | 1 | 1 | 3 |
| TPC (mg GAE/g) | maximize | 18.58 | 69.35 | 1 | 1 | 3 |
| EY (w/w %) | maximize | 9.28 | 21.39 | 1 | 1 | 3 |
| AA (µM AAE/g) | maximize | 3.51 | 3.77 | 1 | 1 | 3 |
| Number | OT (oC) | ET (min) | S:L (g/mL) | TPC (mg GAE/g) | EY (%) | AA (µM AAE/g) | Desirability | |
| 1 | 41.61 | 180.00 | 1:60 | 67.116 | 21.6565 | 3.68583 | 0.854 | Selected |
| 2 | 41.83 | 180.00 | 1:60 | 67.0228 | 21.5575 | 3.68754 | 0.854 | |
| 3 | 41.32 | 180.00 | 1:60 | 67.2314 | 21.7801 | 3.68361 | 0.854 | |
| 4 | 42.33 | 180.00 | 1:60 | 66.8119 | 21.3312 | 3.69121 | 0.853 | |
| 5 | 40.53 | 180.00 | 1:60 | 67.5498 | 22.1155 | 3.67704 | 0.852 | |
| 6 | 41.71 | 179.49 | 1:60 | 67.0487 | 21.5654 | 3.68607 | 0.852 | |
| 7 | 40.47 | 180.00 | 1:59 | 66.9680 | 22.1220 | 3.67791 | 0.850 | |
| 8 | 43.18 | 180.00 | 1:59 | 66.4113 | 20.9343 | 3.69702 | 0.850 | |
| 9 | 40.78 | 180.00 | 1:59 | 66.3632 | 21.9771 | 3.68168 | 0.850 | |
| 10 | 41.80 | 177.66 | 1:60 | 66.9172 | 21.3518 | 3.68495 | 0.844 | |
| 11 | 45.68 | 180.00 | 1:60 | 65.2926 | 19.6570 | 3.71053 | 0.830 | |
| 12 | 36.67 | 180.00 | 1:51 | 55.7064 | 22.7236 | 3.67233 | 0.770 | |
| 13 | 37.44 | 180.00 | 1:48 | 51.4708 | 22.1397 | 3.69064 | 0.766 |
Disclaimer/Publisher’s Note: The statements, opinions and data contained in all publications are solely those of the individual author(s) and contributor(s) and not of MDPI and/or the editor(s). MDPI and/or the editor(s) disclaim responsibility for any injury to people or property resulting from any ideas, methods, instructions or products referred to in the content. |
© 2023 by the authors. Licensee MDPI, Basel, Switzerland. This article is an open access article distributed under the terms and conditions of the Creative Commons Attribution (CC BY) license (http://creativecommons.org/licenses/by/4.0/).


