1. Introduction
Urbanization has transformed rural areas near cities into residential and industrial areas where land cover and infrastructures such as waterways, roads and buildings are being developed. While urbanization has made the environment more habitable, it has also affected all living organisms including microorganisms, plants, and animals [
1]. Many studies have reported the effects of urbanization on a wide range of species. For birds, most studies concluded that species richness decreases as urbanization increases, similar to findings with other vertebrates and invertebrates [
2]. Urbanization reduces the species richness of amphibians, mammals, and birds by 34% and species abundance by 52% per km
2 [
3]. As such, urbanization can be one of the major threats to ecosystems through habitat degradation and fragmentation.
Light pollution is an ecological stressor induced by urbanization. Urban lighting negatively affects the abundance of light-sensitive and nocturnal species [
4,
5], while artificial light at night (ALAN), such as streetlights and car headlights, have negative impacts on insect habitat especially nocturnal insects [
6,
7]. In the case of the Genji firefly,
Luciola cruciata, an insect that is active at night and emits light for mating, ALAN not only prevents communication between individuals through luminescence [
8], but also has adverse effects on their habitats by decreasing the number of eggs laid and preventing larvae from hatching [
9].
To counter these impacts on the Genji firefly, habitat conservation and restoration are urgently needed because habitat loss has led to population declines [
10]. The Genji firefly is an insect that inhabits rivers in Japan and is sometimes used as an indicator species for the conservation and restoration of riverine environments. Some areas where many adult insects fly with flashing luminescence attract tourists [
11]. After hatching on the ground, the larvae live underwater, emerge above the water for pupation, and the adults fly in the air at night for mating [
12]. Considering the ecology of Genji fireflies, both aquatic and terrestrial habitat conditions need to be suitable to complete their life cycle [
13,
14,
15]. Specifically, it is necessary to quantitatively assess their habitat requirements for effective species conservation. Sekine et al. [
16] comprehensively reviewed the habitat conditions of Genji fireflies, including aquatic conditions (e.g., water velocity, discharge, water temperature, water depth), channel morphology (e.g., river width, bottom sediment, channel shape, revetments, channel gradient, vegetation, channel length), and water quality (e.g., dissolved oxygen, BOD and COD). However, habitat requirements for the species remain qualitative. Few studies have focused on the effects of human impacts originating from agriculture (e.g., paddy rice and upland crops), houses, trees, and streetlights. Therefore, land use and components related to urbanization need to be assessed as habitat requirements for improving the conservation and restoration design of Genji firefly habitats.
Species distribution models are useful to clarify the relationship between habitat conditions and species occurrence [
17,
18,
19]. Species distribution models can predict the occurrence of a species in an uninvestigated area based on species-habitat relationships and have been applied for a wide variety of species from terrestrial to marine environments [
20]. Guisan et al. [
21] reviewed and conceptualized how species distribution models can be applied to support every step in decision making for species conservation. However, the reliability of species distribution models depends on how well models predict species occurrence, where both the quality and quantity of data used to train and test the model are critical. Specifically, the use of appropriate absence data is essential in species distribution modelling [
22]. Fukuda and De Baets [
23] reported that removal of absence data can improve model performance and habitat suitability assessment. Lauzeral et al. [
24] proposed an ensemble modelling approach to convert noisy absences into presences to improve the performance of a species distribution model. Whereas our preliminary analysis resulted in poor model performance on the test data, the previous studies suggest that the preprocessing of observation data can improve model performance and reliability in habitat suitability modelling [
25].
This study aims to build a machine learning-based habitat suitability model for relating landscape features and the presence/absence of Genji fireflies in a peri-urban river in Japan. Considering the uncertain nature of absence data, we systematically removed noisy absences, based on which habitat suitability models are constructed to model species distributions and assess the habitat requirements of the species. Variable importance and partial dependence plots computed by Random Forests are used to visualize the ecological characteristics of the target species.
2. Materials and Methods
2.1. Field Survey
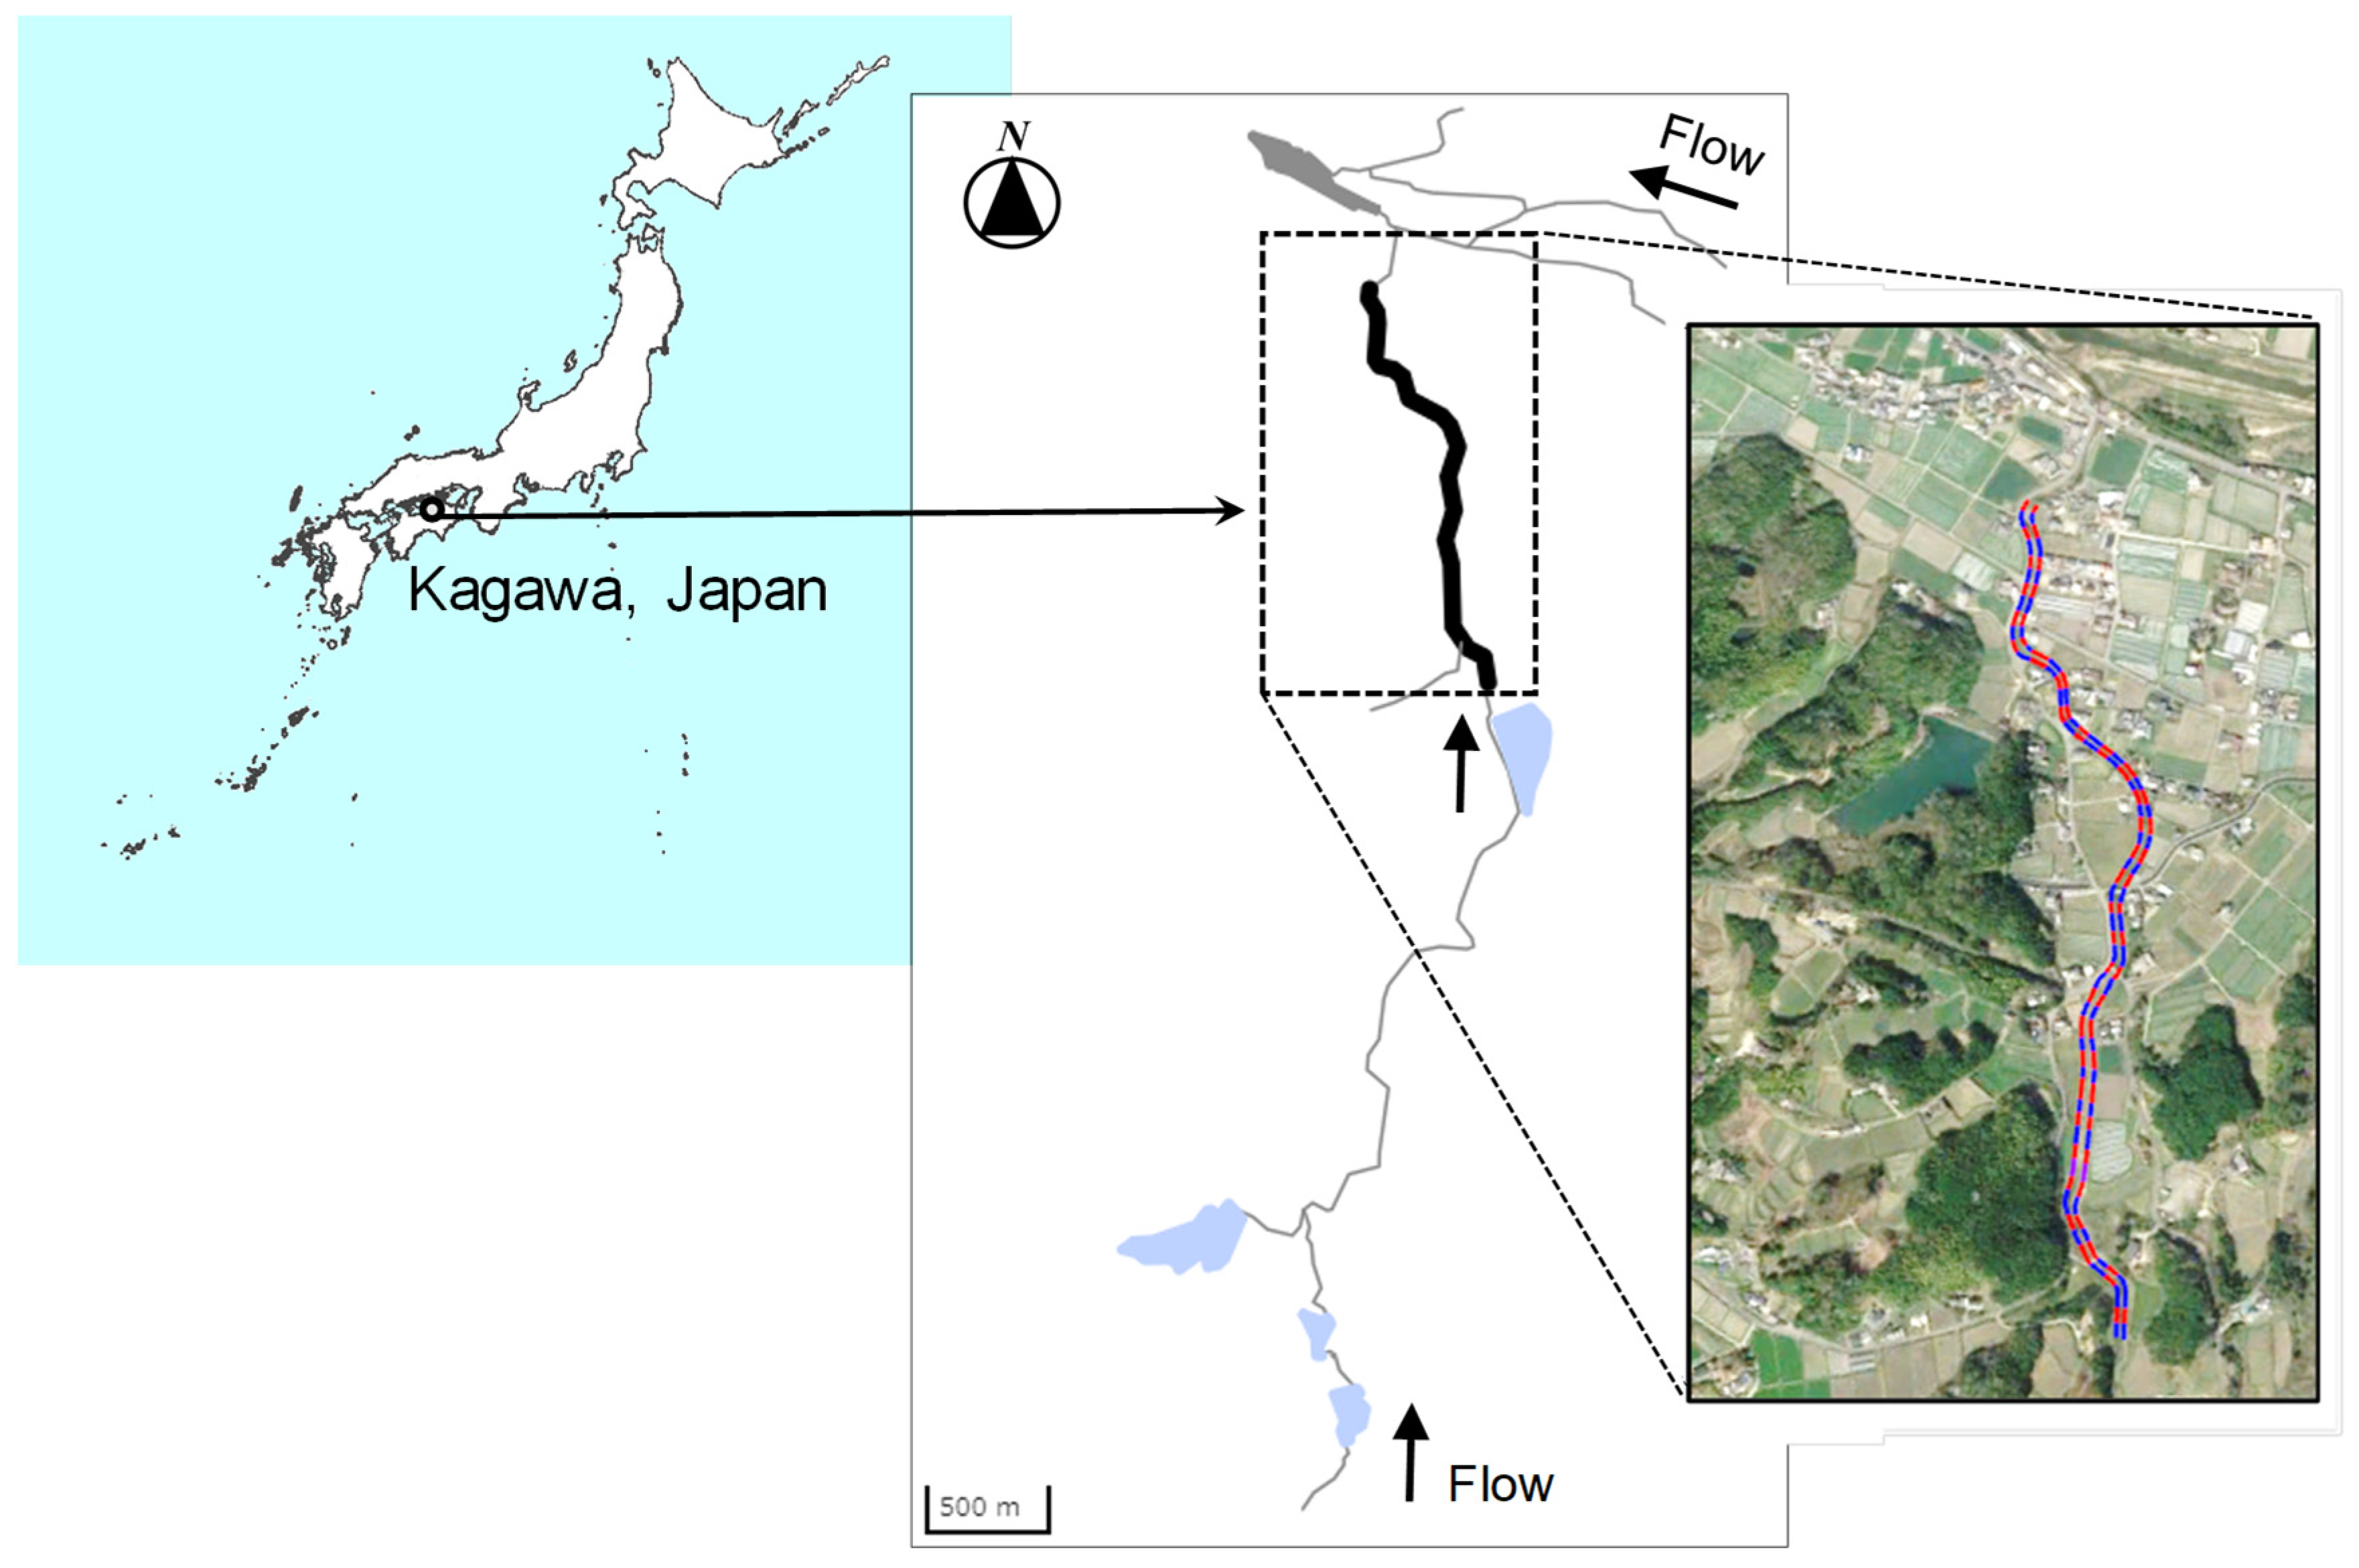
We conducted a series of field surveys on Genji firefly distribution and local landscape features along a 1.2 km reach of the Kajiba River that flows through Ayagawa Town, Ayauta, Kagawa prefecture, Japan. This area covers a wide range of local landscape features such as residential areas with streetlights and houses, agricultural fields (i.e., paddy fields and upland fields), forests, and river environments (e.g., natural and concrete-lined channels). The survey area (34º13′N, 133º56′E) was divided into 60 sections (STs), each 20 m in length (
Figure 1). All surveys were conducted from June 8 to 11, 2022. Three observers visually observed the number of Genji fireflies (
Luciola cruciata) in each section (observation 1: 21:17–23:58 June 8, observation 2: 19:49–21:40 on June 9, observation 3: 22:05–23:34 on June 9, observation 4: 20:01–21:17 on June 10, observation 5: 21:39–22:56 on June 10). If a flying adult was observed in each section, the number of individuals in the section where it was first observed was recorded. Species distribution surveys were conducted five times across 60 sections (STs) during the survey period.
The following eight landscape features were investigated to quantify habitat requirements of Genji fireflies:
Instream Vegetation (InV) (dimensionless): Relative vegetation coverage in the aquatic zone of each section, ranging between 0 and 1;
Riparian Vegetation (RiV) (dimensionless): Relative vegetation coverage along the water edge in each section, ranging between 0 and 1;
Bank Vegetation (BaV) (dimensionless): Relative vegetation coverage of the river banks in each section, ranging between 0 and 1;
Trees (TRE) (count): The number of trees (> 1 m tall) within the constructed river banks in each section;
Paddy (PAD) (m): Length along the river bank in each section where paddy fields are located within 10 m of the river banks (maximum 40 m);
Upland (UPL) (m): Length along the river bank in each section where upland crop fields are located within 10 m of the river banks (maximum 40 m);
Houses (HOU) (m): Distance from each section to the nearest house;
Lamp (LMP) (m): Distance from each section to the nearest streetlight.
2.3. Habitat Suitability Modelling
We applied Random Forests (RF) as the habitat model tool [
26]. Random Forests is a machine-learning algorithm that generates multiple decision trees, each of which can complement the results of the analysis and make predictions with high accuracy. We built a habitat model using the population and environmental data. We prepared five datasets from the habitat surveys for training and testing the developed habitat suitability models. Each dataset consisted of 240 training data points (60 STs × 4 observations) and 60 test data points (60 STs × 1 observation). We used default settings for the RF hyperparameters. Fifty independent initial conditions for the RF computation were used to assess the variability of the model structure.
Considering the limited model performance in our previous study [
25], we opted to improve the model performance by removing noisy absences from the training data. Six different models were built, considering the level of uncertainty in the absence data.
MDLAO: The model used only abundance data for training data, in which all absence data were removed;
MDL0.25: The absence data with model prediction smaller than 0.25 were used as the absence data in model training;
MDL0.5: The absence data with model prediction smaller than 0.5 were used as the absence data in model training;
MDL0.75: The absence data with model prediction smaller than 0.75 were used as the absence data in model training;
MDL1.0: The absence data with model prediction smaller than 1.0 were used as the absence data in model training;
MDLAll: Model using all observed data in model training.
The Root Mean Squared Error (RMSE) and COR (Pearson’s correlation coefficient) were used as performance measures of the model. RMSE represents the difference between the observed values (Y
obs) and the model-predicted values (Y
mdl) (Eq. (1)). The smaller the value, the more accurate the model.
COR represents the correlation between the observed and the modelled values (Eq. 2).
In each model, the partial dependence plots and variable importance were computed. The partial dependence curves were used to evaluate the impact of changes in each environmental factor, and the variable importance was used to evaluate the impact of each environmental factor on Genji fireflies.
We also used a Classification and Regression Tree (CART) to interpret the species-habitat relationships of the Genji fireflies [
27]. CART is a machine learning algorithm that finds a set of rules relating the objective variable to the explanatory variables by repeatedly branching Yes and No at a given condition of an explanatory variable.
3. Results
3.1. Field Observations and Local Landscape Features
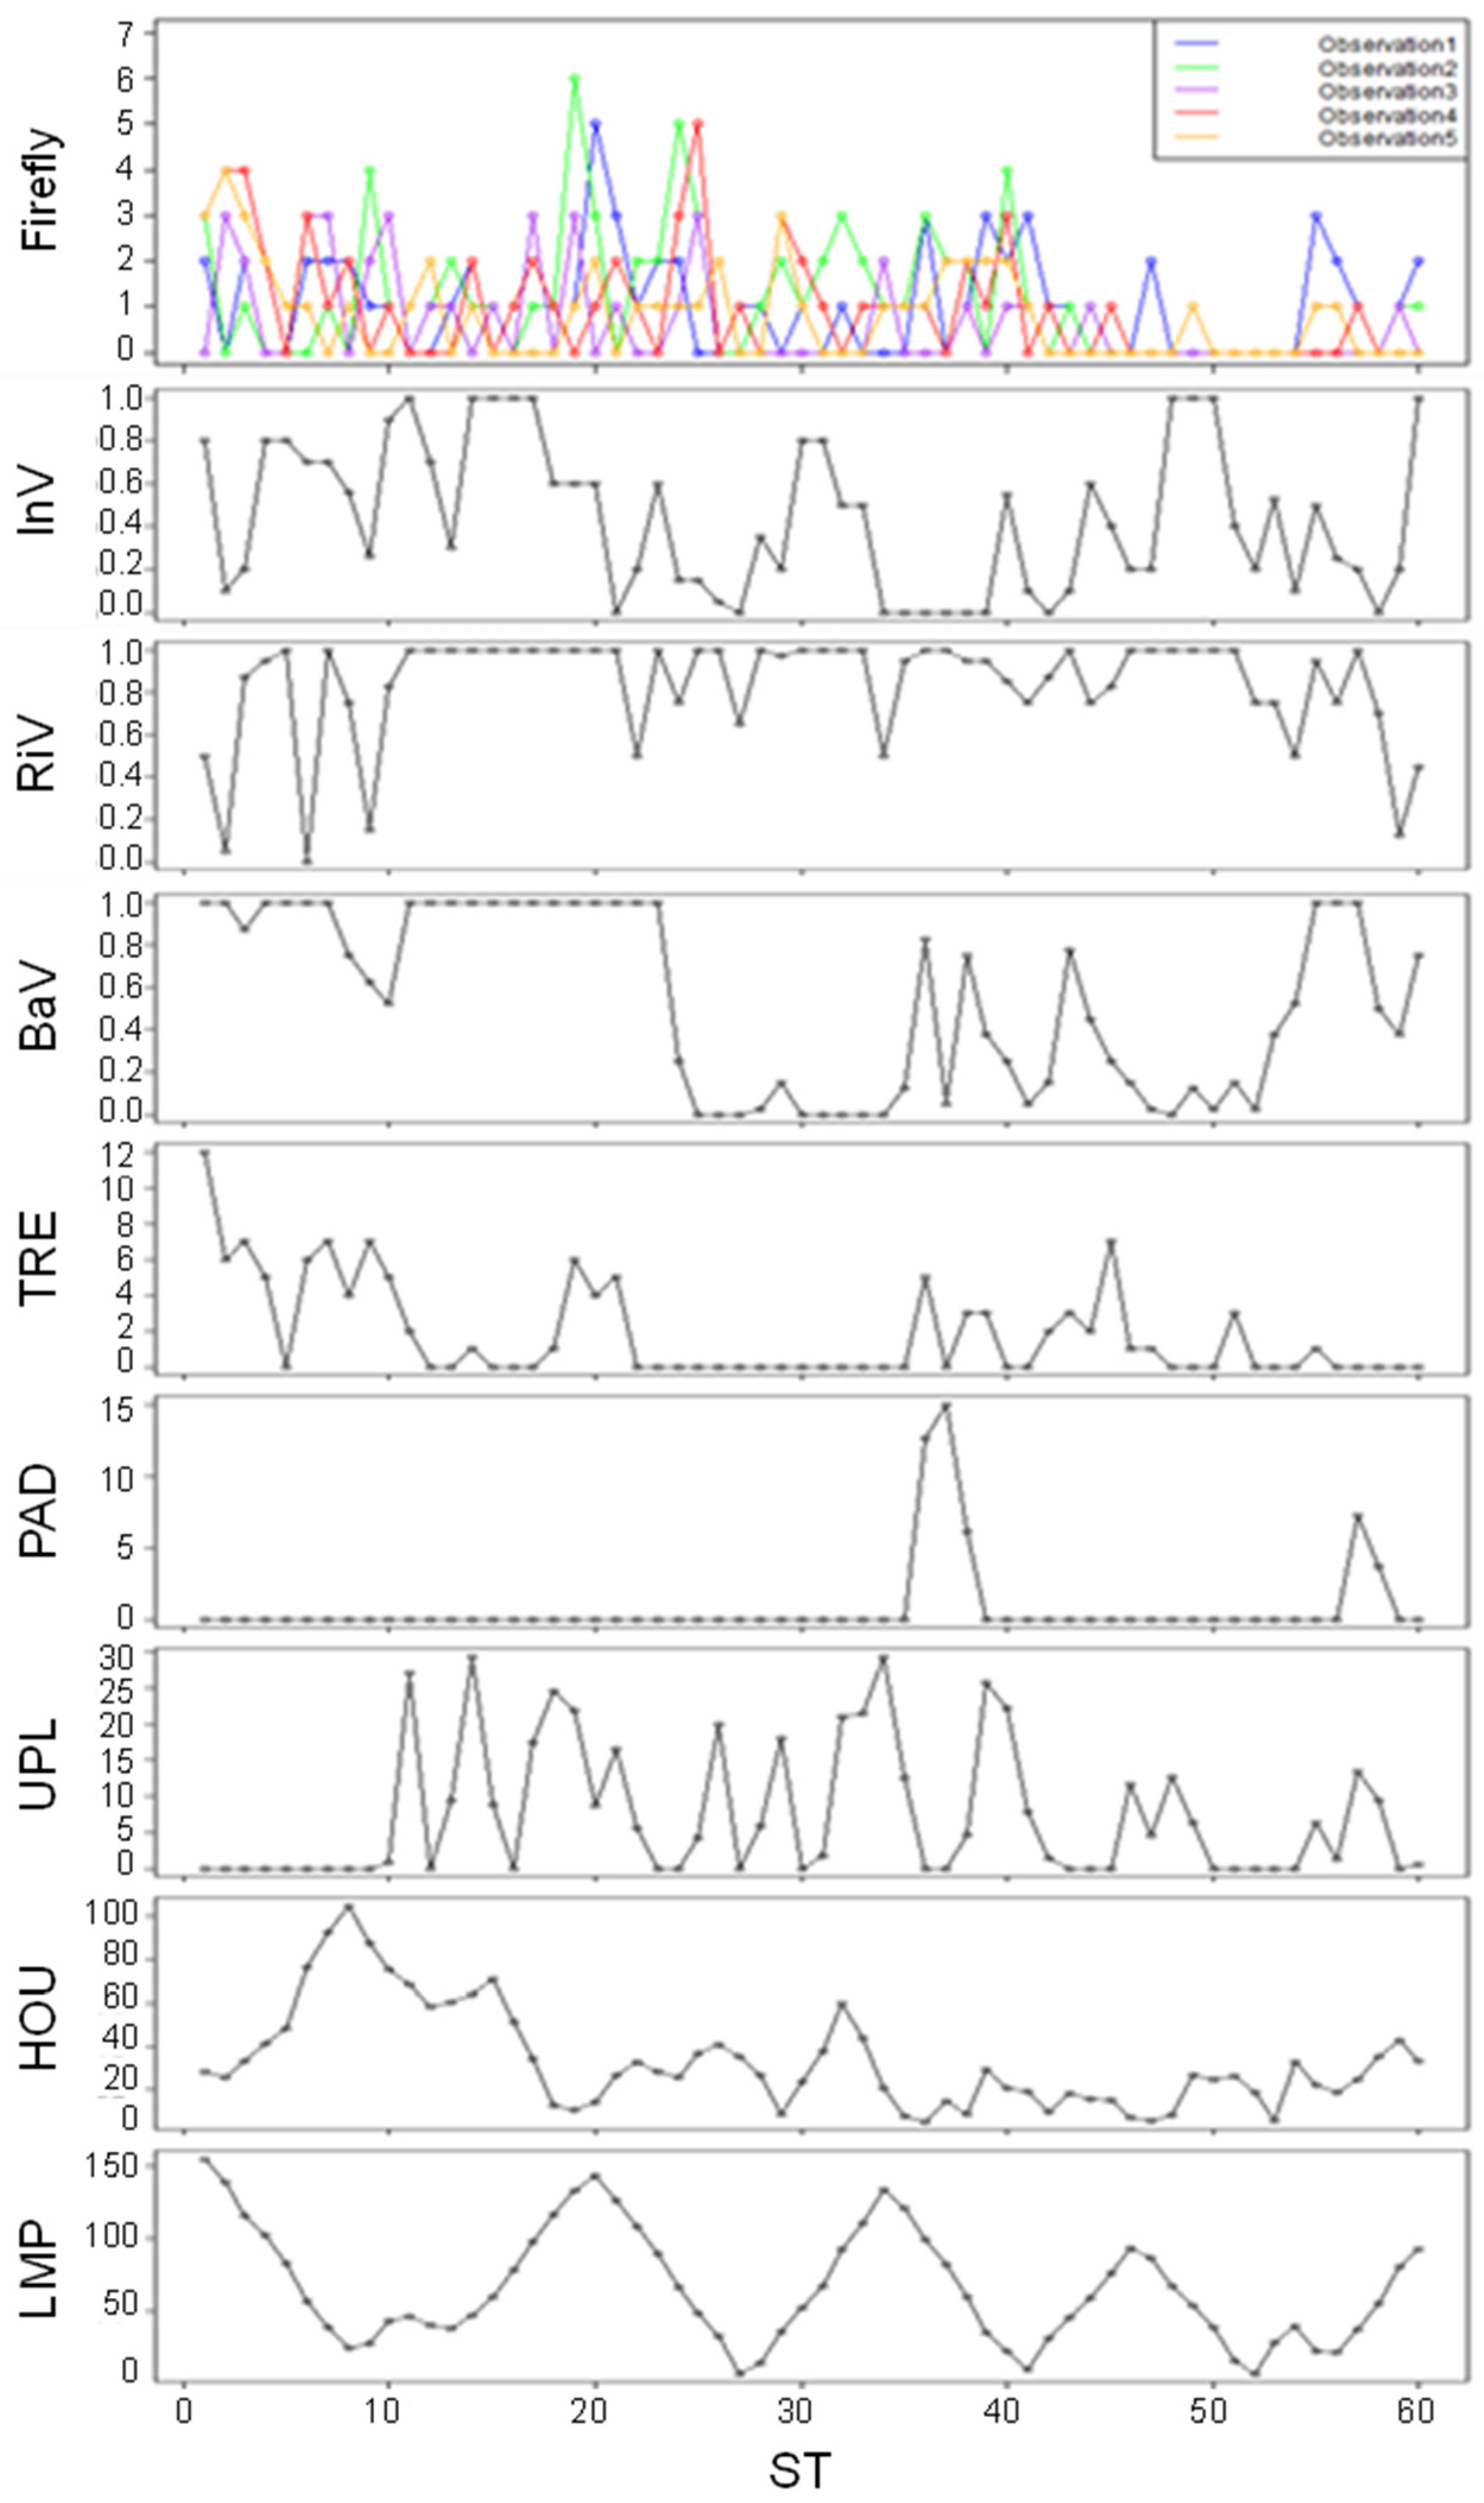
Of the 300 data points (60 sections (STs) × 5 observations), adult Genji fireflies were observed at 159 locations (
Figure 2). The maximum number of individuals observed in each section was six. The total number of Genji fireflies in all sections for the individual observations ranged from 38 to 67. The total number of adults observed in all five observations was 270, and most adults were found around the river channel.
Some trends in habitat conditions emerged along the survey stations. For instance, sections with Bank Vegetation close to zero were concrete-lined sections. Trees were more abundant in upstream reaches compared to downstream. In the mid-stream sections (ST 22–35), there were no trees along the river. On the other hand, some trees were observed near houses in downstream sections. There were only a few sections with paddy fields along the study reach resulting in less coverage of paddy fields compared to upland crop fields. Houses increased from upstream to downstream indicative of the trend of urbanization in the study site. For Lamp, streetlights were located close to the road along the river. The distance to a streetlight is longer in the upstream sections than in downstream reaches, also reflecting local urbanization trends.
3.2. Model Performance
MDL
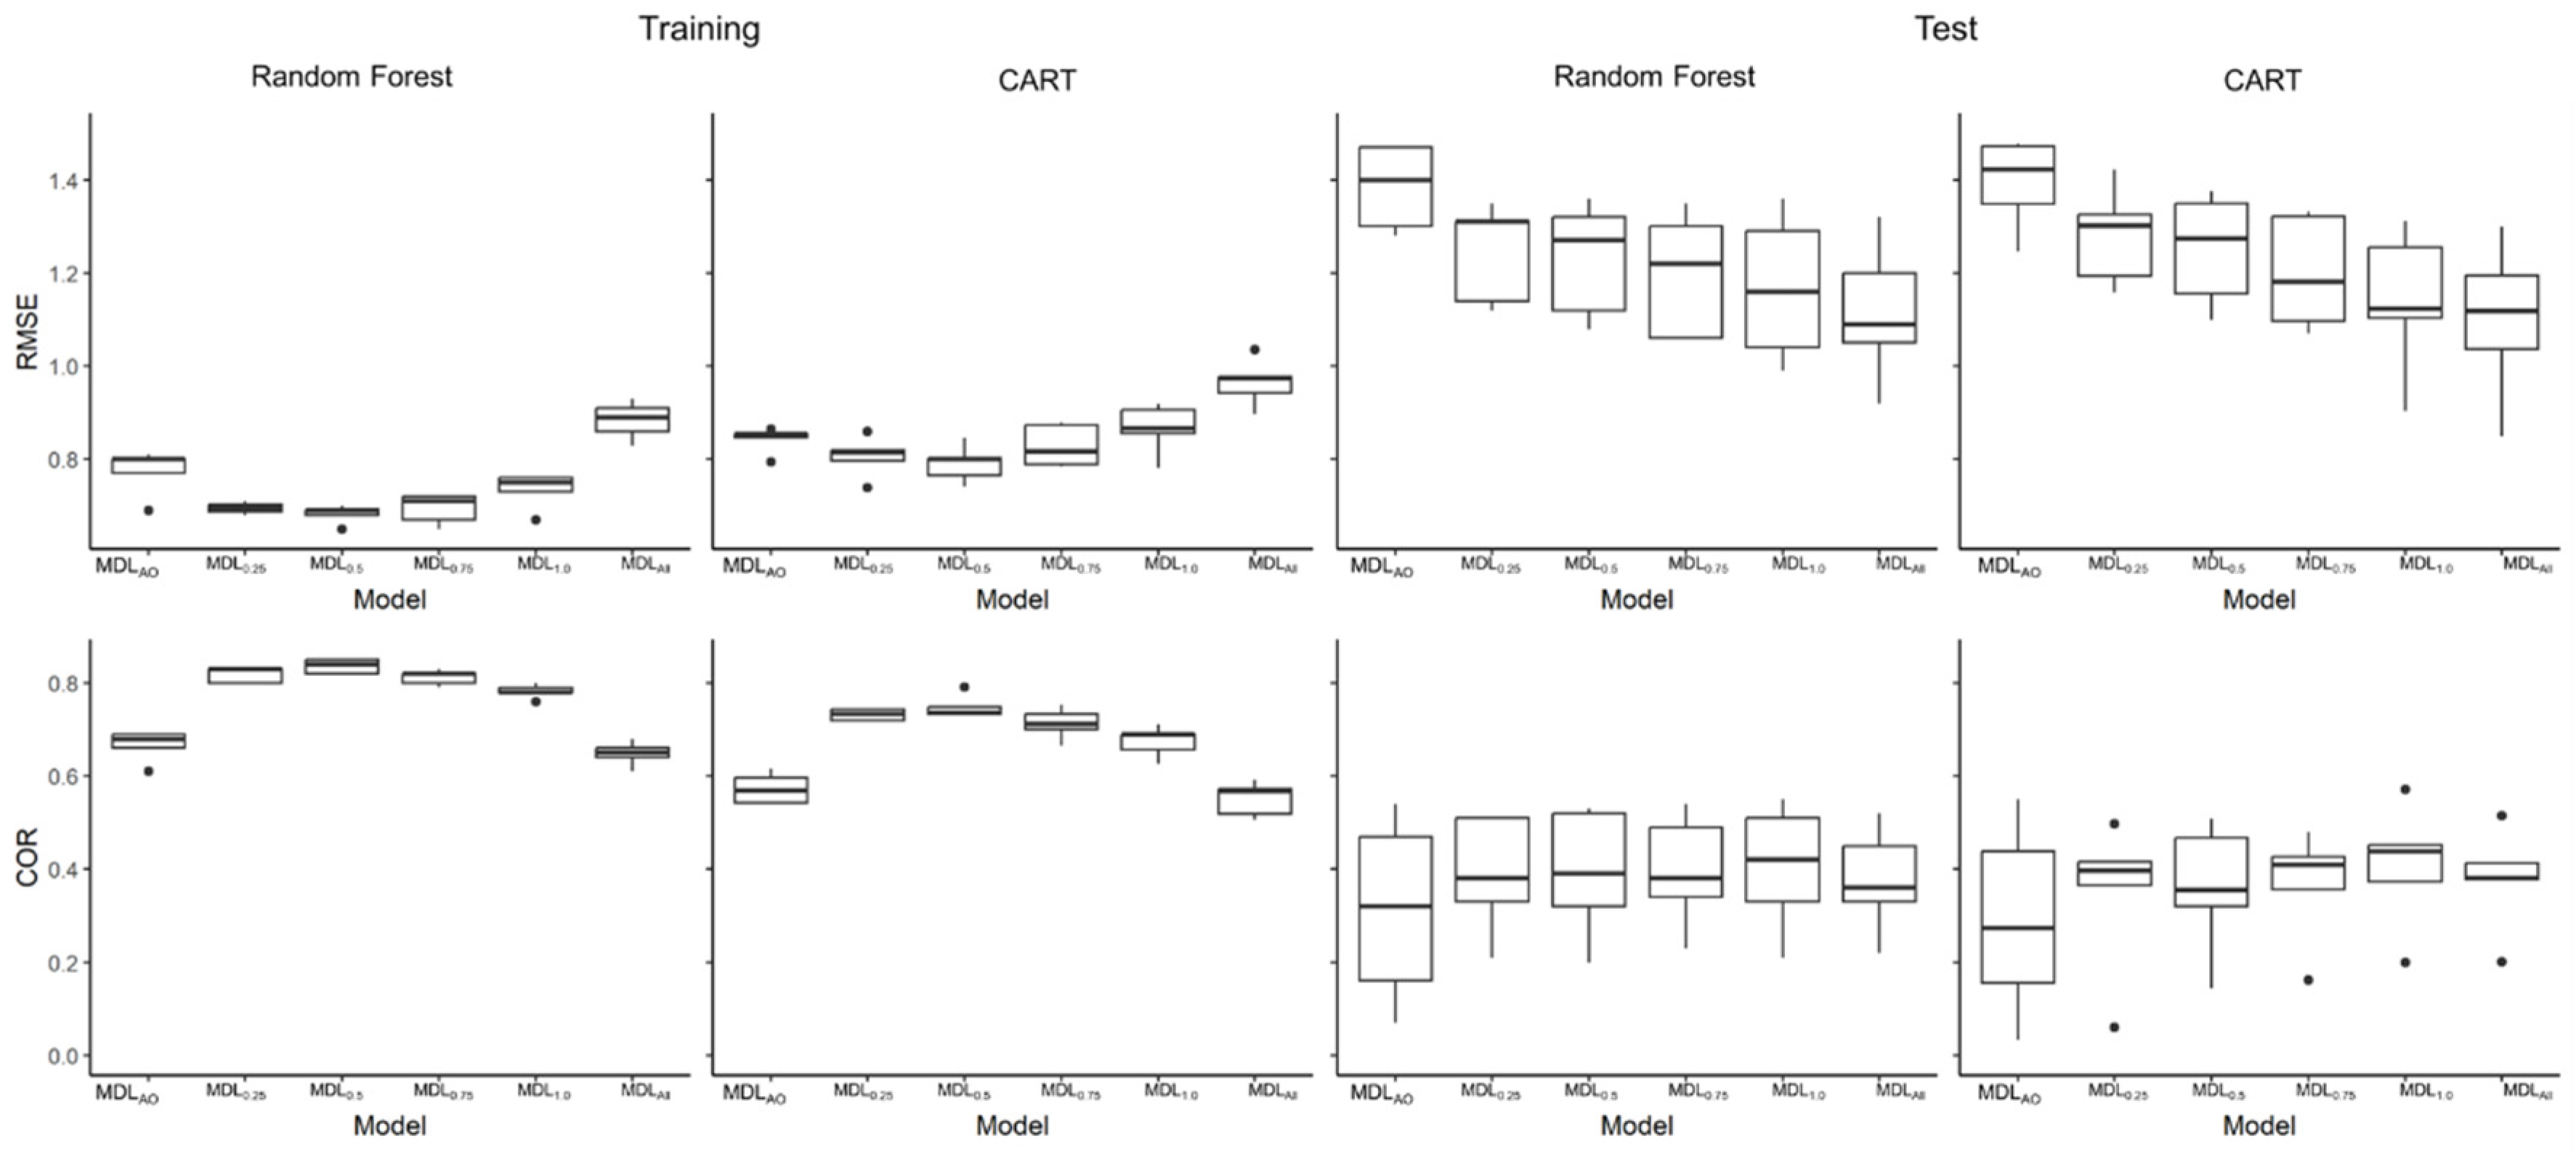
0.5 was the most accurate model in the training data set (
Figure 3). In contrast, RMSE in the test data set decreased with the larger size of data set for model training. This trend is similar in COR, but the model performance for the test data set were nearly the same among the different models. The effects of noisy absence removal on model performance in RF and CART were similar where the variations within both Random Forests and CART test datasets were higher than those of the training data.
3.3. Variable Importance
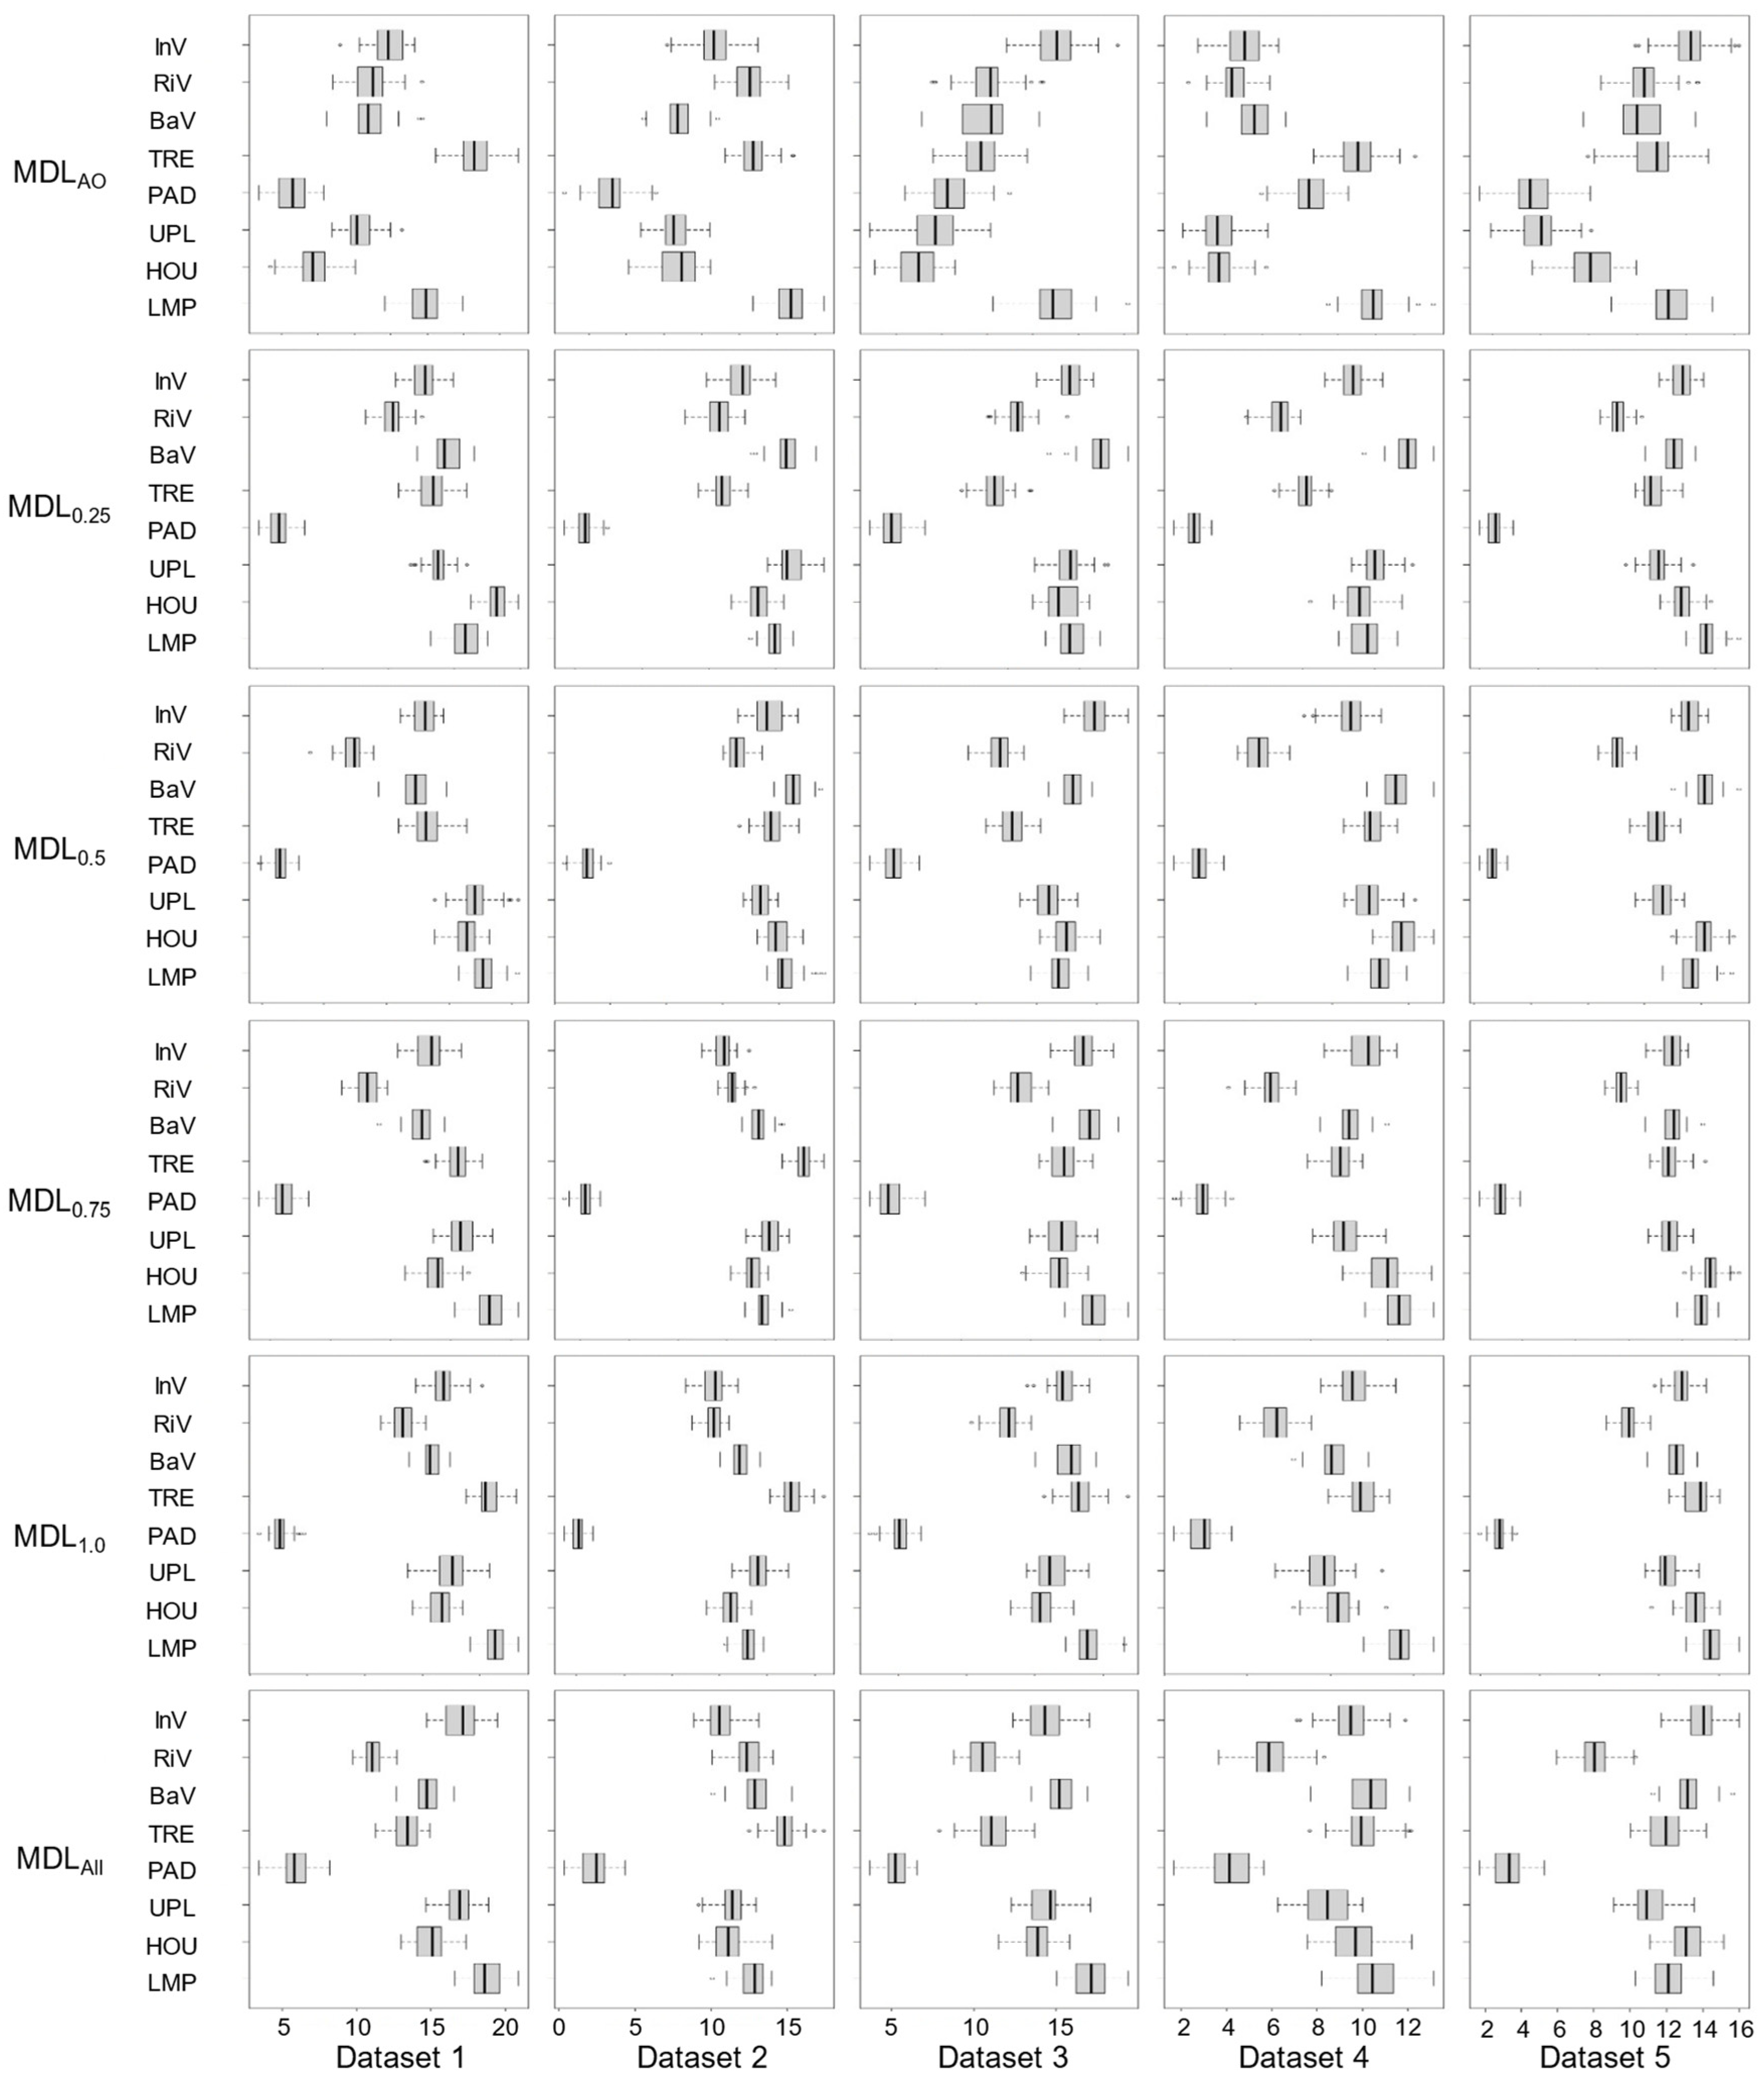
Differences in variable importance computed by RF on each dataset were observed (
Figure 4) where the variation among the five datasets was the smallest in MDL
0.5 and the largest variation occurred for MDL
AO, implying that there was no consistency in variable importance among the datasets. In MDL
AO, no absence data was used, which may explain why the variable importance varied among the data sets. This may partly reflect the importance of accurate absence data in species distribution modelling.
Among the landscape features, Trees, Houses, Upland and Lamp were of the highest importance in all the models and datasets (
Figure 4). The vegetation components (except Trees) exhibited large variations in variable importance among the datasets. The variable importance of paddy field was the lowest in all models and datasets, likely because there were few paddy fields along the studied reach; most STs denoted paddy fields of 0 value.
3.4. Response Curves
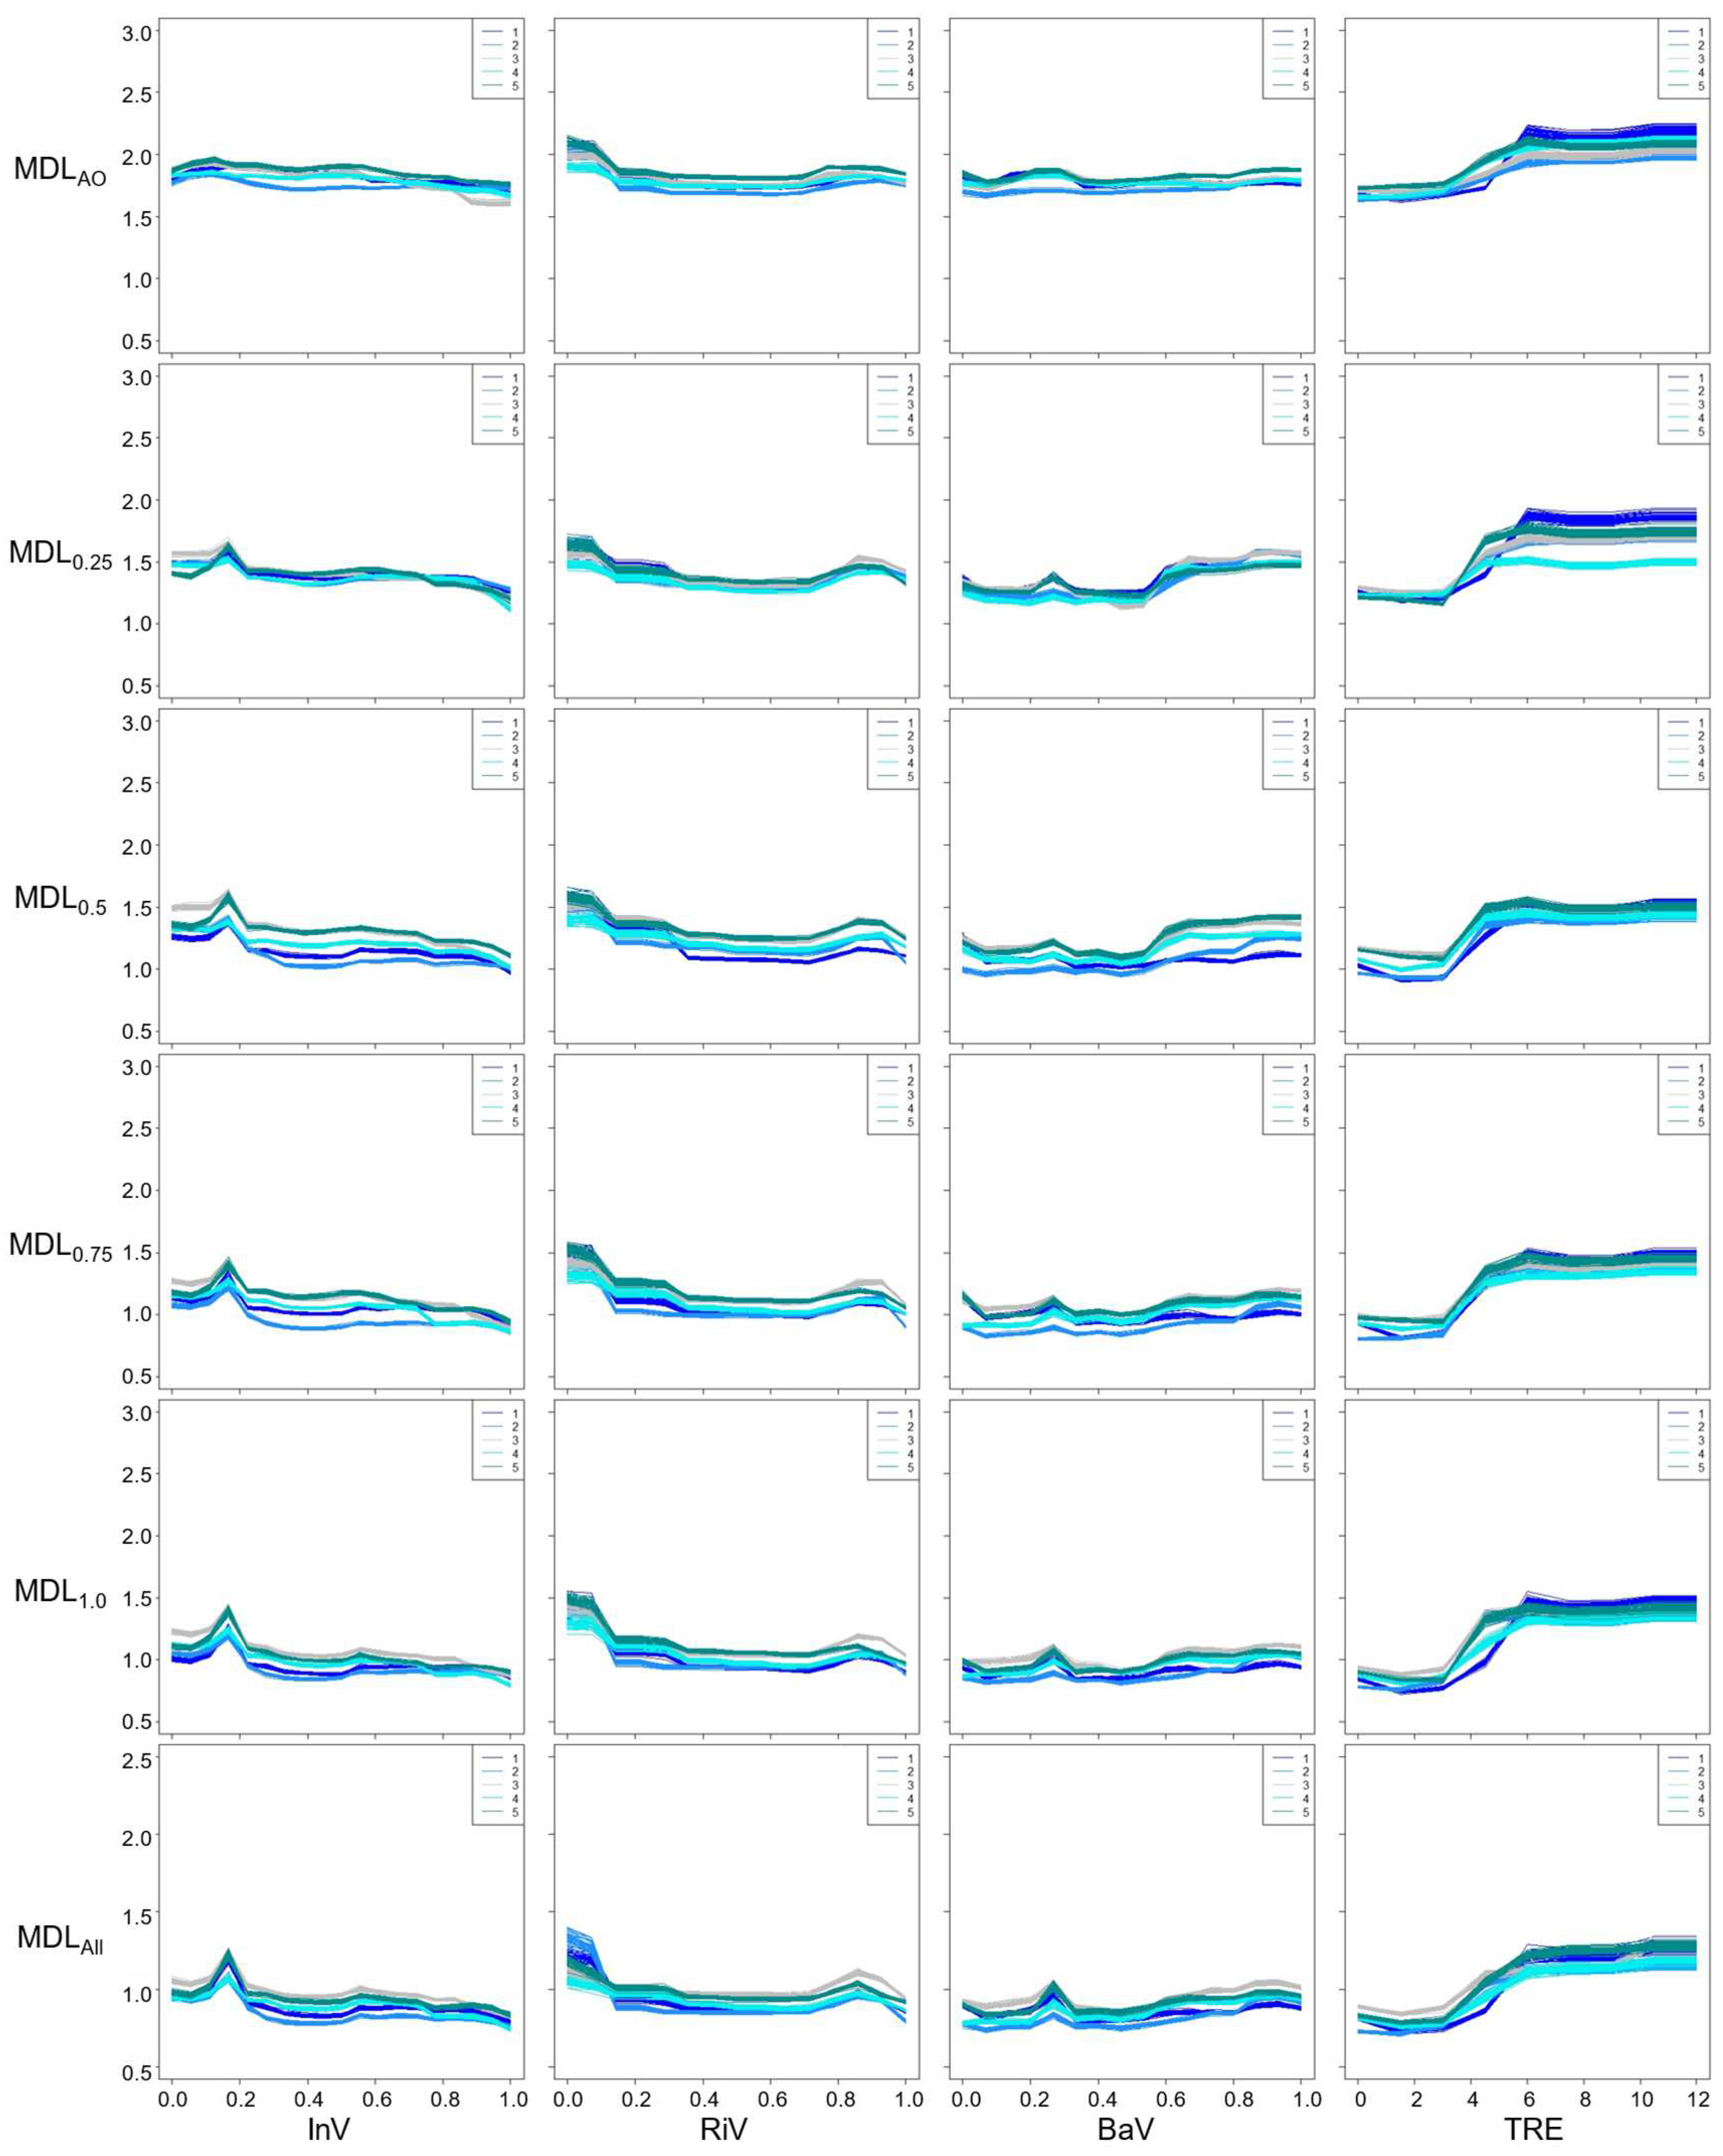
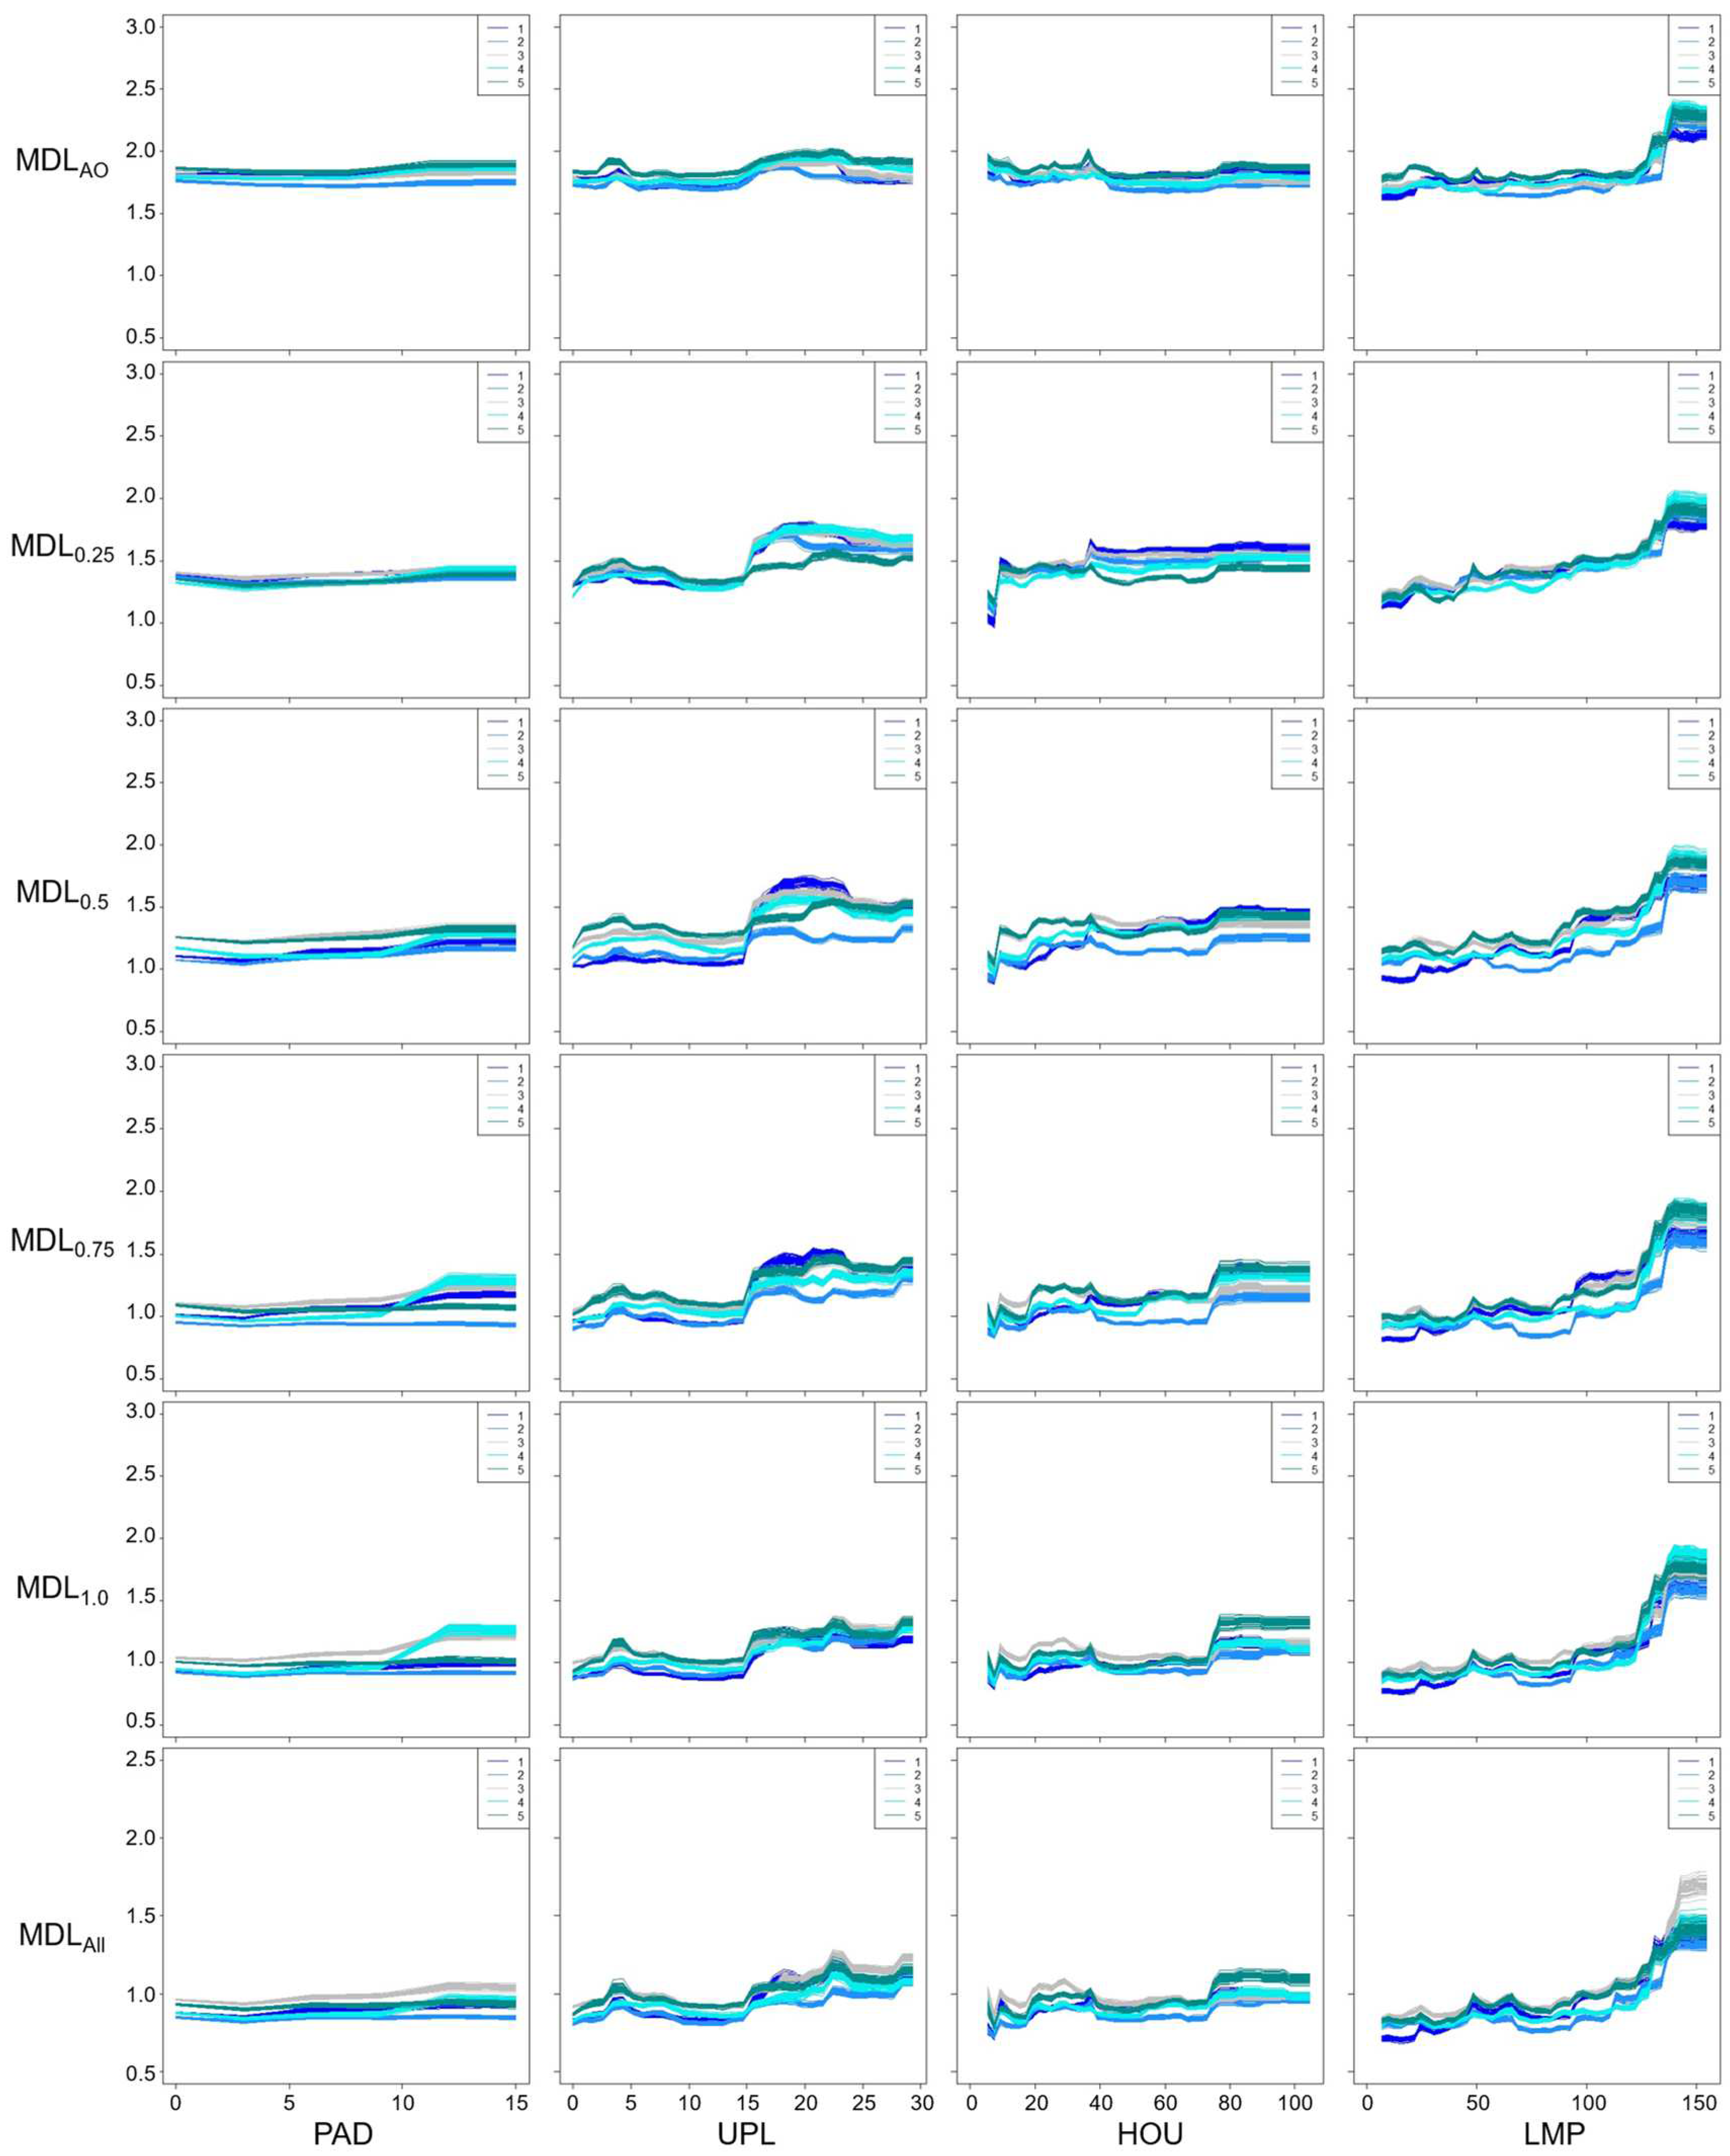
Despite of the variation in species responses among the models (
Figure 5 and
Figure 6), the partial dependence plots clearly exhibit landscape features suitable for Genji fireflies, namely relative coverage of Instream Vegetation (d ≈ 0.17), number of Trees > 1 m in height (> 6), Upland over (15 m), distance to nearest Houses (> 80 m), and distance to nearest Lamp (> 140 m). Specifically, more adults were observed where there were more than 6 trees in the section (
Figure 5). In all models, a > 15 m length of river bank in each section located within 10 m of the upland crop fields (Upland) was deemed suitable for the Genji fireflies. Distances from Houses and Lamps > 80 m and > 140 m, respectively, were important for the Genji firefly habitats. While no trends were observed in MDL
AO for Instream Vegetation, Upland, and Houses, the trend became clearer as the number of data in the training datasets increased. In other words, species responses were more uncertain in the case of MDL
AO. This may indicate that the abundance-only data contain uncertainty which was not removed in this model.
3.5. Habitat Suitability Assessment Using CART
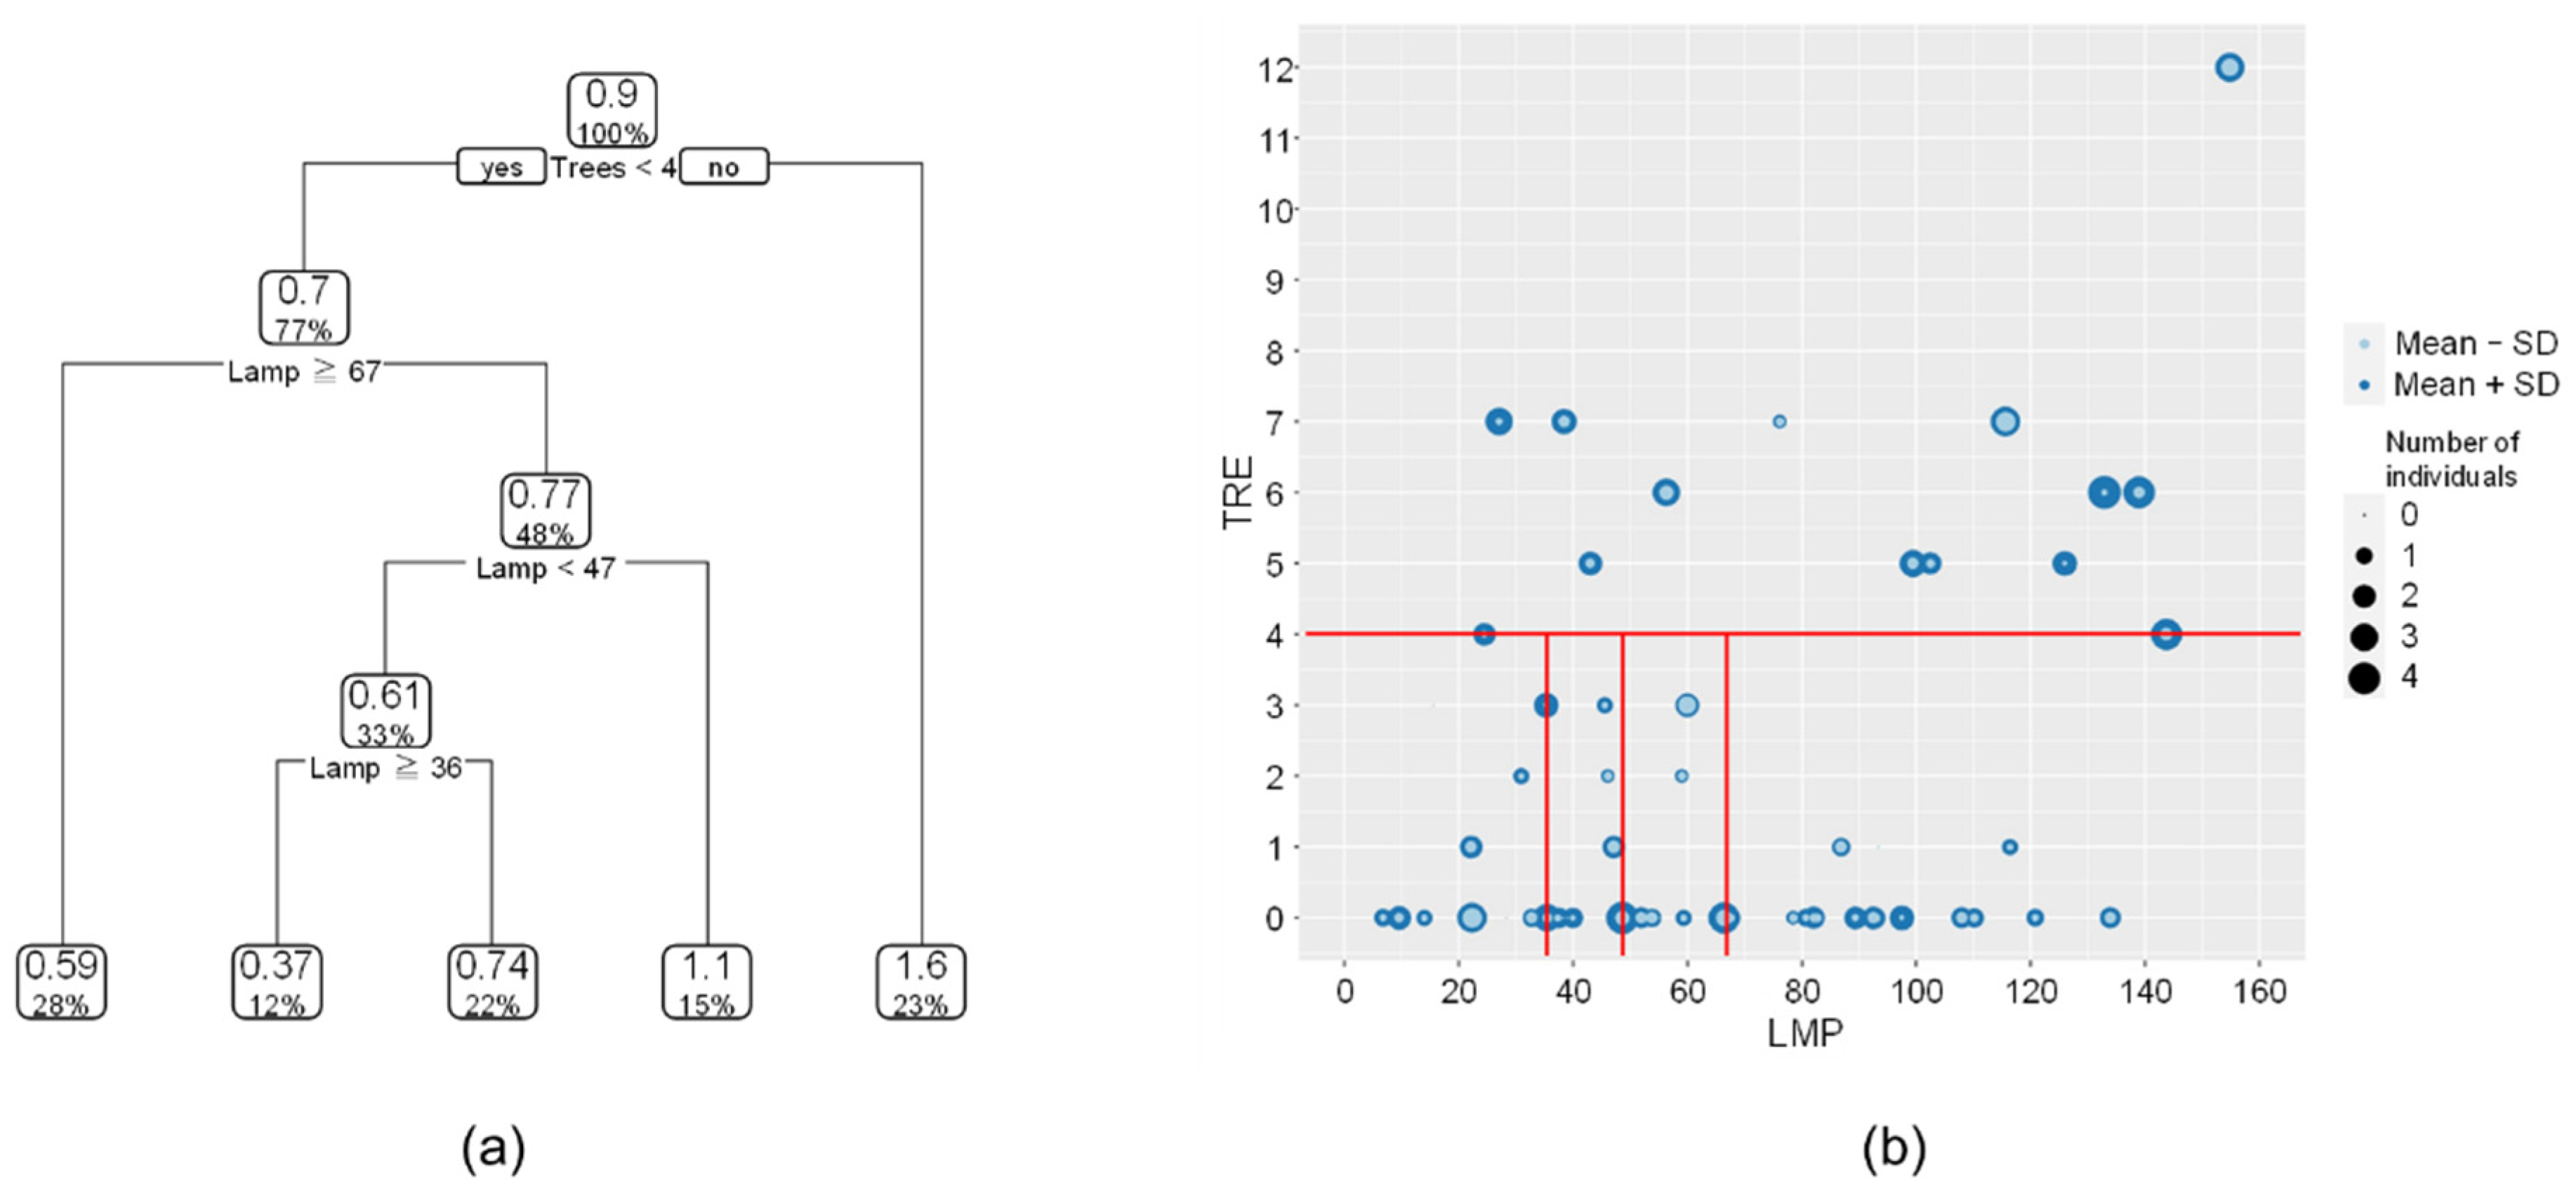
For interpretation purposes, we constructed CARTs using the two landscape features that were assessed as most important in the RF analysis, namely Trees and Lamps (
Figure 4). The first branch in
Figure 7a indicates that a section with more than four trees is the primary threshold for the highest number of individuals. The second highest number of individuals were found in areas with Trees < 4 and Lamps located between 47 to 67 m from the river. The least number of individuals were found in areas with Trees < 4 and Lamps < 36.
Although the results were somewhat different from those computed by RF, the general trend was the same: i.e., the more Trees, the better the habitat. In contrast, the trend for Lamps was different. One possible reason may be because sections with more trees coincided with larger Lamp values (i.e., longer distance to a streetlight) (
Figure 7b). Because CART selects the primary branch (i.e., Trees < 4) for modelling firefly abundance, regression based on Trees can be more important than Lamps in this case. The effects of Lamps on firefly numbers appears rather complex, especially in case of Trees < 4 (i.e., Tree < 4;
Figure 7b).
In this study, the use of CART to interpret the effects of landscape features allowed us to clarify the importance and conditions of Trees, whereas the conditions of Lamps suitable for Genji fireflies differed from those of RF. While CART can be used to visualize the complex species-habitat relationships in a quantitative and interpretable way, care should be taken when using variables with collinearity such as Trees and Lamps in this study.
4. Discussion and Conclusions
4.1. Impact of Noisy Absence Data
In model training, absence data with RF predictions greater than 0.5 were considered noise; removing them improved model performance. In model testing, larger amounts of training data resulted in better model performance. The reason for the difference in the model performance between the training and test datasets could be that no noise removal was performed on the test datasets. Therefore, the effect of removing noisy absences did not appear in the test datasets. In this study, the removal of absence data with RF output values greater than 0.5 improved model performance. One possible way to improve the model performance is to remove noisy data in test data sets, as well as in the presence data.
4.2. Channel Morphology and Land Use
According to Inoue et al. [
13], the best environment is within 10 m of the paddy fields and close to steep slopes. In this study, there were only a few paddy fields near the studied river reach. However, many sections had sediment deposits and areas covered with aquatic and terrestrial vegetation. This riparian zone connected to waters may function as open land such as paddy fields. In addition, both sides of the river were concrete-lined and riveted on a steep slope. According to Shibue et al. [
28], the darker illuminance in a channel in winter when the tree leaves have fallen is better, and the steep slopes on both riverbanks maintain the entire river in a stable state of darkness. In addition, trees and bridges may have blocked external light at night. There were eight sections with an Instream Vegetation with a relative cover of 0.17 where larger numbers of fireflies were observed (i .e., STs 3, 22, 29, 46, 47, 52, 57, and 59). Bridges existed at six of these sections; exceptions were ST 57 and 59. Rather than Instream Vegetation, bridges may be an important factor that increases the number of firefly individuals. Thus, the influence of both green and gray infrastructure covering the river, such as bridges, trees, and vegetation, should also be considered when assessing firefly habitat. Yuma and Ono [
29] reported that adults often turn back without passing under bridges. However, we observed fireflies passing under bridges during the survey, and the area around the bridges was darker than the surrounding area. Therefore, bridges may positively influence firefly habitat.
4.3. Illuminance in Relation to Trees, Lamp, and Houses
More fireflies were observed in areas with > 4–6 trees per 20 m length of the channel. This agrees with a previous study showing that tree density should be as high as possible [
16]. Trees not only block light but also serve as resting and mating sites [
16]. In contrast to previous studies, in which most habitat information is qualitative, we assessed the habitat conditions quantitatively using a data-driven approach. Lights and houses have been reported as important factors affecting the distribution of adult fireflies [
16,
28,
29]. Previous studies have shown that mercury and fluorescent lamps, as well as the glow of fireflies, have many overlapping wavelengths that inhibit illumination for mating, spawning, and hatching [
9]. This study used two landscape features, namely the distance to houses (Houses) and streetlights (Lamp), which are closely related to illuminance in Genji firefly habitats. Both Houses and Lamps showed that the number of individuals increased with distance. This trend is more evident for Lamps. The impact of streetlights on Genji fireflies was clearer than that of houses because lights emitted from homes may be blocked by curtains and garden trees, and are turned off late in the evening. Because streetlights are important for social security, there is a tradeoff between human activities (specifically, ALAN) and nature conservation. In this regard, it may be needed to consider total number or density of artificial light sources at night around the firefly habitats for a deeper understanding of the impact of urbanization on this species.
In addition to previous studies, this study quantified the habitat suitability of local landscape features for the Genji fireflies, based on reconfirming the importance of channel morphology (e.g., riparian zone, steep river banks) and illuminance at night (e.g., riparian trees for suitable light conditions) for adult Genji fireflies. Further studies are required to quantify the habitat requirements of Genji fireflies for improving the design and planning of human activities in harmony with nature.
Author Contributions
Conceptualization, T.O. and H.K.; methodology, T.O. and S.F.; software, S.F.; formal analysis, T.O.; investigation, T.O. and S.F.; data curation, T.O.; writing—original draft preparation, T.O.; writing—review and editing, S.F., R.S.; visualization, T.O.; supervision, H.K. and S.F.; project administration, S.F.; funding acquisition, S.F. All authors have read and agreed to the published version of the manuscript.
Funding
This study was supported in part by JST FOREST Program, Grant Number JPMJFR2019.
Institutional Review Board Statement
Not applicable.
Informed Consent Statement
Not applicable.
Data Availability Statement
Any information required to reanalyze the data reported in this paper is available from the corresponding author upon reasonable request.
Acknowledgments
The authors thank Wataru Ishikawa who contributed to this research in the field.
Conflicts of Interest
The authors declare no conflict of interest. The funders had no role in the design of the study; in the collection, analyses, or interpretation of data; in the writing of the manuscript; or in the decision to publish the results.
References
- Johnson, M.T.J.; Munshi-South, J. Evolution of life in urban environments. Science 2017, 358, eaam8327. [Google Scholar] [CrossRef]
- McKinney, M.L. Effects of urbanization on species richness: A review of plants and animals. Urban Ecosystems 2008, 11, 161–176. [Google Scholar] [CrossRef]
- Li, G.; Fang, C.; Li, Y.; Wang, Z.; Sun, S.; He, S.; Qi, W.; Bao, C.; Ma, H.; Fan, Y.; Feng, Y.; Liu, X. Global impacts of future urban expansion on terrestrial vertebrate diversity. Nature Communications 2022, 13, 1628. [Google Scholar] [CrossRef]
- Hölker, F.; Wolter, C.; Perkin, E.K.; Tockner, K. Light pollution as a biodiversity threat. Trends in Ecology & Evolution 2010, 25, 681–682. [Google Scholar]
- Li, H.; Wilkins, K., T. Predator-Prey Relationship between Urban Bats and Insects Impacted by Both Artificial Light at Night and Spatial Clutter. Biology 2022, 11, 829. [Google Scholar] [CrossRef]
- Stewart, A.J. Impacts of artificial lighting at night on insect conservation. Insect Conservation and Diversity 2021, 14, 163–166. [Google Scholar] [CrossRef]
- Owens, A.C.S.; Lewis, S.M. Narrow-spectrum artificial light silences female fireflies (Coleoptera: Lampyridae). Insect Conservation and Diversity 2021, 14, 199–210. [Google Scholar] [CrossRef]
- Yuma, M. Effects of illuminance and tree coverage on the density of adult Genji-firefly, Luciola cruciata (Coleoptera). Ecol. Civil Eng. 2001, 4, 59–63, (In Japanese with English Abstract). [Google Scholar] [CrossRef]
- Miyashita, M. Effects of LED lightning on the oviposition of firefly, Luciola crusiata and Luciola lateralis. Journal of Japan Society of Civil Engineers, Ser. G (Environmental Research) 2011, 67, 21–29, (In Japanese with English Abstract). [Google Scholar] [CrossRef]
- Nishihara, S.; Nagasaka, M.; Shirai, N.; Takahashi, H. Decrease of Genji Fireflies due to Large-Scale Development in Kanazawa City [Translated from Japanese]. Kahokugata Lake Science 2002, 5, 25–31. (In Japanese) [Google Scholar]
- Hosaka, T.; Kurimoto, M.; Numata, S. Entomological Culture and Insect-related Tourism in Japan. The international journal of tourism science 2017, 10, 57–56. (In Japanese) [Google Scholar]
- Yokohama Environmental Research Institute Yokohama Firefly Association. Creating a Firefly Habitat ~Technical Manual Tentative Plan~ [Translated from Japanese]. Material of Yokohama Environmental Research Institute 1986, 71. (In Japanese) [Google Scholar]
- Inoue, T.; Sekine, M.; Goto, M.; Ukita, M.; Kanao, M. Detecting firefly habitat by using GIS. The 31st Proceedings of Annual Meeting of Environmental Systems Research 2003, 525-530. (In Japanese with English Abstract).
- Kazama, S.; Matsumoto, S.; Priyantha, Ranjan, S. ; Hamamoto, H.; Sawamoto, M. Characterization of firefly habitat using a geographical information system with hydrological simulation. Ecological Modelling 2007, 209, 392–400. [Google Scholar] [CrossRef]
- Uemura, M.; Ishikawa, T.; Syudou, Y.; Fukui, Y. ; About the habitation conditions of genjibotaru. Annual journal of Hydraulic Engineering. JSCE 2003, 47, 1117–1122, (In Japanese with English Abstract). [Google Scholar] [CrossRef]
- Sekine, M.; Goto, M.; Ito, N.; Tanaka, K.; Kanao, M.; Inoue, T. Construction of a firefly stream by using a physical habitat evaluation method. Ecol. Civil Eng. 2007, 10, 103–116, (In Japanese with English Abstract). [Google Scholar] [CrossRef]
- Fukuda, S.; De Baets, B.; Waegeman, W.; Verwaeren, J.; Mouton, A. M. Habitat Prediction and knowledge extraction for spawning European grayling (Thymallus thymallus L.) using a broad range of species distribution models. Environmental Modelling & Software 2013, 47, 1–6. [Google Scholar]
- Liao, J; Wu, Z. ; Wang, H.; Xiao, S.; Mo. P.; Cui, X.; Projected Effects of Climate Change on Species Range of Pantala flavescens, a Wandering Glider Dragonfly. Biology 2023, 12, 226. [Google Scholar]
- Wang, D.; Yu, J.; Lin, Z.; Chen, P. Spatial–Temporal Distribution of Fish Larvae in the Pearl River Estuary Based on Habitat Suitability Index Model. Biology 2023, 12, 603. [Google Scholar] [CrossRef]
- Elith, J.; Leathwick, J.R. Species Distribution Models, Ecological Explanation and Prediction Across Space and Time. Annual Review of Ecology, Evolution, and Systematics 2009, 40, 677–697. [Google Scholar] [CrossRef]
- Guisan, A.; Tingley, R.; Baumgartner, J.B.; Naujokaitis-Lewis, I.; Sutcliffe, P.R.; Tulloch, A.I.T.; Regan, T.J.; Brotons, L.; McDonald-Madden, E.; Mantyka-Pringle, C.; Martin, T.G.; Rhodes, J.R.; Maggini, R.; Setterfield, S.A.; Elith, J.; Schwartz, M.W.; Wintle, B.A.; Broennimann, O.; Austin, M.; Ferrier, S.; Kearney, M.R.; Possingham, H.P.; Buckley, Y.M. Predicting species distributions for conservation decisions. Ecology Letters 2013, 16, 1424–1435. [Google Scholar] [CrossRef]
- Jiménez-Valverde, A.; Lobo, J. M.; Hortal, J. The effect of prevalence and its interaction with sample size on the reliability of species distribution models. Community Ecology 2009, 10, 196–205. [Google Scholar] [CrossRef]
- Fukuda, S.; De Baets, B. Do absence data matter when modelling fish habitat preference using a genetic Takagi-Sugeno fuzzy model? International Journal of Uncertainty Fuzziness and Knowledge-Based Systems 2012, 20 (Suppl. 2), 233–245. [Google Scholar] [CrossRef]
- Lauzeral, C.; Grenouillet, G.; Brosse, S. Dealing with noisy absences to optimize species distribution models: An iterative ensemble modelling approach. PLoS ONE 2012, 7, e49508. [Google Scholar] [CrossRef] [PubMed]
- Ogami, T.; Fukuda, S.; Kakudo, H. Modelling the relationships between local landscape features and habitat suitability of Genji-firefly Luciola cruciata using Random Forests. In Proceedings of the 2022 Joint 12th International Conference on Soft Computing and Intelligent Systems and 23rd International Symposium on Advanced Intelligent Systems (SCIS&ISIS), Ise, Japan, 29 November–2 December 2022; pp. 1–4. [Google Scholar]
- Breiman, L. Random forests. Machine Learning 2001, 45, 5–32. [Google Scholar] [CrossRef]
- Breiman, L.; Friedman, J.; Stone, C.J.; Olshen, R.A. Classification and Regression Trees; Wadsworth and Brooks/Cole: Monterey, CA, USA, 1984. [Google Scholar]
- Shibue, K.; Ohba, N.; Fujii, E. Analysis of Habitat Factor Which Influence on Population of Luciola cruciata at Nobi District in the Miura Peninsula. Journal of the Japanese Institute of Landscape Architecture 1995, 58, 121–124, (In Japanese with English Abstract). [Google Scholar] [CrossRef]
- Yuma, M.; Ono, K. Seasonal changes and population estimate of the adult firefly, Luciola cruciata (Coleoptera : Lampyridae), along the Biwako Canal, Kyoto city. Science report of the Yokosuka city museum 1985, 33, 1–11, (In Japanese with English Abstract). [Google Scholar]
|
Disclaimer/Publisher’s Note: The statements, opinions and data contained in all publications are solely those of the individual author(s) and contributor(s) and not of MDPI and/or the editor(s). MDPI and/or the editor(s) disclaim responsibility for any injury to people or property resulting from any ideas, methods, instructions or products referred to in the content. |
© 2023 by the authors. Licensee MDPI, Basel, Switzerland. This article is an open access article distributed under the terms and conditions of the Creative Commons Attribution (CC BY) license (http://creativecommons.org/licenses/by/4.0/).
