1. Introduction
Despite the promotion of numerous cardiovascular disease prevention measures and drug treatments, HTN continues to represent one of the three major cardiovascular risk factors, along with smoking and dyslipidemia, as well as the main preventable risk factor for premature death and cerebrovascular accident worldwide [
1,
2].
At the same time, mental disorders are currently a real public health problem, with anxiety disorder and panic disorder, being the most common psychiatric disorders worldwide [
3,
4,
5].
The increased incidence of cardiovascular diseases and mental disorders, because of the stress and negative emotions of the last 3-4 years, due to the pandemic, war, and economic crisis, has become worrying. Identifying the population vulnerable to stress and taking preventive measures, from a psychological point of view, are actions that need to be taken.
As a result, the purpose of this paper was to evaluate the connections between psycho-emotional factors, the psychological profile, and hypertension, to identify the presence of anxiety and vulnerability to stress in a person with high blood pressure, and to measure the level of self-efficacy in people with hypertension.
According to WHO estimates, worldwide, 1.28 billion adults between the ages of 30 and 79 years have hypertension, 66% of whom are from low- and middle-income countries [
6].
At the same time, 17 million of the deaths declared worldwide belong to cardiovascular diseases, 9 million of them being due to the complications of hypertension [
7].
In Romania, hypertension is the main cause of cardiovascular diseases, and 62% of all deaths are due to complications [
8].
In addition to non-modifiable risk factors (genetics, age, sex, race) and modifiable risk factors (smoking, obesity, sedentary lifestyle, dyslipidemia, diabetes, etc.), the impact of psychological factors (stress, anxiety, depression) and personality, plays a determining role, recognized by psychosomatics, but neglected in medical practice.
The modern lifestyle, globalization, cultural and socio-economic changes, and stress at work, have determined an alarming increase in stressors (psycho-social stress), generating favorable conditions for the increase in alcohol, tobacco, and drug consumption and the development of drug addictions, anxiety, depression, and psychological vulnerability. If acute stress forces people to act through “flight or fight” and is life-saving, chronic stress is determined by various negative events that persist in life and, over time produces an increase in allostatic load. Neuroendocrine mechanisms mediated by hormones and neurotransmitters will ensure adaptation to stress (allostasis) for a while, but over time the hippocampus, amygdala, and prefrontal cortex will undergo a process of structural remodeling, determining changes in behavioral and physiological responses [
9].
Studies show that mental and psycho-social stress can be a major risk factor for hypertension [
10,
11], acute stress can induce a transient increase in blood pressure [
7], and psycho-social factors are significantly involved in the pathogenesis and expression of hypertension and cardiovascular diseases [
12].
The physiopathological mechanisms by which anxiety, chronic stress, depression, social isolation, and personality traits favor the occurrence of hypertension and cardiovascular diseases, are behavioral (inadequate diet, obesity, smoking, alcohol, sedentarism) and psycho-neuro-endocrine. Psychogenic agents excessively stimulate the sympathetic nervous system, causing a sympathetic-parasympathetic imbalance, hypercortisolemia, and adrenergic activation, producing endothelial dysfunction, increased oxidative stress, inflammation, increased cytokines, and atherosclerosis [
13,
14,
15,
16,
17,
18,
19].
Defined by Hans Selye as “general adaptation syndrome”, by Lazarus and Folkman as “a cognitive and behavioral effort to reduce, master or tolerate external or internal demands” or by Darevenco, in 1998, as a “biological, psychological and behavioral imbalance between requirements and resources”, stress can produce anxiety, fatigue, frustration or sadness [
20,
21].
Stress and anxiety have somatic and psychological repercussions, mediated by the hypothalamic-pituitary-adrenal (HPA) axis, increasing the circulating level of catecholamines [
22,
23,
24].
In addition, as an emotional response to the anticipation of real or imaginary danger, maladaptive anxiety generates physiological reactions of cardiovascular type (tachycardia, increased blood pressure), as well as hyperventilation or behavioral reactions (restlessness, avoidance behavior) in addition to cognitive-subjective reactions (fear, worry, insecurity, loss of control, nervousness) [
25].
The involvement of genetic factors in the appearance of anxiety is known, but epigenetics places environmental factors and the psychological profile of the individual in essential positions in this determinism. Numerous studies have shown the existence of a bidirectional association between anxiety and hypertension, with patients with anxiety being more prone to hypertension, and those with hypertension more often developing anxiety than the general population [
26,
27,
28,
29].
Evidence from some studies highlights the positive relationship between the prevalence of arterial hypertension and the increased level of anxiety, and severe anxiety is more frequently associated with arterial hypertension [
30,
31,
32,
33,
34], by the presence of an increased level of circulating catecholamines, induced by the increase in vegetative activity through the hypothalamic-pituitary axis [
35].
Individuals with an anxiety disorder exhibit an exaggerated neurobiological sensitivity to threat that leads to recurrent, prolonged activation of stress and inflammatory systems.
They may perceive higher levels of threat and are less able to resolve threatening situations compared to individuals without an anxiety disorder, leading to a sustained perception of threat. Therefore, the hypothalamic-pituitary-adrenal axis (HPA) and the autonomic nervous system will be activated for a long time, raising the risk of recording increased blood pressure values [
36].
The association between hypertension and anxiety can also be explained by serotonin deficiency, involved in both mental disorders and hypertension [
37], and increased secretions of adenosine triphosphate in blood cells can cause changes in blood vessels [
38].
The individual’s vulnerability to stress depends on many factors. A determining role in managing the impact of stress on the body is represented by immunogenic personality traits: self-efficacy, coherence, locus of control, robustness, optimism, and religious faith. Among these, self-efficacy, defined by Bandura as “a person’s conviction in his abilities to mobilize his cognitive and motivational resources to complete the given tasks”, deserves to be discussed as a protective factor against stress. Low self-efficacy, frequently associated with the fear of failure, predisposes to anxiety and depression, generating a vicious circle and increasing the risk of developing high blood pressure [
39]. Low self-efficacy should perhaps be included on the list of modifiable risk factors for hypertension.
Studies show that there is a correlation between self-efficacy and hypertension [
40].
High self-efficacy acts as a buffer factor for the physiological stress response. Due to the belief that he can control the situation, the individual will not be exposed to anxiety, and the excessive activity of the sympathetic nervous system and the neuro-hormonal reactions to stress will be greatly reduced.
Individuals with high self-efficacy have a lower vulnerability to stress, anxiety, and depression.
A high level of self-efficacy could motivate the hypertensive patient in the direction of developing a sanogenic behavior, adequate diet, physical exercises, adherence to treatment, and giving up risk behaviors [
41].
Corroborating the information presented, it can be stated that the medical assistance systems would need to act to establish multidisciplinary teams made up of doctors and psychologists. The screening, diagnosis, and treatment of stress and anxiety disorders should be accompanied by the monitoring of blood pressure and the risk factors involved in these pathologies. The clinical care of a population at high risk of developing hypertension due to psychological causes should include specific psychological interventions and stress management strategies. In addition, all these would bring benefits in terms of antihypertensive therapeutic response, increasing compliance with therapeutic or resistance to treatment.
2. Materials and Methods
2.1. Ethical Approval
The collection of human data was performed according to the ethics standards established by the Declaration of Helsinki 2013 and did not need approval from our medical institution. All participants gave informed consent before the completion of any experiment. Their personal information was confidential and participation by individuals as subjects in medical research was voluntary.
2.2. Procedure
Data were collected through the Google Forms © platform from January 2023 to March 2023. The link was disseminated through mailing lists, social networks, and messaging apps.
2.3. Participants and Design
The present work represents a retrospective, case-control study. The study was carried out on 215 people: the case group was made up of 104 people diagnosed with hypertension, and the control group was represented by 111 non-hypertensive (without hypertension disease) people.
2.4. Method
The method of the study was quasi-experimental and consisted of the application of questionnaires to compare their scores.
The research tools were the psychometric instruments.
Study population:
Inclusion criteria were the following: age over 18 years, fulfillment of diagnostic criteria for arterial hypertension, and informed consent regarding participation in the respective study.
Exclusion criteria were the following: age under 18 and the presence of mental illnesses.
2.5. Measures
In this study, representative scales were chosen that are part of psychological tests validated and used in clinical practice. Therefore, the following were used: tests that measured vulnerability to stress (Stress Vulnerability Scale), perceived stress (Perceived Stress Scale), the presence of trait and state anxiety (S.T.A.I.-1 and S.T.A.I.-2), and the level of self-efficacy (SES).
3. Data processing and statistical analysis
3.1. Descriptive Statistics
Microsoft Office Excel spreadsheet program and IBM SPSS (The Statistical Package for the Social Sciences) Statistics program were used for data processing and statistical analysis. The following tests were used for statistical analysis in the IBM SPSS Statistics program: Independent Samples T-test, Chi-Square, and Fisher Exact test.
3.1.1. Characteristics of the group of patients diagnosed with hypertension
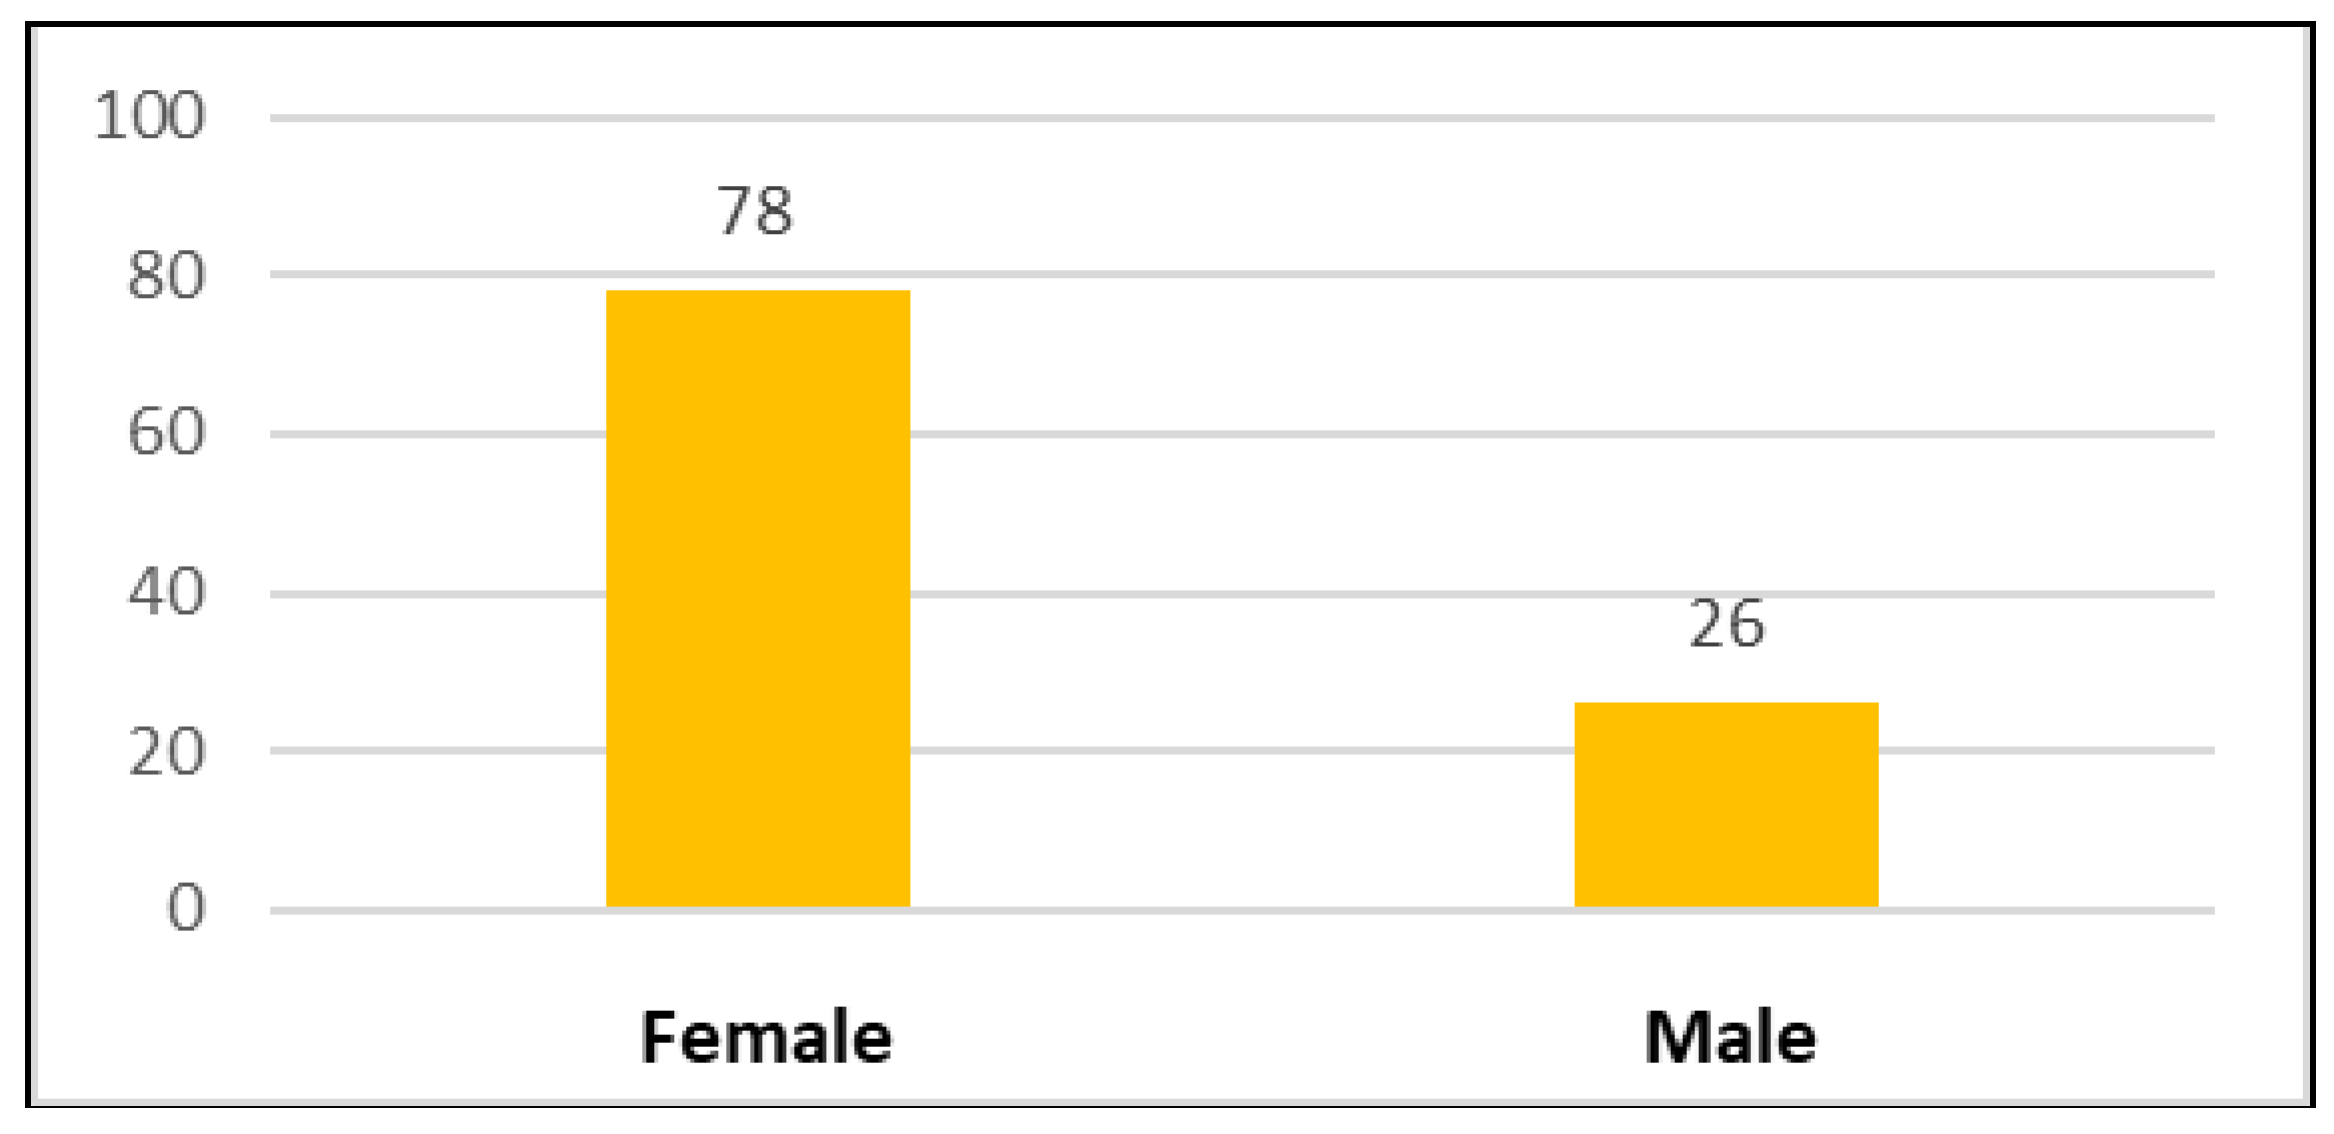
Figure 1 represents the distribution of patients according to gender. The number of female patients was 78 and the number of male patients was 26.
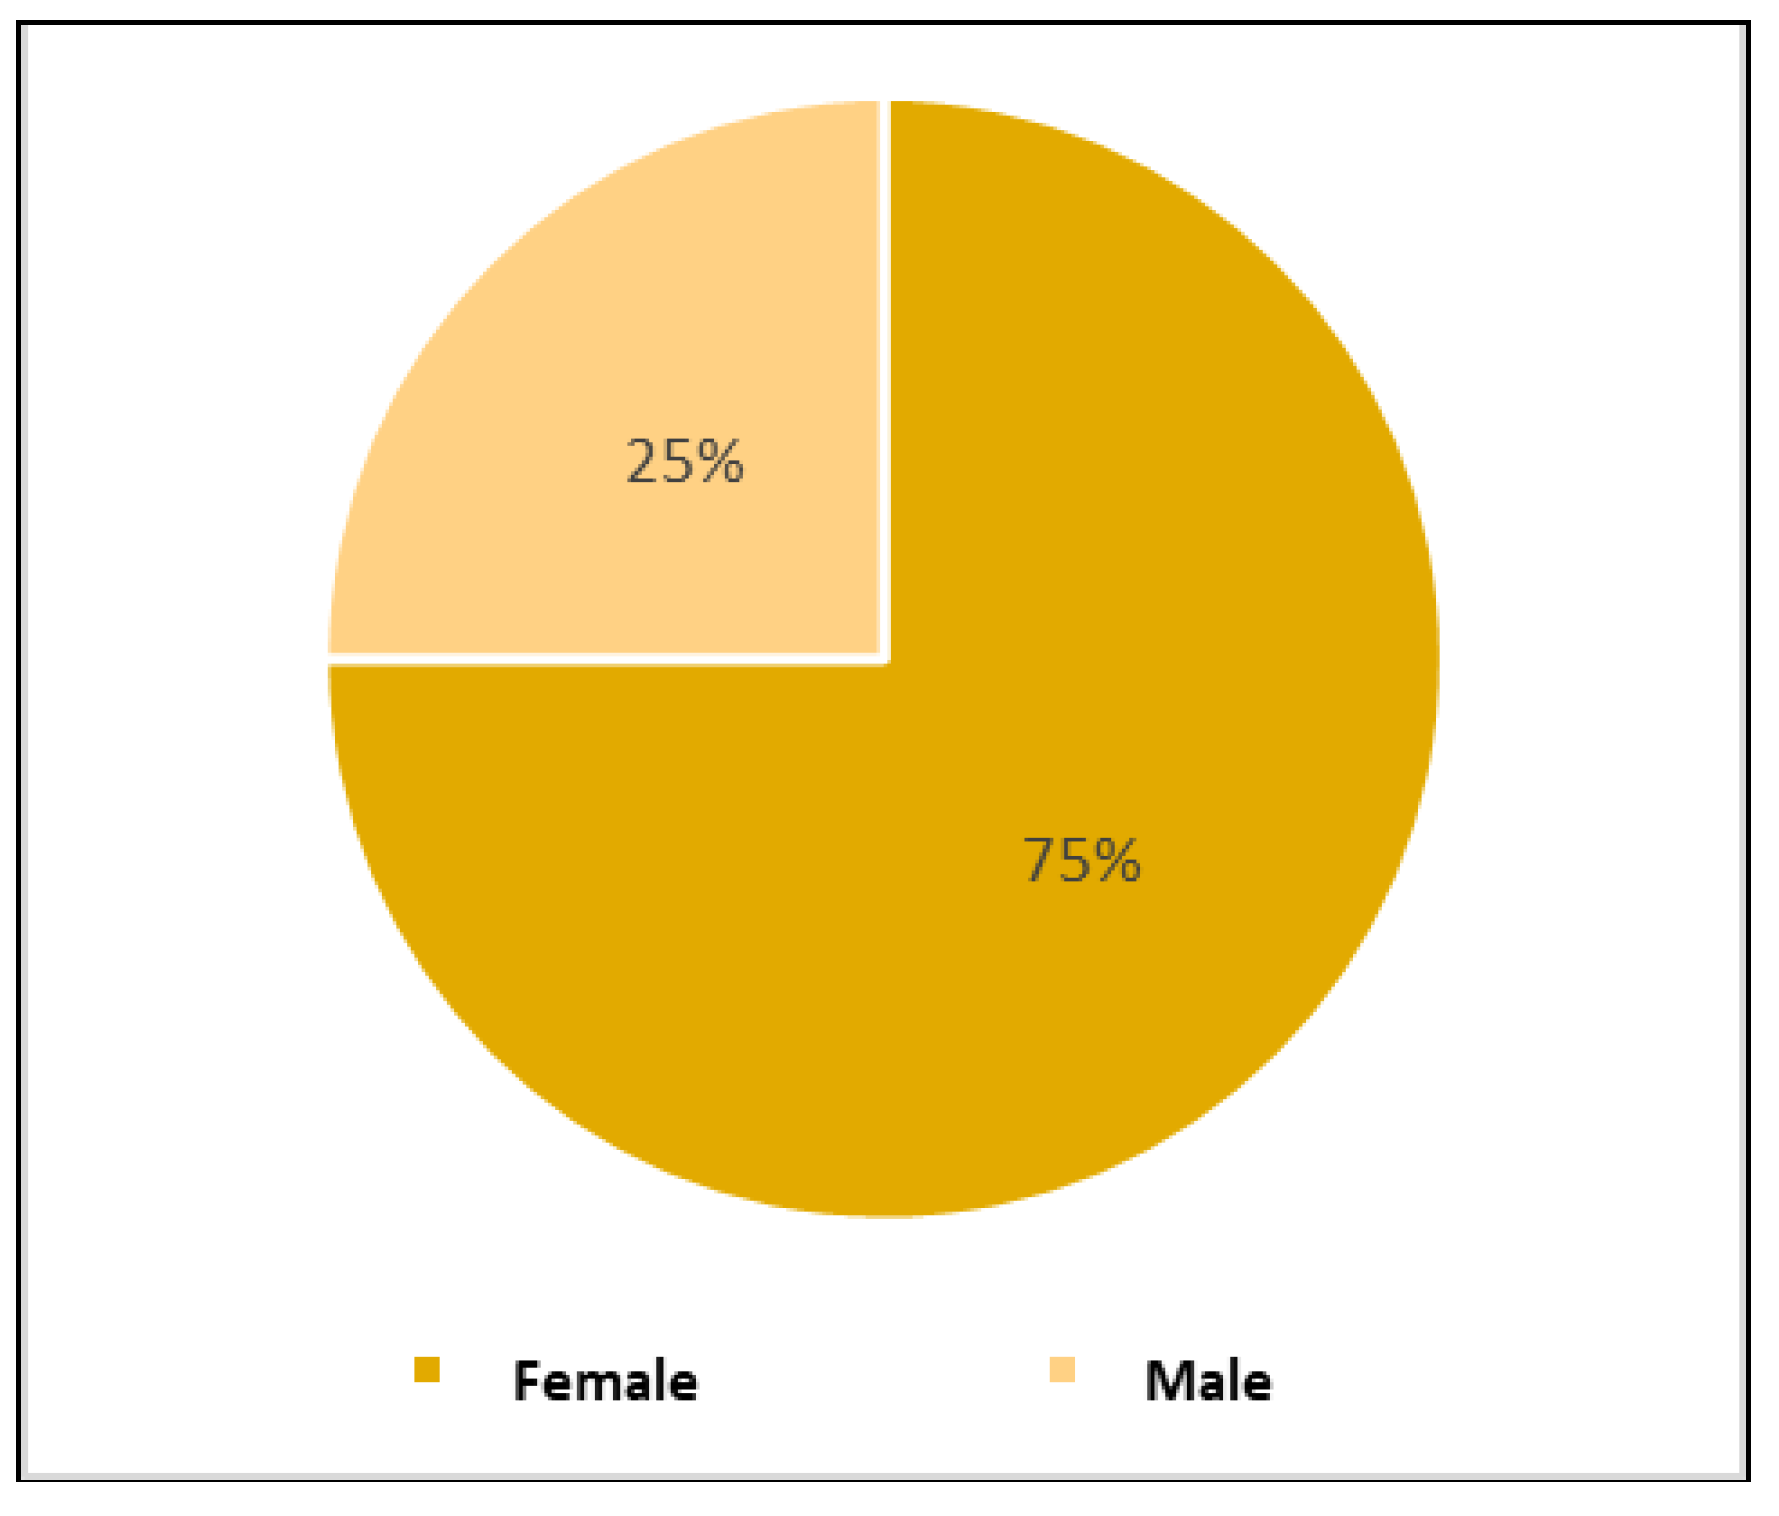
Figure 2 represents the percentage distribution of hypertensive patients. 75% of the total cases were female patients and the remaining 25% were male patients.
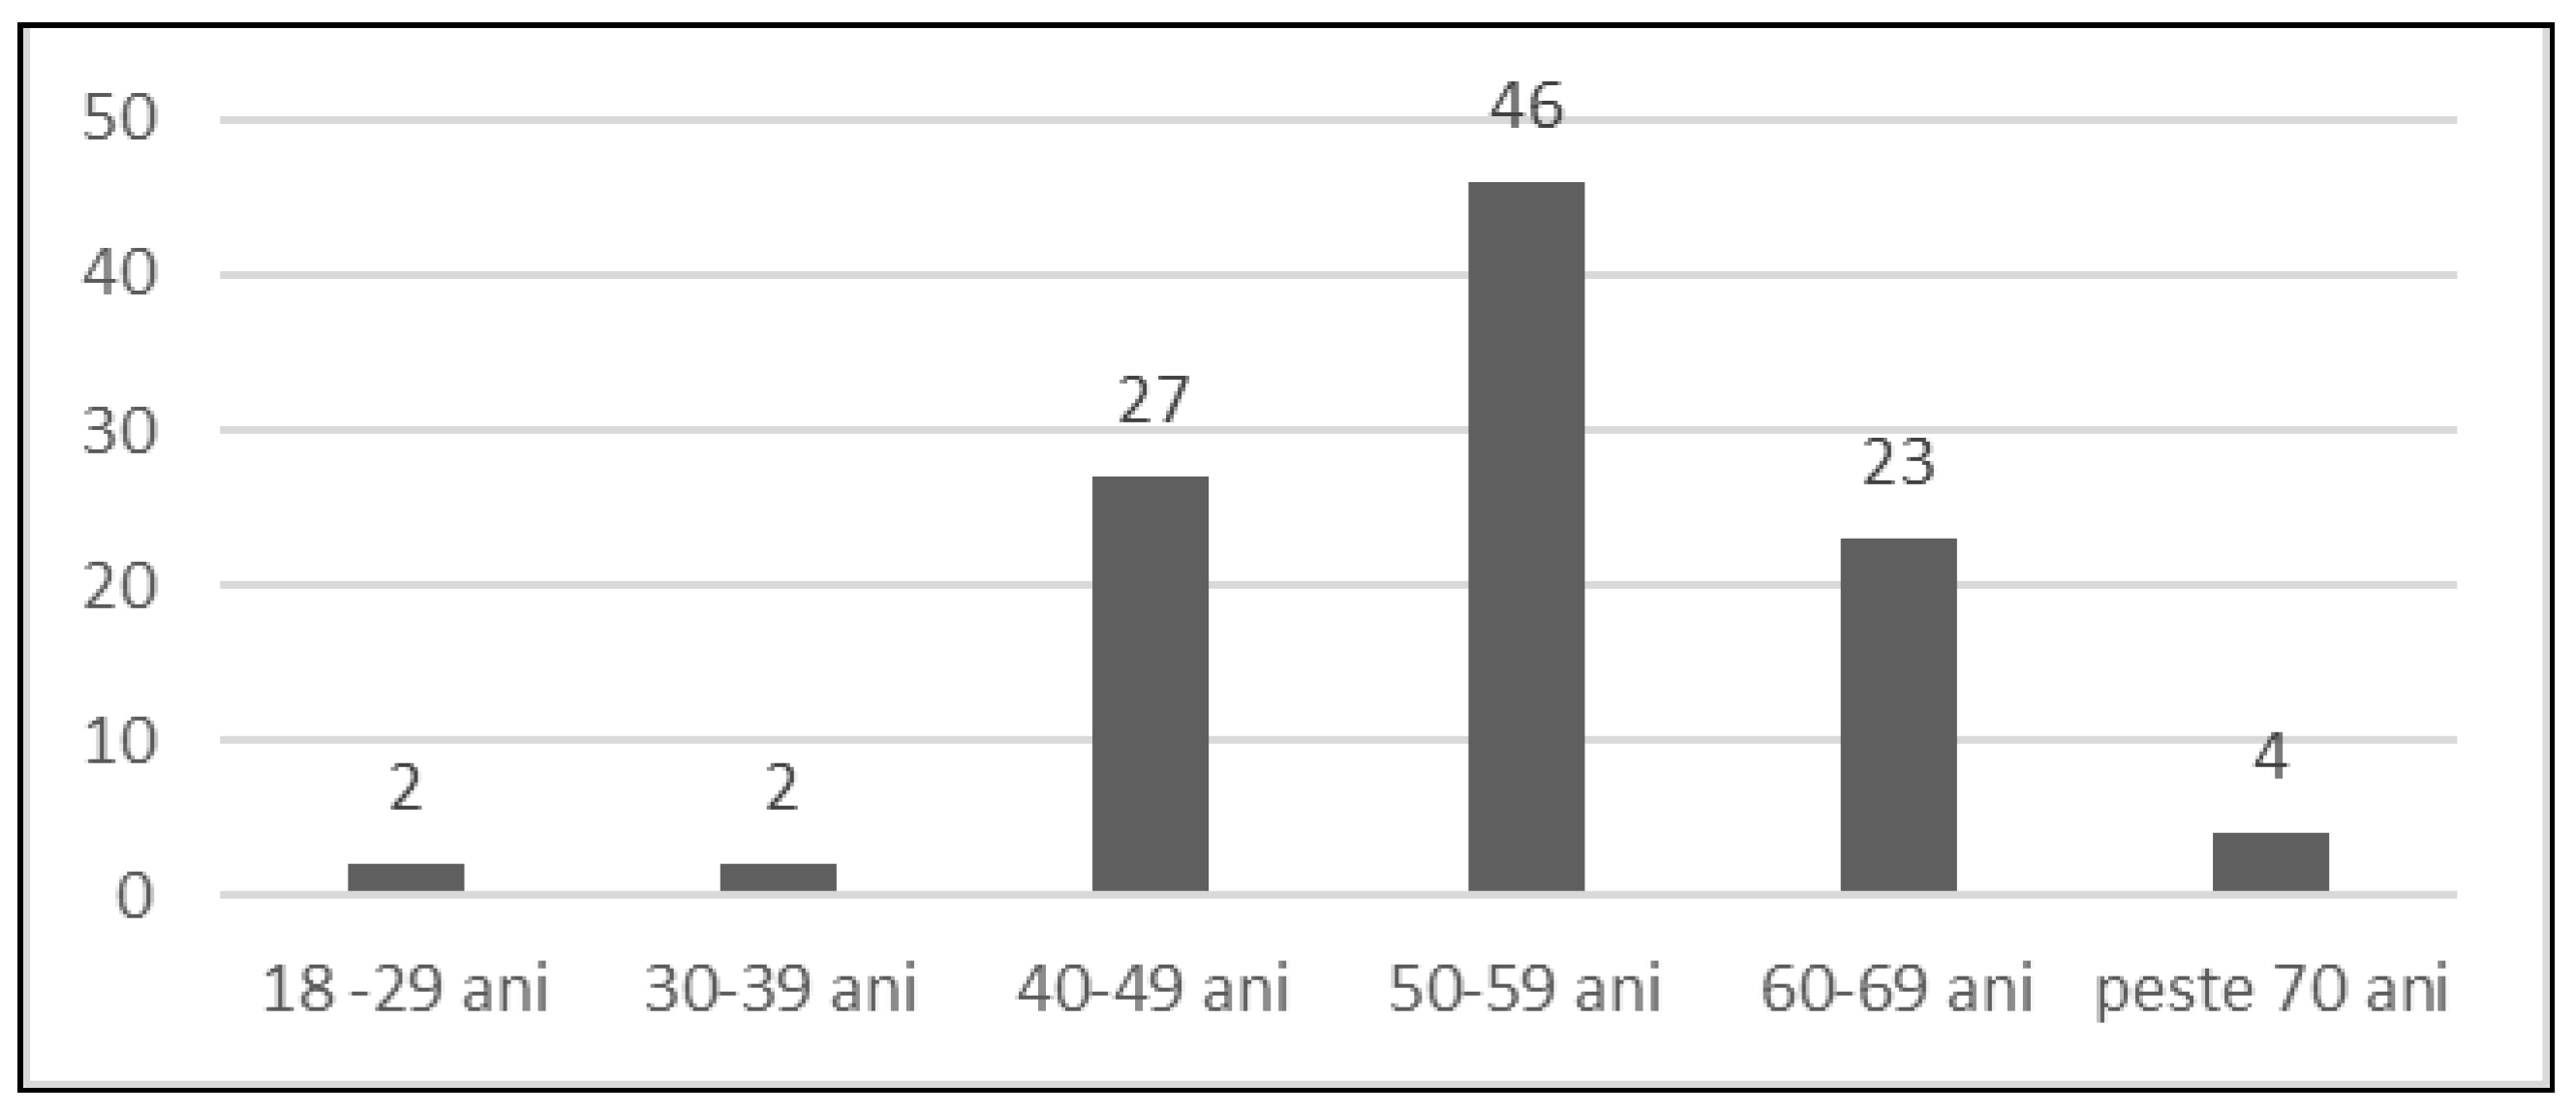
Figure 3 and
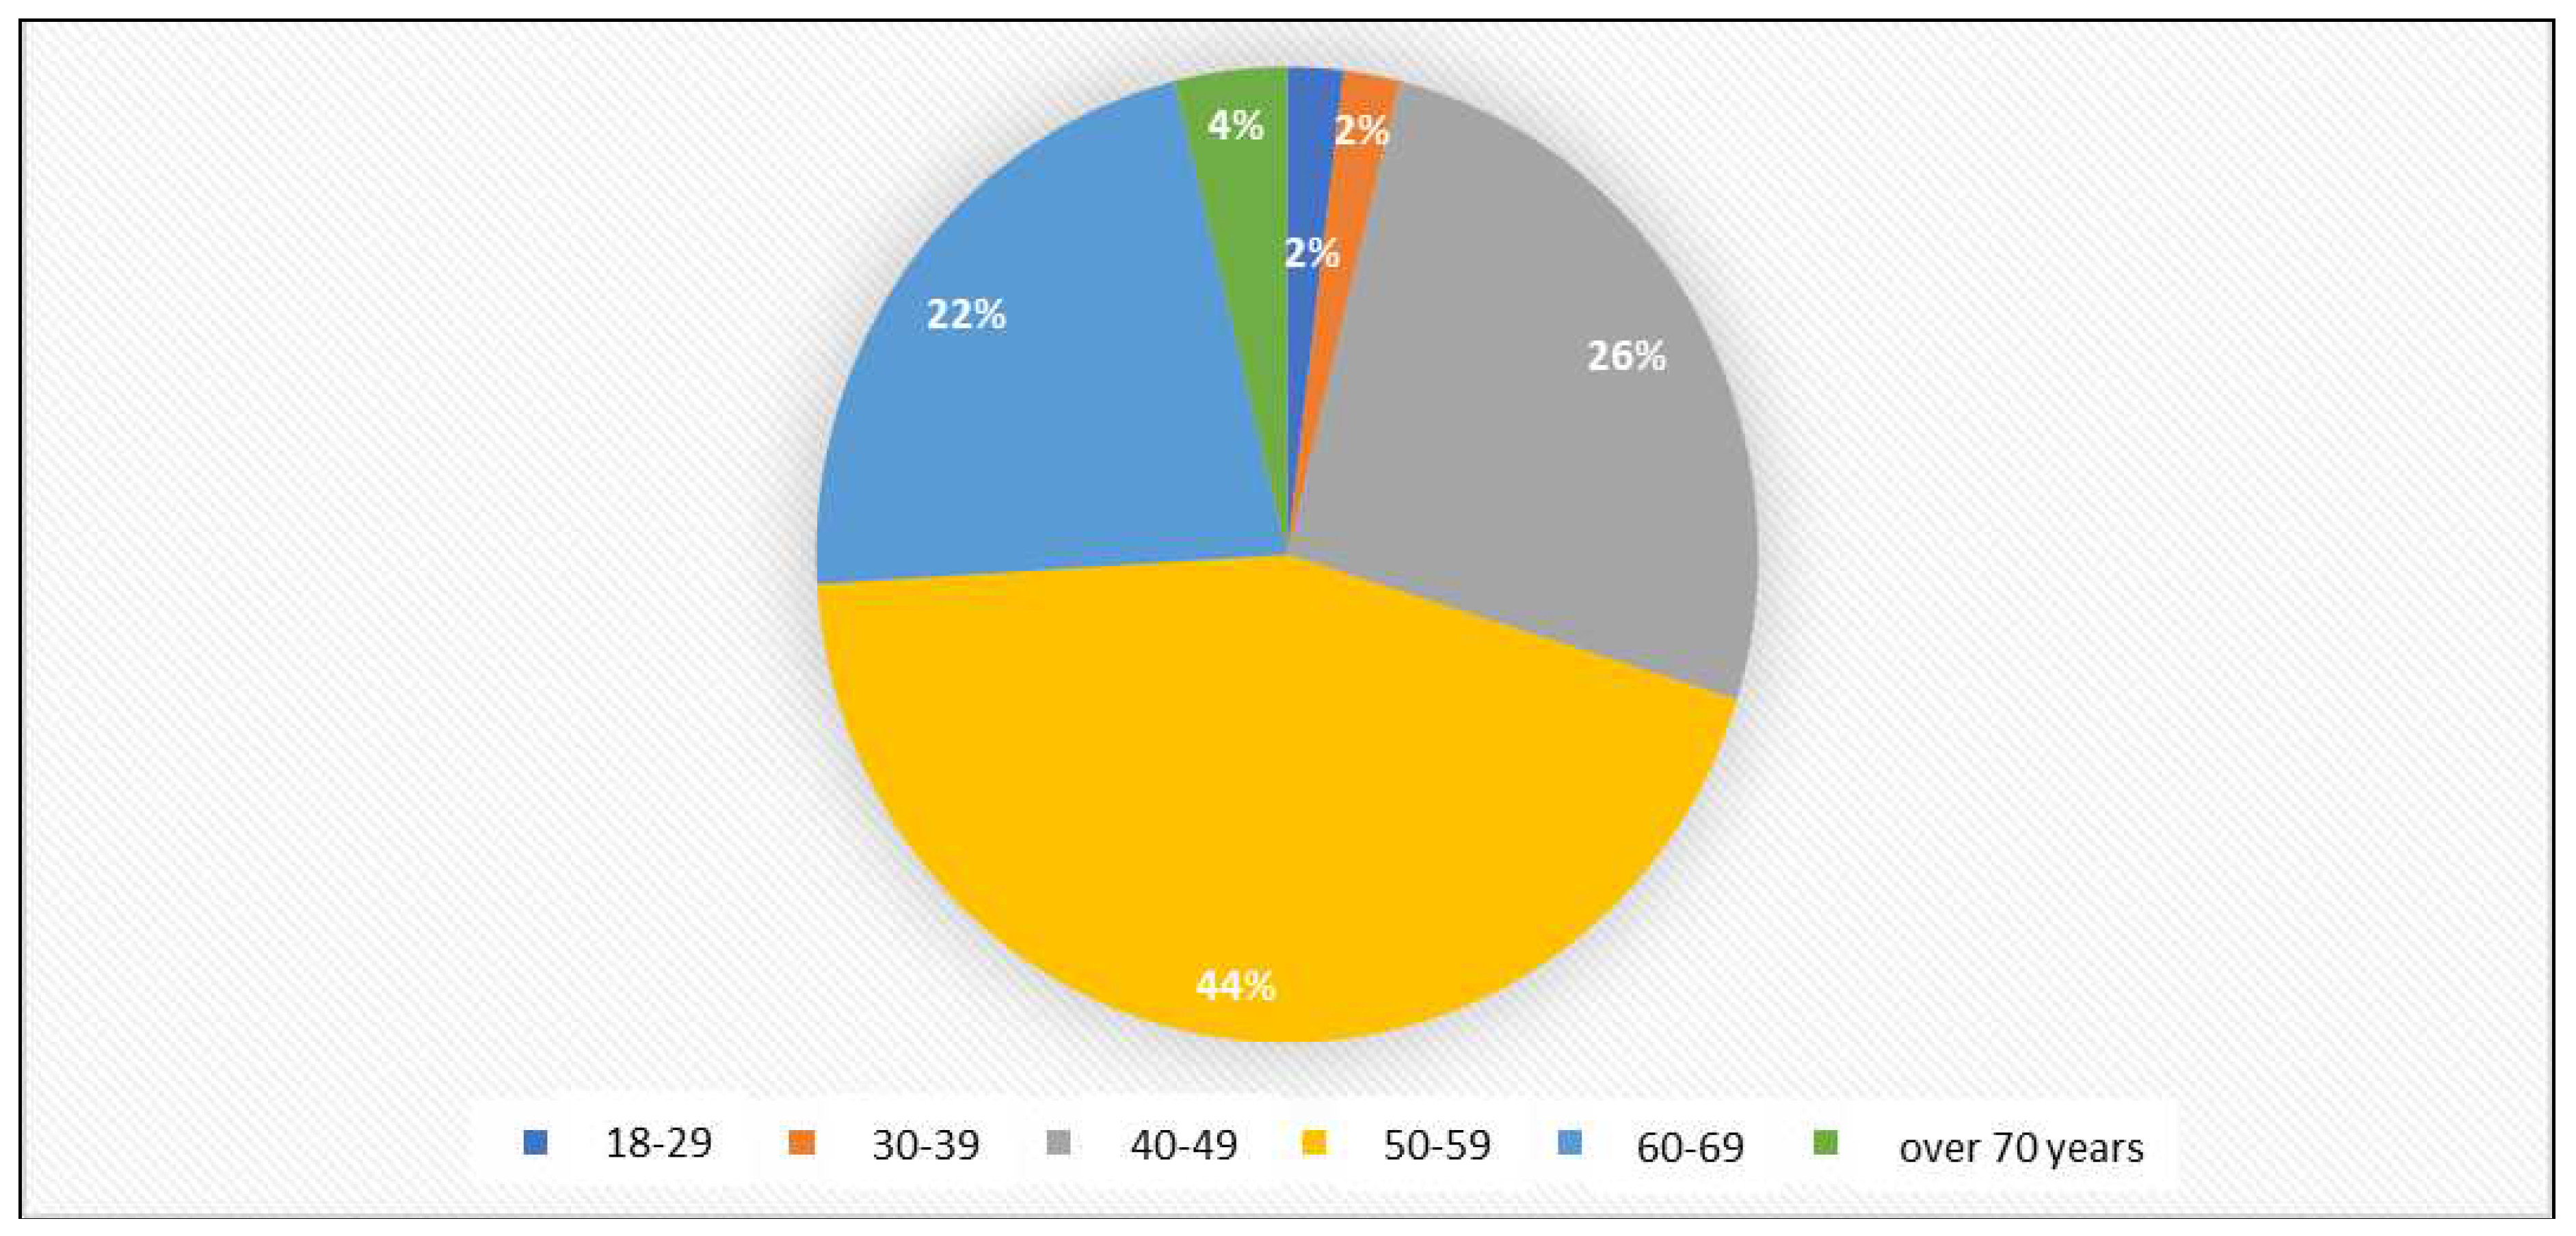
Figure 4 represent the distribution of hypertensive patients by age. Of the total number of patients, 2 patients were in the age range of 18-29 years, representing 2%, 2 patients were in the age range of 30-39 years, representing 2%, 27 patients were in the age range of 40-49 years, representing 26%, 46 patients were in the age range of 50-59 years, representing 44%, 23 patients were in the age range of 60-69 years, representing 22% and 4 patients were in the age range of over 70 years, representing 4%.
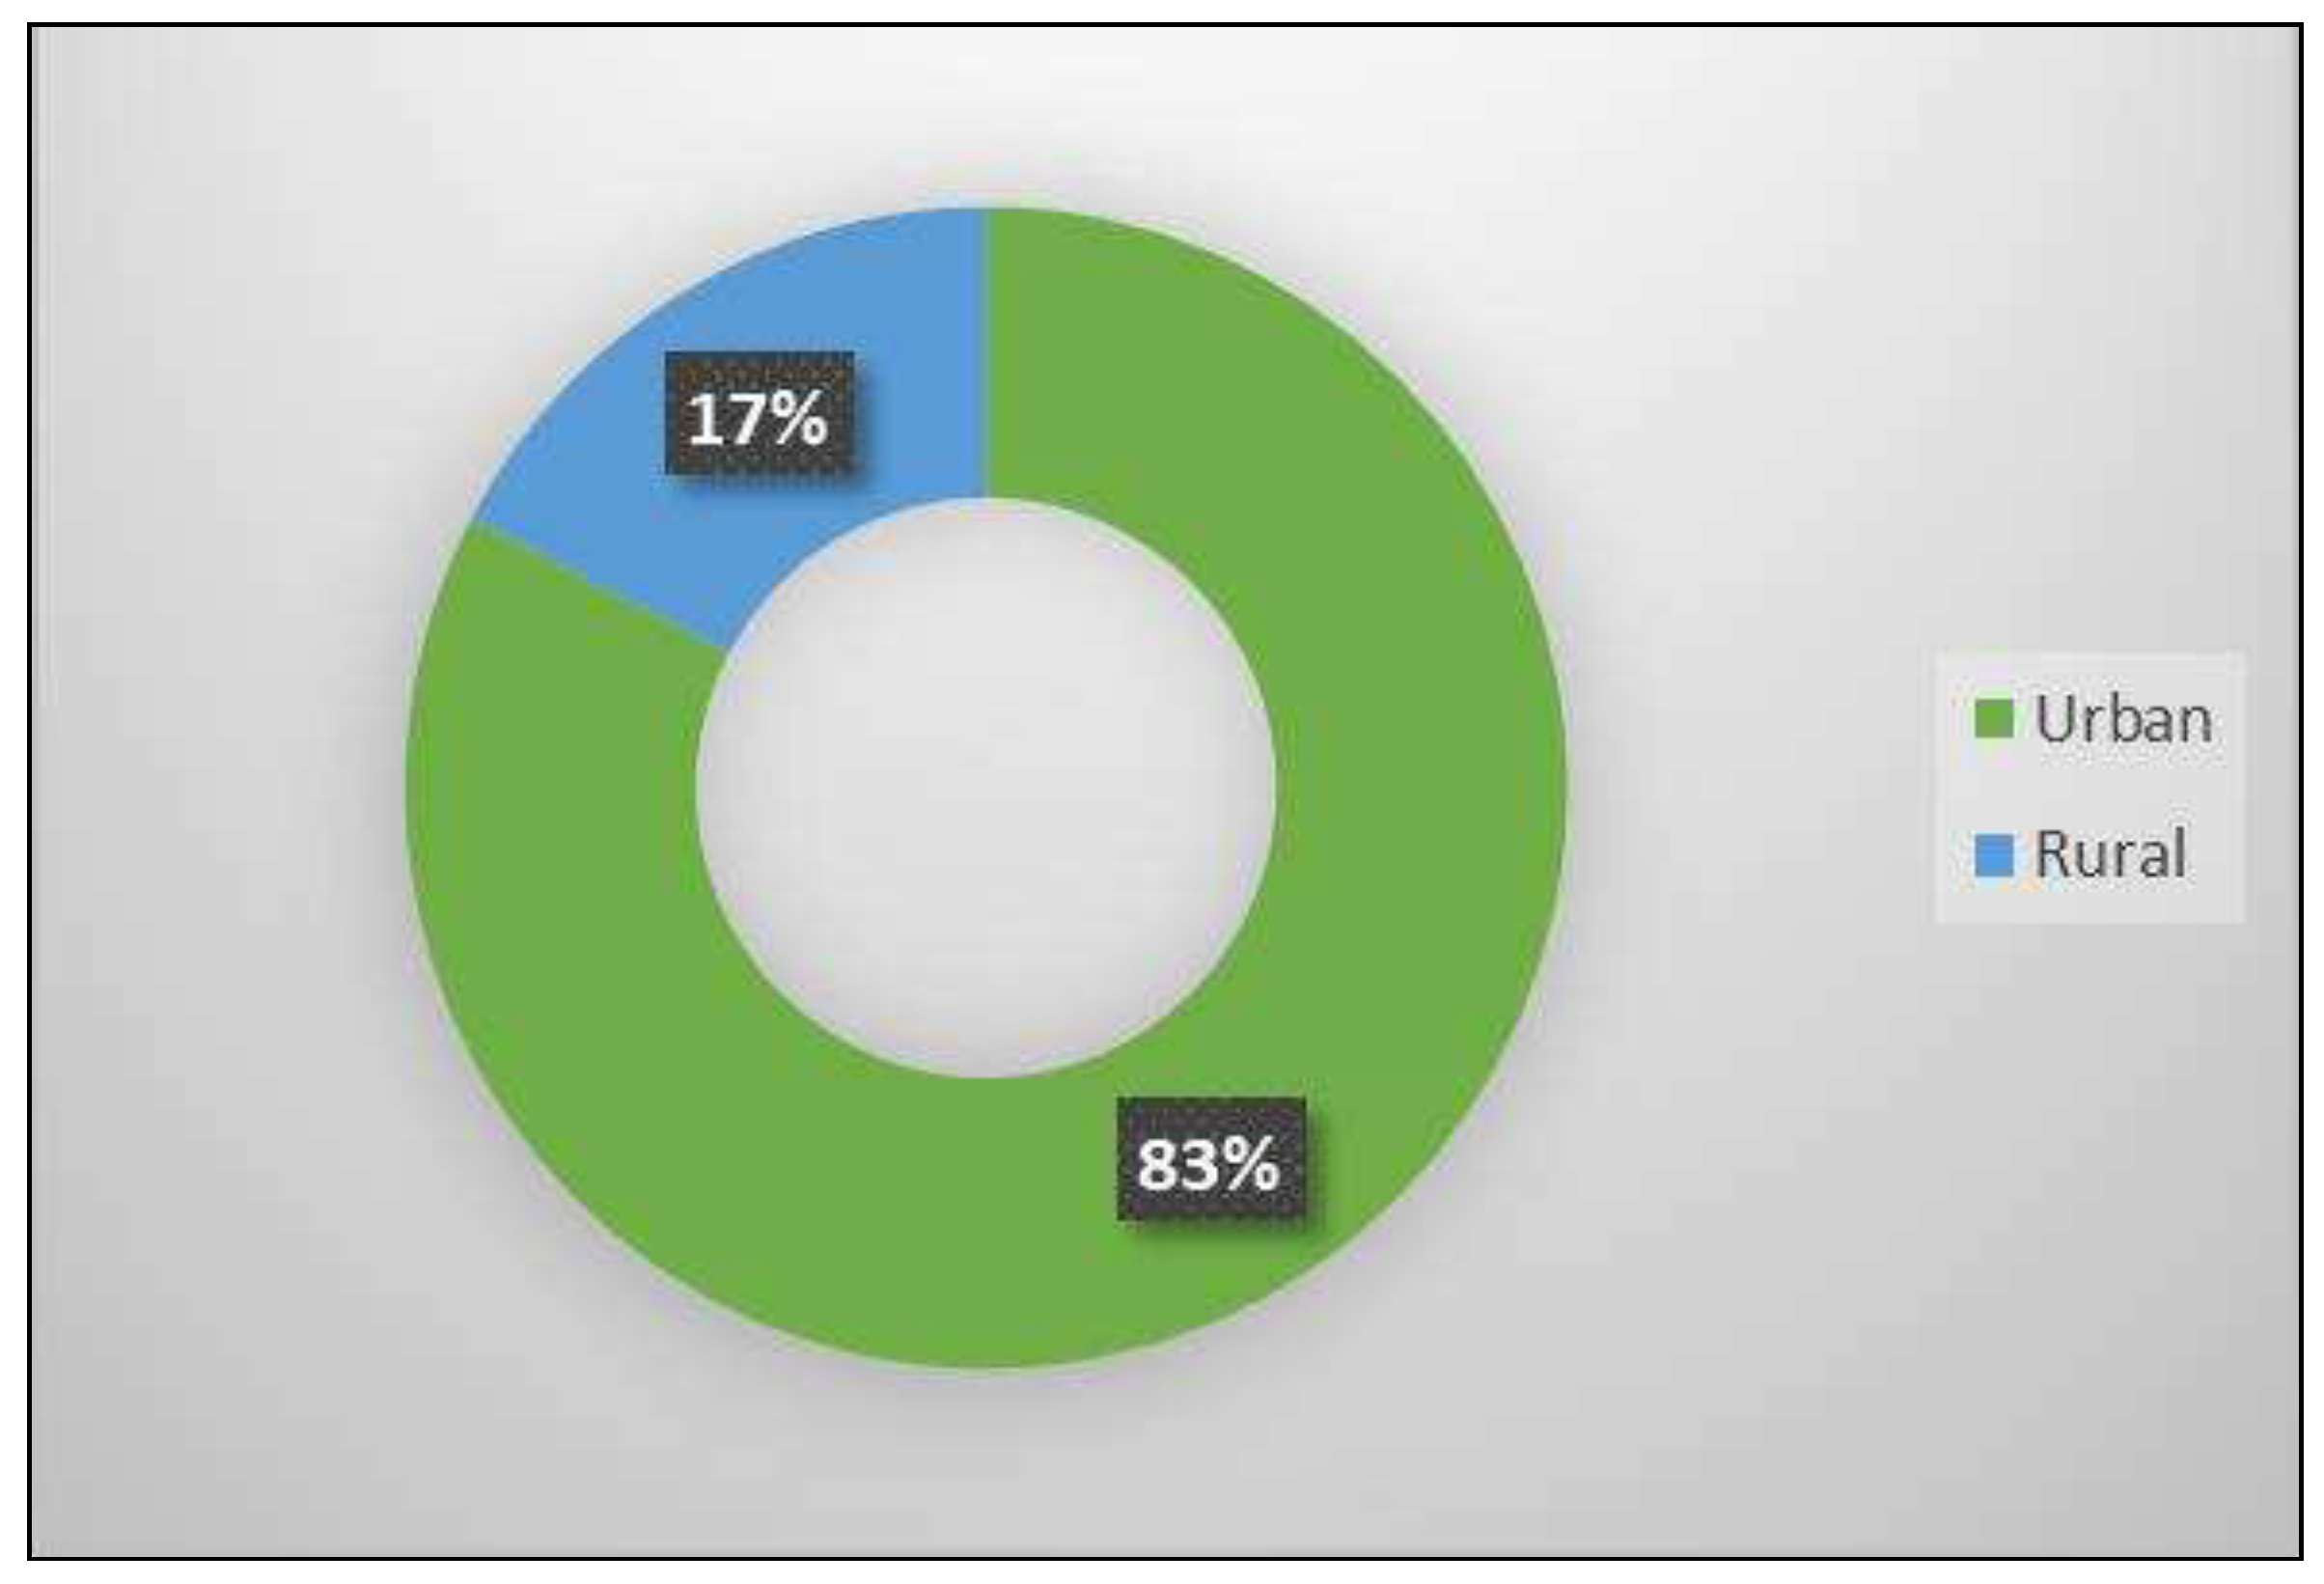
Figure 5 represents the distribution of hypertensive patients according to the medium of origin. Of the total number of patients, 83% came from urban areas and 17% from rural areas.
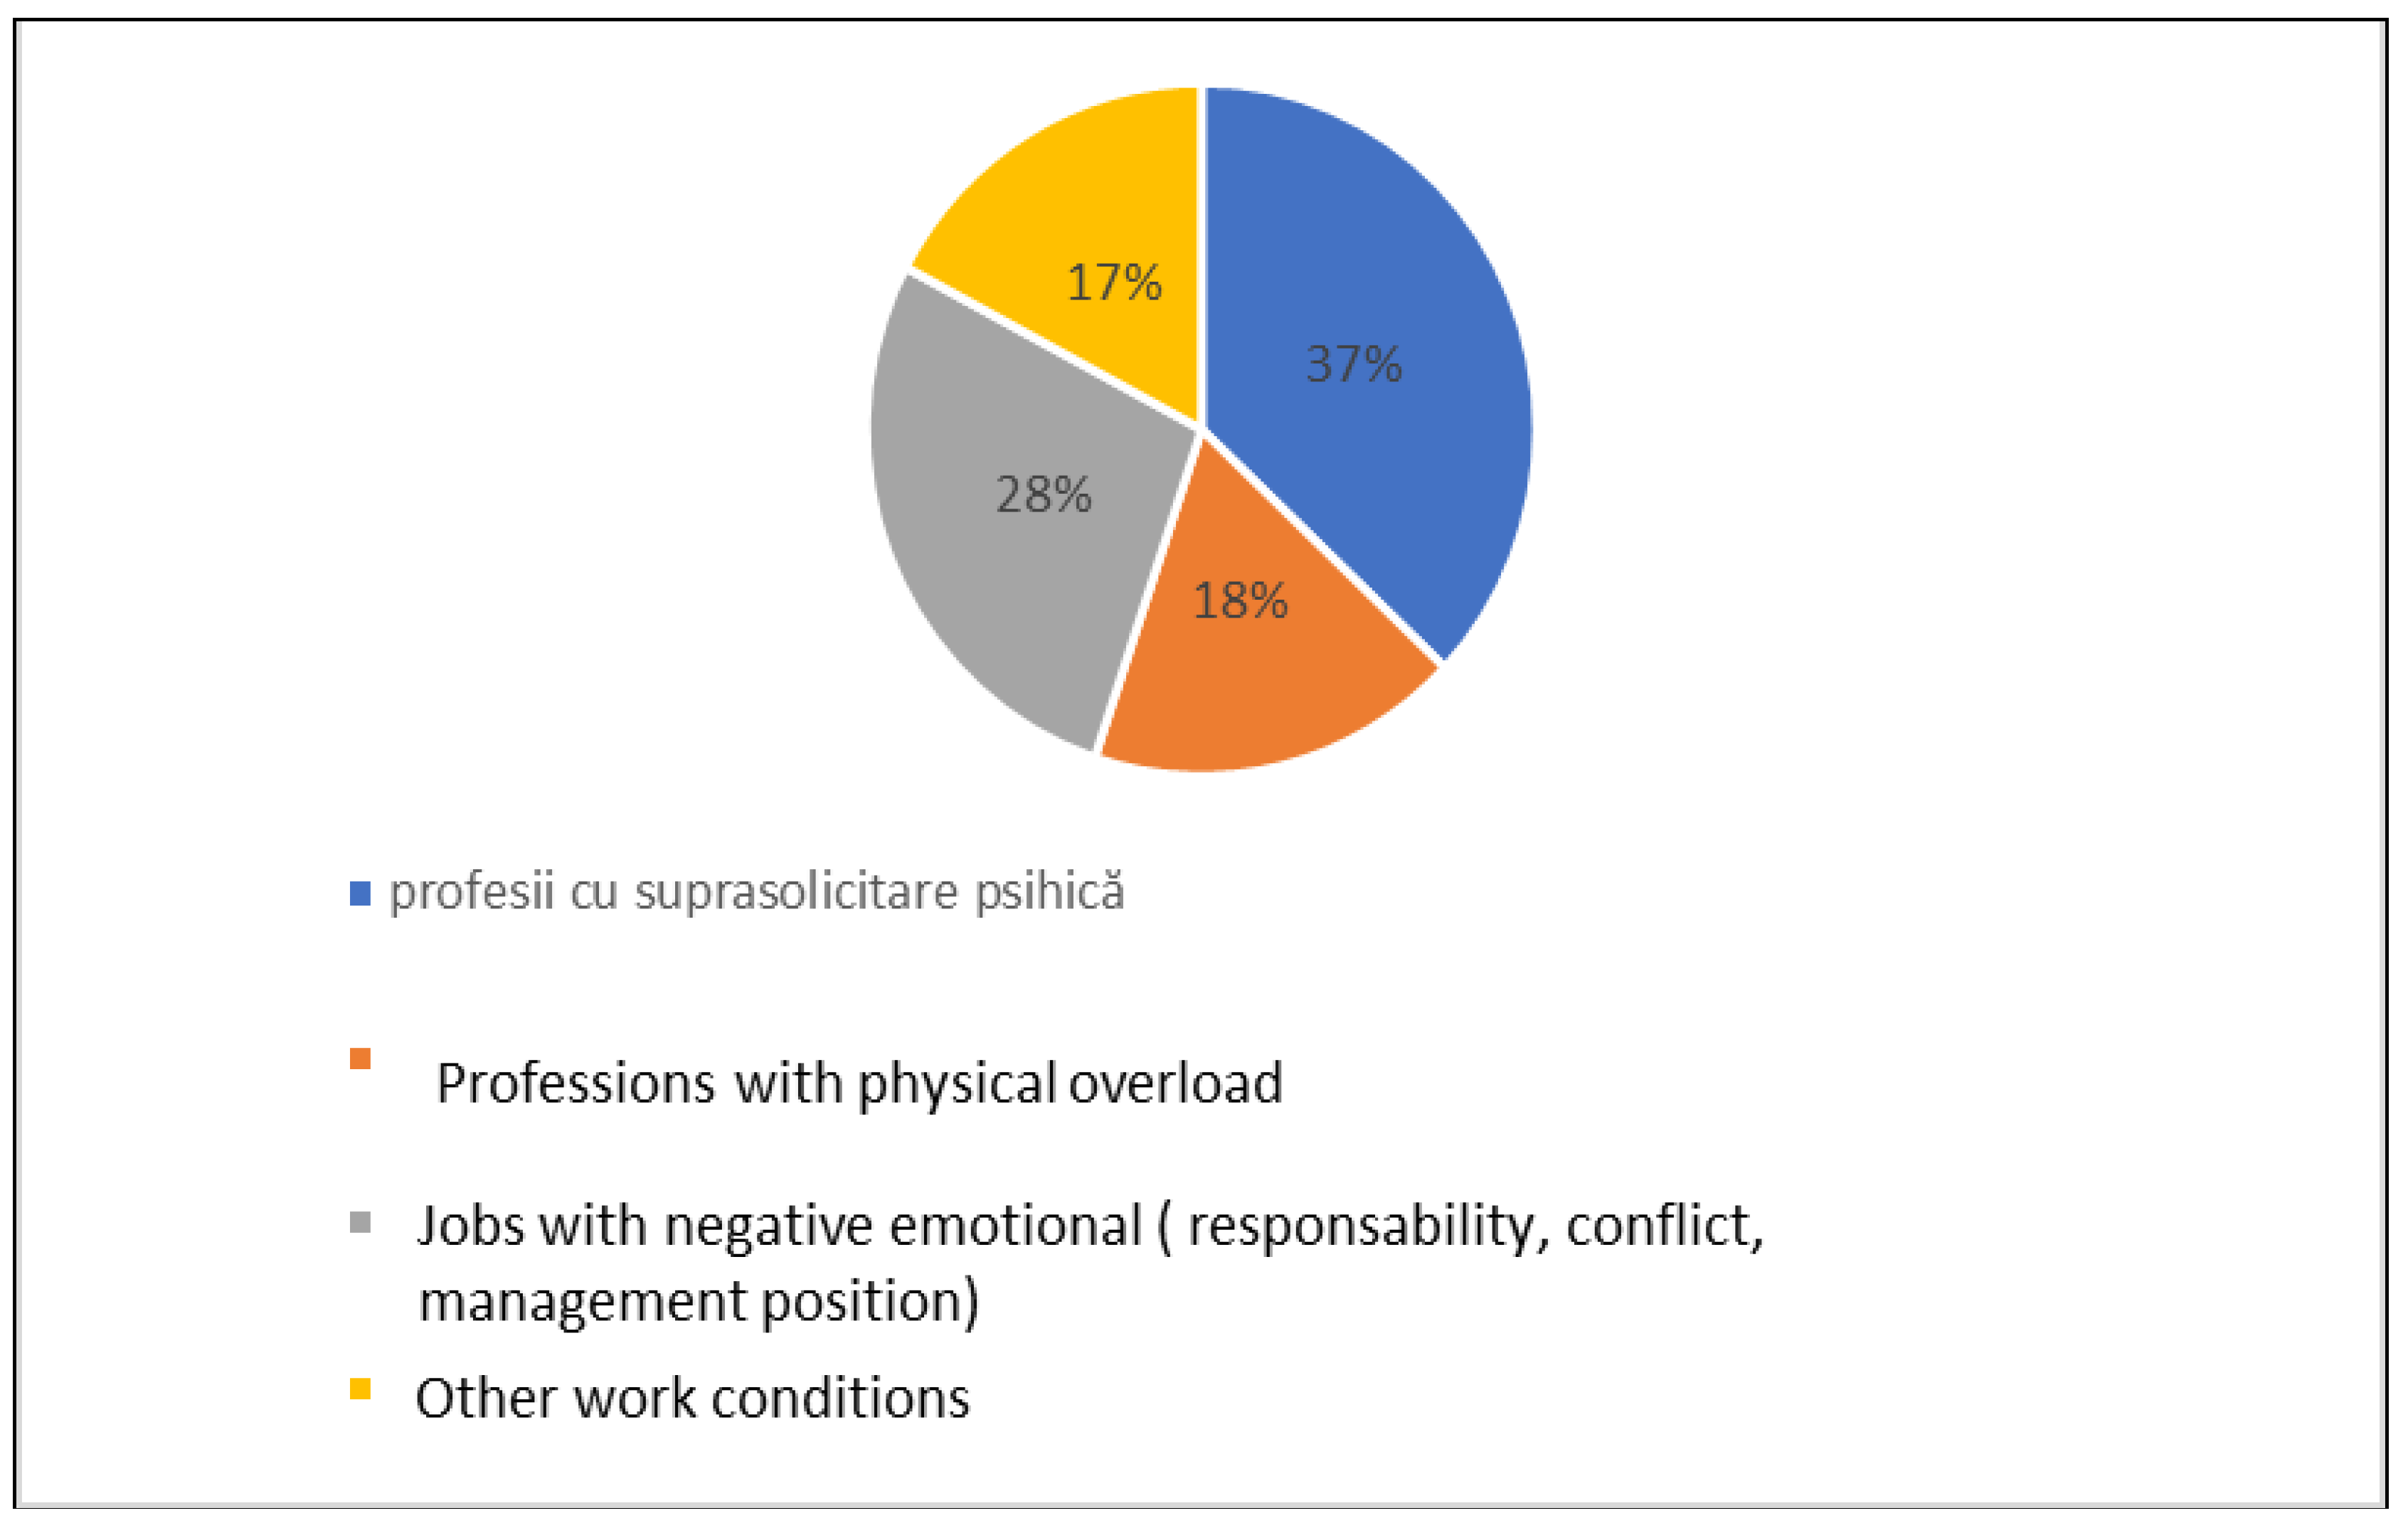
Figure 6 shows the distribution of patients with hypertension according to working conditions. 37% had professions with mental overload, 28% had jobs with negative emotional factors, 18% had professions with physical overload and 17% had other working conditions.
Figure 7 and
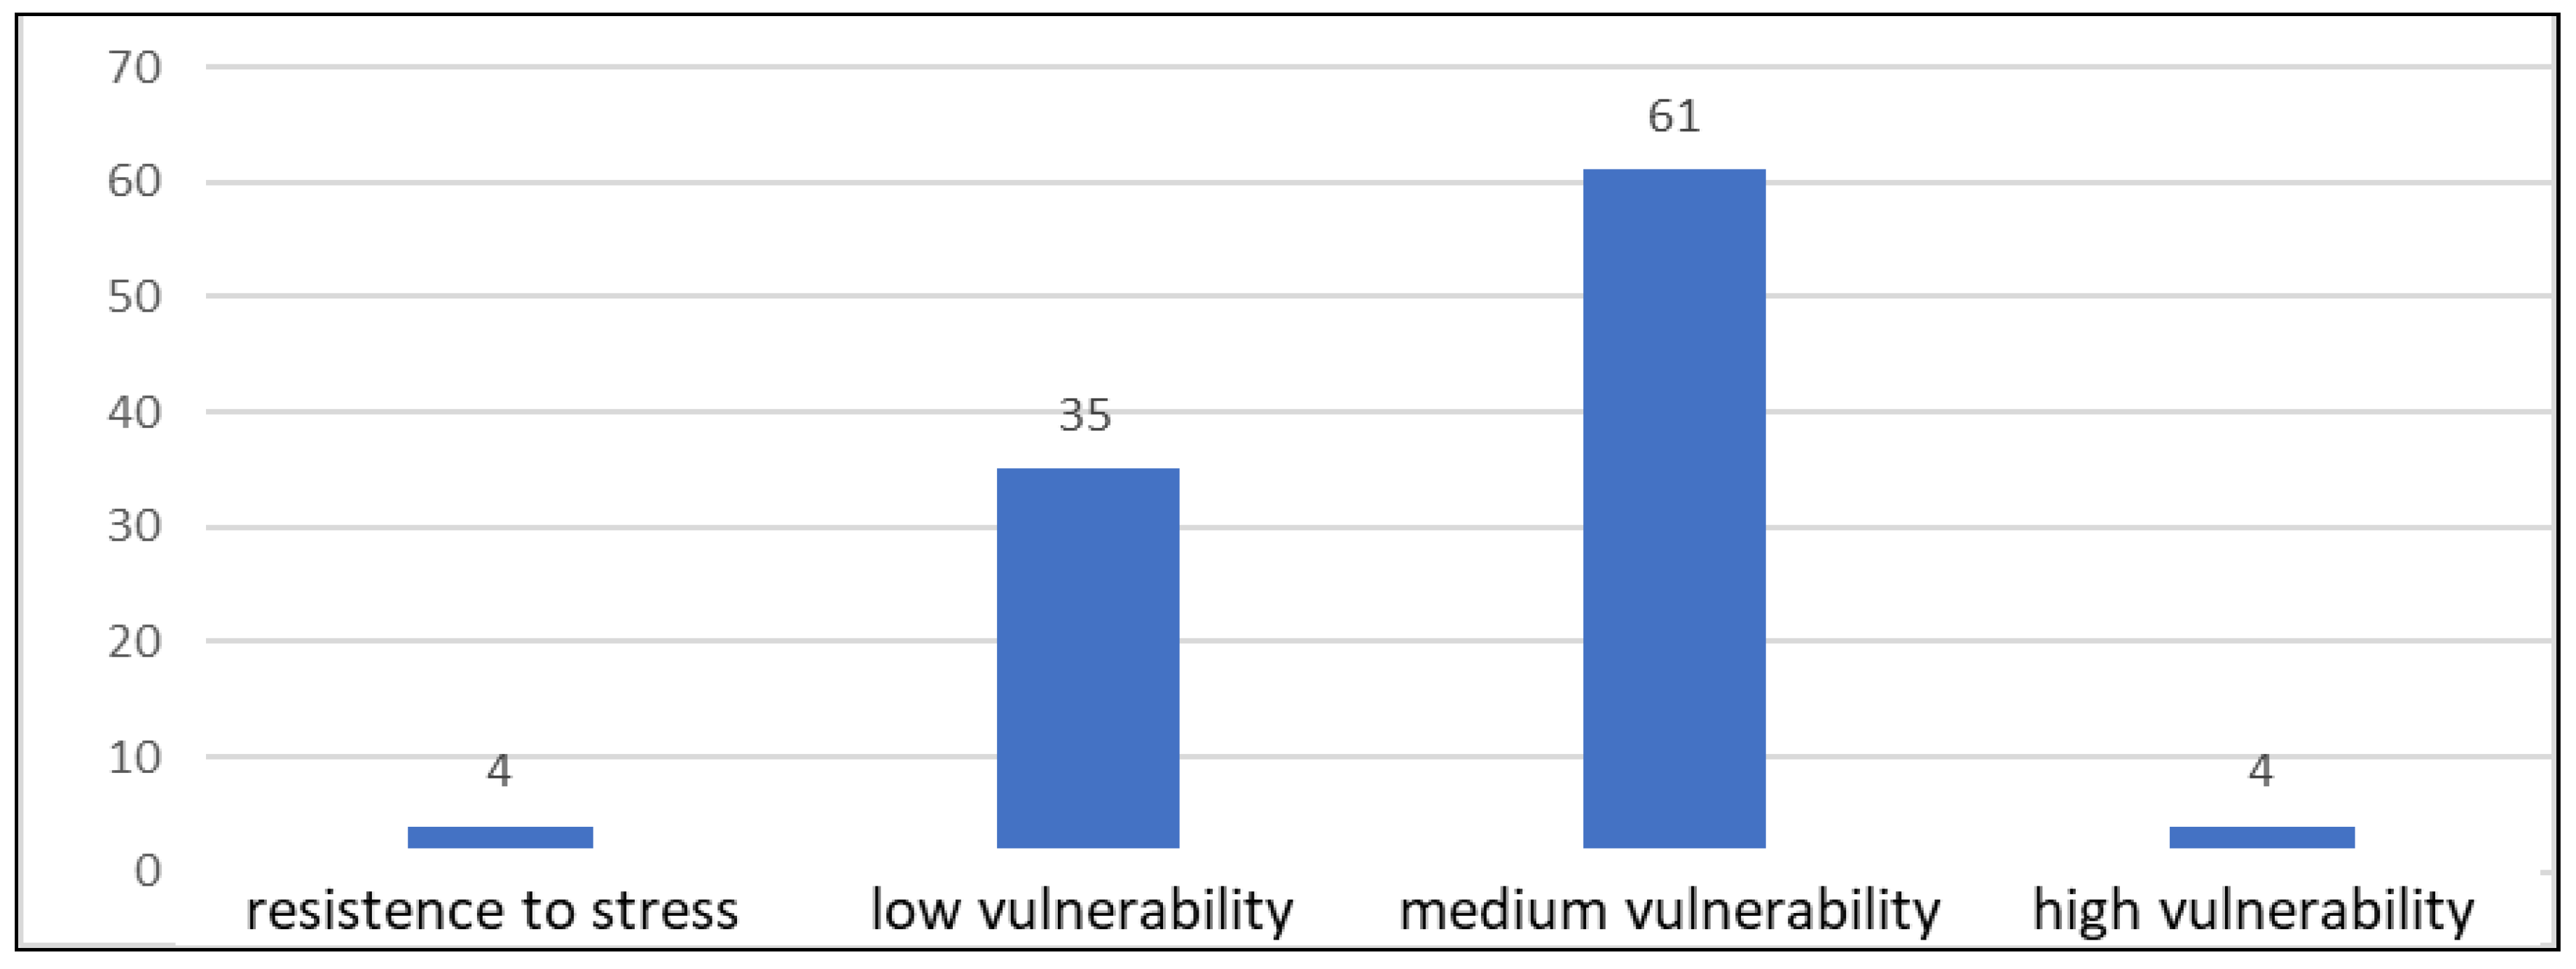
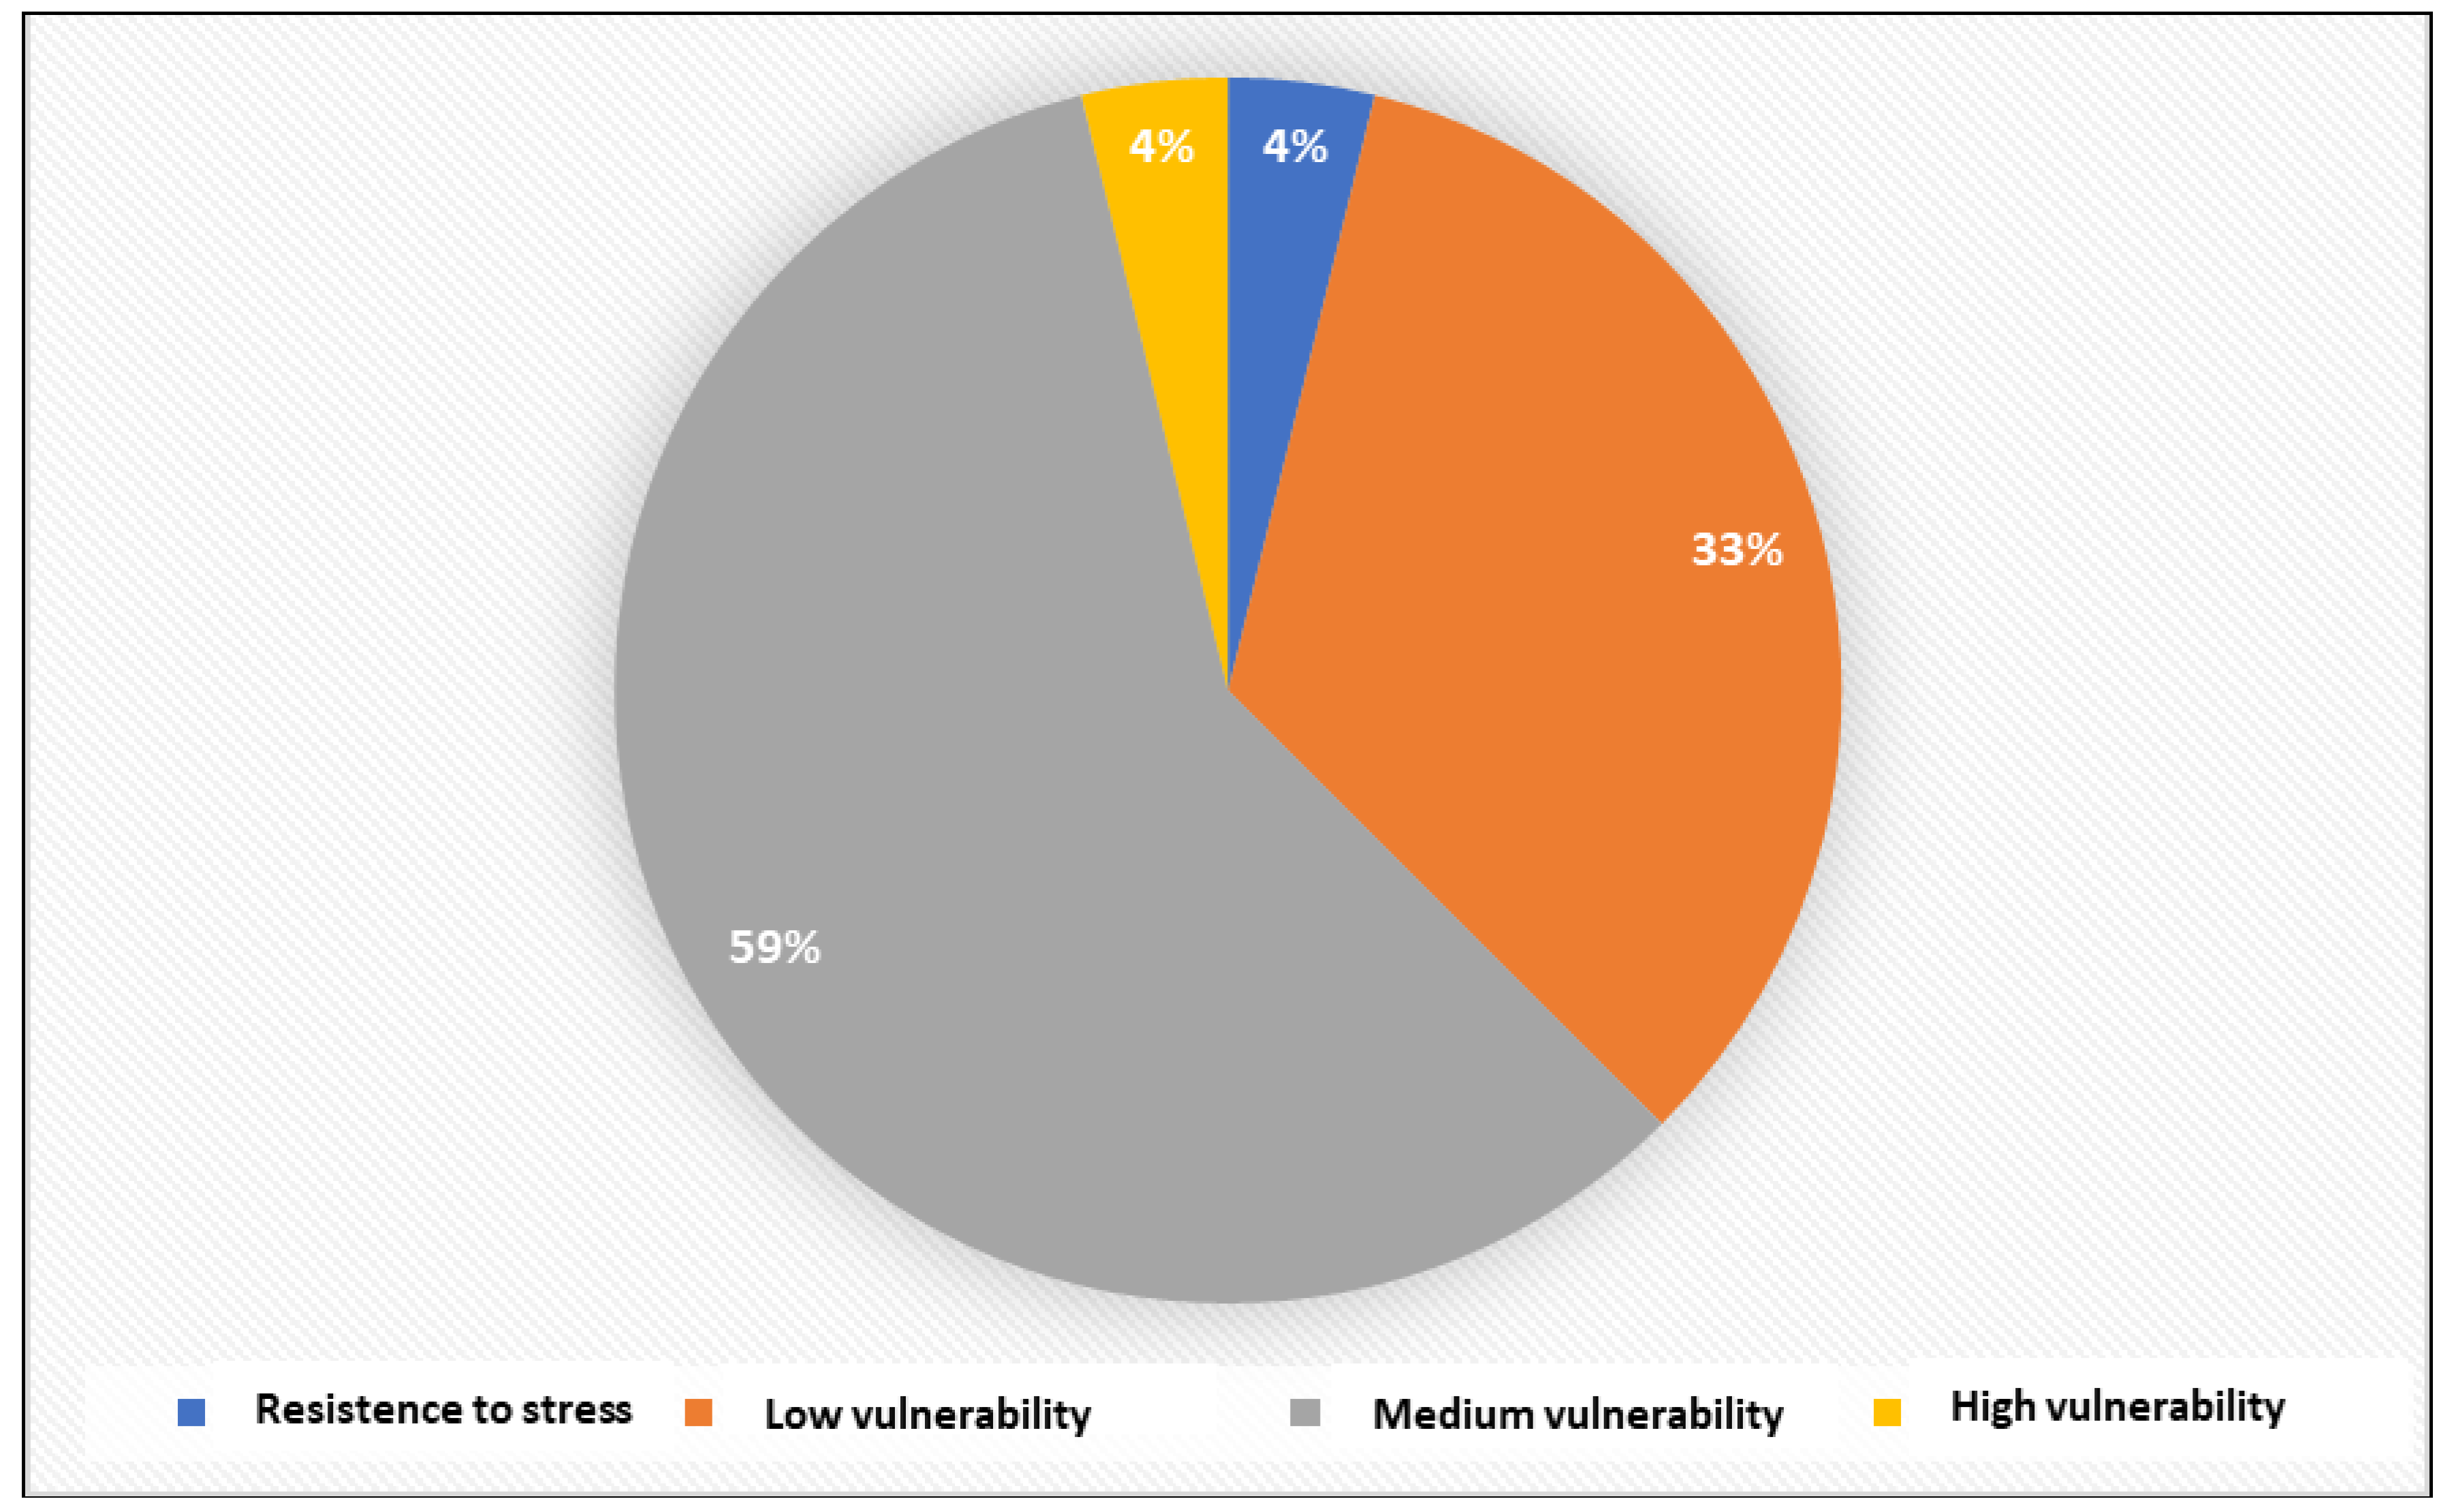
Figure 8 show the distribution of patients with hypertension according to vulnerability to stress. Thus, 4 patients, representing 4%, showed resistance to stress, 35 patients, representing 33%, showed low vulnerability to stress, 61 patients, representing 59%, showed medium vulnerability to stress, and 4 patients, representing 4%, showed high vulnerability to stress.
Figure 9 and
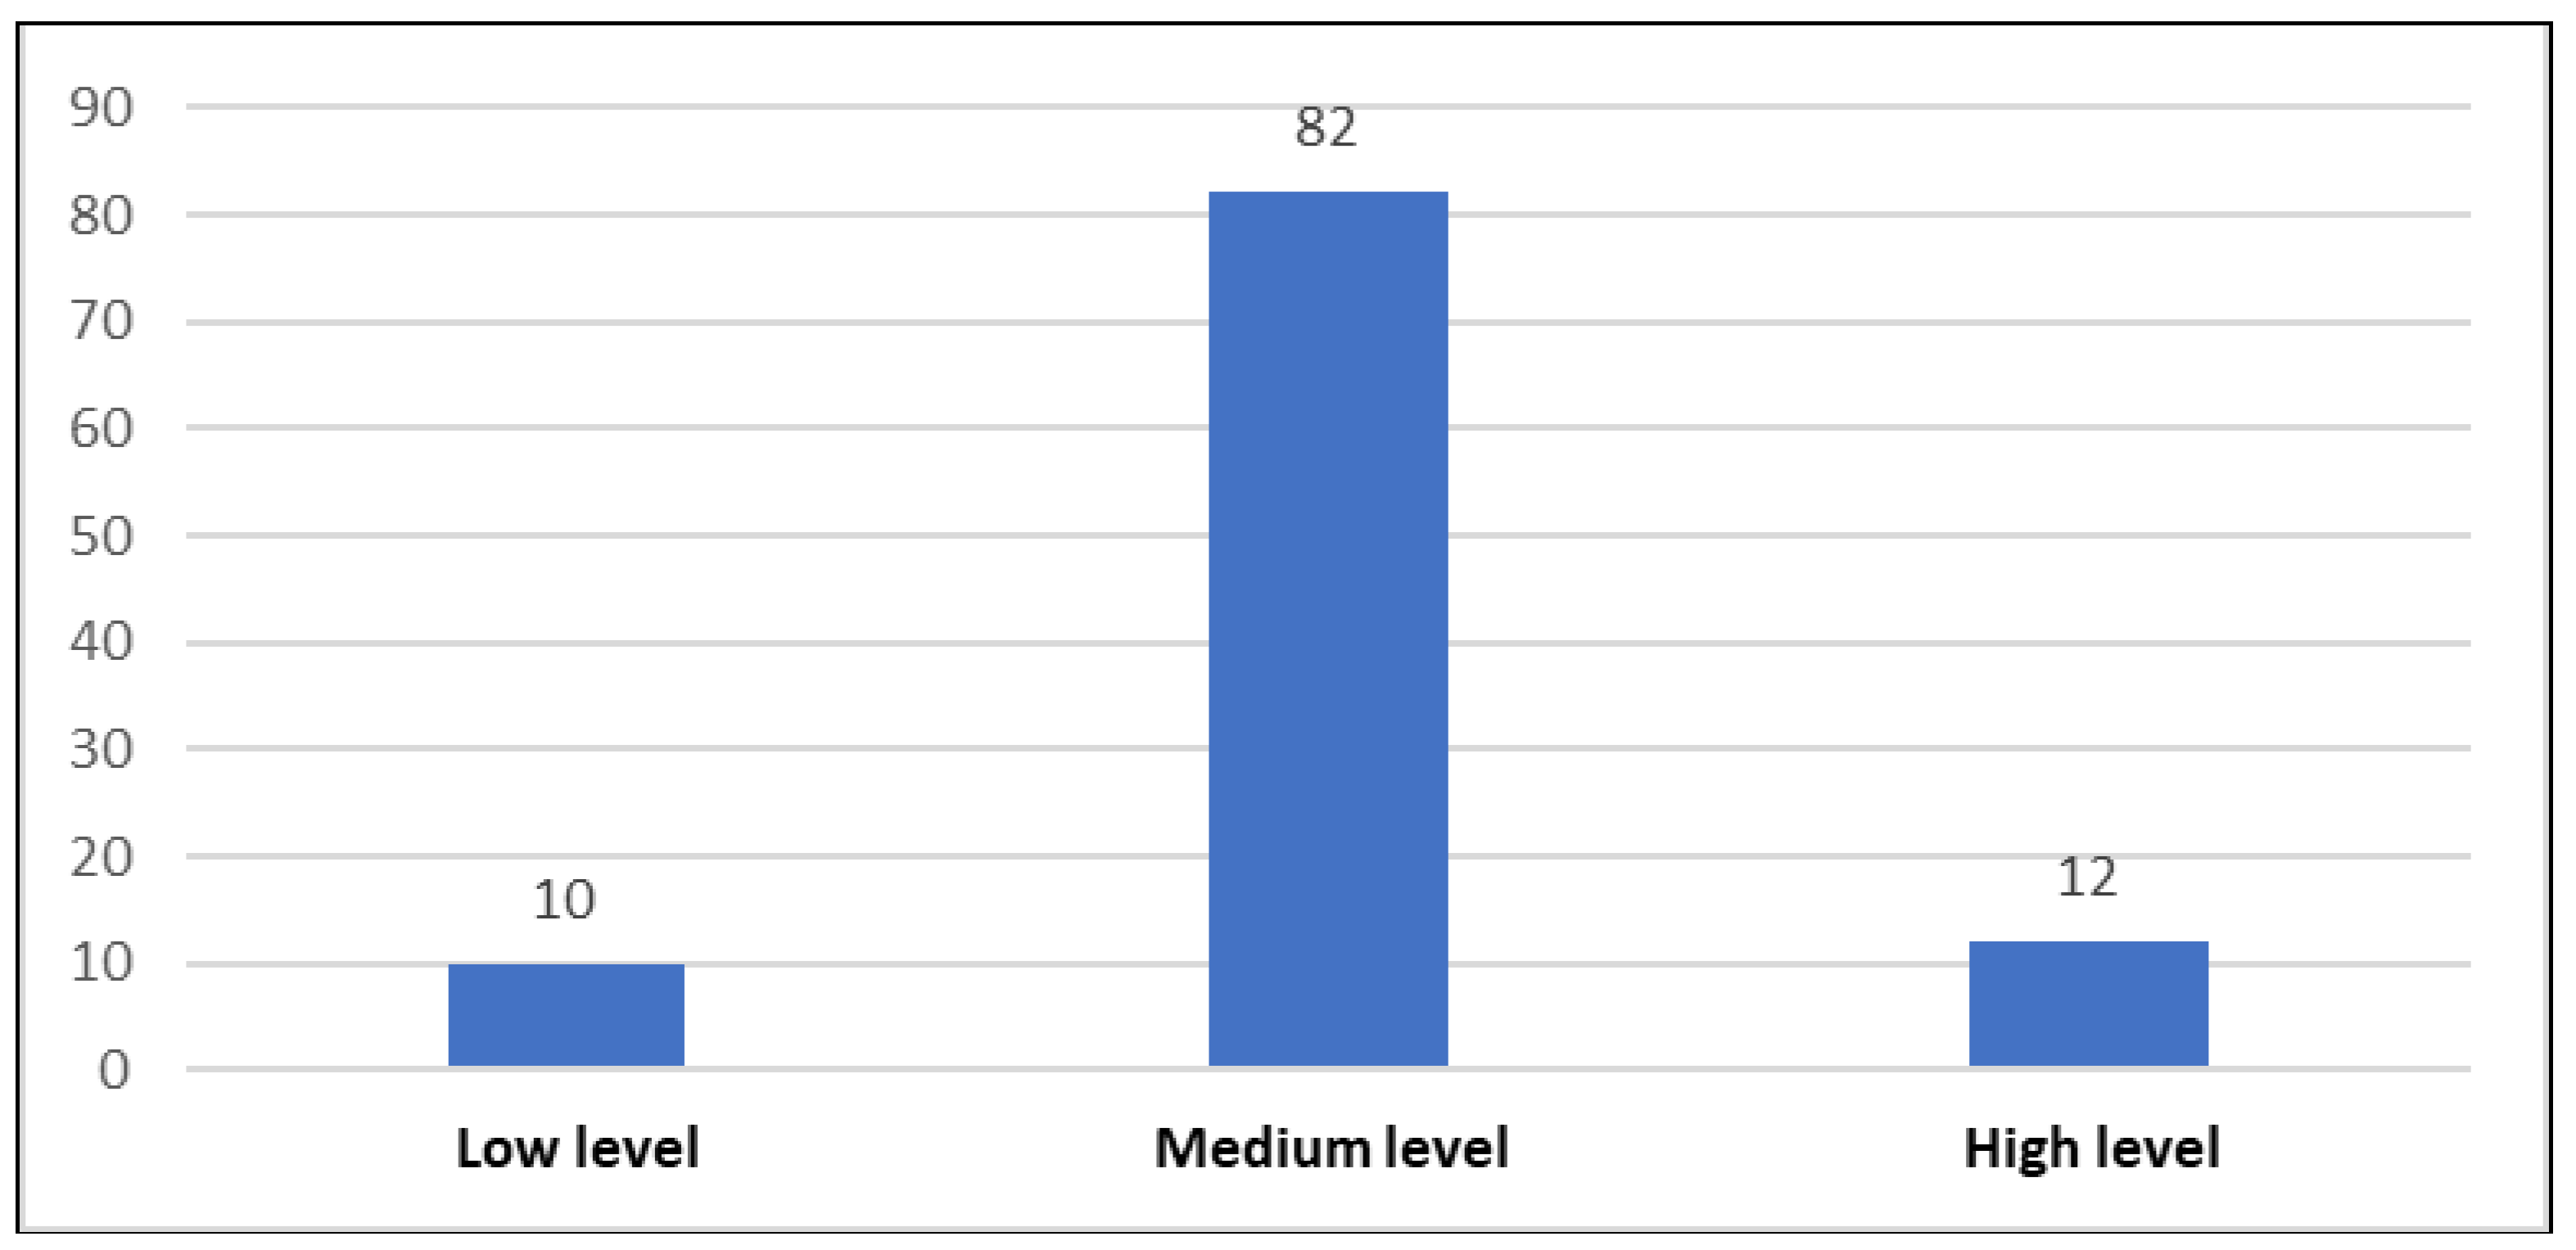
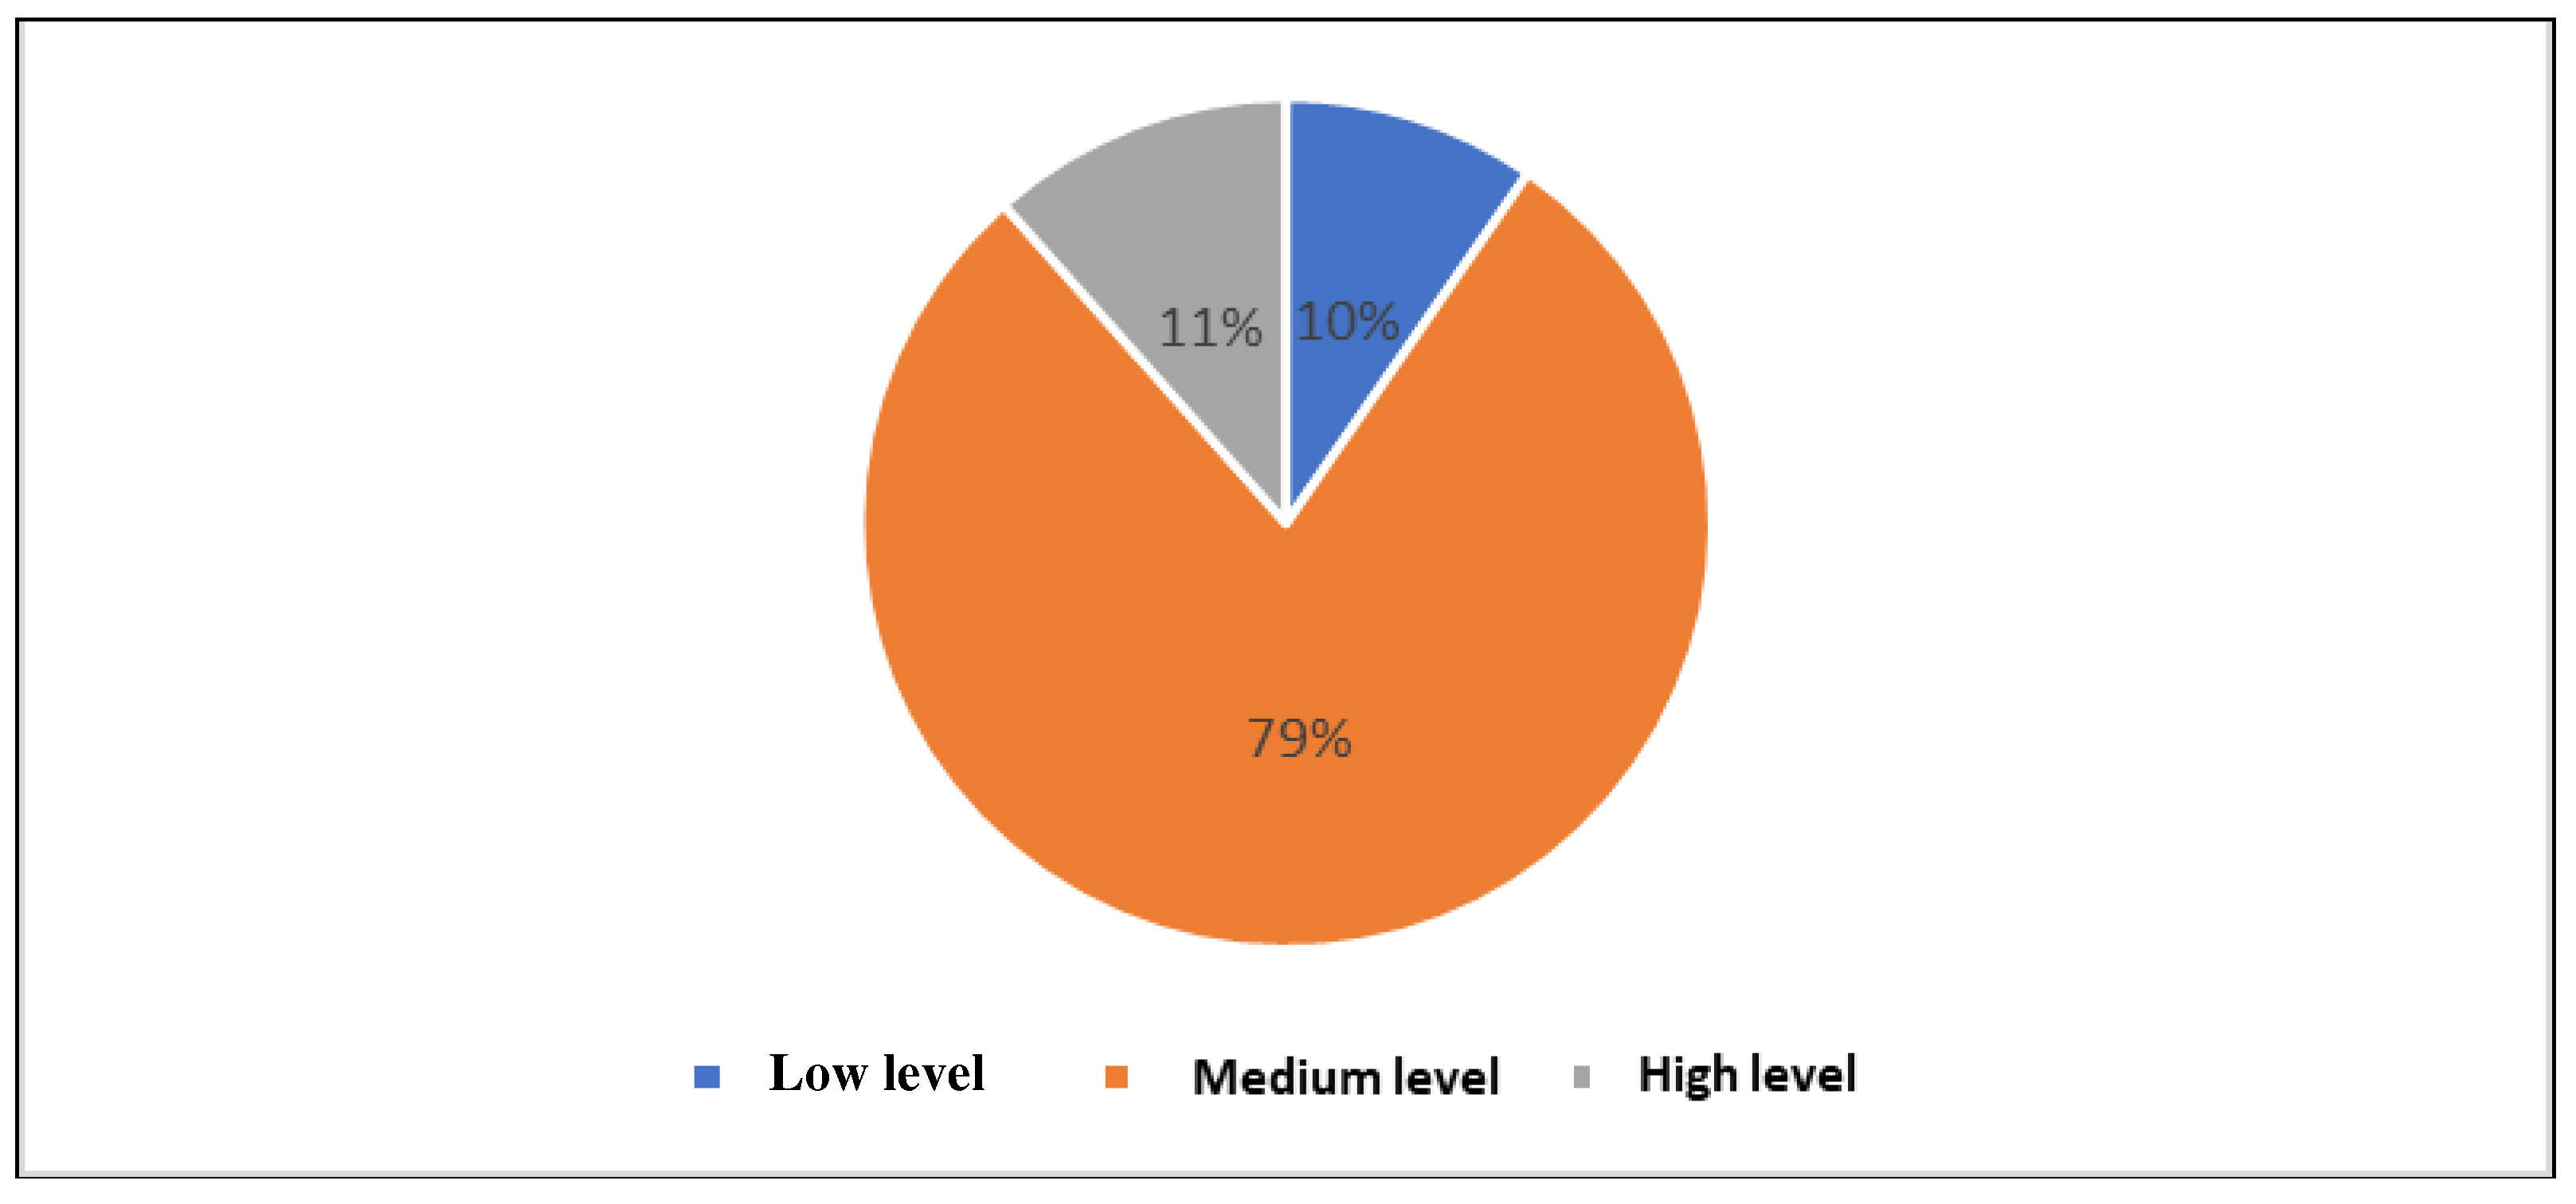
Figure 10 present the distribution of hypertensive patients according to the level of perceived stress. Of the 104 hypertensive patients enrolled in the study, 10 patients, representing 10%, had a low level of stress, 82 patients, representing 79%, had a moderate level of stress, and 12 patients, representing 11%, had a high level of stress.
Figure 11 and
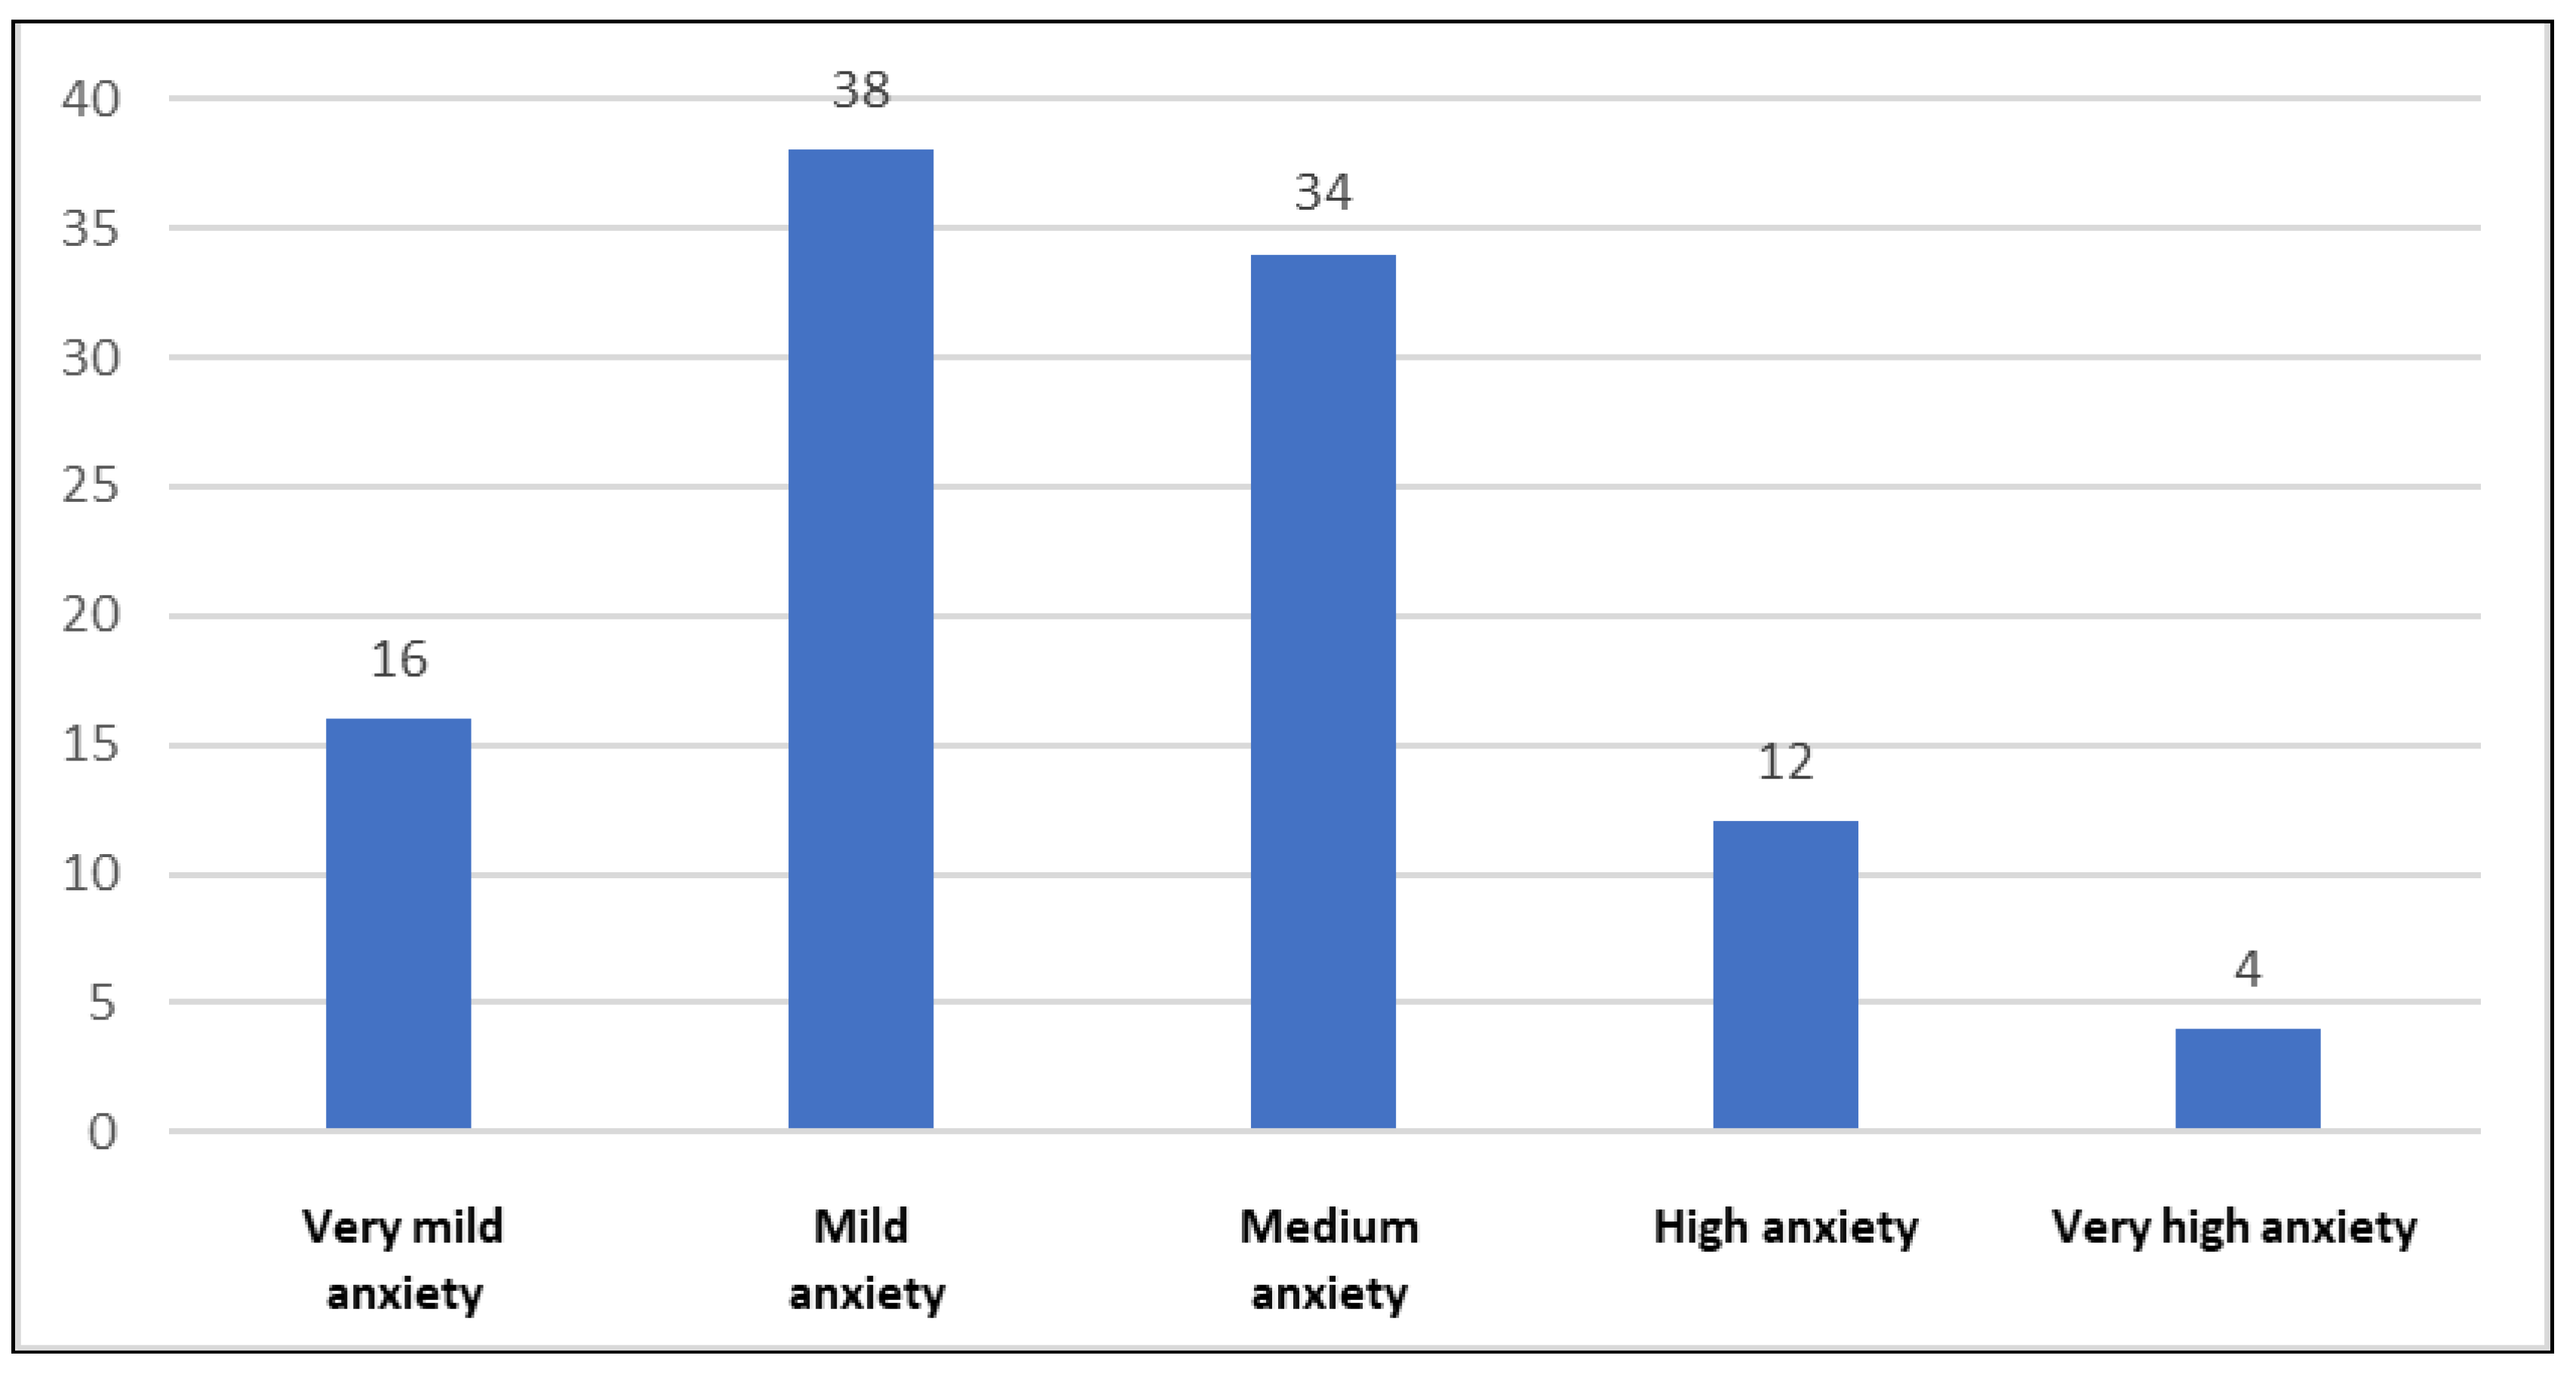
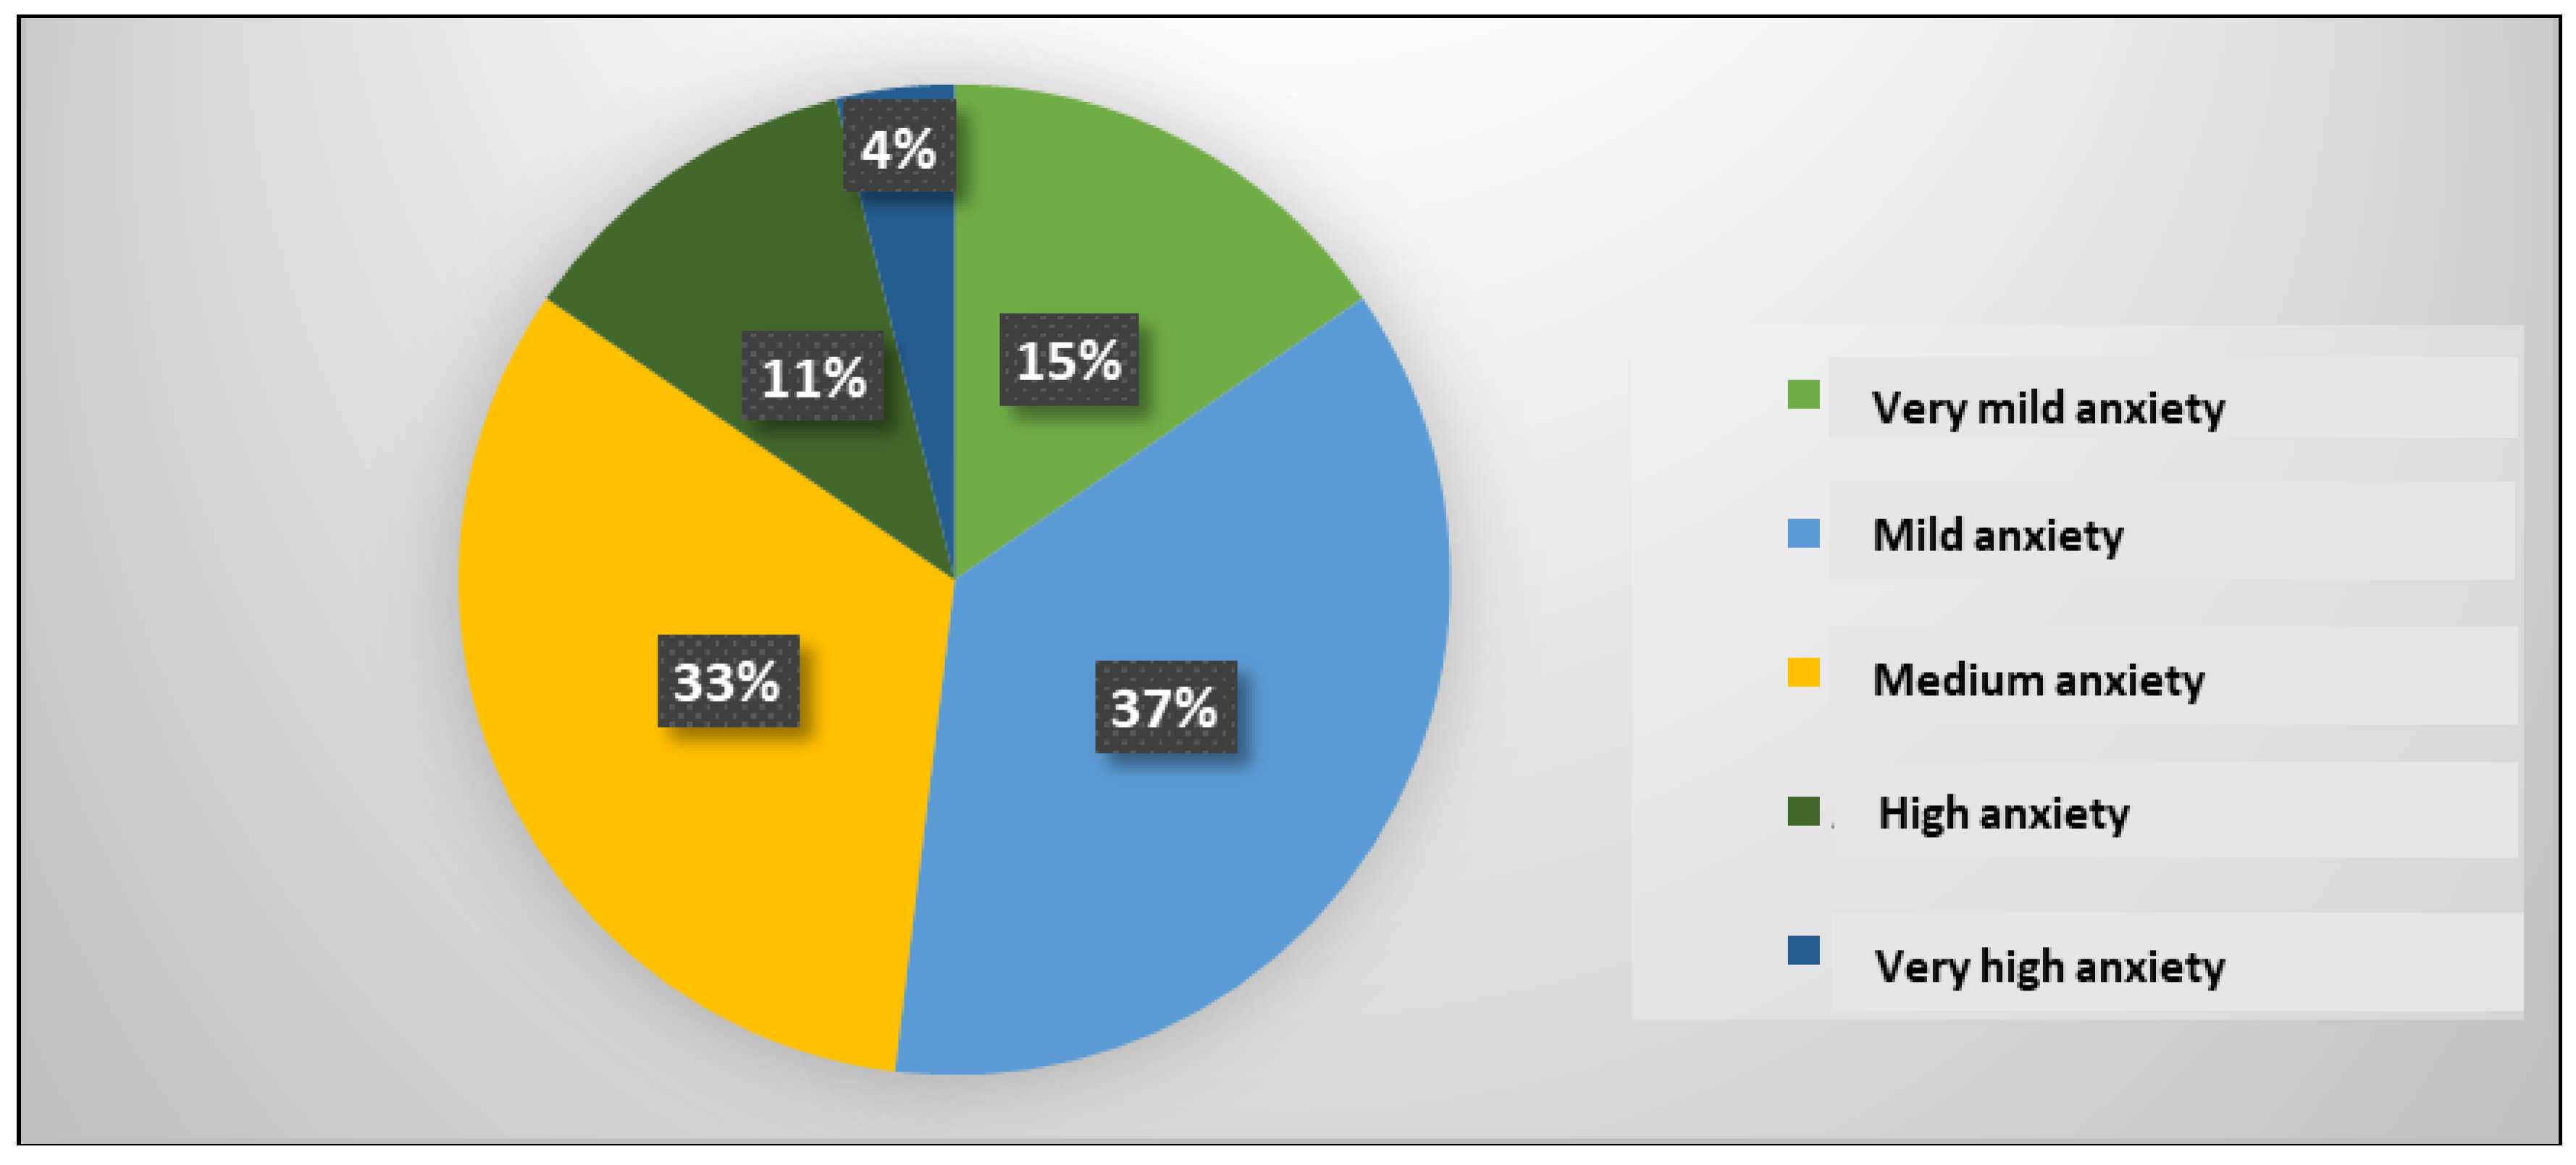
Figure 12 highlight the distribution of hypertensive patients according to the anxiety state level. 16 patients, representing 15%, had very mild anxiety, 38 patients, representing 37%, had mild anxiety, 34 patients, representing 33%, had medium anxiety, 12 patients, representing 11%, had high anxiety and 4 patients, representing 4%, had very high anxiety.
Figure 13 and
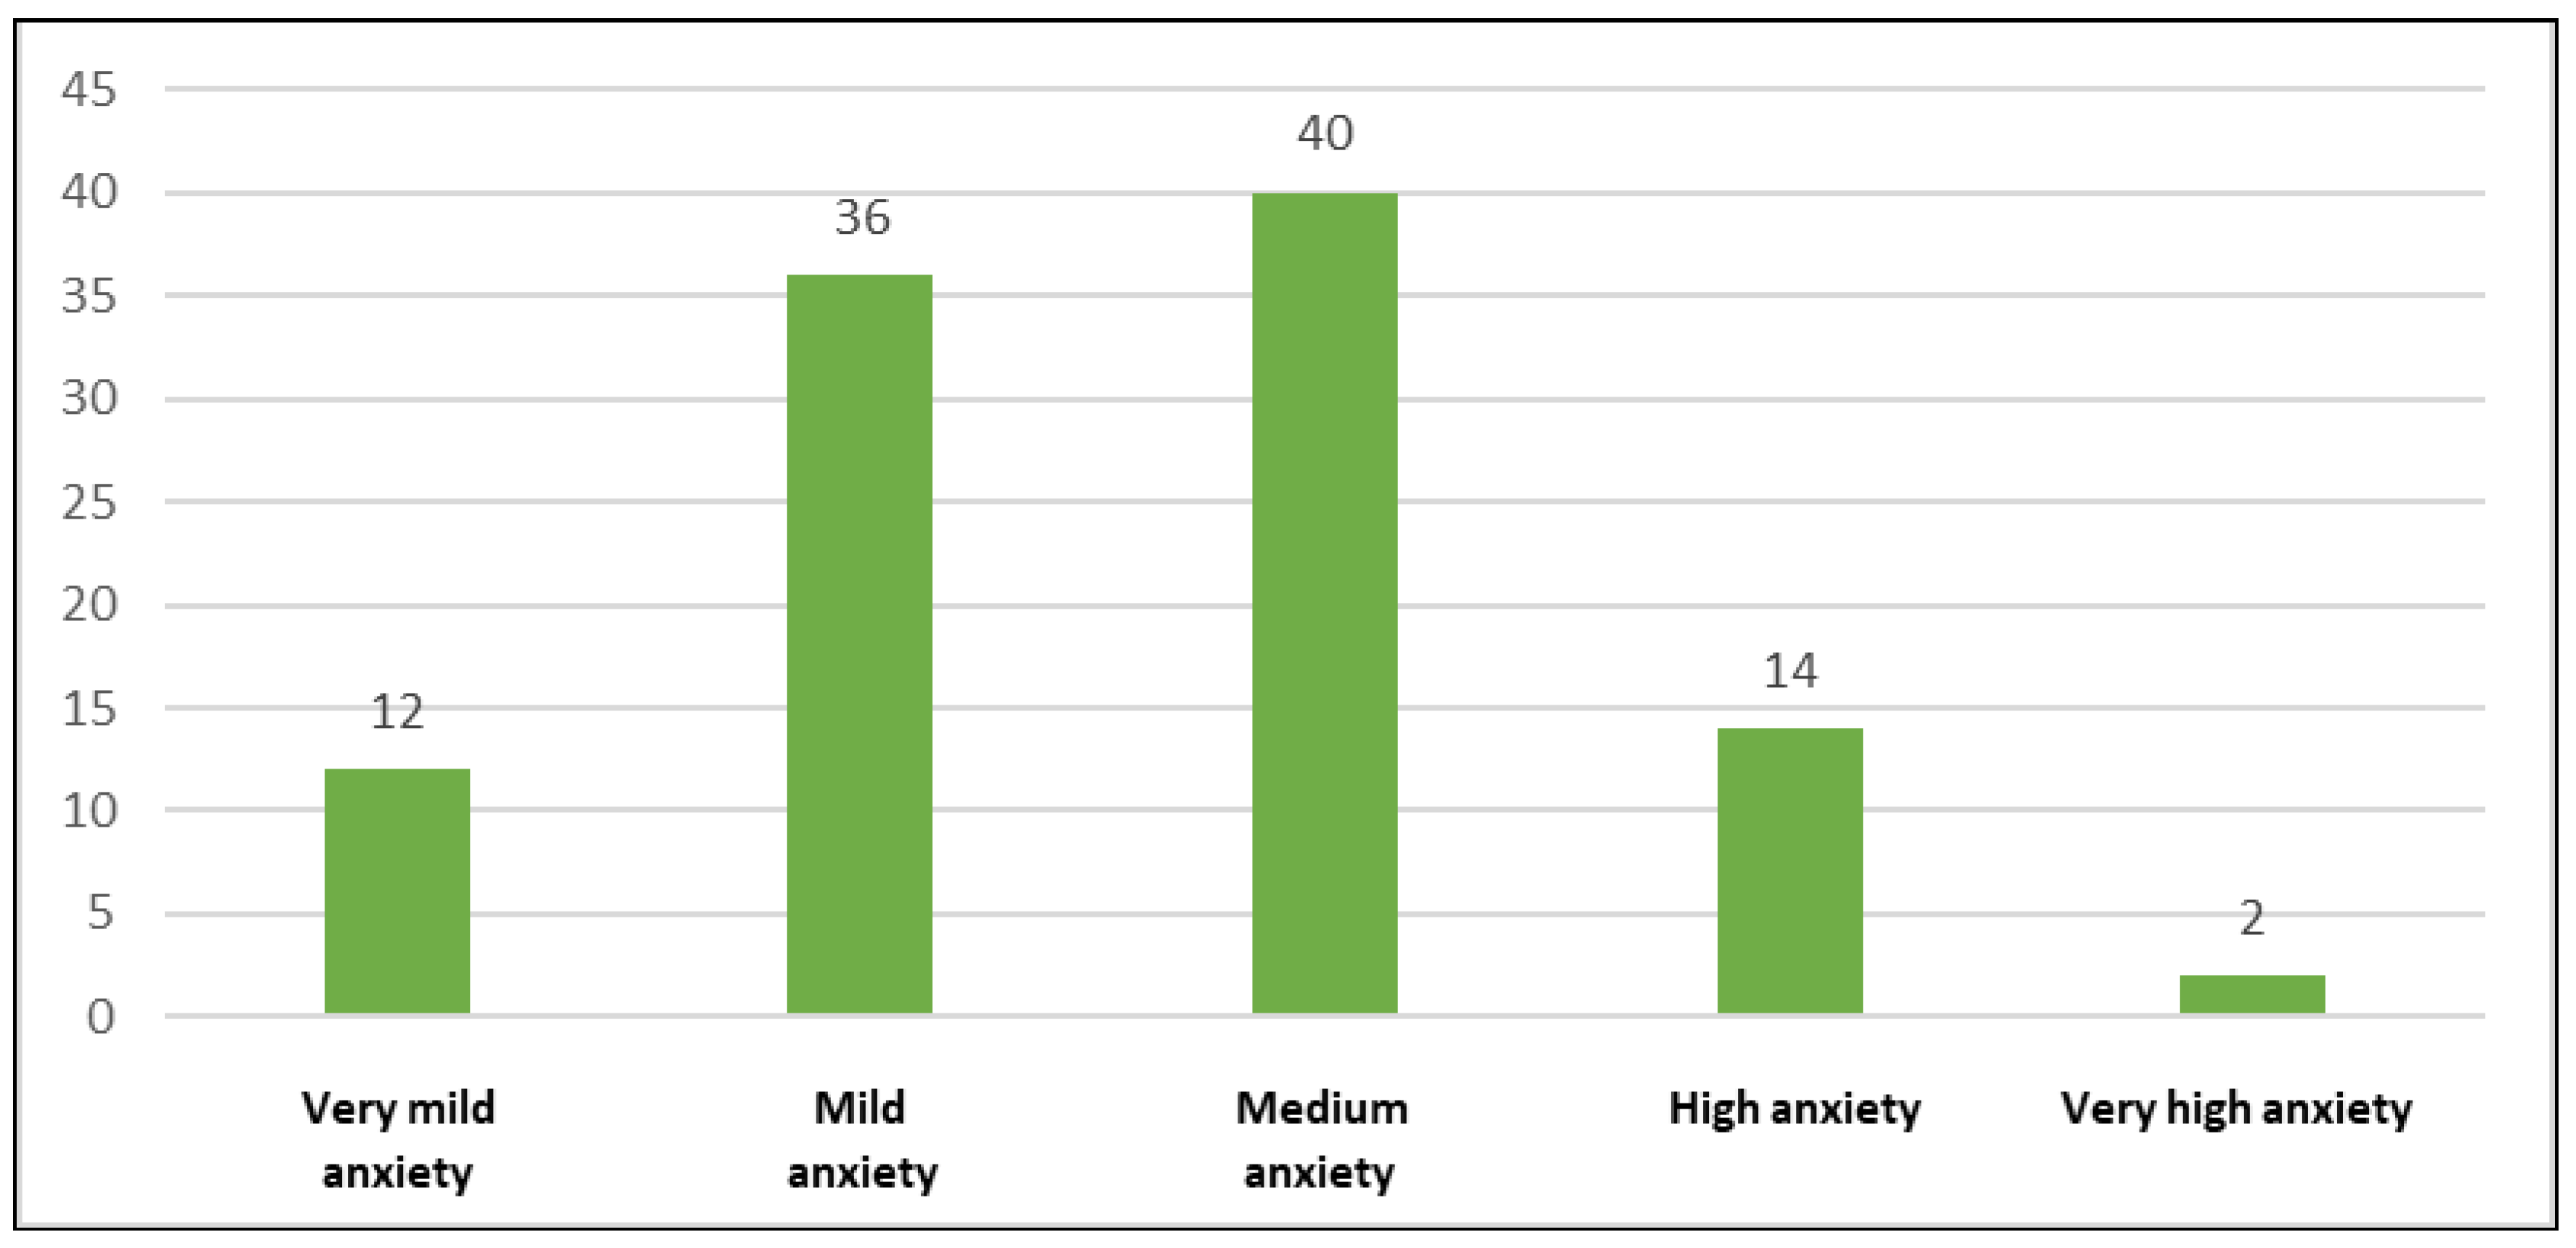
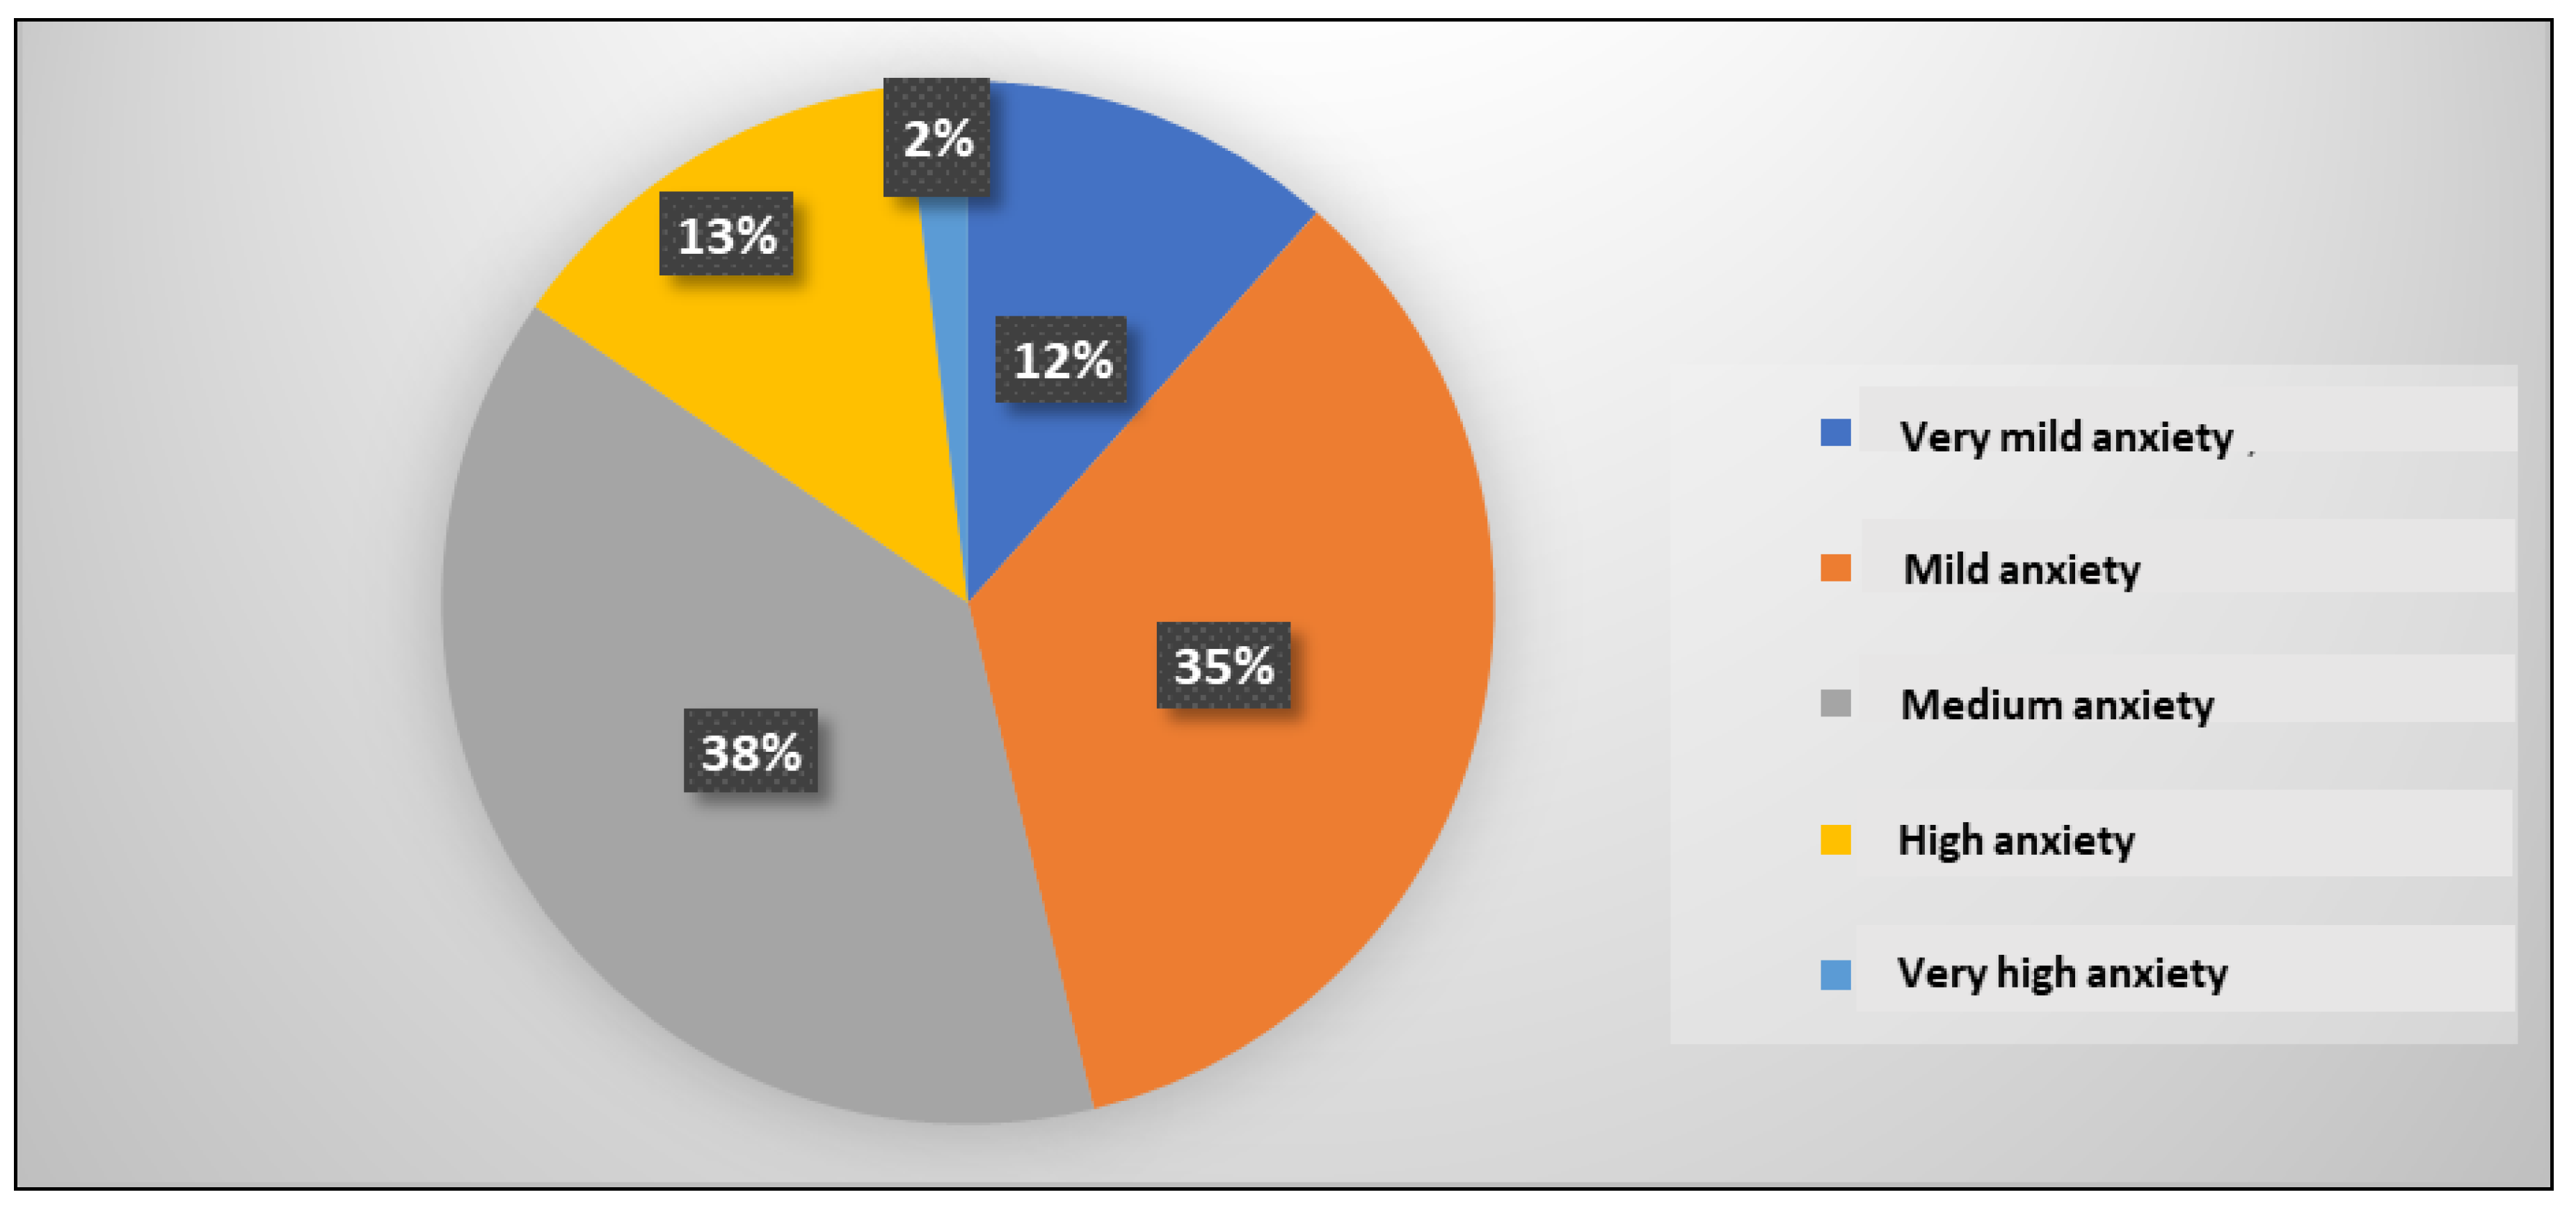
Figure 14 emphasize the distribution of hypertensive patients according to the anxiety trait level. 12 patients, representing 12%, had very mild anxiety, 36 patients, representing 35%, had mild anxiety, 40 patients, representing 38%, had medium anxiety, 14 patients, representing 13%, had high anxiety and 2 patients, representing 2%, had very high anxiety.
Figure 15 and
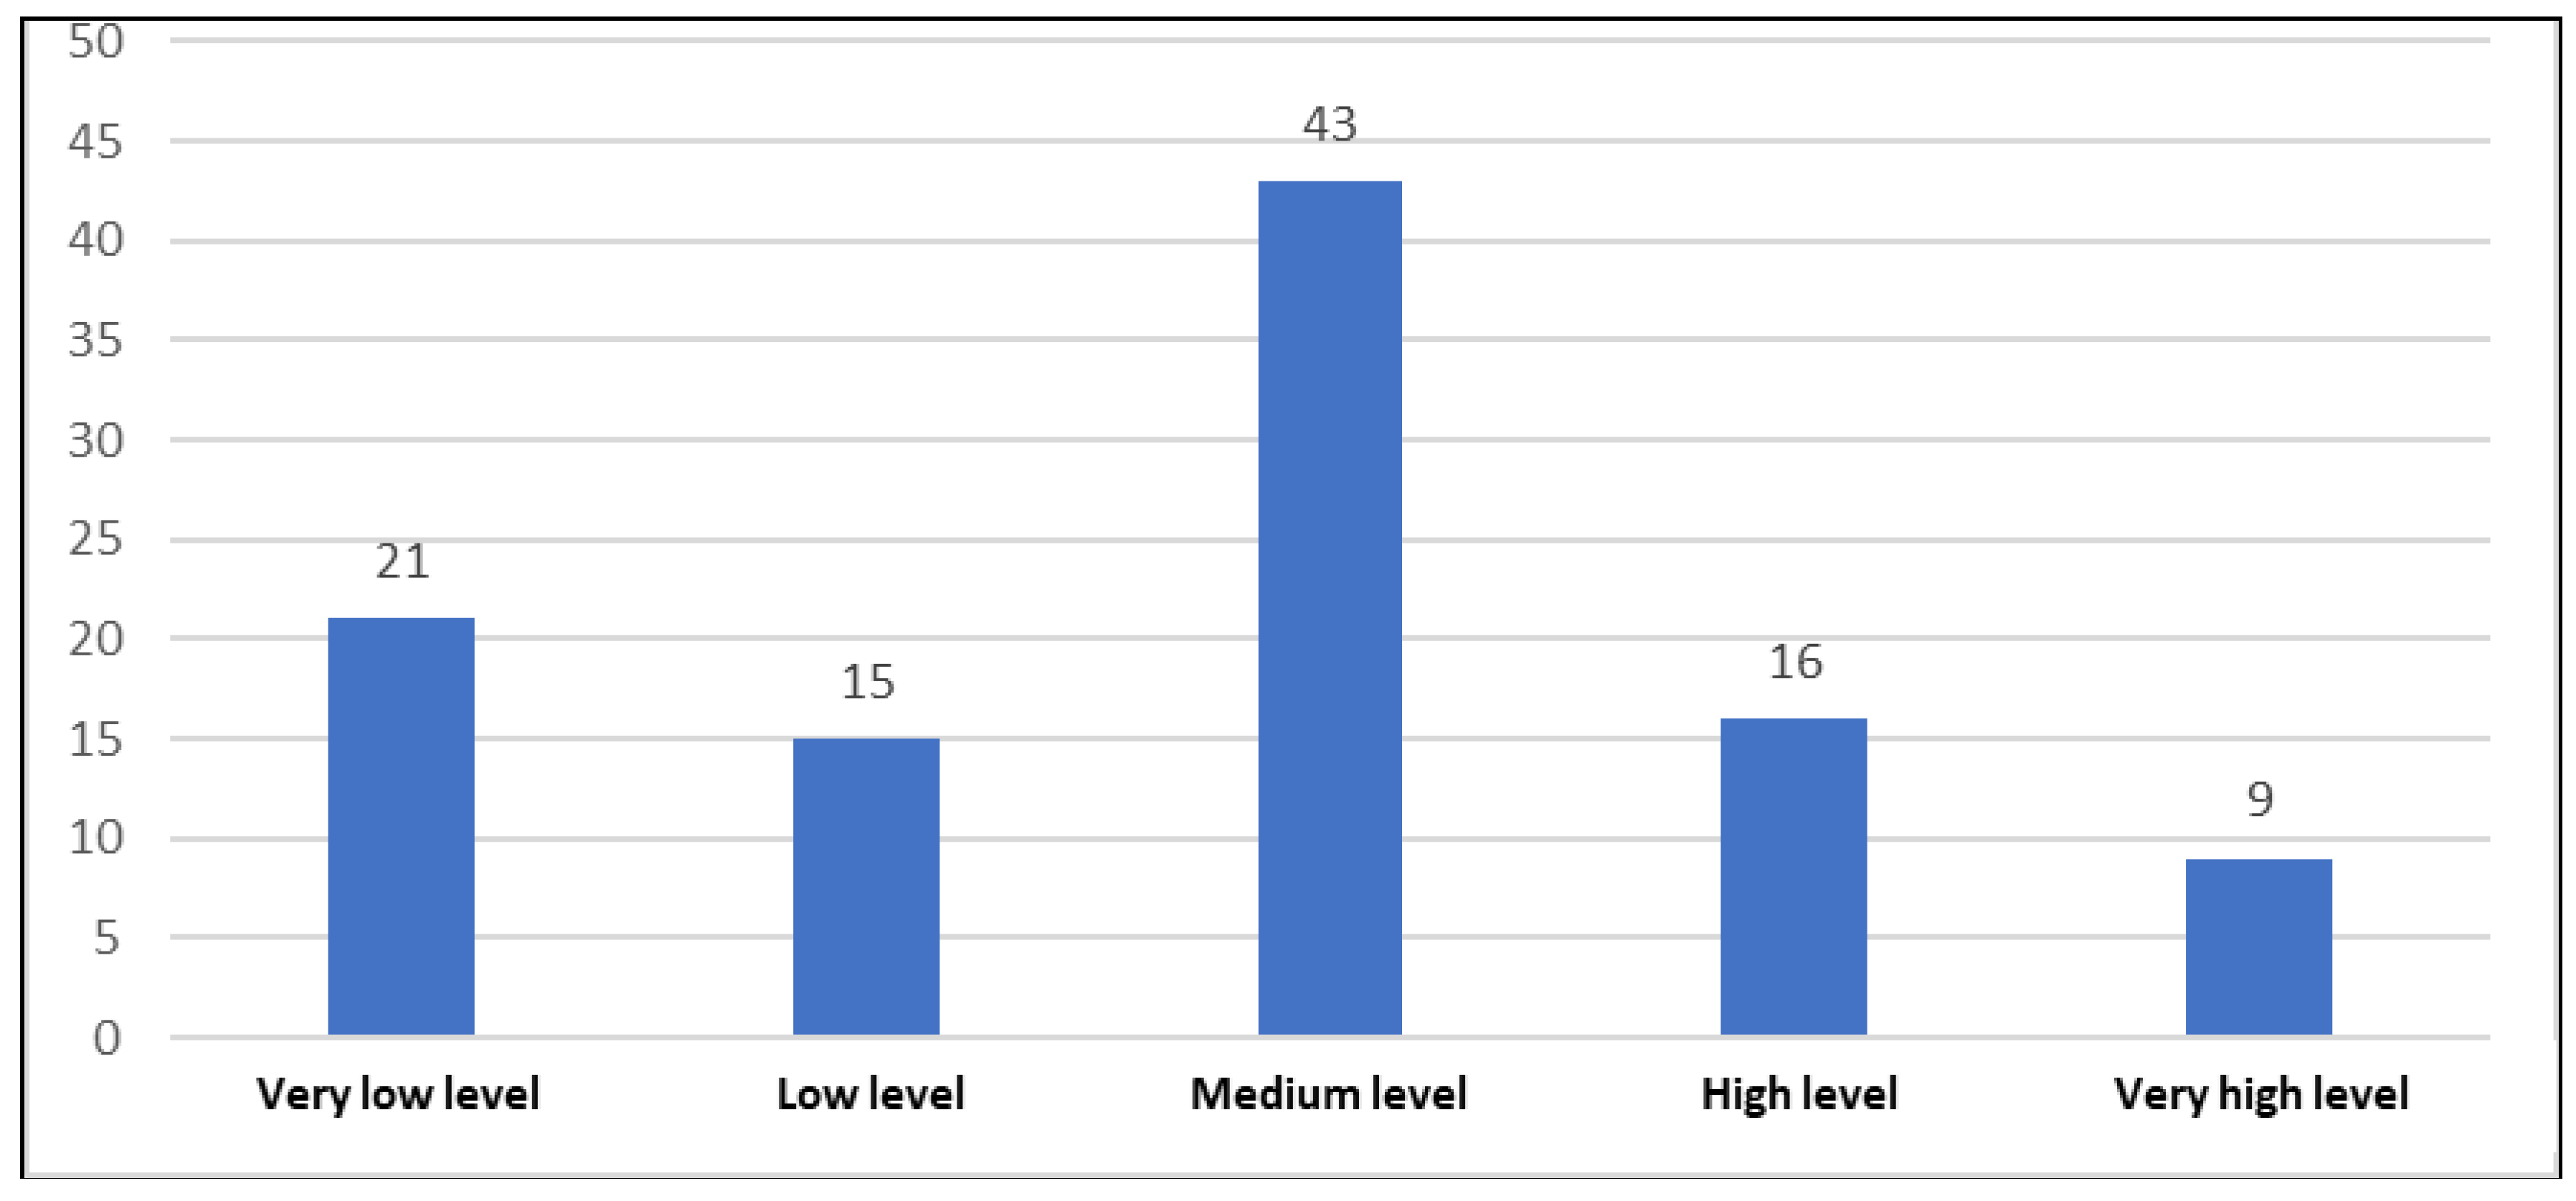
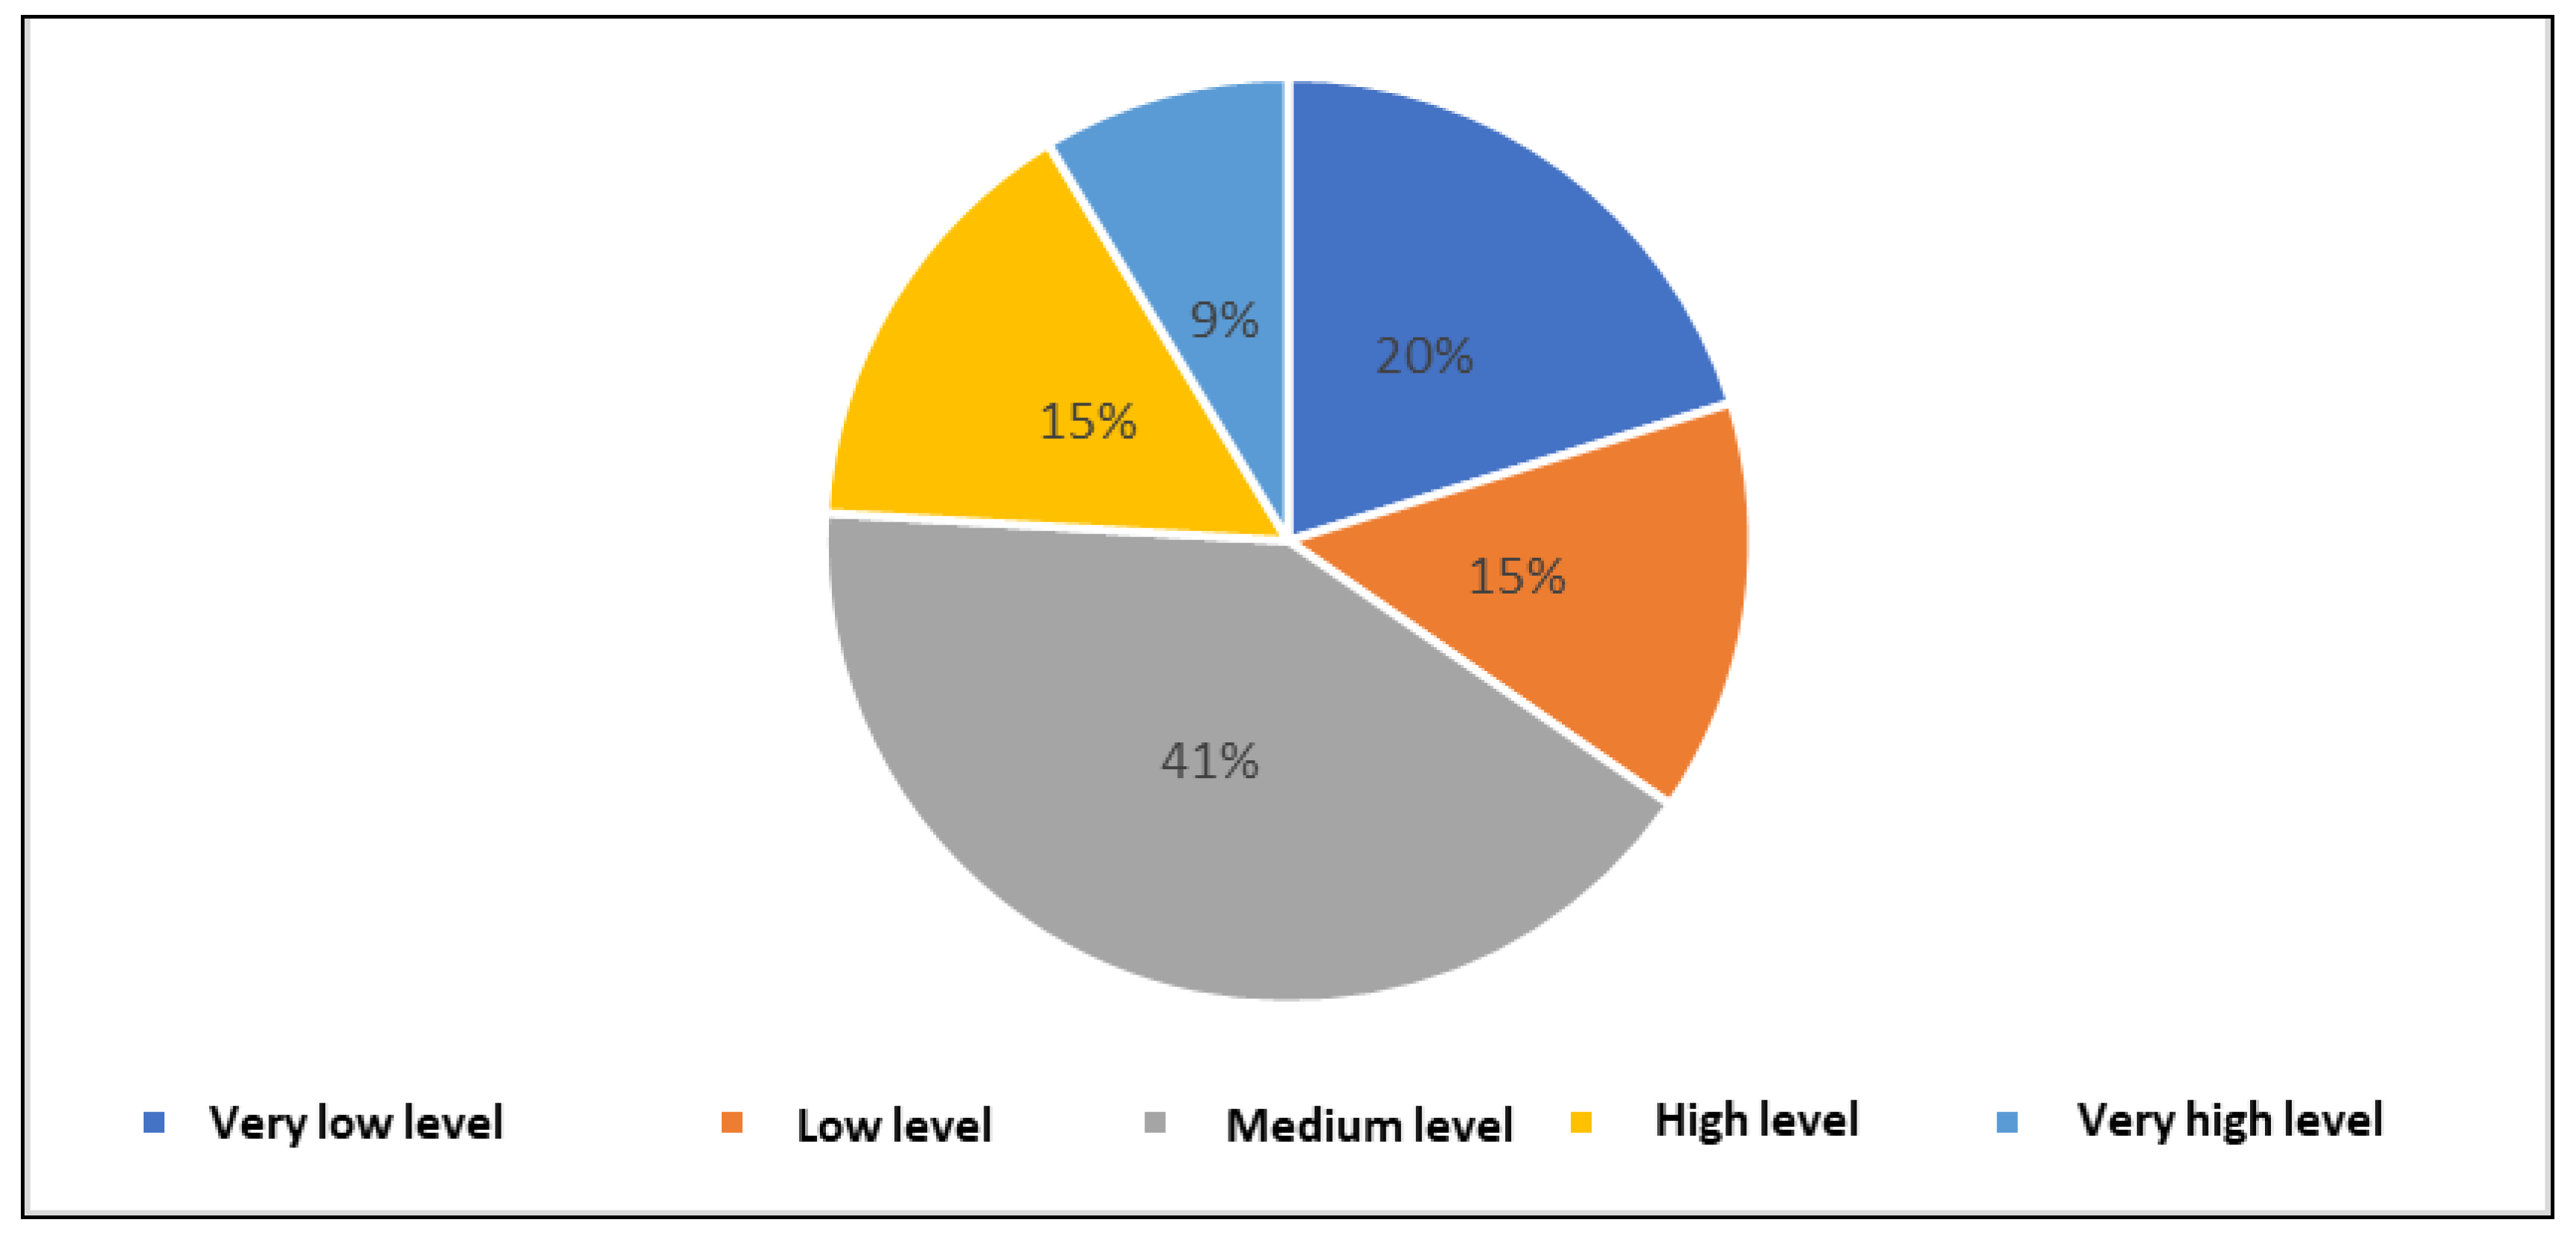
Figure 16 highlight the distribution of patients with hypertension according to their level of self-efficacy. Among the 104 patients enrolled in the study, 21 patients, representing 20%, had a very low level of self-efficacy, 15 patients, representing 15% had a low level of self-efficacy, 43 patients, representing 41%, had an average level of self-efficacy, 16 patients, representing 15%, had a high level of self-efficacy and 9 patients, representing 9%, had a very high level of self-efficacy.
Figure 17 and
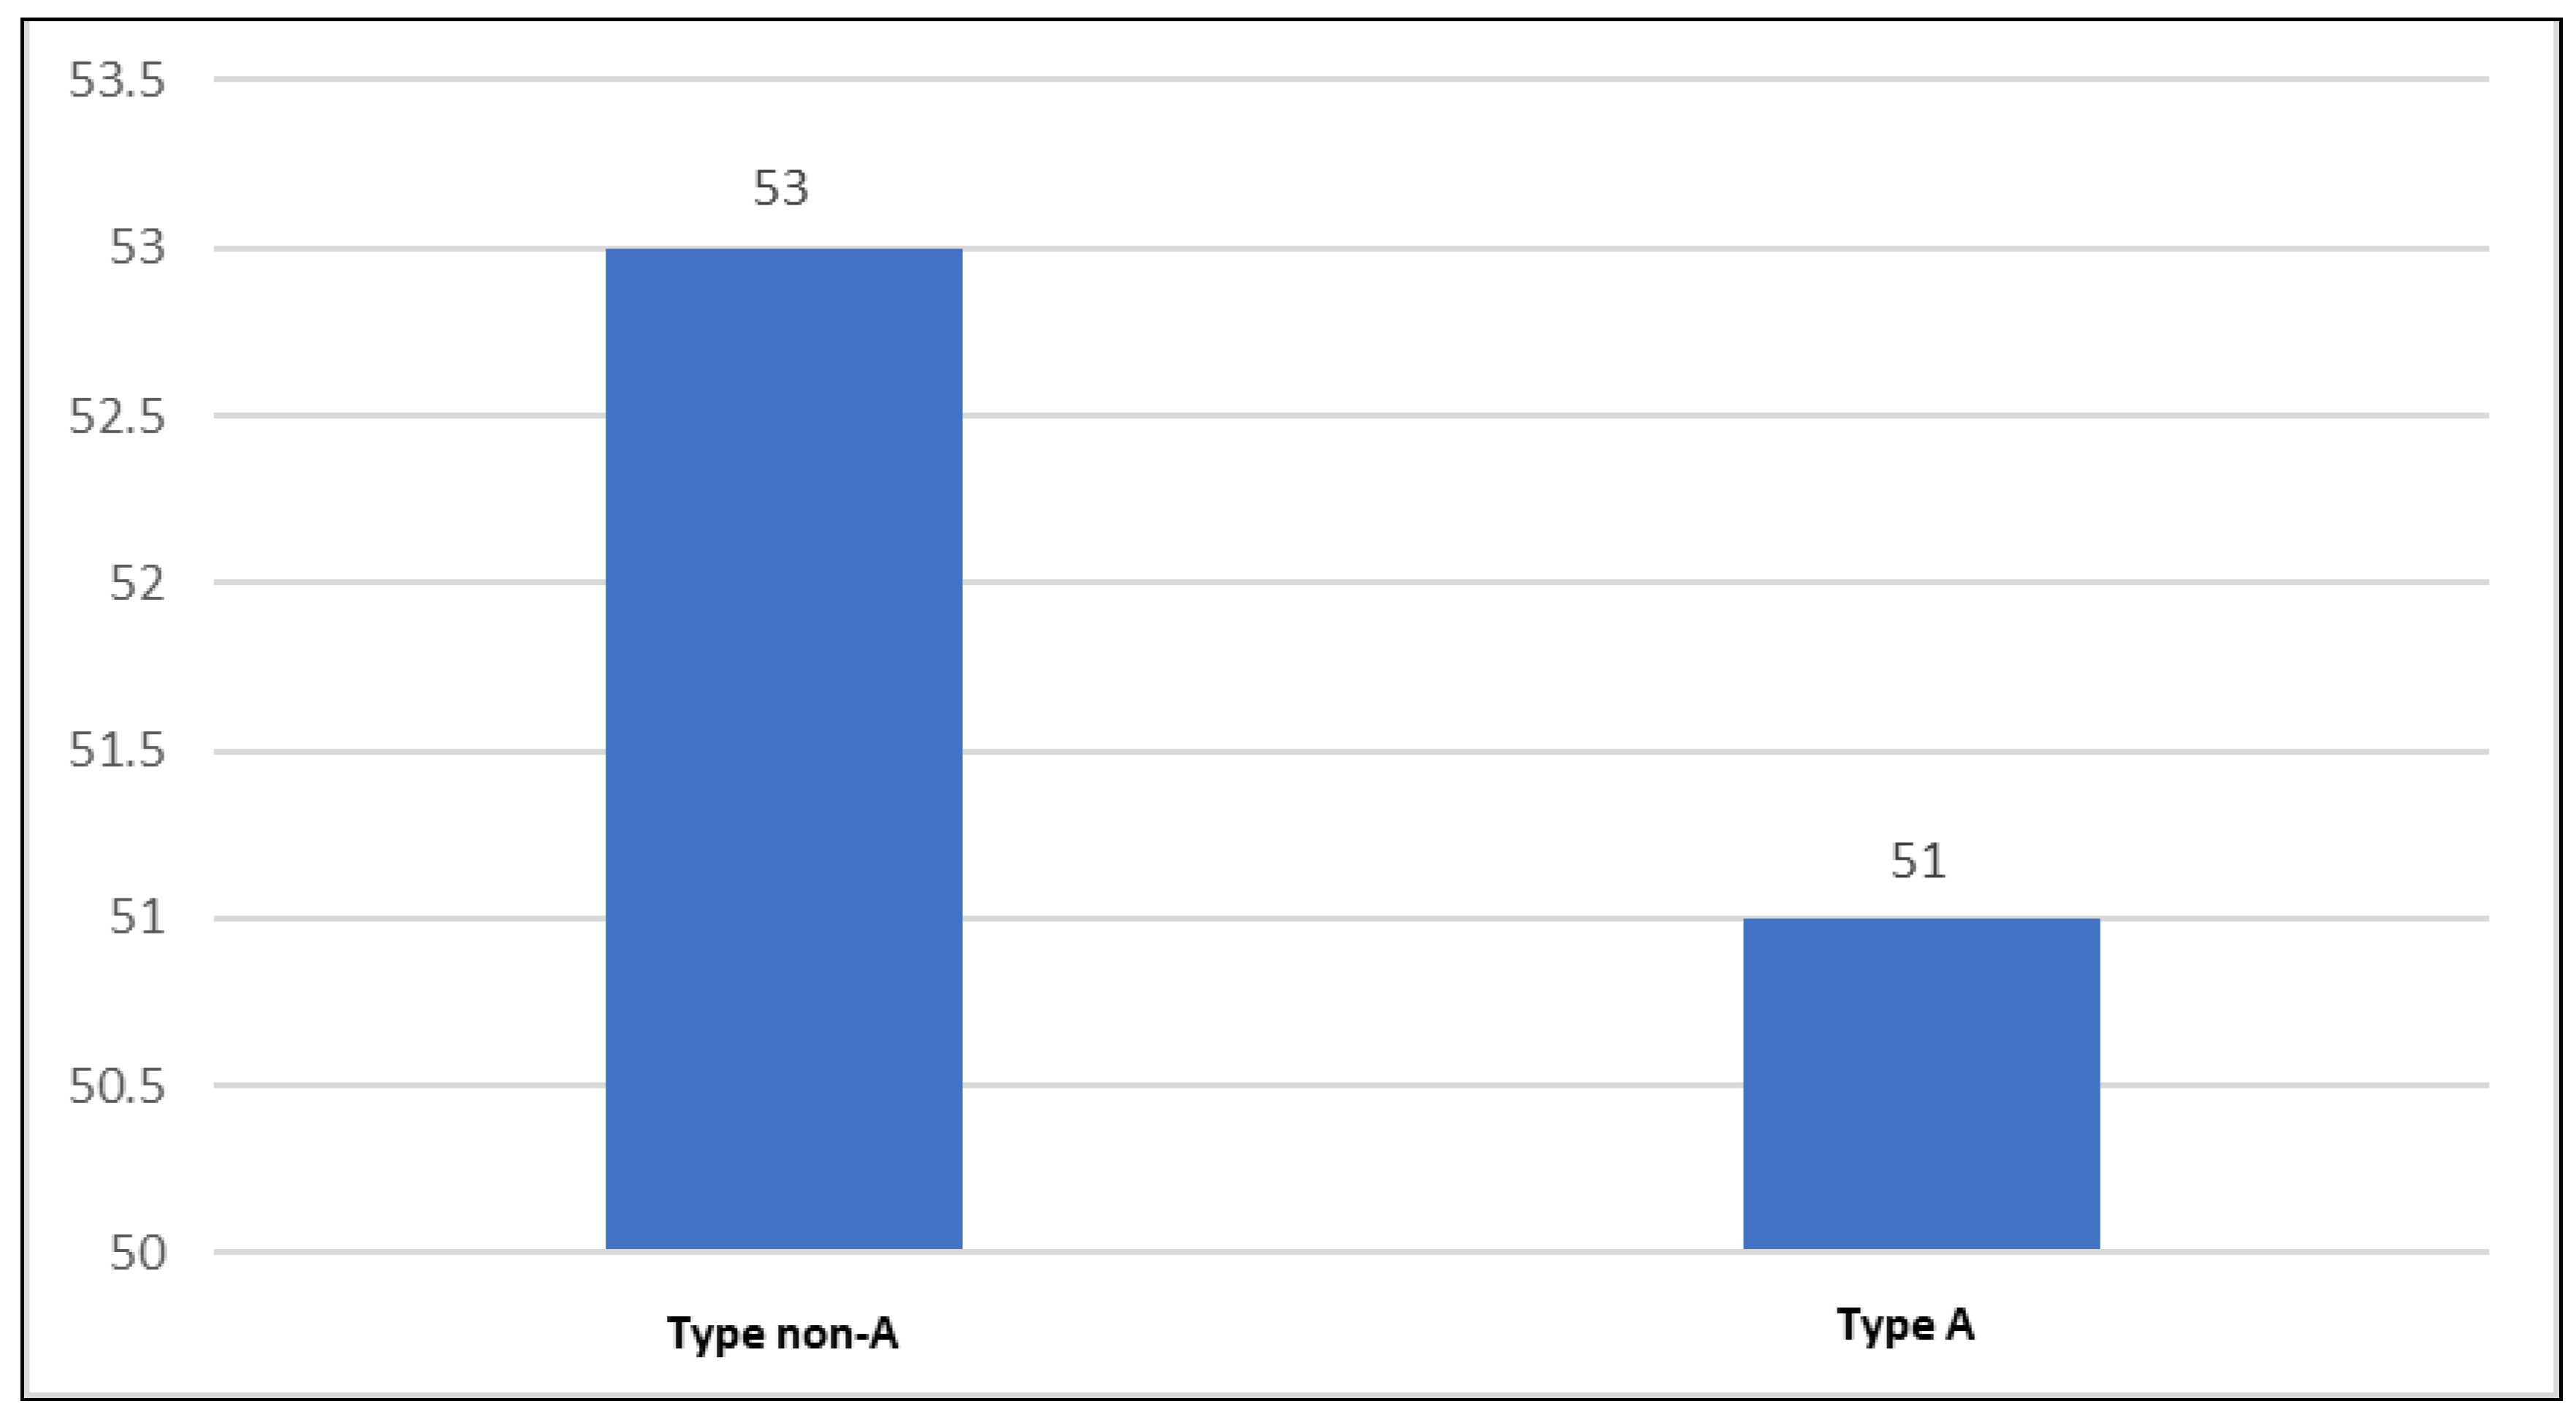
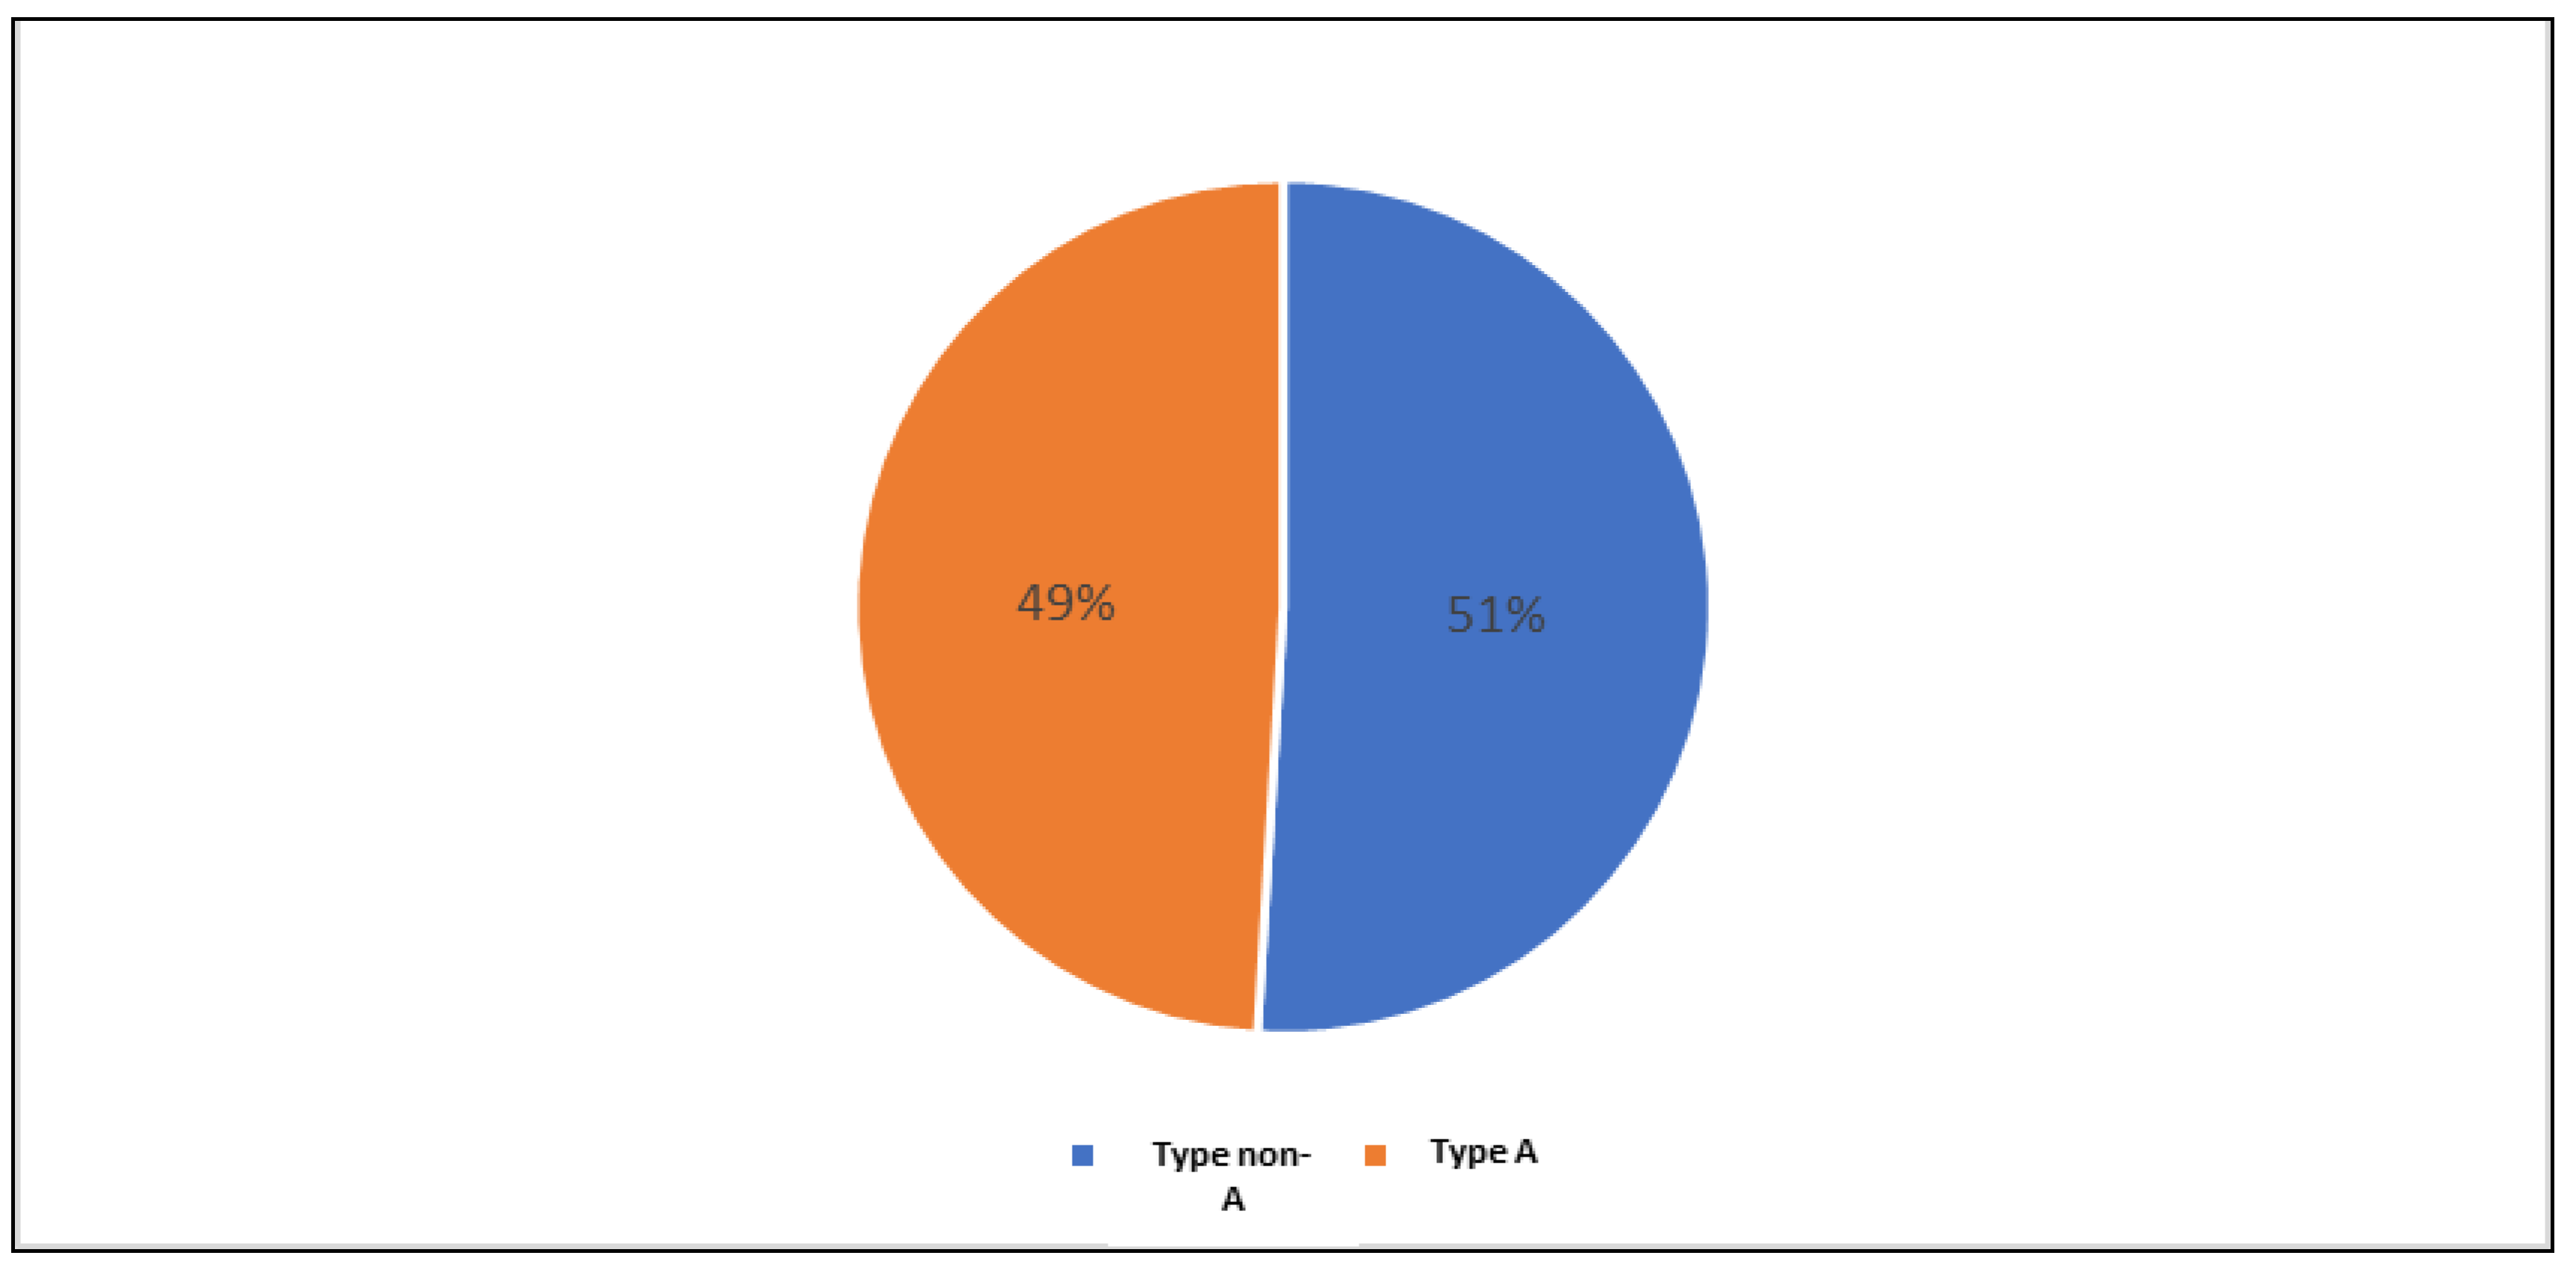
Figure 18 emphasize the distribution of hypertensive patients according to psychobehavioral type A. 53 patients, representing 51%, did not present psychobehavioral type A (they were type non-A), and the remaining 51 patients, representing 49%, presented psychobehavioral type A.
3.1.2. Characteristics of the control lot
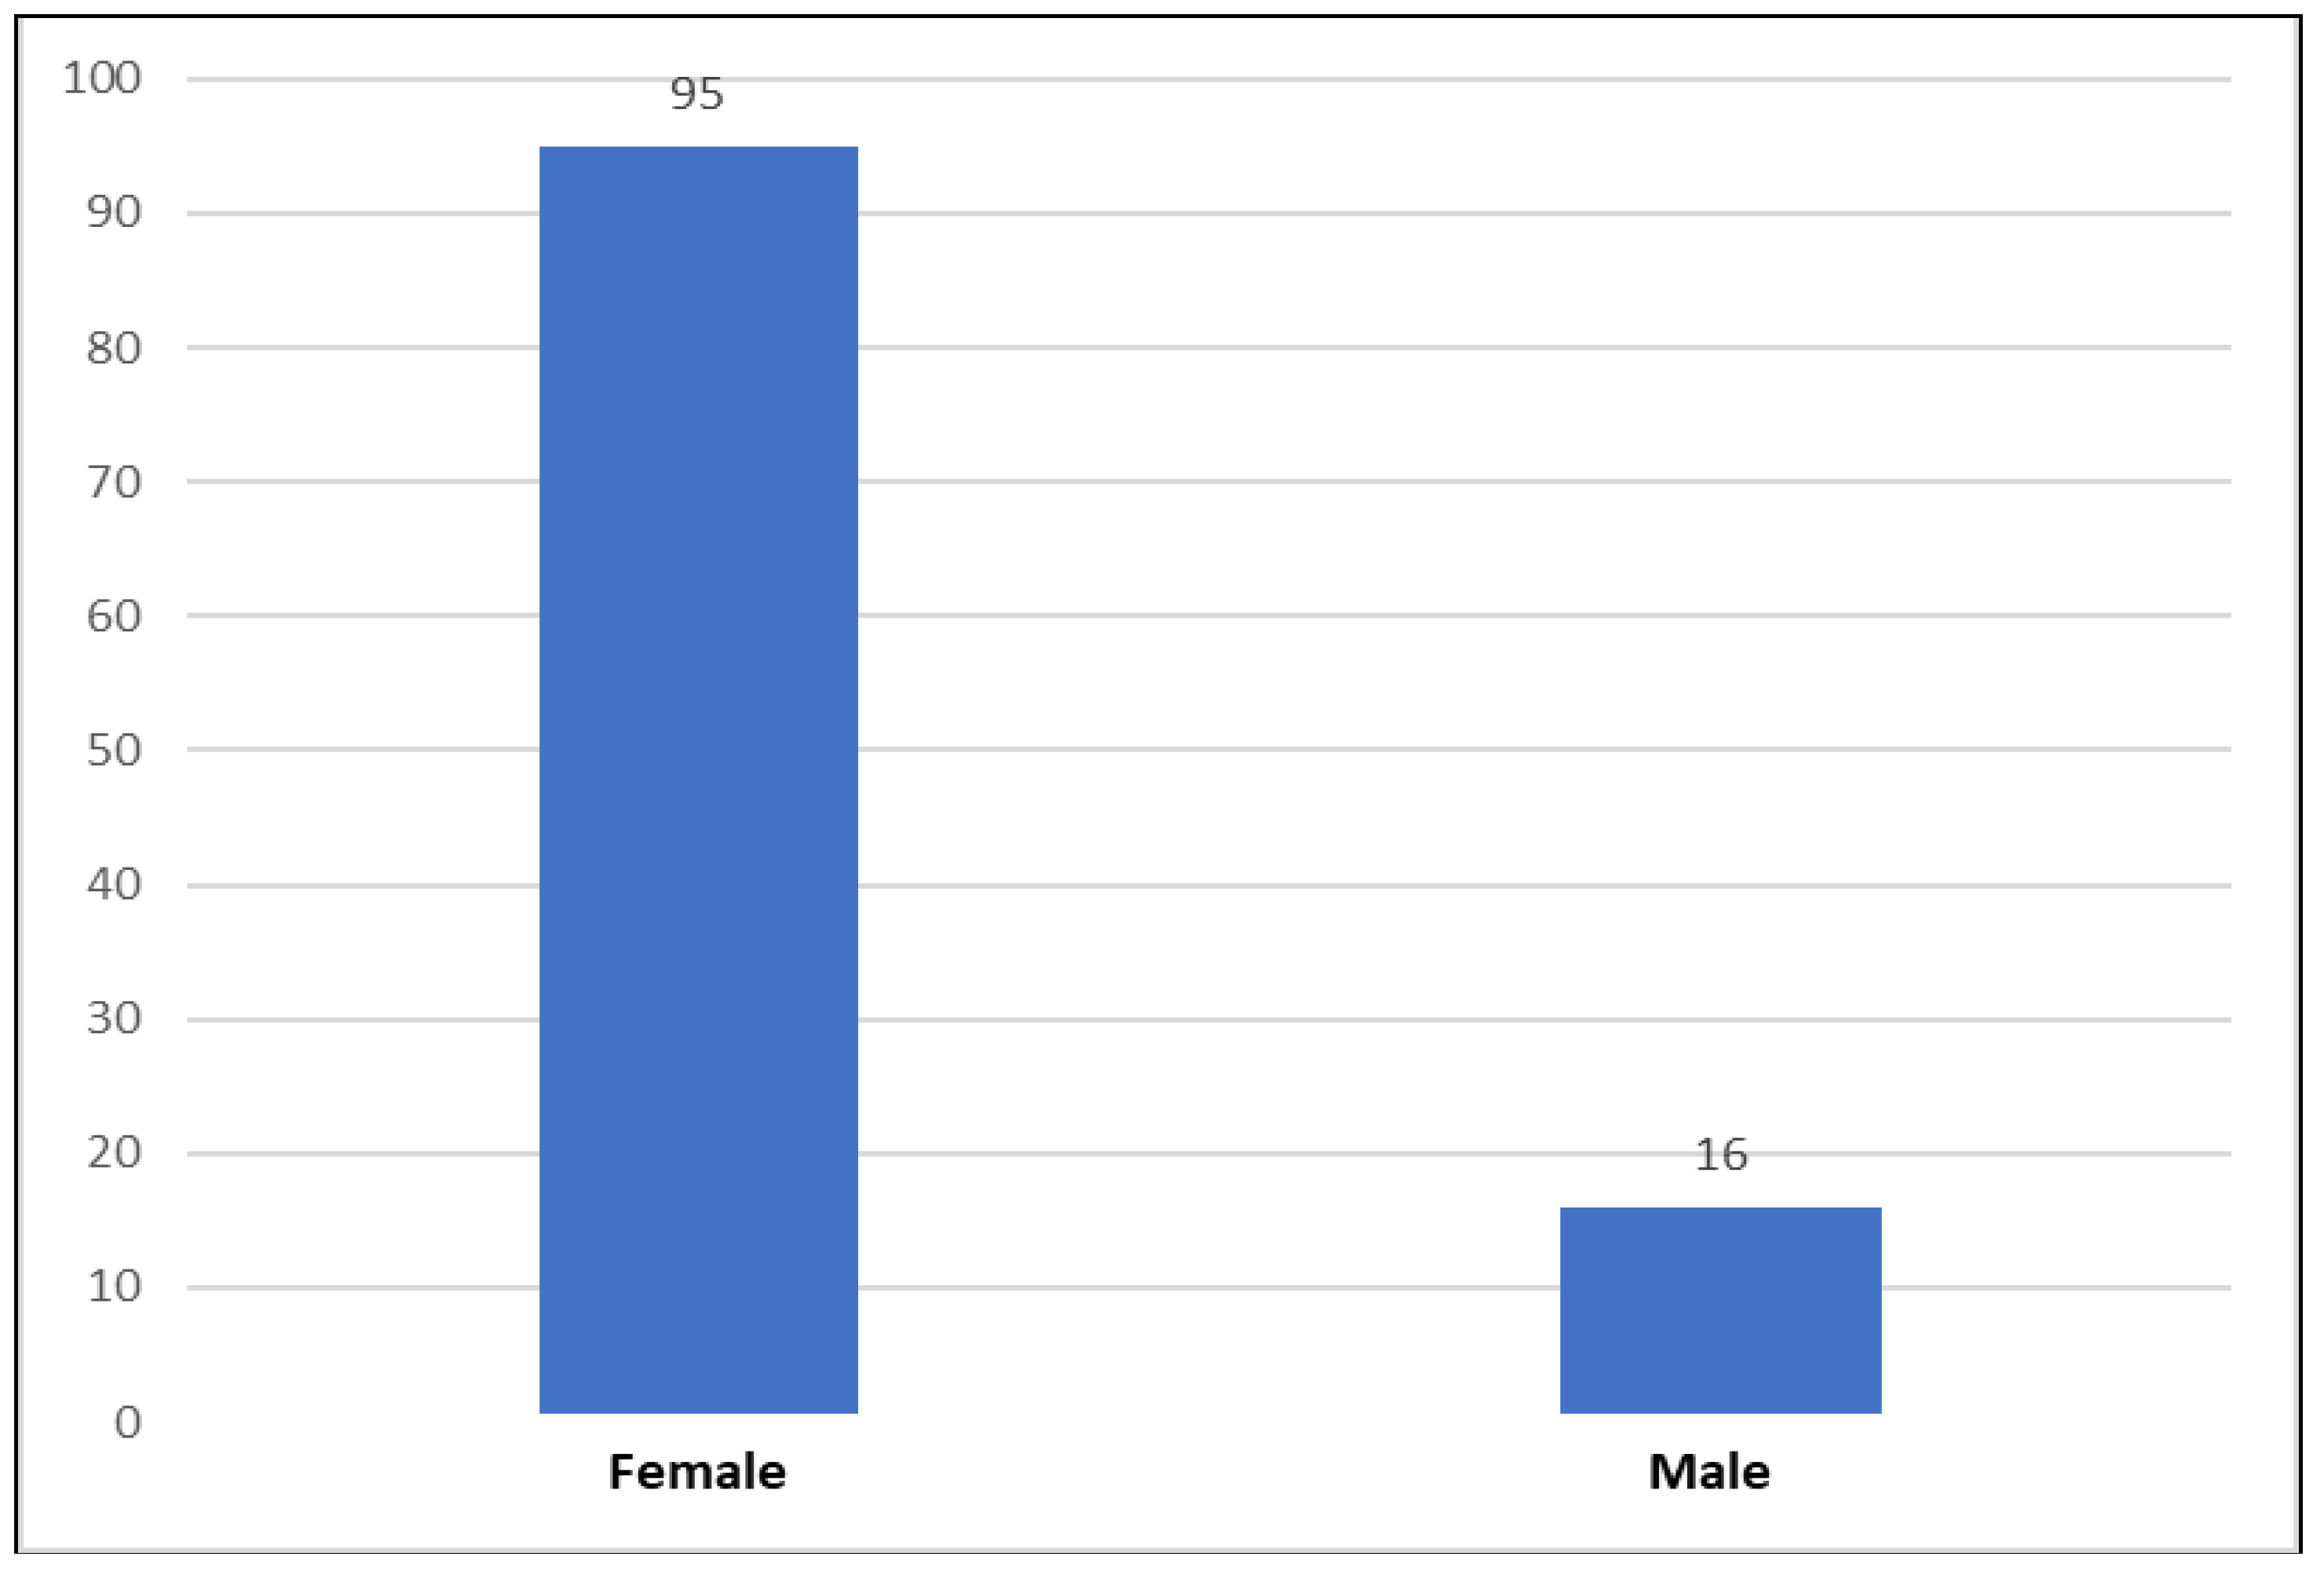
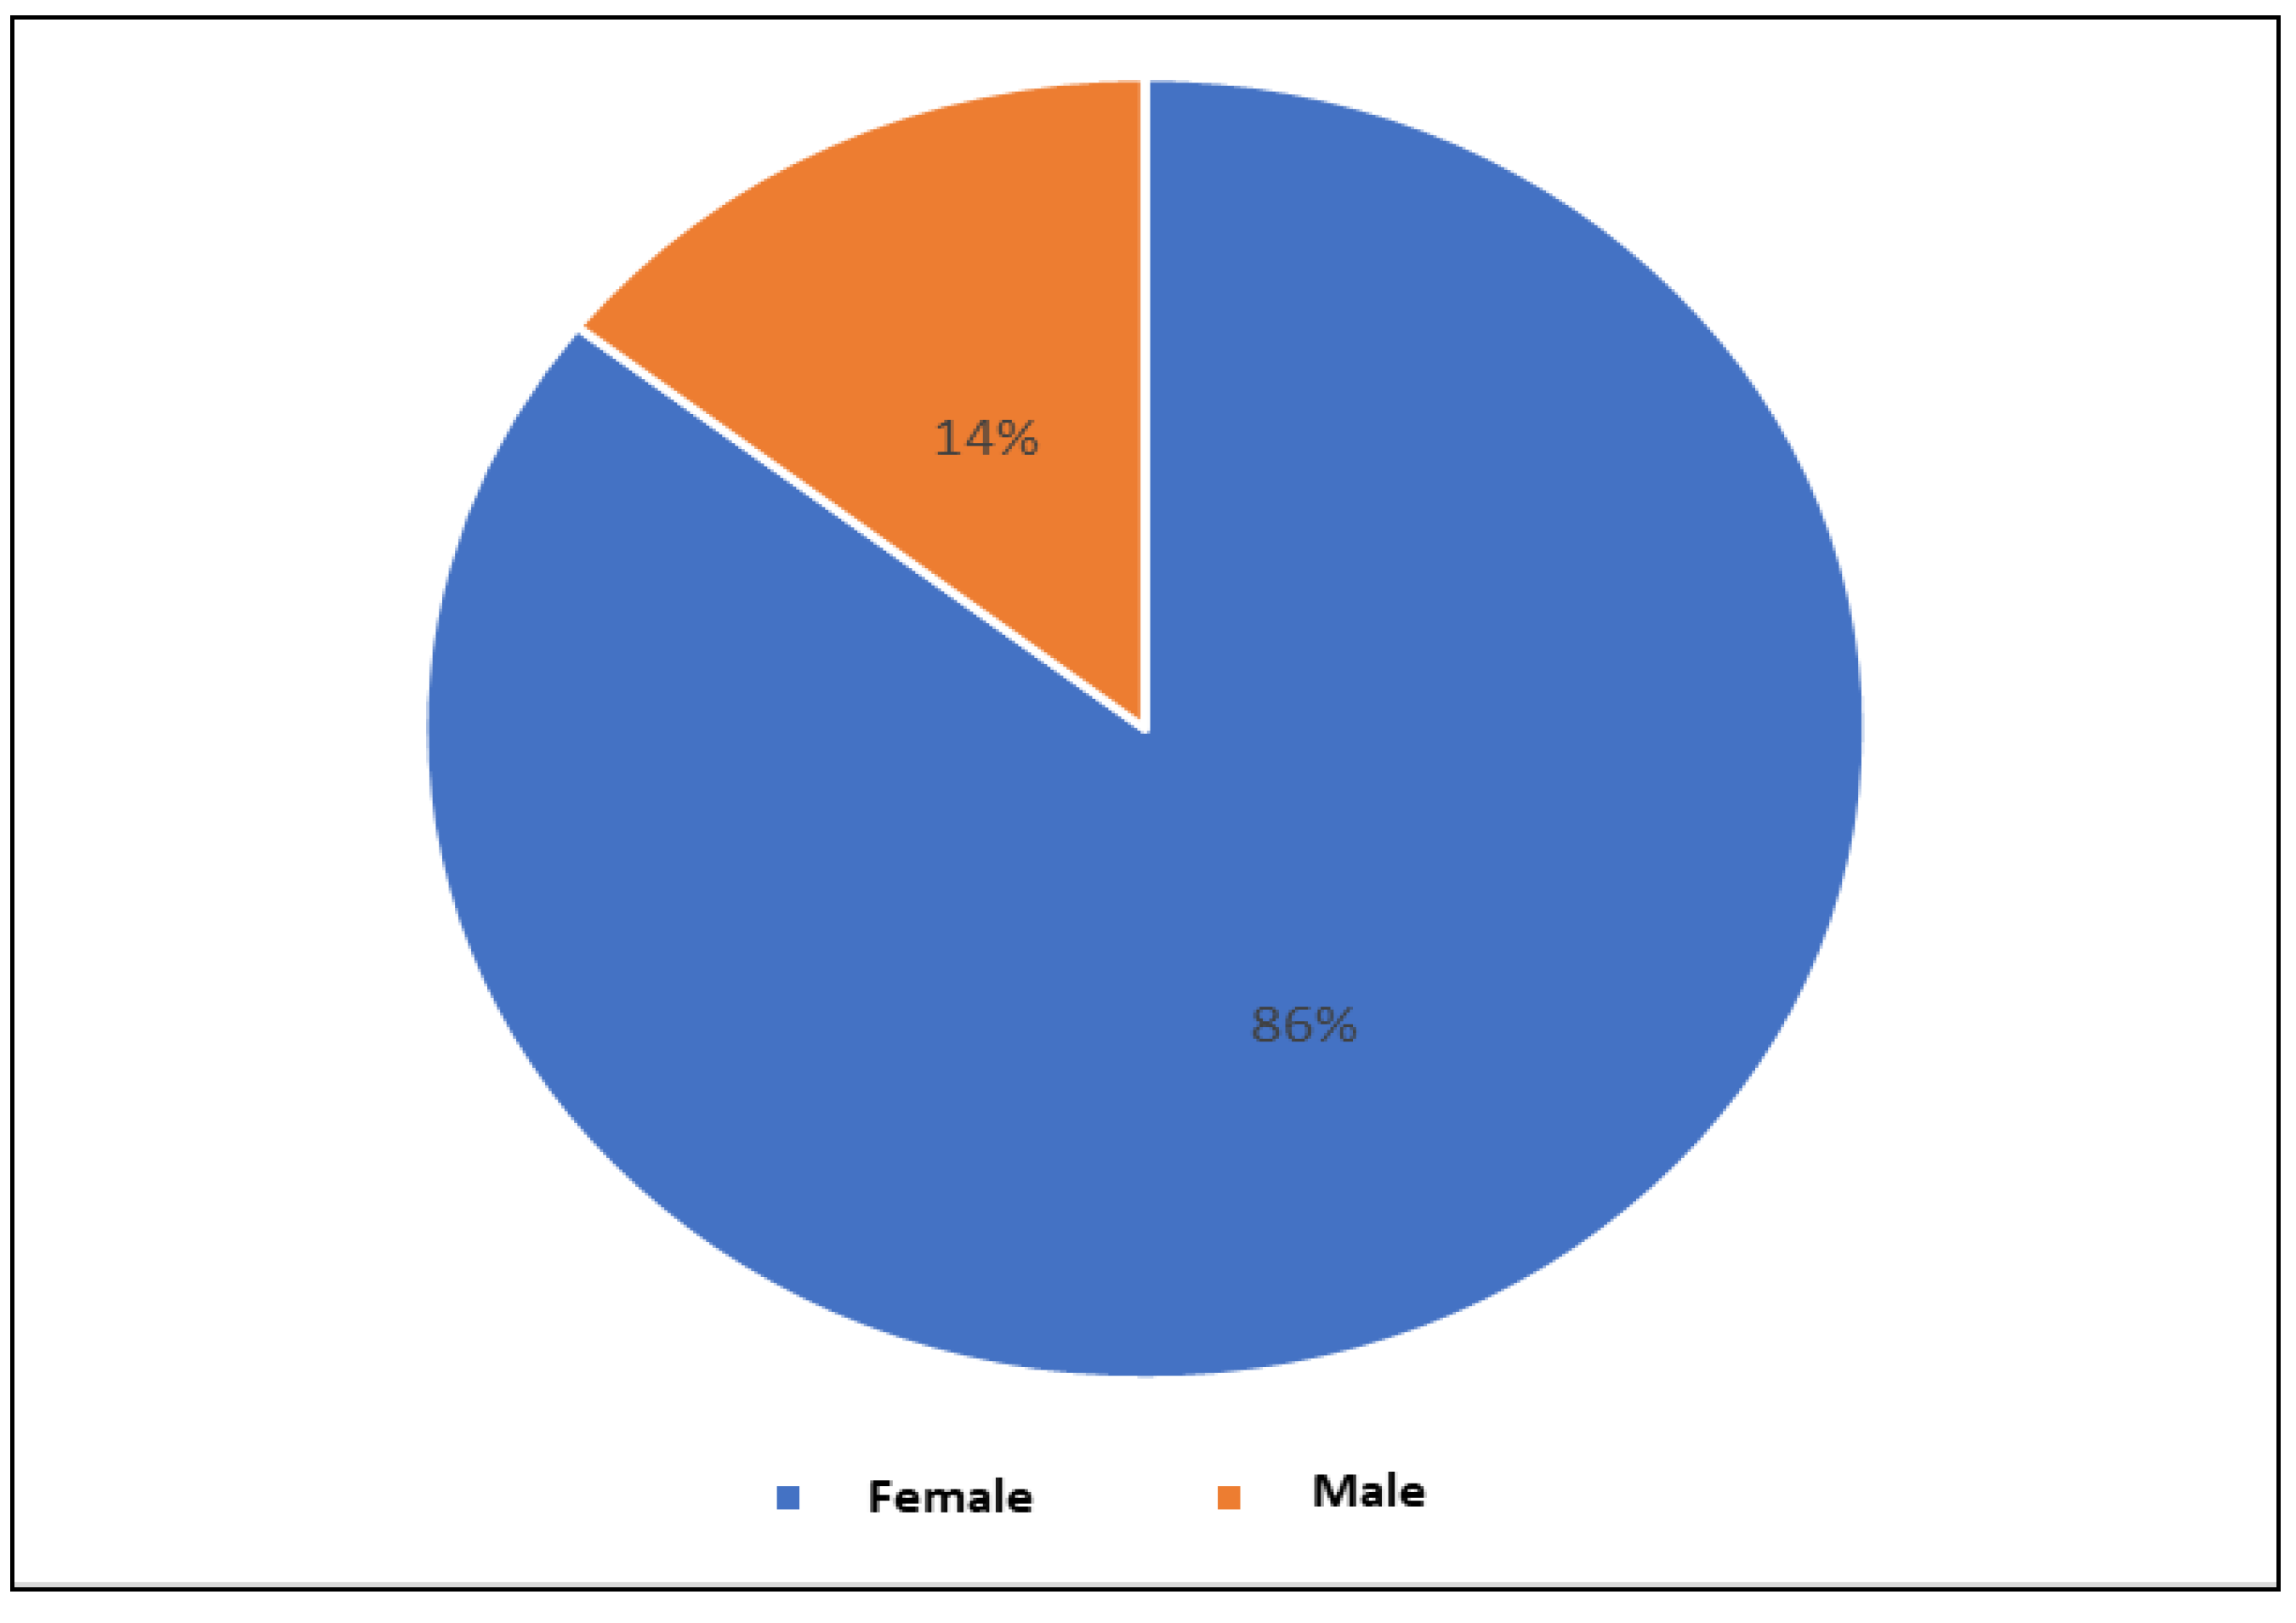
Figure 19 shows the distribution of the control group according to gender. The number of females was 95, and the number of males was 16.
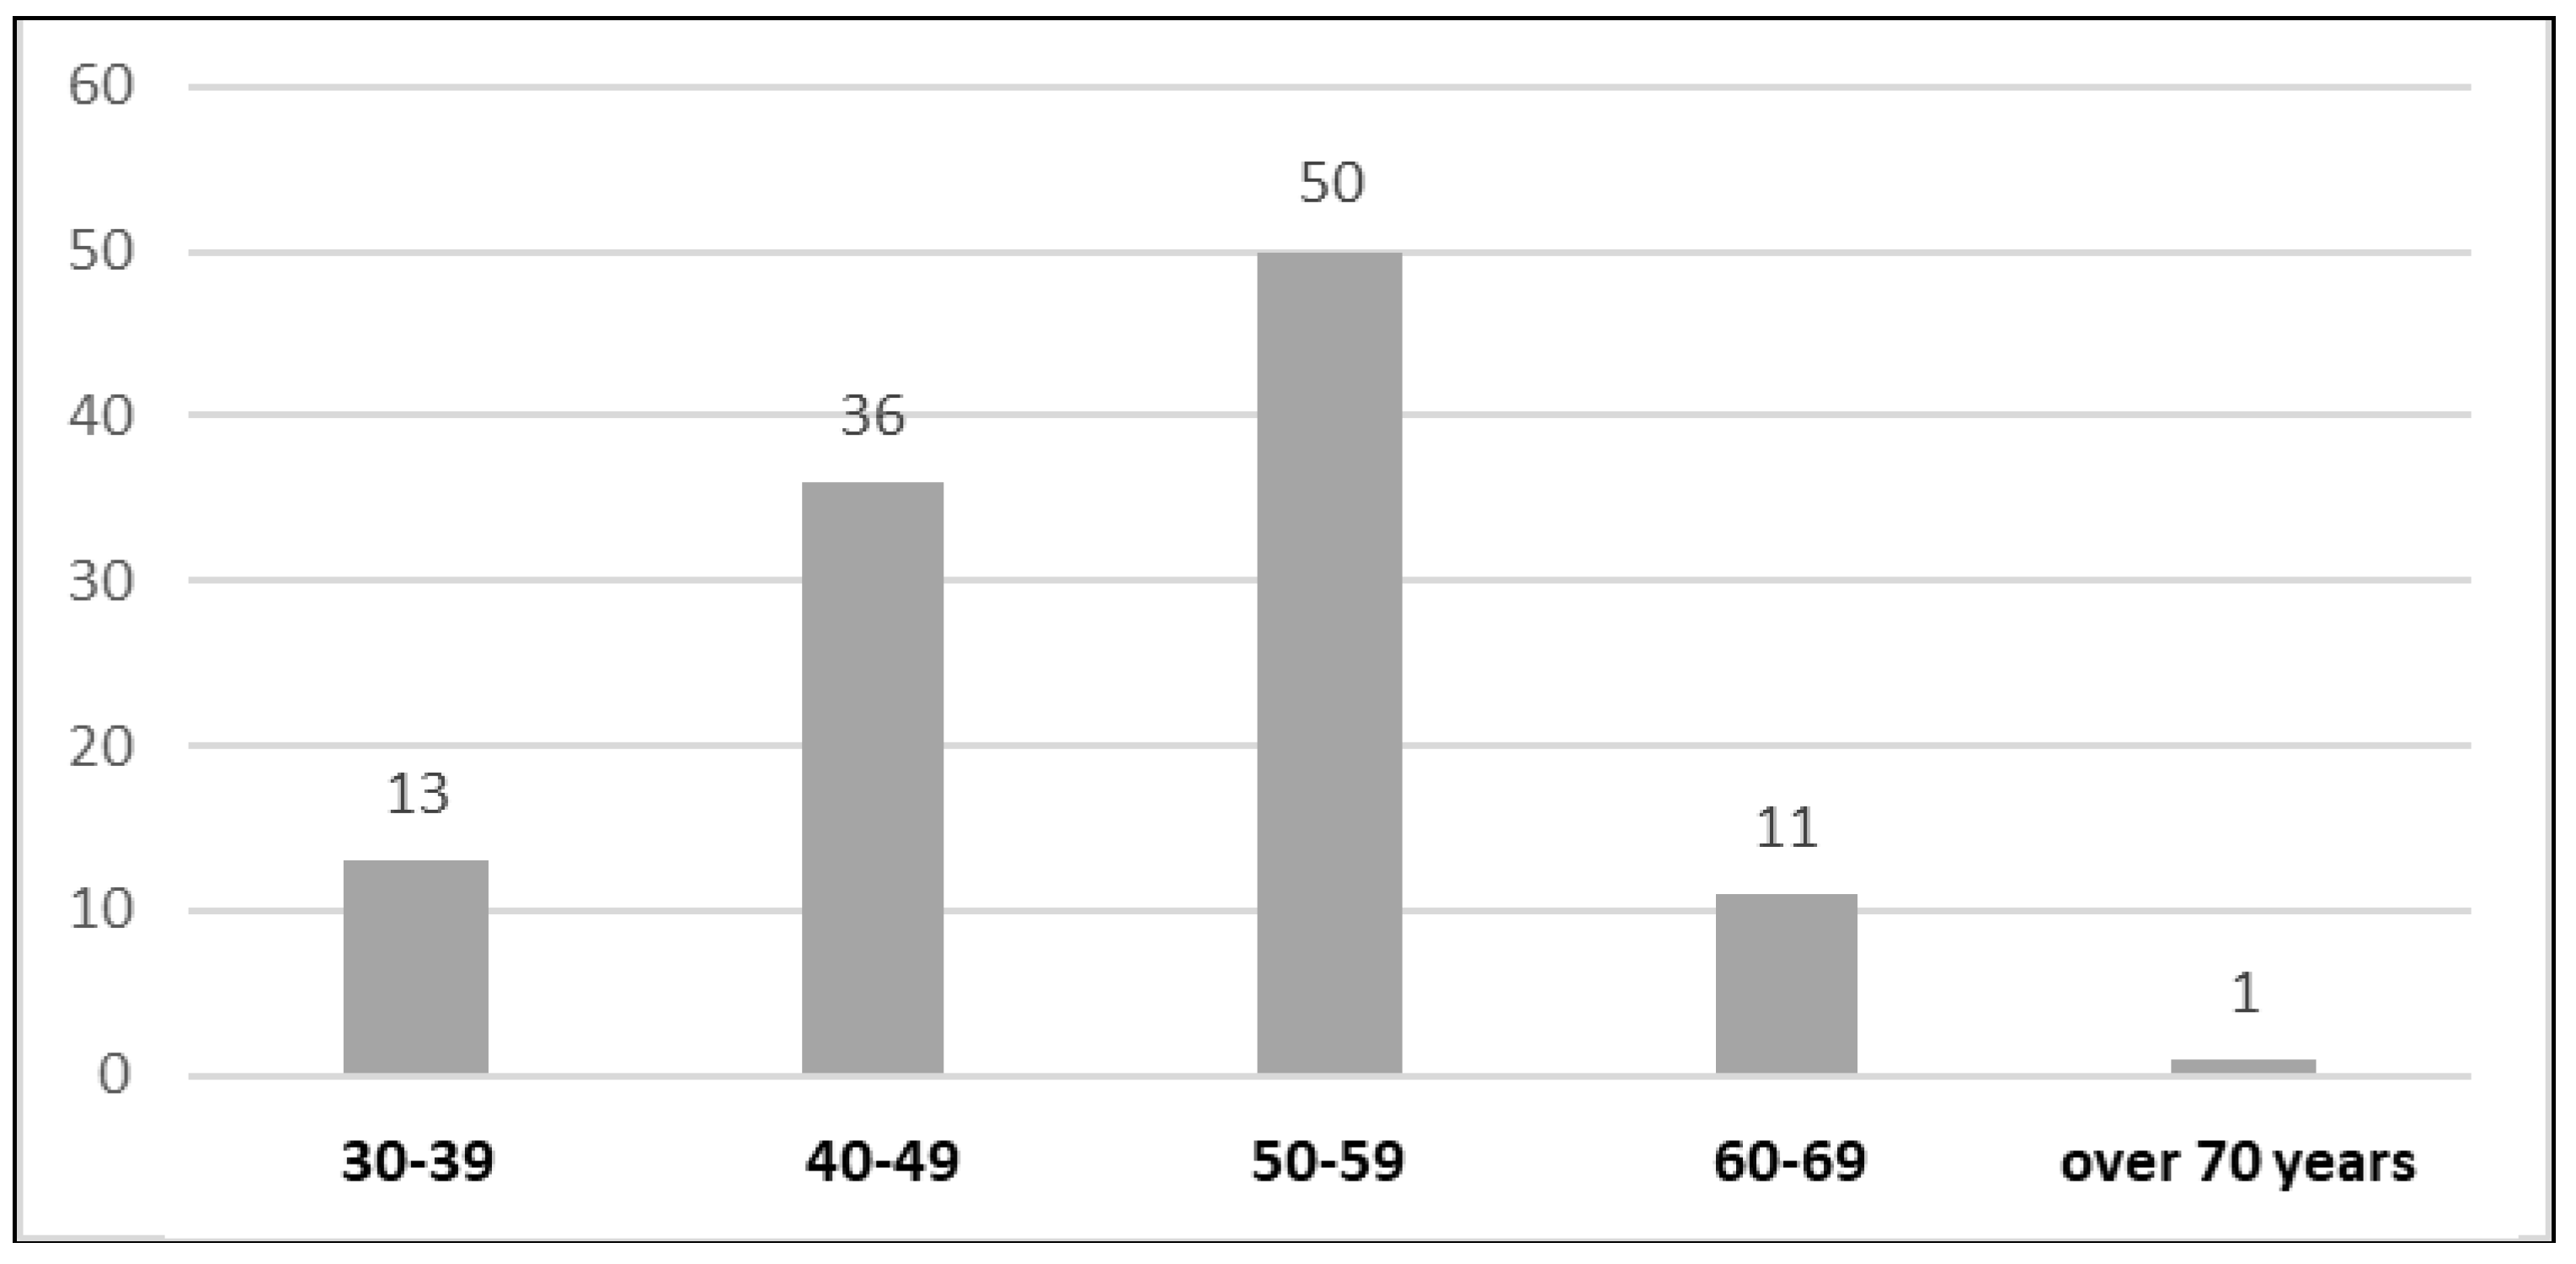
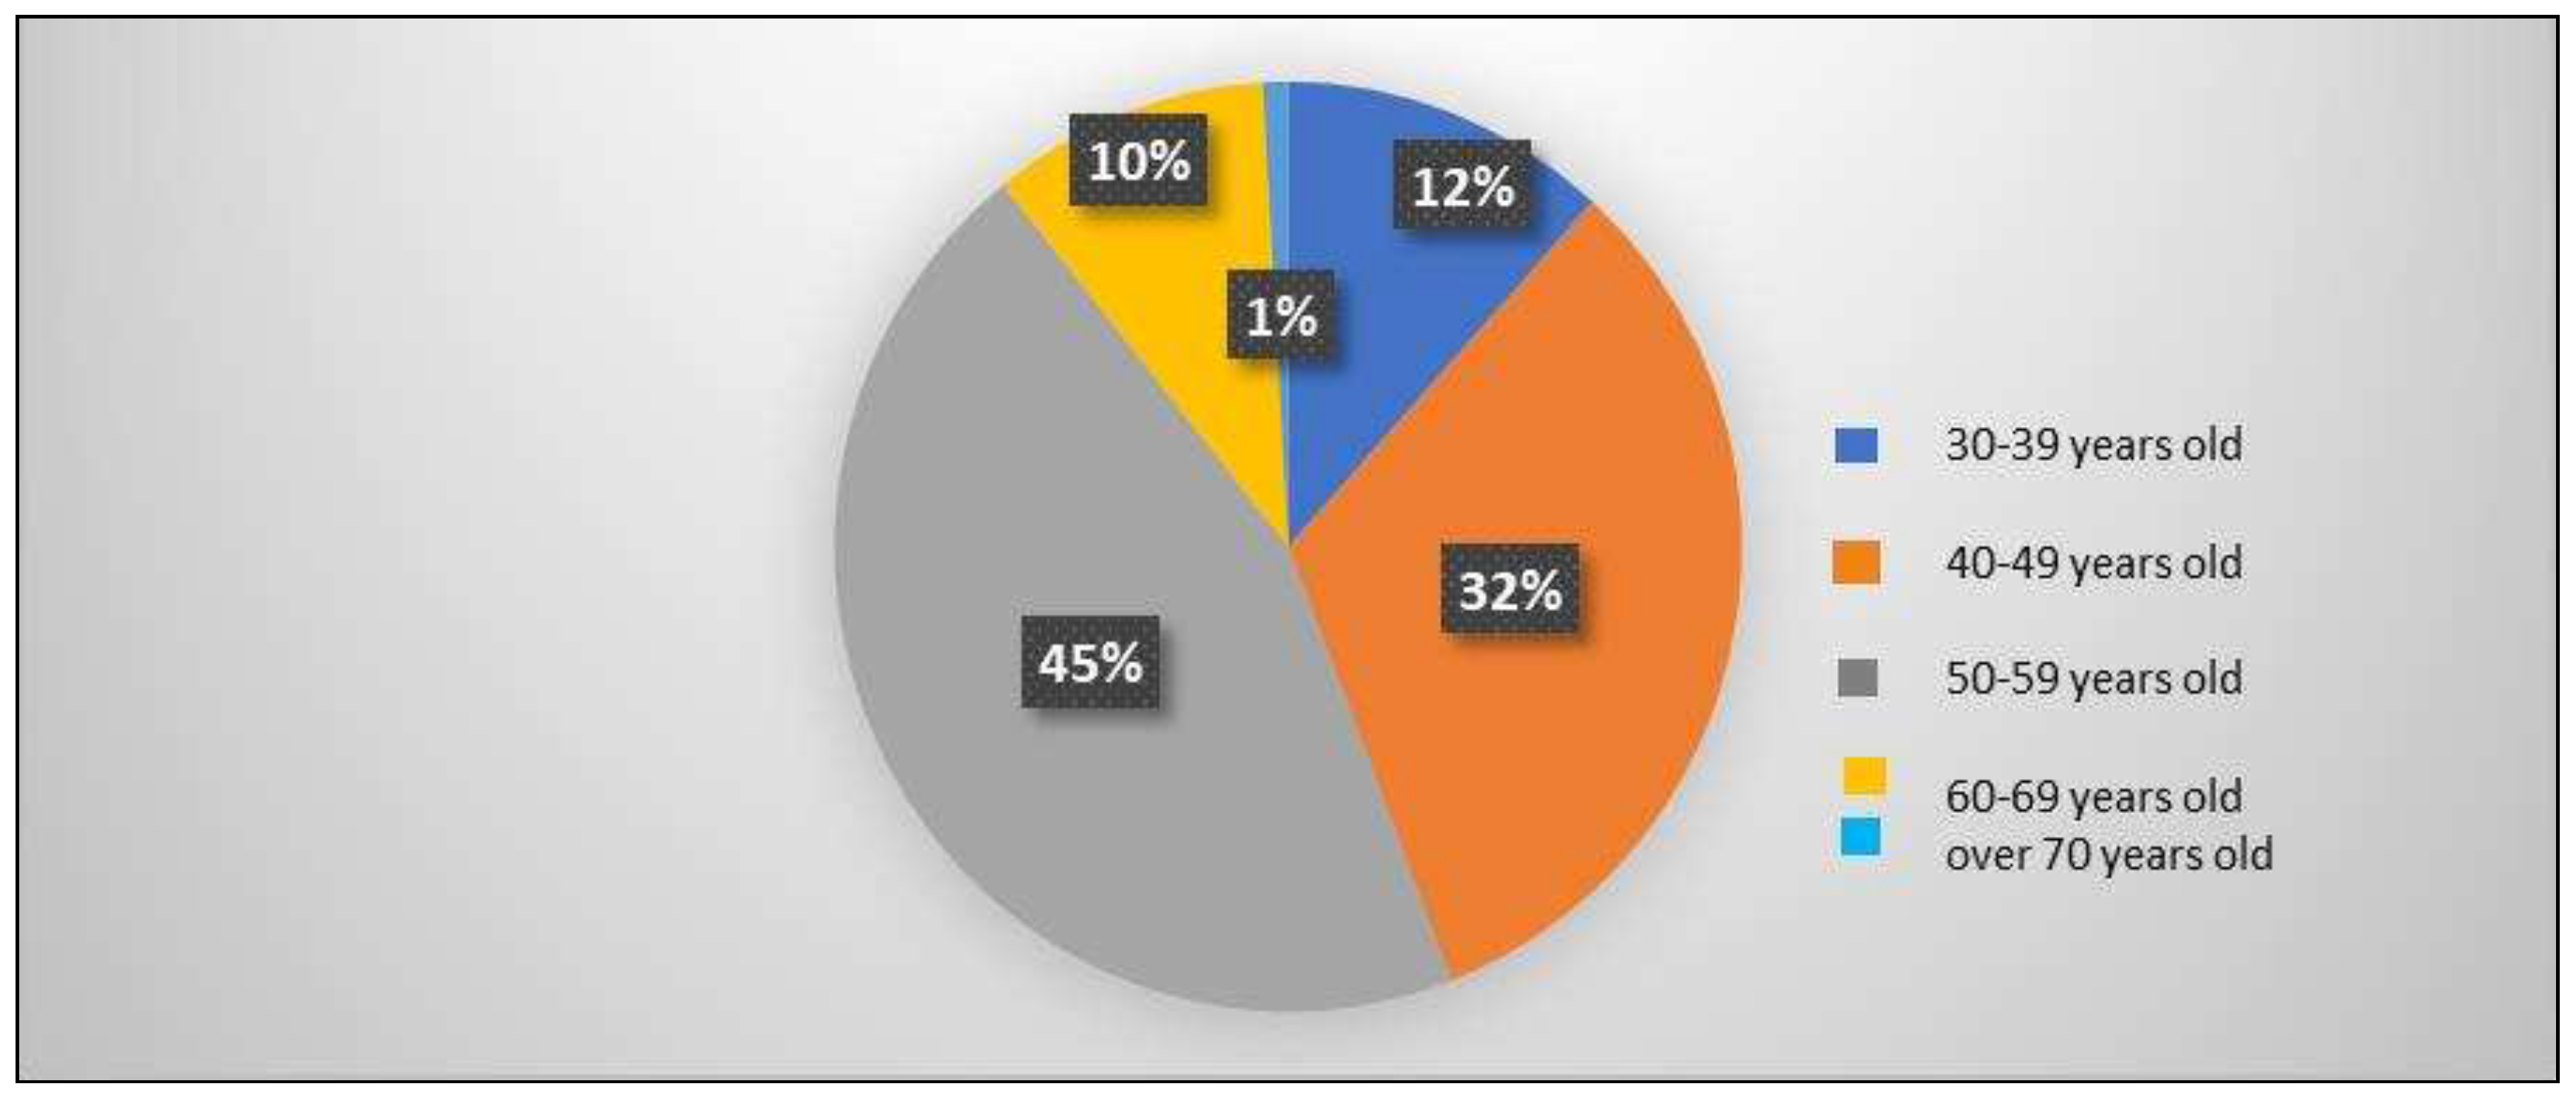
Figure 21 and
Figure 22 emphasize the distribution of the control group by age. Of the total number of patients, 13 were in the age range of 30-39 years, representing 12%, 36 were in the age range of 40-49 years, representing 32%, 50 were in the age range of 50-59 years, representing 45%, 11 were in the age range of 60-69 years, representing 10%, and only one was in the age range of over 70 years, representing 1%.
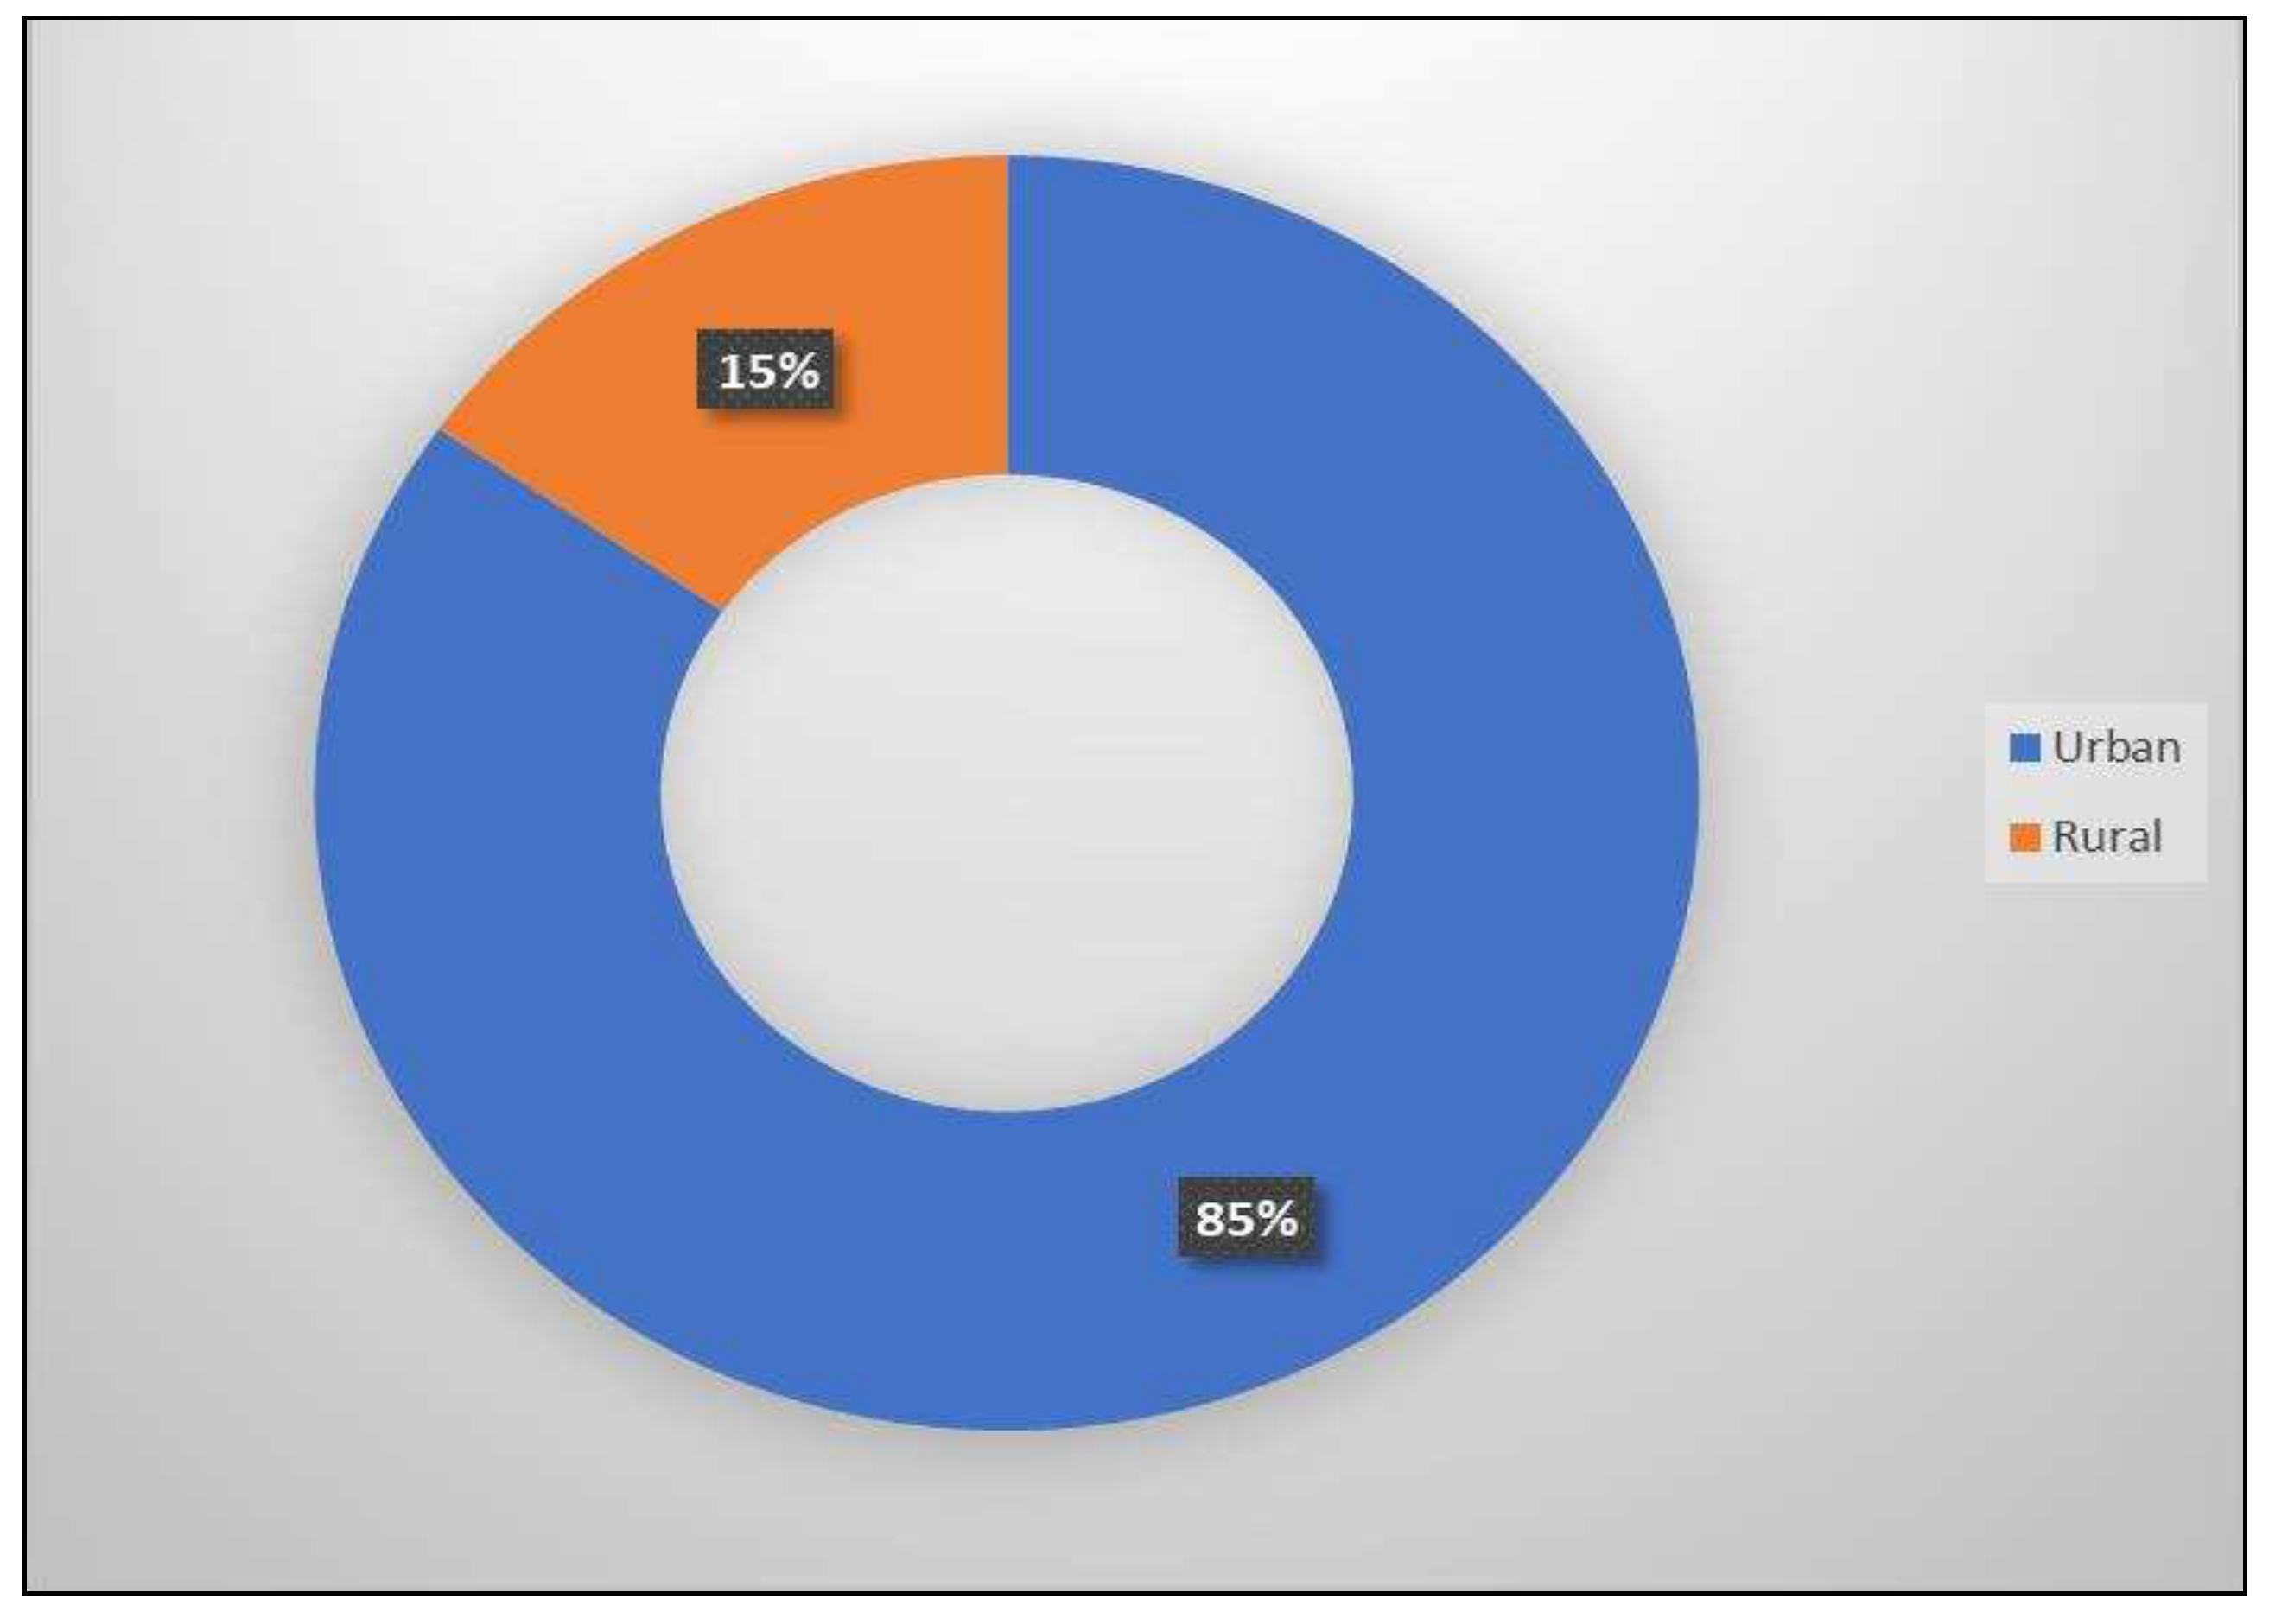
Figure 23 highlights the distribution of the control lot according to the medium of origin. Of the total control group, 85% came from urban areas and 15% came from rural areas.
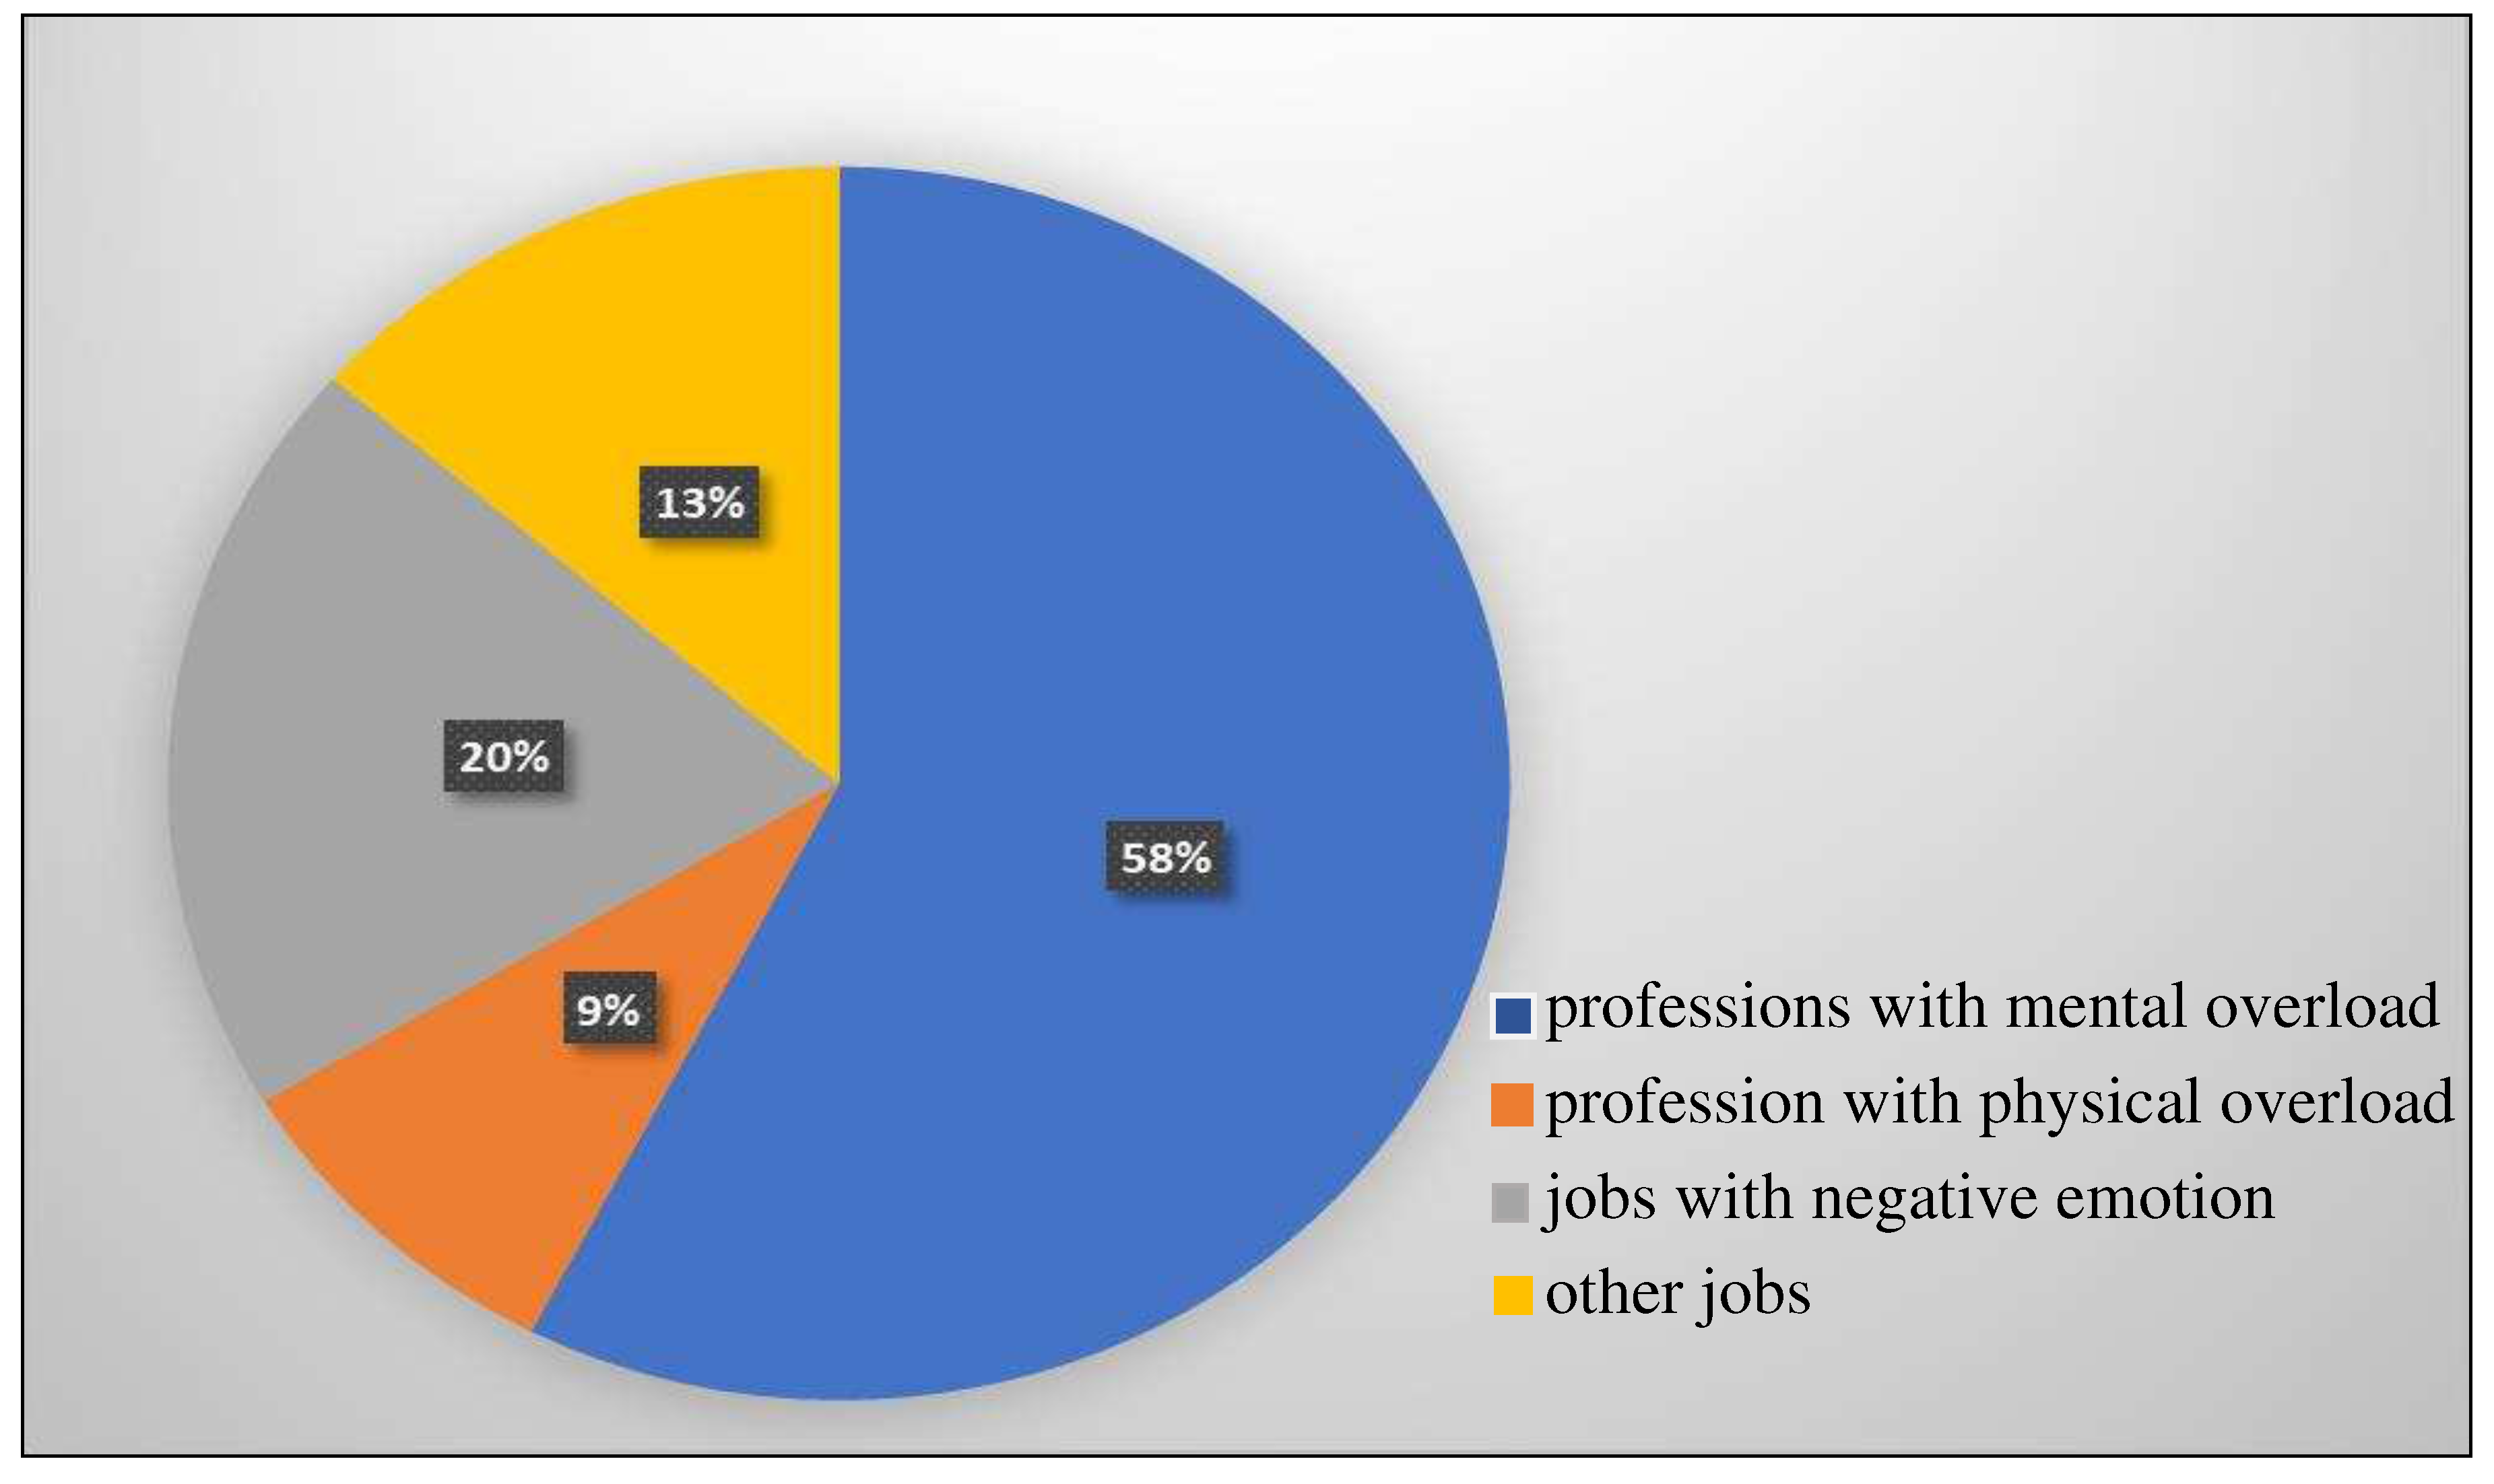
Figure 24 emphasizes the distribution of the control group according to working conditions. 58% had professions with mental overload, 20% had jobs with negative emotional factors, 9% had professions with physical overload and 13% had other working conditions.
Figure 25 and
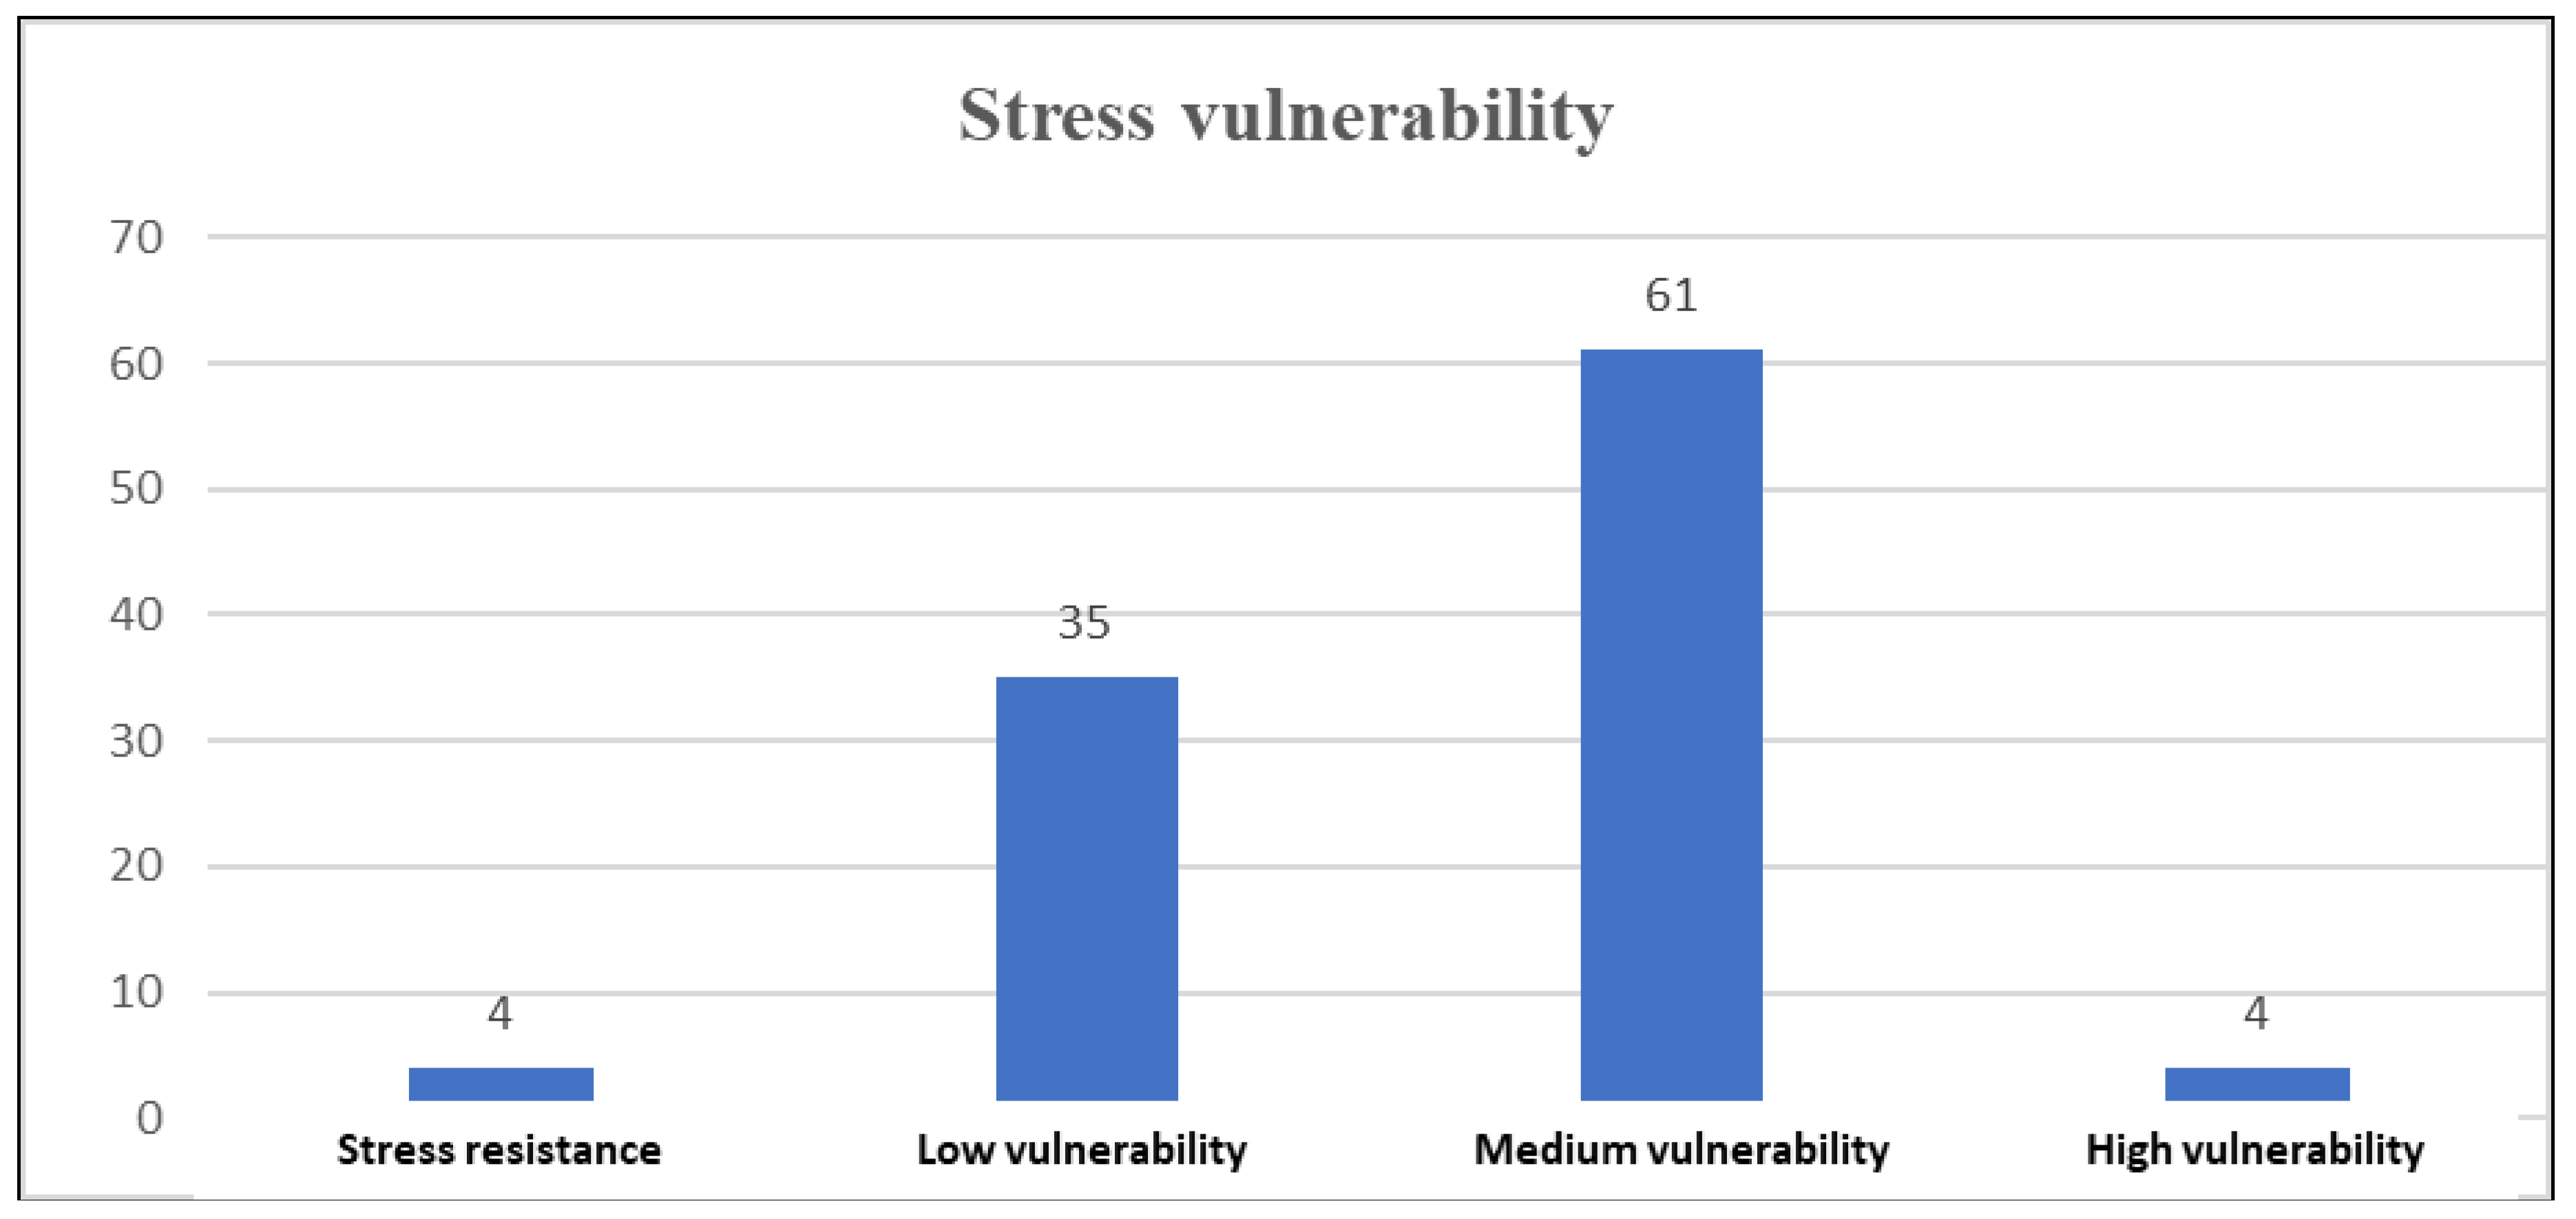
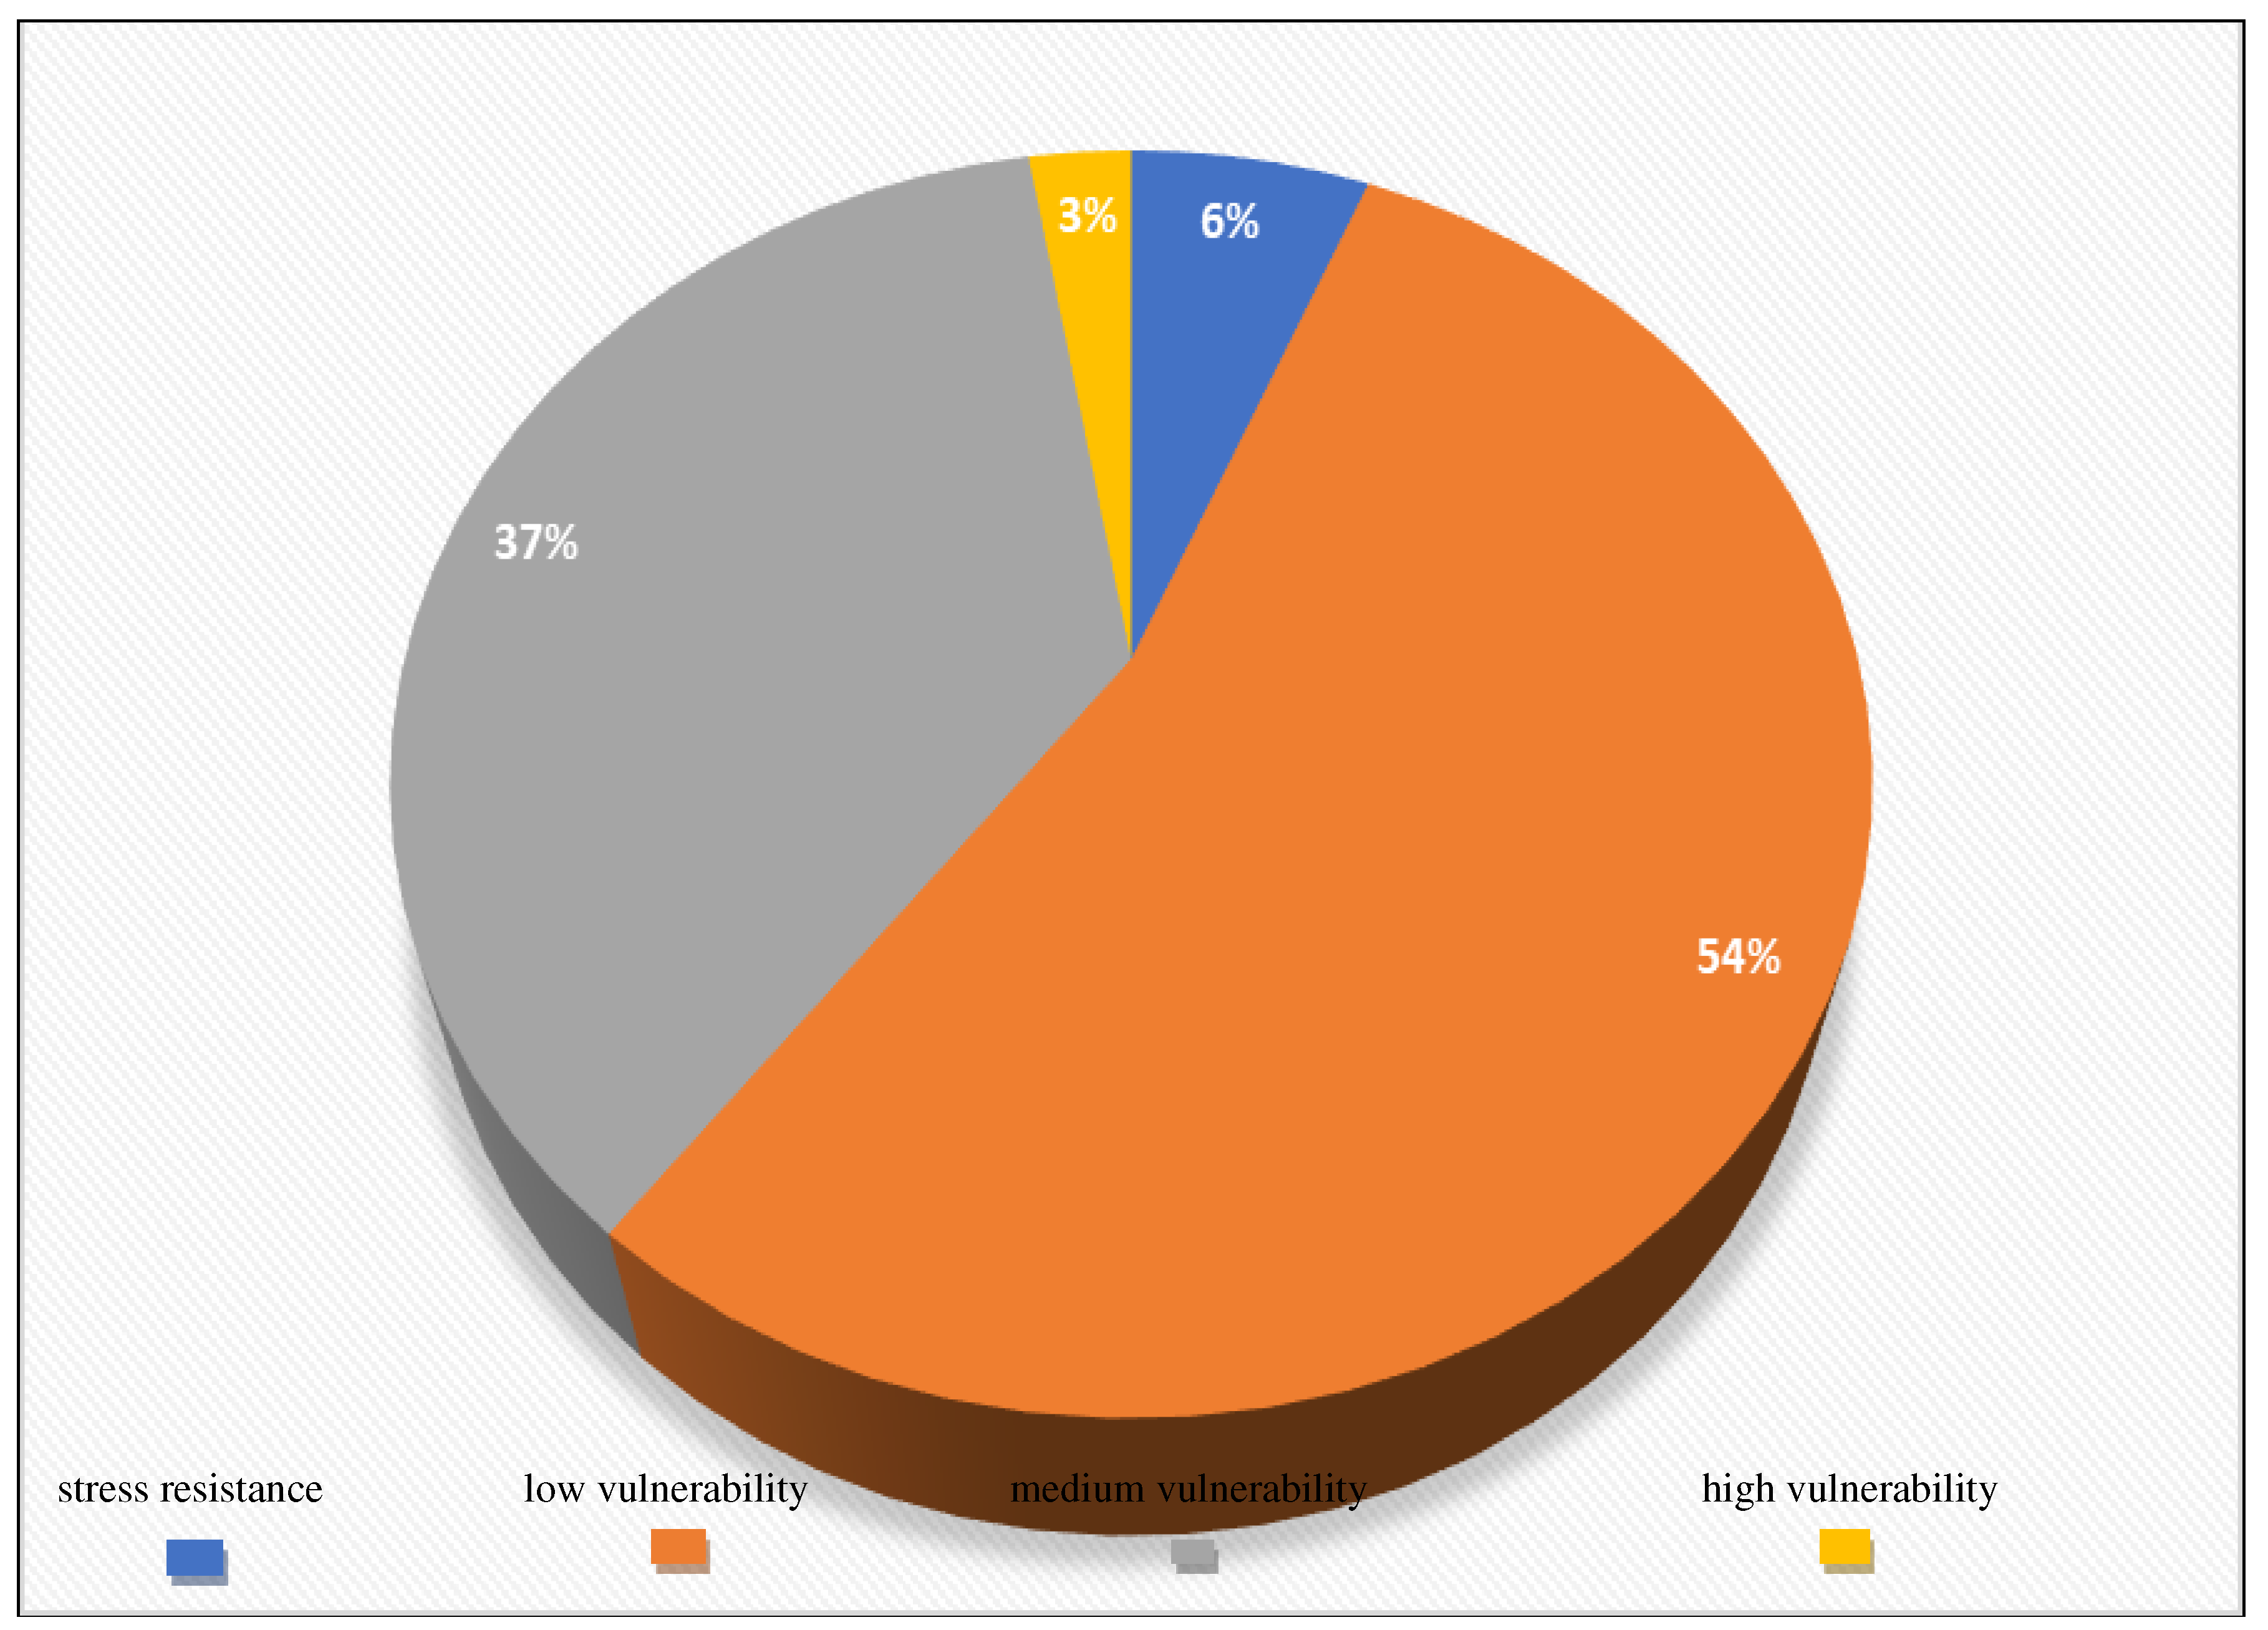
Figure 26 present the distribution of the control group according to vulnerability to stress. Thus, 7 people, representing 6%, showed resistance to stress, 60 people, representing 54%, showed low vulnerability to stress, 41 people, representing 37%, showed medium vulnerability to stress, and 3 people, representing 3%, showed high vulnerability to stress.
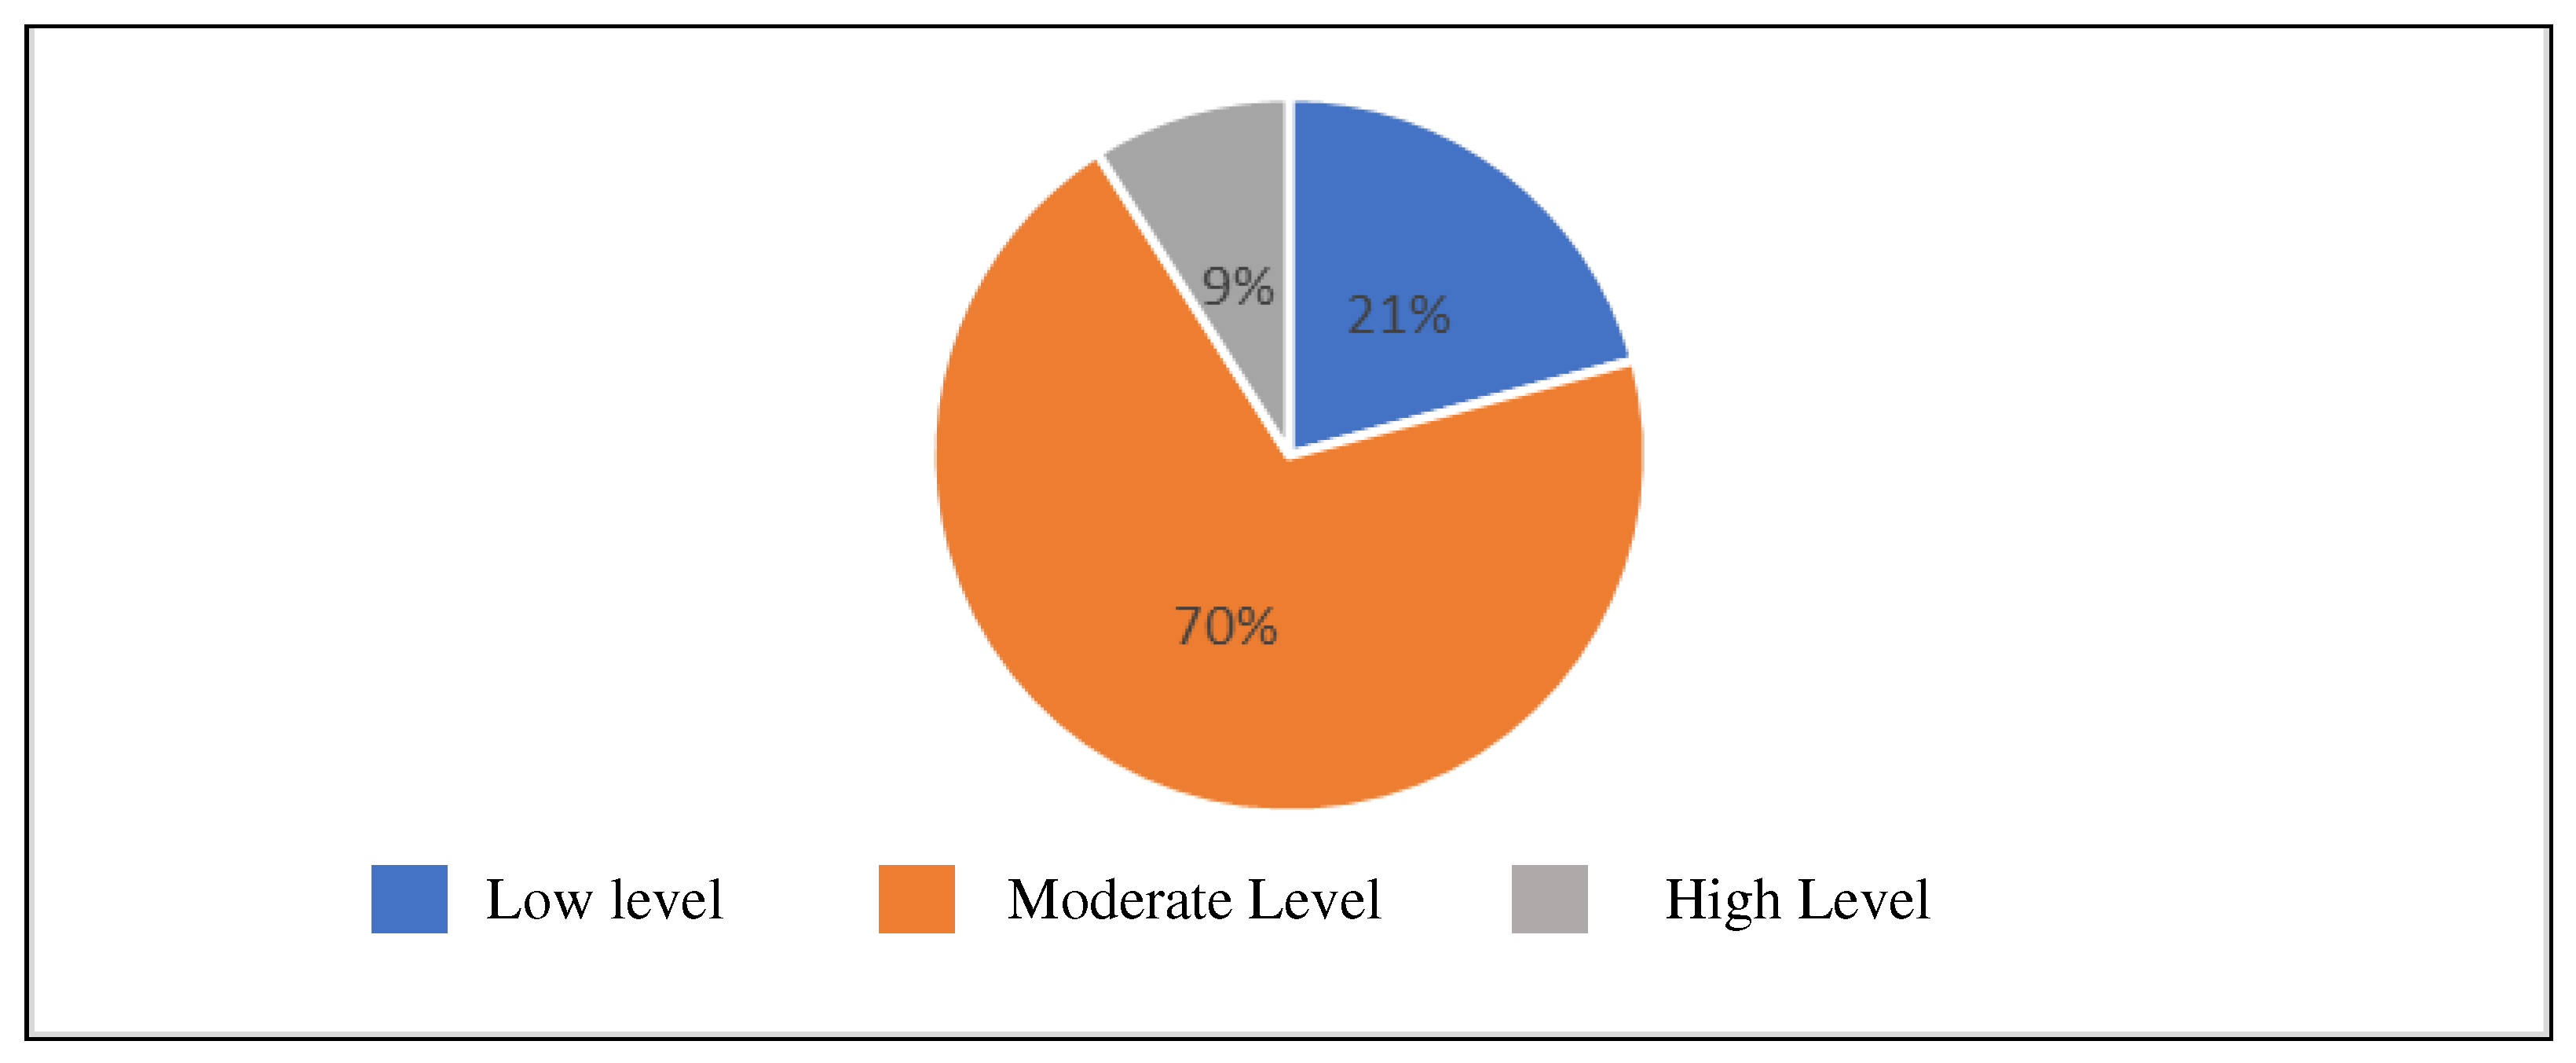
Figure 27 and
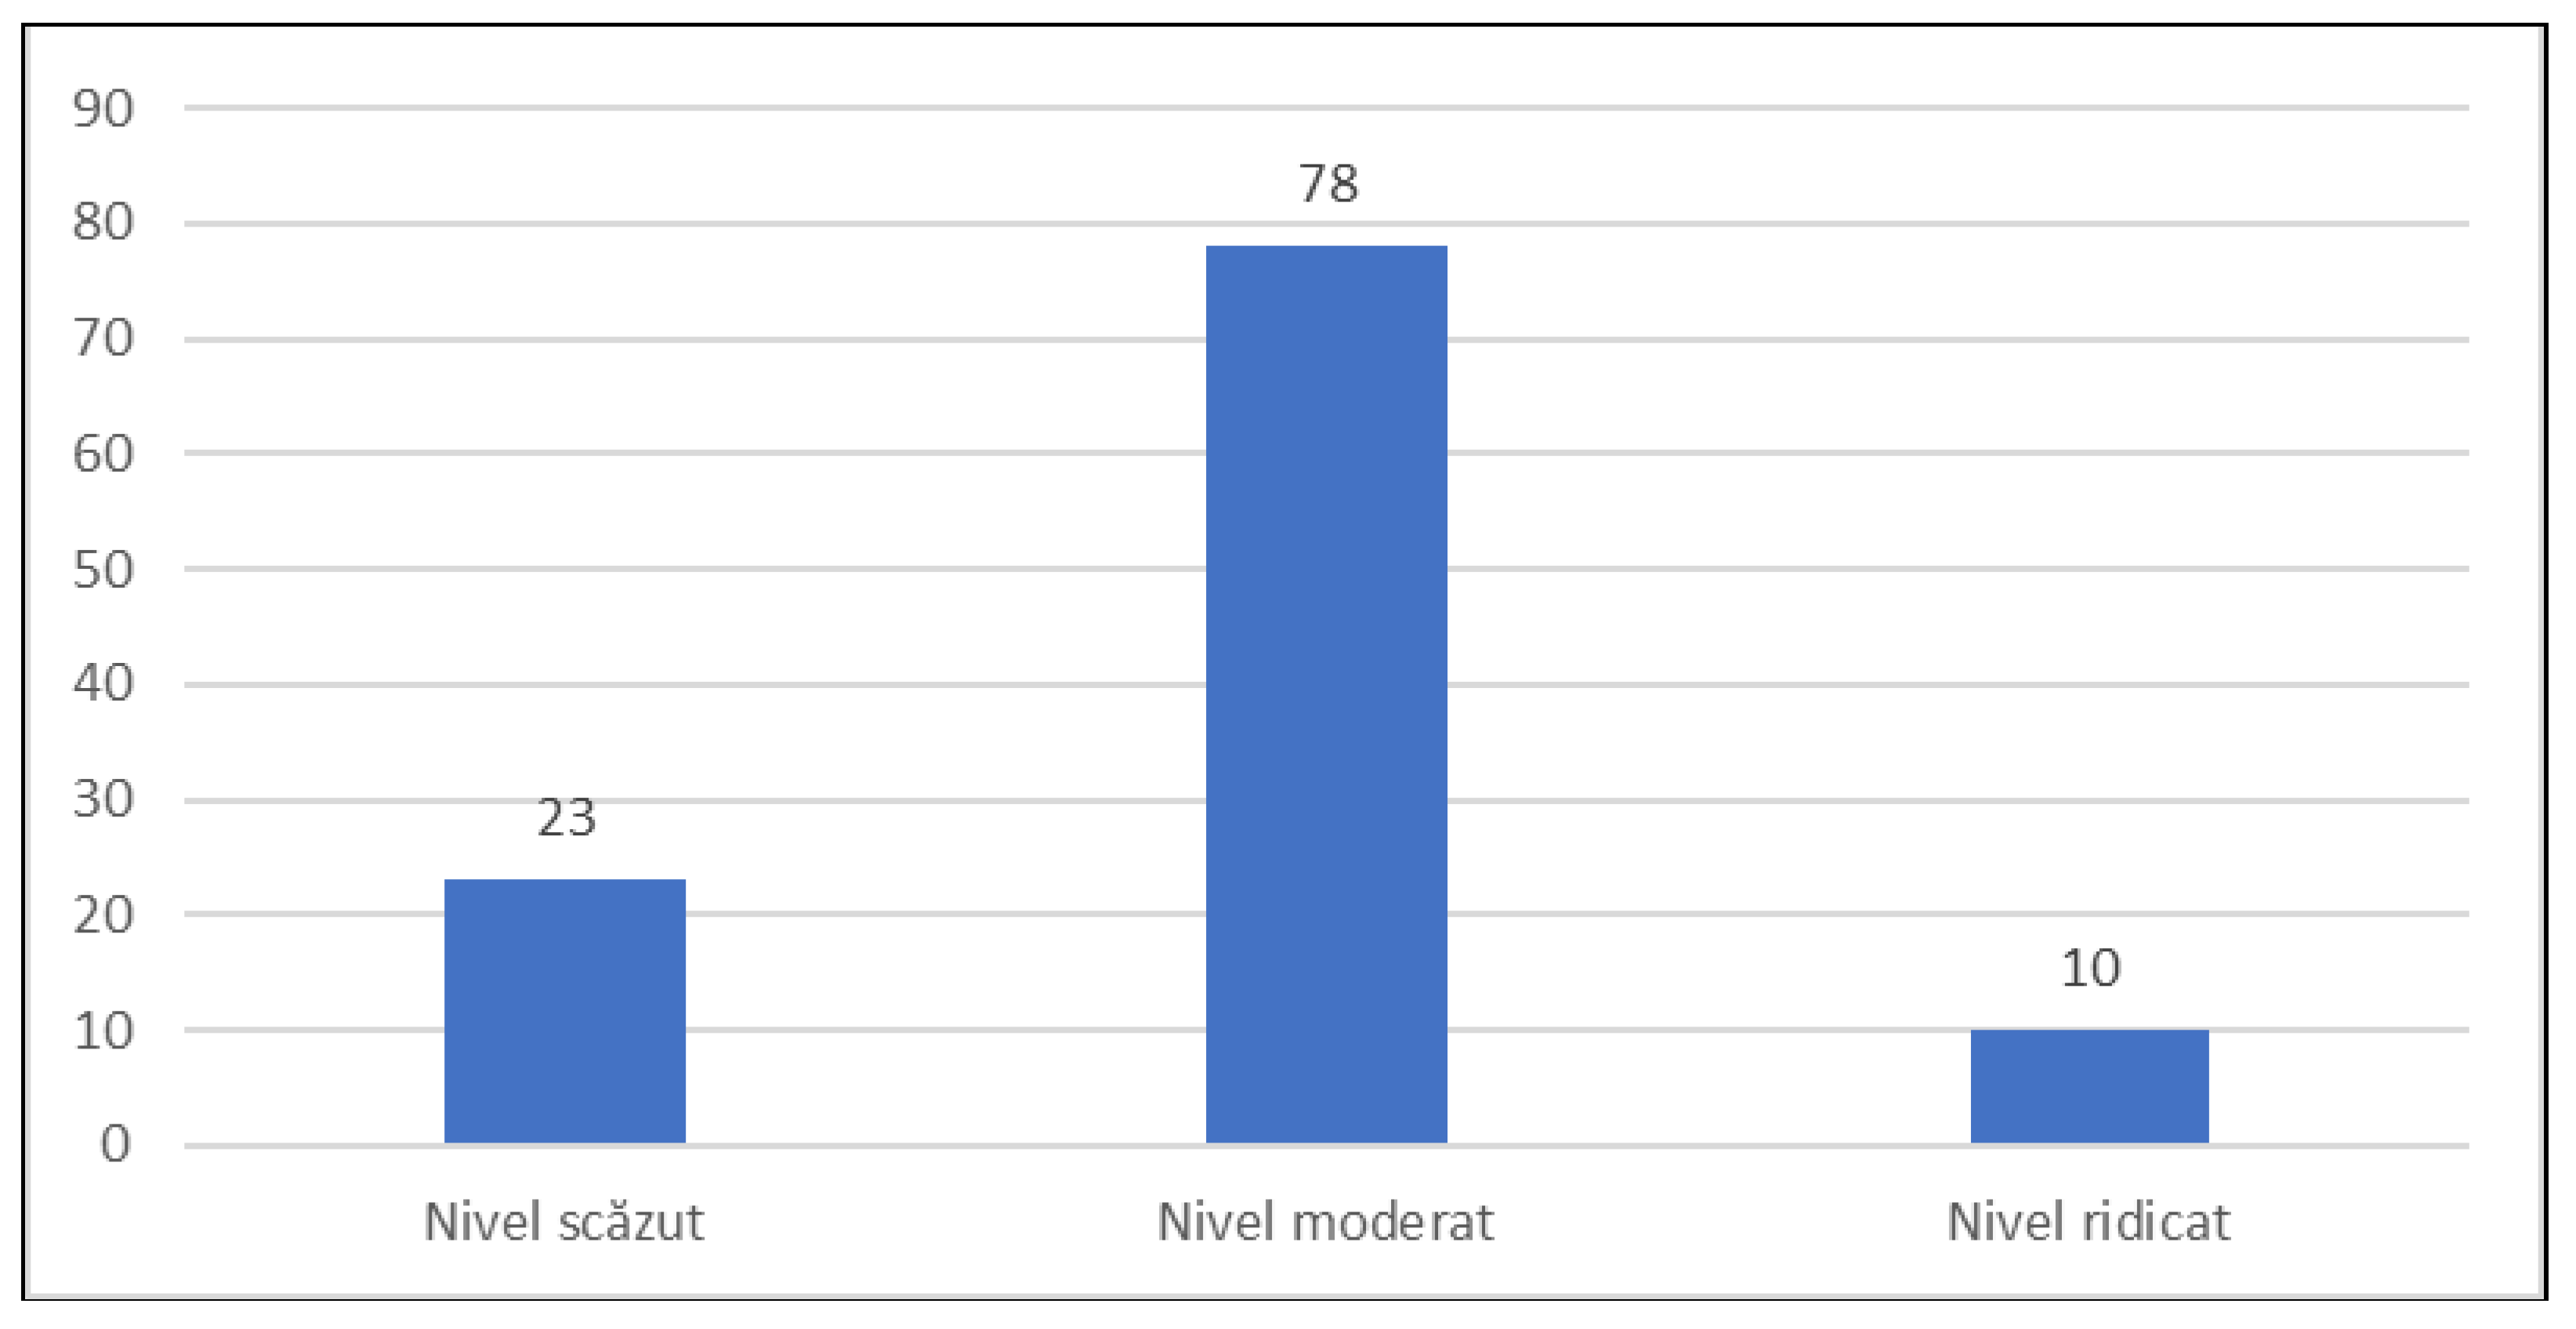
Figure 28 emphasize the distribution of the control group according to the perceived stress level. Among the 111 people who made up the control group, 23 people, representing 21%, had a low level of stress, 78 people, representing 70%, had a moderate level of stress, and 10 people, representing 9%, had a high level of stress.
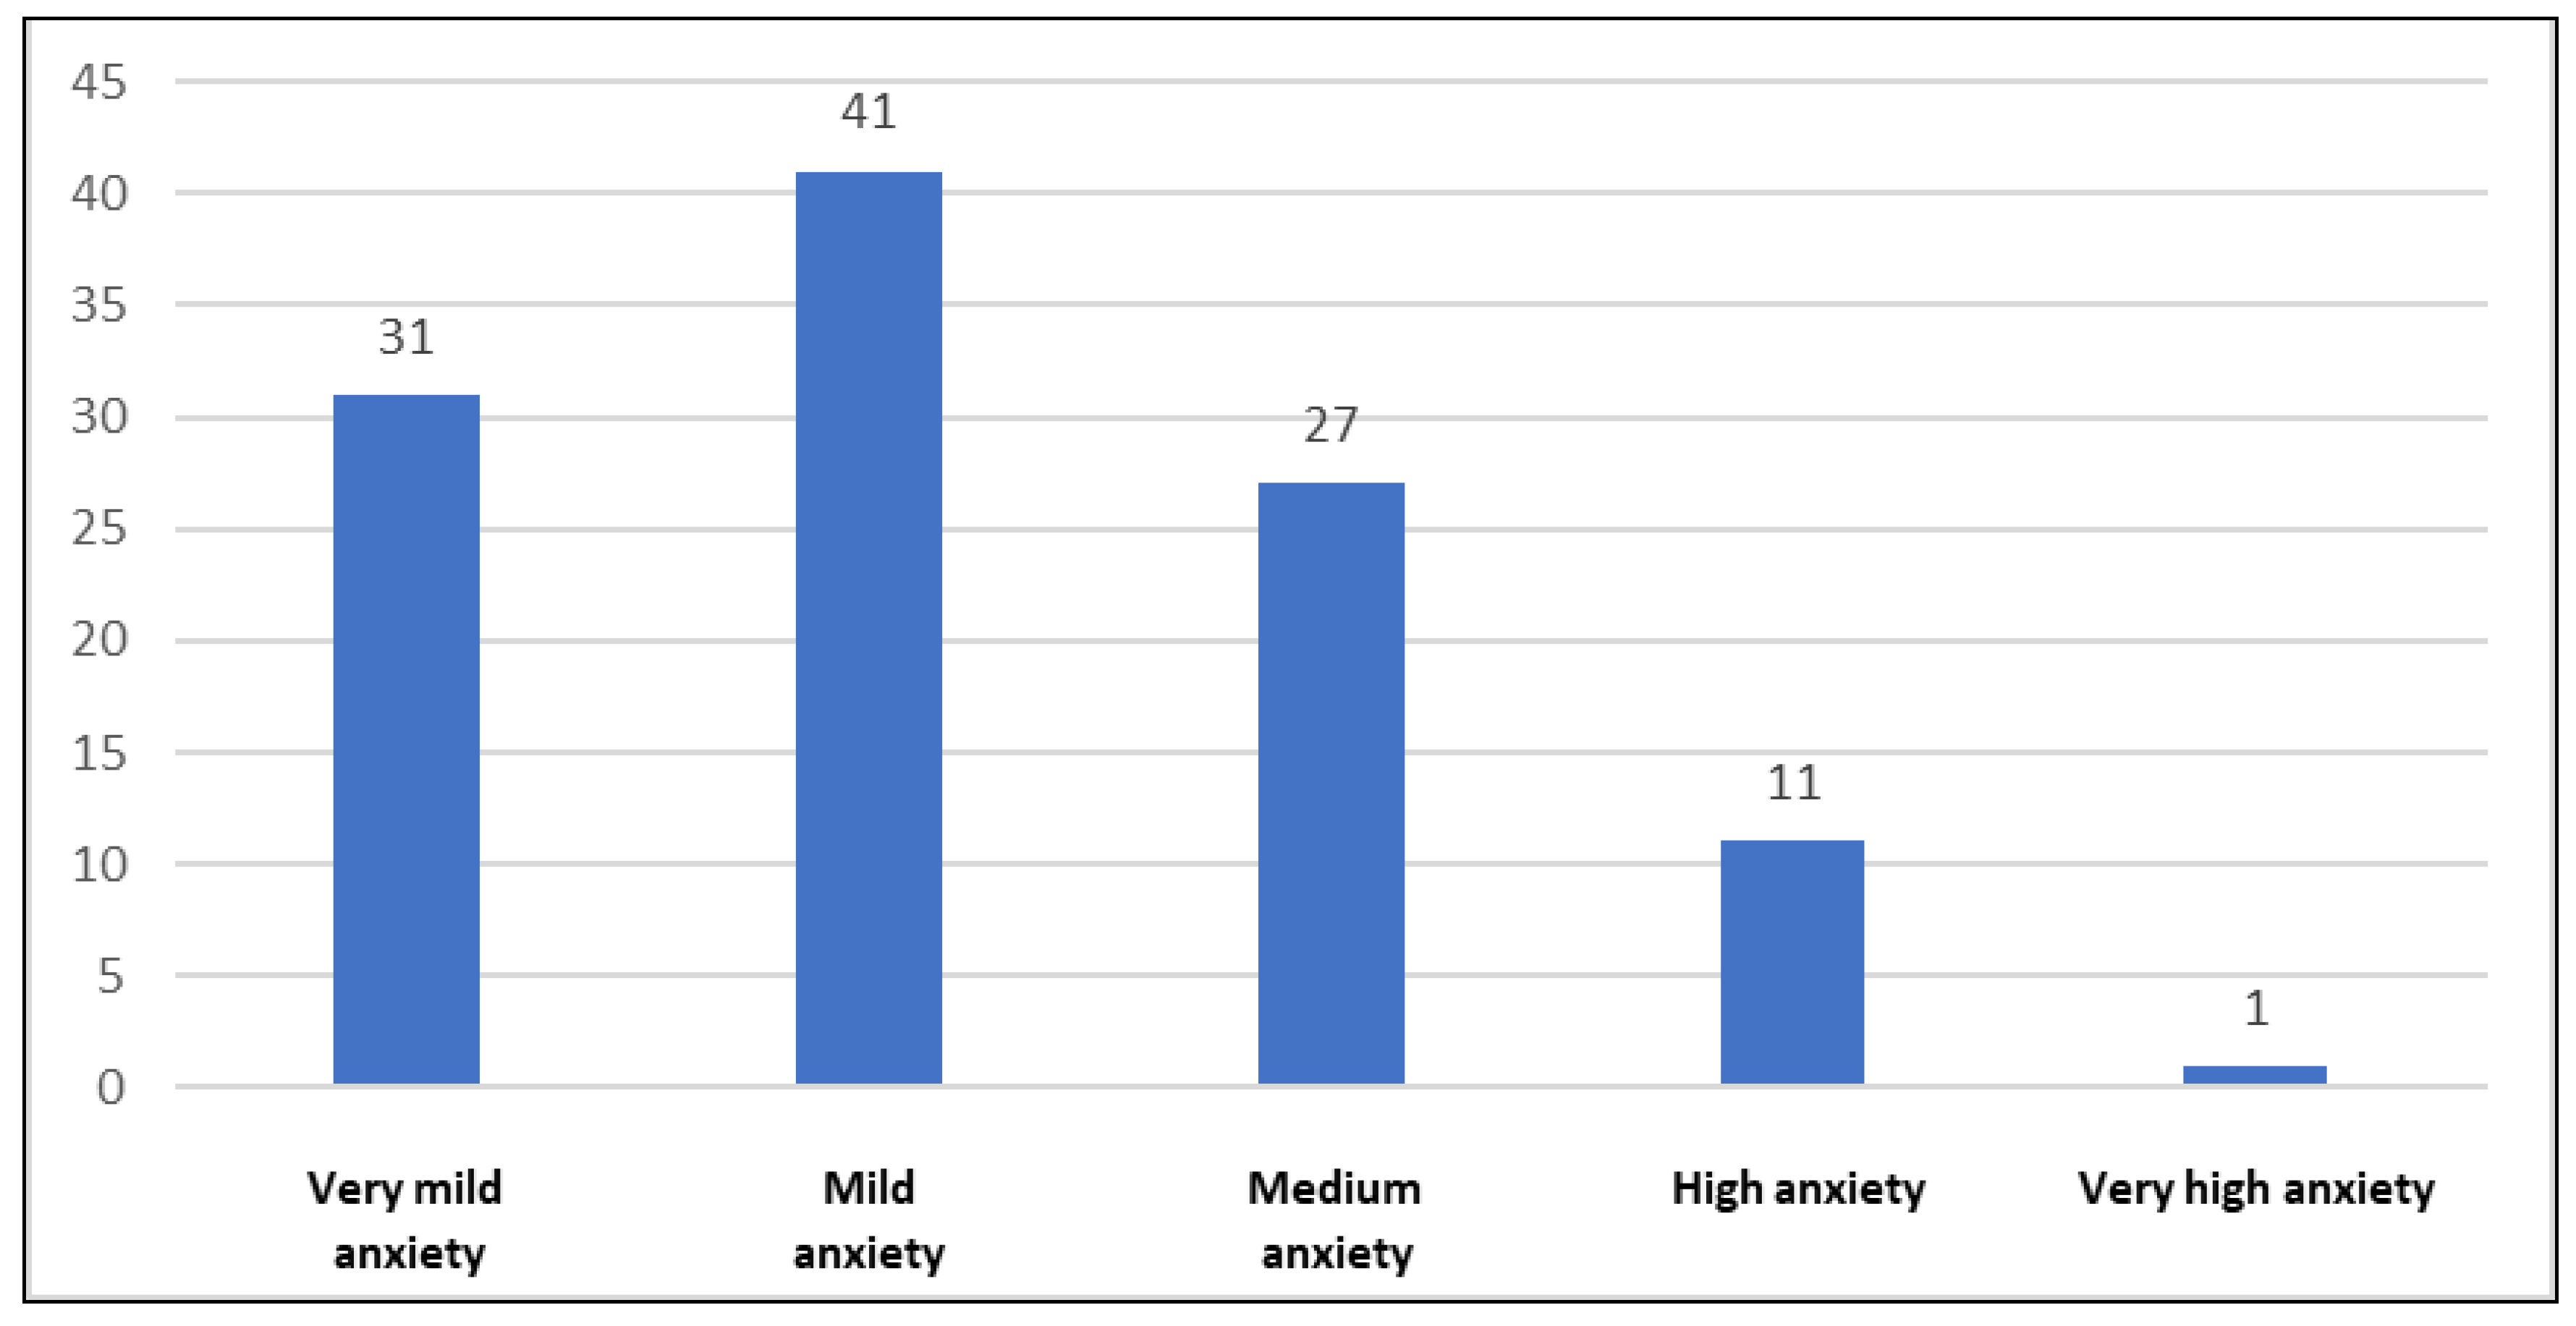
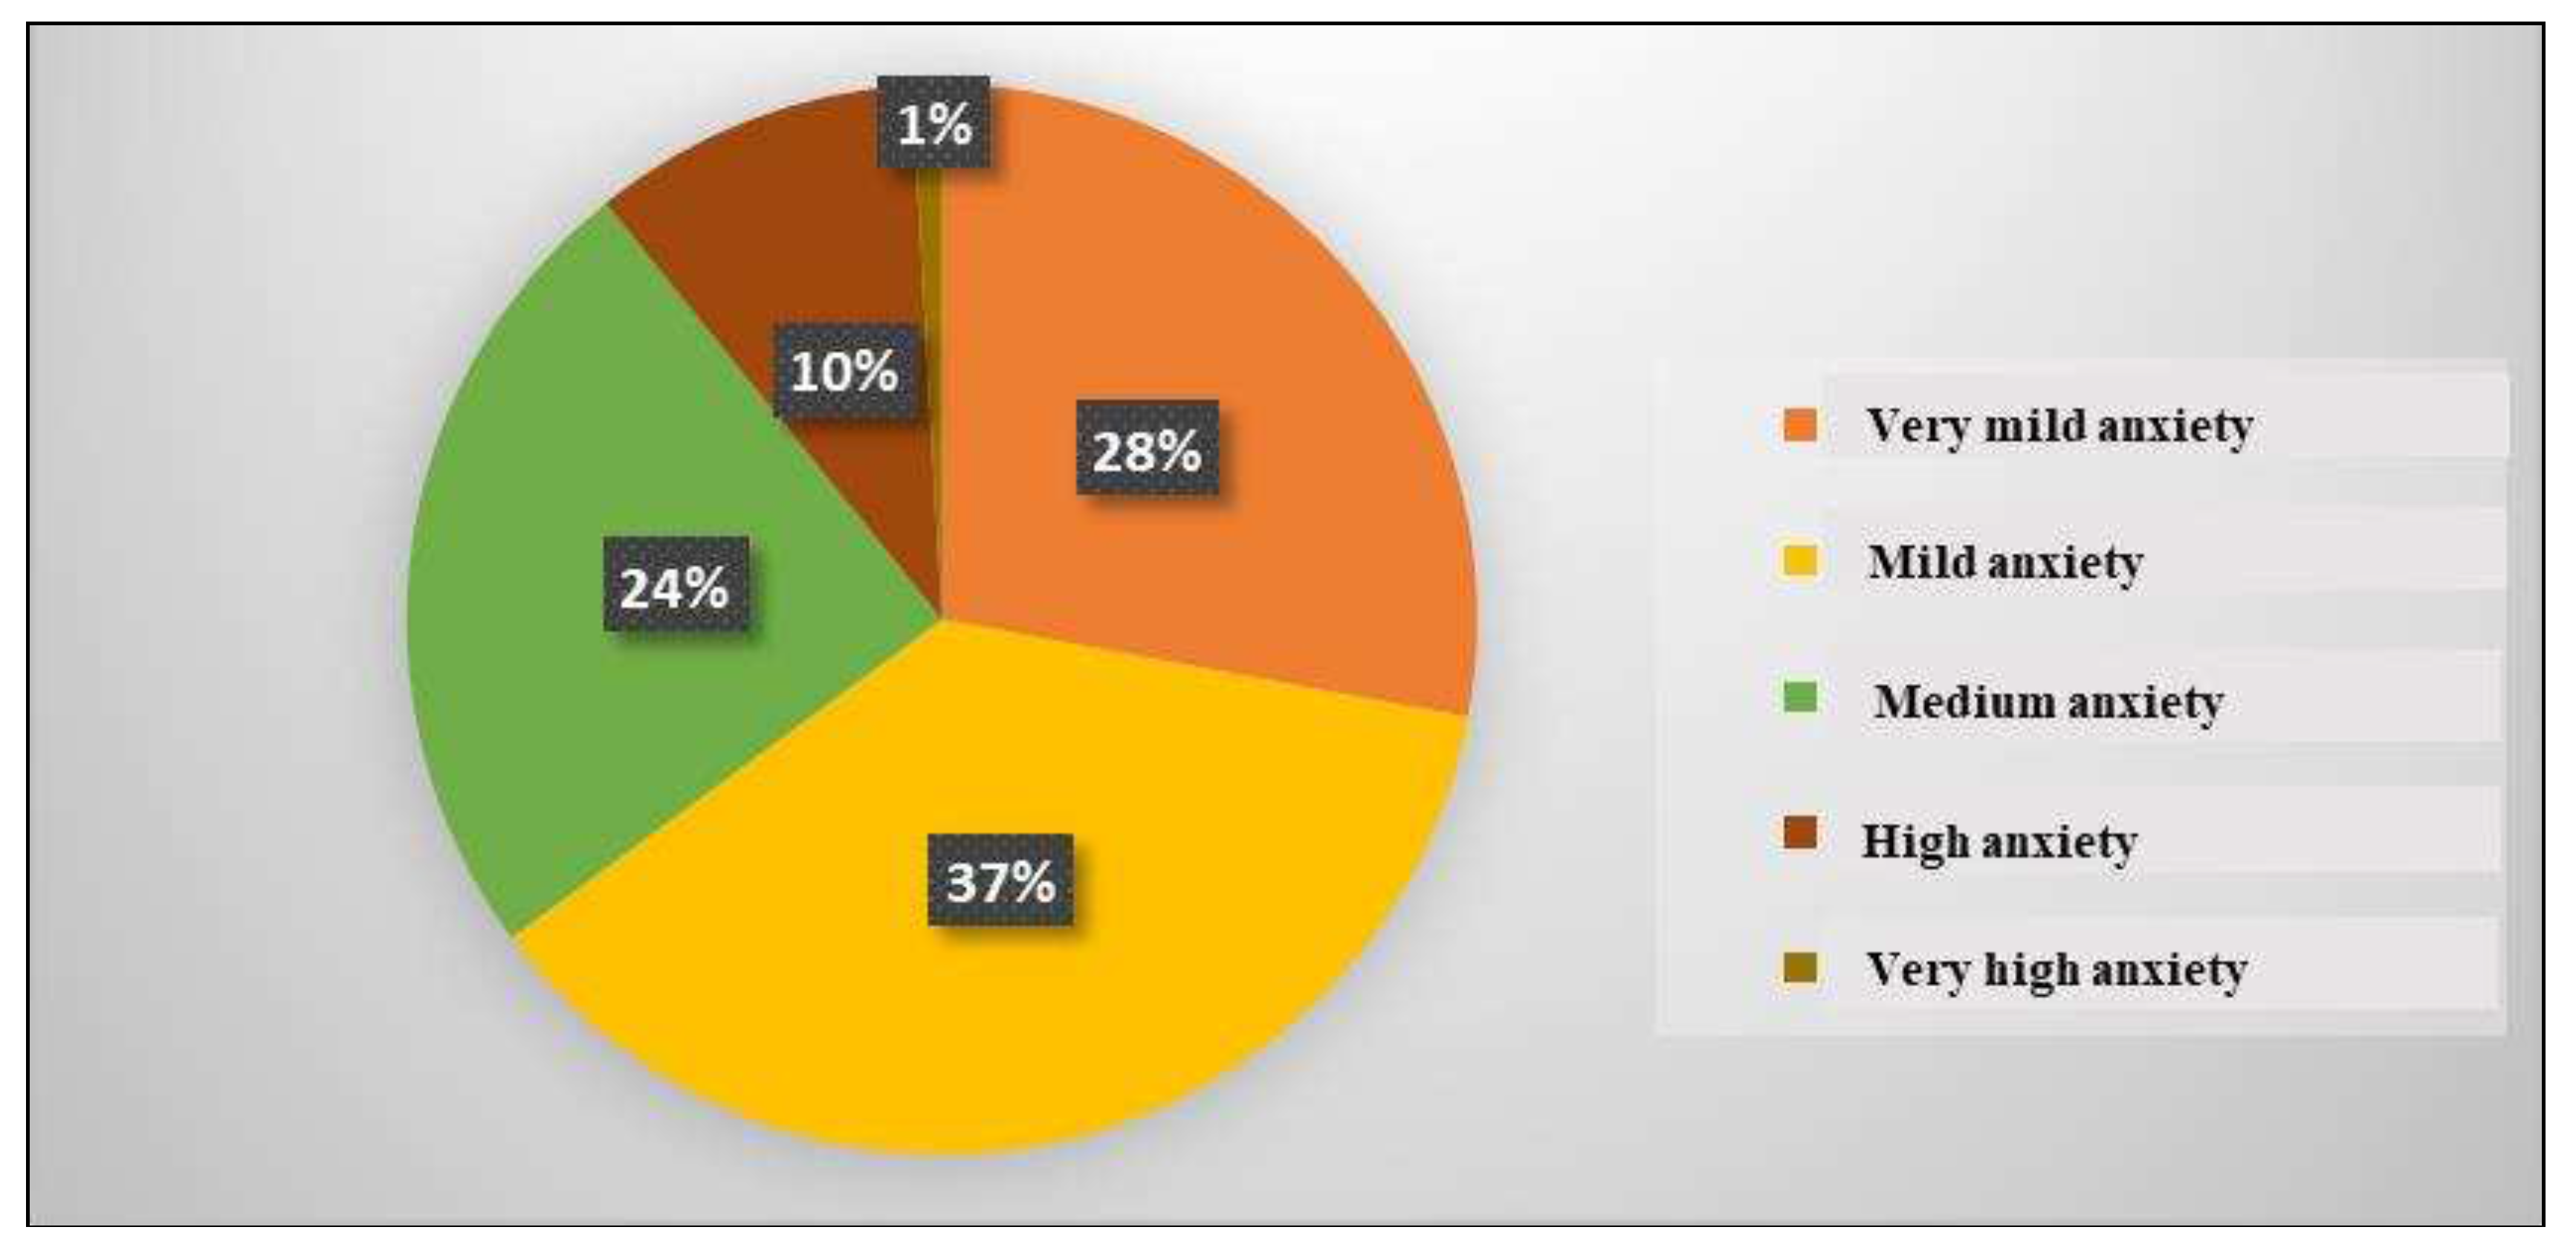
Figure 29 and
Figure 30 show the distribution of the control group according to the anxiety state level. 31 people, representing 28%, had very mild anxiety, 41 people, representing 37%, had mild anxiety, 27 people, representing 24%, had medium anxiety, 11 people, representing 10%, had high anxiety and only one person, representing 1%, had very high anxiety.
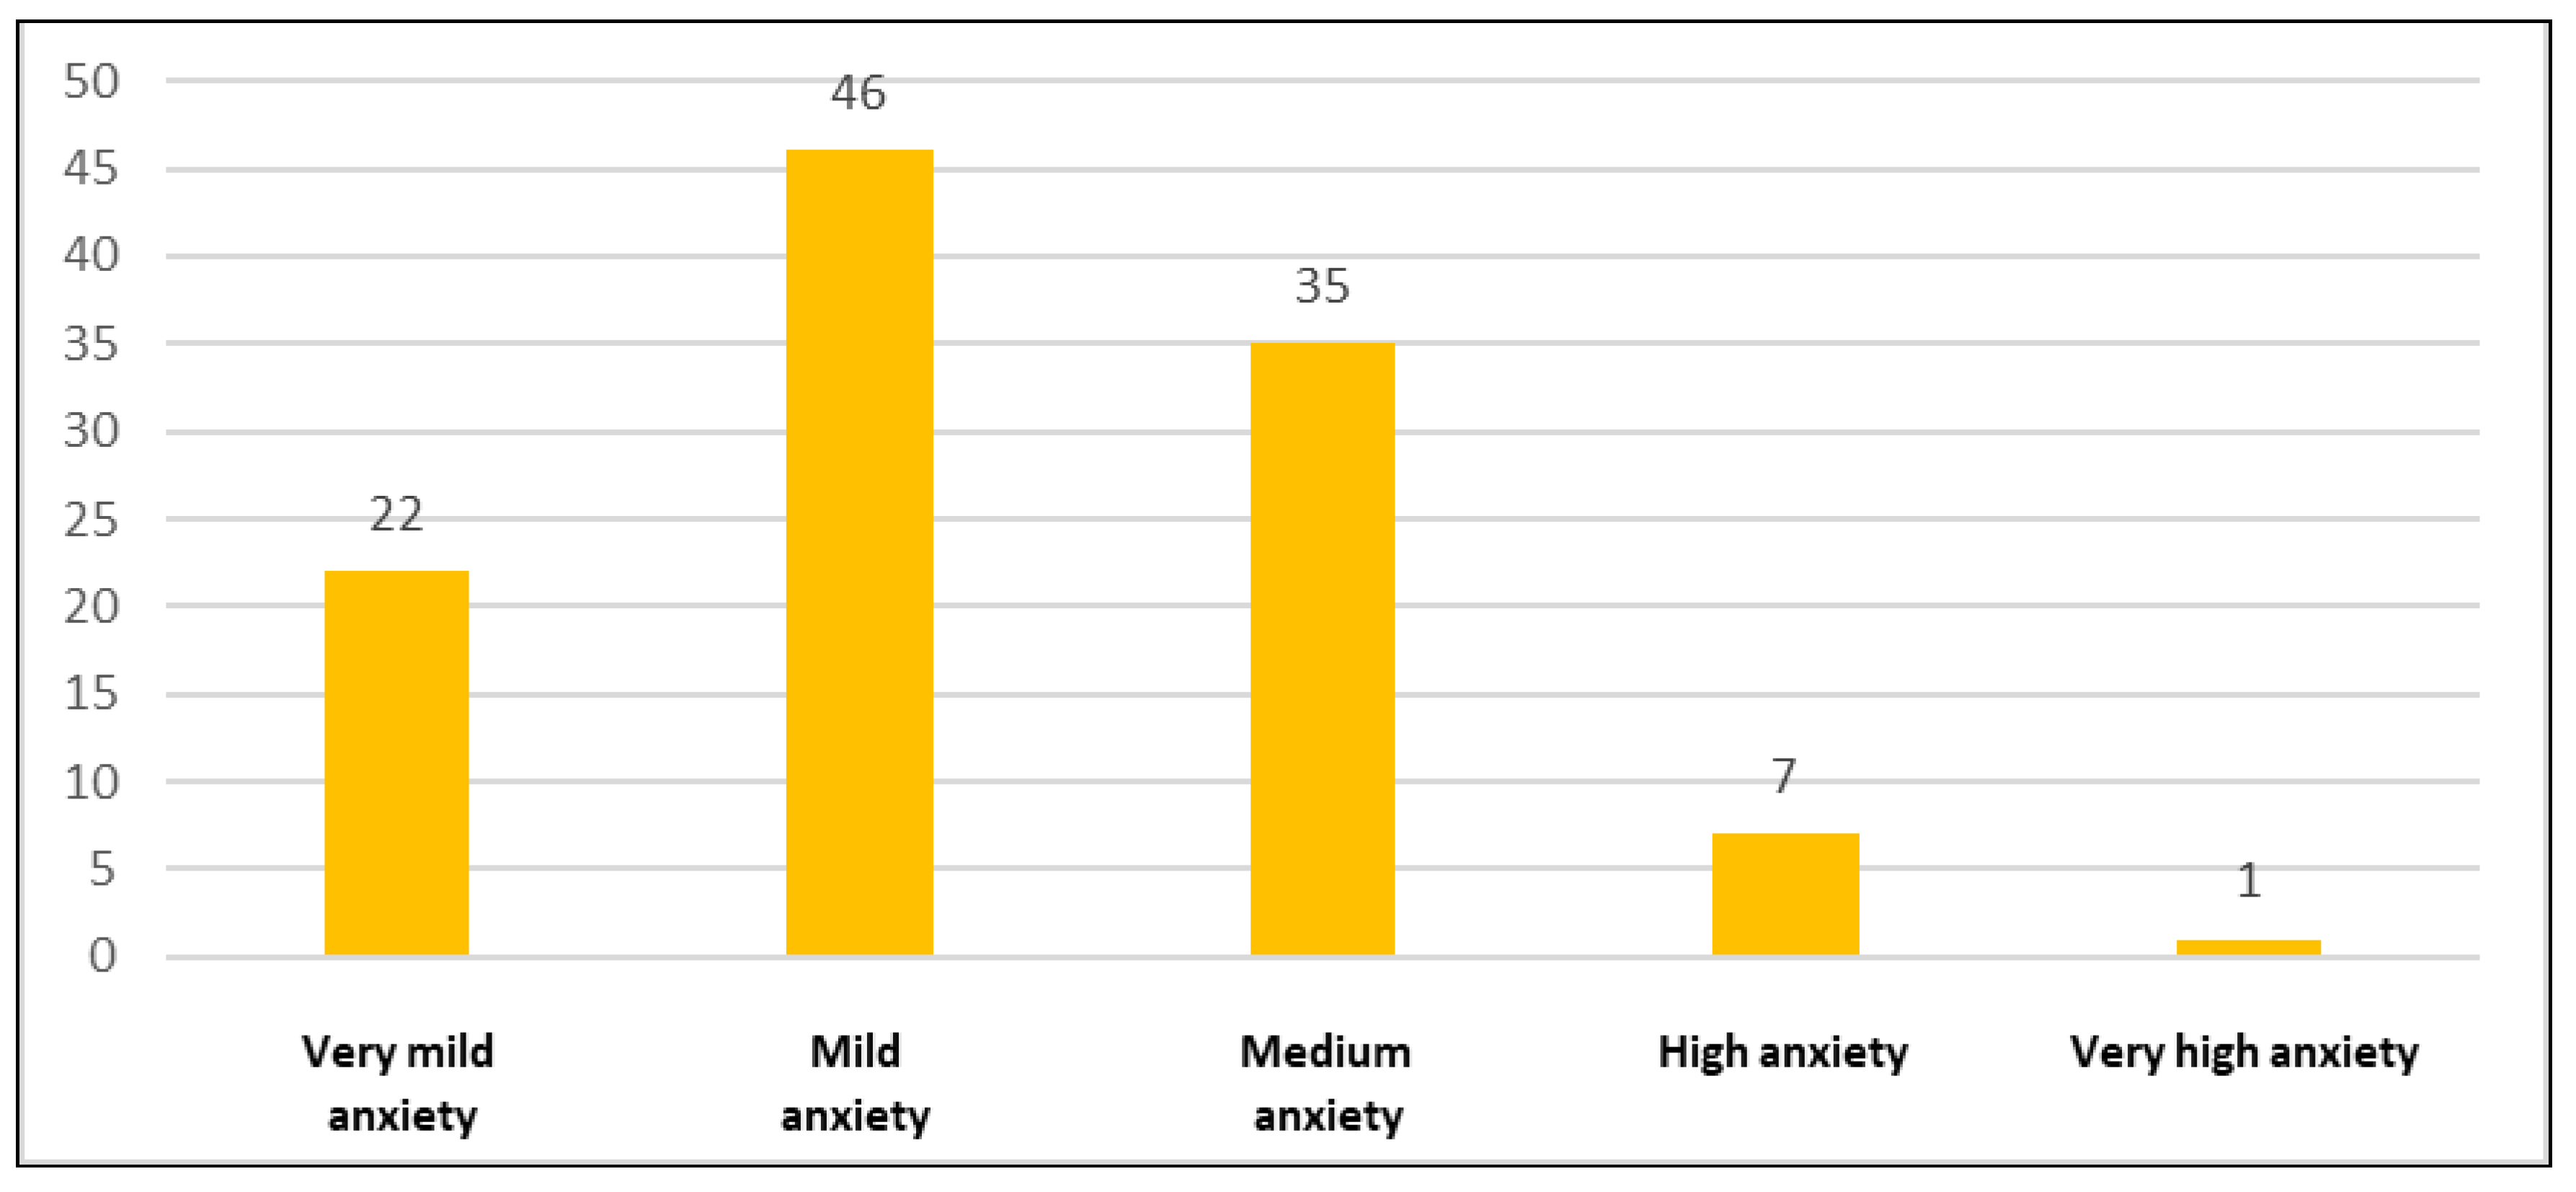
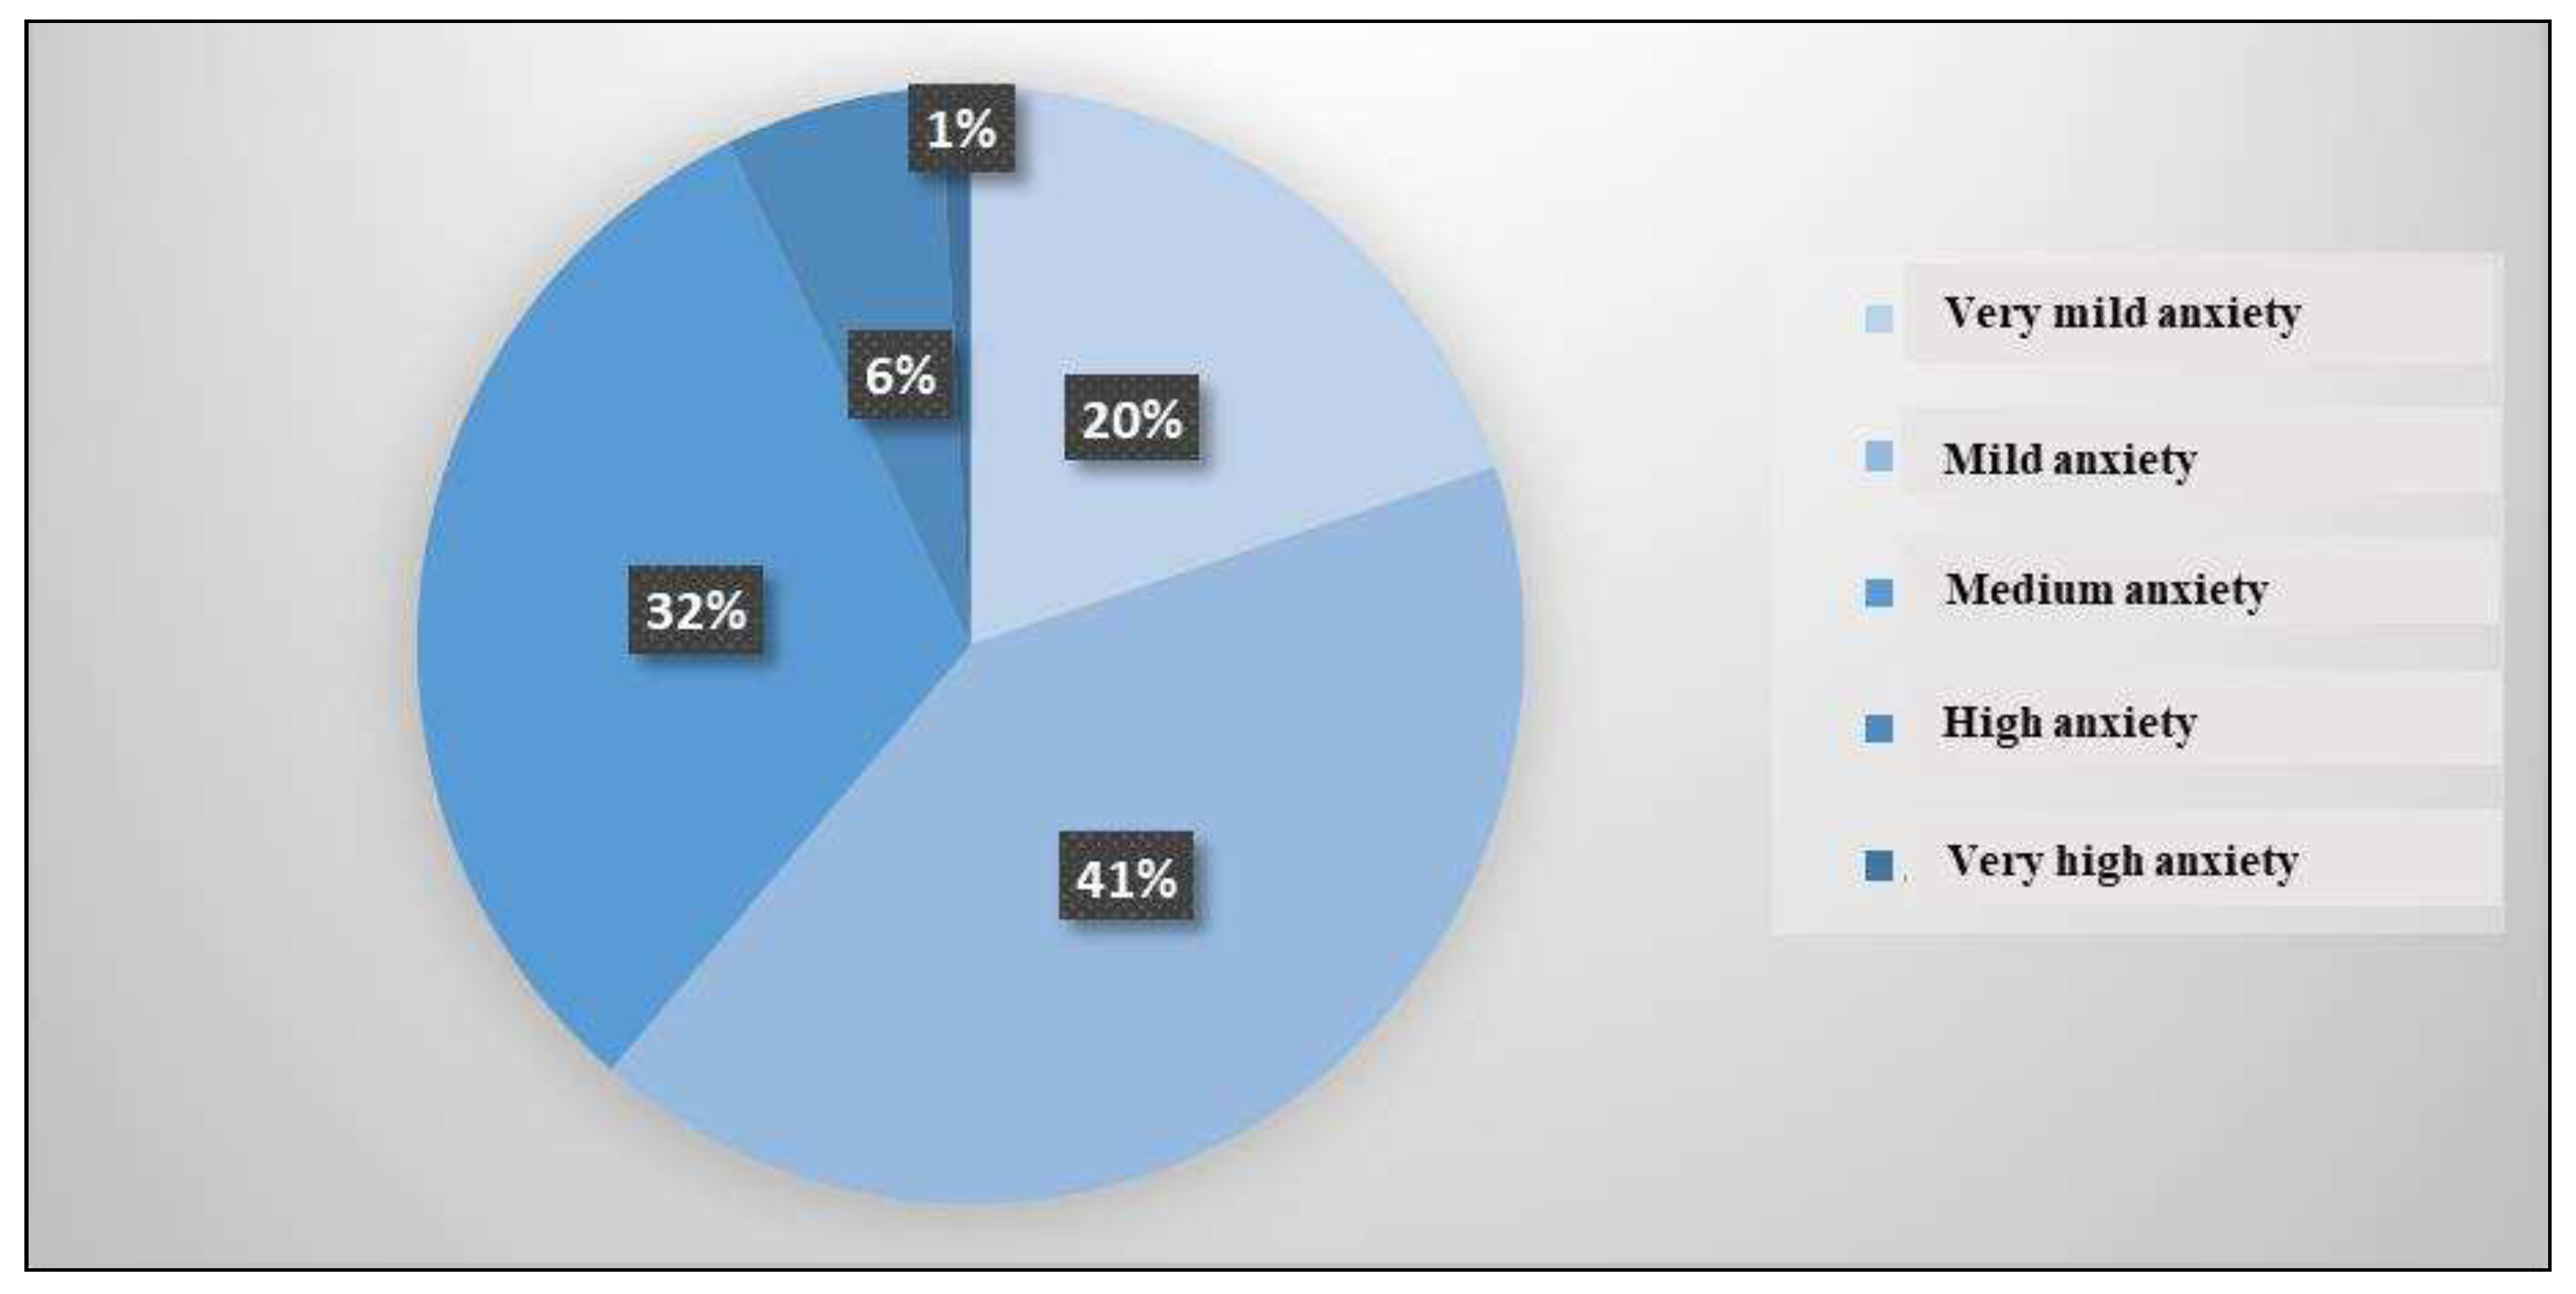
Figure 31 and
Figure 32 highlight the distribution of the control group according to the anxiety trait level. 22 people, representing 20%, had very mild anxiety, 46 people, representing 41%, had mild anxiety, 35 people, representing 32%, had medium anxiety, 7 people, representing 6%, had high anxiety and only one person, representing 1%, had very high anxiety.
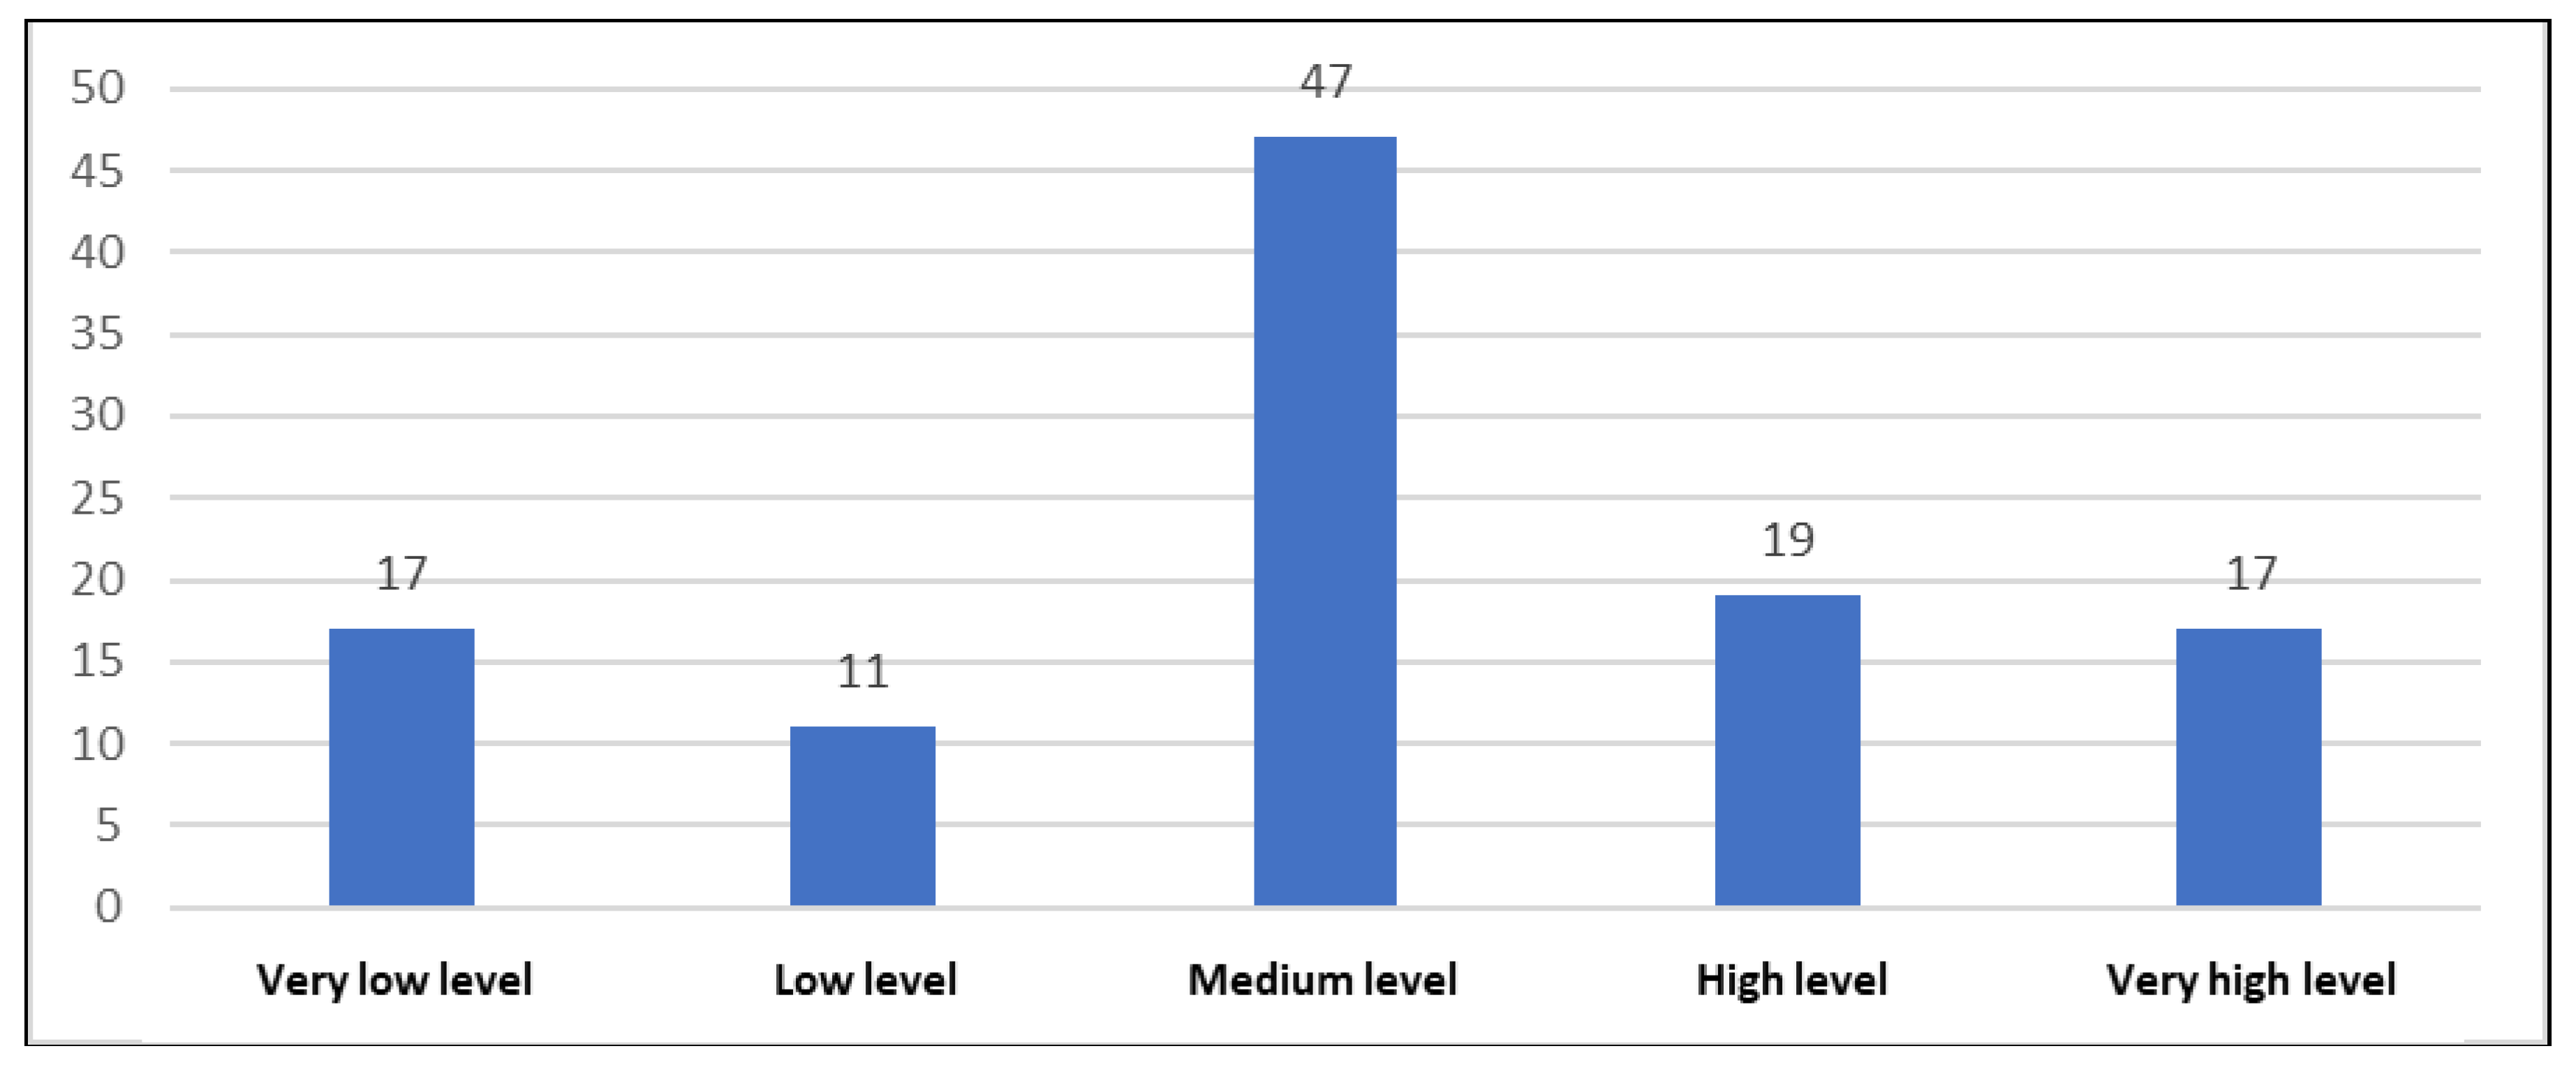
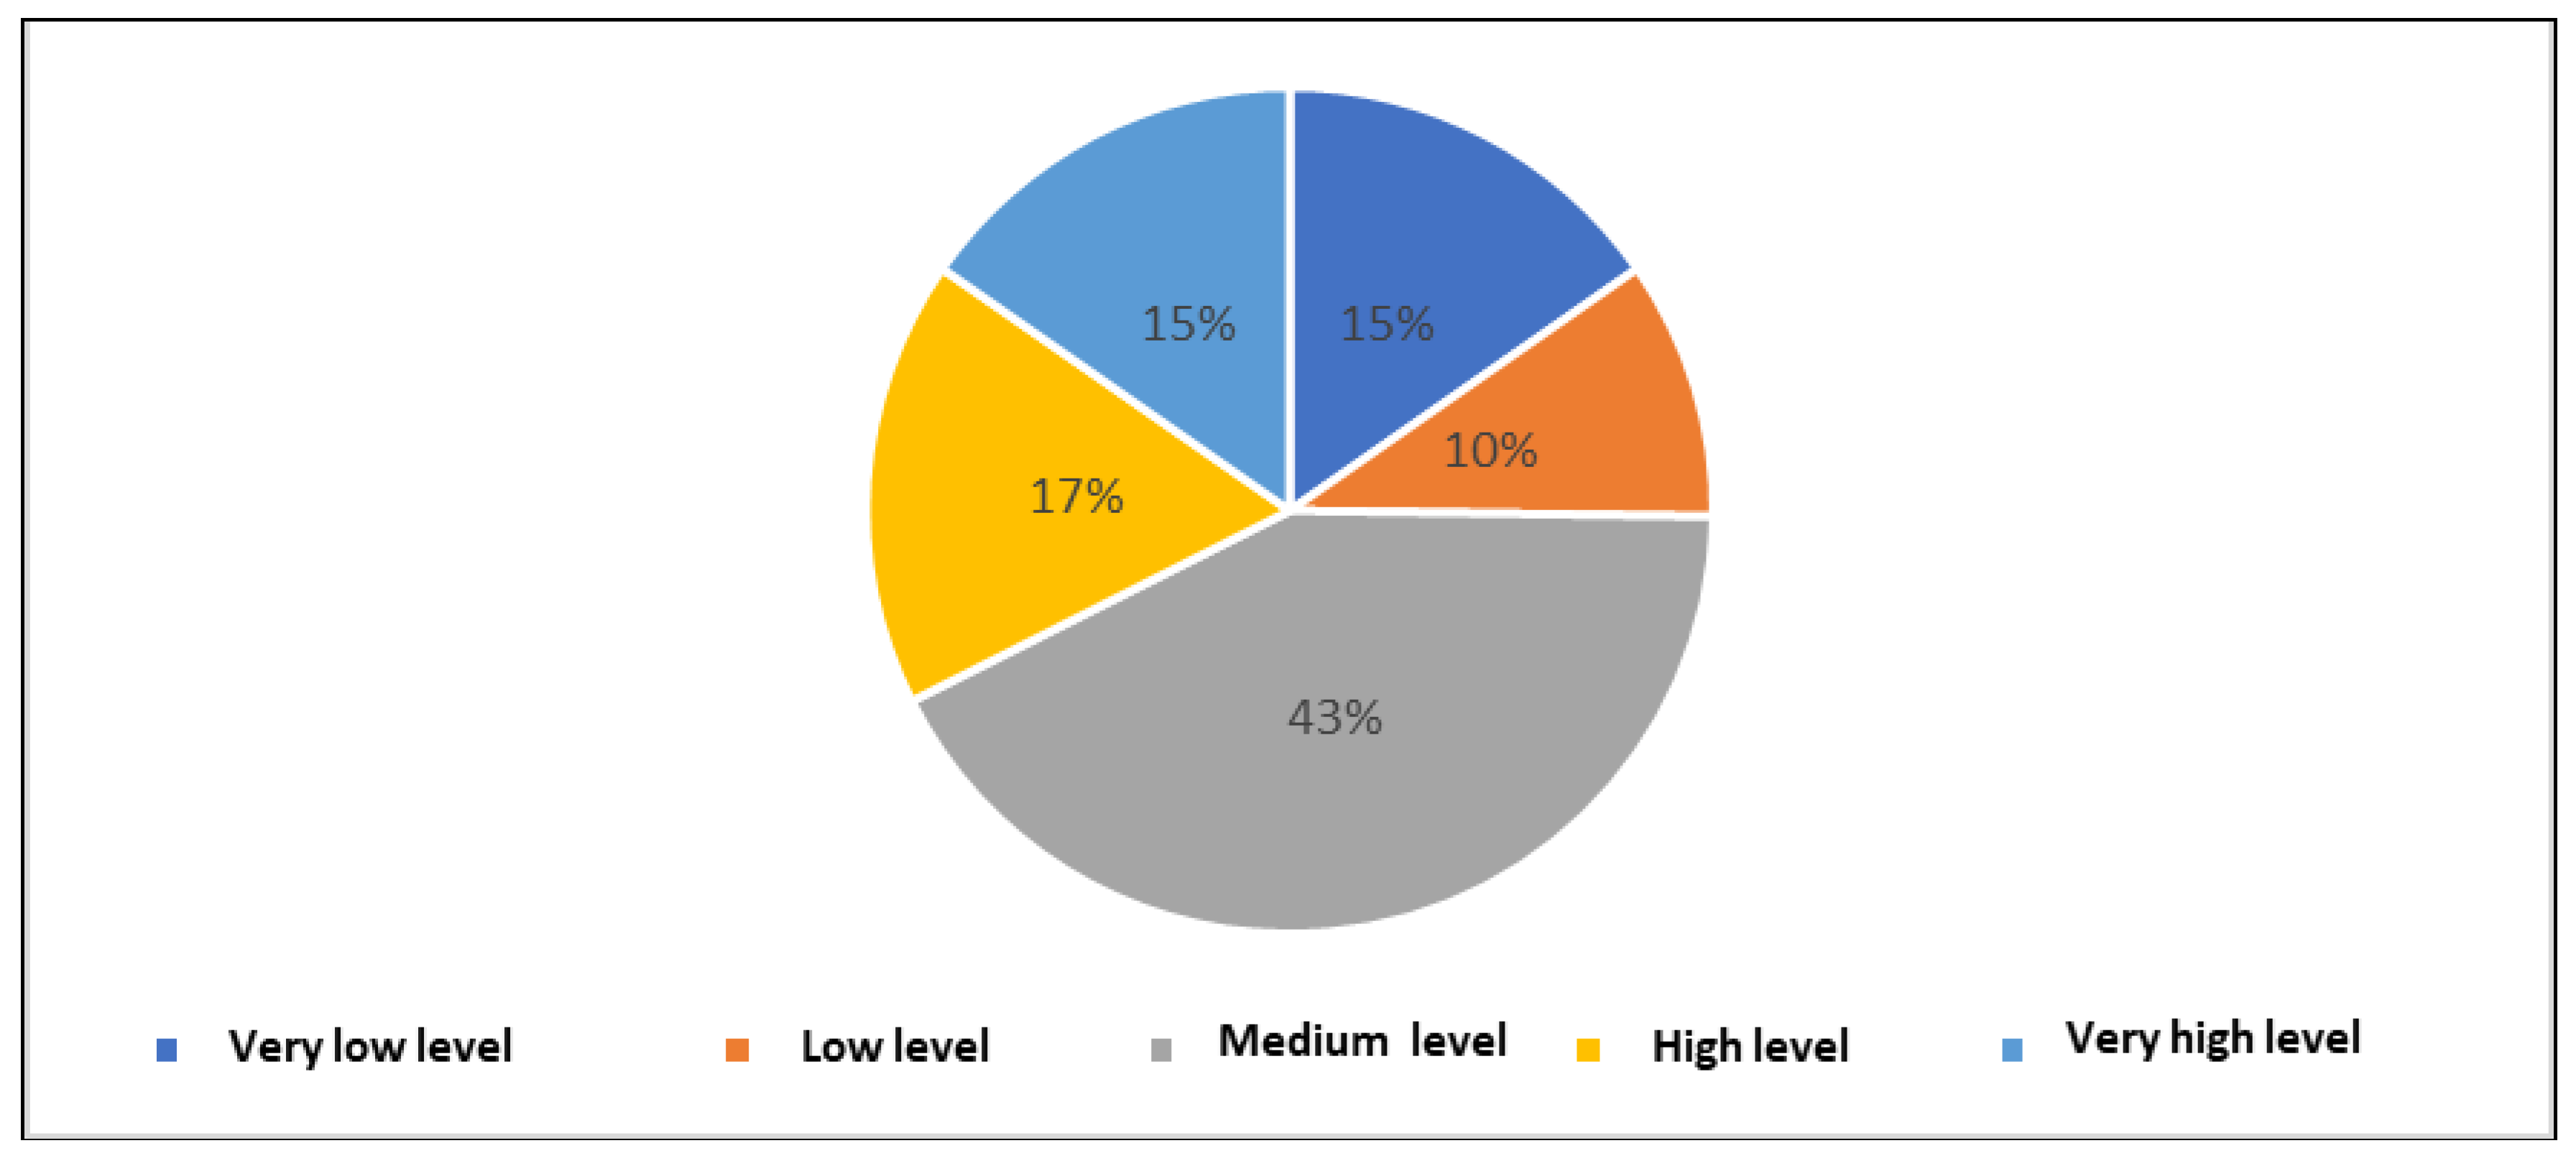
Figure 33 and
Figure 34 show the distribution of the control group according to the self-efficacy level. Among the 104 people who made up the control group, 17 people, representing 15%, had a very low self-efficacy level, 11 people, representing 10%, had a low self-efficacy level, 47 people, representing 43%, had an average self-efficacy level, 19 people, representing 17%, had a high self-efficacy level and 17 people, representing 15%, had a very high self-efficacy level.
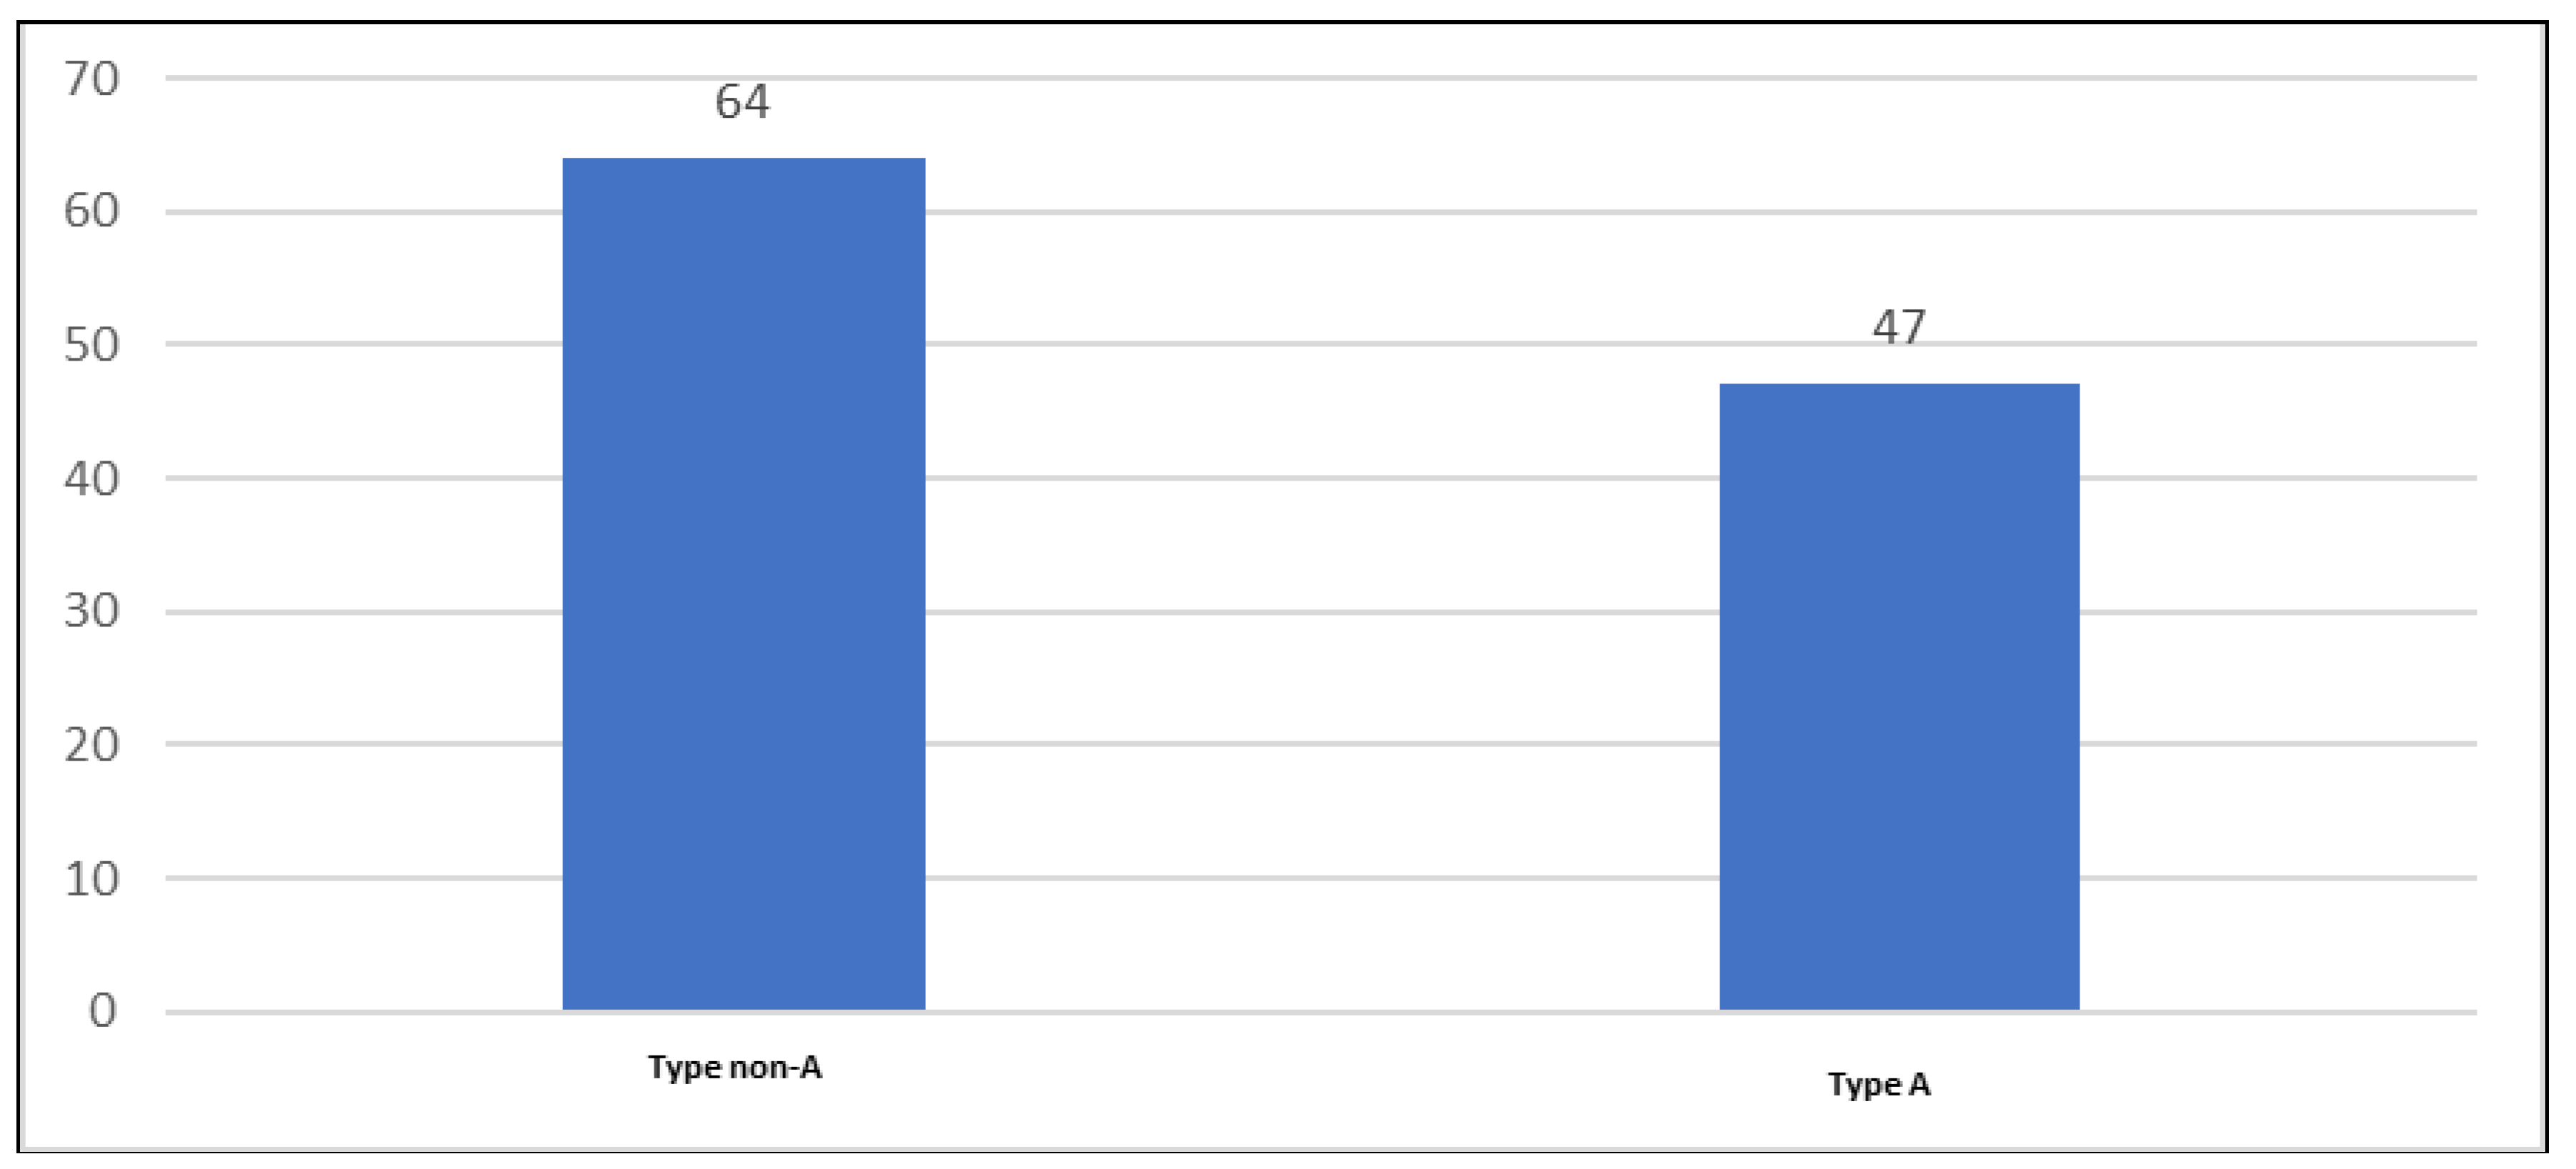
Figure 35 and
Figure 36 show the distribution of the control group according to psychobehavioral type A. 64 people, representing 58%, did not have psychobehavioral type A (they were type non-A), and the remaining 47 people, representing 42%, had psychobehavioral type A.
3.2. Multivariate Analysis Results
Comparison between the scores obtained in the psychometric tests in the patient group and the ones obtained in the control group
Table 1.
Statistical Group - Stress Vulnerability Scale.
Table 1.
Statistical Group - Stress Vulnerability Scale.
| |
VULNERABILITY TO STRESS |
| CODE |
|---|
| 1 |
2 |
| N |
104 |
111 |
| Mean |
31.39 |
26.29 |
| Std. Deviation |
10.085 |
10.490 |
| Std. Error Mean |
.989 |
.996 |
Table 2.
Independent Samples T-test - Stress Vulnerability Scale.
Table 2.
Independent Samples T-test - Stress Vulnerability Scale.
| |
VULNERABILITY TO STRESS |
| Equal variances assumed |
Equal variances not assumed |
| Levene’s Test for Equality of Variances |
F |
.987 |
|
| Sig. |
.322 |
|
| t-test for Equality of Means |
t |
3.634 |
3.639 |
| df |
213 |
212.856 |
| Significance |
One-Sided p |
<.001 |
<.001 |
| Two-Sided p |
.000 |
.000 |
| Mean Difference |
5.106 |
5.106 |
| Std. Error Difference |
1.405 |
1.403 |
| 95% Confidence Interval of the Difference |
Lower |
2.336 |
2.340 |
| Upper |
7.876 |
7.872 |
Given the homogeneity of the variances (Levene=0.322>0.05), the T-test could be applied without further corrections. The difference in means was 5.106, and the 95% confidence interval was from 2.336 to 7.876, which showed that the difference was statistically significant. This result was consistent with the significance of the t-test, whose value was 3.634, which confirmed the statistical difference with a probability of p<0.001 (p<0.05). Thus, the hypothesis that there was a significant difference between hypertensive patients and non-hypertensive individuals in terms of vulnerability to stress was confirmed, with hypertensive patients having an increased vulnerability to stress.
Table 3.
Statistical group - Perceived stress scale.
Table 3.
Statistical group - Perceived stress scale.
| |
PERCEIVED STRESS |
| CODE |
|---|
| 1 |
2 |
| N |
104 |
111 |
| Mean |
19.27 |
16.72 |
| Std. Deviation |
5.973 |
6.440 |
| Std. Error Mean |
.586 |
.611 |
Table 4.
Independent Samples T-test - Perceived stress scale.
Table 4.
Independent Samples T-test - Perceived stress scale.
| |
PERCEIVED STRESS |
| Equal variances assumed |
Equal variances not assumed |
| Levene’s Test for Equality of Variances |
F |
1.575 |
|
| Sig. |
.211 |
|
| t-test for Equality of Means |
t |
3.003 |
3.010 |
| df |
213 |
212.979 |
| Significance |
One-Sided p |
.001 |
.001 |
| Two-Sided p |
.003 |
.003 |
| Mean Difference |
2.549 |
2.549 |
| Std. Error Difference |
.849 |
.847 |
| 95% Confidence Interval of the Difference |
Lower |
.876 |
.880 |
| Upper |
4.221 |
4.217 |
Considering the homogeneity of the variances (Levene=0.211>0.05), the T-test could be applied without further corrections. The difference in means was 2.549, and the 95% confidence interval was from 0.876 to 4.221, which showed that the difference was statistically significant. This result was consistent with the significance of the t-test, whose value was 3.003, which confirmed the statistical difference with a probability of p=0.001 (p<0.05). Thus, the hypothesis that there was a significant difference between hypertensive patients and non-hypertensive individuals regarding the level of perceived stress was confirmed, with hypertensive patients presenting a higher level of perceived stress.
Table 5.
Statistical group - Questionnaire S.T.A.I.-1.
Table 5.
Statistical group - Questionnaire S.T.A.I.-1.
| |
S.T.A.I.1 |
| CODE |
|---|
| 1 |
2 |
| N |
104 |
111 |
| Mean |
43.58 |
39.50 |
| Std. Deviation |
11.951 |
11.076 |
| Std. Error Mean |
1.172 |
1.051 |
Table 6.
Independent Samples T-test - Questionnaire S.T.A.I.-1.
Table 6.
Independent Samples T-test - Questionnaire S.T.A.I.-1.
| |
S.T.A.I.1 |
| Equal variances assumed |
Equal variances not assumed |
| Levene’s Test for Equality of Variances |
F |
.322 |
|
| Sig. |
.571 |
|
| t-test for Equality of Means |
t |
2.593 |
2.587 |
| df |
213 |
208.839 |
| Significance |
One-Sided p |
.005 |
.005 |
| Two-Sided p |
.010 |
.010 |
| Mean Difference |
4.072 |
4.072 |
| Std. Error Difference |
1.570 |
1.574 |
| 95% Confidence Interval of the Difference |
Lower |
.977 |
.969 |
| Upper |
7.168 |
7.176 |
Given the homogeneity of the variances (Levene=0.571>0.05), the T-test could be applied without further corrections. The difference in means was 4.072, and the 95% confidence interval was from 0.977 to 7.168, which showed that the difference was statistically significant. This result was consistent with the significance of the t-test, whose value was 2.593, which confirmed the statistical difference with a probability of p=0.005 (p<0.05). Thus, the hypothesis that there was a significant difference between hypertensive patients and non-hypertensive individuals regarding the anxiety state was confirmed, with hypertensive patients having higher levels of anxiety.
Table 7.
Statistical group - Questionnaire S.T.A.I.-2.
Table 7.
Statistical group - Questionnaire S.T.A.I.-2.
| |
S.T.A.I.2 |
| CODE |
|---|
| 1 |
2 |
| N |
104 |
111 |
| Mean |
44.91 |
40.68 |
| Std. Deviation |
10.742 |
10.161 |
| Std. Error Mean |
1.053 |
.964 |
Table 8.
Independent Samples T-test - Questionnaire S.T.A.I.-2.
Table 8.
Independent Samples T-test - Questionnaire S.T.A.I.-2.
| |
S.T.A.I.2 |
| Equal variances assumed |
Equal variances not assumed |
| Levene’s Test for Equality of Variances |
F |
.552 |
|
| Sig. |
.458 |
|
| t-test for Equality of Means |
t |
2.973 |
2.967 |
| df |
213 |
209.929 |
| Significance |
One-Sided p |
.002 |
.002 |
| Two-Sided p |
.003 |
.003 |
| Mean Difference |
4.238 |
4.238 |
| Std. Error Difference |
1.426 |
1.428 |
| 95% Confidence Interval of the Difference |
Lower |
1.428 |
1.422 |
| Upper |
7.048 |
7.053 |
Considering the homogeneity of the variances (Levene=0.458>0.05), the T-test could be applied without further corrections. The difference in means was 4.238, and the 95% confidence interval was from 1.428 to 7.048, which showed that the difference was statistically significant. This result was consistent with the significance of the t-test, whose value was 2.973, which confirmed the statistical difference with a probability of p=0.002 (p<0.05). Thus, the hypothesis that there was a significant difference between hypertensive patients and non-hypertensive individuals regarding the anxiety state was confirmed, with hypertensive patients having higher levels of anxiety.
Table 9.
Statistical Group - SES Scale for Assessing Self-Efficacy.
Table 9.
Statistical Group - SES Scale for Assessing Self-Efficacy.
| |
SELF-EFFICACY |
| CODE |
|---|
| 1 |
2 |
| N |
104 |
111 |
| Mean |
30.16 |
31.67 |
| Std. Deviation |
4.982 |
4.946 |
| Std. Error Mean |
.488 |
.469 |
Table 10.
Independent Samples T-test - SES Scale for Assessing Self-Efficacy.
Table 10.
Independent Samples T-test - SES Scale for Assessing Self-Efficacy.
| |
SELF-EFFICACY |
| Equal variances assumed |
Equal variances not assumed |
| Levene’s Test for Equality of Variances |
F |
.668 |
|
| Sig. |
.415 |
|
| t-test for Equality of Means |
t |
-2.219 |
-2.219 |
| df |
213 |
211.880 |
| Significance |
One-Sided p |
.014 |
.014 |
| Two-Sided p |
.028 |
.028 |
| Mean Difference |
-1.503 |
-1.503 |
| Std. Error Difference |
.677 |
.677 |
| 95% Confidence Interval of the Difference |
Lower |
-2.838 |
-2.839 |
| Upper |
-.168 |
-.168 |
Considering the homogeneity of the variances (Levene=0.415>0.05), the T-test could be applied without further corrections. The difference in means was -1.503, and the 95% confidence interval was from -2.838 to -0.168, which showed that the difference was statistically significant. This result was consistent with the significance of the t-test, whose value was -2.219, which confirmed the statistical difference with a probability of p=0.014 (p<0.05). Thus, the hypothesis that there was a significant difference between hypertensive and non-hypertensive individuals in terms of self-efficacy was confirmed, with hypertensive patients showing lower levels of self-efficacy.
Table 11.
Comparison between the scores obtained in the psychometric tests in the patient group and the ones obtained in the control group.
Table 11.
Comparison between the scores obtained in the psychometric tests in the patient group and the ones obtained in the control group.
| Psychometric tests |
Average |
Deviation |
Confidence interval 95% |
t |
df |
p |
| Hypertensives lot |
Control lot |
Hypertensives lot |
Control lot |
Minimum |
Maximum |
|
|
|
| Stress vulnerability scale |
31.39 |
26.29 |
10.085 |
10.490 |
2.336 |
7.876 |
3.634 |
213 |
<0.001 |
S.T.A.I.-1
Questionnaire |
43.58 |
39.50 |
11.951 |
11.076 |
0.977 |
7.168 |
2.593 |
213 |
0.005 |
| S.T.A.I.-2 Questionnaire |
44.91 |
40.68 |
10.742 |
10.161 |
1.428 |
7.048 |
2.973 |
213 |
0.002 |
| SES scale |
30.16 |
31.67 |
4.982 |
4.946 |
-2.838 |
-0.168 |
-2.219 |
213 |
0.014 |
Table 12.
Study group - Psychobehavioral type A.
Table 12.
Study group - Psychobehavioral type A.
| |
PSYCHOBEHAVIORAL TYPES |
Total |
| Type A |
Type non-A |
|
| STUDYGROUP |
HYPERTENSIVE |
Count |
51 |
53 |
104 |
| Expected Count |
47.4 |
56.6 |
104.0 |
| % within STUDY GROUP |
49.0% |
51.0% |
100.0% |
| % within PSYCHOBEHAVIORAL TYPE |
52.0% |
45.3% |
48.4% |
| % of Total |
23.7% |
24.7% |
48.4% |
| CONTROL GROUP |
Count |
47 |
64 |
111 |
| Expected Count |
50.6 |
60.4 |
111.0 |
| % within STUDY GROUP |
42.3% |
57.7% |
100.0% |
| % within PSYCHOBEHAVIORAL TYPE |
48.0% |
54.7% |
51.6% |
| % of Total |
21.9% |
29.8% |
51.6% |
| Total |
Count |
98 |
117 |
215 |
| Expected Count |
98.0 |
117.0 |
215.0 |
| % within STUDY GROUP |
45.6% |
54.4% |
100.0% |
| % within PSYCHOBEHAVIORAL TYPE |
100.0% |
100.0% |
100.0% |
| % of Total |
45.6% |
54.4% |
100.0% |
Table 13.
Chi-Square Test – Psychobehavioral Type A.
Table 13.
Chi-Square Test – Psychobehavioral Type A.
| |
Value |
df |
Asymptotic Significance (2-sided) |
Exact Sig. (2-sided) |
Exact Sig. (1-sided) |
| Pearson Chi-Square |
.971a
|
1 |
.325 |
|
|
| Continuity Correctionb
|
.719 |
1 |
.396 |
|
|
| Likelihood Ratio |
.971 |
1 |
.324 |
|
|
| Fisher’s Exact Test |
|
|
|
.341 |
.198 |
| N of Valid Cases |
215 |
|
|
|
|
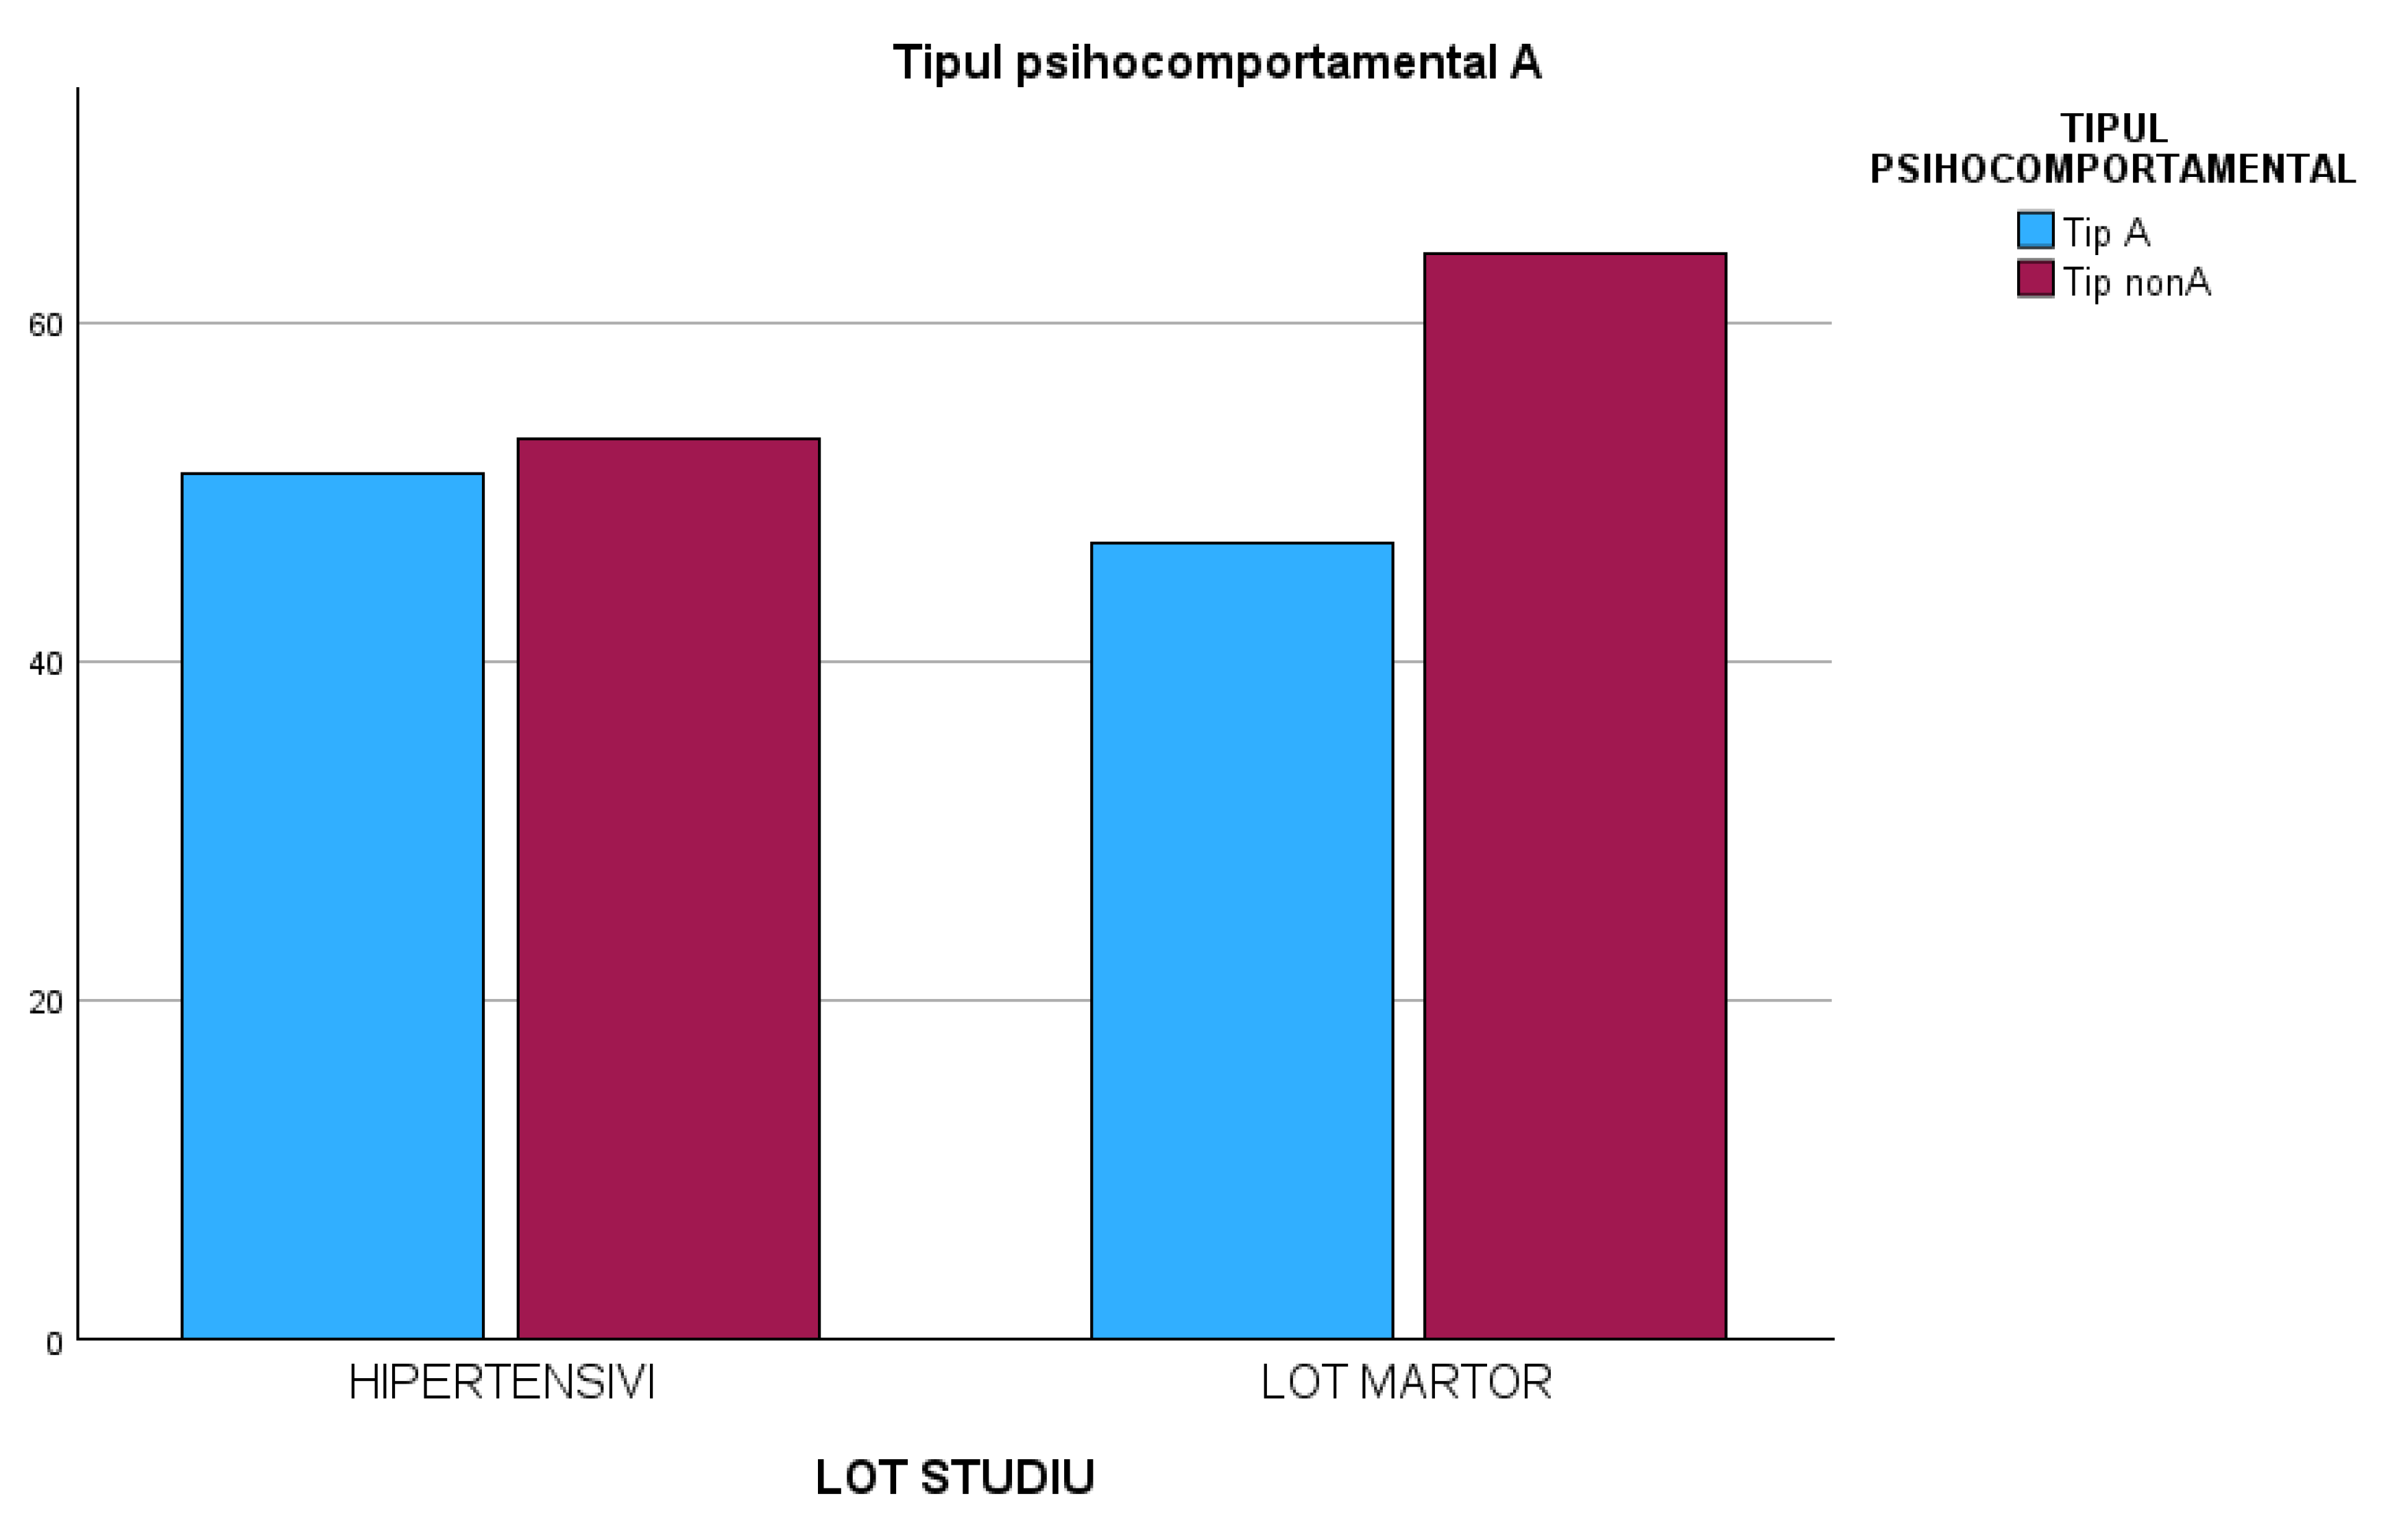
The group of hypertensive patients consisted of 51 people with type A and 53 people with type non-A.
The control group consisted of 47 individuals with type A and 64 individuals with type non-A.
Considering that neither in the group of hypertensive patients nor in the control group were there people < 5 and the study group consisted of 215 people, the p-value of the Person Chi-Square was used for statistical interpretation from the Chi-Square test, respectively p=0.325>0.05, which refuted the hypothesis that there was a significant difference between hypertensive patients and non-hypertensive individuals regarding psychobehavioral type A.
Figure 37.
Comparison between the group of hypertensive patients and the control group according to psychobehavioral type A.
Figure 37.
Comparison between the group of hypertensive patients and the control group according to psychobehavioral type A.
4. Discussion
Our study included 215 people, 104 hypertensive and 111 non-hypertensives, and revealed that 83% of the hypertensive patients worked in environments with mental and physical stress and factors that generate negative emotions. Medium and high vulnerability to stress was present in 63% of them (the level of perceived stress was high in 11% and moderate in 79% of hypertensive patients). Regarding disimmunogenic personality traits, state anxiety was identified in 48% of them (4% - very high level, 11% - high level, and 33% - medium level) and trait anxiety was observed in 53% of the hypertensives (2% - very high level, 13% - high level, and 38% - medium level). We also tested the self-efficacy level, as a strong immunogenic trait, and our findings indicated a very low and low level of self-efficacy in 35% of the hypertensives and an average level of self-efficacy in 41% of them. Regarding the psychobehavioral type A, a behavior pattern exposing to cardiovascular diseases, 45% of the hypertensive patients were type A.
These findings in our study suggest the involvement of psycho-emotional factors in the determination of high blood pressure. An explanation of this could be related to the consequences of the stress experienced by the population in the last 3 years when the exposure to negative emotions included the fear of illness in a pandemic, social isolation, family trauma, fear of war, economic instability, financial losses, uncertainty job retention, professional overwork, and many others.
The study also showed that 79% of hypertensive patients currently have a moderate level of perceived stress, which creates favorable conditions for this group to record an increase in the level of stress perception in the following period, in the case in future they will be subjected to other stressful stimuli. Combined with the high rate of vulnerability to stress, 63%, this represents a solid argument that should raise awareness.
Regarding the psychobehavioral type A, although the percentage of hypertensive patients was 49%, and the non-A was 51%, the values could have been more relevant, if the group of patients had been larger.
5. Conclusions
By applying standardized psychometric questionnaires for 215 patients, 104 hypertensive and 111 non-hypertensives, our study followed the measurement of the level of vulnerability to stress (Stress Vulnerability Scale), perceived stress (Perceived Stress Scale), anxiety (STAI-1, STAI-2), self-efficacy (SES Scale) and psychobehavioral type A (Jenkins Questionnaire). The results highlighted statistically significant differences, as follows:
for vulnerability to stress, the difference in means was 5.106, and the 95% confidence interval was from 2.336 to 7.876, which showed that the difference was statistically significant. This result was consistent with the significance of the t-test, whose value was 3.634, which confirmed the statistical difference with a probability of p<0.001 (p<0.05).
for the level of perceived stress, the difference in means was 2.549, and the 95% confidence interval was from 0.876 to 4.221, which showed that the difference was statistically significant. This result was consistent with the significance of the t-test, whose value was 3.003, which confirmed the statistical difference with a probability of p=0.001 (p<0.05).
for the anxiety state, the difference in means was 4.072, and the 95% confidence interval was from 0.977 to 7.168, which showed that the difference was statistically significant. This result was consistent with the significance of the t-test, whose value was 2.593, which confirmed the statistical difference with a probability of p=0.005 (p<0.05).
for the anxiety trait, the difference in means was 4.238, and the 95% confidence interval was from 1.428 to 7.048, which showed that the difference was statistically significant. This result was consistent with the significance of the t-test, whose value was 2.973, which confirmed the statistical difference with a probability of p=0.002 (p<0.05).
for self-efficacy, the difference in means was -1.503, and the 95% confidence interval was from -2.838 to -0.168, which showed that the difference was statistically significant. This result was consistent with the significance of the t-test, whose value was -2.219, which confirmed the statistical difference with a probability of p=0.014 (p<0.05).
Regarding the psychobehavioral type A, the Chi-Square test p-value from Person Chi-Square, respectively p=0.325>0.05, refuted the hypothesis that there was a significant difference between patients with hypertension and the ones without hypertension.
In conclusion, the results obtained can have various implications, which target the patient, the doctor, and the health system. For example, patients identified by the family doctor as being vulnerable to stress would require a specialized assessment by the psychologist, followed by interventions such as psychological counseling, cognitive-behavior therapy, and learning coping strategies to manage stress and improve immunogenic personality traits. In addition, continuing medical education programs should also include training courses for doctors in the field of clinical psychology.
At the same time, measures aimed at expanding psychological assessment methods are needed, by establishing regulations at the level of health policies, which should also include mental health on the list of population screenings, if we want to prevent the increase in the incidence of psychosomatic diseases in the future.
All these would be useful for decreasing the contribution of psychological causes of illness, decreasing the number of visits to the doctor, the symptoms of chronic diseases, the number of hypertensive crises (and not only), the recurrences of diseases paced by stress and negative emotions, the incidence of mental diseases, reducing the doses of drugs used for the underlying disease and last, but not least, improving therapeutic compliance, improving the quality of life and interpersonal relationships.
A limitation of the study might have come from the relatively small number of patients included in the research. Our future research is directed towards expanding the study of the involvement of psycho-emotional factors in other diseases, such as diabetes and other autoimmune pathologies.
Author Contributions
Conceptualization and methodology, L.B.; software, validation, and formal analysis, C.B.; investigation, C.B.; resources, L.B., C.B., data curation, L.B.; writing - original draft preparation, L.B.; writing - review and editing, L.B.; visualization, all the authors; supervision and project administration, L.B. All authors have read and agreed to the published version of the manuscript.
Funding
The authors received no financial support for the research, authorship, and/or publication of this article.
Institutional Review Board Statement
This study was conducted according to the guidelines of the Declaration of Helsinki and did not require approval from the Institutional Review Board (or Ethics Committee).
Informed Consent Statement
All procedures performed in the study involving human participants were by the ethical standards of the institutional and/or national research committee and with the 1964 Helsinki Declaration and its later amendments or comparable ethical standards.
Data Availability Statement
The datasets generated and/or analyzed during the current study are available from the corresponding author upon reasonable request.
Acknowledgments
We thank all participants who voluntarily contributed to this study. We also thank all the members of “Carol Davila” University of Medicine and Pharmacy, Bucharest, Romania for their support in this study.
Conflicts of Interest
The authors declare no conflict of interest.
References
- Mills, K.T.; Bundy, J.D.; Kelly, T.N.; Reed, J.E.; Kearney, P.M.; Reynolds, K.; et al. Global disparities of hypertension prevalence and control. Circulation. 2016, 134:441-50. [CrossRef]
- Lim, S.S.; Vos, T.; Flaxman, A.D.; Danaei, G.; Shibuya, K.; Adair-Rohani, H.; et al. A comparative risk assessment of burden of disease and injury attributable to 67 risk factors and risk factor clusters in 21 regions, 1990-2010: a systematic analysis for the Global Burden of Disease Study 2010. Lancet. 2010, 380:2224-60. [CrossRef]
- Bacon, S.L.; Campbell, T.S.; André, A.; Lavoie, K.L. The impact of mood and anxiety disorders on incident hypertension at one year. Int J Hypertens. 2014, 2014(953094):7. [CrossRef]
- https://www.nimh.nih.gov/health/statistics/any-anxiety-disorder.shtml. (accessed May 31, 2019).
- Bandelow, B.; Michaelis, S. Epidemiology of anxiety disorders in the 21st century. Dialogues Clin Neurosci. 2015, 17:3. [CrossRef]
- https://www.who.int/news-room/fact-sheets/detail/hypertension. (accessed May 31, 2019).
- Revised draft: Global action plan for the prevention and control of noncommunicable diseases: 2013-2020. World Health Organization. Geneva. 2008 [Version updated 2013 February 11; accessed on 21/02/2018]; Available from: http://www.who.int/nmh/events/2013/revised_draft_ncd_ action_plan.pdf.
- Dorobantu, M.; Vijiiac, A.E.; Fronea, O.F.G. The SEPHAR-FUp 2020 Project (Study for the Evaluation of Prevalence of Hypertension and Cardiovascular Risk in Romania – Follow-up 2020). 2020.
- Mcewen, B. Physiology and Neurobiology of Stress and Adaptation: Central Role of the Brain. Physiological Reviews. 87(3):873-904. [CrossRef]
- Andrew, S. Psychophysiological Stress Reactivity and Hypertension. Hypertension. 2008, 52:220-21. [CrossRef]
- Bhelkar, S.; Deshpande, S.; Mankar, S.; Hiwarkar, P. Association between Stress and Hypertension among Adults More Than 30 Years: A Case-Control Study - ORIGINAL ARTICLE. pISSN 0976 3325│eISSN 2229 6816 Open Access Article www.njcmindia.org-2018.
- Kulkarni, S.; O’Farrell, I.; Erasi, M.; Kochar, M.S. Stress and hypertension. WMJ: Official Publication of the State Medical Society of Wisconsin. 1998, 97(11):34-38. http://europepmc.org/abstract/med/9894438.
- O’Donovan, A.; Slavich, G.M.; Epel, E.S.; Neylan, T.C. Exaggerated neurobiological sensitivity to threat as a mechanism linking anxiety with increased risk for diseases of aging. Neurosci Biobehav Rev. 2013, 37:96-108. [CrossRef]
- Rozanski, A.; Blumenthal, J.A.; Kaplan, J. Impact of psychological factors on the pathogenesis of cardiovascular disease and implications for therapy. Circulation. 1999, PMID: 10217662. [CrossRef]
- Iamandescu, I.B. Stresul psihic şi Bolile Interne, vol. I; Editura ALL, 1993.
- Markovitz, J.H.; Matthews, K.A.; Kannel, W.B.; Cobb, J.L.; D’Agostino, R.B. Psychological predictors of hypertension in the Framingham Study. Is there tension in hypertension? JAMA. 1993 Nov 24, 270(20):2439-43. [CrossRef]
- Titov, V.N.; Elchaninova, S.A.; et al. Biological function stress, innate immunity, inflammatory response and arterial hypertension. Clinical laboratory diagnostics. 2008, 12:3-15.
- Din-Dzietham, R.; Nembhard, W.N.; Collins, R.; Davis, S.K. Perceived stress following race-based discrimination at work is associated with hypertension in African-Americans. The metro Atlanta heart disease study, 1999-2001. 2004, 58(3):449-461. [CrossRef]
- Roohafza, H.; Sattari, N.; Nouri, F.; Talaei, M. Do any kinds of perceived stressors lead to hypertension? A longitudinal cohort study. Hypertension Research. 2022, 45:1058-1066. [CrossRef]
- Iamadescu, I.B. Manual de psihologie medicală, Editura Infomedica, București, 2010.
- Iamadescu, I.B. Psihologie medicală, Vol. 1: Psihologia Sănătății, Editura Infomedica, București, 2005.
- Player, M.S.; Peterson, L.E. Anxiety disorders, hypertension, and cardiovascular risk: a review. Int J Psychiatry Med. 2011, 41(4):365-77. [CrossRef]
- Januzzi, J.L.; Stern, T.A.; Pasternak, R.C.; DeSanctis, R.W. The influence of anxiety and depression on outcomes of patients with coronary artery disease. Arch Intern Med. 2000, 160(13):1913-21. [CrossRef]
- Johnson, H.M. Anxiety and hypertension: is there a link? A literature review of the comorbidity relationship between anxiety and hypertension. Current hypertension reports. 2019, Springer. [CrossRef]
- Cano Vindel, A. Stresul și anxietatea. Cum vindecăm tulburările emoționale, Editura Litera, București, 2022.
- Player, M.S.; Peterson, L.E. Anxiety disorders, hypertension, and cardiovascular risk: a review. Int J Psychiatry Med. 2011, 41(4):365-77. [CrossRef]
- Cheung, B.M.; Au, T.; Chan, S.; Lam, C.; Lau, S.; Lee, R.; et al. The relationship between hypertension and anxiety or depression in Hong Kong Chinese. Exp Clin Cardiol. 2005, 10:21-4.
- Johannessen, L.; Strudsholm, U.; Foldager, L.; Munk-Jørgenson, P. Increased risk of hypertension in patients with bipolar disorder and patients with anxiety compared to background population and patients with schizophrenia. J Affect Disord. 2006, 95(1-3):13-7. [CrossRef]
- Carroll, D.; Phillips, A.C.; Gale, C.R.; Batty, G.D. Generalized anxiety and major depressive disorders, their comorbidity and hypertension in middle-aged men. Psychosom Med. 2010, 72(1):16-9. [CrossRef]
- Hildrum, B.; Mykletun, A.; Holmen, J.; Dahl, A. Effect of anxiety and depression on blood pressure: 11-year longitudinal population study. Br J Psychiatry. 2008, 193(2):108-13. [CrossRef]
- Wu, E.L.; Chien, I.C.; Lin, C.H. Increased risk of hypertension in patients with anxiety disorders: a population-based study. J Psychosom Res. 2014, 77:522-7. [CrossRef]
- Scott, K.M.; Bruffaerts, R.; Tsang, A.; Ormel, J.; Alonso, J.; Angermeyer, M.C.; et al. Depression-anxiety relationships with chronic physical conditions: results from the World Mental Health surveys. J Affect Disord. 2007, 103(1-3):113-20. [CrossRef]
- Niles, A.N.; Dour, H.J.; Stanton, A.L.; Roy-Byrne, P.P.; Stein, M.B.; Sullivan, G.; et al. Anxiety and depressive symptoms and medical illness among adults with anxiety disorders. J Psychosom Res. 2015, 78(2):109-15. [CrossRef]
- Seldenrijk, A.; Vogelzangs, N.; Batelaan, N.M.; Wieman, I.; et al. Depression, anxiety and 6-year risk of cardiovascular disease. J Psychosom Res. 2015, 78(2):123-9. [CrossRef]
- Iamadescu I.B.; Sinescu, C.J. Psihocardiologie, Editura ALL, București, 2015.
- O’Donovan, A.; Slavich, G.M.; Epel, E.S.; Neylan, T.C. Exaggerated neurobiological sensitivity to threat as a mechanism linking anxiety with increased risk for diseases of aging. Neurosci Biobehav Rev. 2013, 37:96-108. [CrossRef]
- Davies, S.J.; Jackson, P.R.; Potokar, J.; Nutt, D.J. Treatment of anxiety and depressive disorders in patients with cardiovascular disease. BMJ. 2004, 328:939-943. [CrossRef]
- Goleman, D. Inteligența emoțională, Ed. a 3-a; Editura Curtea Veche, București, 2008.
- Popa-Velea, O.; Diaconescu, L.; Mihăilescu, A. Psihologie medicală, Ed. a 2-a, rev.; Editura Universitară “Carol Davila”, București, 2017.
- Asnaniar, W.O.S.; Tuanany, R. Self-Efficacy In Patients With Hypertension. Jurnal Aisyah. 2021, aisyah.journalpress.id. [CrossRef]
- Savadkooh, O.K. Effect of self-management program on self-efficacy in hypertensive patients. J Mazandaran Univ Med Sci. 2012, 22(92):19-28.
Figure 1.
Distribution of patients according to gender.
Figure 1.
Distribution of patients according to gender.
Figure 2.
Percentage distribution of patients with hypertension according to gender.
Figure 2.
Percentage distribution of patients with hypertension according to gender.
Figure 3.
Distribution of hypertensive patients according to age.
Figure 3.
Distribution of hypertensive patients according to age.
Figure 4.
Percentage distribution of hypertensive patients according to age.
Figure 4.
Percentage distribution of hypertensive patients according to age.
Figure 5.
The medium of origin of the patients.
Figure 5.
The medium of origin of the patients.
Figure 6.
Percentage distribution of patients with hypertension according to working conditions.
Figure 6.
Percentage distribution of patients with hypertension according to working conditions.
Figure 7.
Distribution of hypertensive patients according to vulnerability to stress.
Figure 7.
Distribution of hypertensive patients according to vulnerability to stress.
Figure 8.
Percentage distribution of patients with hypertension according to vulnerability to stress.
Figure 8.
Percentage distribution of patients with hypertension according to vulnerability to stress.
Figure 9.
Distribution of hypertensive patients according to the level of perceived stress.
Figure 9.
Distribution of hypertensive patients according to the level of perceived stress.
Figure 10.
Percentage distribution of hypertensive patients according to the perceived stress level.
Figure 10.
Percentage distribution of hypertensive patients according to the perceived stress level.
Figure 11.
Distribution of hypertensive patients according to anxiety state level.
Figure 11.
Distribution of hypertensive patients according to anxiety state level.
Figure 12.
Percentage distribution of hypertensive patients according to anxiety state level.
Figure 12.
Percentage distribution of hypertensive patients according to anxiety state level.
Figure 13.
Distribution of hypertensive patients according to anxiety trait level.
Figure 13.
Distribution of hypertensive patients according to anxiety trait level.
Figure 14.
Percentage distribution of hypertensive patients according to anxiety trait level.
Figure 14.
Percentage distribution of hypertensive patients according to anxiety trait level.
Figure 15.
Distribution of patients with hypertension according to the self-efficacy level.
Figure 15.
Distribution of patients with hypertension according to the self-efficacy level.
Figure 16.
Percentage distribution of patients with hypertension according to the self-efficacy level.
Figure 16.
Percentage distribution of patients with hypertension according to the self-efficacy level.
Figure 17.
Distribution of hypertensive patients according to psychobehavioral type A.
Figure 17.
Distribution of hypertensive patients according to psychobehavioral type A.
Figure 18.
Percentage distribution of hypertensive patients according to psychobehavioral type A.
Figure 18.
Percentage distribution of hypertensive patients according to psychobehavioral type A.
Figure 19.
Distribution of the control group according to gender.
Figure 19.
Distribution of the control group according to gender.
Figure 20.
Percentage distribution of the control group according to gender.
Figure 20.
Percentage distribution of the control group according to gender.
Figure 21.
Distribution of the control group according to age.
Figure 21.
Distribution of the control group according to age.
Figure 22.
Percentage distribution of the control group according to age.
Figure 22.
Percentage distribution of the control group according to age.
Figure 23.
The medium of origin of the control lot.
Figure 23.
The medium of origin of the control lot.
Figure 24.
Percentage distribution of the control group according to working conditions.
Figure 24.
Percentage distribution of the control group according to working conditions.
Figure 25.
Distribution of the control group according to vulnerability to stress.
Figure 25.
Distribution of the control group according to vulnerability to stress.
Figure 26.
Percentage distribution of the control group according to stress vulnerability.
Figure 26.
Percentage distribution of the control group according to stress vulnerability.
Figure 27.
Distribution of the control group according to the perceived stress level.
Figure 27.
Distribution of the control group according to the perceived stress level.
Figure 28.
Percentage distribution of the control group according to the perceived stress level.
Figure 28.
Percentage distribution of the control group according to the perceived stress level.
Figure 29.
Distribution of the control group according to the anxiety state level.
Figure 29.
Distribution of the control group according to the anxiety state level.
Figure 30.
Percentage distribution of the control group according to the anxiety state level.
Figure 30.
Percentage distribution of the control group according to the anxiety state level.
Figure 31.
Distribution of the control group according to anxiety trait level.
Figure 31.
Distribution of the control group according to anxiety trait level.
Figure 32.
Percentage distribution of the control group according to anxiety trait level.
Figure 32.
Percentage distribution of the control group according to anxiety trait level.
Figure 33.
Distribution of the control group according to self-efficacy level.
Figure 33.
Distribution of the control group according to self-efficacy level.
Figure 34.
Percentage distribution of the control group according to the self-efficacy level.
Figure 34.
Percentage distribution of the control group according to the self-efficacy level.
Figure 35.
Distribution of the control group according to psychobehavioral type A.
Figure 35.
Distribution of the control group according to psychobehavioral type A.
Figure 36.
Percentage distribution of the control group according to the psychobehavioral type A.
Figure 36.
Percentage distribution of the control group according to the psychobehavioral type A.
|
Disclaimer/Publisher’s Note: The statements, opinions and data contained in all publications are solely those of the individual author(s) and contributor(s) and not of MDPI and/or the editor(s). MDPI and/or the editor(s) disclaim responsibility for any injury to people or property resulting from any ideas, methods, instructions or products referred to in the content. |
© 2023 by the authors. Licensee MDPI, Basel, Switzerland. This article is an open access article distributed under the terms and conditions of the Creative Commons Attribution (CC BY) license (http://creativecommons.org/licenses/by/4.0/).
