Preprint
Article

Optimal Planning of Urban Building-type Integrated Energy Systems Considering Indoor Somatosensory Comfort and PV Consumption

This version is not peer-reviewed.

Submitted:

09 November 2023

Posted:

09 November 2023

You are already at the latest version

A peer-reviewed article of this preprint also exists.

Abstract
Building energy consumption is the main urban energy consumption component, which mainly serves people-centered work and living energy demands. Based on the physical requirements of humans in urban buildings and to determine the comfortable body temperature in each season, this paper establishes a sizing optimization model of building-type integrated energy systems (IES), where the cooling and heating loads required to maintain indoor somatosensory body comfortable temperature are calculated. Depending on the external energy price, internal power balance and other constraints, the model develops an optimal sizing and capacity panning method of energy conversion and storage unit in a building-type IES with PV generation. The operating principle is described as follows: the PV generation is fully consumed, a gas engine satisfies the electric and thermal base load requirements, while the power system and a heat pump supply the remaining loads. The gas price, peak-valley electricity price gap and heat-topower ratio of gas engines are considered as important factors for the overall techno-economic analysis. The developed method is applied to optimize the economic performance of building-type IES and verified by practical examples. The results show that using the complementary characteristics of different energy conversion units is important to the overall IES cost.
Keywords: 
Subject: 
Engineering  -   Energy and Fuel Technology

0. Introduction

Due to the energy crisis caused by the excessive use of fossil energy in recent years and the green, low-carbon lifestyle demand for clean energy, the highly efficient integrated energy systems (IES), with extensive coupling and complementary of electricity, heat, gas, cold and other energy sources have gradually become the focus of academic and engineering research [1,2,3]. The IES is a smart grid with a multisource input-output port model that is composed of energy conversion and storage units [4]. An IES equipped with multi-energy sources is expected to promote substantial economic benefits in terms of optimal planning and operation. The coupling relationship between these units is described by the coupling matrix to obtain the optimal configuration and economic operation of multi-energy sources [5].
Currently, many experts and scholars have conducted a substantial amount of research on heat, gas, cold and storage within integrated-energy planning issues [6,7]. For IES planning, the key point is to decide which energy conversion or storage unit is necessary and how to calculate its capacity [8,9]. The main goal is economy when a multi-integrated energy system is designed [10], and 0-1 mixed-integer linear programming models with actual case studies are useful for the optimization and capacity planning of each unit [11,12]. As the most important unit, combined cooling, heating and power production (CCHP) should be addressed in multistage and multi-scenario analyses of the coupled electricity, cooling and thermal IES to determine the capacity and location of electricity distribution grids and thermal pipeline networks [13,14]. In addition to economy, a multi-objective planning method that considers the reliability, carbon emissions, and energy efficiency indicators of IES with a variety of planning models has been developed [15,16]. Different algorithms, such as improved Kriging or Reinforcement learning (RL) combined with chaotic sampling algorithms, are adopted for the capacity planning problem solution in IESs [17,18].
However, theoretical research on the characteristics and temperature adjustment needs of indoor activity-dominated business centers, residential areas and office buildings is relatively rare [19]. In cities, urban buildings represent the highest energy consumption and are suitable for photovoltaic (PV) energy generation or other distributed energy [20,21,22], demand side response and energy storage solutions [23,24]. However, research on real-time demand modeling of cold and thermal power based on the indoor temperature intervals for human body comfort is lacking [25,26]. In the new mode of urban building energy services, energy service providers are responsible for installation, operation, maintenance, fuel cost and other affairs. These providers invest in building energy units, provide electricity, thermal and cold supply services, and gain profit by planning and operation optimization [27,28]. Thus, the planning of a IES may be exposed to substantial economic risks, particularly in realistic conditions characterized by significant uncertainties in energy prices and demand [29,30]. The building-type IES planning and sizing method, which considers thermal and cold power to adjust the temperature comfort of users, together with PV generation and cost evaluation, is important for energy service providers and customers.
Under this framework, this paper presents a building-type IES planning optimization methodology that is subject to indoor somatosensory comfort and PV generation. The required cold and thermal regulation power is obtained by the temperature adjustment evaluation index, which is referred to as the predicted mean vote (PMV). The optimal sizing and capacity planning 0-1 state variables of building-type IES are established to determine the type, capacity and operation of various units in the optimization model. The most economical building-type IES with the lowest cost is the optimal objective to solve global configuration optimization. Complementarity of grid-purchased electric power and distributed generation, gas-fired thermal power production and heat pump heating are suitable for cost reduction. The proposed approach provides an investment risk hedging strategy and avoids investment lock-out in a buildingtype IES.
The rest of this paper is structured as follows: Section 1 presents the PMV model considered for this paper, which represents a general building-type IES for indoor somatosensory comfort regulation. A novel generalized approach to obtain thermal power is also presented. The planning and sizing methodology that facilitates an economic investment in the IES is described in Section 2. The key attributes of the approach are demonstrated with a realistic case study in Section 3 A sensitivity analysis of the important factors is carried out in Section 4. The conclusions of this paper are summarized in Section 5.

1. Building-Type IES and PMV Index

1.1. IES Model

The IES can be defined as a multi-energy input-output port, which is a system model that satisfies the requirements of different loads for various energy sources, such as electricity, heat, gas, and cold, and interactively couples various energy networks. The system network topology, which is shown in Figure 1, consists of three parts, namely, input, output and energy network. Among these parts, the input terminal includes the input of different forms of energy, such s the grid power purchase and solar PV energy, natural gas; the output terminal includes the output of user heating and cooling loads, power sales to the grid and power load; and the energy network includes different energy conversion, storage and transmission equipment.
In a building-type IES, the energy production unit generally includes combined heat and power (CHP) units (gas engine and waste-heat boiler), gas boilers, and solar PV modules. The energy storage unit mainly includes electric and thermal energy storage equipment, while the energy conversion unit includes heat pumps, absorption and electric refrigerators. Their energy conversion models are introduced bellow:
CHP units include gas engines and waste-heat boilers. Natural gas is used as the input energy fuel, and hightemperature and high-pressure steam is generated to drive steam turbines to produce electricity. Gas waste heat can be recovered by waste-heat boilers to provide thermal power for building users. In this work it is assumed that the operating efficiency of the gas turbine remains constant within the operating interval, and its input-output function relationship is defined in equations (1)-(2):
p M T , t o u t = η M T , e λ g a s f M T , t
h M T , t o u t = η W H , h ( 1 η M T , e ) λ g a s f M T , t
where p M T , t o u t and h M T , t o u t are the electrical power output and the thermal power output, respectively, of the gas engine at time t; η M T , e and η W H , h are the electric power generation efficiency and waste-heat recovery efficiency of the CHP unit, respectively; λ g a s and f M T , t are the calorific values of the natural gas and gas consumption rate, respectively.
A gas boiler also uses natural gas as input energy, and the only output thermal energy is supplied to users in a building without electricity generation. Usually, gas boilers are not as efficient as CHP units. The input-output function relationship is described in equation (3):
h G B , t o u t = η G B , e λ g a s f G B , t
where h G B , t o u t is the output thermal power of the gas boiler at time t; f G B , t is the boiler gas consumption rate; and η G B , e is the efficiency of the gas boiler.
The PV module is anextensivelyapplied form of renewable energy in urban buildings. Because solar energy resources are highly distributed energy exhaustion, primary energy acquisition, and noise and pollutant emissions do not occur in the process of PV power generation. PV power generation is mainly determined by the ambient temperature and sunshine intensity.The output power can be expressed as:
p P V , t o u t = P s t c G t G s t c [ 1 + k ( T t T s t c ) ]
Where T t and G t are the temperature of the PV module and sunshine intensity of the PV module, respectively, at time t; P s t c , T s t c and G s t c are the rated output power, temperature and sunshine intensity, respectively, of the PV module in standard conditions, respectively; and k is the power temperature coefficient.
Heat pumps use a small quantity of electricity to leverage heat from the surroundings (air or soil) to attain high temperatures. Heat pumps are more energy efficient and mainly include air-source and ground-source heat pumps. Generally, the heating coefficient characterizes the performance of a heat pump, which is defined as the ratio of the output heat to the input electric power. Denoted as C O P P H , the input-output function relationship of the heat pump is defined in equation (5):
h P H , t o u t = C O P P H p E , t i n
where h P H , t o u t and p E H , t i n are the output heat power and input electric power, respectively, of the heat pump.
Absorption refrigerators convert heat into cold. Heat can be generated by CHP units, heat pumps, etc. Two kinds of absorption refrigerators are commonlyemployed: ammonia bromide absorption refrigerators and lithium bromide absorption refrigerators. Buildings can be cooled by absorption refrigerators on hot days. The ratio of the output cooling capacity to the input heat power is defined as the conversion coefficient, which is referred to as C O P H C . The input-output function relationship is provided in equation (6):
c H C , t o u t = C O P H C h H , t i n
where c H C , t o u t and h H , t i n are the output cooling power and input heat power, respectively.
The input of an electric refrigerator is electrical energy, which is converted to cold energy. This energy can be used during periods of high cooling demand and surplus electricity (such as at night when the electricity price is low). The ratio of the output cooling power to the input cooling power is defined as the cooling coefficient, which is C O P H C . The input-output function relationship is defined in equation (7):
c E C , t o u t = C O P E C p E , t i n
where c E C , t o u t and p E C , t i n are the output cold power and input electric power, respectively.
The energy storage unit includes two types,namely, electrical energy storage equipment and thermal energy storage equipment. Their mathematical models are provided in equation (8) and equation (9), respectively:
E E S , t + 1 = ( 1 θ E S ) E E S , t + ( p E S , t c h η E S c h p E S , t d i s η E S d i s ) Δ T
Q H S , t + 1 = ( 1 θ H S ) Q H S , t + ( h H S , t c h η H S c h h H S , t d i s η H S d i s ) Δ T
where E E S , t + 1 is the stored electricity energy of the electrical energy storage device at time t+1; E E S , t , p E S , t c h , and p E S , t d i s are the stored electricityenergy, charging power, and discharge power, respectively, of the electrical energy storage device at time t; η E S c h , η E S d i s are the charging efficiency and discharging efficiency, respectively, of the electrical energy storage device; Q H S , t + 1 is the stored heat of the thermal energy storage device at time t+1; Q H S , t , h H S , t c h , h H S , t d i s are the stored heat, endothermic power, and exothermic power, respectively, of the thermal energy storage device at time t; η H S c h , η H S d i s are the heat absorption efficiency and heat release efficiency, respectively, of the thermal energy storage equipment; θ E S and θ H S are the self-discharge loss coefficient and heat dissipation loss coefficient of the electrical and thermal energy storage devices, respectively.

1.2. PMV Index for Building Indoor Somatosensory Comfort

For urban building-type IESs, the heat load is mainly divided into rigid loads and temperature regulation loads. The rigid load is the long-term stable demand of domestic hot water and other usage, which can be easily predicted by clustering and other methods, while the temperature regulation load is the unstable elastic demand of indoor temperature regulation by cooling and heating in all seasons. The increase or decrease of the indoor temperature is influenced by many uncertain factors, such as season, outdoor temperature, and building materials. In this paper, the PMV model is used to determine the indoor temperature regulation heat load of urban buildings [31,32]. The PMV model, which was proposed by Prof. Fanger, is a heat balance model in which external heat stimulation is passively received via physical energy and mass exchange between human body feeling and the building environment. The indoor area where human activities are concentrated has the same demand for the room temperature range. The simplified equation of the PMV index is [33]:
ϕ t PMV = 2.43 3.76 × T c T t i n M ( C l τ + 0.1 )
where f t PMV is the PMV index value at time t; T c and T t i n are the human body skin surface and indoor air temperature, respectively, of which T c is 33.5 °C; M is the energy metabolism rate of the human body, which is related to the activity level, and the base value is adopted regardless of the indoor activity; and C l τ is the thermal resistance of the clothing worn in season τ . According to the ISO730 standard, the PMV index range that satisfies the optimal human body temperature is expressed as follows:
0.5 ϕ t PMV 0.5
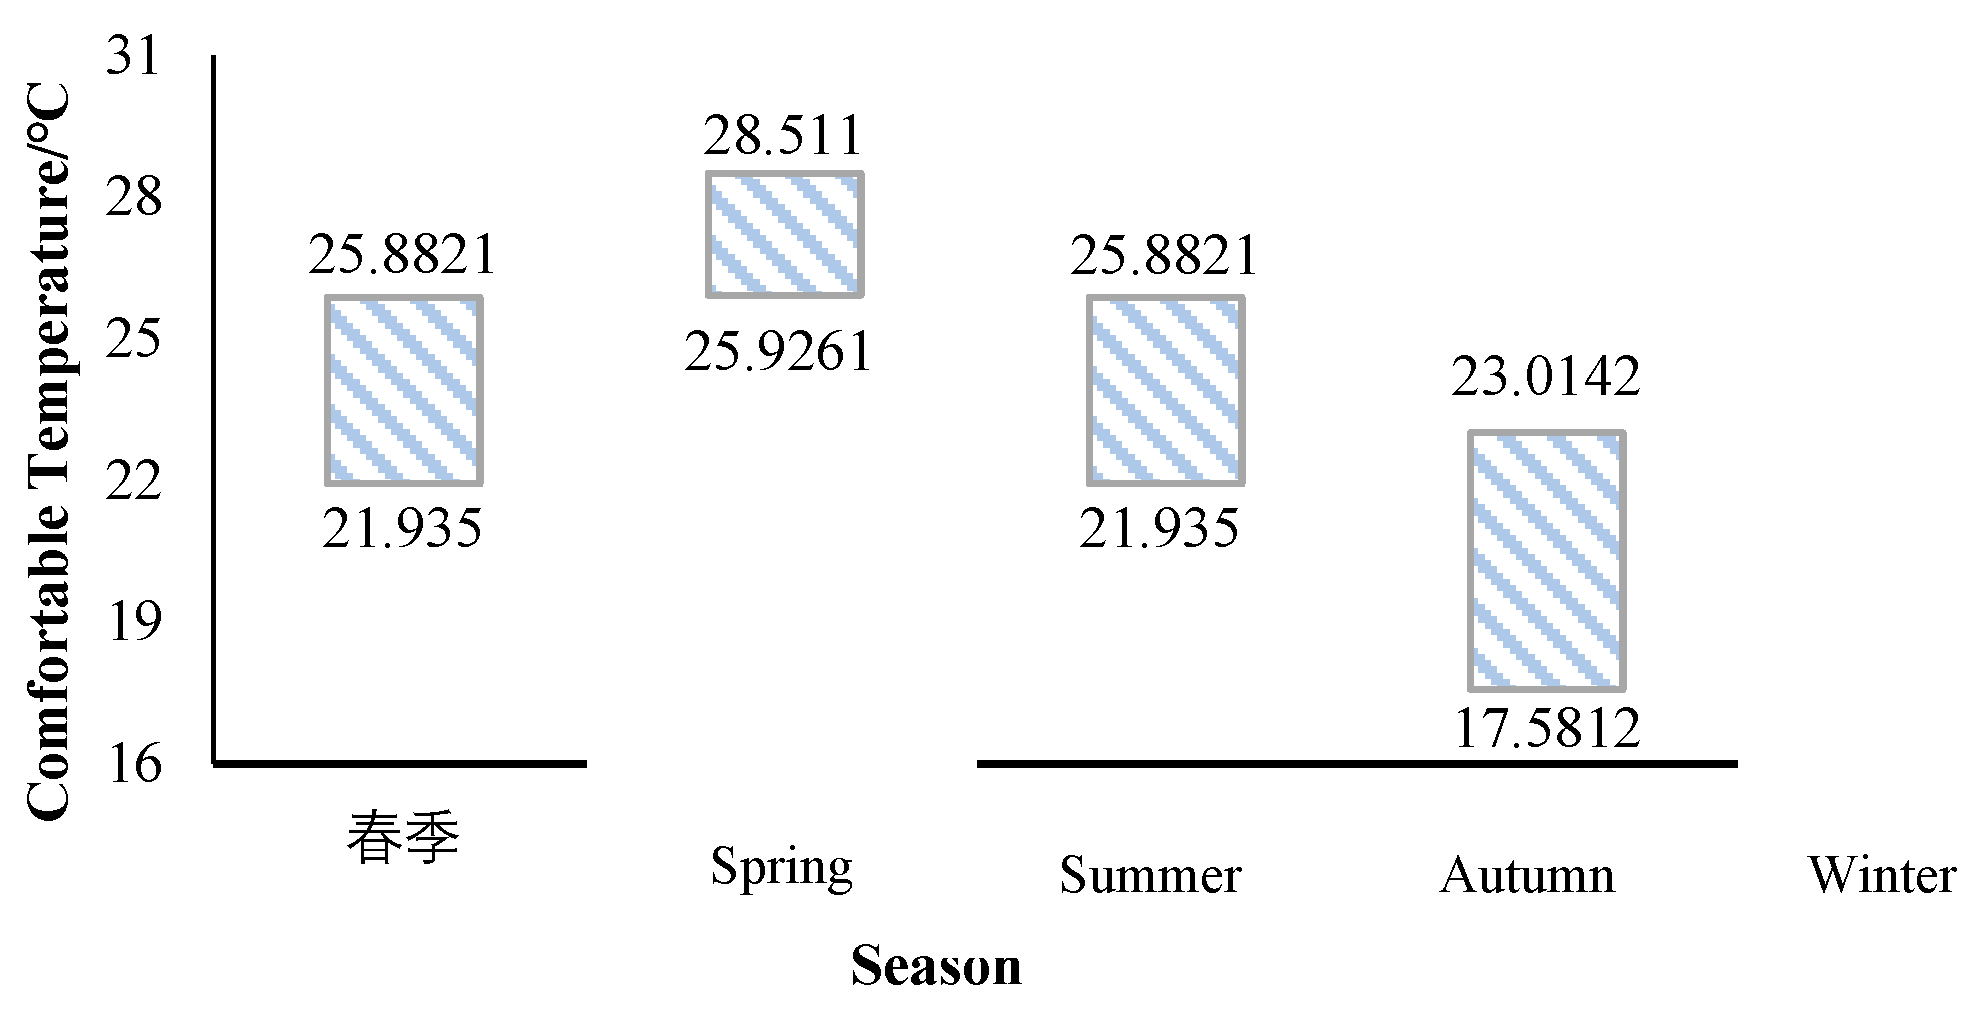
when f t PMV is within the range given in equation (11), temperature comfort is optimal, and users will not notice notable temperature change differences. At this time, the indoor temperature T t i n is transformed into a mathematical constraint interval, which satisfies the user temperature demand for the highest comfort level and has a certain elasticity. The elastic constraint interval of the indoor temperature T t i n is shown in Figure 2.
The relationship between the indoor temperature and regulation thermal/cold power follows a first-order equivalent thermal parameter model. The corresponding differential equation is provided in equation (12), and the discretization process is defined in equation (13) [34]:
d T t i n d t = q t a i r C + T t o u t T t i n R C
T t + 1 i n = T t i n e Δ T R C + ( R q t a i r + T t o u t ) ( 1 e Δ T R C )
where T t o u t is the outdoor temperature at time t; R is the equivalent thermal resistance of the building; C is the equivalent heat capacity considering the passive thermal storage effect of building insulation; ΔT is the power adjustment time interval; The cold or thermal power output q t a i r at time t is used for indoor temperature control.
Based on these constraints, the temperature adjustment power q t a i r required to maintain the optimal human body temperature in a building can be obtained.
Based on the above equations, the temperature adjustment power q t a i r required to maintain the indoor somatosensory comfortable temperature in a building can be obtained. q t a i r > 0 indicates that the indoor temperature needs heating, while q t a i r < 0 means that the indoor temperature needs cooling.

2. Optimization Model for Building-Type IES Planning and Capacity Sizing

2.1. Preprocessing

At the preprocessing stage, all the typical daily load curves are collected. The electricity, cooling and heating load curves of the building in the planning period is statistically analyzed, and the typical daily electricity, cooling and heating load curves are obtained by clustering or scenario reduction. It is assumed that typical daily scenarios are obtained by clustering, in which the total number of days of the nth typical scenario is dn. The specific typical day screening method is based on [35]. Here, for a one-year period analysis, let N=3; i.e., spring days combined with autumn days, summer days and winter days represent the 3 typical daily scenarios.
Then, for one-year period analysis, to make the annual comprehensive cost of a building-type IES most economical, an optimal sizing model with 0-1 variables are developed bellow. The solution will give the optimized capacity of each unit in IES and how do they work to balance the power and load within each typical daily scenario.

2.2. Optimization Objective

In this paper, cost is adopted as the objective function of the IES planning and sizing model. Specifically, the annual comprehensive operation cost is defined as the indicator with which to evaluate the economy, including equipment initial installation cost, annual maintenance cost, and annual energy fuel consumption cost, as defined in equation (14)[36]:
min C A T C = C I N + C O M + C E S
where C A T C is the annual comprehensive operation cost of the system; C I N , C OM and C E S are the yearly values of the initial installation, annual operation and maintenance and annual energy fuel consumption costs, respectively; and the specific calculation method of each cost index is expressed as follows.
In this paper, by using the equal annual value method and the capital recovery factor (CRF) index, the initial investment costs of all types of equipment installed in an IES can be converted to the annual cost expenditure, as shown in equation (15):
C I N = s ξ s c a p C s r ( 1 + r ) l s ( 1 + r ) l s 1
where C I N is the annual value of the initial equipment installation cost, C s is the planned installation capacity of equipment s, ξ s c a p is the installation cost of a unit capacity of equipment s, r is the benchmark discount rate, and l s is the average life of equipment s.
According to the actual engineering experience, the equipment maintenance cost is generally calculated as a percentage of the initial installation cost:
C O M = C I N × a
where a is the equipment operation and maintenance cost coefficient, which is set to 0.05 in this paper.
The energy fuel consumption cost includes the cost of natural gas and other fuels consumed by the energy production equipment and the difference between the purchase and the sale of electricity to the grid.
C E S = n d n t ( s f s . t ξ t g a s + p t b u y ξ t b u y p t s e l l ξ t s e l l ) Δ T
where ξ t b u y , ξ t s e l l and ξ t g a s are the purchase price of power from the grid, the sale price of power to the grid and the purchase price of gas, respectively, at time t; p t b u y and p t s e l l are the electric power purchased from the grid and the electric power sold to the grid, respectively, in the IES at time t; f s . t is the gas consumption rate (for equipment s) at time t; and Δ T is the power regulation time interval.

2.3. Constrains

The constraints consist of the operation constraints of the IES on typical days. These include the input-output coupling constraints of the various types of equipment in the IES model mentioned above, and system power balance constraints (mainly cold, thermal and electric power balance), power system constraints of grid tie lines, equipment capacity planning & output constraints as follows:
Define the grid supplied electric power p t p u r c h = p t b u y p t s e l l at time t, according to the conversion relationship in Figure 1, the electric, thermal and cold power balance constraints can be expressed as:
p t p u r c h ( p E H , t i n + p E C , t i n ) + p M T , t o u t + p E S , t d i s = p t L p P V , t o u t + p E S , t c h
h M T , t o u t + h G B , t o u t + h P H , t o u t h H , t i n + h H S , t d i s = { h t r i g i d + h H S , t c h + q t a i r , q t a i r 0 h t r i g i d + h H S , t c h , q t a i r < 0
c H C , t o u t + c E C , t o u t = c t L = { 0 , q t a i r 0 | q t a i r | , q t a i r < 0
where p t L , h t r i g i d and p P V , t o u t are the electrical load demand, the rigid thermal power mentioned in above and the electrical power generated from the building-integrated PV at time t. They can be obtained from the given typical daily load curves and PV output power curves. q t a i r can be obtained from (13) for indoor somatosensory comfort. When q t a i r 0 , the thermal power supplied is used for both rigid thermal power and the indoor temperature arisen, and there is no need for cooling power; while when q t a i r < 0 , cooling power is supplied to drop the indoor temperature, the thermal power supply is used only for rigid thermal power. All the output or input power of each energy production, conversion and storage unit (except the PV module) of the IES in (18)-(20) are variables, and can be obtained through the optimal solution.
Considering the power limit of the connecting line between the IES and the power grid, the power constraints are established in equations (21)-(23):
0 p t b u y γ t b u y p b u y . max
0 p t s e l l γ t s e l l p s e l l . max
0 γ t s e l l + γ t b u y 1
where p b u y . max and p s e l l . max are the upper power limits of the IES to purchase electricity or sell electricity, respectively, to the grid; and γ t b u y and γ t s e l l are 0-1 variables that indicate the status of the IES for selling electricity and purchasing electricity, respectively, where γ t b u y = 1 represents the purchase of electricity from grid and γ t s e l l = 1 represents the sale of electricity to grid. Constraint (23) simultaneously restricts the IES to either purchasing or selling electricity.
The optimally sized capacity of each unit C s in the IES cannot exceed the upper and lower limits of the allowed installation capacity, as shown in equation (24):
γ s C s min C s γ s C s max
where γ s is a 0-1 state variable, γ s = 0 and γ s = 1 indicate that no equipment is installed and that kind of equipment is installed, respectively, and C s min and C s max are the lower limit and upper limit, respectively, of the installed capacity of unit s.
The output of the energy production/conversion equipment must not exceed the allowed upper and lower limits:
ψ s . t δ s min C s w s . t ψ s . t δ s max C s
where δ s min and δ s max are the minimum output ratio and maximum output ratio, respectively, of the energy production/conversion unit s; ψ s . t is a 0-1 state variable, in which ψ s . t = 0 indicates that unit s is not put into operation at time t, while ψ s . t = 1 indicates the opposite; C s is the optimal capacity solution of unit s; and w s . t is the output power of unit s at time t. For gas engine w s . t = p M T , t o u t ; for waste-heat boiler w s . t = h M T , t o u t ; for gas boiler w s . t = h G B , t o u t ; for heat pump w s . t = h P H , t o u t ; for absorption refrigerator w s . t = c H C , t o u t ;and electric refrigerator w s . t = c E C , t o u t .
Regardless of the overload ability, the optimally sized C s of each unit is considered to be the max power output among one year time t.
C s = max t { w s . t }
The energy storage equipment should satisfy the upper and lower limit constraints, as defined in equation (27). To ensure continuity of the energy storage state between successive scheduling days, this paper assumes that state W s . T and the energy storage starting time occur at the last moment of each scheduling cycle. State W s .1 is the same as defined in equation (28).
S s min C s W s . t S s max C s
W s .1 = W s . T
where S s max and S s min represent the upper energy storage limit and lower energy storage limit, respectively, of the energy storage equipment, and W s . t is the energy storage amount of equipment s at time t. For electricity power storage W s . t = E s . t and for thermal power storage W s . t = Q s . t .
The optimally sized C s of each storage unit is also considered to be the max storage power amount among one year time t.
C s = max t { W s . t }
In addition, the energy storage charging and discharging rate constraints must be considered, which implies that the charging and discharging power of the energy storage equipment cannot exceed a certain limit. Therefore, the charging and discharging power of energy storage equipment is generally related to the storage capacity and max charging/discharging rate, as follows:
0 w s . t c h ε s . t c h κ s c h C s
0 w s . t d i s ε s . t d i s κ s d i s C s
0 ε s . t c h + ε s . t d i s 1
where w s . t c h and w s . t d i s are the charging power and discharging power, respectively, of energy storage equipment s at time t. For electricity power storage w s . t c h = p E S , t c h and w s . t d i s = p E S , t d i s ; for thermal power storage w s . t c h = h E S , t c h and w s . t d i s = h E S , t d i s .They are used to balance the power supply and load consumption in electric and thermal network; κ s c h and κ s d i s are the max charging rate and discharging rate, respectively, of energy storage equipment s; and ε s . t c h and ε s . t d i s are characteristics of the energy storage equipment. The 0-1 state variable of equipment s at time t; ε s . t c h = 1 represents charging, and ε s . t d i s = 1 indicates discharging. Equation (27) ensures that the energy storage device cannot be simultaneously charged and discharged.

2.4. Model Solution

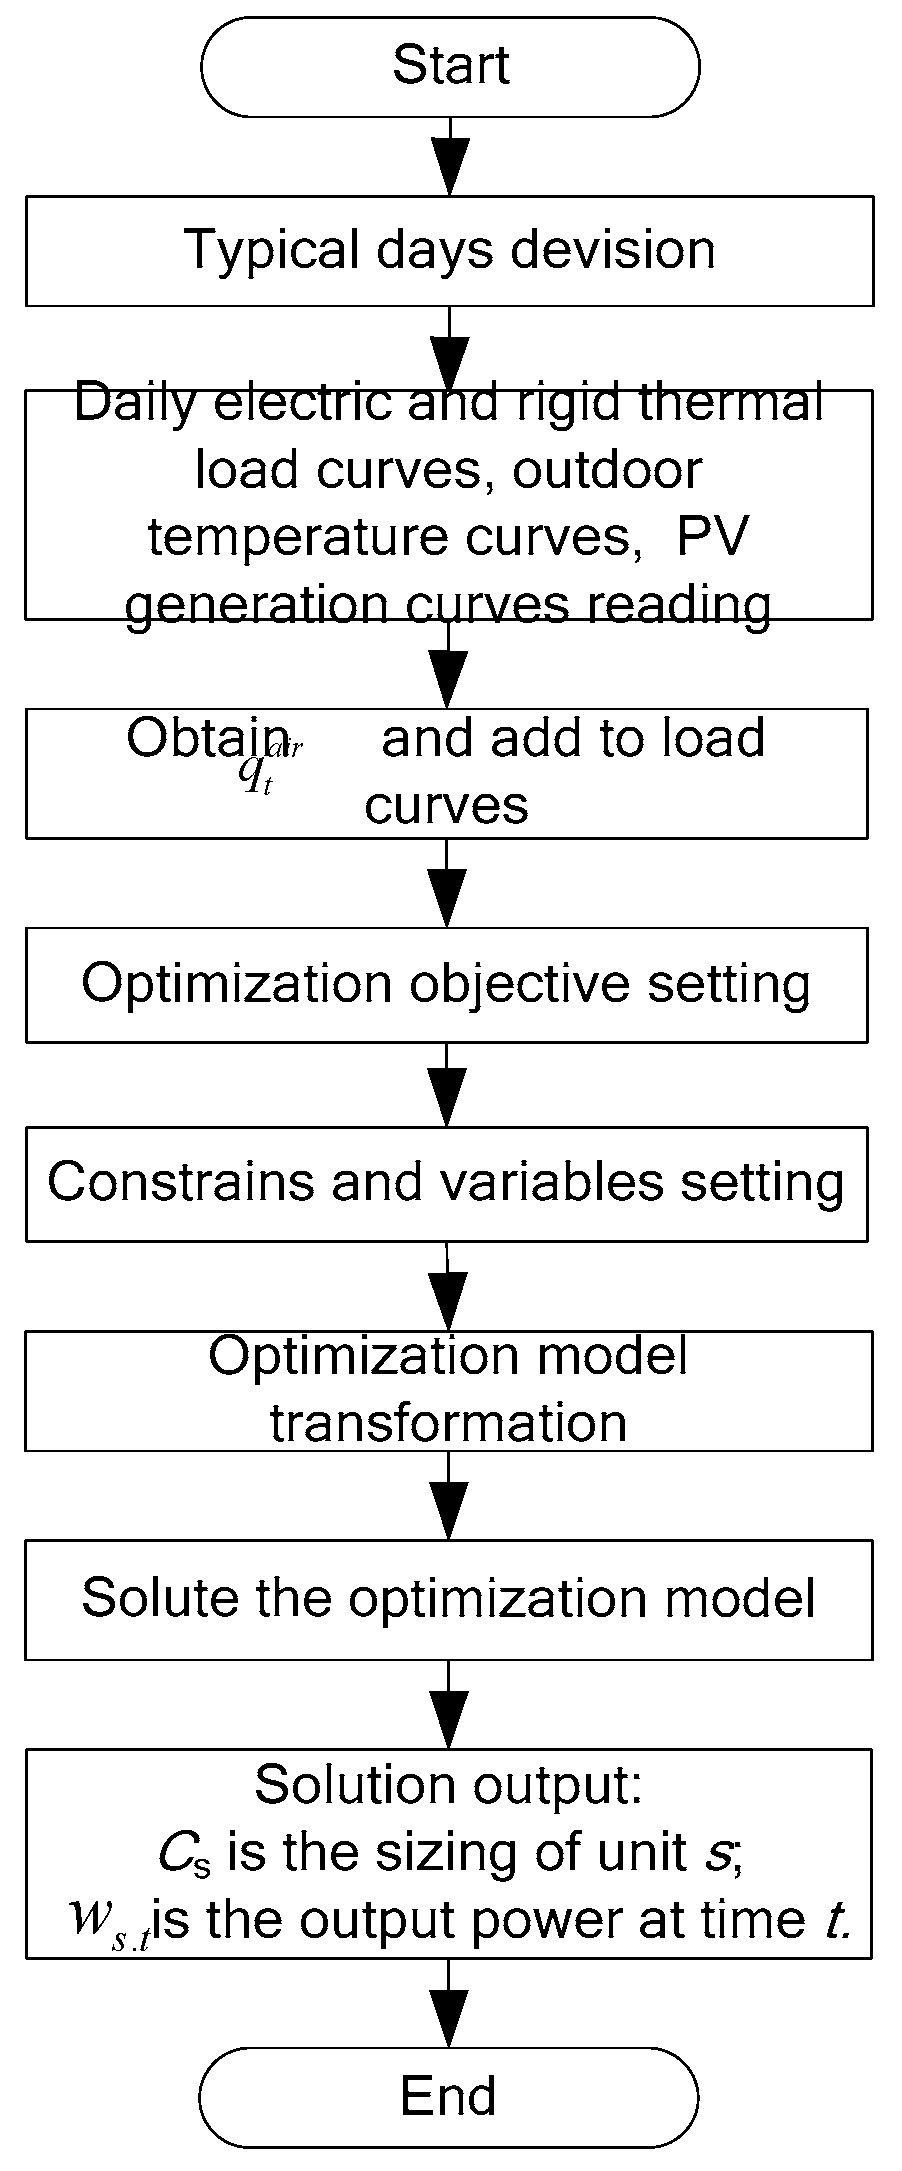
When planning a building-type IES considering indoor somatosensory comfort and PV generation, 3 types of typical days are divided firstly. The sum of 183 spring/autumn days, 91 summer days and 91 winter days represents the whole year. Secondly, the daily electric and rigid heat load curves, outdoor temperature curves, together with the PV generation curves are read into this model; Thirdly, the cold or thermal power output q t a i r for indoor temperature somatosensory comfort regulation at time ton3 types of typical days are calculated from (13) and then added to thermal and cold load curves; Fourthly, the optimization objective is set with fuel price, timely and directionally (to or from the grid) varied electricity prices, equipment installing and maintenance costs; Fifthly, each constrains are set to ensure the electrical, thermal and cold power balance, the installation capacity and its power output at each time t, together with 0-1 constrain variables are variables for the optimal solution.
The previous optimization model is a mixed-integer nonlinear optimization problem, which is difficult to solve directly but can be transformed into a 0-1 mixed-integer linear programming problem by a specific mathematical transformation. The nonlinear characteristic of this model is due to the product of continuous and 0-1 variables, i.e., the constraint form of k 1 u x z k 2 u y , in which x, y and z are continuous variables, u is a 0-1 variable and k 1 < k 2 is a given constant. This is equivalent to the following equation (33):
z k 2 y k 1 x z + ( 1 u ) k 2 0 z k 2 y max u
where ymax is the maximum value of variable y. With this transformation method, the optimization model proposed in this paper can be transformed into a 0-1 mixed-integer linear optimization model, which can be modeled with the Yalmip toolbox in MATLAB software, and a global optimal solution can be obtained with the commercial optimization software CPLEX.
The flowchart of modeling and solution is shown in Figure 3.

3. Case Studies

3.1. Basic Settings

A commercial and residential podium building in China is considered as the building-type IES planning object. The planning objective is to achieve the most economical operation with the premise of balancing power and energy by determining the equipment type and capacity allocation. The building has 200 apartments (each has an area of 120 m2) and contains a 10,000 m2 office floor and a 5,000 m2 hotel. The building adopts a centralized cooling and heating mode. The building implements an energy use trusteeship: the energy provider charges each owner annual cooling and heating fees according to a fixed unit price per square meter and guarantees the provision of cooling and heating according to the indoor temperature limit shown in Figure 2. On this basis, the energy supply optimization operation targets to maximize revenue. Through the method of clustering, the whole year is divided into three typical seasons: spring combined with autumn (because load and temperature in spring and autumn are similar), summer and winter. The local natural gas price is 2.7 RMB yuan/m3, and the calorific value is 9.7 kWh/m3. The equipment price parameters, time-varied power purchase and sale price curve, outdoor temperature and load curve of the typical seasons are shown in the Appendix.

3.2. Scenario Analysis without PV Modules

Firstly, PV modules are assumed not to be installed in the building. Based on the objective of the lowest annual total cost for the building-type IES, and through the above expressed methodology, an optimized sizing result is shown in Table 1 and Table 2 as Scenario 1. It can be found that according to the principle of economic equipment selection, noneconomic and low-efficiency equipment, such as electrical/thermal energy storage devices, electric refrigerators and gas boilers, are not selected in the optimized allocation results. A heat pump, a CHP unit and an absorption refrigerator are included to satisfy the load demands. To further know whether the use of energy storage or only a CHP unit can lower the cost, the following 2 more scenarios are defined for analysis:
Scenario 2: An energy storage equipment, which is used for peak load reduction and valley shifting of the electrical or heat load demand, a CHP unit and an absorption refrigerator are included to satisfy the load demands;
Scenario 3: The building-type IES includes only a CHP unit and an absorption refrigerator to satisfy the load demands.
The optimally sized capacity and cost comparison of the three scenarios are summarized in Table 1 and Table 2, respectively.
According to Table 1 and Table 2, scenario 3 has the highest optimally sized capacity of the gas engine and waste-heat boiler, with the highest annual cost. In comparison, scenario 2 has the highest installation cost, mainly due to the addition of the storage equipment and the installation capacity of the gas engine together the waste-heat boiler.The thermal storage is selected by the optimization model due to its lower price than electrical energy storage. The total annual cost of scenario 2 is also higher than the total cost of scenario 1. Including the heat pump in scenario 1, the problem of an insufficient output during the peak heat load period is more effectively solved even than energy storage. The optimally sizing capacity of the gas engine, waste-heat boiler and the total annual cost the lowest. In the follow-up analysis, the optimal planning result (scenario 1) is traded as a base study to further analyze.

3.3. Scenario Analysis with PV Modules

To explore the influence of PV generation on IESplanning and sizing, two additional scenarios are defined:
Scenario 4: A 150 kW PV, a heat pump, a CHP unit and an absorption refrigerator are included to satisfy the load demands.
Scenario 5: A 300 kW PV, a heat pump, a CHP unit and an absorption refrigerator are included to satisfy the load demands.
The optimized sizing and cost comparison results of scenario 1, 4 and 5 are listed in Table 3 and Table 4, respectively.
Obviously, with an increase in the PV installation capacity, the output of PV power generation increases, and the optimally sized capacity of the gas engine and corresponding waste-heat boiler decreases. Compared to scenario 1, the capacity of the gas engine and waste-heat boiler in scenario 5 is reduced by 8.8%. The capacity of the heat pump and absorption refrigerator remains unchanged. In terms of costs, with the increase in PV installation capacity, although the capacity of the gas engine and waste-heat boiler decreases, the total equipment installation and maintenance costs increase. But because PV power generation does not require fuel, which greatly reduces the fuel cost. Therefore, the total annual cost of the IES is reduced. Compared with scenario 1, the total annual cost of the IES in scenario 5 is reduced by almost 313,000 RMB yuan, or 4.0%. Therefore, building-integrated PV generation reduces not only carbon emissions but also IES’ total cost. Therefore, installing PV modules in urban buildings should be encouraged.

3.4. Power Balance Study

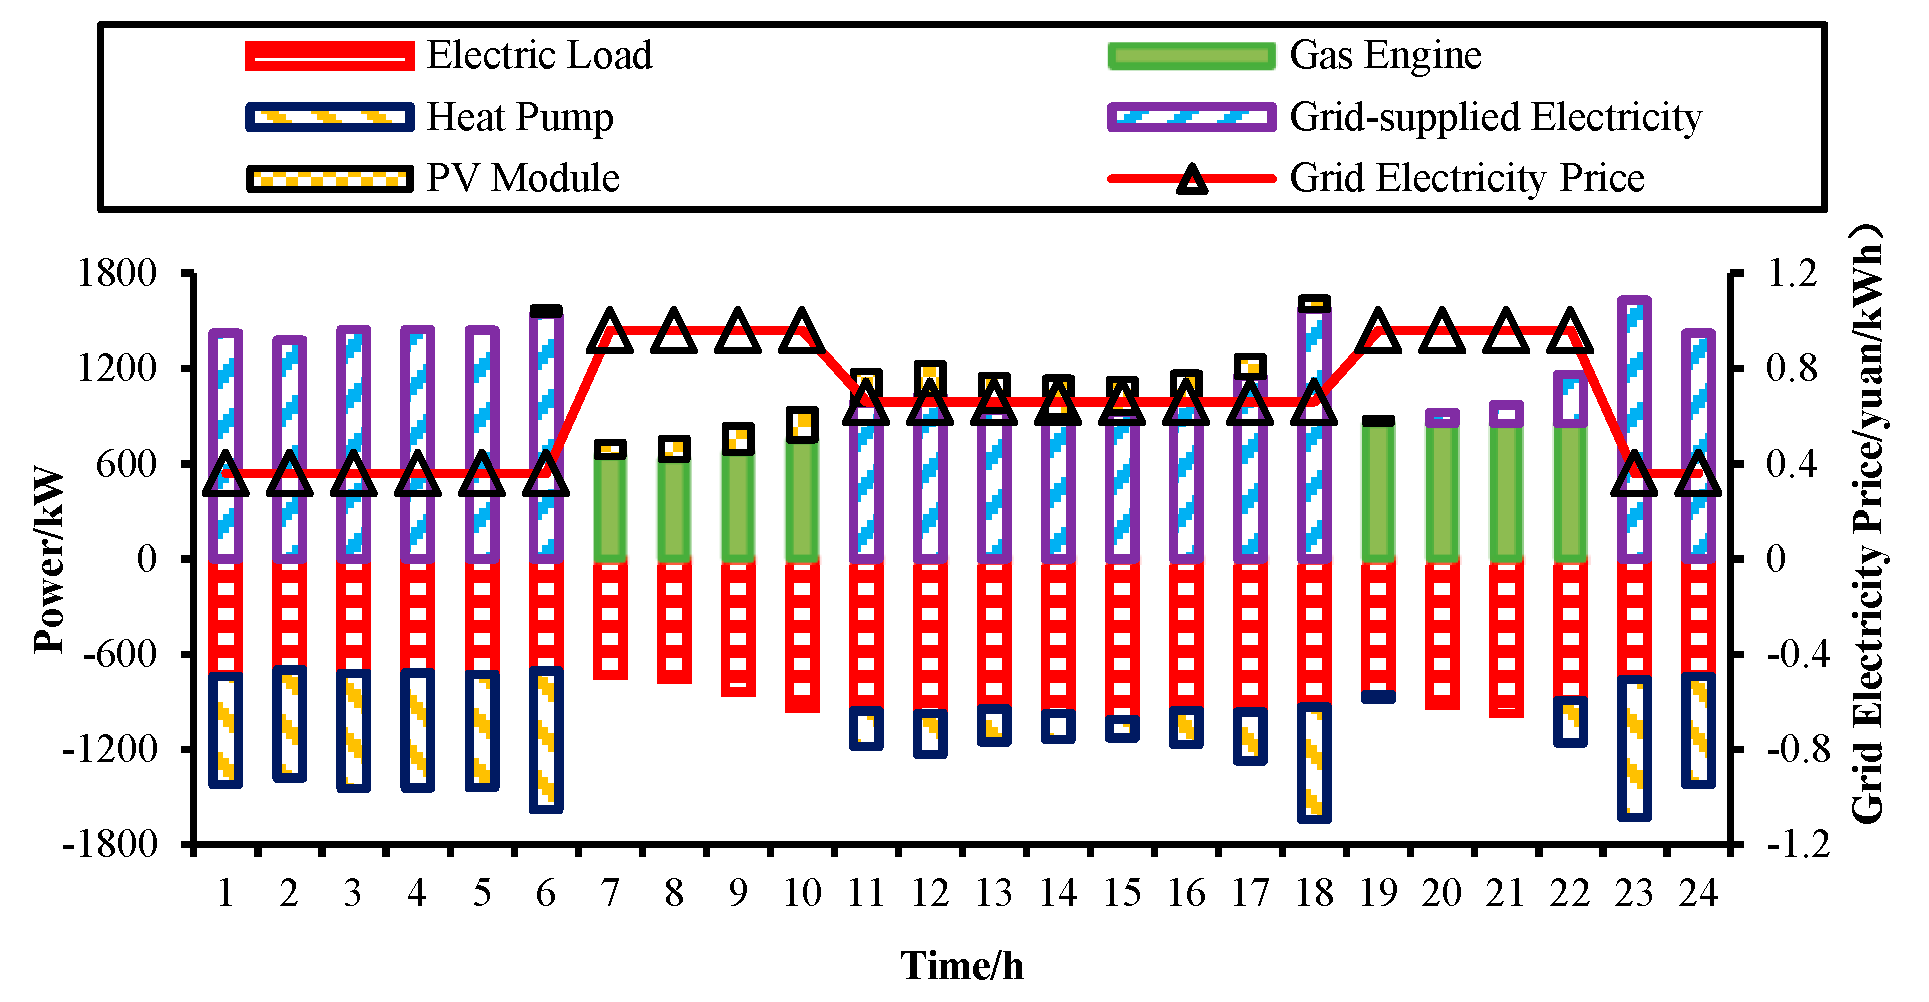
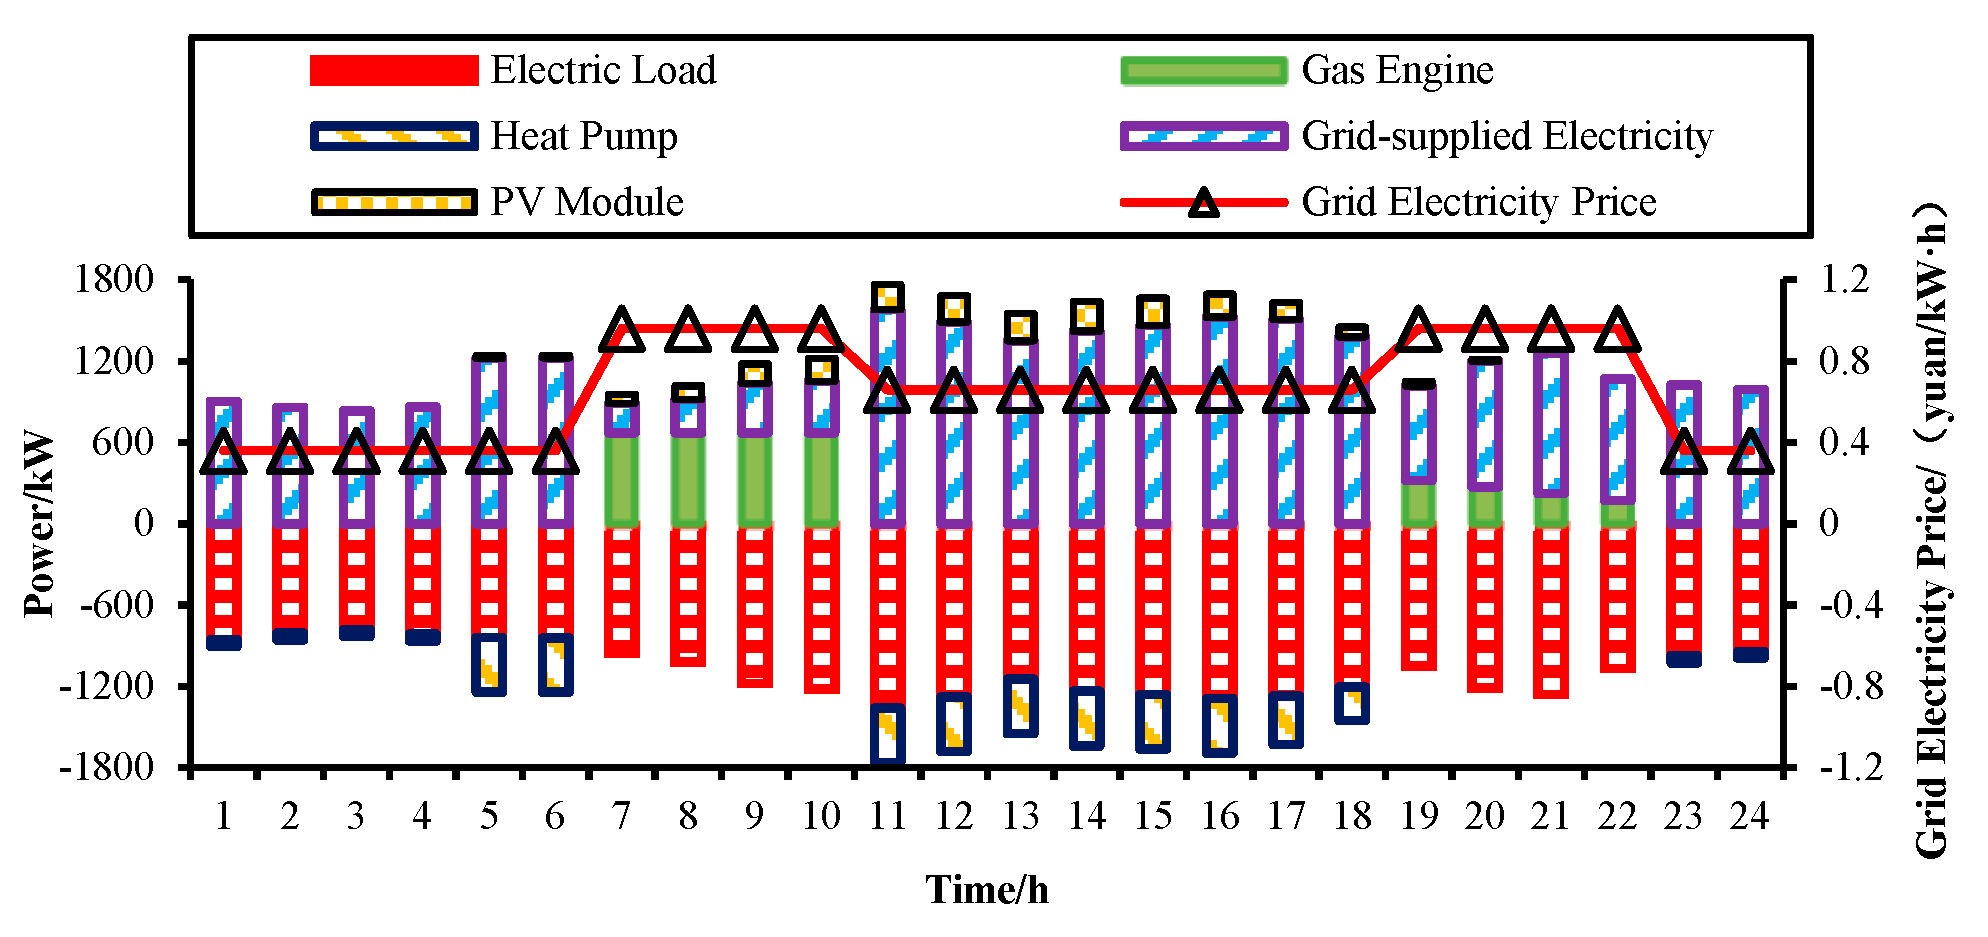
The optimal planning model also gives the power balance solution. Figure 4 shows the power balance curves for typical days in spring &autumn in scenario 5. The valley-price periods of the grid-supplied electricity range from 1:00 to 6:00 and from 23:00 to 24:00, and the flat-price periods range from 11:00 to 18:00, while the peak-price periods range from 7:00 to 10:00 and from 19:00 to 22:00. In the valley and flat price periods, the cost of gas power generation is higher than that of purchasing electricity from the grid, and the gas engine is deactivated. Even though the IES purchases most of the electricity from the grid, some electricity is provided by the PV module to satisfy the electric load demand and operate the heat pump for thermal energy supply. During the peak-price period, the gas engine operates at a high load rate to satisfy the electric load demands of the building. When the electric load rises substantially, it is supplemented by purchasing electricity from the power grid (19:00-22:00). In the daytime, the installed 300 kW PV module supplies approximately 40-240 kW of electric power, which is totally consumed in the building and decreases the electric power obtained from the grid and the gas engine.
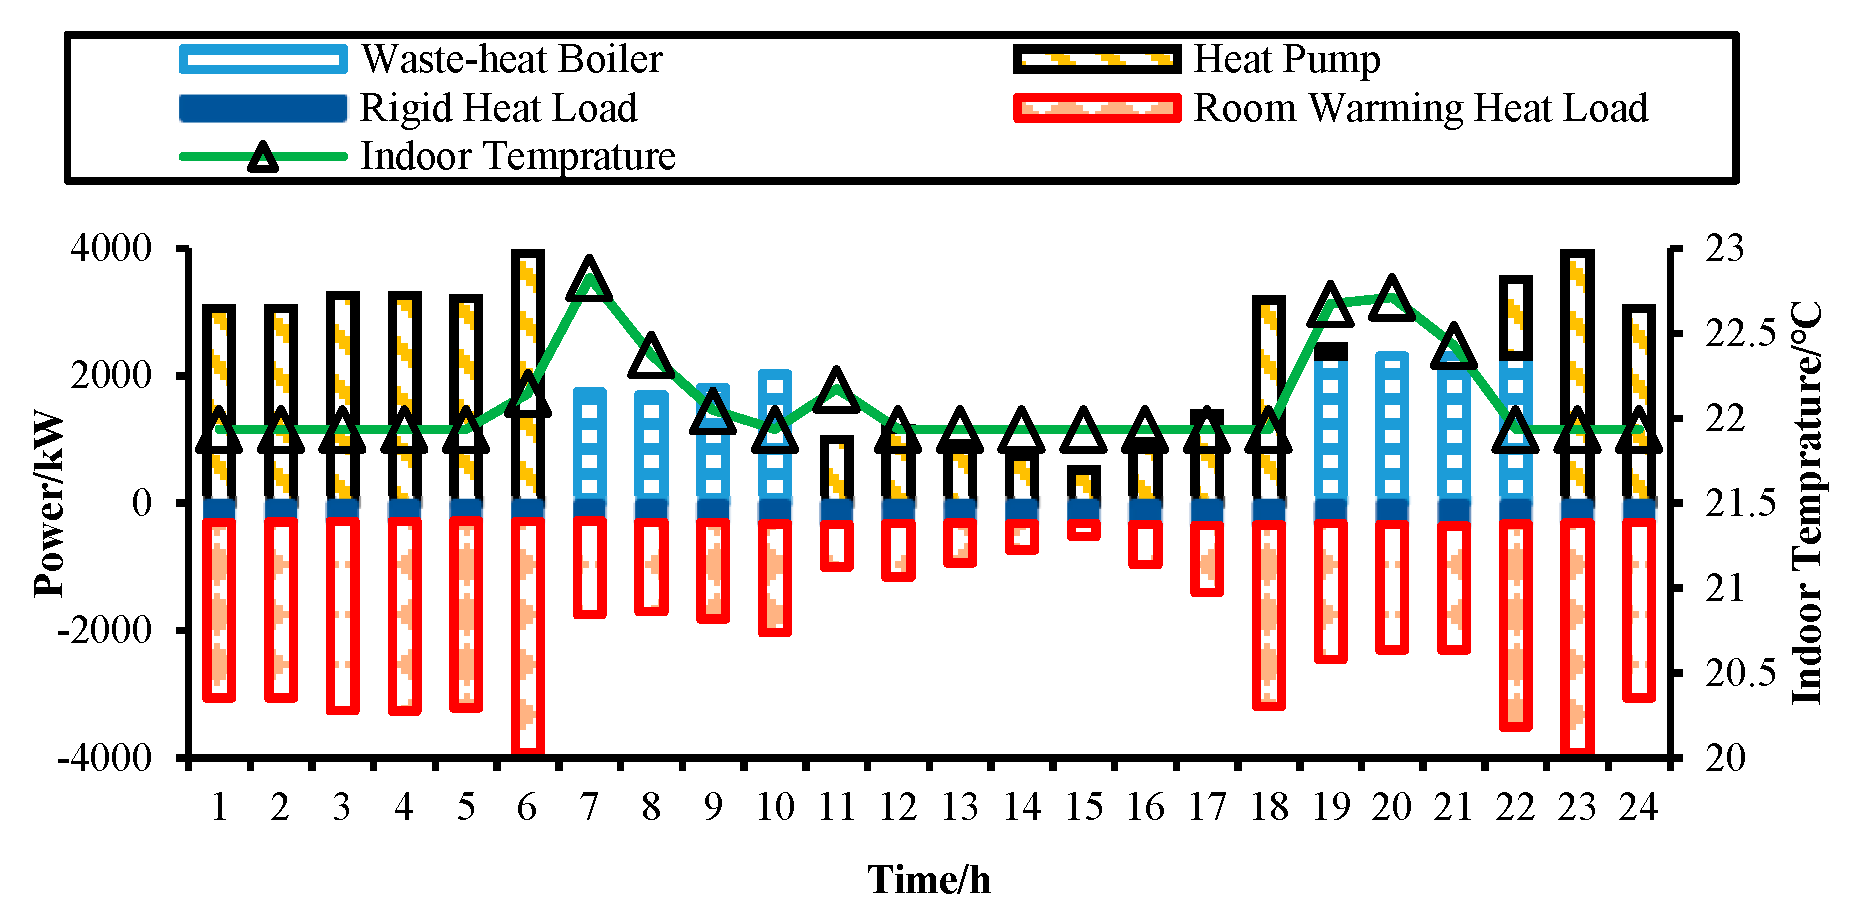
Figure 5 shows the thermal power balance curves for typical days in spring&autumn in scenario 5. The heat load (including the rigid and air-conditioning heat loads required to maintain a comfortable temperature) is balanced by the heat generated by the waste-heat boiler and heat pump. The waste-heat boiler supplies heat by recovering waste heat of the gas engine, which coincides with the start and stop conditions of the gas engine. During the peak grid-electricity price period, the waste-heat boiler and gas engine operate simultaneously to supply power and heat. During this time, the heat pump is used as a supplementary thermal source and maintains a low load operation rate (peak electricity price period at night) and even stops (peak electricity price period in the morning). In the flat and valley-electricity price periods, the gas engine and waste-heat boiler are deactivated, and heat is supplied by the heat pump to satisfy the rigid and indoor temperature regulation heat load requirements. Between 10:00 and 17:00, when the outdoor temperature is high, a lower thermal energy requirement is applied to maintain the indoor temperature. At other times, when the outdoor temperature is low, a higher thermal energy demand is required to maintain the indoor temperature. The trend observed in Figure 4 is consistent with the principle of indoor and outdoor thermal energy exchange. The indoor temperature is maintained between 21.5 °C and 23 °C, which satisfies the comfortable temperature of human body. The absorption refrigerator does not operate because the cooling requirement does not exist in spring and autumn.
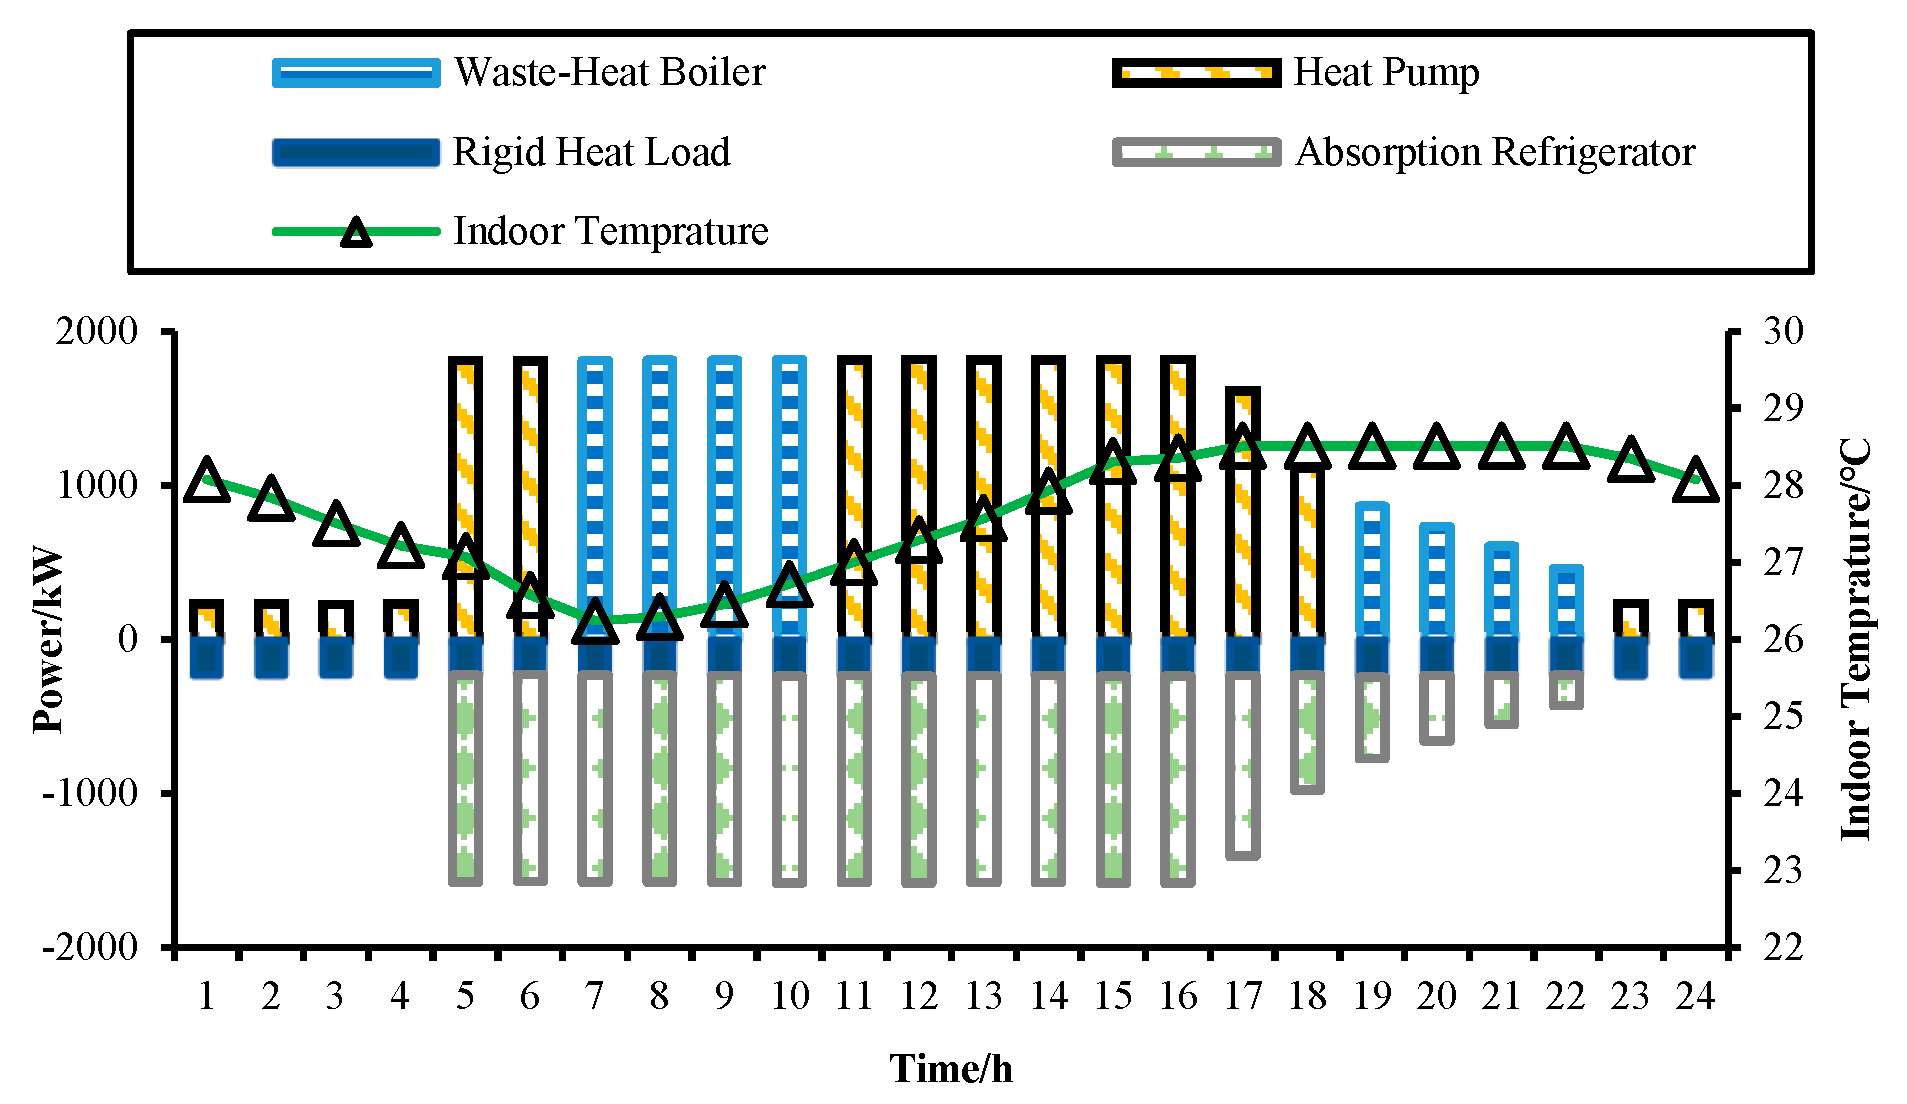
Figure 6 and Figure 7 show the electric and thermal power balance curves, respectively, on typical summer days in scenario 5. The gas engine, waste-heat boiler, absorption refrigerator, and heat pump are all put into operation. The absorption refrigerator is used as a heat sink for indoor cooling, whose heat energy consumption power is obtained from the heat pump and the waste-heat boiler. During the peak-electricity price periods in the morning and night, the gas engine is turned on for power and heat generation. The waste-heat boiler supplies the rigid heat load and the exchanged heat required by the absorption refrigerator to decrease the room temperature, while the heat pump is stopped. Insufficient electric power is provided by the grid and PV module. In the flat and valley-electricity price periods, the heat exchange of the absorption refrigerator is entirely provided by the heat pump, and the rigid heat load is also satisfied by the latter. The heat pump generates heat by purchasing electricity from the grid, supplemented by the PV module. Between 5:00 and 17:00, the absorption refrigerator in the IES operates close to the rated power limit when the outdoor temperature is high. Except for a small portion of the rigid heat load, the rest of the thermal energy is used by the absorption refrigeration to adjust the indoor temperature. The cooling load of the absorption refrigerator gradually decreases with a decrease in the ambient temperature after 17:00. Based on the principle of the gas engine, the electric power is determined by the heat power, and the power generation of the gas engine during the peak-price period at night is not as high as that during the peak-price period in the morning because the outdoor temperature is suitable from 19:00 to 5:00 and there is no need to cool the air temperature in the room. This finding explains why the PV output during the morning peak period can reduce the capacity of the gas engine. As a result, the indoor temperature in this building can be maintained between 26 °C and 29 °C.
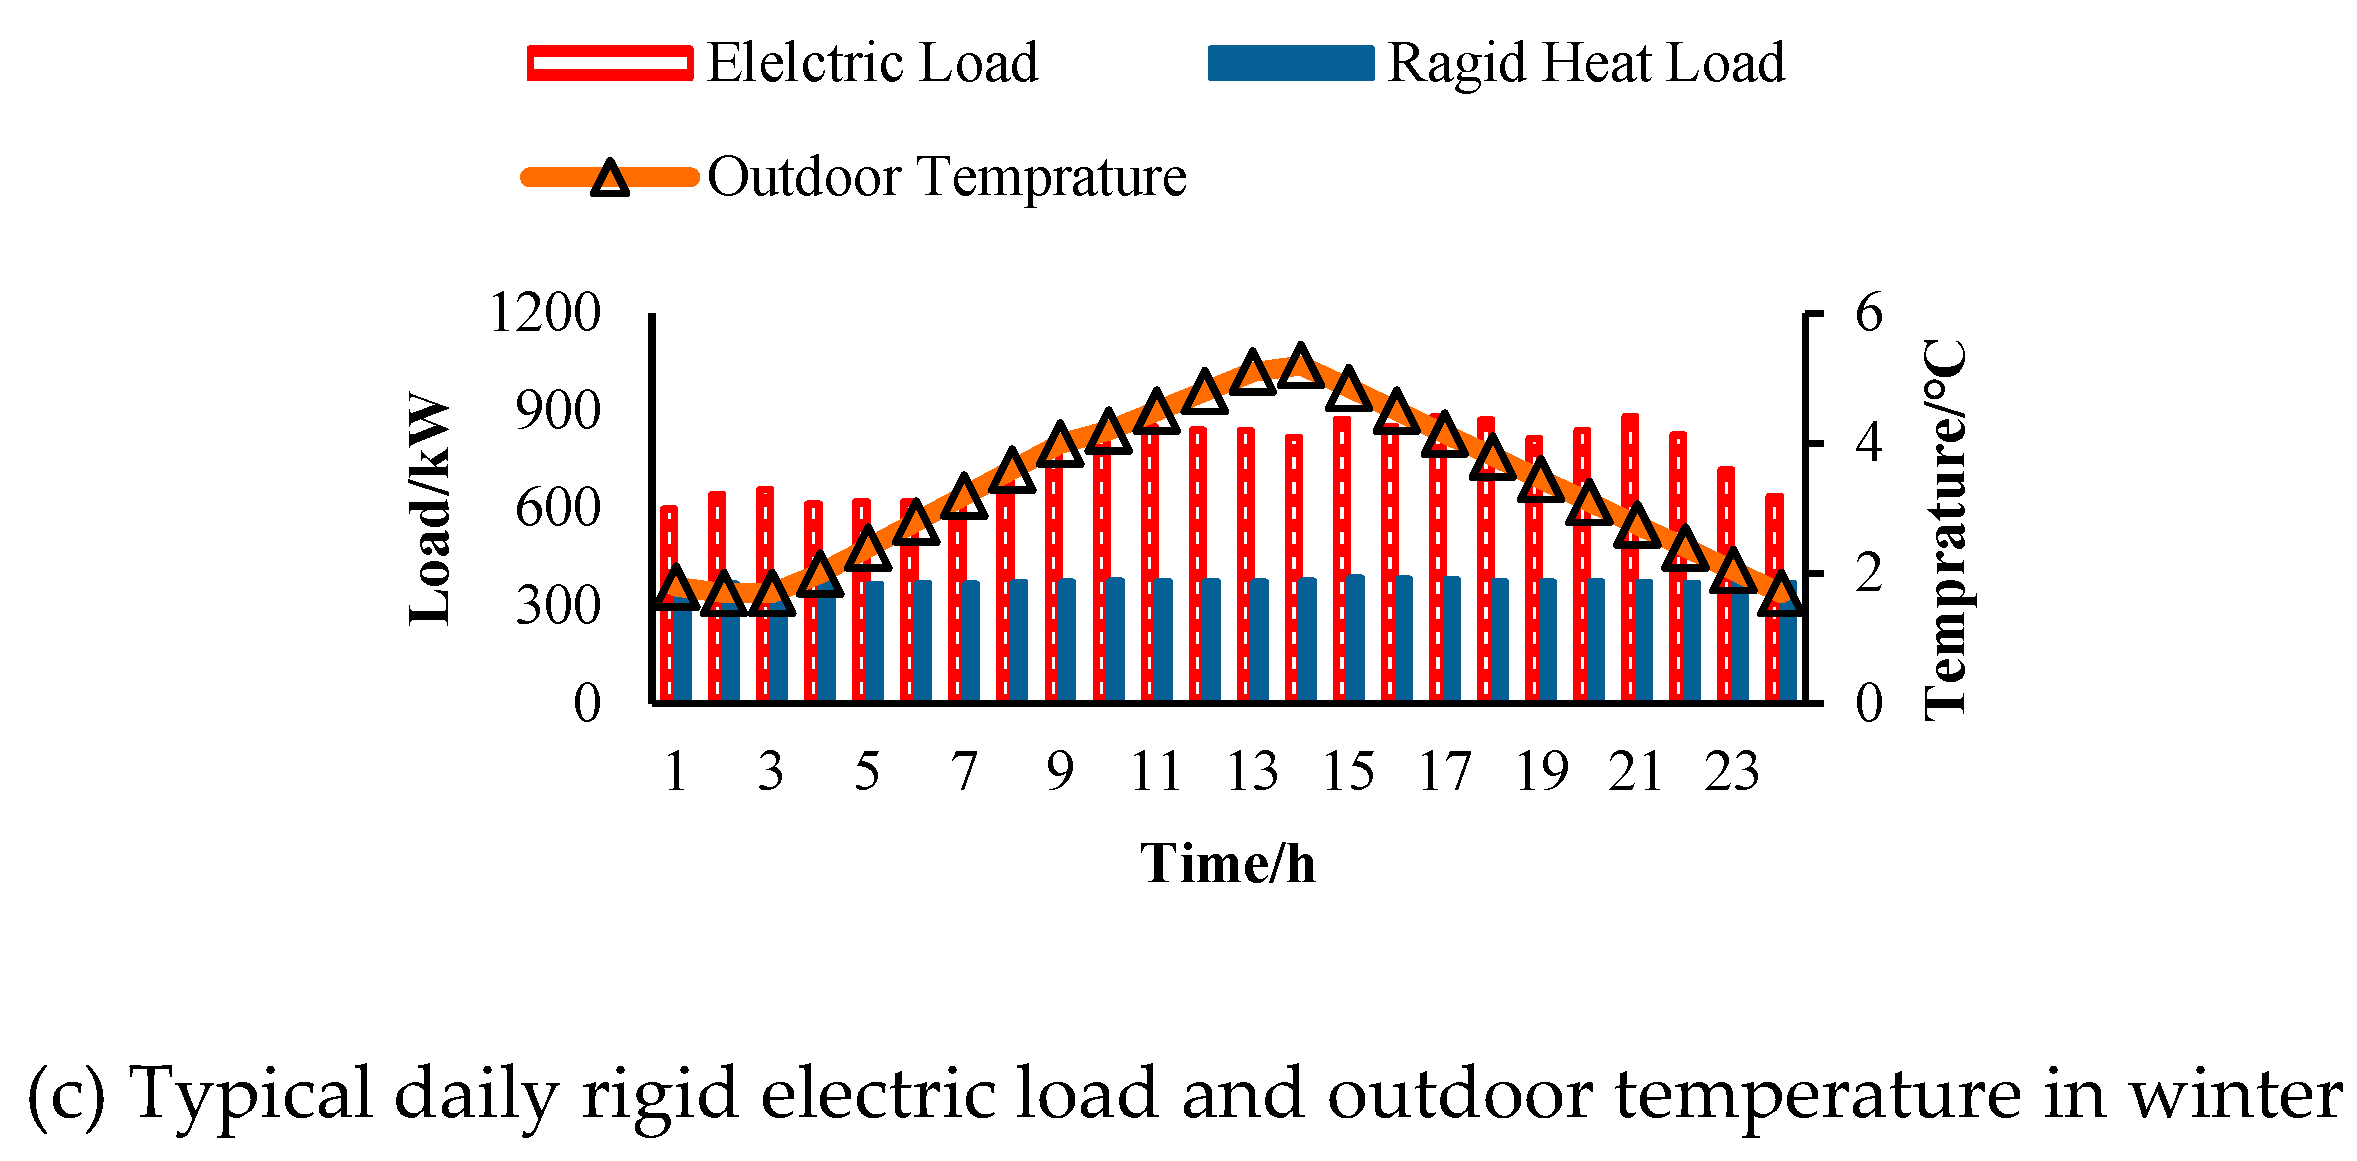
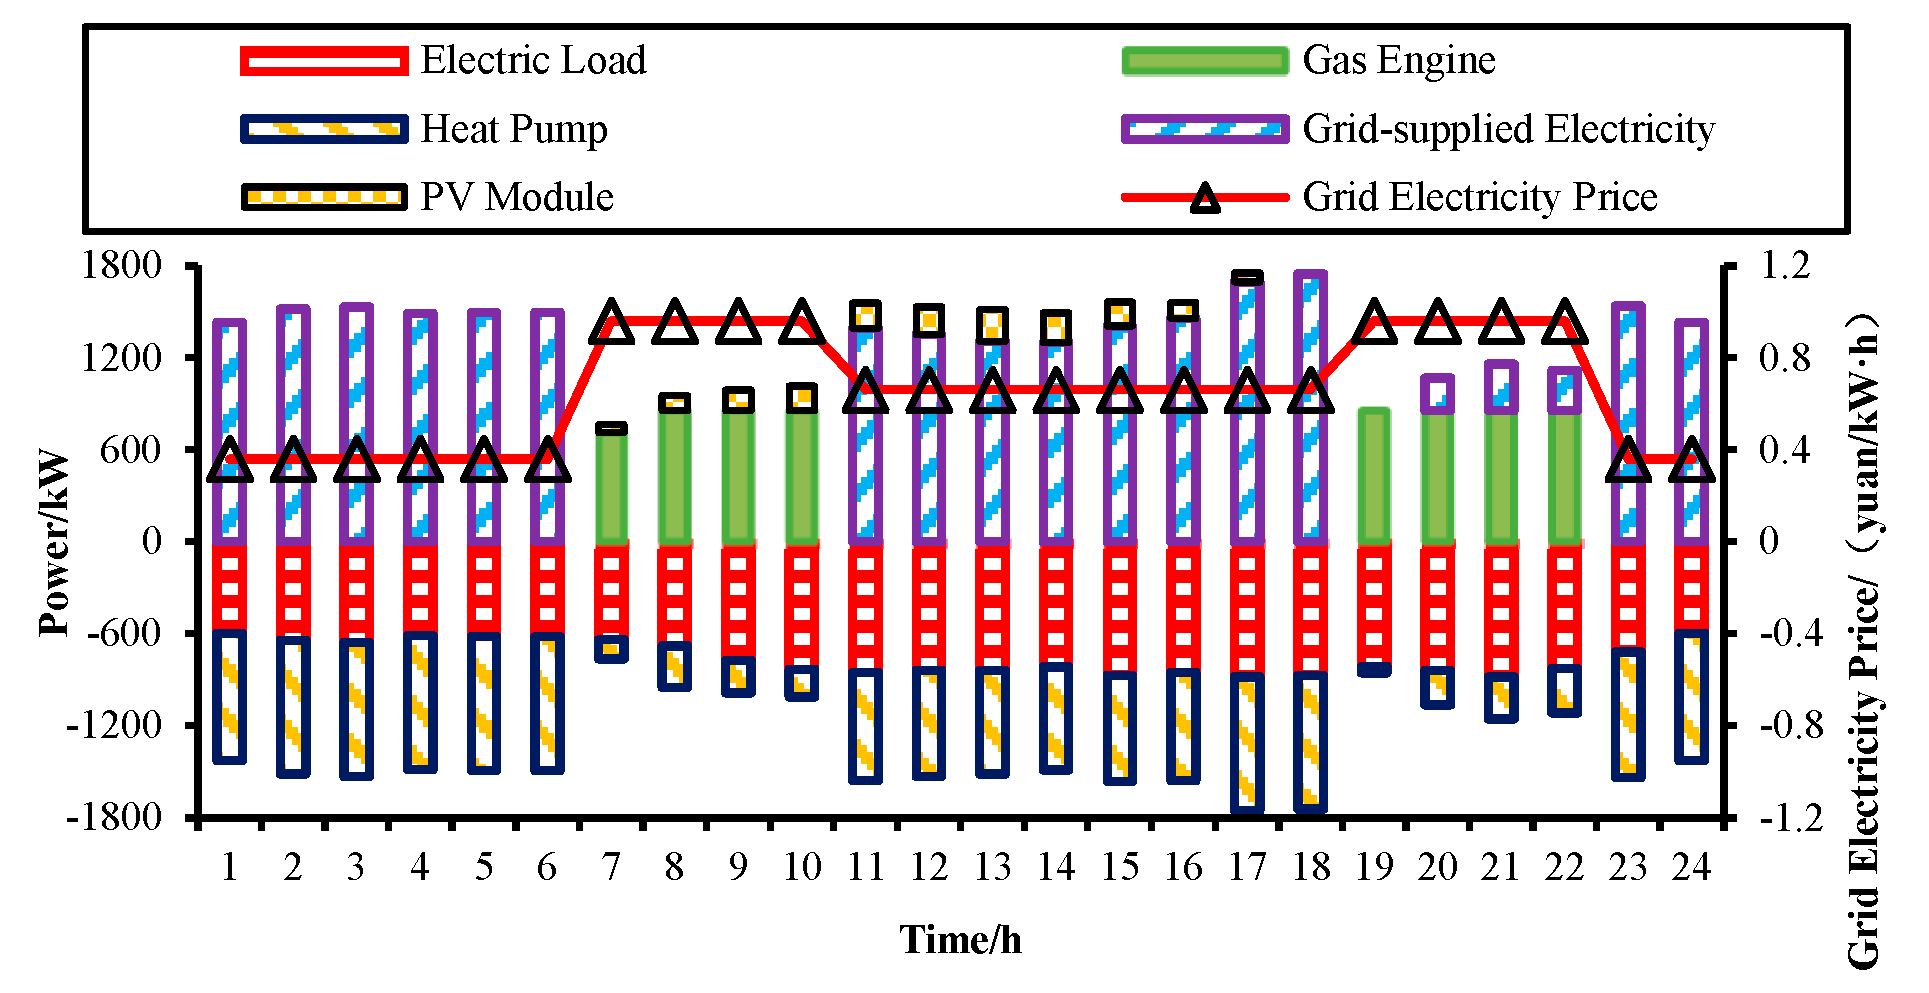
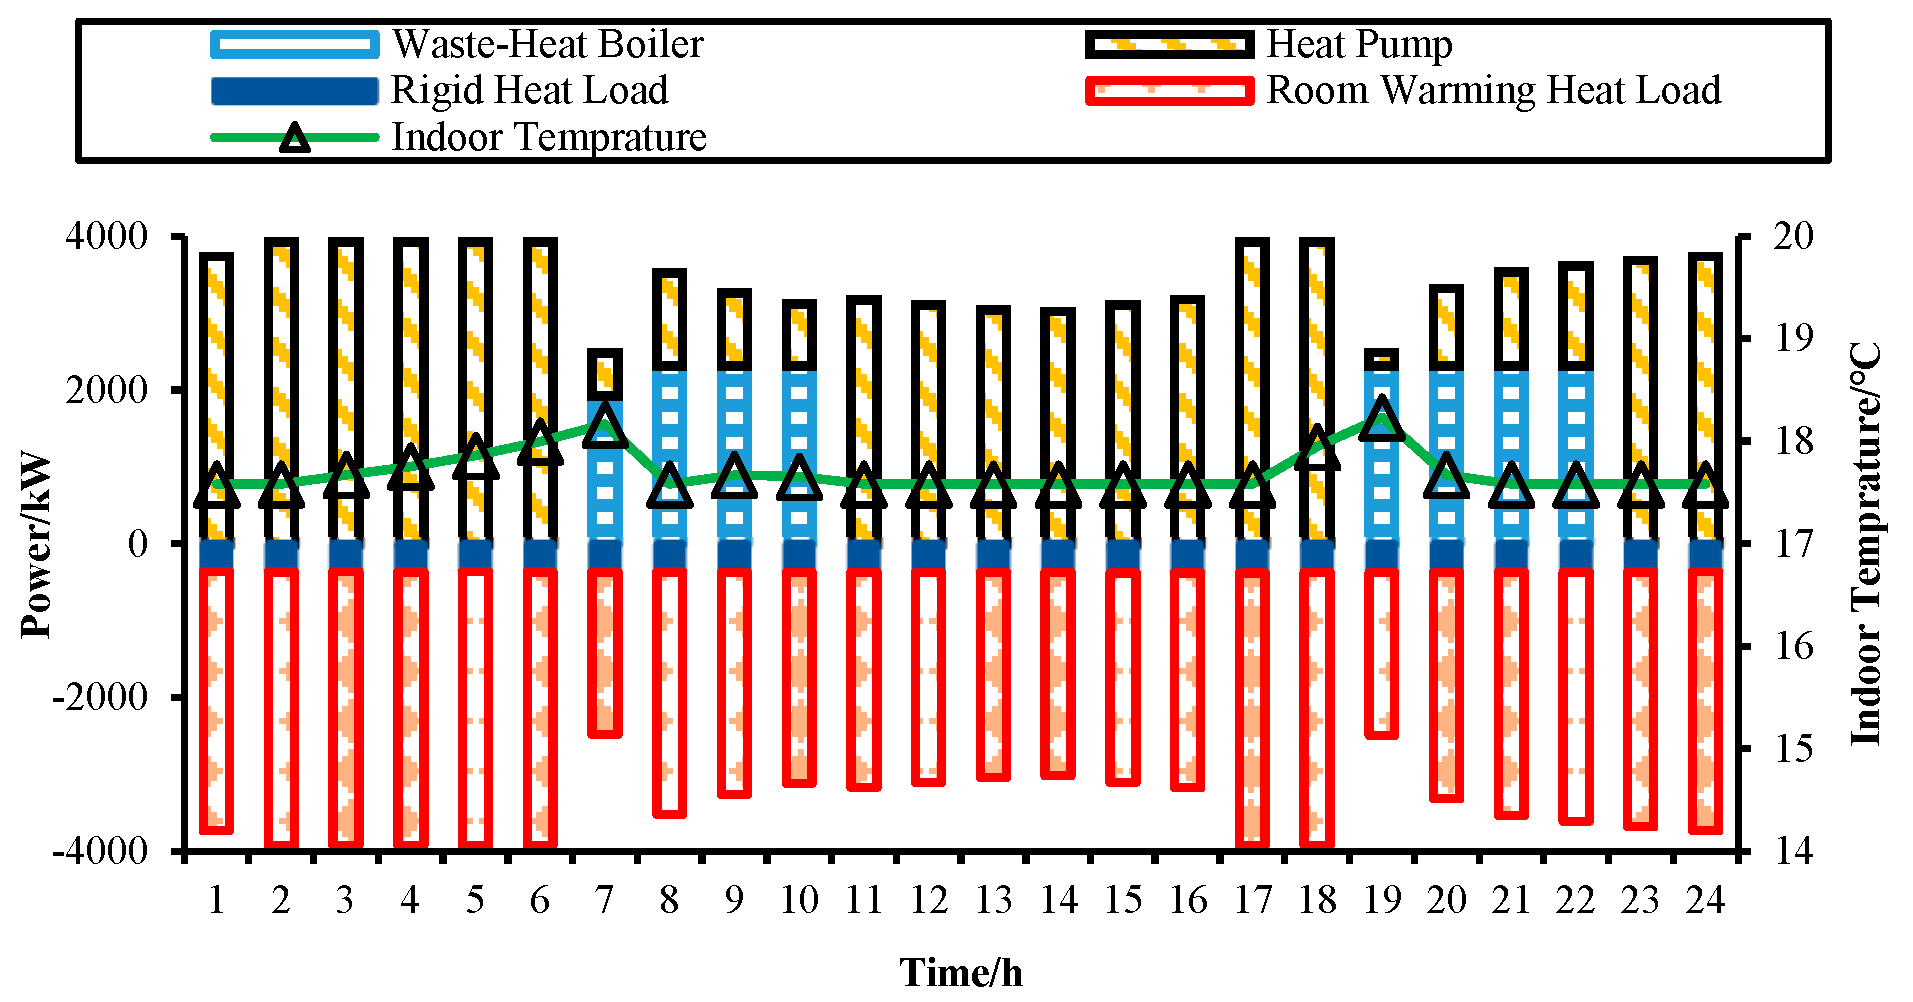
Figure 8 and Figure 9 show the electric and thermal power balance curves, respectively, on typical winter days. The waste-heat boiler and heat pump are put into operation. Since cooling load is not required in winter, the absorption refrigerator is not operated. Similarly, during the peak-electricity price period, the gas engine generates electricity, which in combination with the PV module, reduces the high-price electricity amount purchased from the grid. Additionally, with the PV output, the capacity of the gas engine can also be reduced. Due to the high heating demand in winter, both the gas engine and the waste-heat boiler operate close to their rated power limits. When the heating demand exceeds the output power of the waste-heat boiler, it is supplemented by the heat pump. During the flat and valley-electricity price periods, the heat pump replaces the waste-heat boiler to continuously supply heat, while the electric load and electricity required by the heat pump are provided from the grid and supplemented by the PV module. In winter, high thermal demand exists due to the heat load. The heat pump runs from 1 to 24 hours in a whole daytime and operates only under a low load when the gas engine and waste-heat boiler are operating. As observed, the indoor temperature can be maintained between 17 °C and 19 °C.

4. Sensitivity Analysis

4.1. Ggas Price
To explore the relationship between optimally sized results and the impact factors, a sensitivity study has been carried out. The gas price of the CHP unitis chosen as the main impact factors.
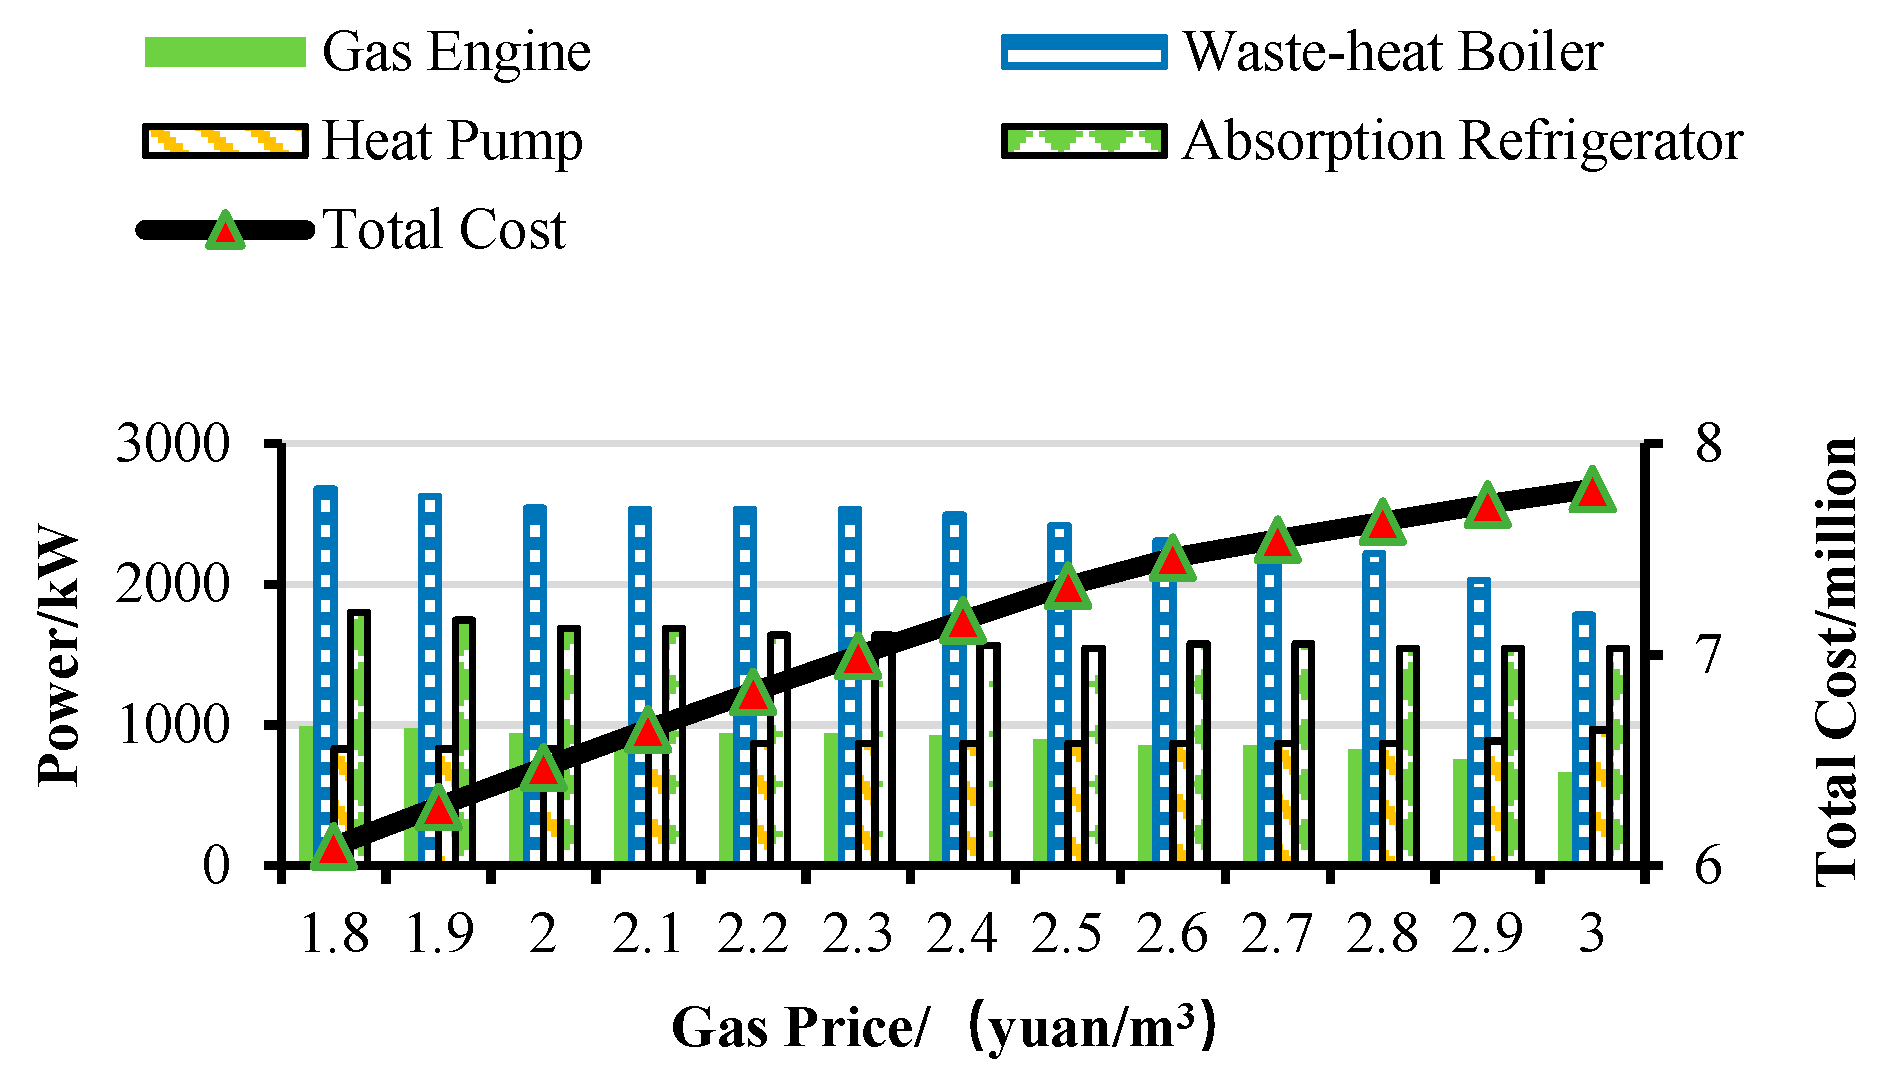
The price of natural gas is an important factor that has an impact on the optimal allocation and capacity sizing results for the IES. In this section, the optimal sized capacity response and sensitivity of the total annual cost to the gas price will be evaluated. Figure 10 shows the trend graph.
The optimal sized capacity and total annual cost of the IES vary with the natural gas price. The total annual cost is positively correlated with the gas price but the trend is nonlinear. As the gas price increases, the total annual cost growth rate decreases. When the gas price increases by 0.3 RMB yuan/m3 from 2.4 RMB yuan/m3 to 2.7 RMB yuan/m3, the annual cost growth rate is almost 5.49%. When the gas price increases by 0.3 RMB yuan/m3 from 2.7 RMB yuan/m3 to 3.0 RMB yuan/m3, the annual cost growth rate is only 3.34%. When the gas price drops below 2.4 RMB yuan/m3, gas-generated electric power is more profitable than purchasing electricity from the grid in the period of flat electricity prices, and the optimal sized capacity and operation time of the gas engine and waste-heat boiler increase, while the total annual operation cost also exhibits a steeper downward trend.
The optimally sized capacity variation trends of the gas engine and waste-heat boiler are similar. When the gas price increases, the fuel cost of the gas engine and waste-heat boiler greatly increases, and the optimallysized capacity decreases. The capacity of the heat pump exhibits the opposite trend. Due to the limitation of the thermal power balance, the sized capacity of the waste-heat boiler and the rated thermal power are reduced. The thermal power of the heat pump needs to be increased to achieve a system thermal power balance. Due to the cooling power balance, the optimally sized capacity of the absorption refrigerator only slightly decreases with an increase in gas price and then remains stable at 1,560 kW when the gas price exceeds 2.4 RMB yuan/m3.
Preprints 90066 g010

4.2. Peak-Valley Price Gap of Grid Supplied Power

To examine the impact of the peak-valley price gap on the optimally allocated capacity and annual total cost, twomore scenarios are defined. The normal price in the additional two scenarios remains at 0.66 RMB yuan/kW·h, and a 300kW PV module is installed in the building, which is the same as scenario 5.
Scenario 6: No difference between the peak-price and valley-price.
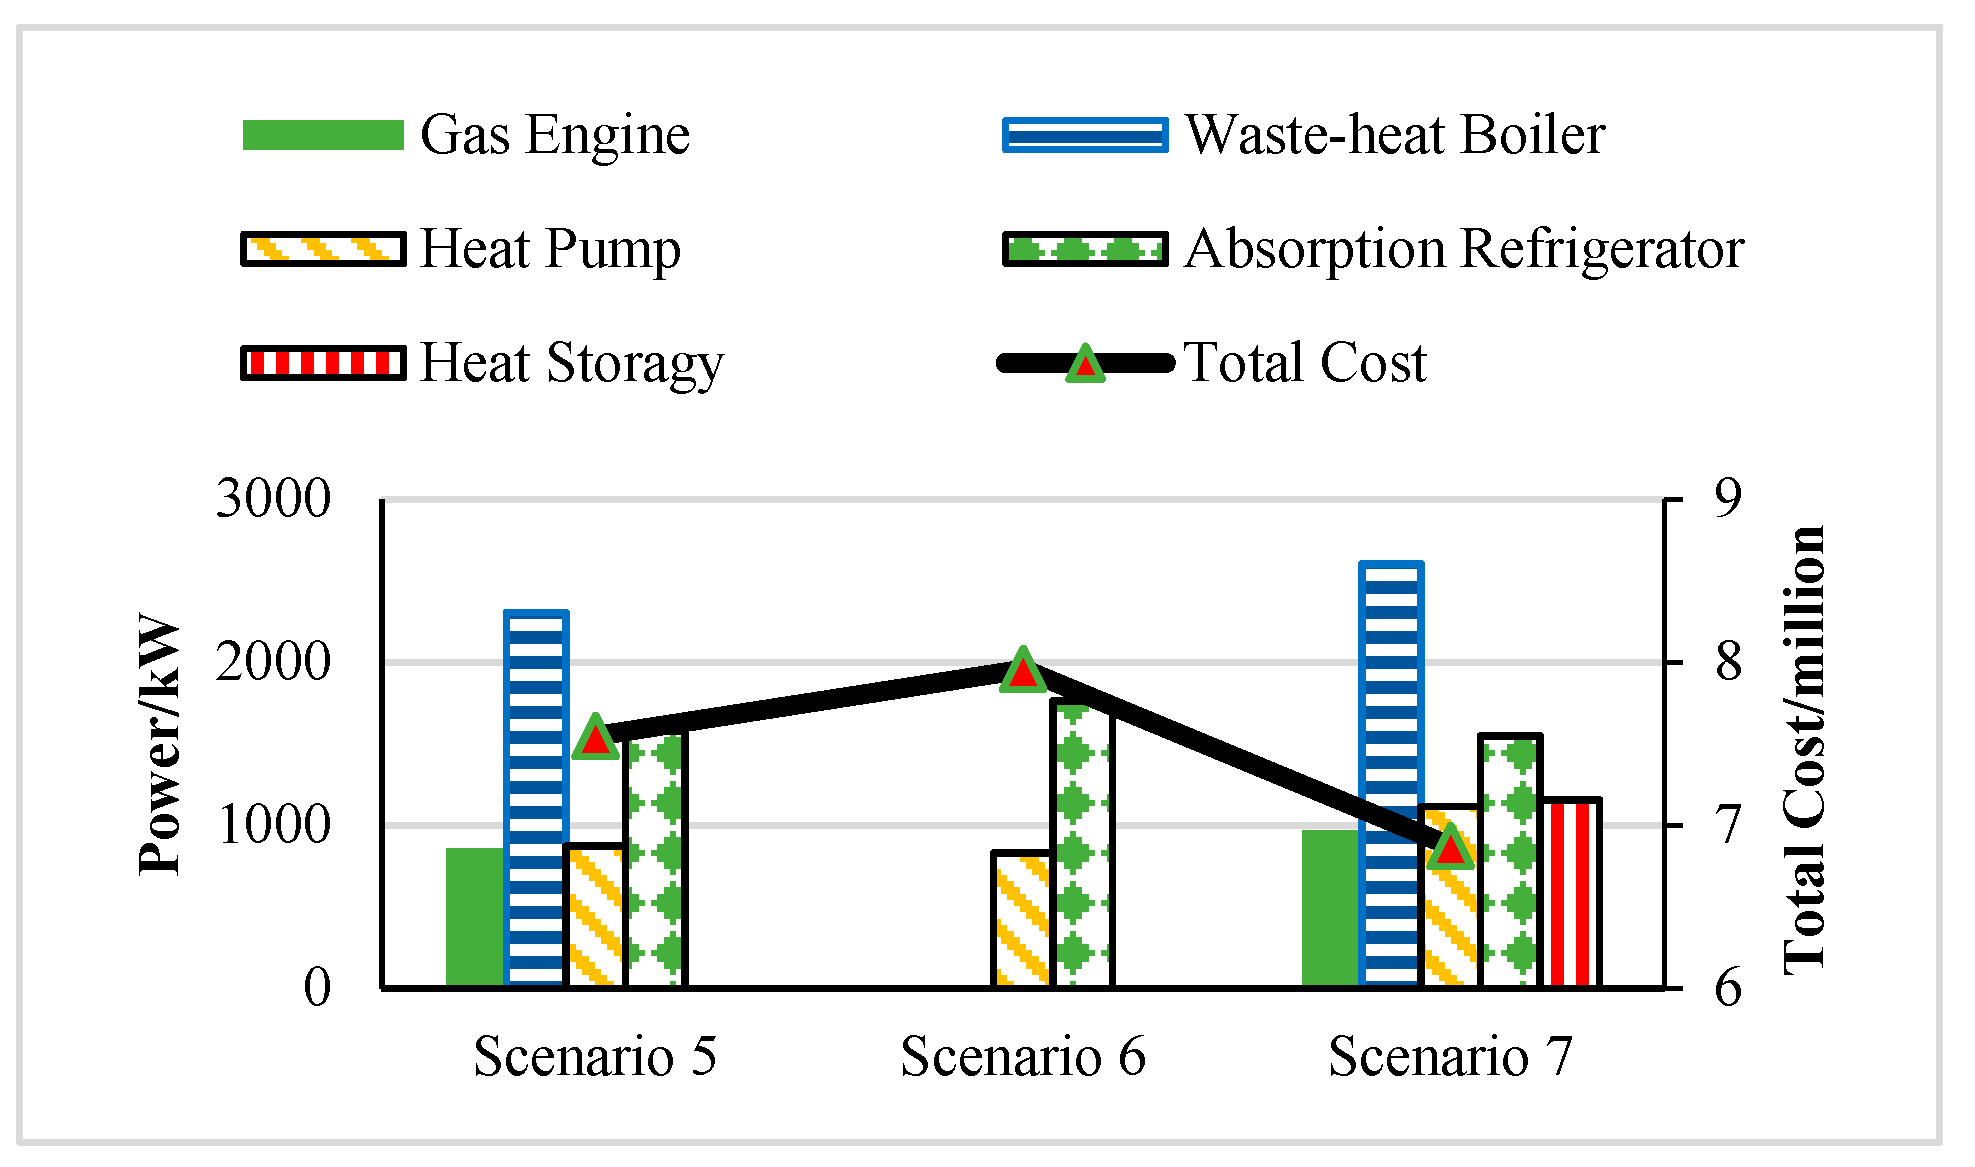
Scenario 7:The peak-valley price gap is defined according to a valley electricity price of 0.165 RMB yuan/kW·h and a peak electricity price of 1.155/kW·h from the grid.
The optimally allocated capacity results are shown in Figure 11. In scenario 6, when no peak-valley price gap is observed, the most economical way is to install only a heat pump and absorption refrigerator to balance the heat and cooling power.However, the total cost of this scenario is the highest because the electricity price remains constant over time and purchasing electricity from the grid is more economical. In scenario 7, the gap between the peak and valley electricity prices is large. During the peak time, satisfyingthe power supply demand is more economical for the CHP unit, while during the valley time, purchasing power from the grid is more economical.To satisfy the cooling and thermal power demands in buildings, heat storage has become aneconomical method.The capacities of the gas engine and waste-heat boiler increase because less electricity is purchased from the grid during the peak-price period. Therefore, in scenario 7, the EHis equipped with the largest number of equipment types. However, the full use of low-priced electricity results in the lowest total cost. It is also worth mentioning that although the gap between the peak and valleypriceshas economic benefits, heat storage is preferred over electricity storage due to its cost advantages.

5. Conclusions

Based on the building energy demand dominated by human indoor activities, this paper proposes an allocation and capacity sizing method for building-typeIES with economy as the optimization objective considering the indoor comfortable temperature of the human body. The following conclusions can be obtained from the above research:
(1) The operation of an IES should fully utilize the complementary functions of various types of equipment, such as those in gas-electricity generation, PV modules and grid purchase, and waste-heat boilers and heat pumps, to achieve the best economy.
(2) A CHP unit design should not be based on the maximum heat load to determine the capacity of the gas engine and waste-heat boiler. Instead, a CHP unit design should be based on the goal that its operating output rate should be as high as possible, and the generated power is consumed locally by the building and not transferred to the grid.
(3) Installing building PV modules leads to reducing the optimally sizedcapacity of IES equipment, pollutant emissions, and total cost, which is worth advocating and promoting.
(4) The gas price and grid electricity peak-valley price gap are important factors that influence the total annual operation cost and capacity sizing. The lower is the gas price, the higher is the thermal power ratio and the lower is the total annual operation cost. A large gap between the peak and valley electricity prices is beneficial to reducing the total operating cost, and heat storage is more economical than battery energy storage.
(5) With the building-type IES, which is based on the PMV index, the room temperature can be regulated in a comfortable range for human body. With the contribution of PV modules and CHP units, the IES can greatly reduce the dependence on the power grid during peak periods and satisfy demand response.
With the further reform of the electricity side in China, custom power will attract the attention of both customers and electricity retail companies. Not only should custom power pricing models be studied, the decision-making strategy, methodology, as well as the associated law and policy, should be explored further.

Acknowledgments

This work is funded by the 2023 Yunnan Power Grid Co., Ltd. Management Consulting Project (No.: 0500002023080201GH00169).

Conflicts of Interest

The authors declare no conflict of interest.

Appendix A. Parameters

A1. Economic Parameters of the Equipment

Devices Abbreviation Average life/year Minimum load rate Maximum load rate Unit installation capacity cost/ RMB yuan Electric efficiency Thermal efficiency Coefficient of performance
Gas engine MT 30 0.2 1 6000 0.25
Waste-heat boiler WH 20 0 1 125 0.9
Gas-fired boiler GB 15 0 1 340 0.93
Heat pump HP 10 0 1 971 4.5
Absorption refrigerator AC 20 0 1 1100 0.85
Electric refrigerator EC 20 0 1 3000 0.95
Electrical energy storage ES 10 0.2 0.8 2000 0.95 0.2
Thermal energy storage HS 10 0.1 0.9 150 0.9 0.2
Photovoltaic module PV 20 7000 0.95
Note: the energy storage performance coefficient is the charge discharge ratio, which is equal to the energy storage charge discharge efficiency.

A2. Indoor Temperature Constraint Parameters

Category Parameter Value
PMV index parameters Cl1 0.155 m2·°C/W
Cl2 0.067 m2·°C/W
Cl3 0.251 m2·°C/W
M 58.2 W/m2
Building parameters R 1.5 °C/kW
C 5.44 kWh/°C

A3. Power Purchase and Sale Price Curve
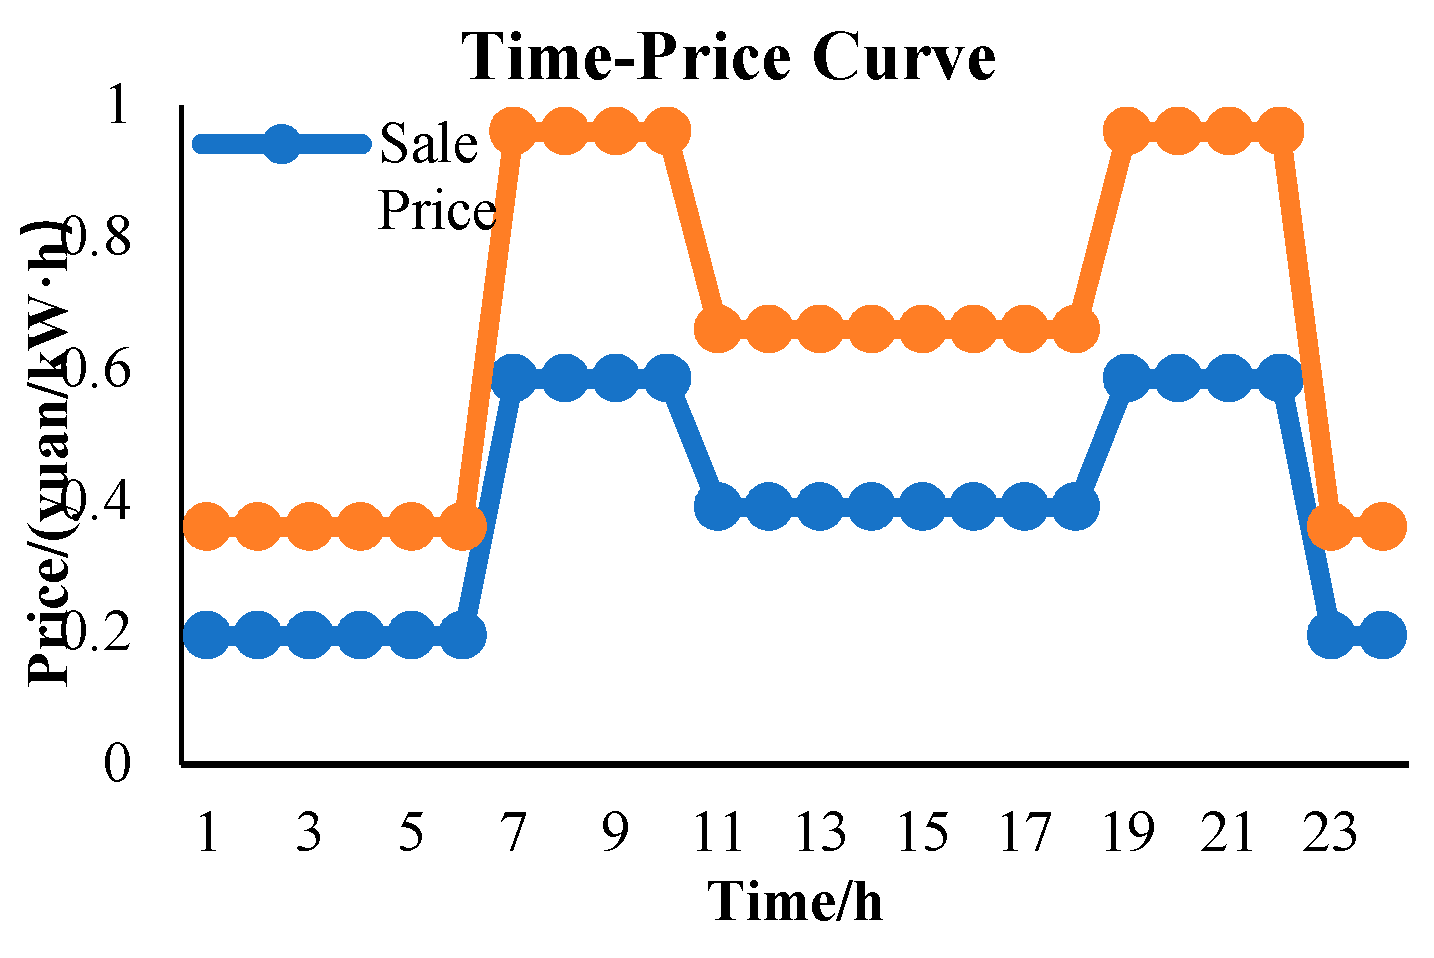
Figure A1. Power purchase and sale price curve
Preprints 90066 g0a1

A4. Typical Daily Rigid Electric Heating Load and Outdoor Temperature
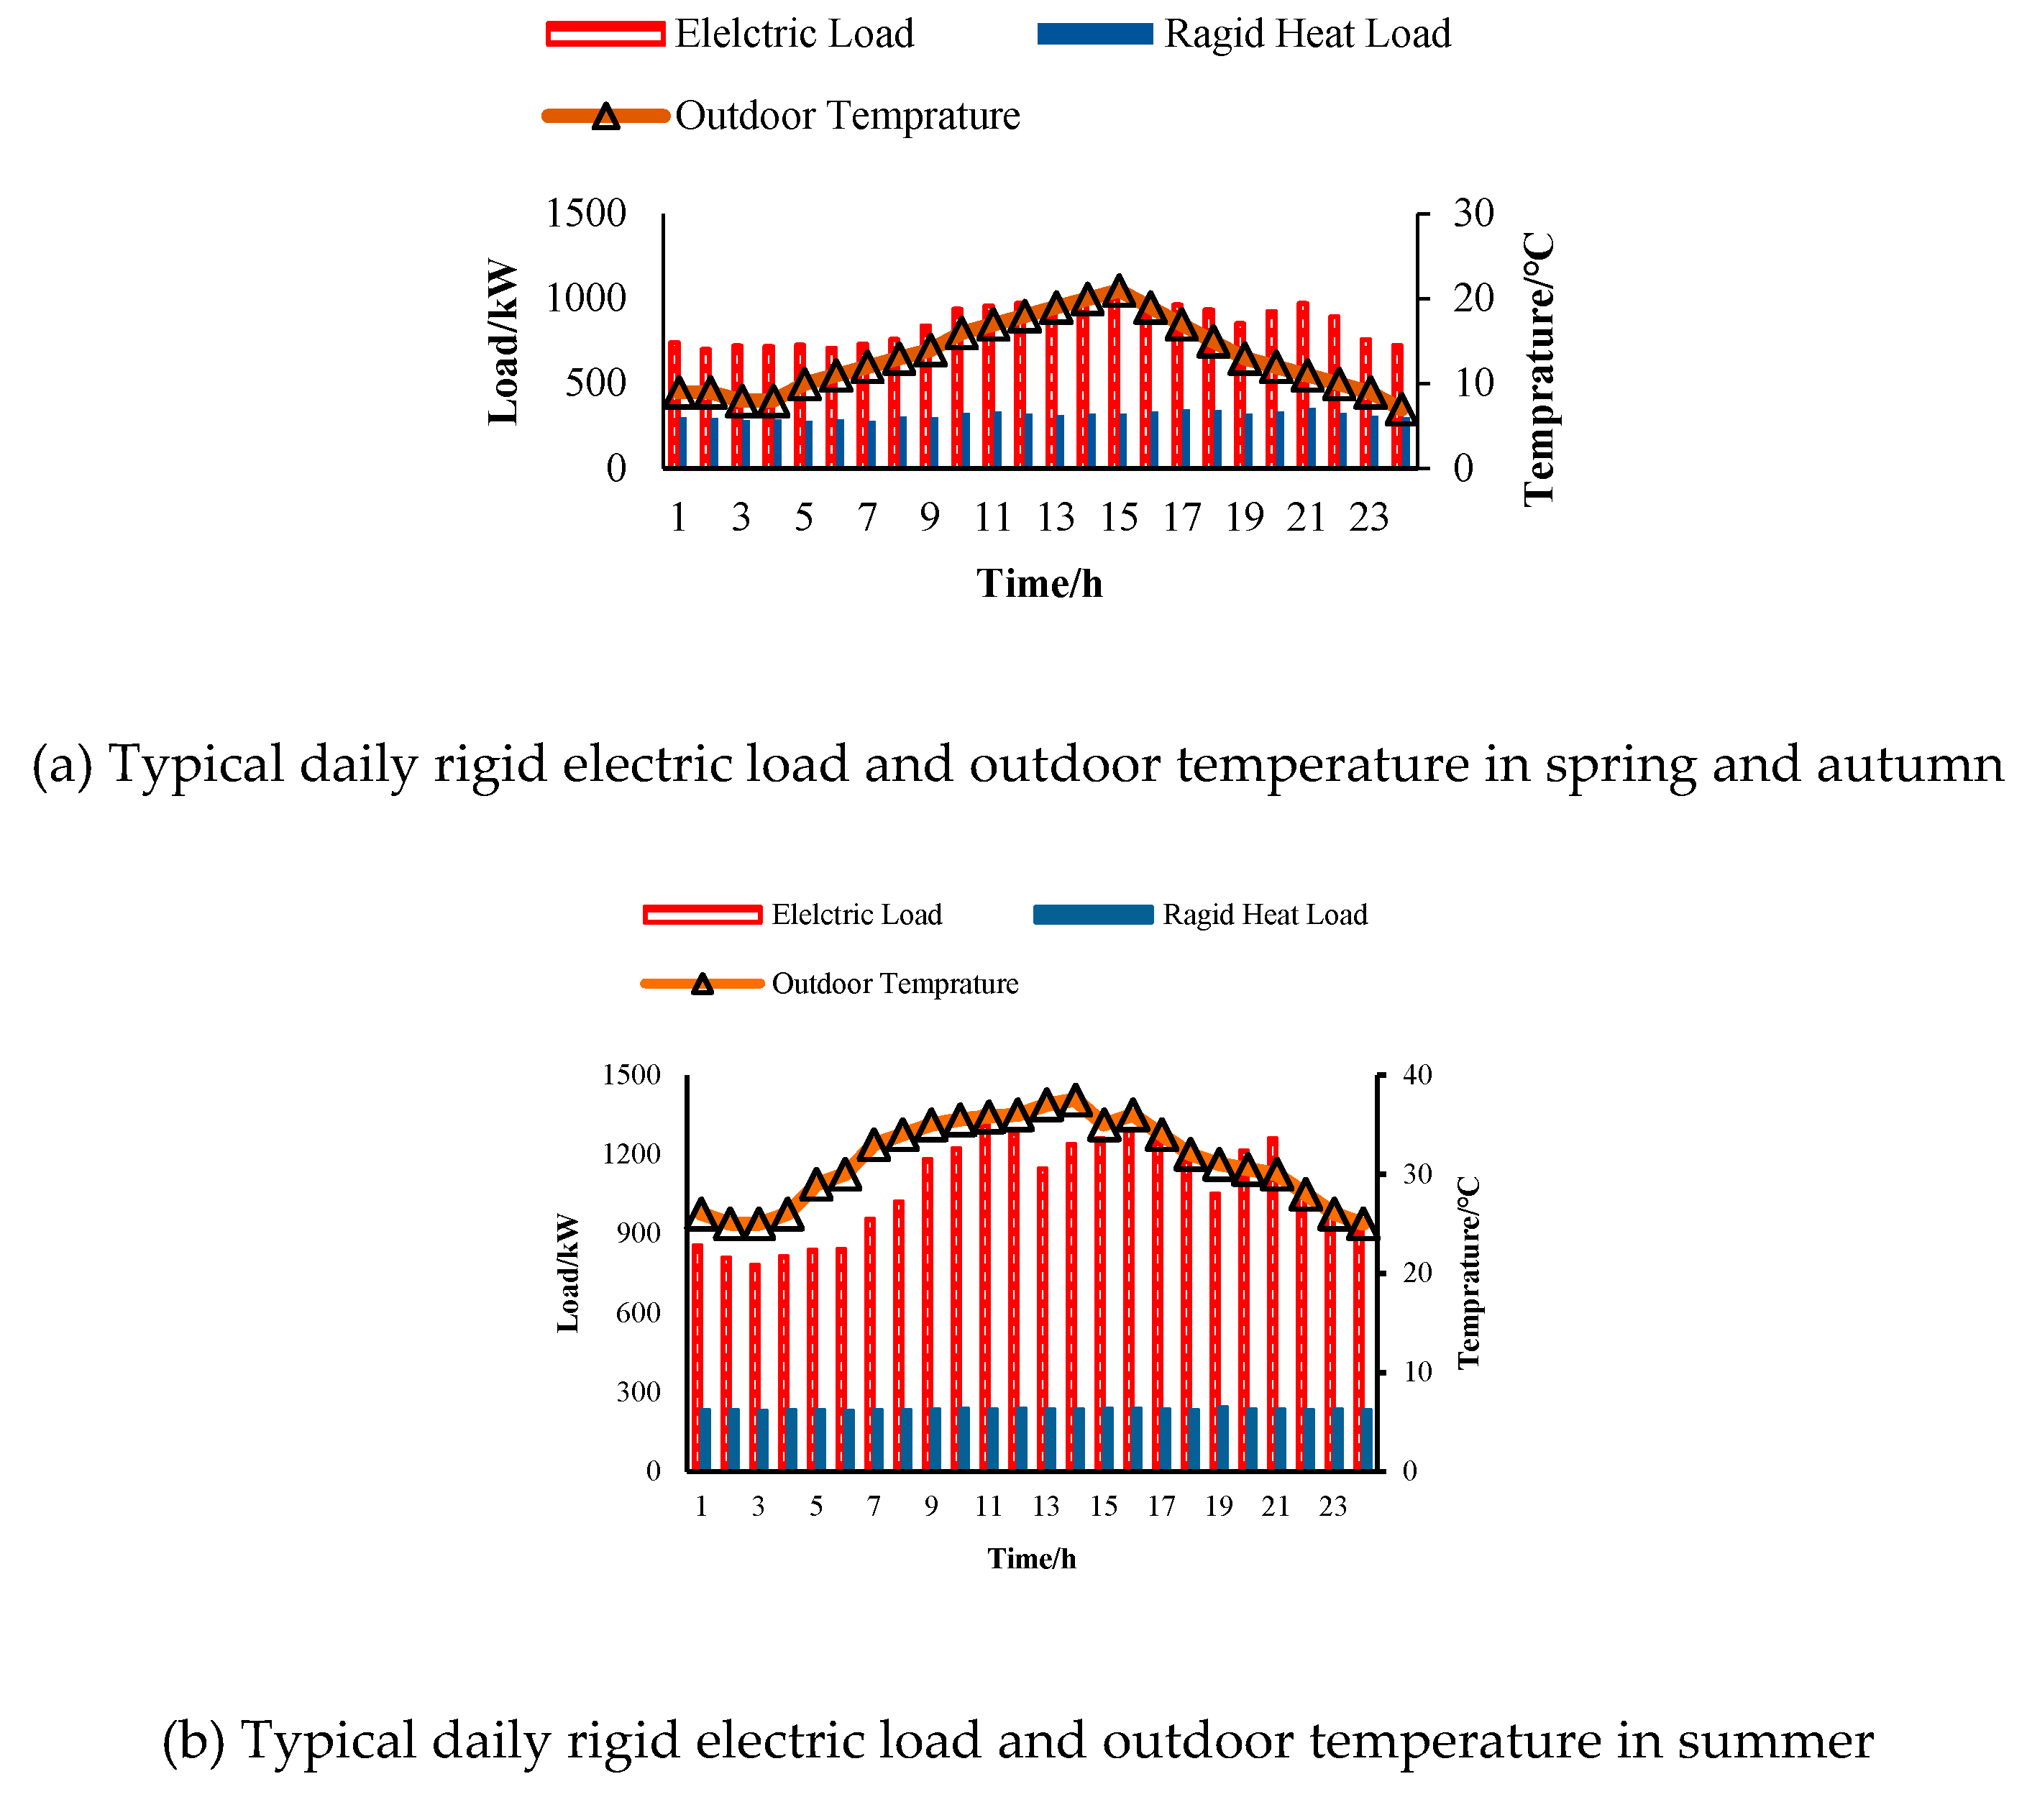
Figure A2. Typical daily rigid electric heating load and outdoor temperature
Preprints 90066 g0a2aPreprints 90066 g0a2b

References

  1. Chen, C.; Liu, S.; Lin, Z. Optimal coordinative operation strategy of the electric-thermal-gas integrated energy system considering CSP plant. IET Energy Systems Integration. 2020, 3, 187–195. [Google Scholar] [CrossRef]
  2. Yin Y; Liu Y; Ma, Y; Lei Y. Integrated energy demand forecasting for the park based on the Transformer algorithm. Integrated intelligent Energy. 2023, 10, 61–69.
  3. Mancarella, P; Chicco, G. Demand response from energy shifting in distributed multi-generation. IEEE Trans. Smart Grid. 2013, 19, 28–38.
  4. Deng, Z; Yang, J; Dong, C. et al. Research on economic dispatch of integrated energy system based on improved krill swarm algorithm. Energy Reports. 2022, 8, 77–86. [CrossRef]
  5. Zhang, X; Karady, G; Ariaratnam,S. Optimal allocation of CHP-based distributed generation on urban energy distribution networks. IEEE Trans. Sustain. Energy. IEEE Trans. Sustain. Energy. 2014, 2, 46–53.
  6. Ren,S; Hu, B; Ning, L. et al. Optimal operation of integrated energy system including large-scale controllable industrial loads. Energy Reports. 2022, 8, 938–949. [CrossRef]
  7. Fu, Y; Sun, Q; Wennersten, R. The effect of correlation of uncertainties on collaborative optimization of integrated energy system. Energy Reports. 2021, 7, 586–592. [CrossRef]
  8. Huang, W; Zhang, N; Yang, J; Wang, Y; Kang, C. Optimal configuration planning of multi-Energy systems considering distributed renewable Energy. IEEE Trans. Smart Grid. 2019, 14, 52–64.
  9. Zhou, Z; Liu, P; Li, Z; Ni, W. An engineering approach to the optimal design of distributed energy systems in China. Appl. Therm. Eng. 2013, 3, 87–96.
  10. Oh, S; Lee, H; Jung, J; Kwak, H. Optimal planning and economic evaluation of cogeneration system. Energy. 2007, 7, 60–71.
  11. Wu, C; Tang, W; Bai, M; Zhang, L; Cai, Y. Energy router based planning of energy internet at user side. Automation of Electric Power Systems. 2017, 4, 20–28.
  12. Bahrami, S; Safe, F. A financial approach to evaluate an optimized combined cooling, heat and power system. Energy and Power Engineering. 2013, 3, 52–62.
  13. Karami, H; Sanjari, M; Hosseinian, S; Gharehpetian, G. An optimal dispatch algorithm for managing residential distributed energy resources. IEEE Trans. Smart Grid. 2014, 5, 2360–2367. [CrossRef]
  14. Dou, X; Shao, Y; Wang, J; Hu Q. Heat-electricity joint bidding strategies for intelligent buildings in intelligent building cluster. International Journal of Electrical Power & Energy Systems. 2021, 129, 1–11.
  15. Zhao, F; Zhang, C; Sun, B; Wei, D. Three-stage collaborative global optimization design method of combined cooling heating and power. Proceedings of the CSEE. 2015, 37, 85–93.
  16. Salimi, M; Ghasemi, H; Adelpour, M; Vaez-Zadeh, S. Optimal planning of energy hubs in interconnected energy systems: a case study for natural gas and electricity. IET Generation, Transmission & Distribution. 2015, 9, 695–707.
  17. Liu, D; Wu, J; Lin, K; L, D; Gong, T. A planning method of integrated energy system based on kriging model. Power System Technology. 2019, 1, 85–94.
  18. Sheikhi, A; Rayati, M; Ranjbar, A. Energy Hub optimal sizing in the smart grid: machine learning approach. IEEE Power&Energy Society Innovative Smart Grid Technologies Conference. 2015, 1-5.
  19. Arcuri, P; Florio, G; Fragiacomo, P. A mixed integer programming model for optimal design of trigeneration in a hospital complex. Energy. 2010, 14, 30–47.
  20. Lara, E; Garcia, F. Review on viability and implementation of residential PV-battery systems: considering the case of dominican republic. Energy Reports 2021, 7, 8868–8899. [CrossRef]
  21. Zhao, W; Chen, J; Hai, T. et al. Design of low-energy buildings in densely populated urban areas based on IoT. Energy Reports 2022, 8, 4822–4833. [CrossRef]
  22. Solano, J; Olivieri, L; Caamaño-Martín, E. Sing the potential of PV hybrid systems to cover HVAC loads in a grid-connected residential building through intelligent control. Applied Energy. 2017, 2, 49–66.
  23. Brahman, S; Honarmand, M; Jadid, S. Optimal electrical and thermal energy management of a residential energy hub integrating demand response and energy storage system. Energy and Buildings. 2015, 90, 65–75. [CrossRef]
  24. Sheikhi, A; Rayati, M; Bahrami, S; Ranjbar, A. Integrated demand side management game in smart energy hubs. IEEE Trans. Smart Grid. 2015, 6, 75–83.
  25. Tasdighi, M; Ghasemi, H; Rahimi-Kian, A. Residential microgrid scheduling based on smart meters data and temperature dependent thermal load modeling. IEEE Trans.Smart Grid. 2014, 3, 49–57.
  26. Mei, X; Song, M. An autonomous hierarchical control for improving indoor comfort and energy efficiency of a direct expansion air conditioning system. Applied Energy. 2018, 4, 50–63.
  27. Westner, G; Madlener, R. Investment in new power generation under uncertainty: benefits of CHP vs. condensing plants in a copula based analysis. Energy Econ. 2012, 34, 31–44. [CrossRef]
  28. Sheikhi, A; Ranjbar, A; Oraee, H. Financial analysis and optimal size and operation for a multicarrier energy system. Energy and Buildings. 2012, 7, 7,1–8.
  29. Rienze, F; Ahcin, P; Andersson, G. Valuing investments in multi-energy conversion, storage, and demand-side-management systems under uncertainty. IEEE Trans. Sustain. Energy, 2011, 2, 194–202. [CrossRef]
  30. Ceseña, E; Capuder, T; Mancarella, P. Flexible distributed multi-energy generation system expansion planning under uncertainty. IEEE Trans. Smart Grid. 2016, 3, 48–57.
  31. Zhang H; Wen, F; Zhang, C; Meng, J; Lin, G; Dang S. Operation optimization model of home energy hubs considering comfort level of customers. Automation of Electric Power Systems. 2016, 20, 32–39.
  32. Fanger, P. “Thermal comfort "Copenhagen. Denmark: Danish Techical Press . 1970.
  33. Zeng, G; Tian, Y; Zhao, H; Wang, P. Analysis on the environment and synthesis factors affecting the PMV index. Building Energy Efficiency, 2007, 1, 1–6.
  34. Zhang, W; Lian, J; Chang, C; Kalsi, K. Aggregated modeling and control of air conditioning loads for demand response. IEEE Trans. Power Systems. 2013, 46, 55–64.
  35. Li, W; Zhang, H; Wang, Q; Yang, Q. Characteristics of wind power in Jilin province and the study of wind curtailment reduction policy recommendations. Renewable Energy Resources. 2013, 2, 123–126.
  36. Cui P. Optimal allocation and comprehensive benefit evaluation of energy hubs considering comprehensive demand side response. Hangzhou, China: Zhejiang Univ Press. 2018.
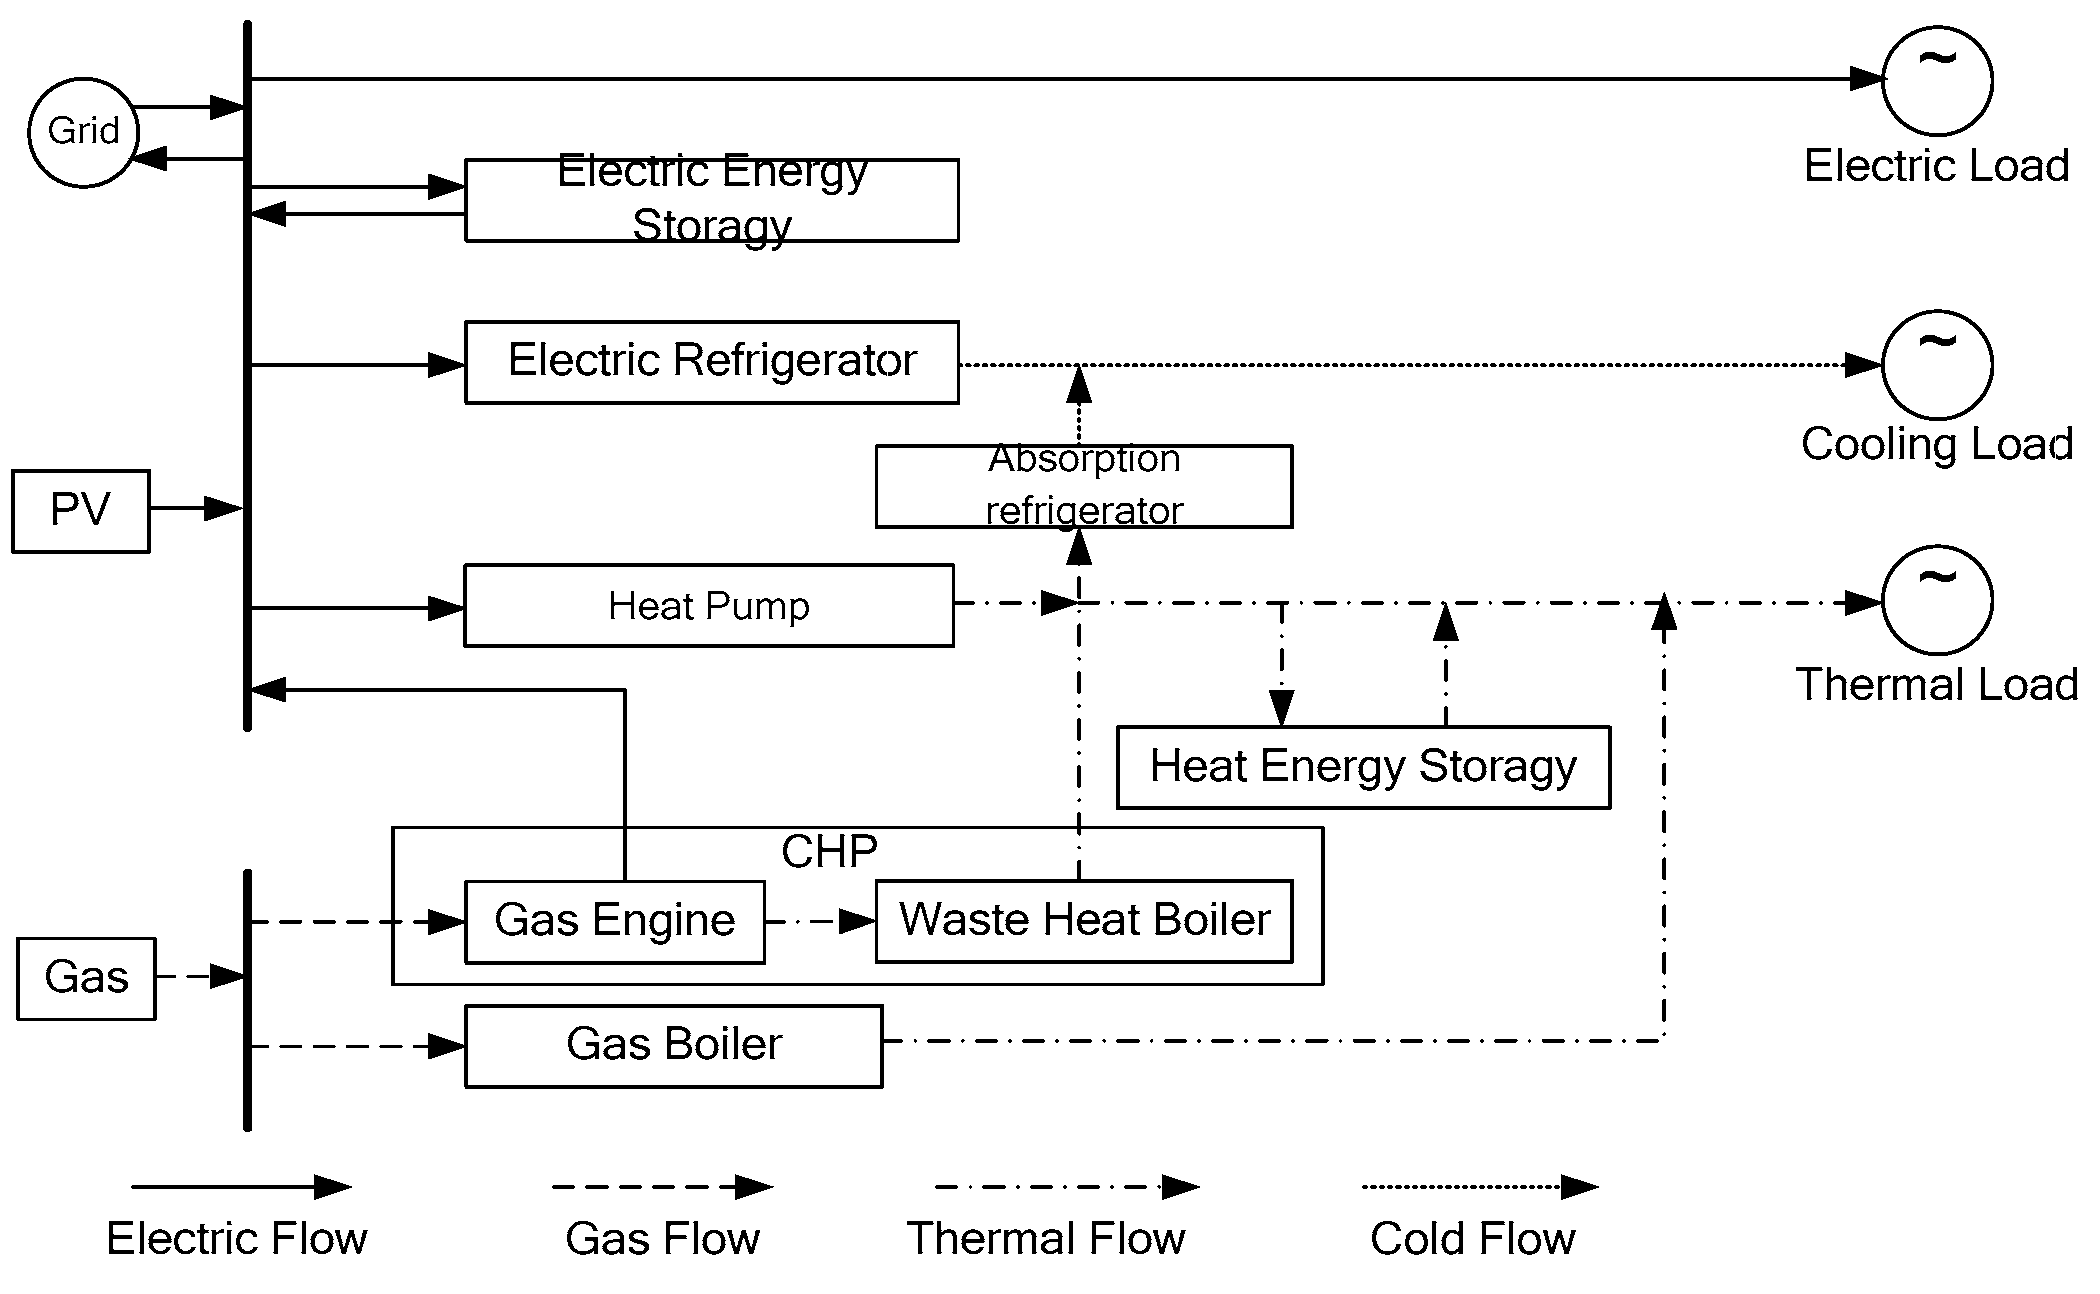
Figure 1. Structure of a building-type IES.
Preprints 90066 g001
Figure 2. Indoor comfortable temperature constraints in different seasons.
Preprints 90066 g002
Figure 3. Flowchart of modeling and solution.
Preprints 90066 g003
Figure 4. Electrical power balance in spring and autumn in scenario 5.
Preprints 90066 g004
Figure 5. Thermal power balance in spring and autumn in scenario 5.
Preprints 90066 g005
Figure 6. Electrical power balance in summer in scenario 5.
Preprints 90066 g006
Figure 7. Thermal power balance in summer in scenario 5.
Preprints 90066 g007
Figure 8. Electrical power balance in winter in scenario 5.
Preprints 90066 g008
Figure 9. Thermal power balance in winter in scenario 5.
Preprints 90066 g009
Figure 10. Gas price sensitivity
Preprints 90066 g010
Figure 11. Grid supplied peak and valley electricity price sensitivity
Preprints 90066 g011
Table 1. Optimally sized capacity (scenarios 1-3)
Scenario Optimally sized capacity/kW Thermal storage power/capacity
kW/kWh
Gas engine Waste-
heat boiler
Heat pump Absorption refrigerator
Scenario 1 936.7 2529.1 871.7 1579.3 0
Scenario 2 1299.5 3508.7 0 1579.8 1822.6/3645.2
Scenario 3 1354.4 3656.8 0 1580.1 0
Table 2. Cost comparison of scenarios 1-3
Scenario Cost/(year 10000 RMB yuan) Total cost (10,000 RMB yuan/year)
Installation Maintenance Energy fuel consumption
Scenario 1 66.8 3.3 711.4 781.5
Scenario 2 78.1 3.9 870.3 952.3
Scenario 3 73.3 3.7 890.4 967.4
Table 3. Optimally sized capacity (scenarios4-5)
Scenario Optimallysized capacity/kW
Gas engine Waste-heat boiler Heat pump Absorption refrigerator PV module
Scenario 1 936.7 2529.1 871.7 1579.3 0
Scenario 4 895.7 2418.5 871.7 1579.7 150
Scenario 5 854.7 2307.8 871.7 1580.1 300
Table 4. Cost Comparison of scenarios 1,4,5
Scenario Cost/(year 10000 RMB yuan) Total cost (10,000 RMB yuan/year)
Installation Maintenance Energy fuel consumption
Scenario 1 66.8 3.3 711.4 781.5
Scenario 4 73.5 3.7 688.7 765.9
Scenario 5 80.2 4.0 666.0 750.2
Disclaimer/Publisher’s Note: The statements, opinions and data contained in all publications are solely those of the individual author(s) and contributor(s) and not of MDPI and/or the editor(s). MDPI and/or the editor(s) disclaim responsibility for any injury to people or property resulting from any ideas, methods, instructions or products referred to in the content.
Copyright: This open access article is published under a Creative Commons CC BY 4.0 license, which permit the free download, distribution, and reuse, provided that the author and preprint are cited in any reuse.
Alerts
Prerpints.org logo

Preprints.org is a free preprint server supported by MDPI in Basel, Switzerland.

Subscribe

© 2025 MDPI (Basel, Switzerland) unless otherwise stated