1. Introduction
Opto-magnetic imaging spectroscopy (OMIS) is the third generation of optical methods for detecting skin cancer (melanoma). The first method used by doctors is the visual investigation and their experience. In order to increase accuracy, a dermoscope was developed and doctors whose receiving a two-day course on dermoscopy achieved an accuracy up to 20% [1,2]. However, it is necessary to have many years of experience with the dermoscope in order to achieve satisfactory accuracy for screening (around 90-95%) and diagnostic (around 95-99%). In order to achieve this result, with several days of training, a method was developed and a device based on spectrum hyper convolution, optomagnetic imaging spectroscopy (OMIS), was built.
In order to achieve the set of goals, in the last fifteen years’ research has been carried out on the characterization of skin and melanoma using AFM (Atomic Force Microscopy) and MFM (Magnetic force Microscopy). [3,4] The studies demonstrated excellent results: separation of normal tissue from inflamed surrounding tissue, pre-cancerous and cancerous tissues was 100%. However, the nanotechnology approach using AFM/MFM was not suitable for broader, clinical use because it took 4-6 hours (depend of image resolution) to characterize one in vitro sample of size 1.0 x 1.0 μm. In addition, the methodology is expensive significantly hampering broader, clinical application, due to unacceptable economic burden on the healthcare system. Due to the reasons stated above, the development of a new method was started based on the obtained results of the nanotechnological method.
The proof-of-principal results were obtained using MFM and based in the magnetic (paramagnetic and diamagnetic) properties of the tissues, the same principles were the basis for the development of the new method. The requirement was that a 30 x 30 mm surface should be imaged with one recording (due to the approximated size of the mole) and that the paramagnetic and diamagnetic properties of the skin should be identified. In order to achieve this, we transferred our knowledge from nanotechnology to a new method OMIS by replacing the mechanical cantilever (AFM/MFM) with light (OMIS). In 2010 the first prototype of OMIS device was made and the first initial study on 118 cases was completed (
Table 1). [3].
Results shown in
Table 1 suggest that the MFM results are unequivocal, i.e. there is no overlapping between values for any of the four categories of the samples. In the case of histopathological slides, with the OMIS method there is an overlap between skin diseases ("inflammatory") and benign lesions ("pre-cancer"), because the differences in values between the categories are smaller and in spite that the SD (standard deviation) is smaller than with MFM. Also, negligible at 0.1%, but still existing, a borderline overlap of benign lesions and malignant lesions was observed 4.4+0.9 = 5.3 and 6.1-0.9= 5.2, respectively.
The advantages of the OMIS method when compared to AFM/MFM for cancer detection are multiple. The results are obtained faster, a larger sample surface could be imaged and OMIS methodology is significantly cheaper enabling better integration in the healthcare system and patient care. Encouraged with promising results, and aforementioned advantages over the AFM/MFM further development of the method and its application to other types of epithelial tissues was performed to include cancers of the cervix, colon and oral cavity.
2. Materials and Methods
2.1. OMIS Method
The OMIS is a device based on quantum mechanics and machine learning (ML) for detecting, the physical properties of tissues at the nano level, but within the macroscopic area (30x30 mm) because the mechanical cantilever (sonda) of MFM is replaced with light. It is based on light-matter interactions between light (electromagnetic phenomenon) and valence electrons in the sample (covalent bonds, hydrogen bonds, ion-electron interaction, and van der Waals interactions). OMIS is a spectroscopy method that measures the ratio of unpaired (paramagnetism) and paired electrons (diamagnetism) of a sample by leveraging the known aspects of light-matter interactions [
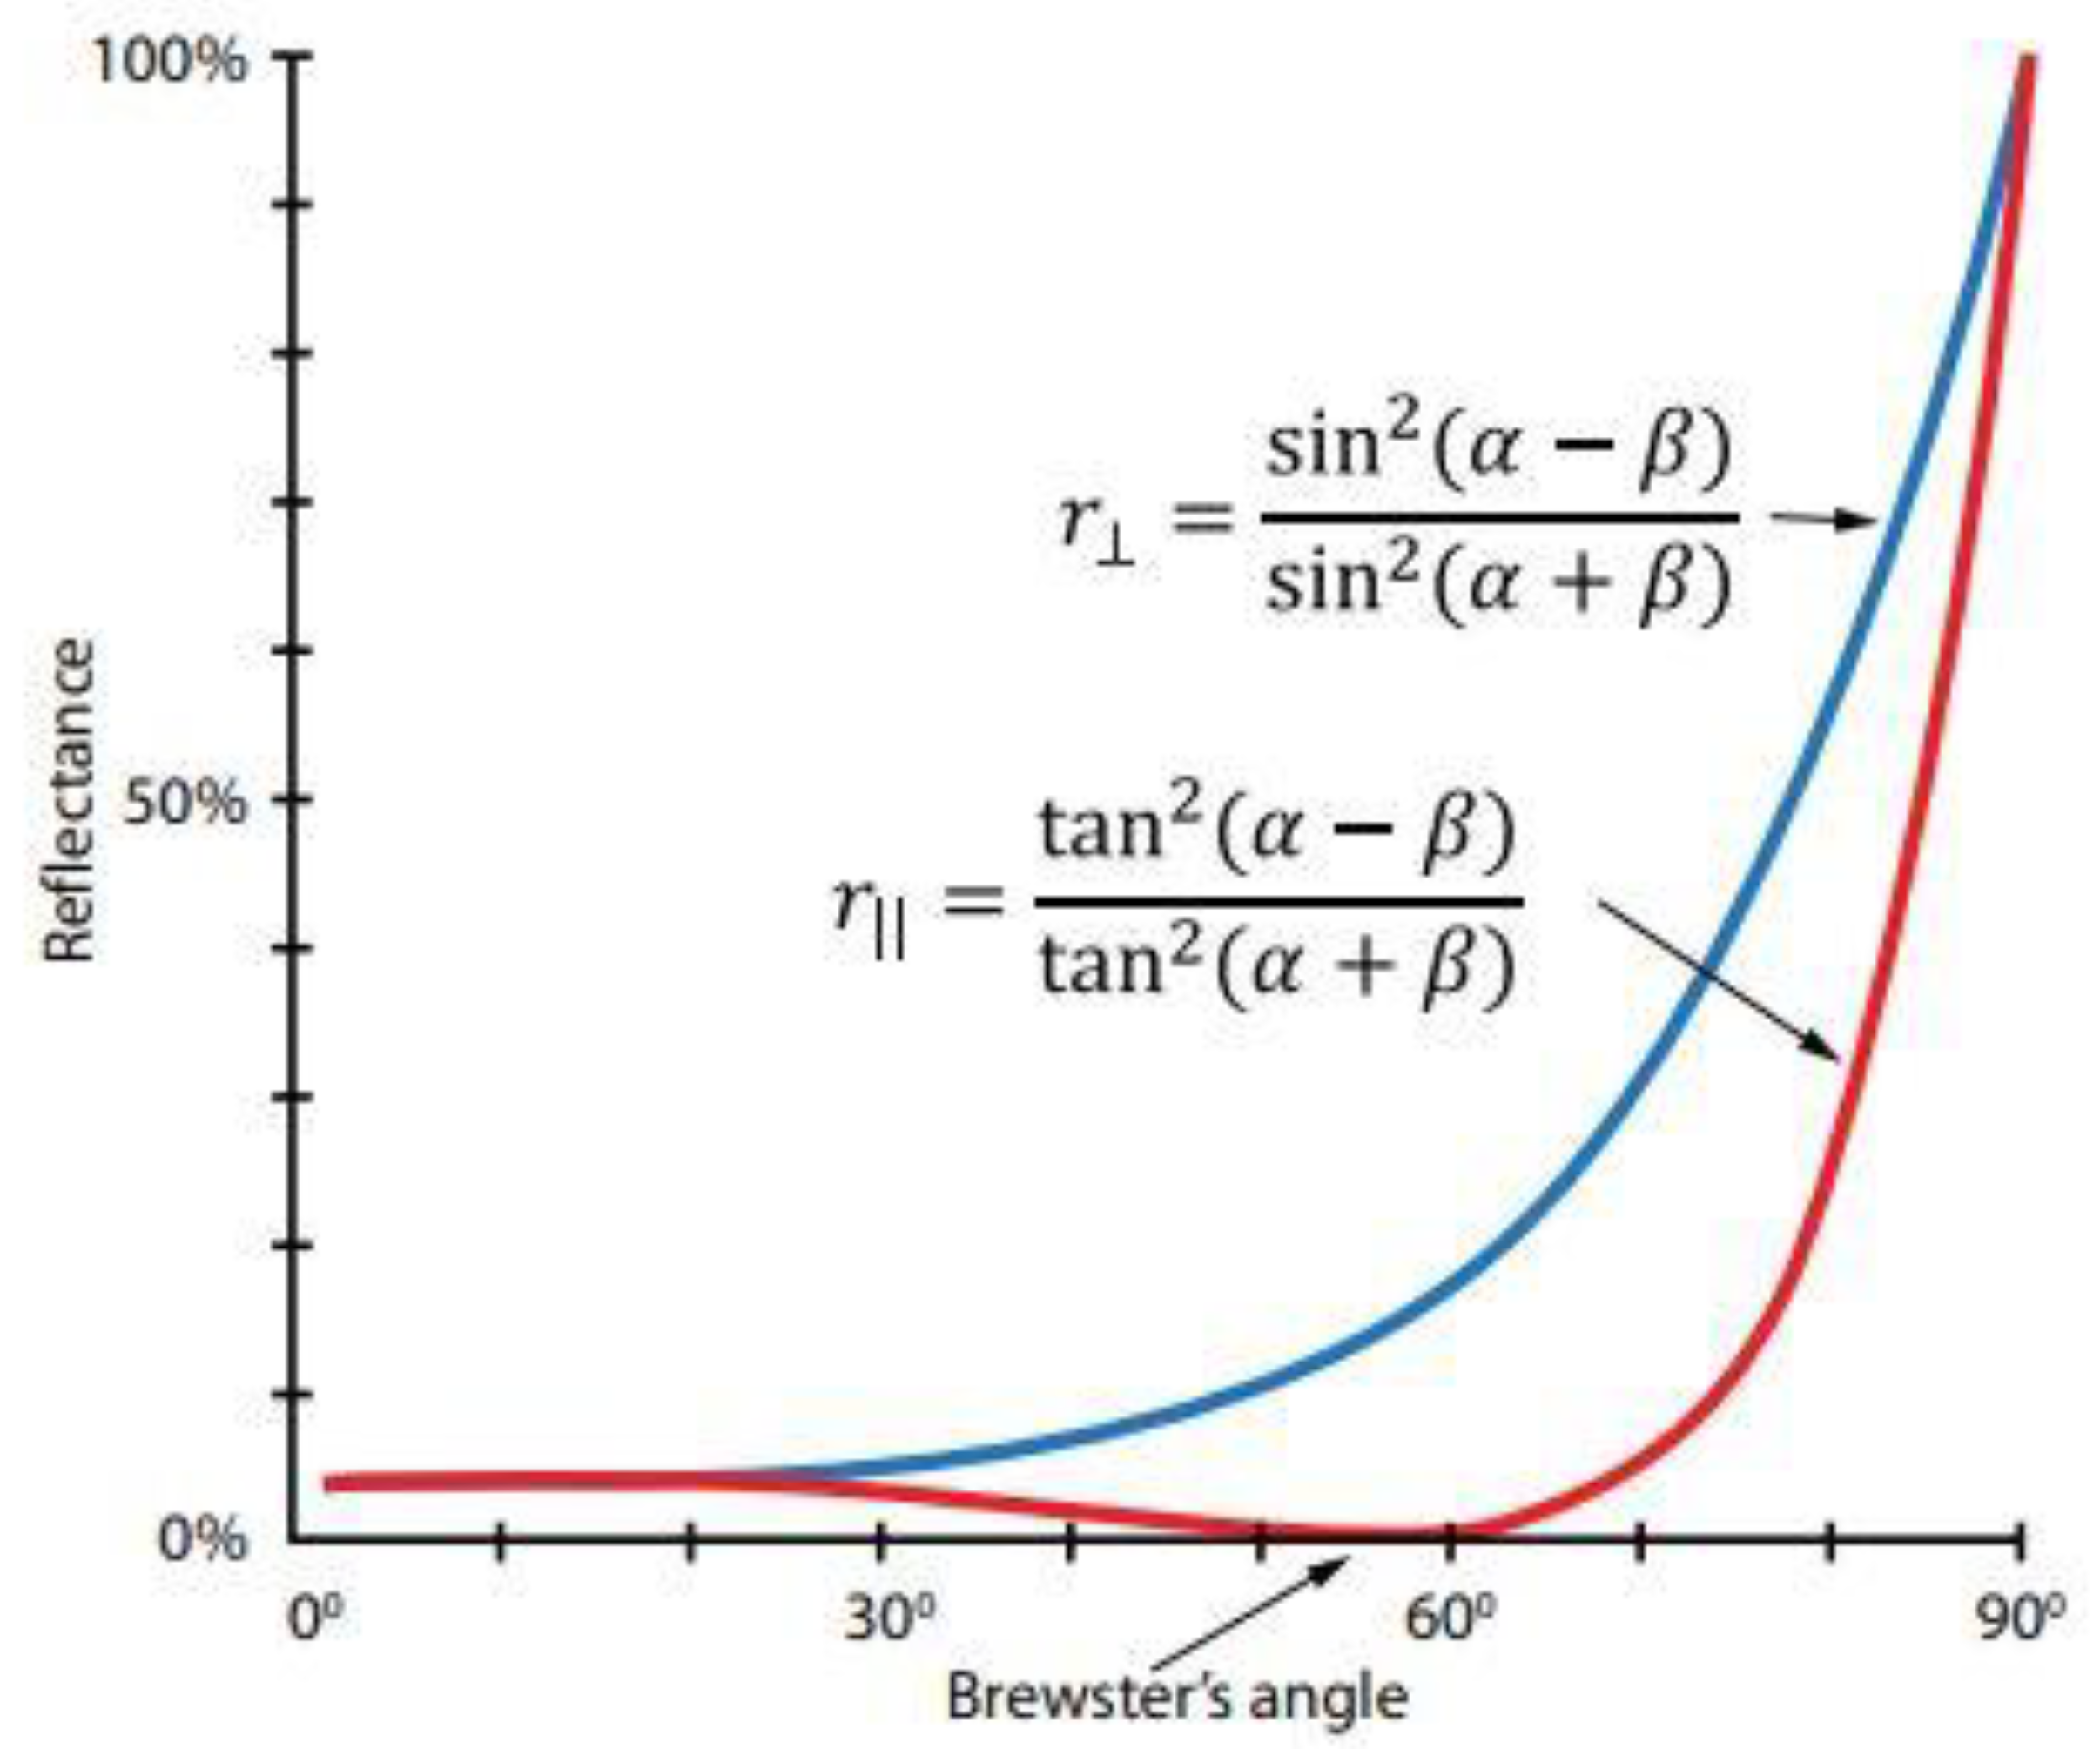
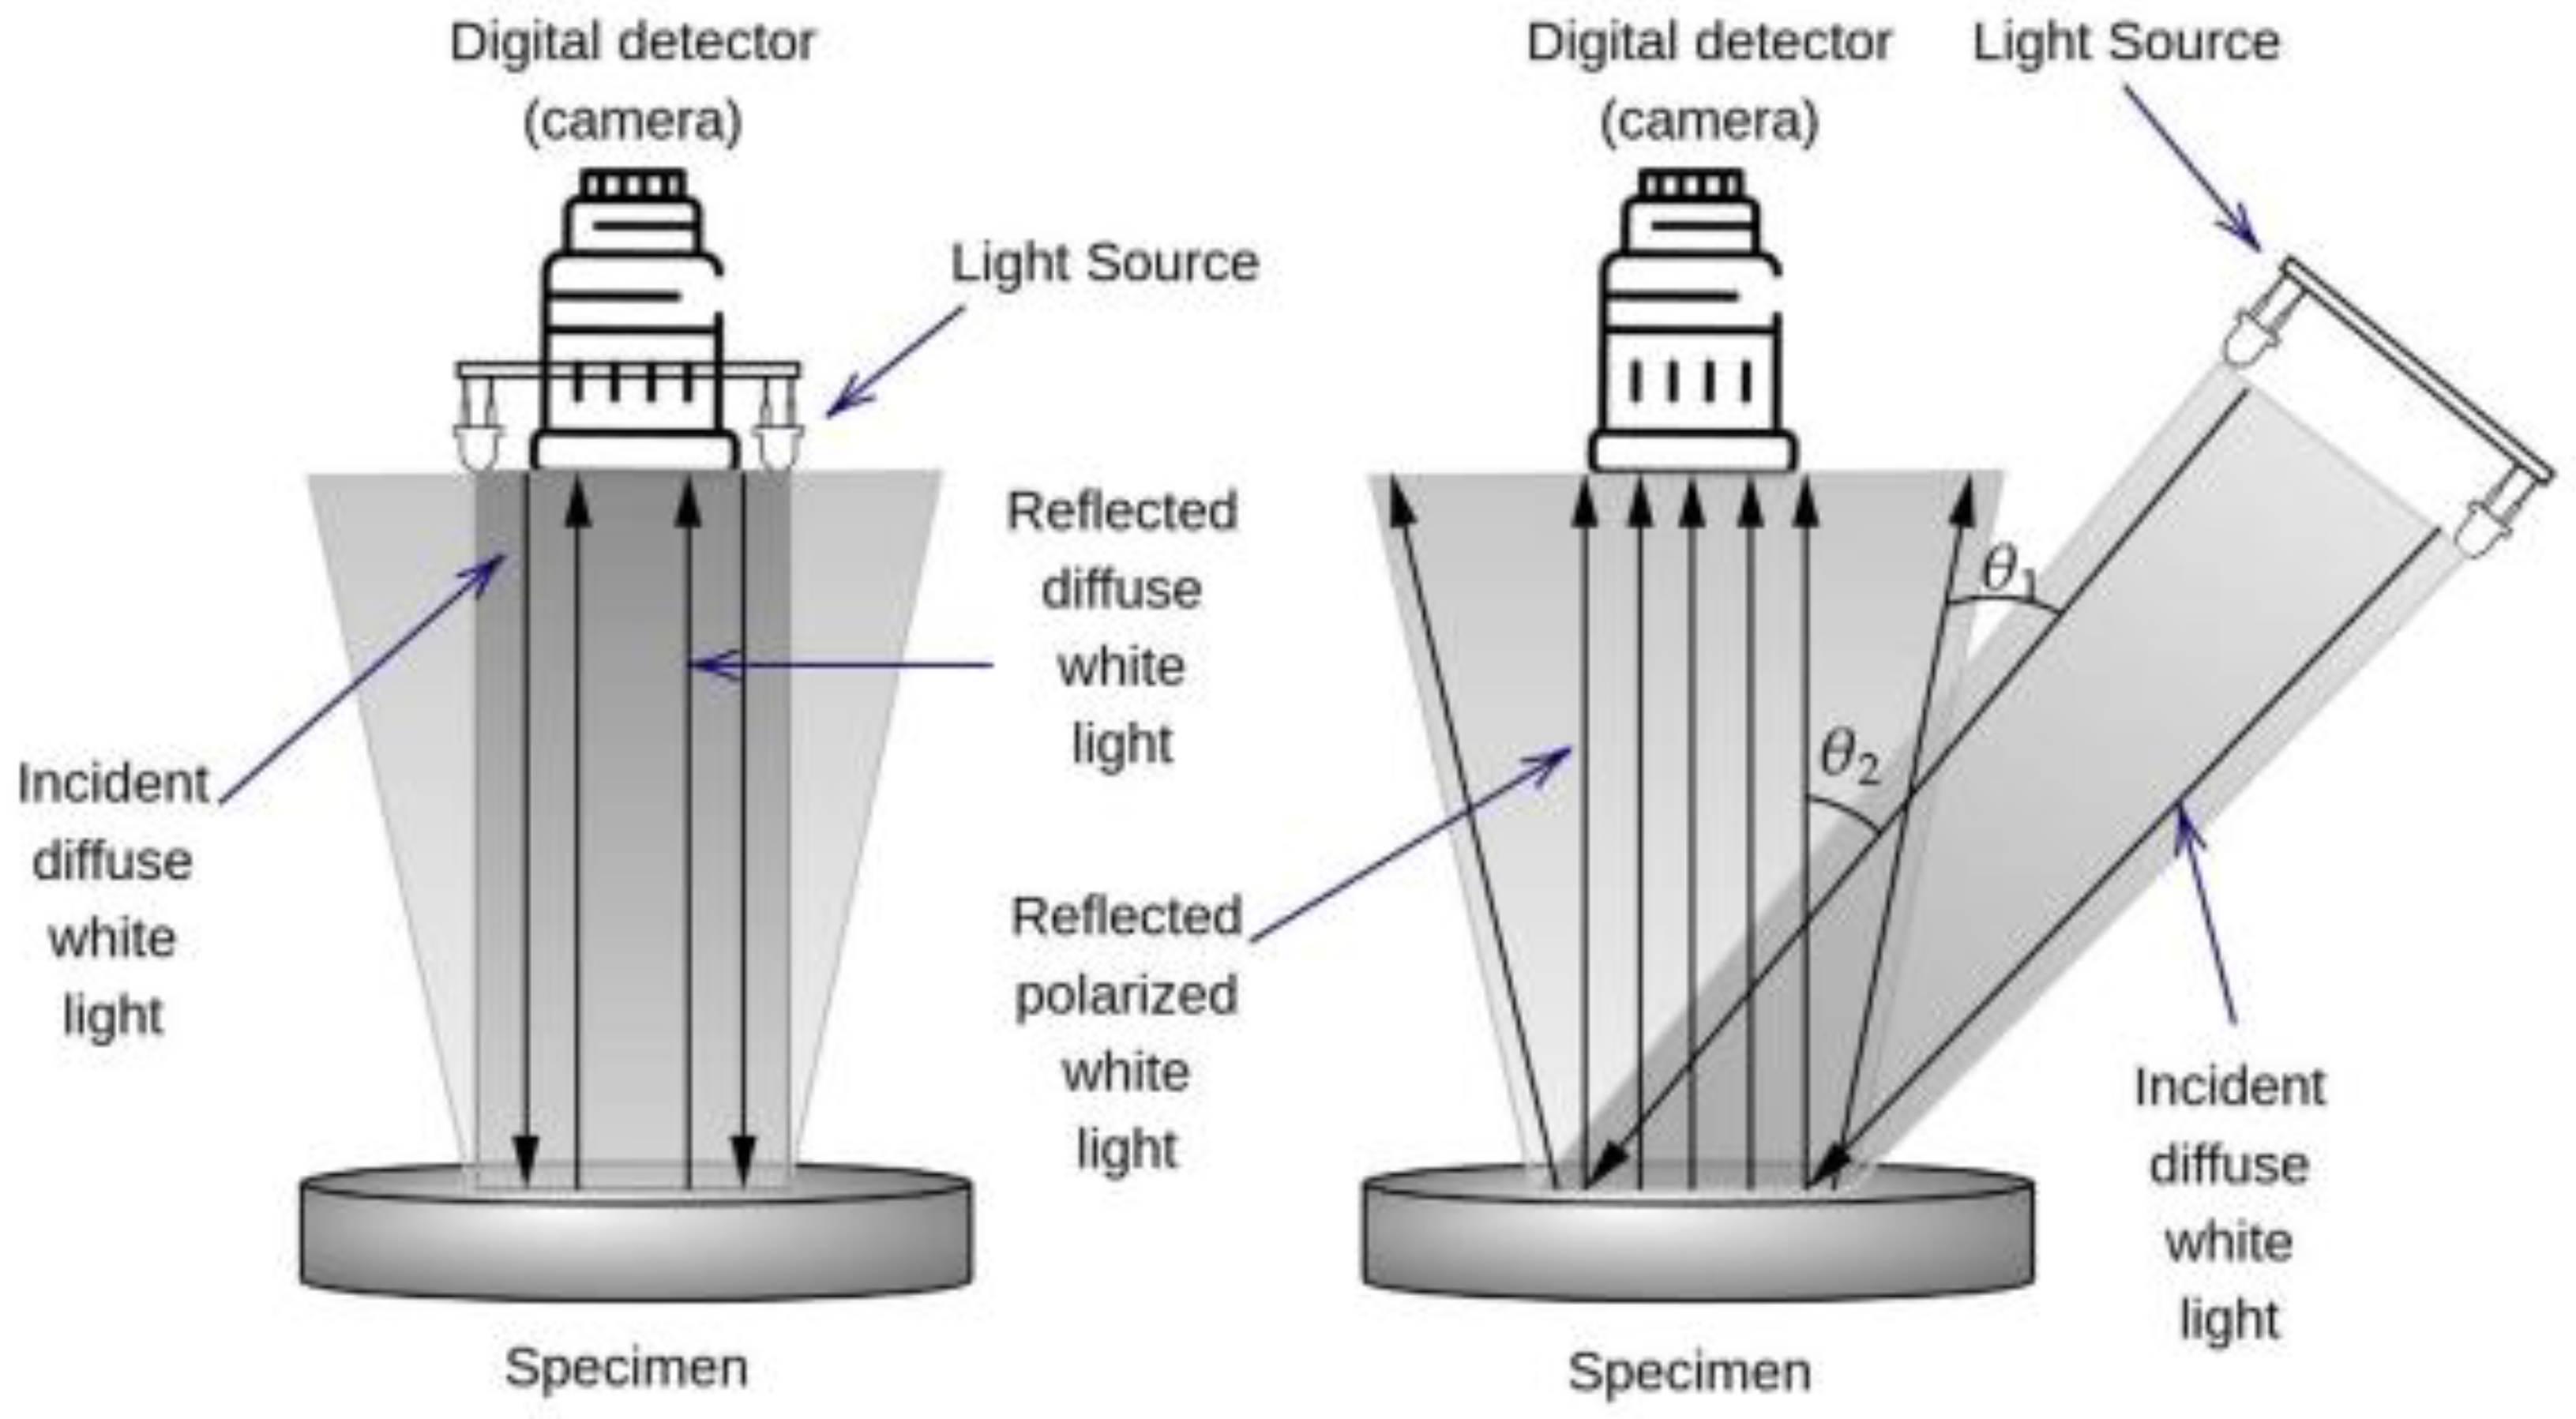
5]. Light, as an electromagnetic phenomenon, consists of electric and magnetic waves, which are always perpendicular. When a sample is illuminated under a specific angle, the reflected light is polarized. The specific angle at which this occurs is known as Brewster’s angle; each material has a unique Brewster’s angle value. By applying the OMIS technique, light from a diffused light source is reflected by a sample and recorded by the sensor, as indicated in
Figure 1. Subsequently, the same type of diffuse white light from a second light source placed at the Brewster’s angle of the material is reflected by the sample and recorded by the sensor. The reflected polarized light detected by the sensor contains predominantly an electrical component of light-matter interaction. By subtracting the reflected polarized light (electrical properties) from the reflected white diffuse light (electro-magnetic properties), the result provides information about the magnetic properties of matter based on light-matter interaction (
Figure 2) [
5]. A pair of digital images is acquired under white diffuse light, and white diffuse light under Brewster’s angle will result in three spectra (channels) – blue, red, and green (RGB)– for each image. When blue, green, or red spectra for the image of the sample taken under Brewster’s angle are subtracted from the blue, green, or red spectra for the image of the sample taken under diffuse light, the resultant composite hyper spectrum will represent an opto-magnetic spectrum of the sample. For processing (classification) of samples, machine learning is integrated based on the Artificial Neural Network (ANN) algorithm to develop a model capable of differentiating between different classes of samples (normal, inflammatory, benign, and cancer or normal, low-grade, high-grade, and cancer). This differentiation is further confirmed by the Random Forest (RF) algorithm. The limit of detection is directly related to algorithm training and efficiency and the capabilities of the charge-coupled device. As with other ML models, the bigger the training set (including high quality samples and images) more efficient the algorithm for detection becomes, and as a result, the methodology improves sensitivity and specificity at differentiating between the samples. Investigations results demonstrate that measuring repeatability of the OMIS for the same sample is: 98 ± 1%, 97 ± 2% and 96 ± 2.5%, for solid state matter, viscoelastic matter (tissues) and liquids, respectively. OMIS has been successfully used for tissue characterization [6-8], screening tool for several cancers [
9,
10,
11,
12,
13,
14], and detection of viruses in plasma [
15] with very high accuracy and sensitivity. In the next chapter, results of the studies using OMIS for the rapid detection of epithelia tissues cancers is presented.
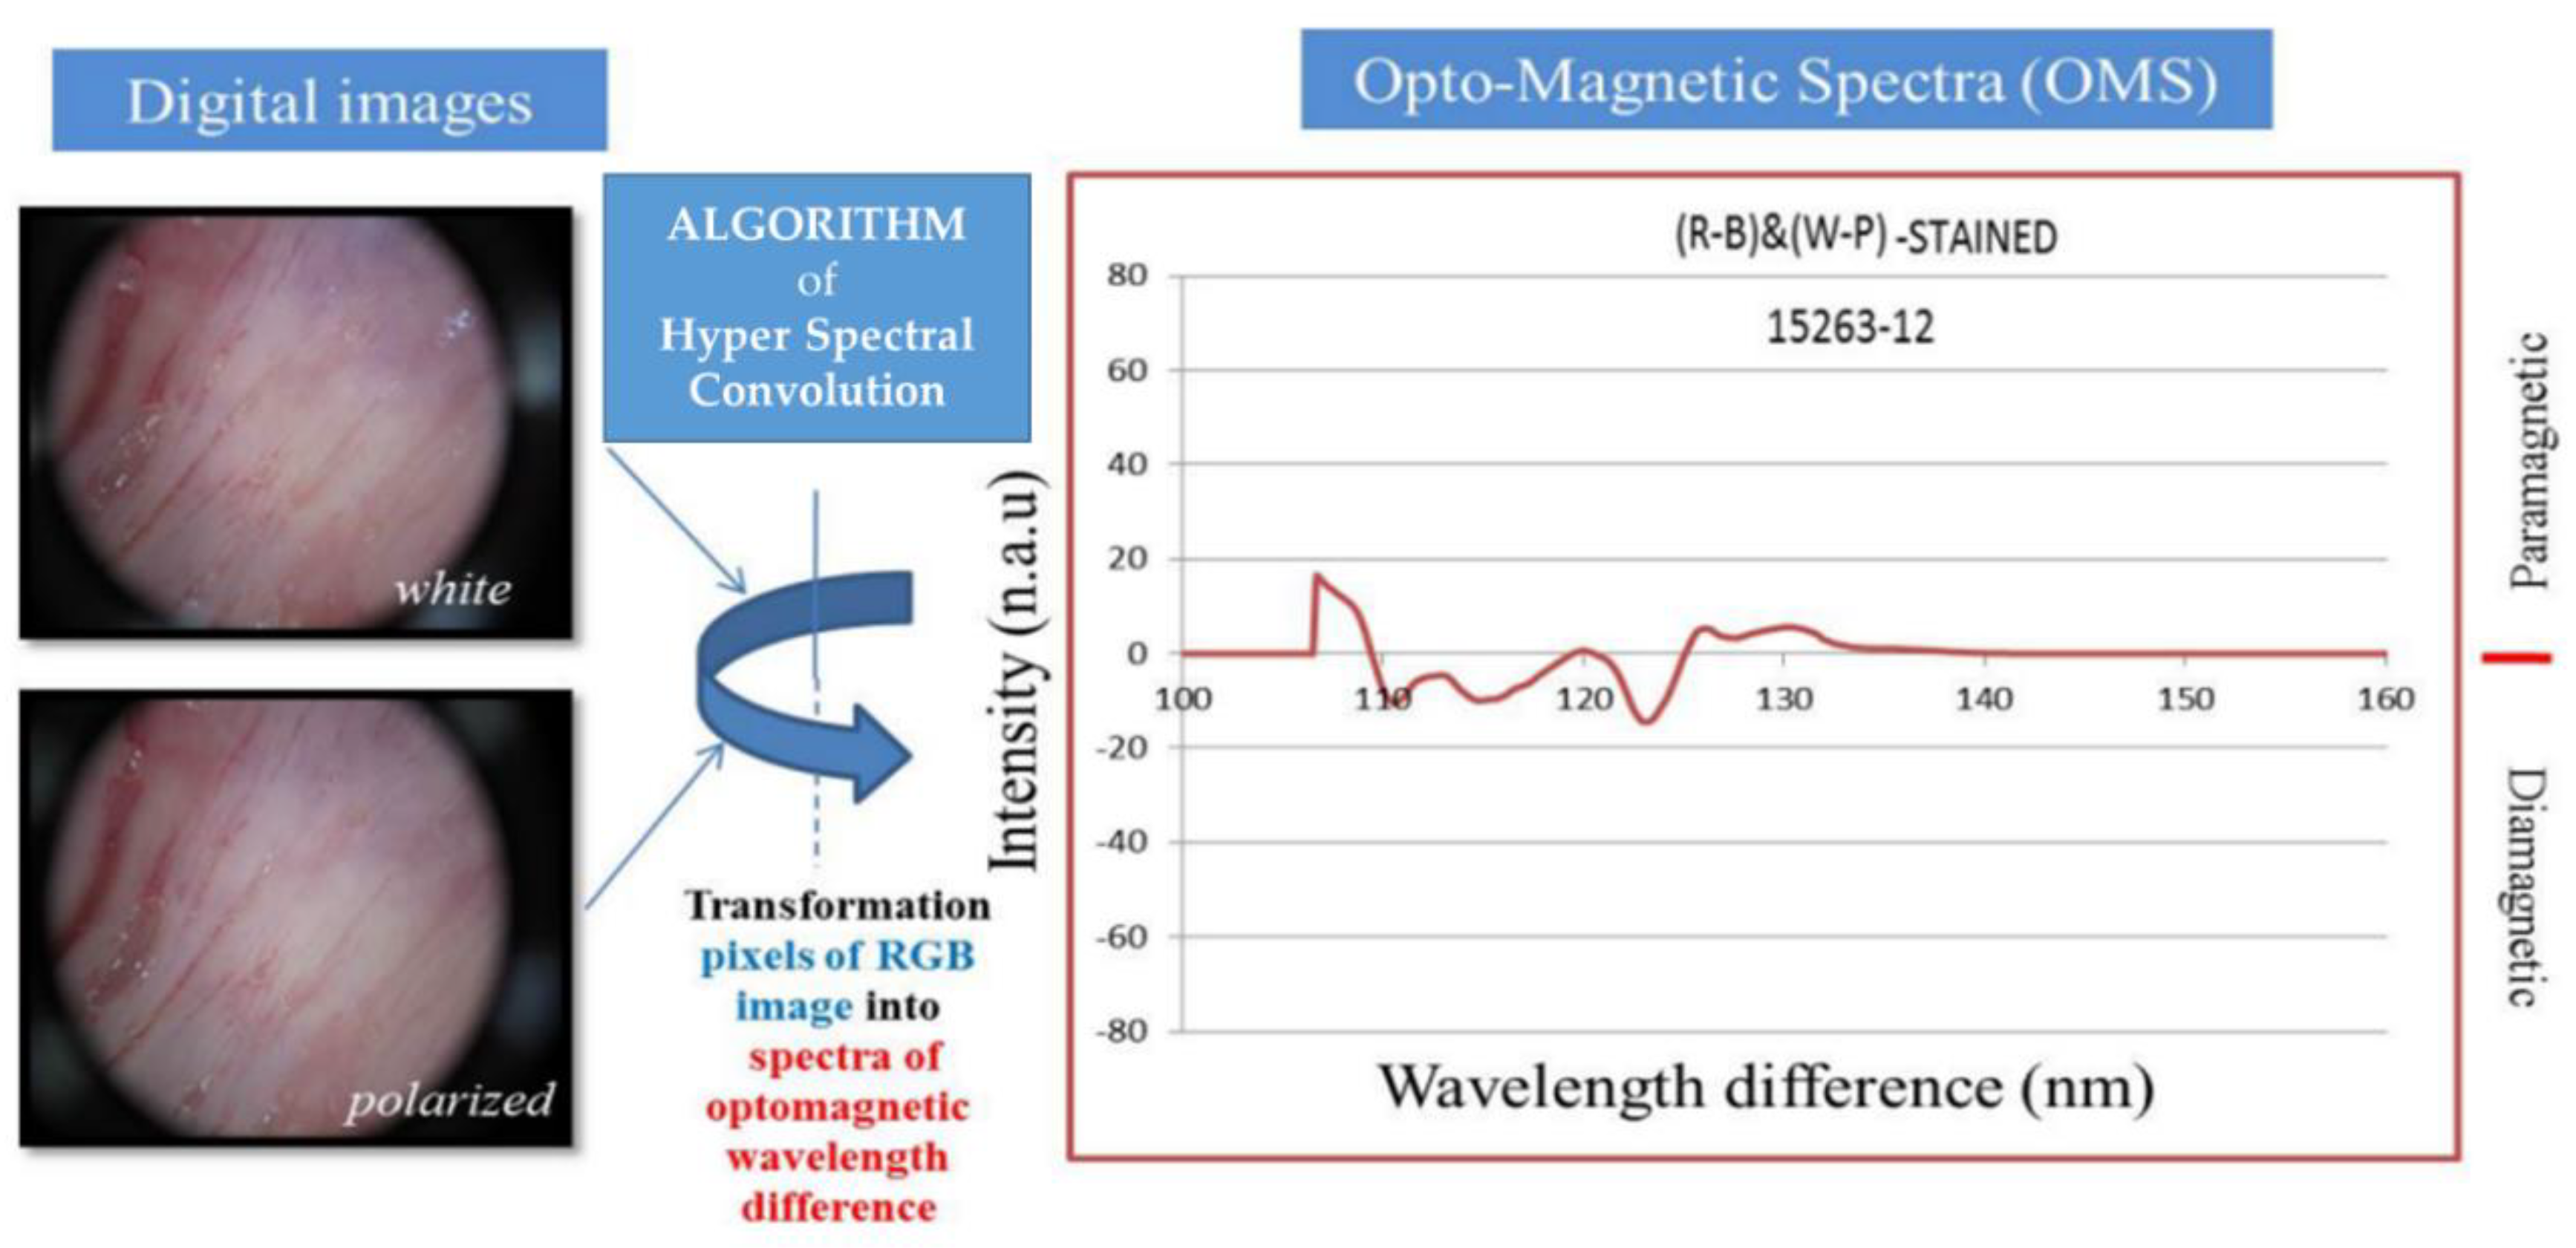
The starting point for data processing are two images of tissues obtained with white light, one of which was obtained with the white diffused light at an angle of 90
0, and the other also with the same light, but at the Brewster angle (53.6
0 – for tissues) (
Figure 3). Depending on which depth of the epithelium we want to analyse the blue, green and red channels will be used (
blue channel - the surface and depth of the epidermis close to the basal membrane,
green channel - basal membrane and the upper part of the dermis and
red channel - the middle and lower part of the dermis).
It means, depending on which part of the epithelial tissue we want to analyse in depth, different light source channels will be used. The order of penetration of the light into the tissue is as follow: blue light (300-600μm, shallow), green light (up to 1.4 mm, medium) and red light (about 2-3 mm - the deepest). For example, if one wants the state of the tissue throughout the depth, the blue (B) and red (R) channel of diffuse (W) and polarized (P) light in the designation (R-B)(W-P) as hyper convolution spectra, will be used. On other side, if one wants to analyse the epidermis, then the blue (B) and green (G) channel of diffuse (W) and polarized (P) light in the designation (G-B)(W-P) It means, depending on which part of the epithelial tissue we want to analyse in depth, different light source channels will be used. The order of penetration of the light into the tissue is as follow: blue light (300-600μm, shallow), green light (up to 1.4 mm, medium) and red light (about 2-3 mm - the deepest). For example, if one wants the state of the tissue throughout the depth, the blue (B) and red (R) channel of diffuse (W) and polarized (P) light in the designation, (R-B)(W-P) as hyper convolution spectra, will be used. On other side, if one wants to analyse the epidermis, then the blue (B) and green (G) channel of diffuse (W) and polarized (P) light in the designation (G-B)(W-P) as hyper convolution spectra, will be used. However, if one wants to investigate the state of the dermis, then the green (G) and red (R) channel of diffuse (W) and polarized (P) light in the designation (R-G)(W-P) as hyper convolution spectra, will be used.[5,9]
Figure 3.
Three basic OMIS phases: (1) obtaining images from diffuse and polarized light, (2) converting images into a hyper convolutional spectrum, and (3) diagram of the interrelation of paired electrons (diamagnetism) and unpaired electrons (paramagnetism) in tissue for a given wavelength difference. Based on the intensity of the amplitude for a given wavelength, the recorded sample is classified. [
9].
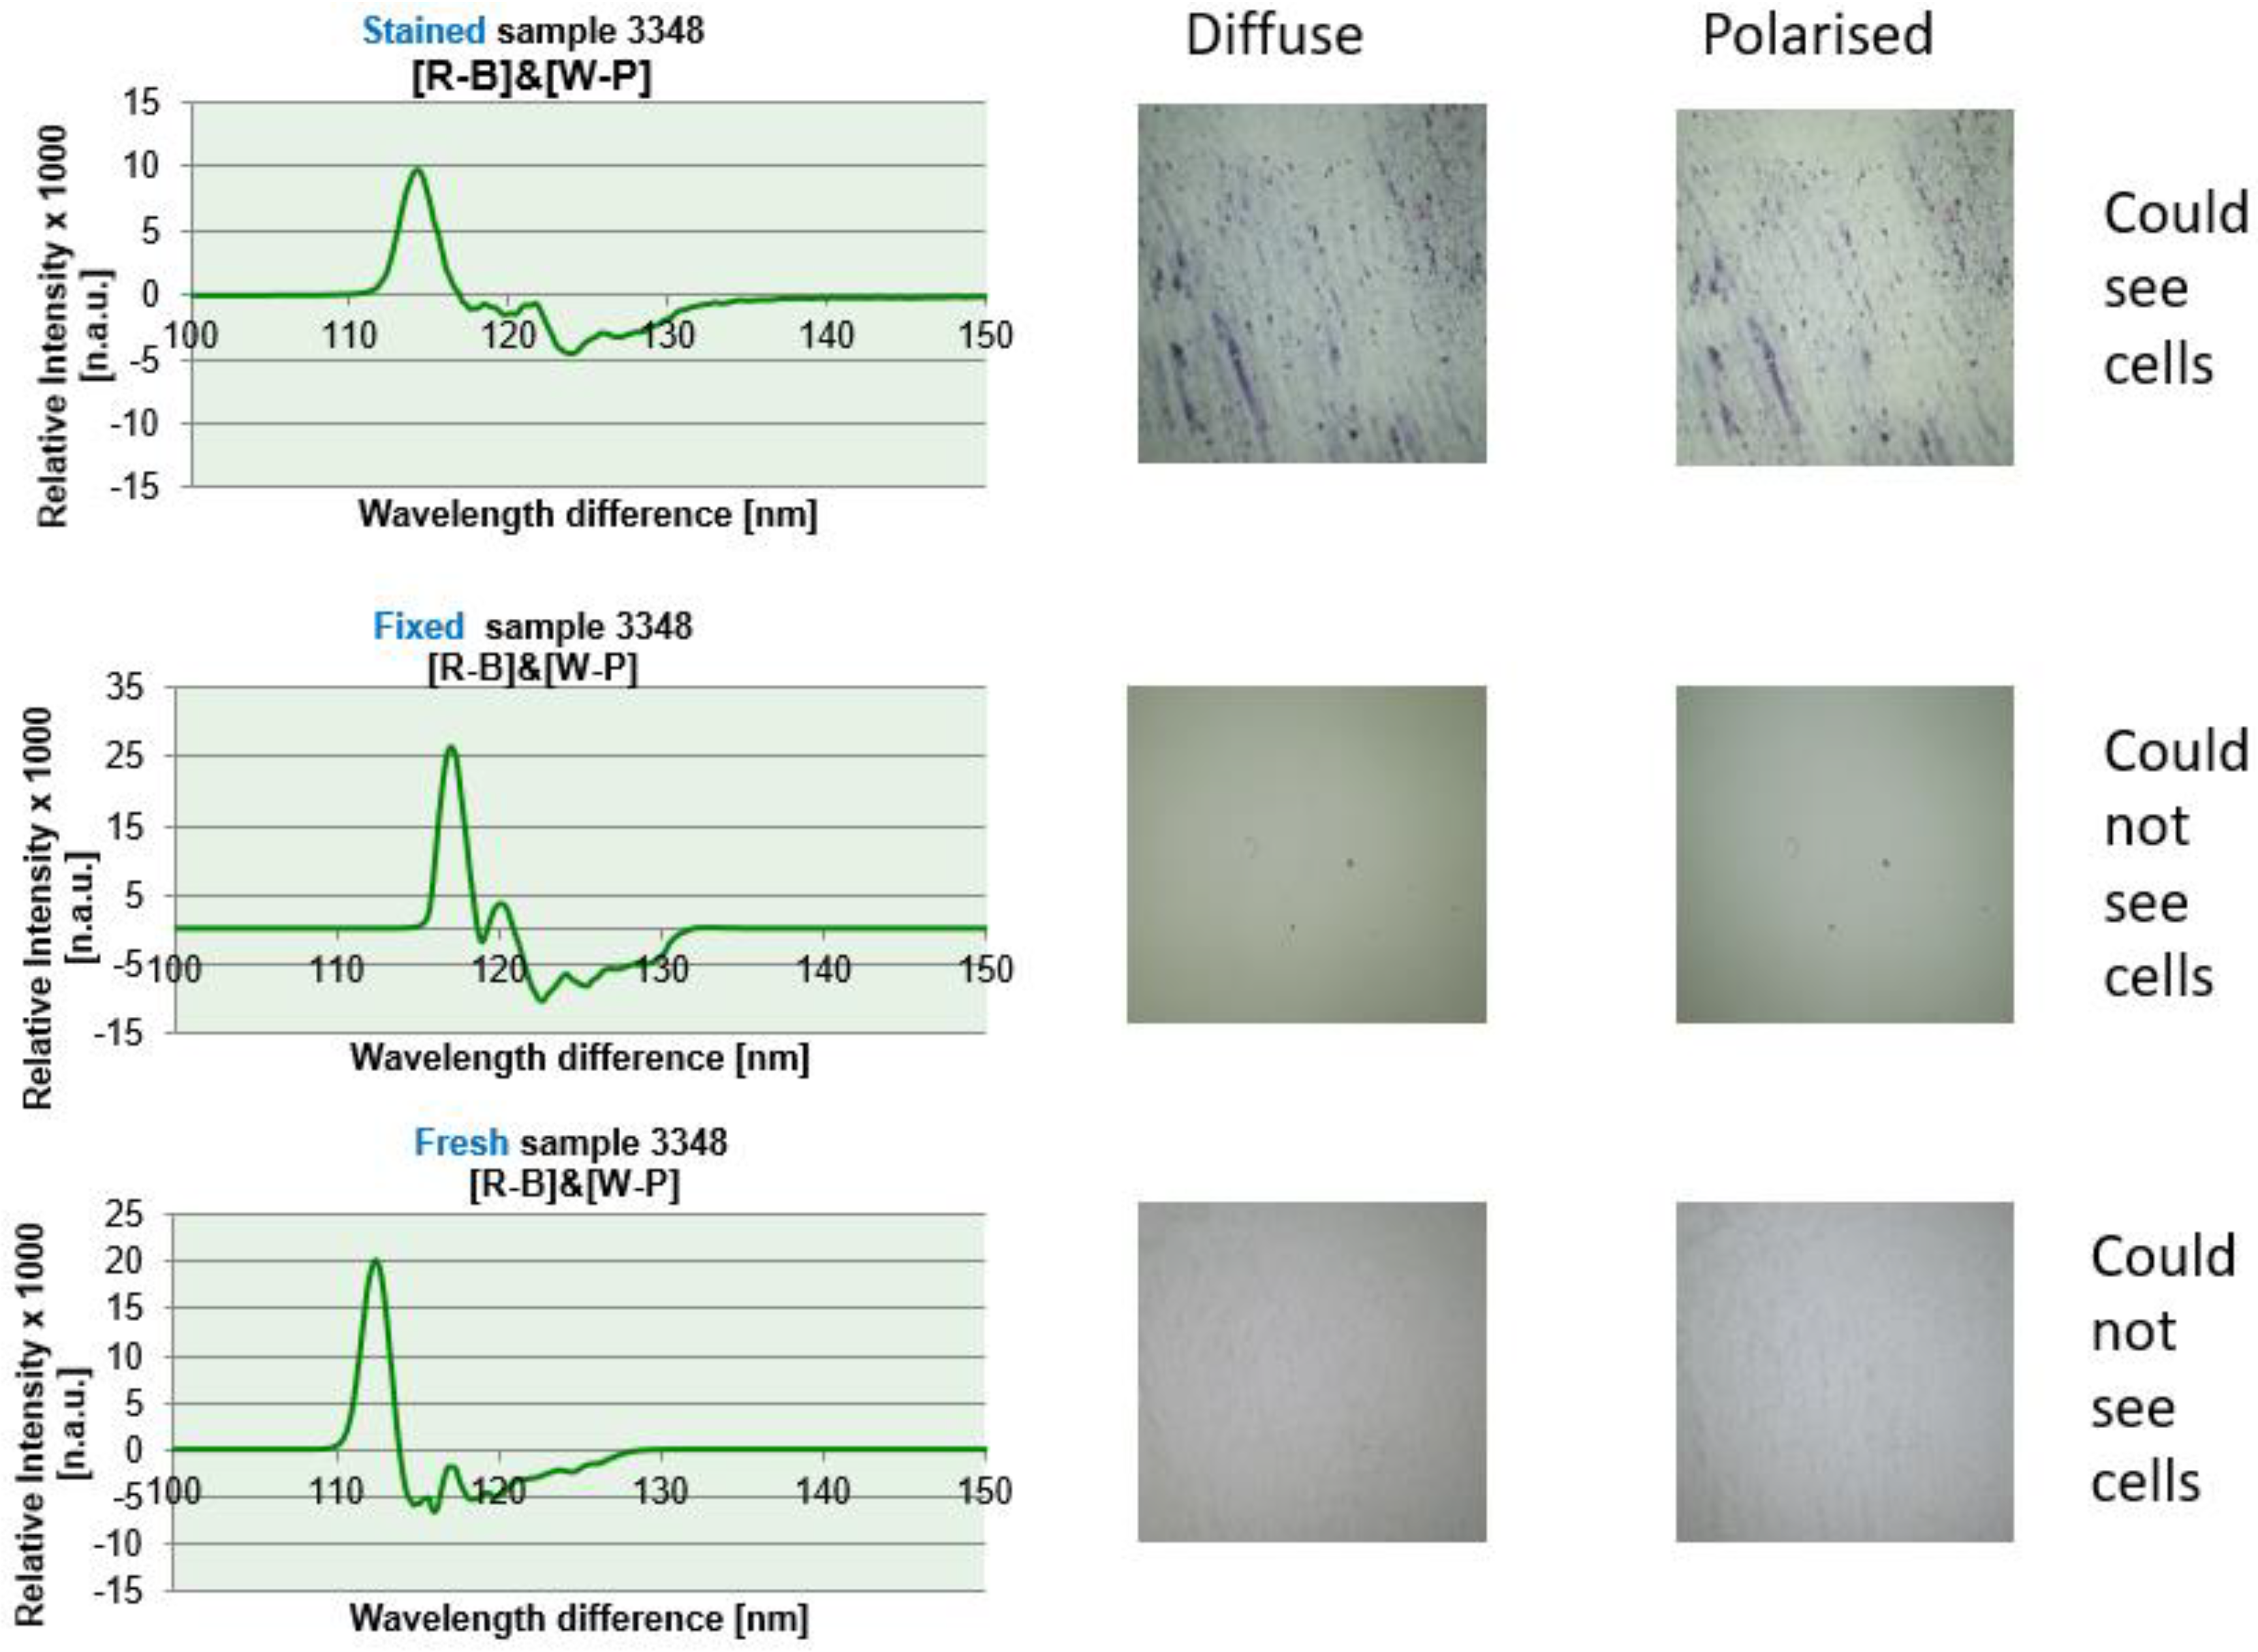
Regardless of whether the sample is fresh, fixed or stained for histopathological investigations, the resulting OMIS diagrams are the same, or approximately the same. From accuracy point of view, the best spectrum is from a fresh sample, then for a fixed one, and only then for a dyed one (
Figure 4). As could be seen from the image, even if we do not see tissue in the images of diffuse and polarized light for fresh and fixed samples, the OMIS process produces spectra, because they are primarily created as a process of light reflection from valence electrons (characteristic of molecules) and hydrogen bonds (characteristic of intermolecular interaction) tissues.
2.2. OMIS Proof of Concept
In the study of histopathological skin samples, the JSPM-5200, Scanning Probe Microscopy system from JEOL, Japan was used for MFM investigation [3]. Under the applied imaging mode for magnetic gradient measurement, the chosen cantilever is sensitive to the change of magnetic properties of the sample, due to the electrons’ valence state of sample and the dipole-dipole interaction between the tip of the probe and the sample. Since dipole moments of the sample depend on paired and unpaired electrons, attraction/repulsion forces are observed [
16]. The shift from the resonant frequency of the cantilever and measured frequency is proportional to an average force gradient which means that the cantilever-magnetic field angle ϕ (°) of tip-sample interaction is the value that will characterize the sample [17-18].
In the study, whose results for MFM are shown in
Table 1, it was found that healthy tissue has a shift (Δf/f x 10
6) in the range of {7-9} n.a.u, and cantilever-magnetic field angle ϕ (°) in the range of {-4 and -8}, which defines a strong diamagnetism. Inflammatory tissue was within Δf/f {4-7} n.a.u. and angles ϕ (°) {-10 and -35} (weak diamagnetism), a benign tumor within Δf/f {2 and -8} n.a.u. and angles ϕ (°) {-50 and -80} degrees (weak and medium paramagnetism), while cancer was within Δf/f {-14 and -15} n.a.u. and angle ϕ (°) {-50 to -150}, which defines strong paramagnetism. Thus, healthy tissue is like "copper" (diamagnetic, paired electrons) and cancer was “aluminium-like”, high paramagnetic (unpaired electrons).
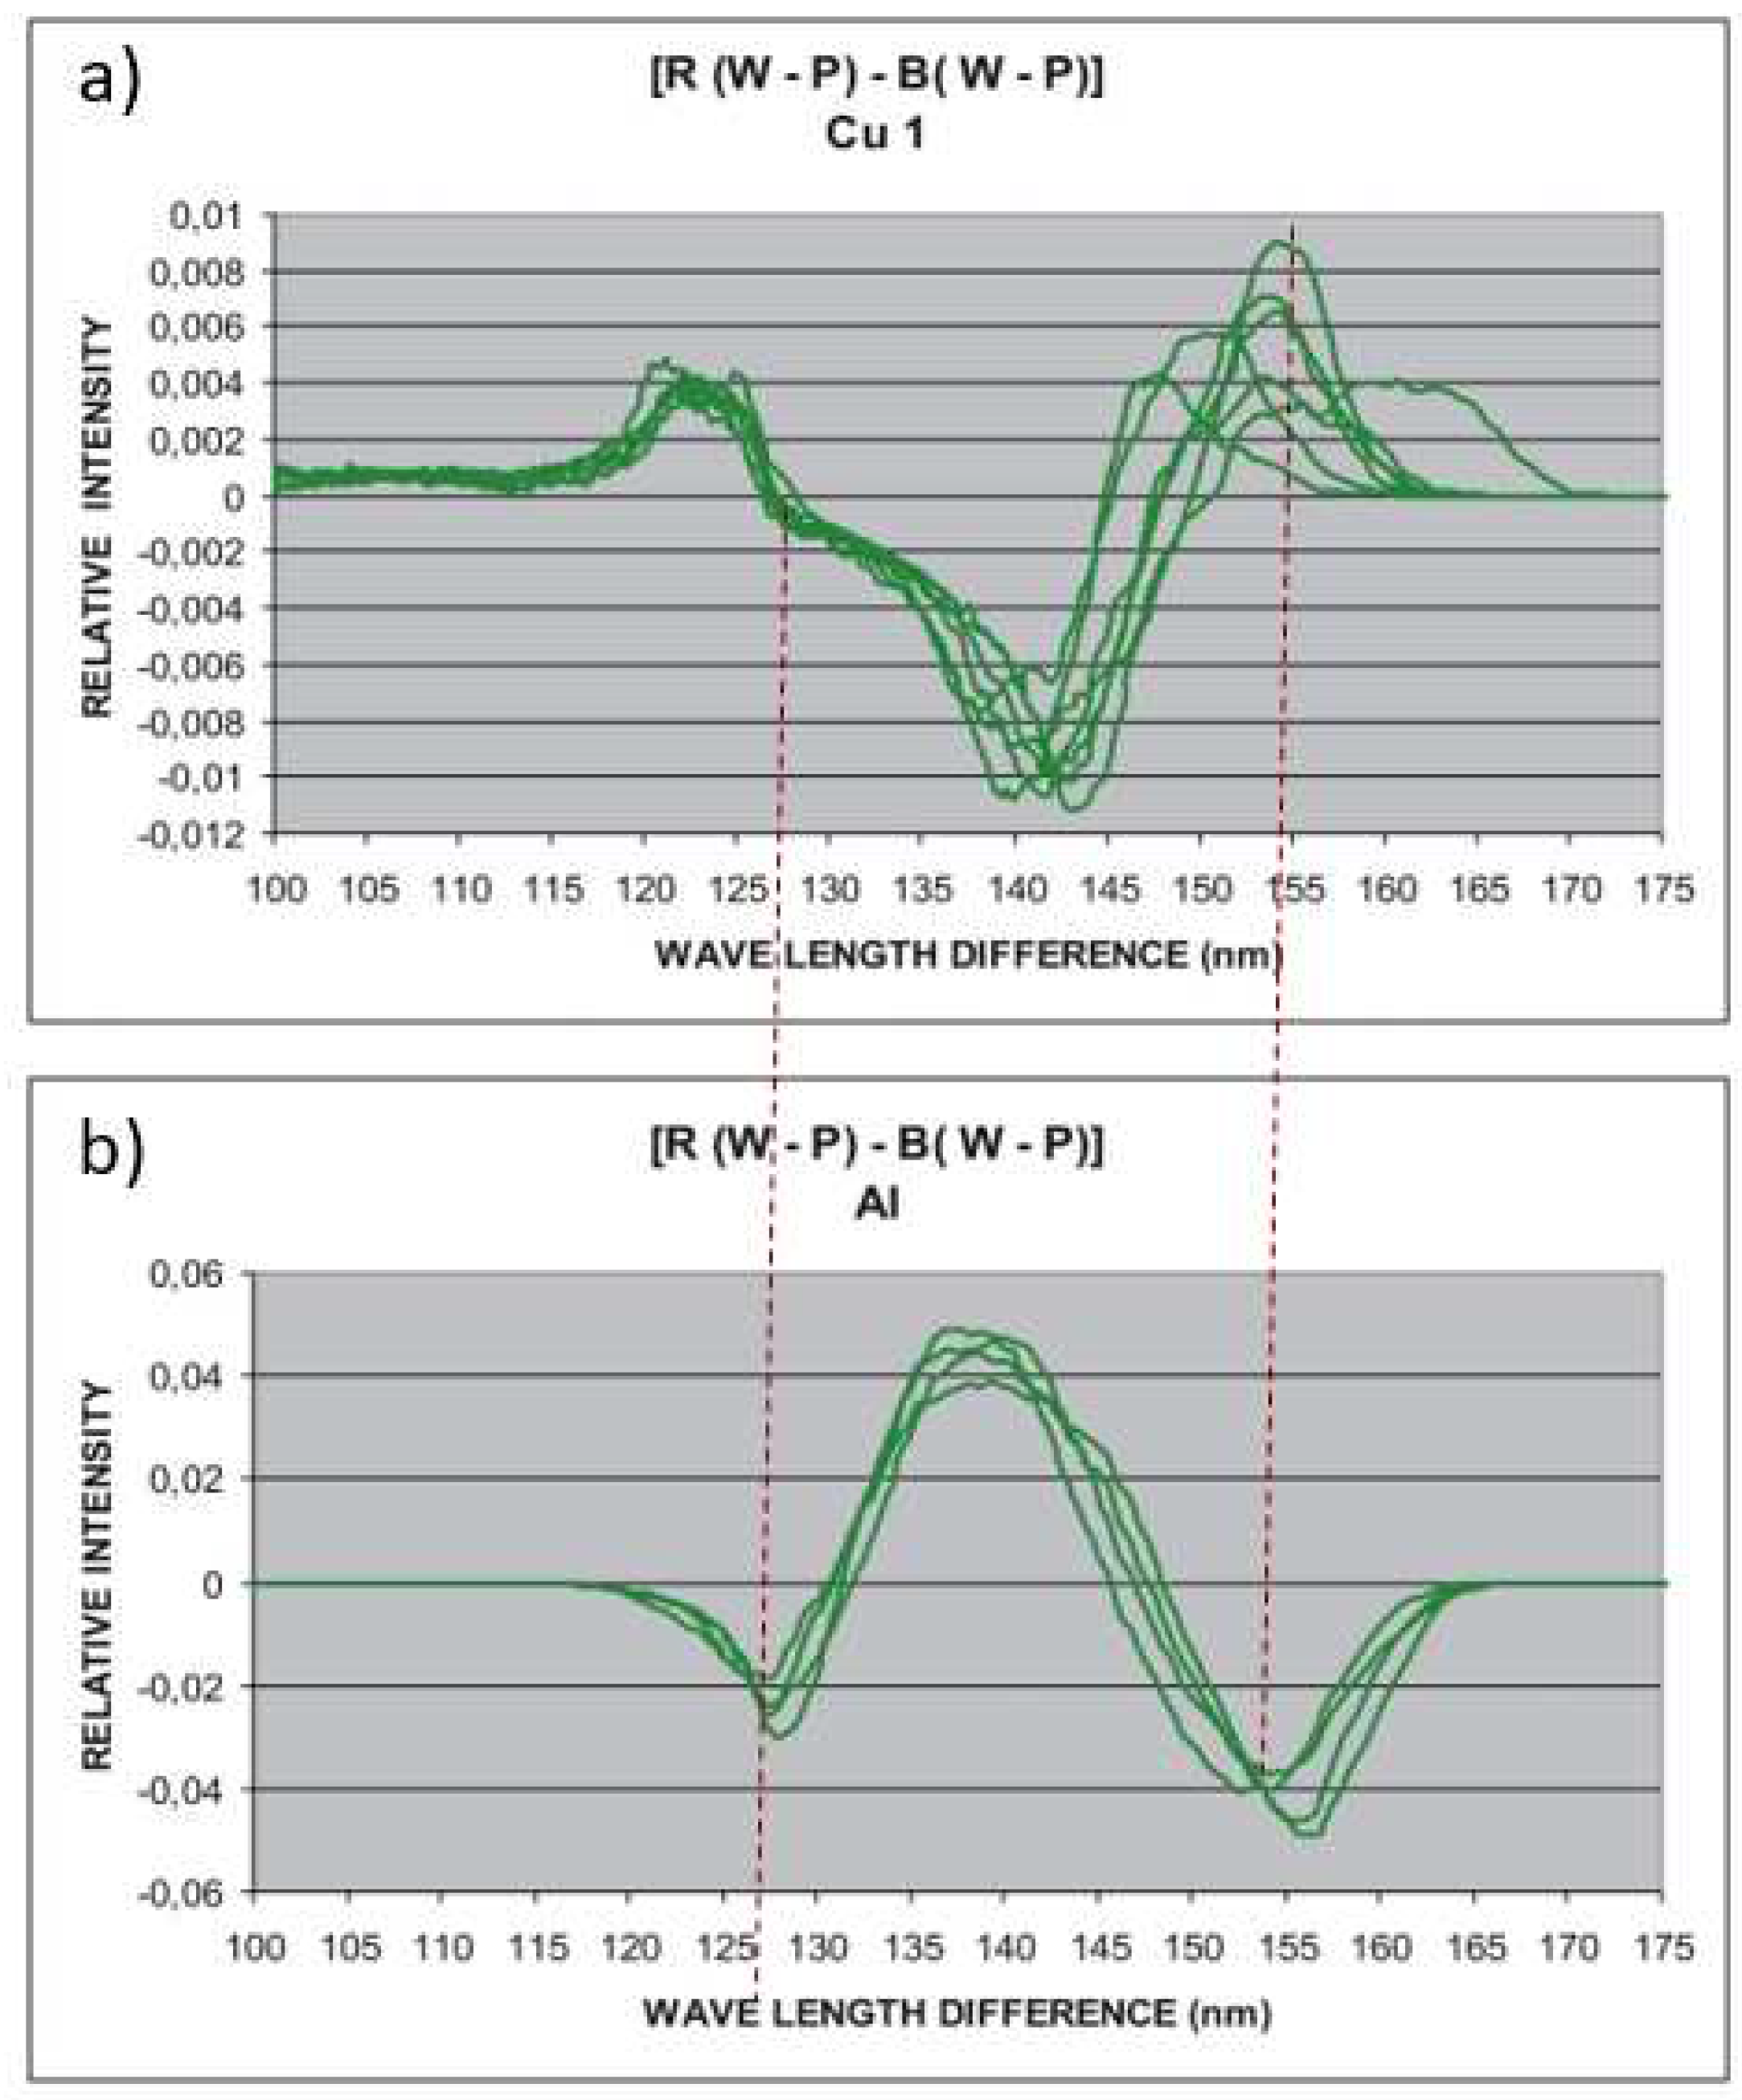
To test the OMIS method, i.e. if, like MFM, it separates paramagnetic and diamagnetic properties in identification, copper and aluminium of 99.9% purity (
Metal Products Co.,Ltd., China) were recorded with OMIS and their spectra were obtained. For wavelength differences of 125-155 nm, two opposing peaks were obtained (
Figure 5), which showed that the OMIS concept of diamagnetism and paramagnetism is correct.
3. Results
3.1. OMIS Application in Epithelial Cancer Detection
3.1.1. OMIS and Melanoma
The optical properties of skin in vivo conditions were investigated for two different types of skin lesions that exist or occur on the skin due to damage. In this initial investigation, 96 patients participated (48 patients in melanoma group and the other 48 to the nevus group).[9] The obtained results were divided into two basic categories, benign and malignant pigment changes. OMIS device was applied directly onto the lesion. In 97% of cases, the obtained results sensitivity, using OMIS, agreed with histopathology findings. However, specificity was 87.04 % and accuracy 91.67 %.
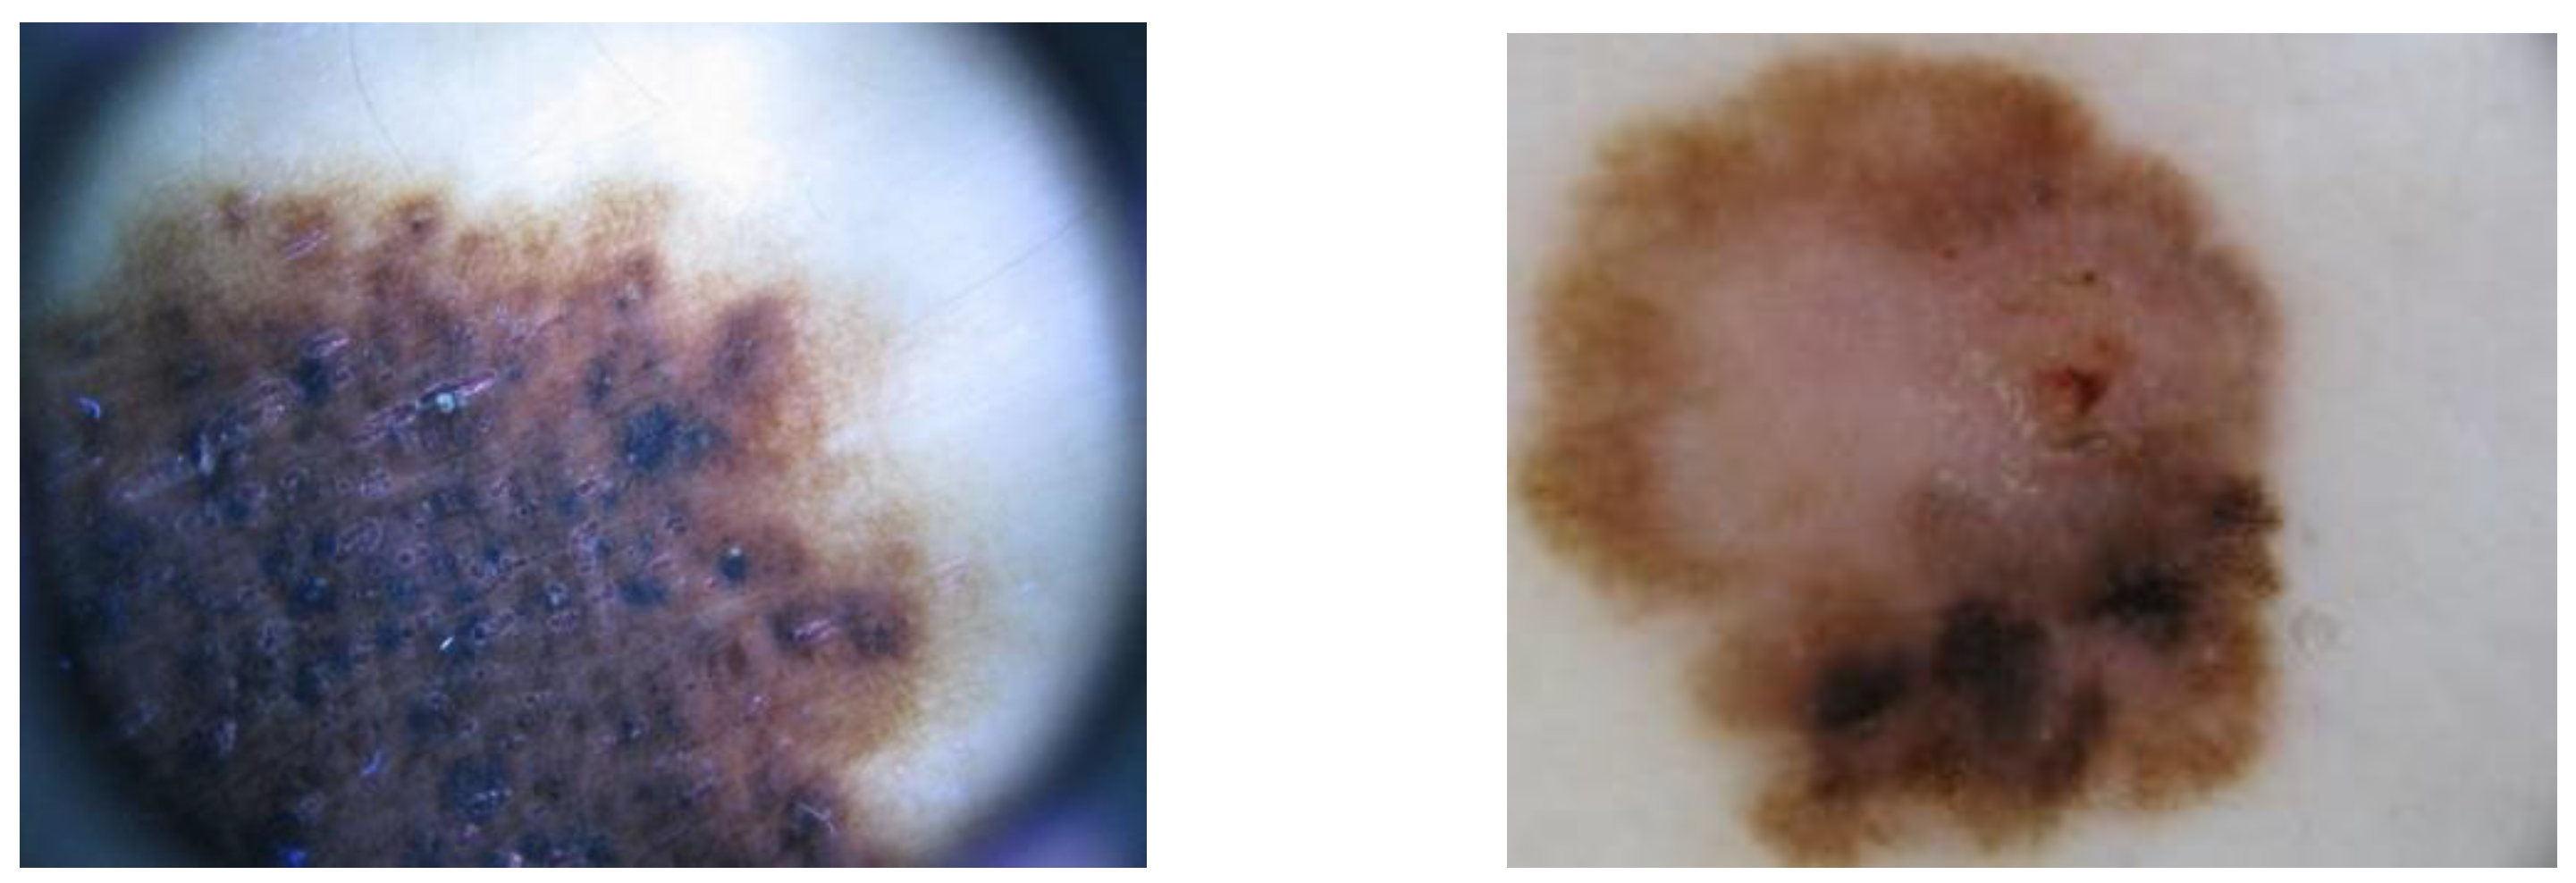
As described, it is very challenging to macroscopically differentiate between a healthy mole and a melanoma without tools, or even using a magnifying glass, as is the shown in
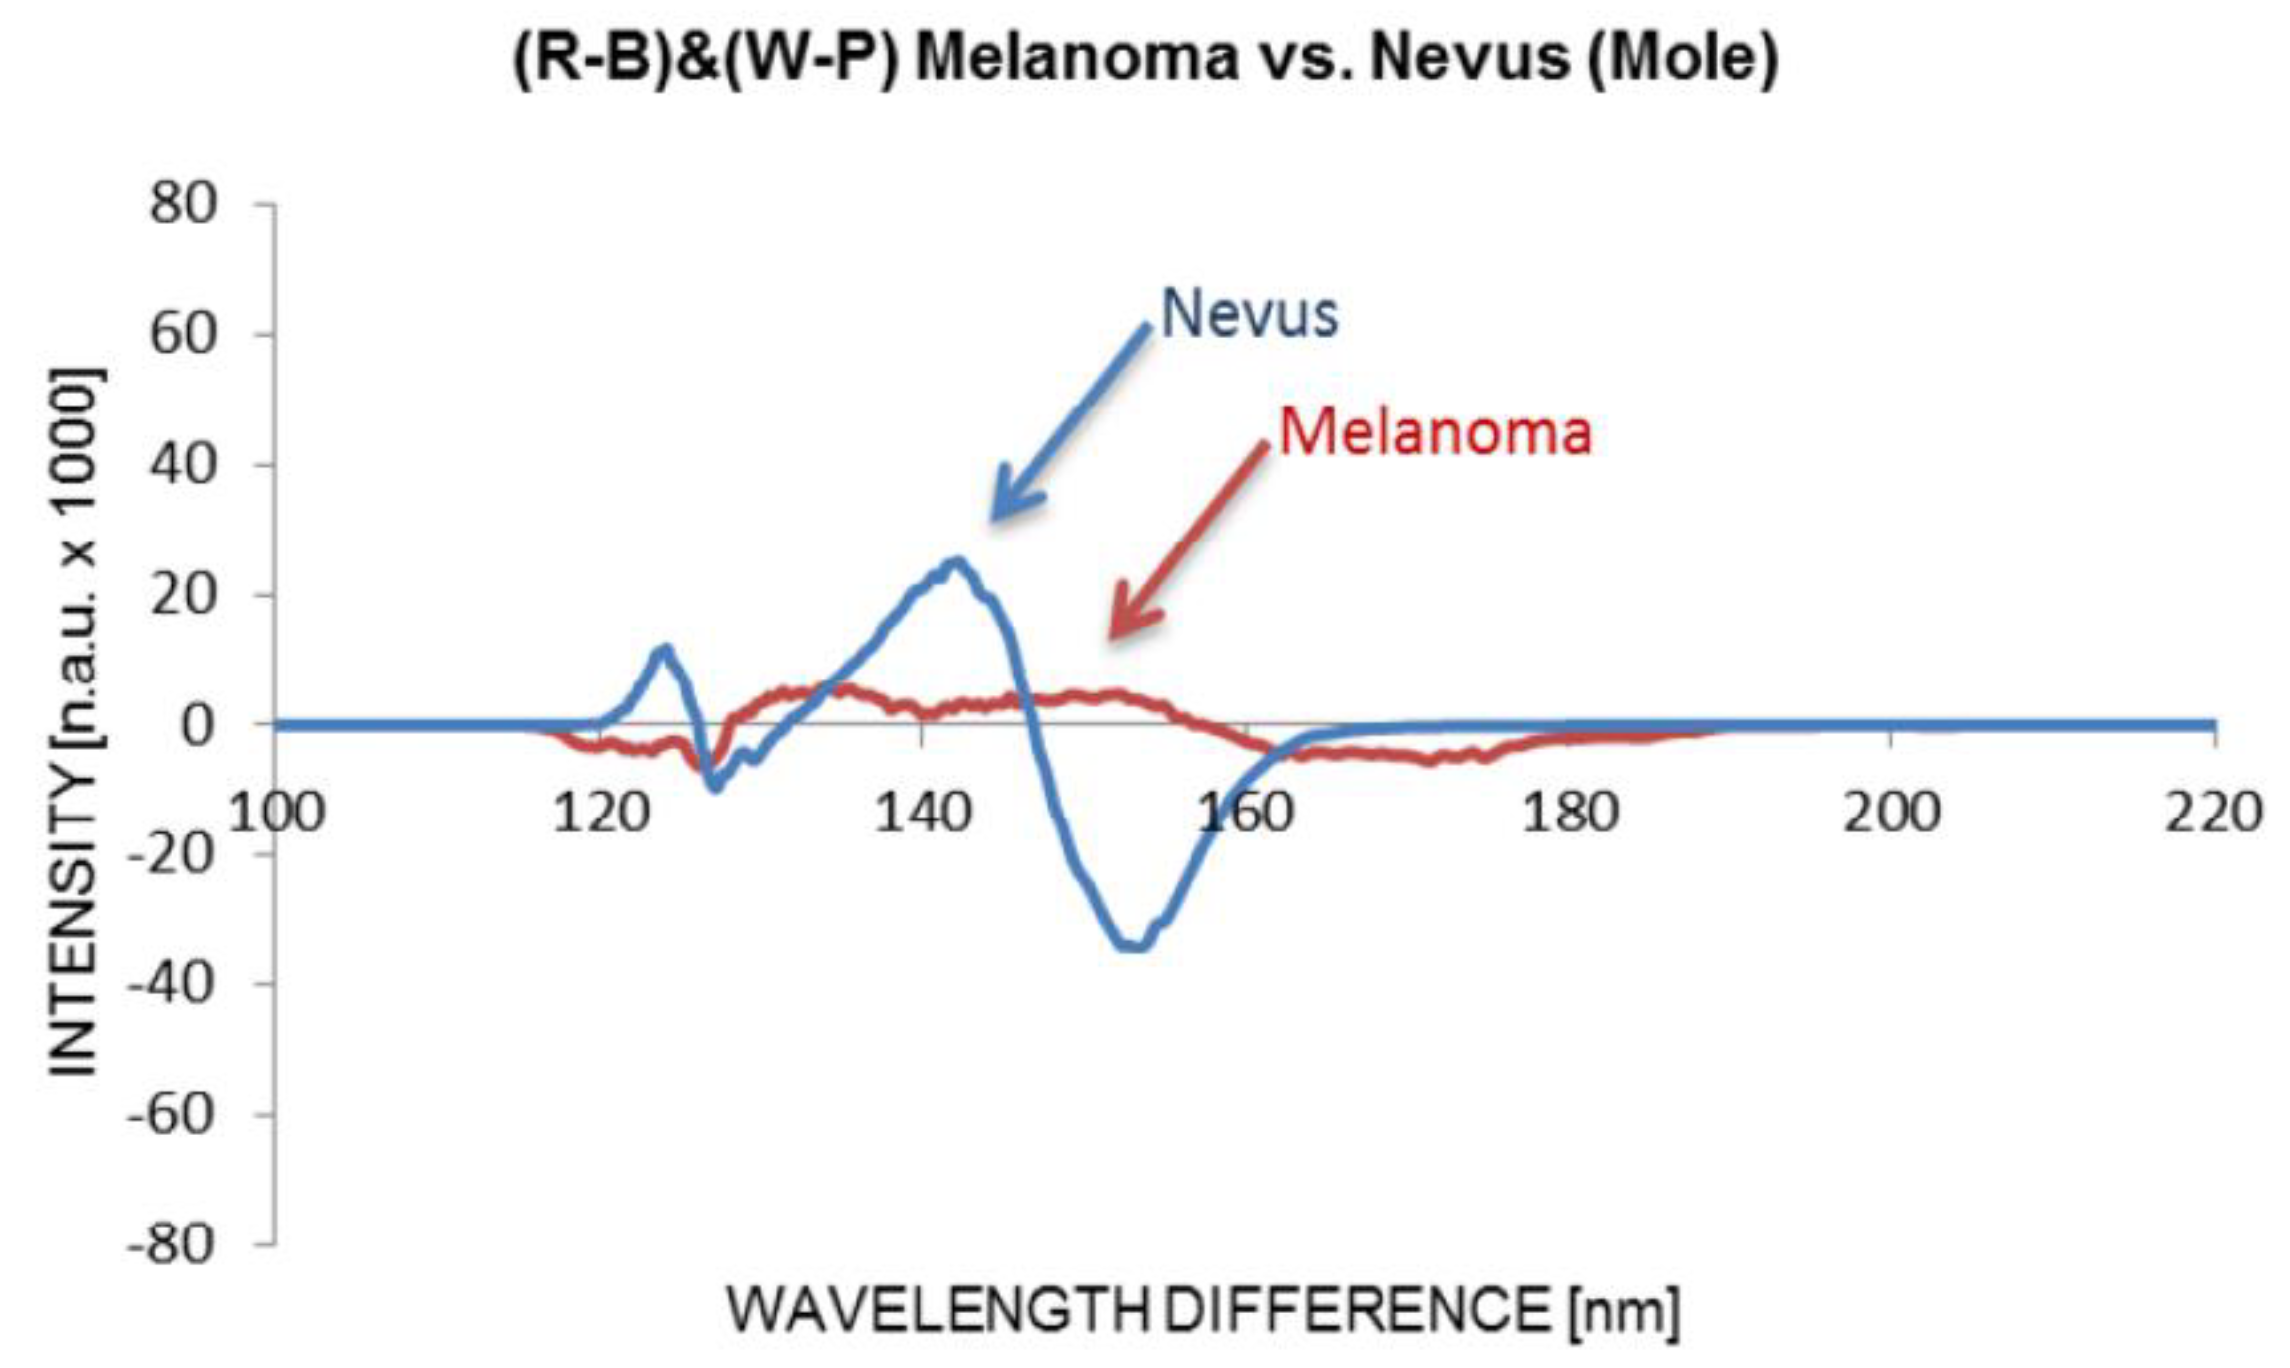
Figure 6. Using OMIS to image, and consequently analyse images of both moles, we identified that the mole from the first picture (left) is normal, and from the second picture (right) is melanoma. The OMIS spectra are shown in
Figure 7.
3.1.2. OMIS and Cervix
The cervical tissue samples used in OMIS study are prepared using Papanicolaou procedure (stained samples). Papanicolaou is currently a golden standard for detection of cervical cancer. The samples were first investigated by a cytotechnologist, and then the OMIS technique was used. In the initial study, OMIS spectra of cervical cells were averaged per each patient to obtain a single spectrum for every microscopic slide, i.e., cervical smear. The study of the stained cervical cytology samples obtained from 140 patients (280 microscopic slides with cervical cell samples), which included 35 cases from each Pap group, showed a good potential of OMIS to characterize samples from different Pap groups. In this study, the degree of accuracy for stained cervical smears was 85.18%. The obtained accuracy result was reported to be a consequence of inadequate staining of the samples. [
9]
In the second study a total number of 320 fresh (not dyed) cervical samples (240 samples from the II Pap group, 50 samples from the III Pap group, 16 samples from the IV Pap group and 14 samples from the V Pap group) were investigated. In this study, accuracy of results was significantly improved, and classifier accuracy was 96% for classification between normal result (II Papanicolaou group) and invasive cancer (V Papanicolaou group). Achieved sensitivity was 95% and specificity 97%. Based on these results, it can be said that OMIS is fast, easy-to-use, and since it uses unstained cervical samples, it is cost-effective, because there is no need for laboratory services, chemicals for staining, and sample transport (this is very suitable for community health centres). [
10,
11].
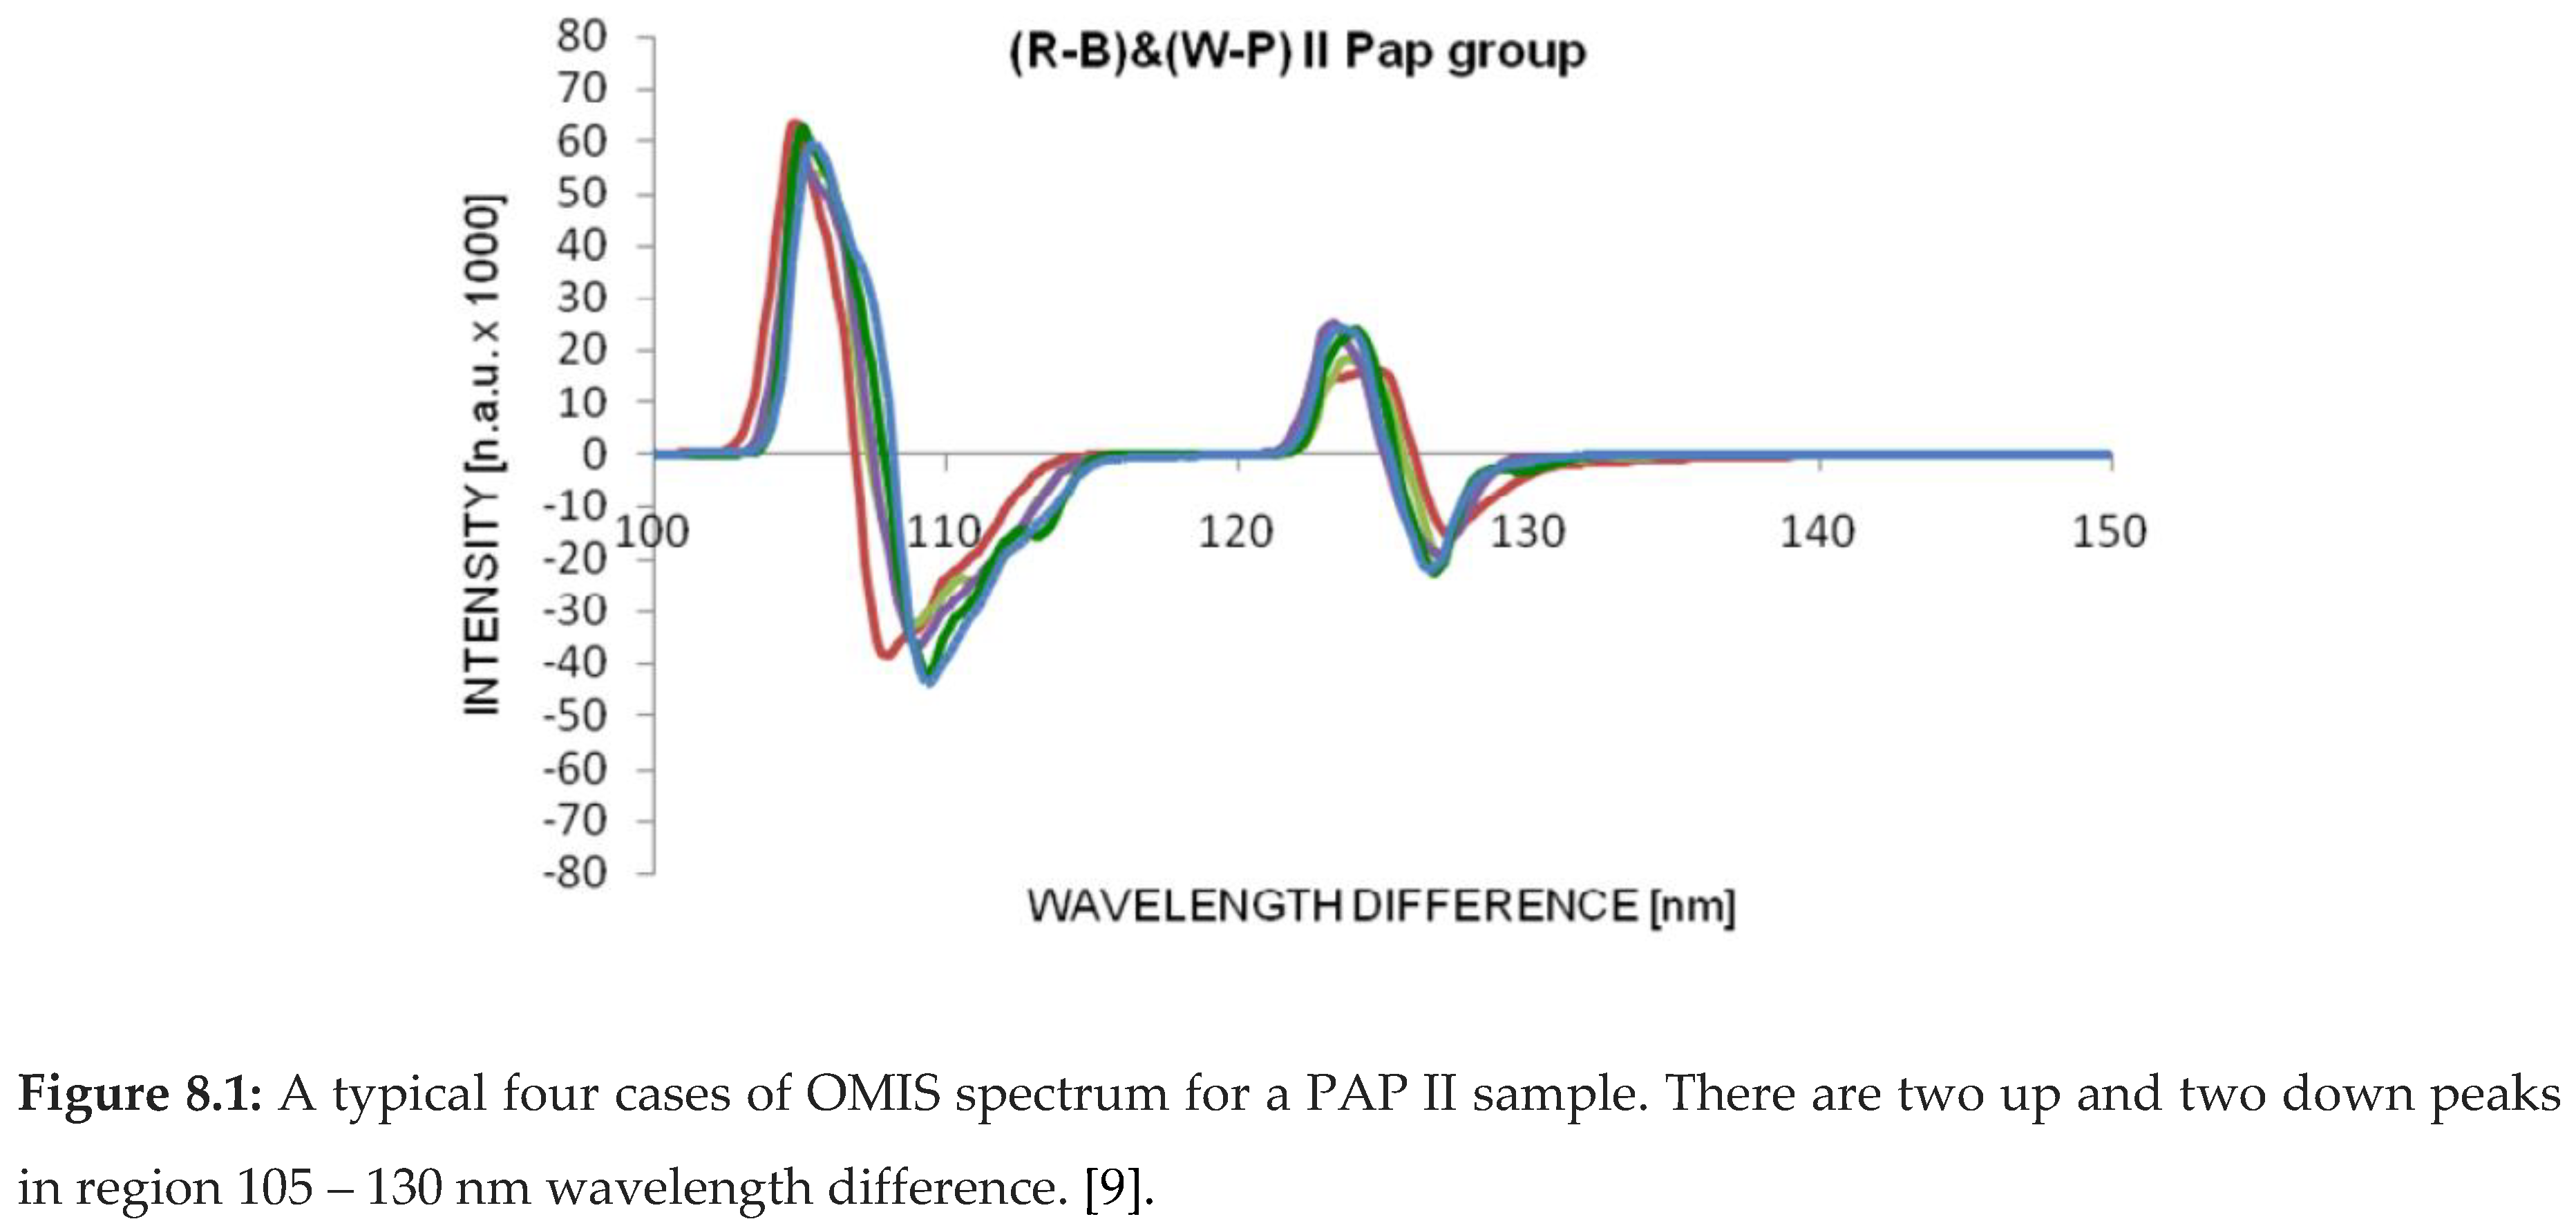
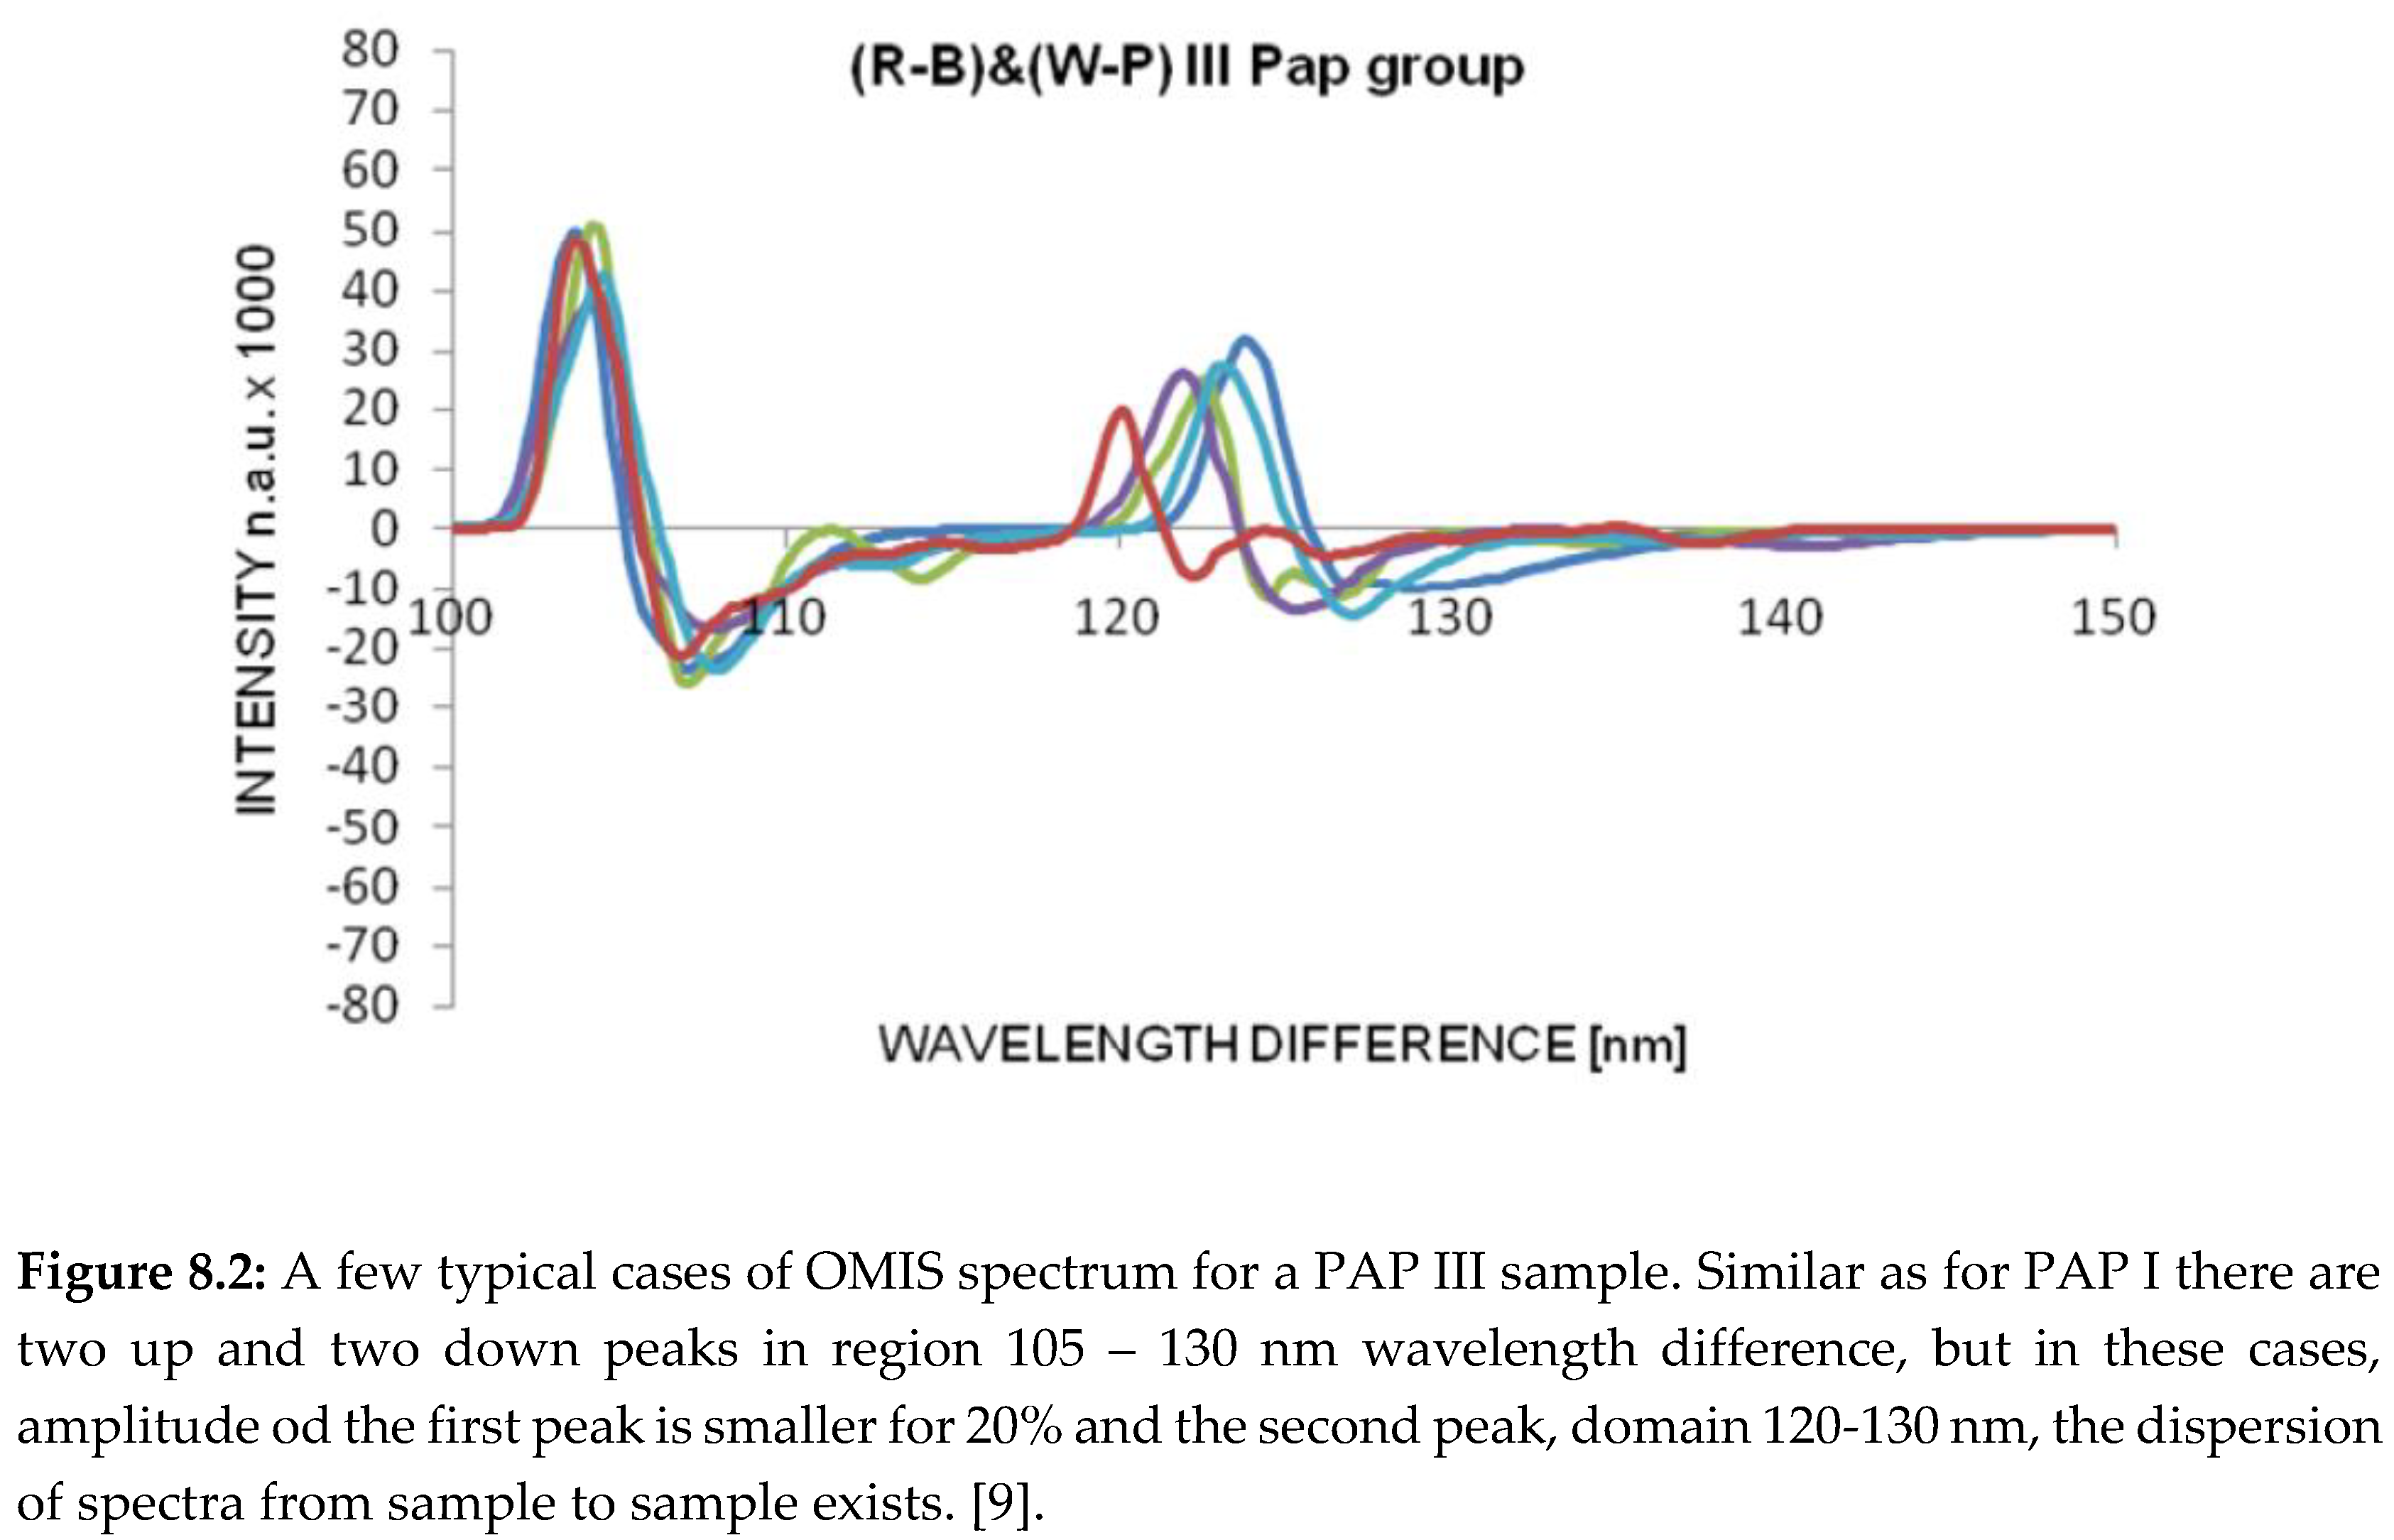
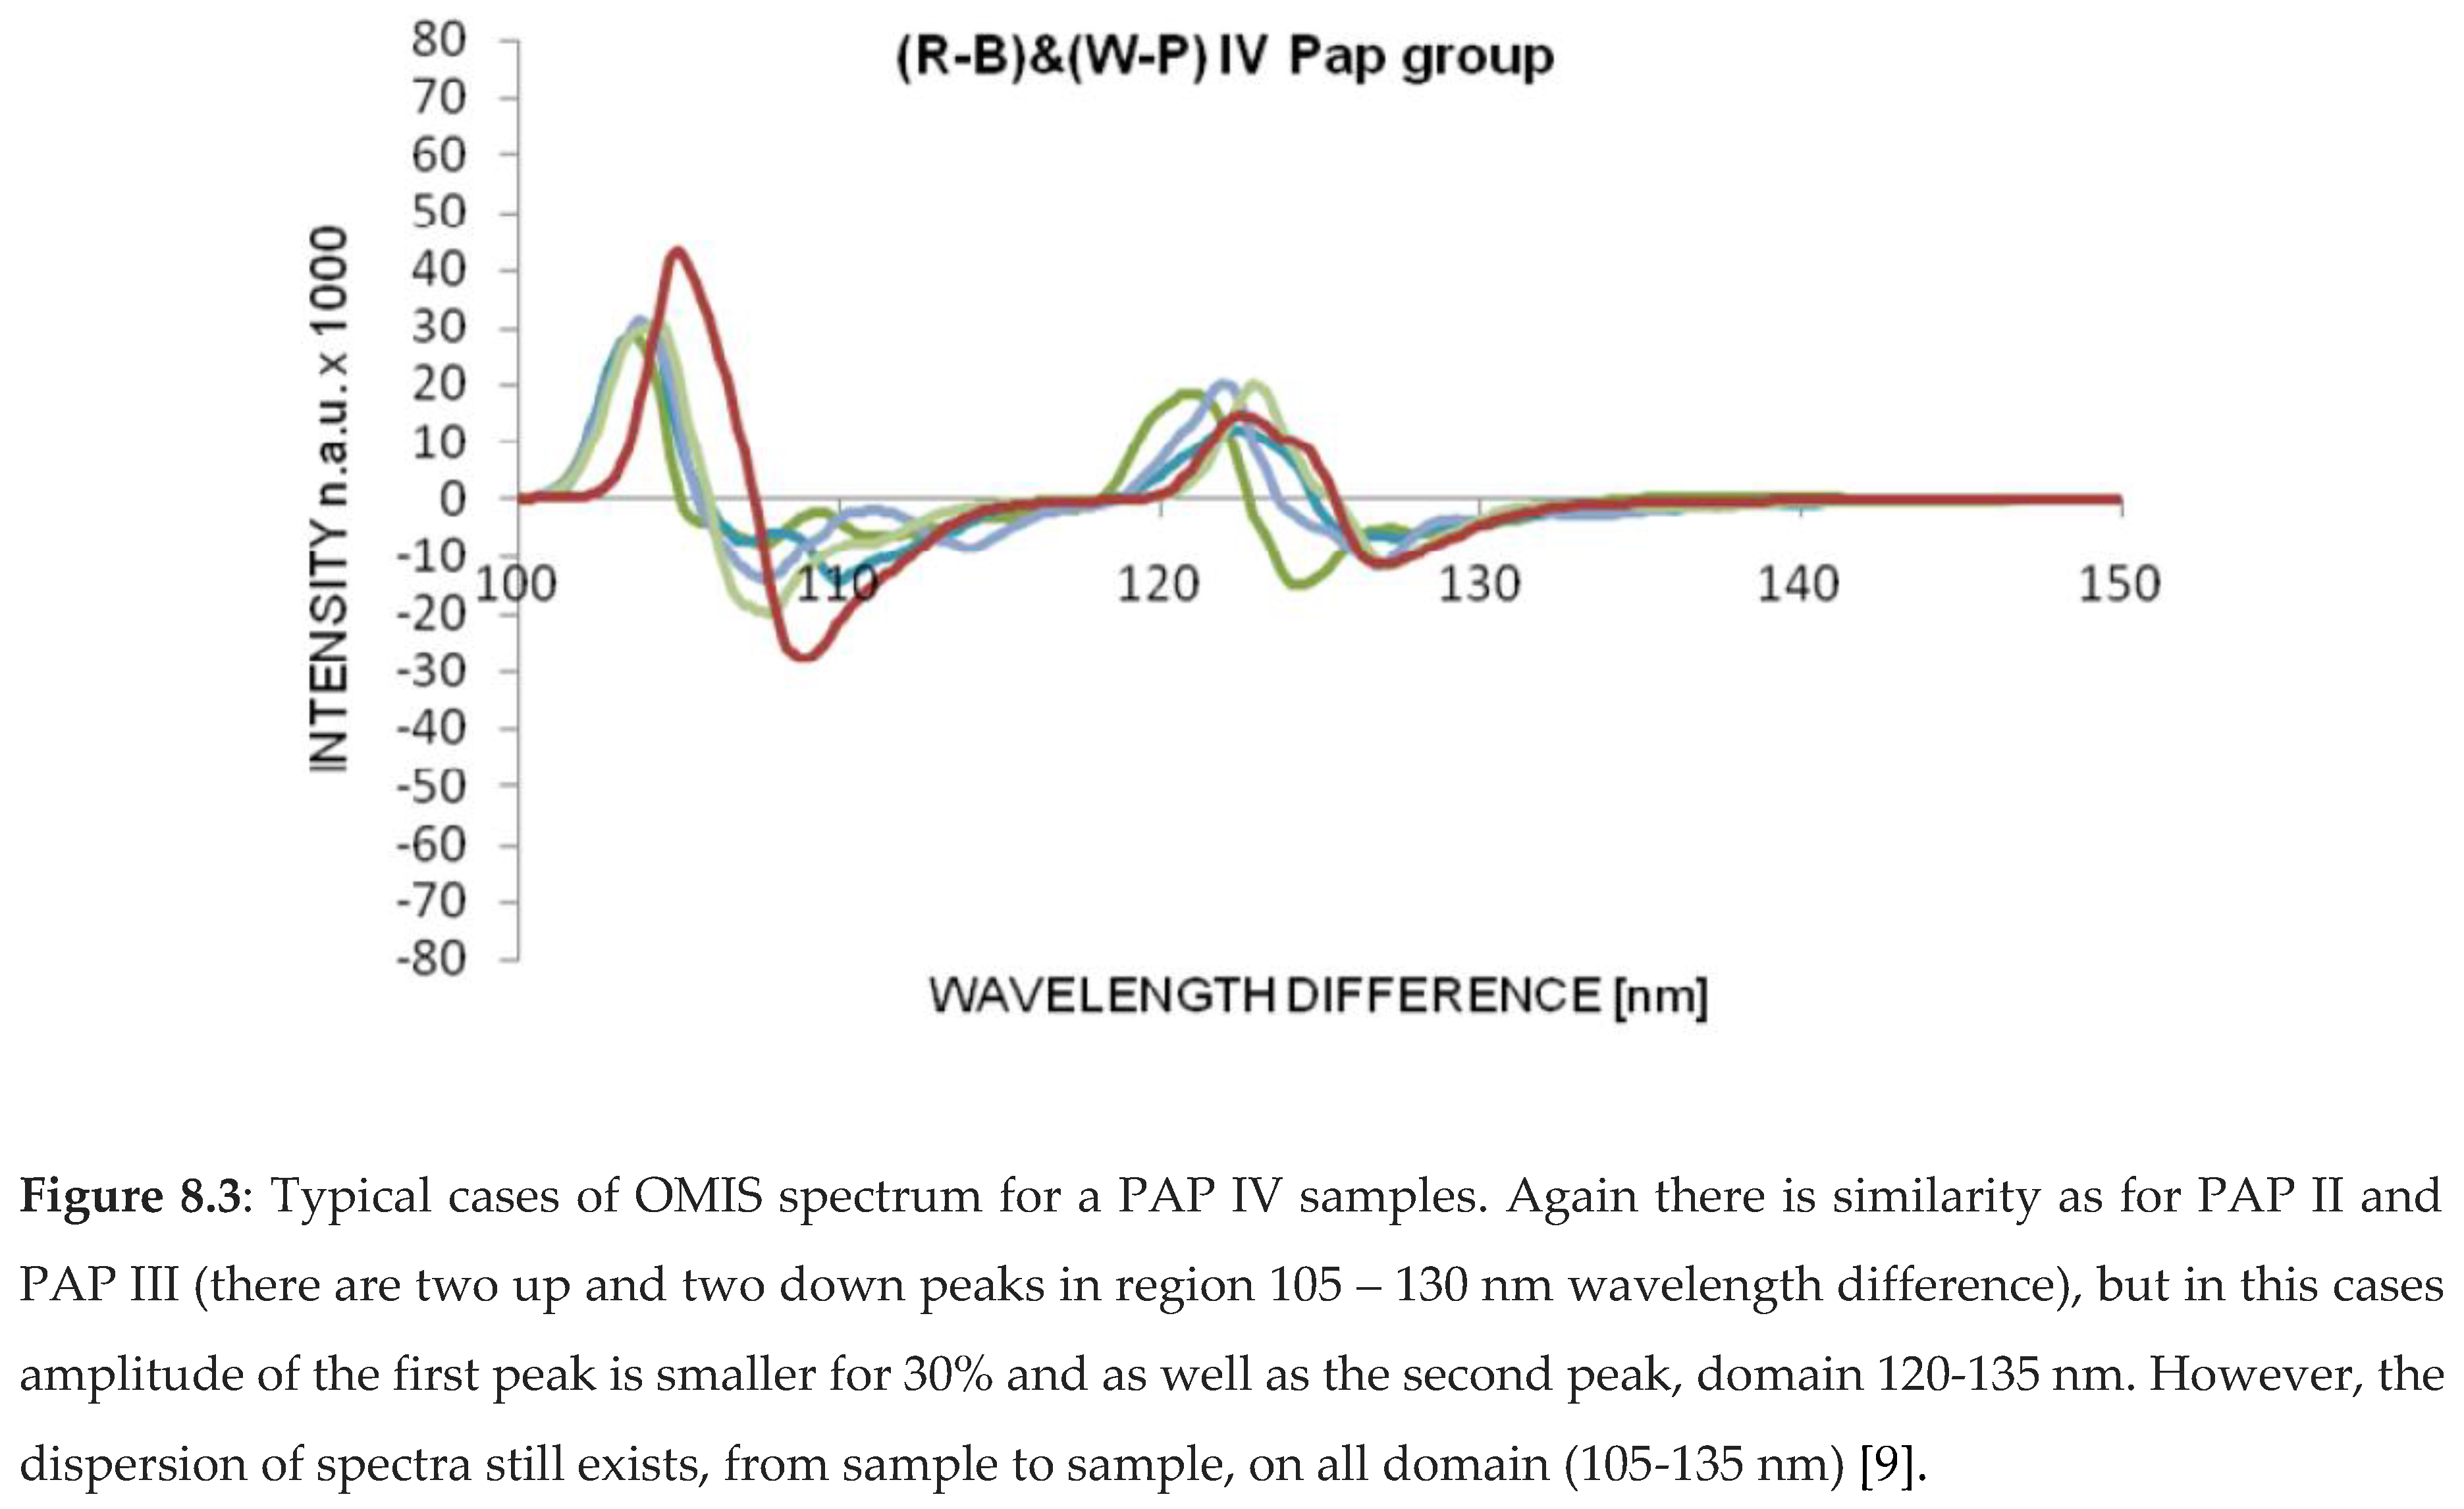
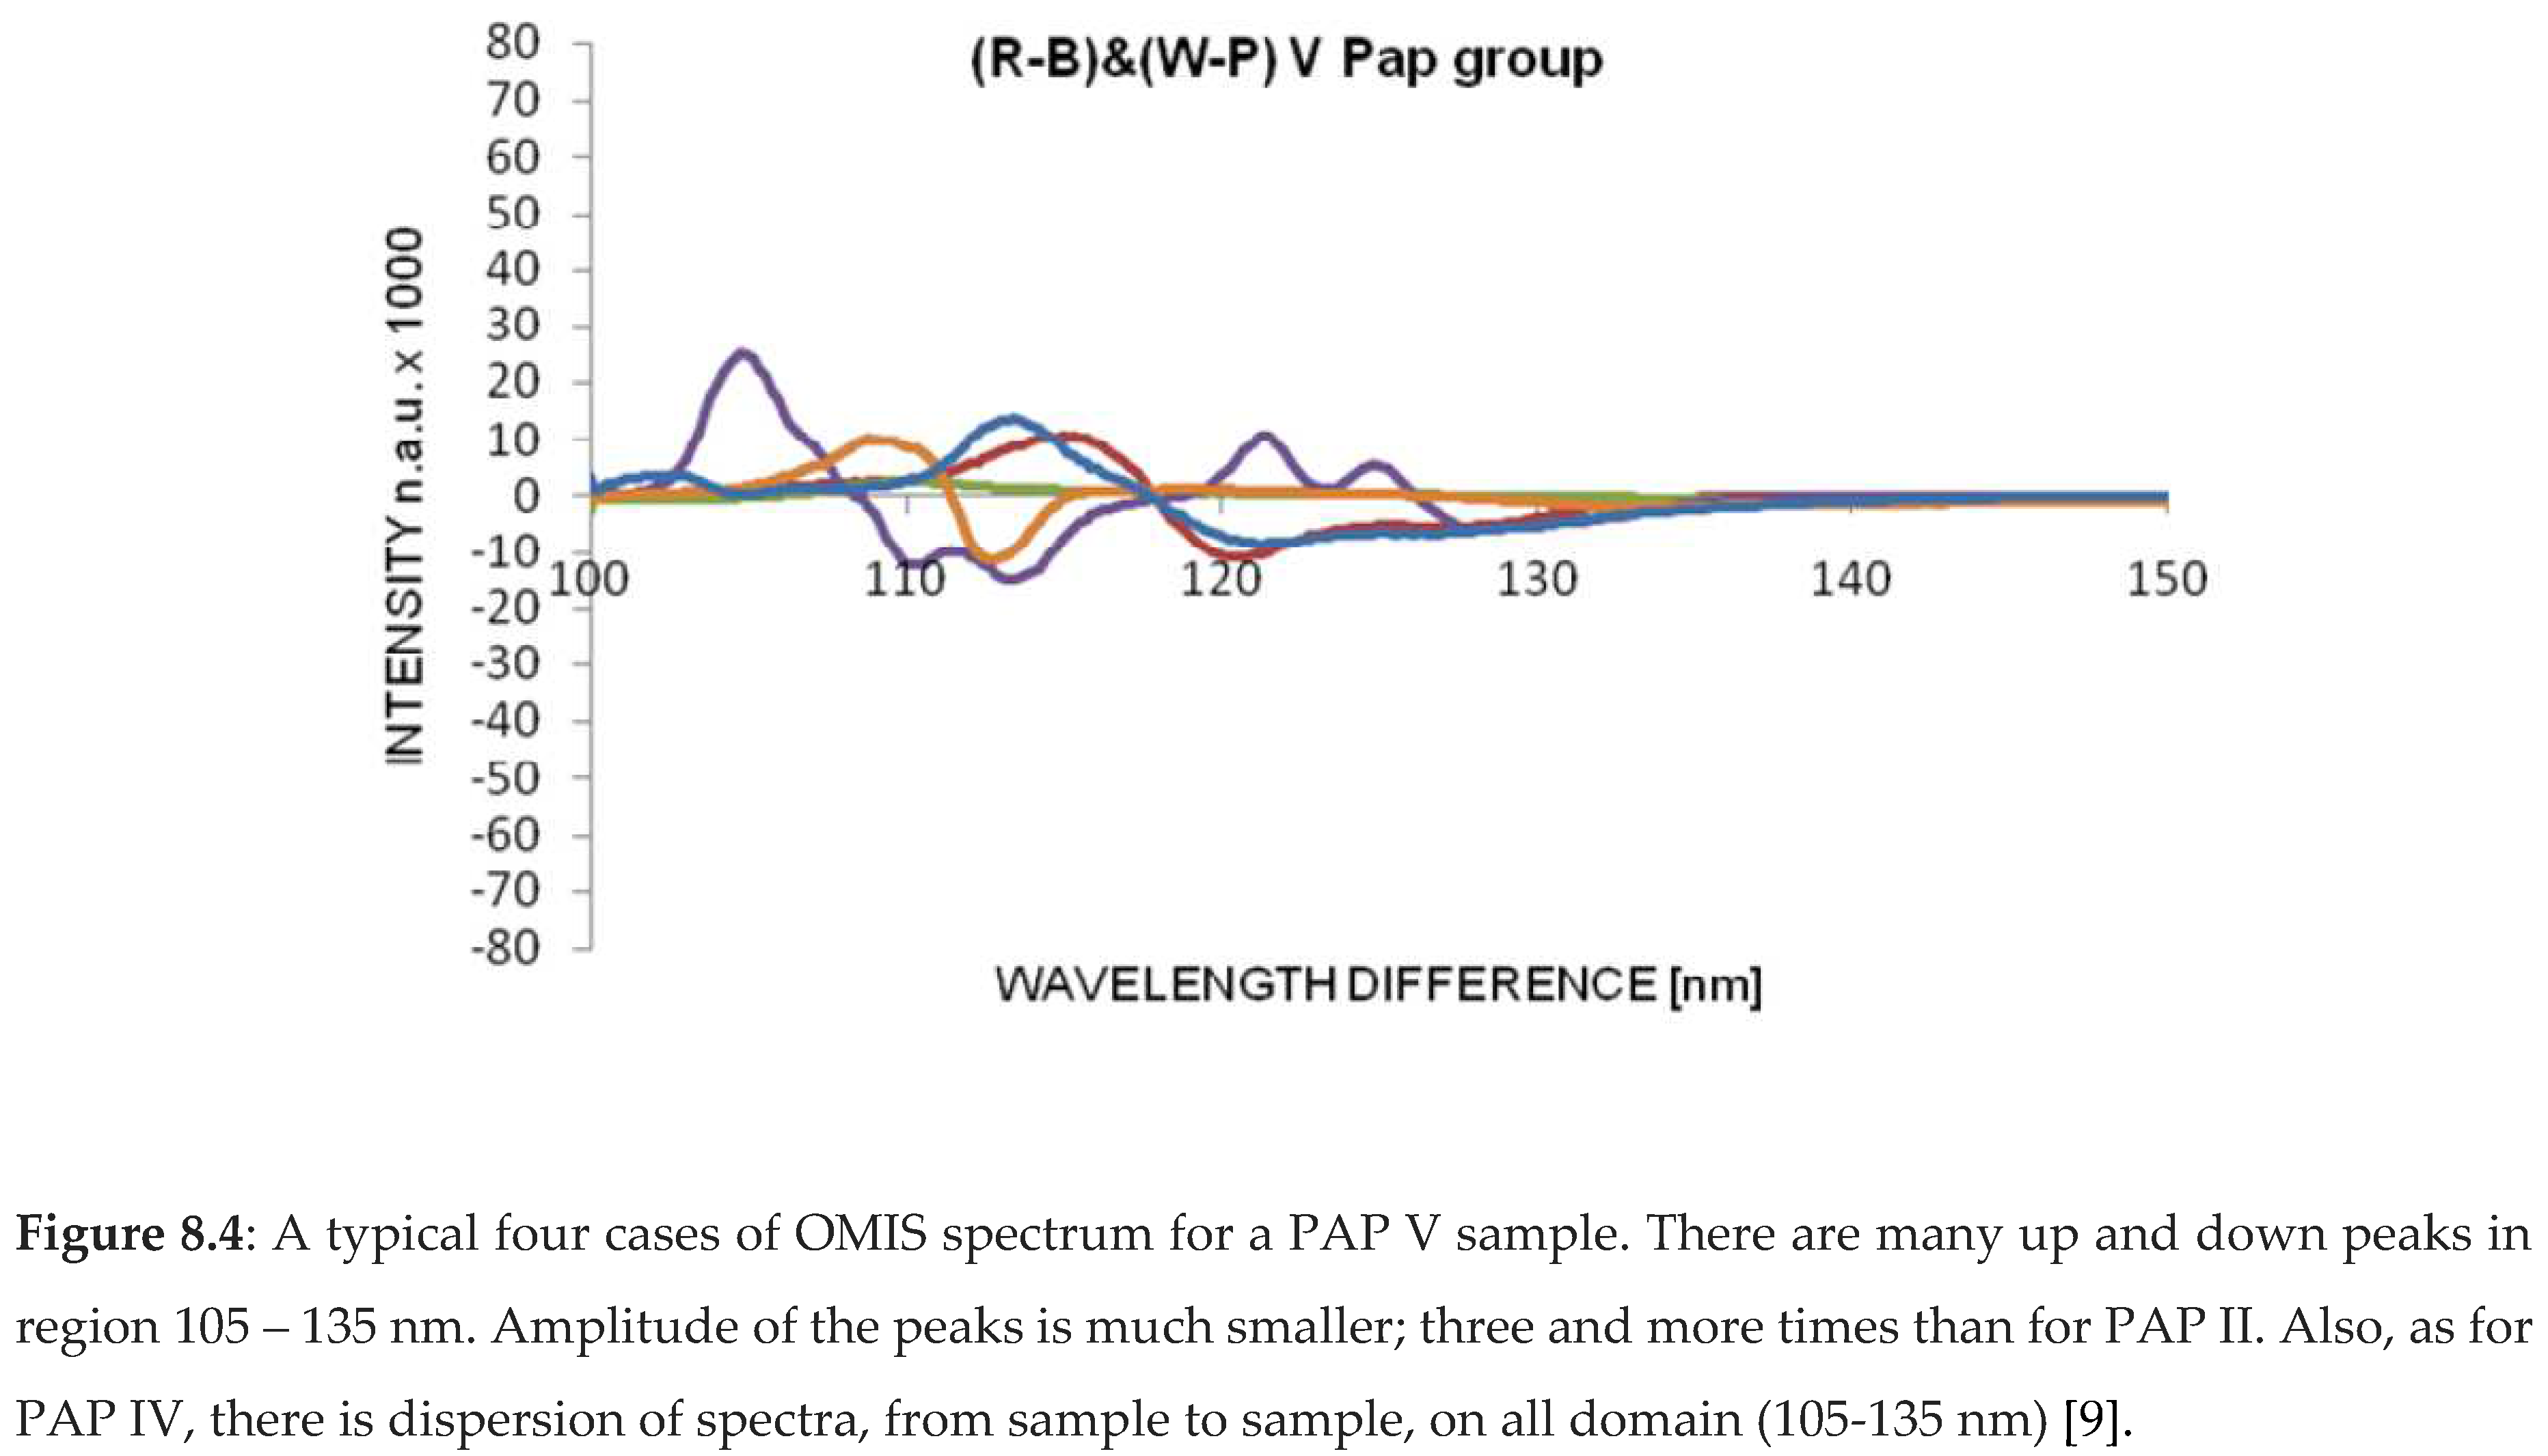
OMIS spectra for PAP II (healthy tissue), PAP III (inflammatory), PAP IV (pre-cancerous) and PAP V (cancer) samples are presented in diagrams (Figure 8.1-4).
3.1.3. OMIS and Colon
In the initial feasibility study of OMIS to provide a non-invasive method for the differentiation between healthy and tumour tissues in colon (healthy colon tissue and colon adenocarcinoma). Tissue samples were obtained from 70 human patients with colonic adenocarcinoma, having histopathology confirmation. Healthy colon tissue was used as control sample for each of the patients. Tumour tissue was investigated and confirmed to various grades and stages. The group included patients of both sexes, aged 19 to 85 years. After surgical resection, each removed colon sample was first rinsed with purified water to exclude surface blood and then placed on equipment especially designed for OMIS. Digital images of healthy tissue and neoplasms were taken ten times per each sample under white diffuse and polarized light, 1 hour and 4 hours after removal of the tissue. The imaging of healthy tissue was at least 8 cm from the tumour. After imaging, the tissue sample was fixed in formalin for further histopathology examination. Specificity was 100%, sensitivity 92.98%, accuracy 96.43%, and Kappa 0.9286.[9].
In the second study, 316 samples of colon tissues were investigated [
12]. Compared with histopathology examination, the OMIS method achieved an accuracy of 92.59% using Multilayer Perceptron Neural Network as a classifier, and 89.87% using Naïve-Bayes classifier. This results strongly suggest that non-disruptive OMIS method might be used for tissue characterization
ex vivo to discriminate between the healthy and cancerous state of the colon.
Figure 9.
Typical OMIS spectrum for colon tissue: healthy and cancerous. In healthy tissue, four peaks appear, two up and two down in the wavelength difference range of 105-135 nm, while in cancerous tissue the spectrum is of lower intensity and irregular throughout the spectrum.[
9].
Figure 9.
Typical OMIS spectrum for colon tissue: healthy and cancerous. In healthy tissue, four peaks appear, two up and two down in the wavelength difference range of 105-135 nm, while in cancerous tissue the spectrum is of lower intensity and irregular throughout the spectrum.[
9].
3.1.4. OMIS and Oral Cavity
In this study 46 samples were investigated to separate tumour (OSCC – oral squamous cell carcinoma) from adjacent non-tumour oral cavity tissue. [
13] Samples were taken from a fresh surgical specimen of primary OSCC. Digital imaging of samples was performed within 60 min of resection using OMIS device. Images were processed through a specifically designed convolution algorithm based on light-matter interaction.
The results presented in
Table 2 show that three of the algorithms (NB, RF and SVM) have the same accuracy of 85.71%. However, the best sensitivity or the ability by which the OMIS method can identify the OSCC tissue is achieved with the naïve Bayes me–hod - 100%. This is also associated with the highest AUC value of 0.975 for this particular classifier. It is, therefore, the only classifier where OMIS has presented itself as an excellent discriminative methodology for oral cavity. On the other hand, the Support Vector Machine and the Random Forest algorithms can provide OMIS with a very good discriminative power (0.878 for SVM and 0.857 for RF), while the Decision Tree method might be considered as useless (AUC value of 0.5) (Figure 31b, c, d). However, with the regard to specificity, the Random Forest and Decision Tree are the only classifiers to identify all the normal tissue samples correctly.
The OMIS method generated excellent discriminative power through the Naive Bayes classifier. In separation of the OSCC and normal tissue types an AUC value of 0.975 was obtained. The Random Forest algorithm has shown itself as the most suitable for the OMIS data originating from comparisons between the three groups of stained samples. An overall accuracy of up to 86.11%, sensitivity of up to 100%, a specificity of up to 88.89% and the AUC value of up to 0.917 was registered during these differentiations. All the applied algorithms on the OMIS data from unstained as well as stained tissue samples, the Decision Tree algorithm has shown to be the least appropriate for these specific datasets. The OMIS method has shown to be at least as effective as the other optical methods used on oral cavity tissues and in many cases surpassing their performance.[
13].
4. Discussion
4.1. Liquids and Solid
Research using the OMIS method were also performed both for visco-elastic materials (biological tissues) and for liquids and solids. In addition to the above-mentioned results of water and water in the epidermis [6,7], water with different types and concentrations of minerals was also investigated [14]. The obtained results demonstrated that OMIS together with multivariate techniques and neural networks approach can be a valuable asset in characterizing water from the aspect of its structural organization. However, in case of applying OMIS as a routine method for water characterisation it is necessary to perform series of controlled experiments to identify exact correlation between the type of water molecular organization and demonstrated opto-magnetic properties of water. If this goal is possible to achieve, the road for characterizing water from the new – structural aspect with a simple and easily available method could be established.
For the investigation of the structural properties and ultrastructural changes of solid state materials, of a new, used, and fractured NiTi instruments in dentistry, OMIS was used. [15]. The study included three sets of different types of rotary instruments: MTwo (VDW, Munich, Germany), Pro Taper Universal (Dentsply Maillefer, Ballaigues, Switzerland), and BioRace (FKG DENTAIRE Swiss Dental Products, Le Crêt-du-Locle Switzerland). Root canal shaping was performed on root canals with different curvatures, and after intra-canal fracture, instruments of the same type were successfully analysed using OMIS.
Also, Magnetic Force Microscopy (MFM) and Opto-Magnetic Spectroscopy (OMS) were used to characterize solid state materials, such as HTCV stainless steel and aluminium. [16]. Both materials were immersed in 1.0M HCl and 1.0M CH3COOH solutions for two hours. The OMS method showed that treated materials exhibited differences in peak wavelengths. Topographical and magnetic features for steel plate samples showed better resistance to an aggressive medium compared to aluminium. The results and analysis of these investigations are compared to MFM results and it was found that structural changes of materials at the micro level are the same but at nano level MFM results are for about 20% better.
Comparative analysis of thin films using UV-Vis-NIR and OMIS was investigated. [22].The aim of this research was to characterize and compare two materials, standard glasses material and standard glasses material with C60 thin film layer. According to opto-magnetic imaging spectroscopy results shown that there is a dramatic difference in the values of the positive and negative peaks on wavelength difference (nm)-Intensity (n.a.u.) of those two materials. The nano film glass has lower RGB intensities at approximately the same wavelengths in comparison to the standard glass material, which is of great importance for the further experiments and OMIS application in this field.
The investigation of influence of three types of contact lenses on different aqueous solutions, which are similar to tear film is done using Opto-magnetic imaging spectroscopy method and IR spectroscopy. [23,24]. The diagrams acquired by opto-magnetic imaging spectroscopy method show the differences and similarities for the same class of samples as well as for different classes. From the plot of the average spectrums for aqua purificata and the SP40 contact lens submerged in aqua purificata , one can see that four peaks appears, two positive and two negative. The variation in the intensity of the peaks and the shift in the change of wavelengths in the OMIS diagram well describe the differences obtained in different conditions.
In addition, comparative study of hormesis-threshold biodosimetric model and the opto-magnetic imaging spectroscopy method in characterization of biophysical properties of pulmonary tissue is done. [25] OMIS method was performed by ILT 350 (International Light Technology, USA). Transmittance W/m2 was evaluated in the range of 380-780 nm. The graph obtained by applying the neural network can be used for the assessment of the dose-response relationship regarding smoking and radiation effects at low-doses. Both approaches, biodosimetric method based on apoptotic parameters and artificial intelligence method (using OMIS data) provide a clearer distinction of non-smokers, smokers, and smokers with lung cancer according to apoptotic parameters and smoking exposure.
4.2. In Situ Detection of Bacteria in Blood
Bacteraemia, leading to sepsis is potentially life-threatening condition. Successful antibiotic treatment is dependent on the identification of the bacterial species, that can take hours or days to complete. We performed feasibility study to test whether OMIS can be used for the detection of bacteria in blood. Commercially available human blood spiked with a defined concentration multidrug resistant
Staphylococcus aureus, derived from a clinical isolate was used. [26] Three concentrations of bacteria of 1 × 10
6, 1 × 10
5 and 1 ×10
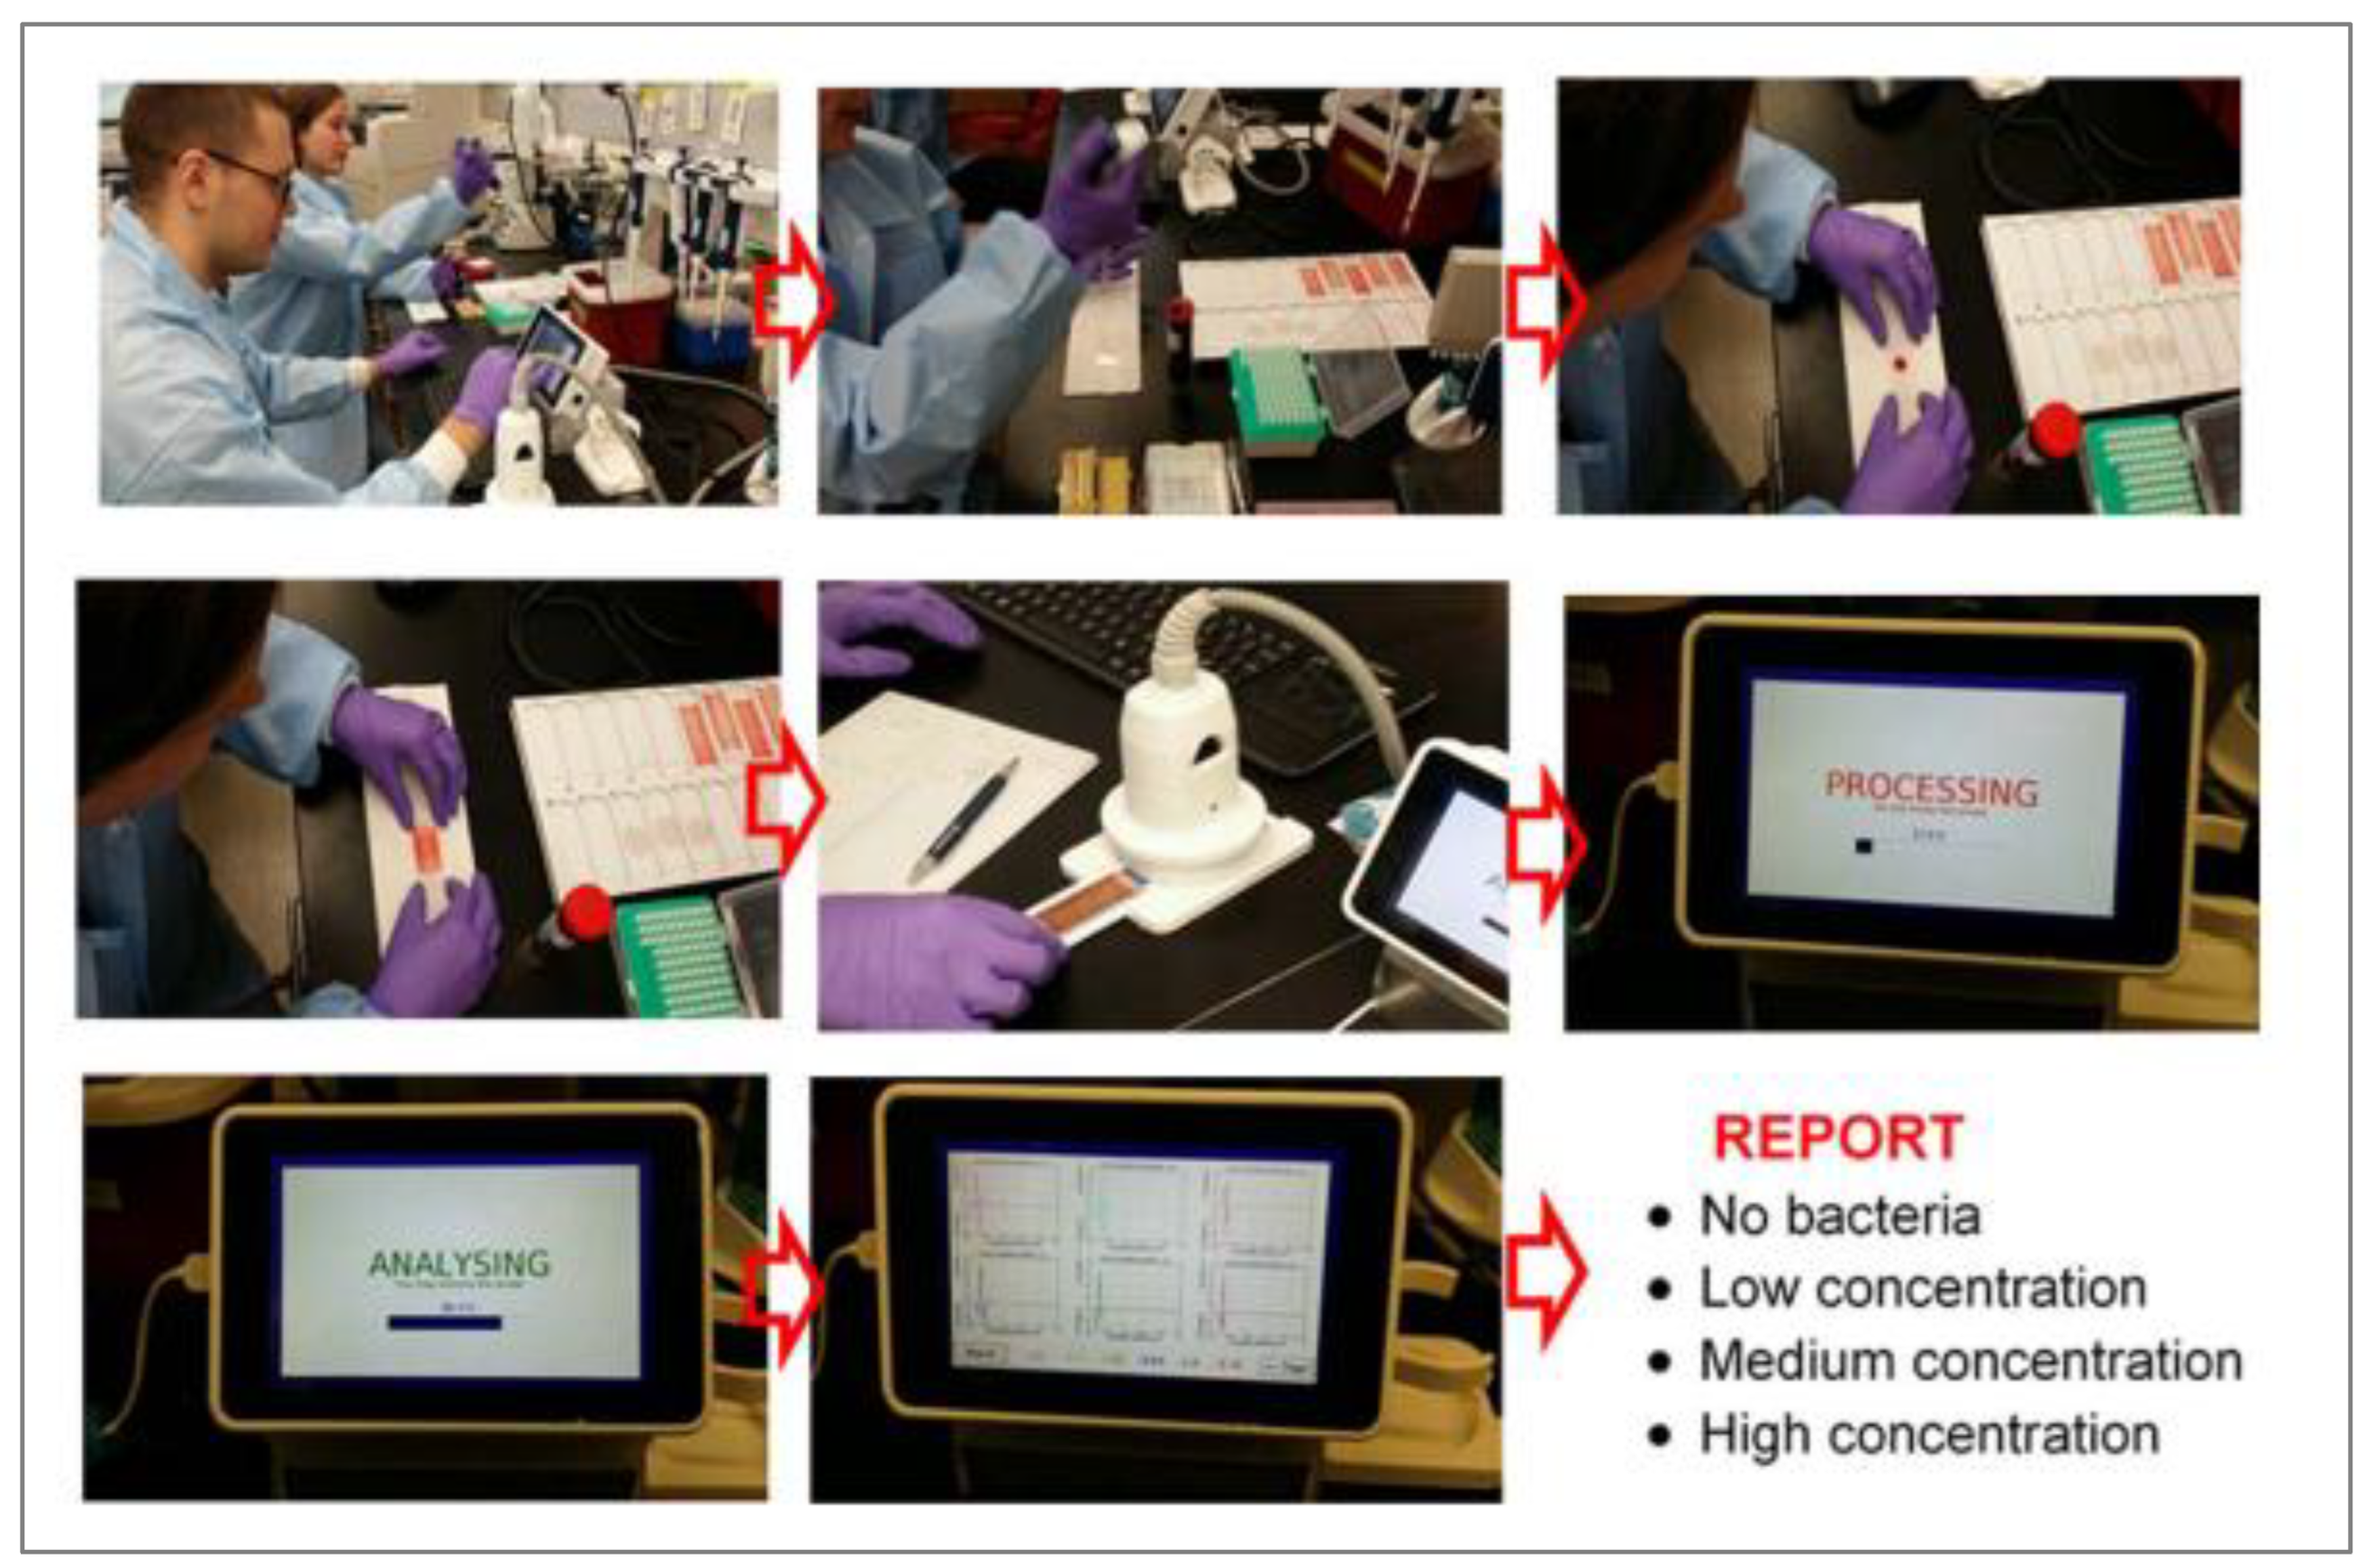
4 CFU/mL are set, corresponding to High (H), Medium (M) and Low (L) concentrations respectively. A total of 240 samples (60 samples per concentration as well as 60 samples of sterile blood (N)) were investigated (
Figure 10), and the data were analysed using two classifiers: artificial neural network and random forest. Images for the training set and validation sets were separately obtained and used for comparison against true positive values (confirmatory plating on the nutrient agar).(
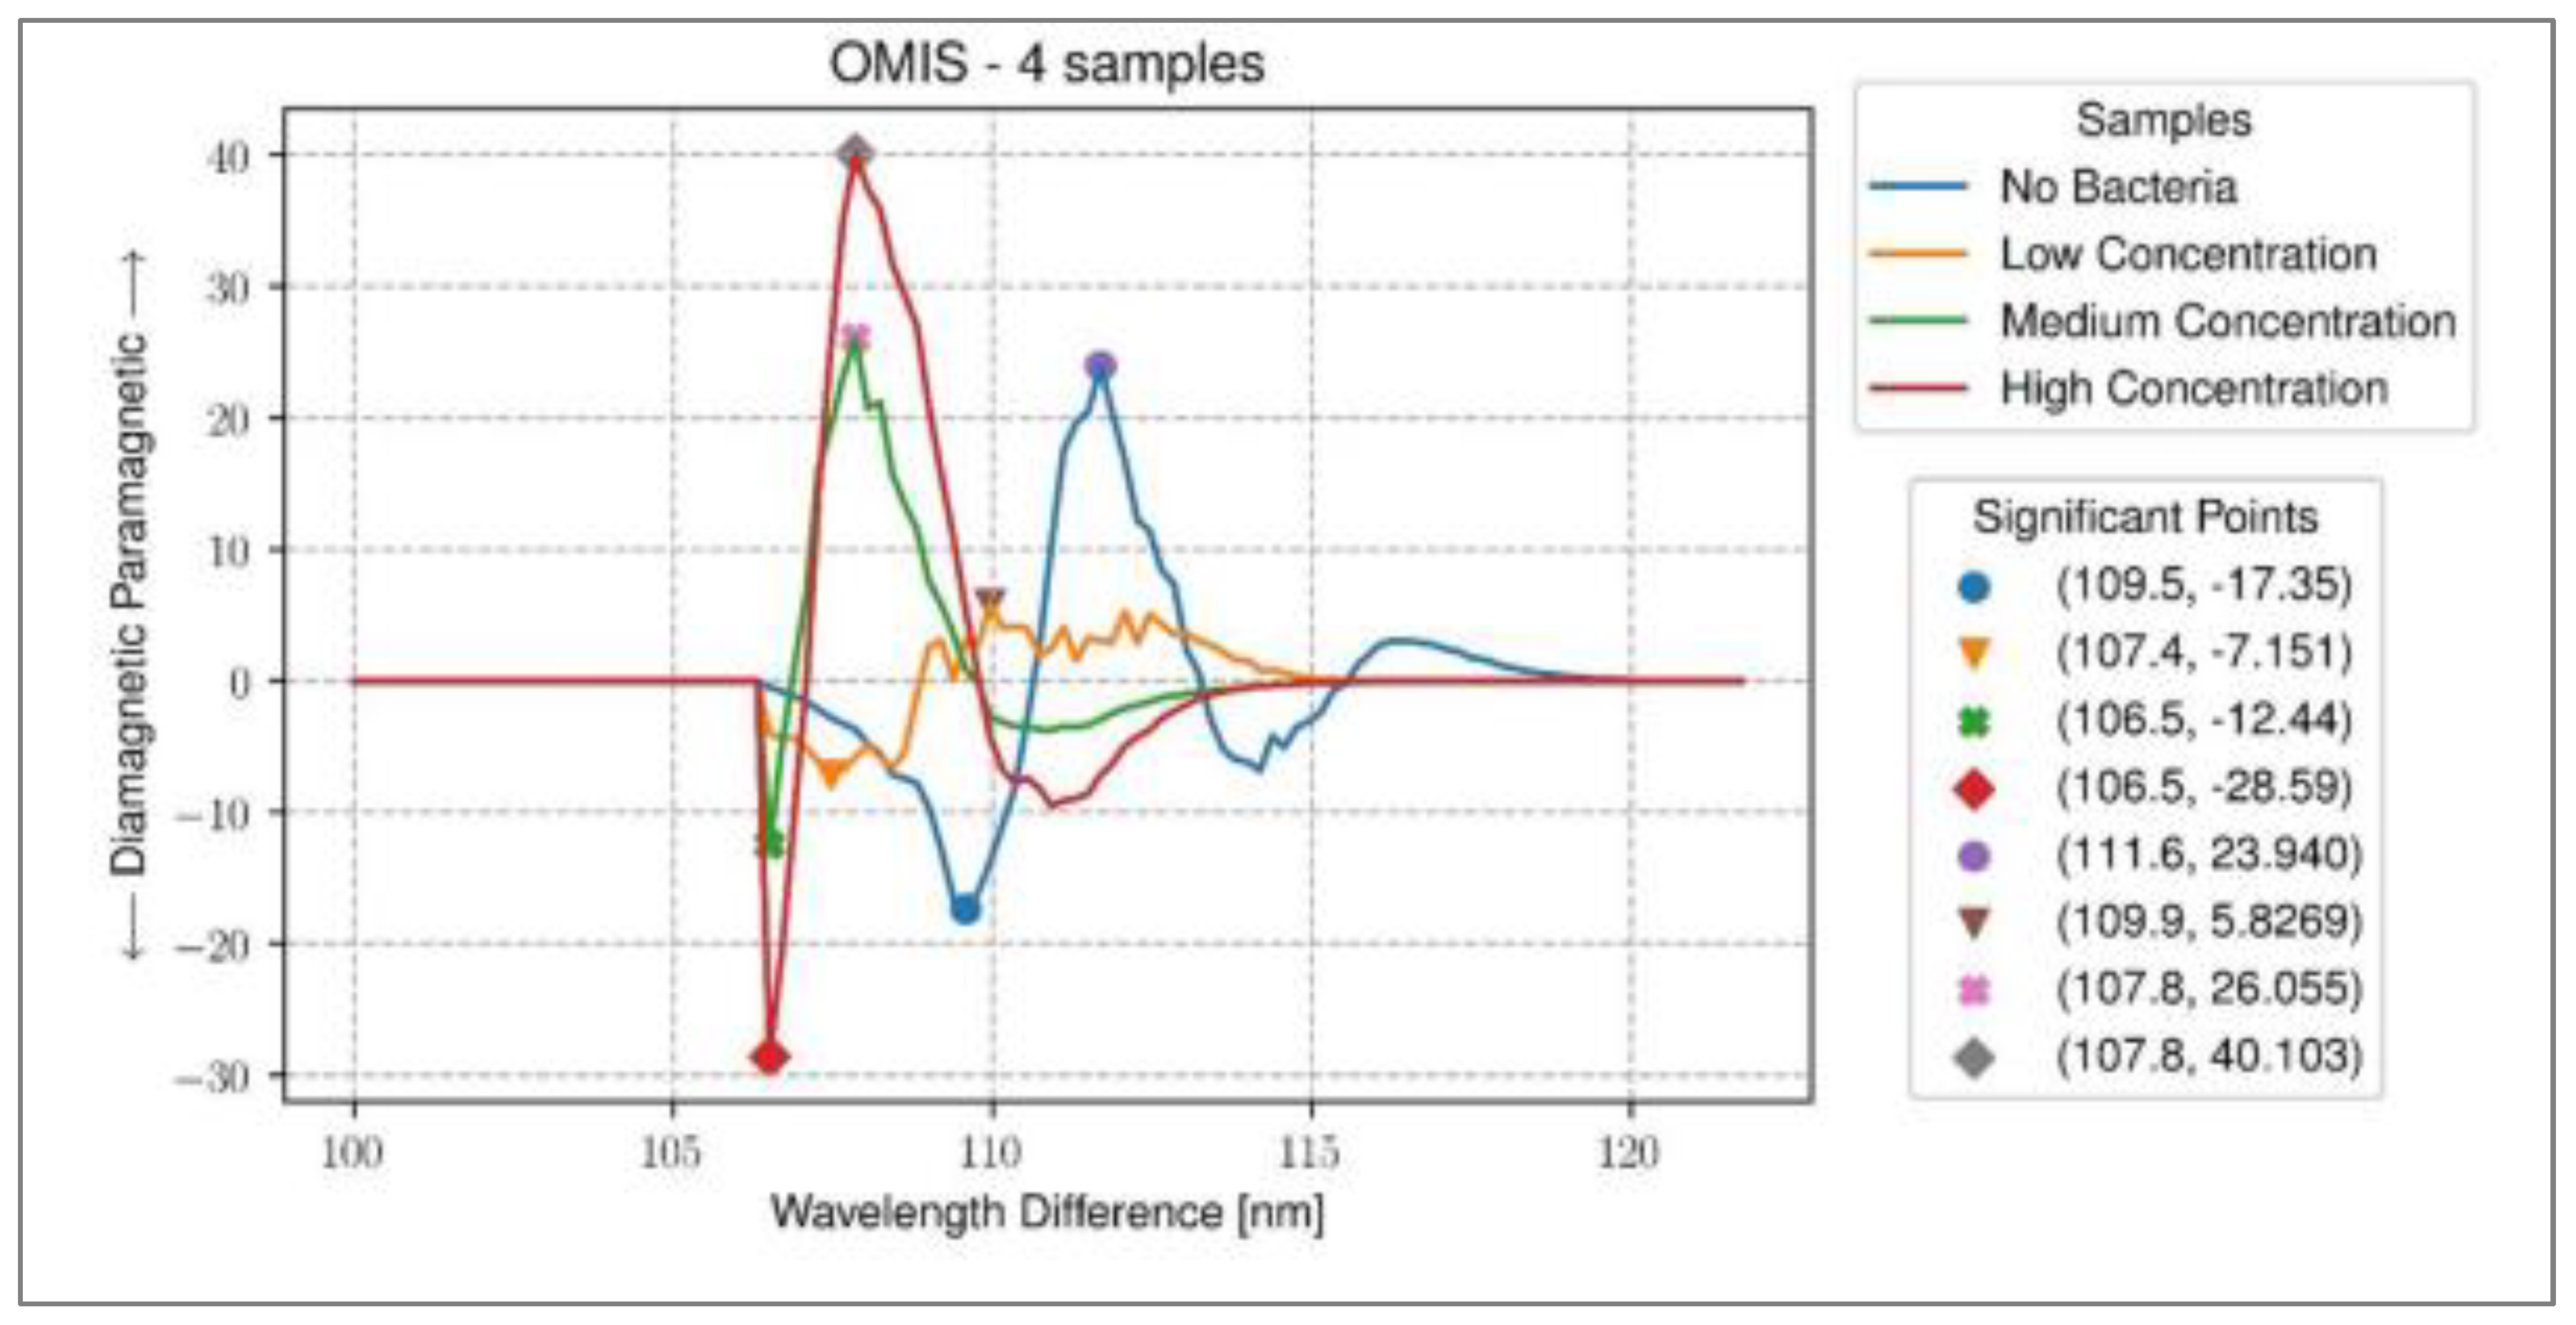
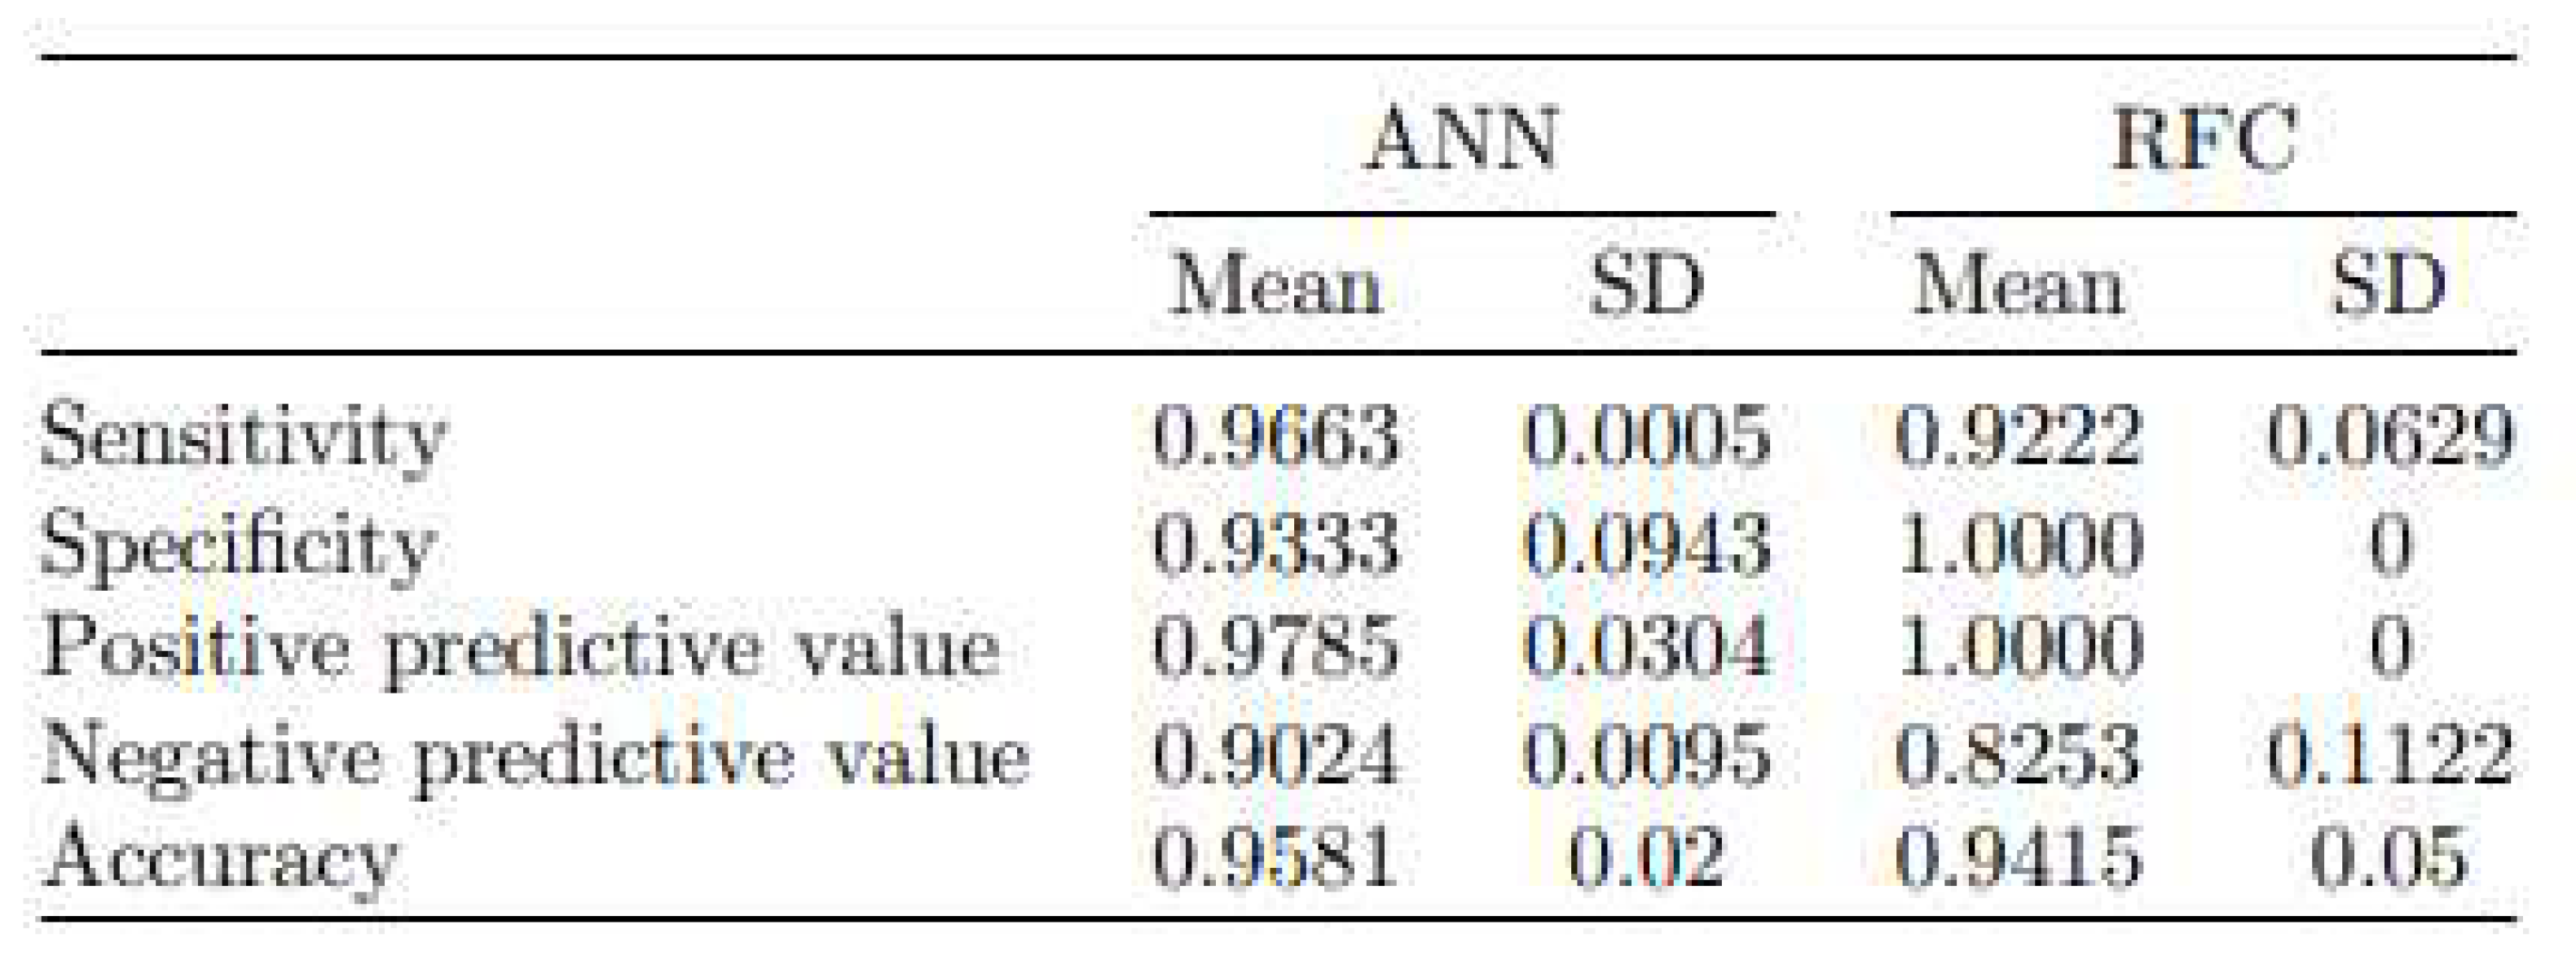
Figure 11). The average score of classification samples in the correct category (N, L, M, H) one-by-one was 95.8% for the ANN algorithm, while for the RF algorithm accuracy was 94.15% (average means that three times different 40 samples (of 240 samples) were chosen, and each prediction test had different sample mixtures). The proximity of the two values of accuracy strongly indicates that the input data (interaction of light with paired and unpaired electrons) and the output data (classification N, L, M, H concentration of bacteria) are in very good correlation (
Table 3).
4.3. Cosmetics
Opto-Magnetic Imaging Spectroscopy (OMIS) has been used for the analysis of the biophysical skin properties (diamagnetic/paramagnetic) after applying three groups of different cosmetic products [27]. Tested cosmetic products were prepared by replacing the active ingredients with 3HFWC or with water in four commercial products. The original commercial creams and their vesicles with water added served as control groups. Data were statistically analysed using paired t test in R software. Difference between paramagnetic/dimagnetic (p+/p−) parameters that showed statistical significance before the treatment and after the treatment obtained for different creams with different types of light ((W-P)(R-B), (W-P) (R-G), (UW-w)) ranges from 0.09 to 2.78. However, for all skin structures (skin surface, epidermis, and dermis) OMIS average difference value ranges from 12% to 32%.
To investigate the moisturizing properties of hyperharmonized fullerenol— 3HFWC+ as an emulsion O/W ingredient on the skin, OMIS was used. [28] The study was conducted on 38 volunteers (female) with no dermatologic diseases and with normal to dry skin. Subject's age ranged from 31 to 69 years (mean age of the participants was 41.3). In this study, OMIS showed that the effect of creams on the biophysical condition of the skin can be determined with great statistical significance.
Since OMIS method is very sensitive to conformation changes in biomolecules, it enabled the demonstration of improvements of biophysical properties of the skin and collagen molecules after the treatment of the skin with cosmetic products which evaluated by OMIS.
4.4. OMIS Method Disadventage and Its Future Improvment
As a part of the discussion, it is necessary to underline the main advantages of the OMIS method compared to other methods that are applied, as well as the main disadvantages of the OMIS method.
Table 3 summarizes the advantages of the OMIS method in comparison to the other five methods used in medical practice. One of the main shortcomings of the OMIS method is presented in
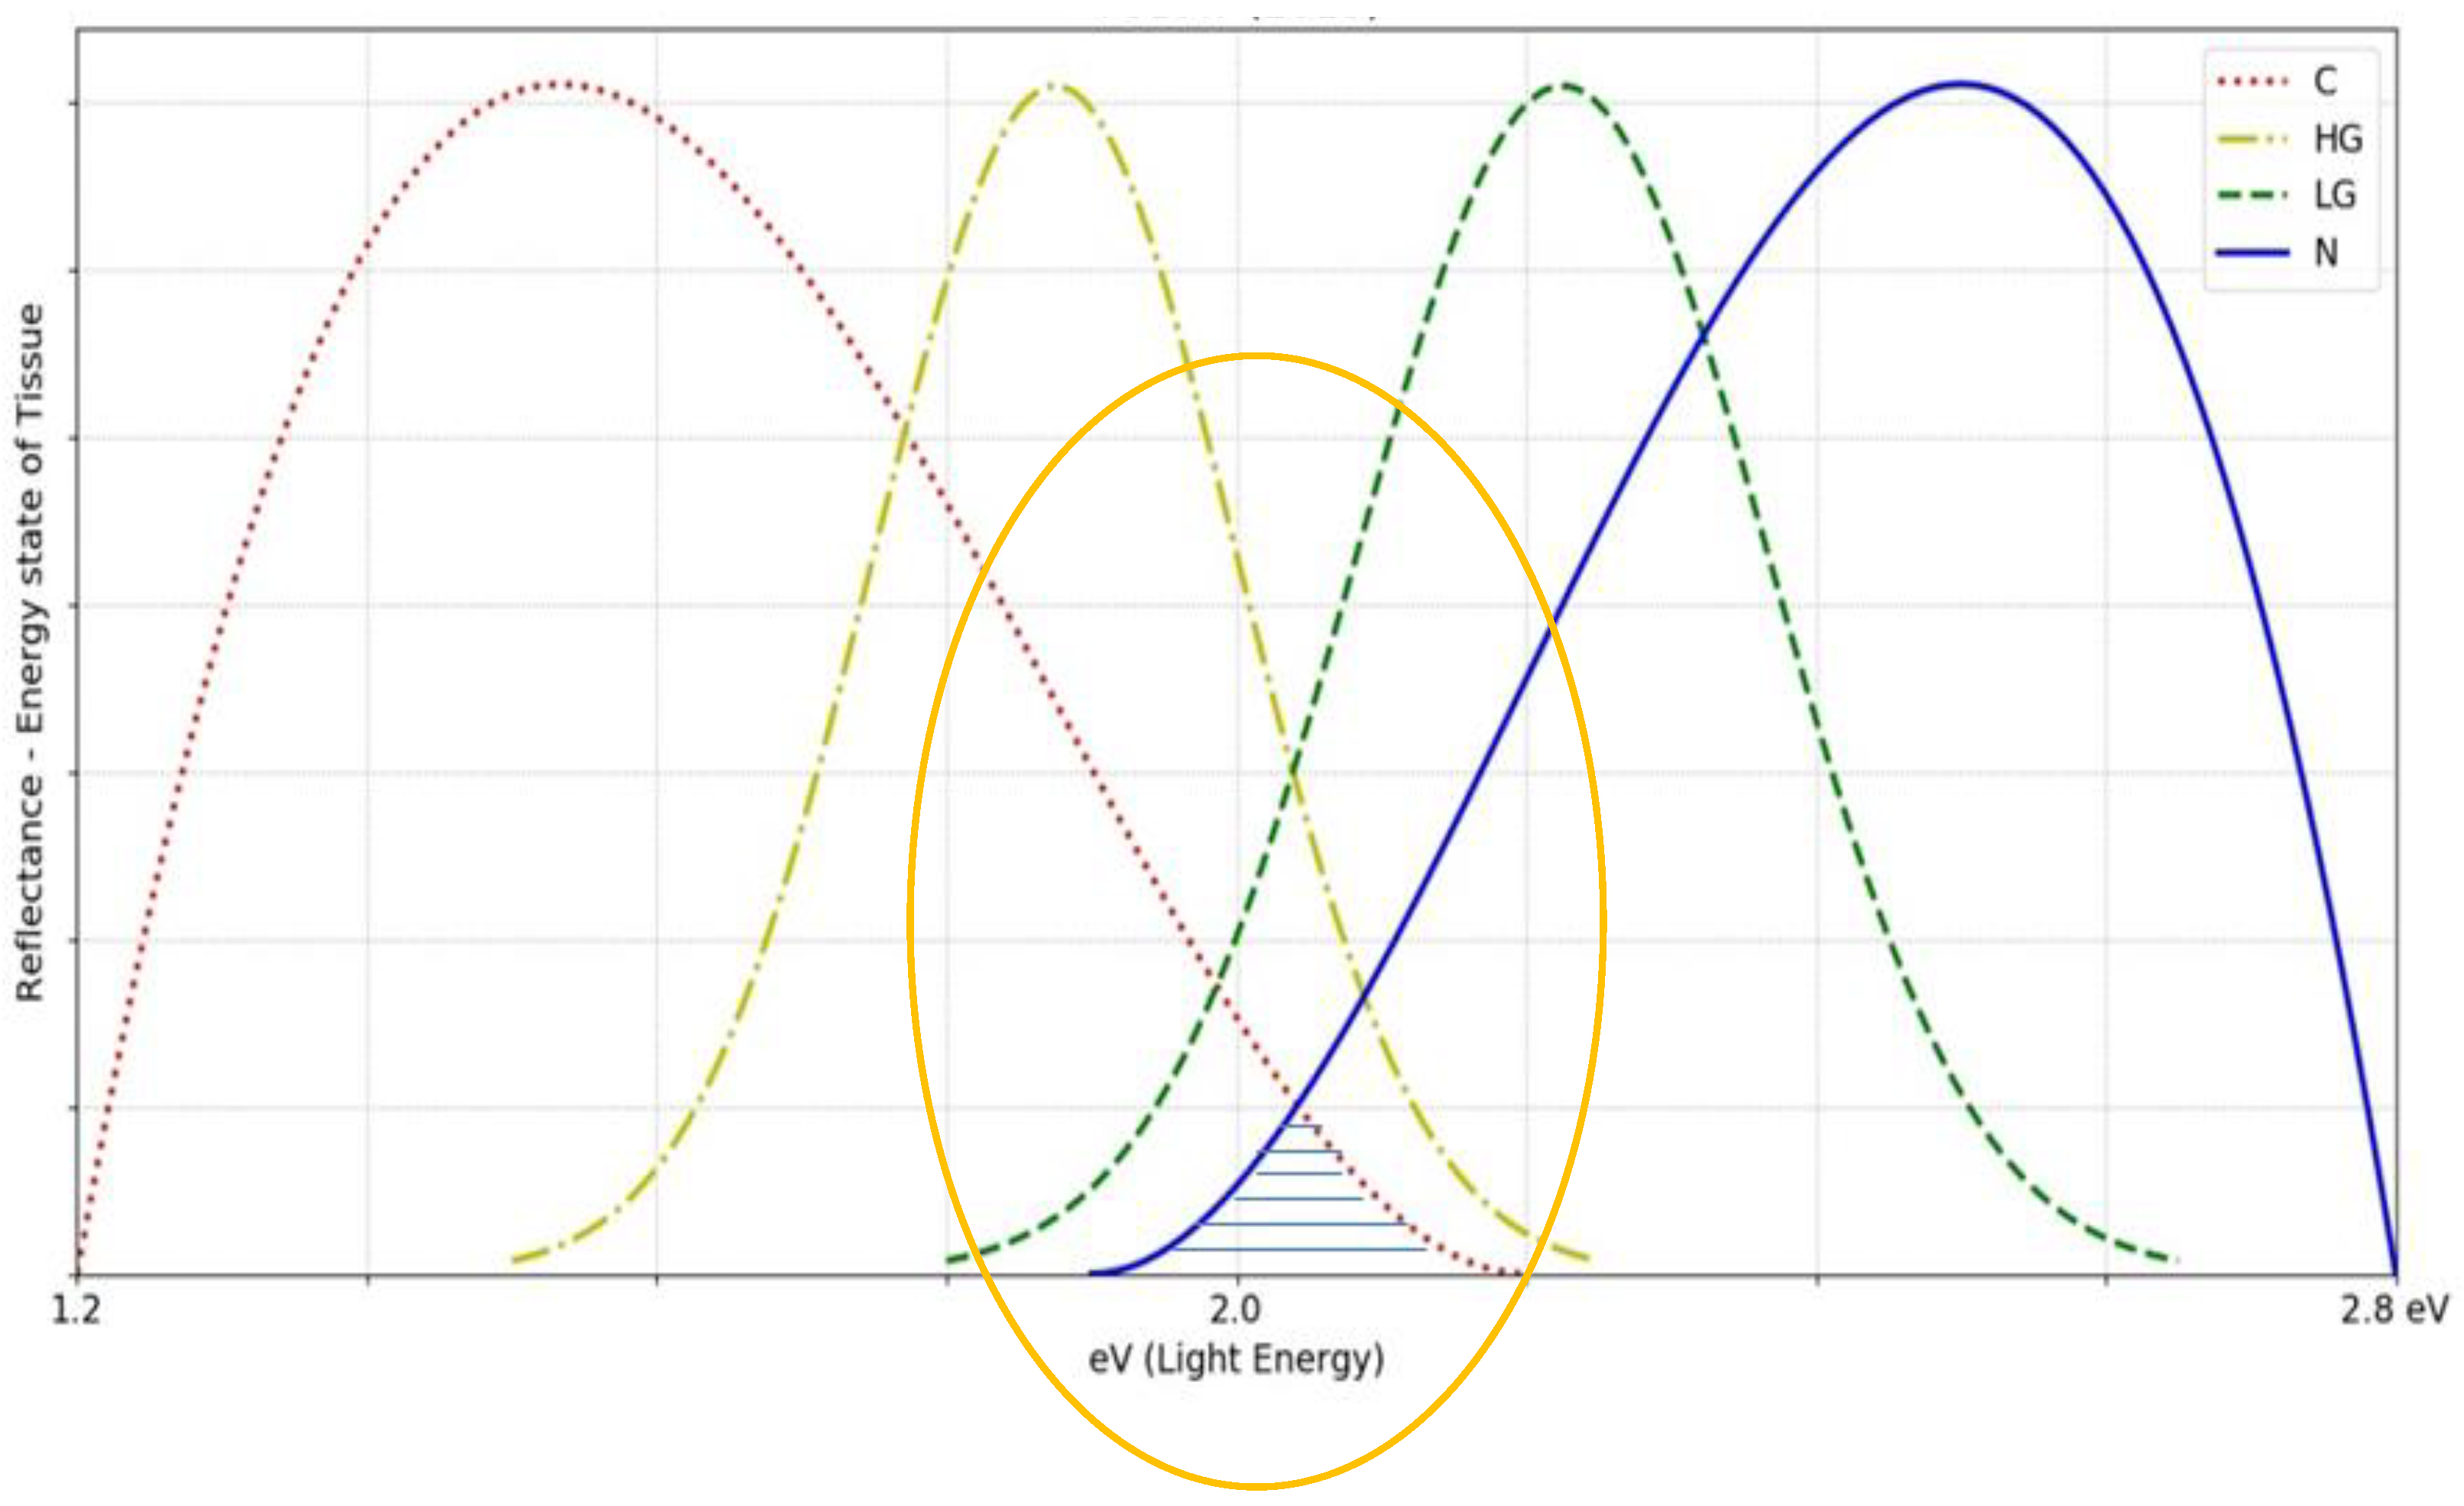
Figure 12, and it refers to the accuracy of the method. The answer to the question of why the values for healthy state and cancer overlap is that sometimes there are more healthy area in the imaged sample than is allowed. This problem is solved by doing an automatic crop, which will be closer and closer to the edge of the diseased tissue. In the part Future direction, more suggestions for hardware and software improvement of the method will be proposed.
Table 3.
Comparison of the OMIS method and the other five methods in the characterization of the cervix by criteria: who works, location for analysis, time for analysis, cost of screening, specificity, sensitivity and accuracy).
Table 3.
Comparison of the OMIS method and the other five methods in the characterization of the cervix by criteria: who works, location for analysis, time for analysis, cost of screening, specificity, sensitivity and accuracy).
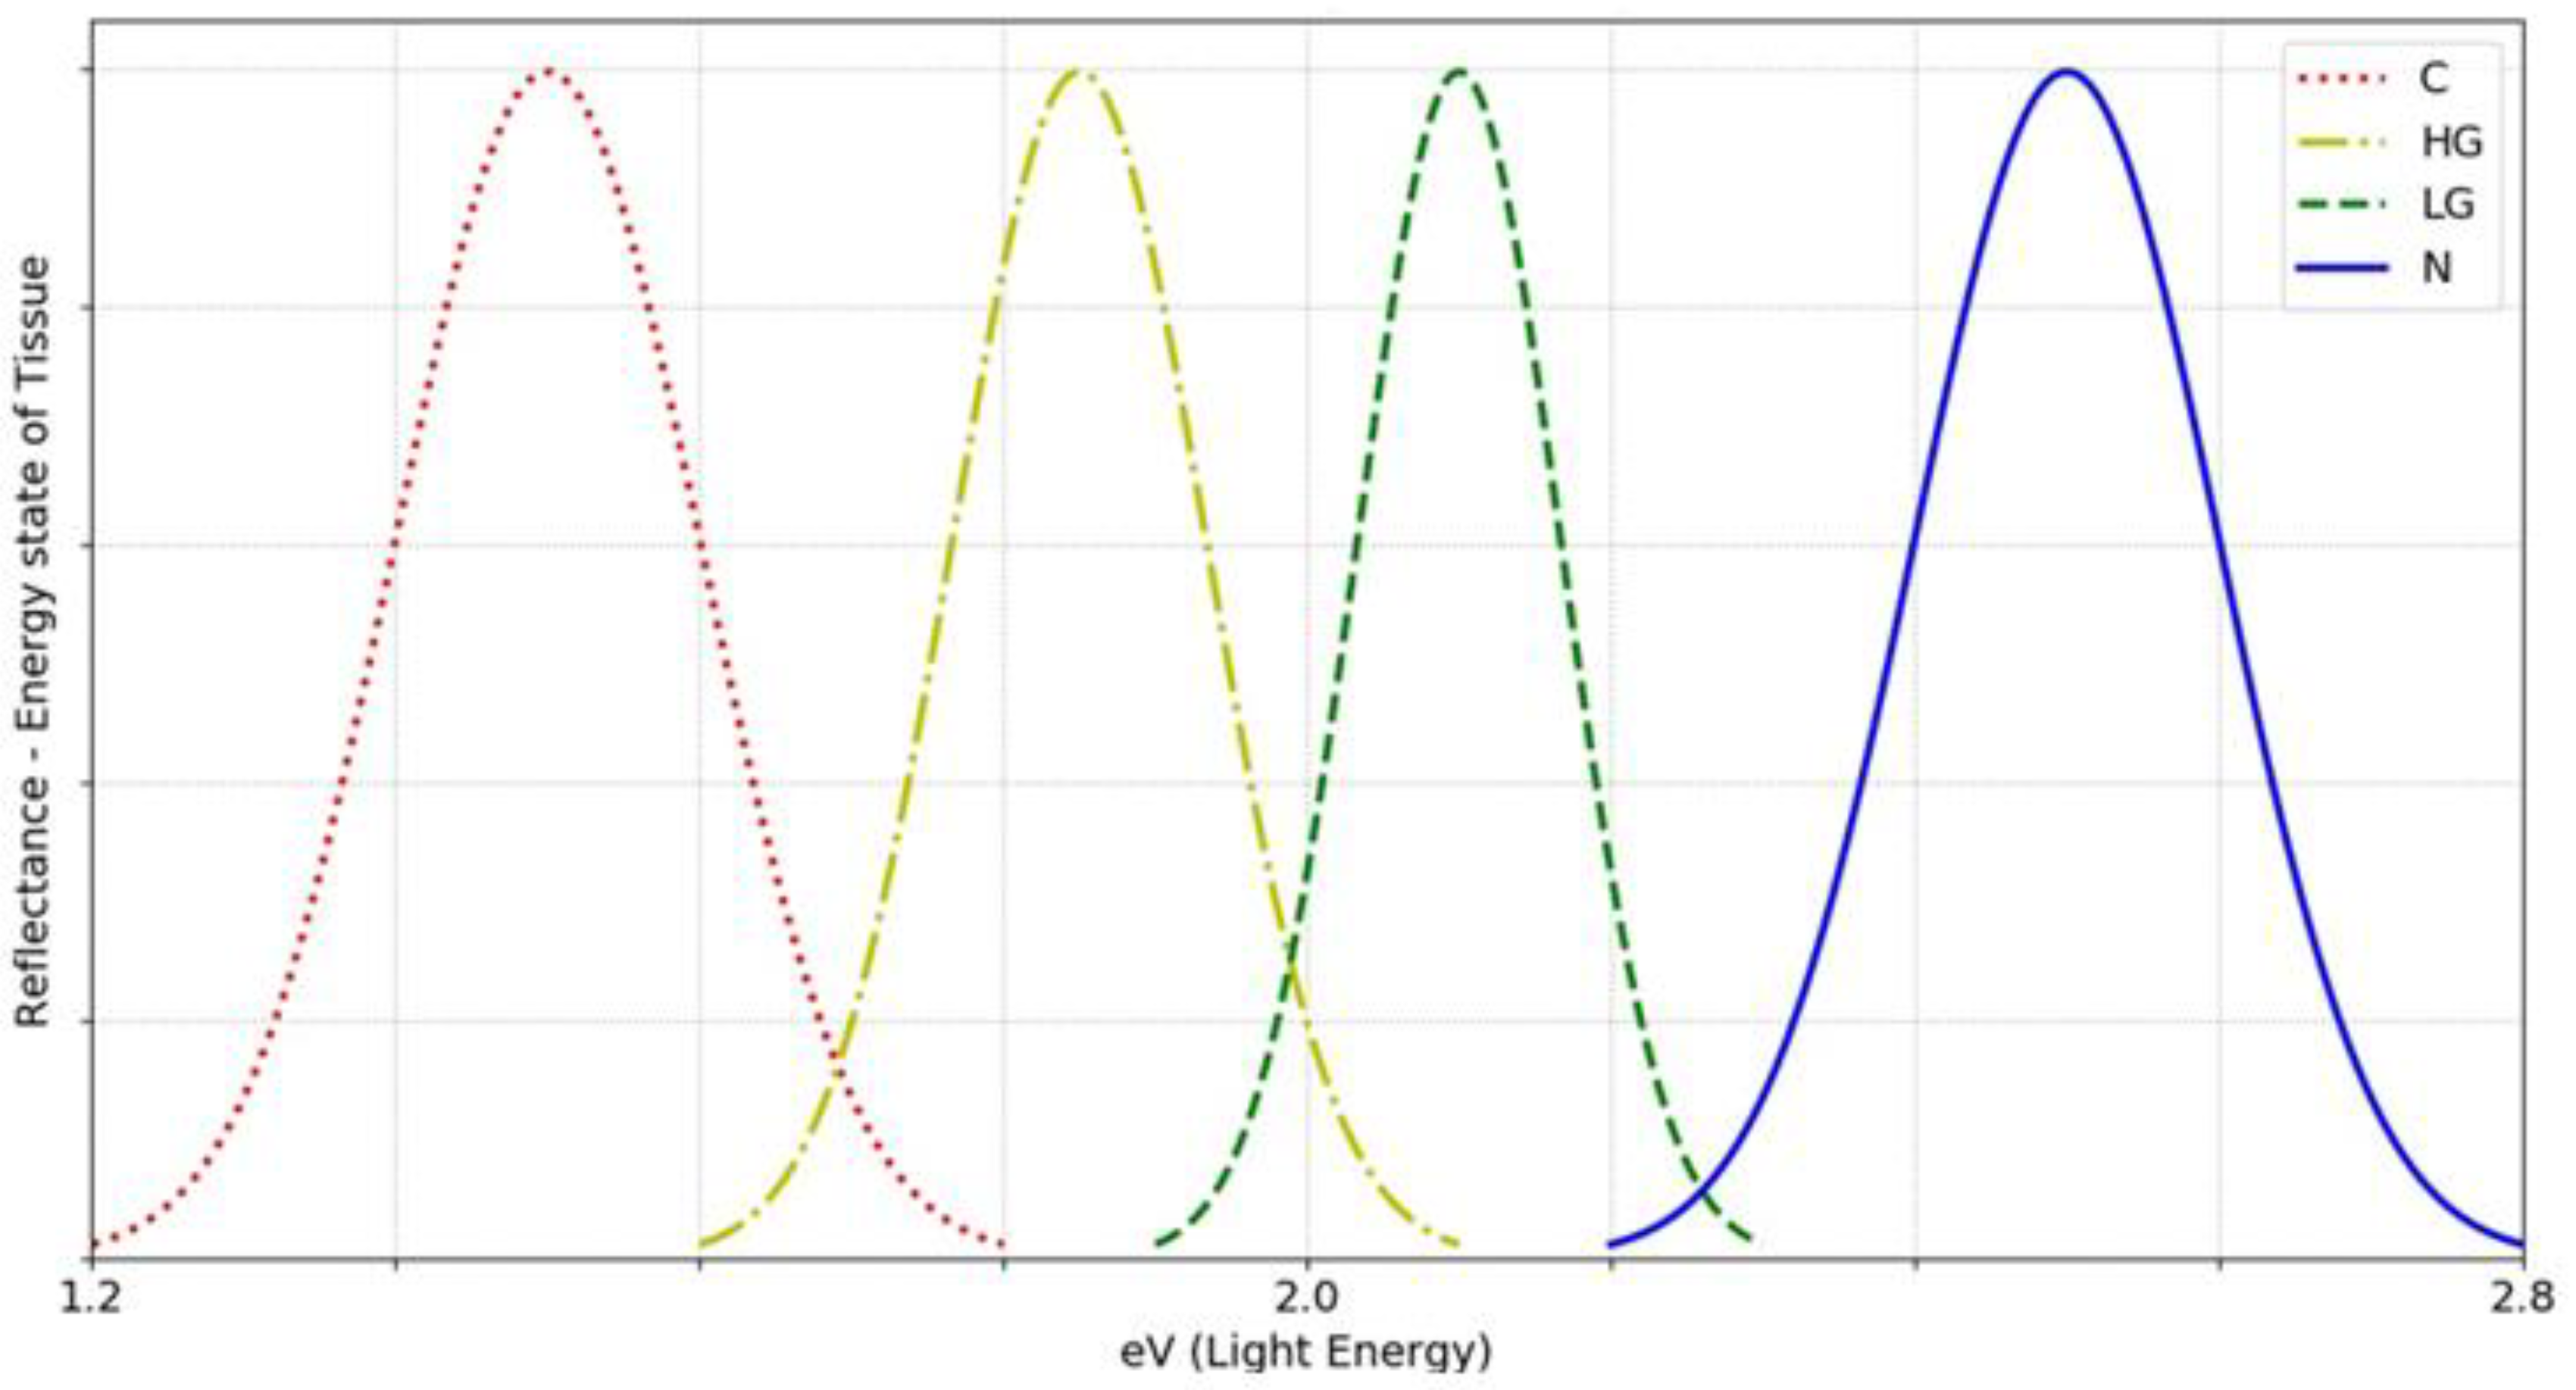
In this part, the direction of future investigation will be proposed as well as what else needs to be achieved. The improvement (upgrading) of OMIS device and methods are possible in the following directions: hardware, software and algorithms. With regards to the hardware, the plan is to have additional UV, green, red and infrared lights in addition to the white light. This newly improved hardware, would enable an even better- and better-quality analysis of epithelial tissues in depth. Within the software the protection of the system can be improved as well as the selection of the object of interest. In this way the overlapping of healthy and irregular tissues in the image will be reduced to a minimum. This would significantly increase accuracy (estimates are that it would reach 97-98%). The ultimate goal is to apply advanced machine algorithms of learning, hyper light algorithms and achieve minimal overlap between only adjacent categories and complete separation of normal and cancerous categories (
Figure 13).
5. Conclusions
The OMIS method showed good results with all four types of epithelial tissues: skin, cervix, colon and oral cavity (accuracy between 85-95% depending on the ratio of healthy and diseased tissue that was recorded). The method can be used for screening, triage of samples (which samples have the advantage of being processed histopathological), as well as an auxiliary tool for doctors in the operating room.
The advantages of OMIS method are multiple: results with OMIS method can be obtained within 5 min unlike screening tests used in clinical practice today; OMIS can be applied on unstained (fresh) samples, and in that way cost of the screening test implementation is significantly reduced; specificity is high, and sensitivity is in the good range.
OMIS has potential to be a promising optical method for in vitro, ex vivo and in vitro characterization of epithelia tissues. Further investigation is necessary to determine how tissue type and level of pathological transformation impact OMIS results. Ultimately, this could help surgeons not in using this method as an in vivo indicator for surgical resection with safe margins as well as during the surgery.
It was also shown that, in addition to the characterization of epithelial tissues (visco-elastic), OMIS can also be used for the characterization of liquid and solid samples. For the same sample the measuring repeatability of the OMIS is: 98 ± 1%, 97 ± 2% and 96 ± 2.5%, for solid state matter, viscoelastic matter (tissues) and liquids, respectively. However, the accuracy for a group of the same samples is between 85-96%, depending on the type of sample as well as the relationship between the sample and the surrounding tissue that was recorded and taken into considered.
Funding
This research was supported by Ministry of Science and Technolgical Development of the Republic of Serbia under Project No. III 41006 in period of 2015- 2020 and Contract 451-03-9/2021-14/200105 dated 05.02.2021.
Author Contribution
Investigation, visualization, formal analysis and writing—original draft preparation and editing, L.M.D.K; investigation, formal analysis, B.J. A.D.I.S; conceptualization, supervision, formal analysis, data curation and writing—review and editing, B.J.; conceptualization, methodology, resources, writing—review and editing, V.A.; conceptualization, supervision, formal analysis, data curation, writing—review and editing, funding acquisition, project administration, L.M. D.K, V.A. All authors have read and agreed to the published version of the manuscript
Acknowledgments
We would like to thank Khalil Rzvi, MD, Southend University Southend, UK Hospital, Dr Ravi Gaur, MD Oncqest Labortories, New Delhi, India, Dr Milena Papic-Obradović, dr Djurica Grga, MD, Dr Bogdan Lisul, University of Belgrade and Dr Jadran Bandic,ORS Hospital,Belgrade who helped us in our effotr to realized and present this research.
Ethical Approval
All procedures performed in the studies involving human participants were in accordinace with the ethical standards of the insttutional and/or national research committee and the 1964 Helsinki declaration and its later amendments or comparable ethical standards. Studies caried out after patient writeen approval.
Conflicts of Interest
The authors declare no conflict of interest. The funders had no role in the design of the study; in the collection, analyses, or interpretation of data; in the writing of the manuscript, or in the decision to publish the results.
Disclaimer
Material has been reviewed by the Walter Reed Army Institute of Research. There is no objection to its presentation and/or publication. The opinions or assertions contained herein are the private views of the author, and are not to be construed as official, or as reflecting true views of the Department of the Army or the Department of Defense.
References
- Johr, R. , Soyer, H.P., Argenziano, G., Hofmann-Wellenhof, Scalvenzi, M. Dermoscopy The Essentials, Mosby, Edinburgh, 2004.
- Bandić, J. , Dobrosavljević, D., Koruga, D., 9th Basic Dermoscopy Seminar: Accuracy in melanomadetection, Serbian Dermoscopy Association and Department of Biomedical Engineering, Faculty of Mechanical Engineering, University of Belgrade, 25-, Belgrade. 26 November.
- Kojić, D. , Caracterisation of structural, mechanical, electric and magnetic properties of skin by optical and nanoprobe microscopies, Department of Biomedical Engineering, Faculty of Mechanical Engineering, University of Belgrade (supervisor Professor Djuro Koruga), , Belgrade. 25 February.
- Kojic Dusan,Matija Lidija R Petrov Ljubisa Koruga Djuro Lj, Mechanical Properties of Human Skin Studied by Atomic Force Microscope, Proceedings - 25th Danubia-Adria Symposium on Advances in Experimental Mechanics, DAS, No.2019, pp.121-122, 2008.
- Koruga,D.,Tomic,A. System and method for analysis of light - mater interaction based on spectral convolution : Granted in : Japan :Patent No.10-1150184, Singapore: Patent No.163043, China: Patent No CN200980108822.9, Russia :Patent No.2440603Mexico: Patent No.308206, Australia: Patent No.2009204227. PCT US 2009/030347. Published after filing:.
- Koruga, D.; Miljković, S.; Ribar, S.; Matija, L.; Kojić, D. Water Hydrogen Bonds Study by Opto-Magnetic Fingerprint, Acta Physica Polonica A, Vol.117, No. Acta Phys. Pol. A 2010, 117, 777–781. [Google Scholar] [CrossRef]
- Koruga, Đ.; Bandić, J.; Janjić, G.; Lalović, Č.; Munćan, J.; Dobrosavljević Vukojević, D. Dobrosavljevic Vukojevic Epidermal Layers Characterisation by Opto-Magnetic Spectroscopy Based on Digital Image of Skin. Acta Phys. Pol. A 2012, 121, 606–610. [Google Scholar] [CrossRef]
- Sedlar Mariana, M.; Nikolic Gorana, V.; Dragicevic Aleksandra, L.J.; Koruga Djuro, L.J. Opto-magnetic imaging spectroscopy in characterization of the tissues during hyperbaric oxygen therapy. Mil. Med. Rev. 2015, 72, 922–927. [Google Scholar] [CrossRef] [PubMed]
- Matija, L. , Jeftić, B., Nikolić, G., Dragičević, A., Mileusnić, I., Munćan, J., Koruga, D. 2014. [Google Scholar]
- Jeftic, B.; Papic-Obradovic, M.; Muncan, J.; Matija, L.; Koruga, D. Optomagnetic Imaging Spectroscopy Application in Cervical Dysplasia and Cancer Detection: Comparation of Stained and Unstained Papanicolaou Smears. J. Med. Biol. Eng. 2017, 37, 936–943. [Google Scholar] [CrossRef]
- Razvi, K.; Dragicevic, A.; Madhavan, K.; Anu, M.; Hemingway, S.; Papic-Obradovic, M.; Koruga, D. Optomagnetic imaging spectroscopy (OMIS) as a novel method in the characterization of cervical smears. J. Clin. Oncol. 2016, 34 (Suppl. 15). [Google Scholar] [CrossRef]
- Dragicevic, A.; Matija, L.; Krivokapic, Z.; Dimitrijevic, I.; Baros, M.; Koruga, D. Classification of Healthy and Cancer States of Colon Epithelial Tissues Using Opto-magnetic Imaging Spectroscopy. J. Med. Biol. Eng. 2019, 39, 367–380. [Google Scholar] [CrossRef]
- Lisul, B.; Jelovac, D.; Petrovic, M.; Koruga, D.J.; Matija, L.; Grga, D.J. Predicting value of Opto-Magnetic imaging Spectroscopy in discriminating oral squamous cell carcinoma from non-tumor tissue in surgical margins. J. Med. Biol. Eng. 2019, 39, 874–884. [Google Scholar] [CrossRef]
- Hut, I.; Jeftic, B.; Matija, L. Cobajic, Machine Learning Classification of Cervical Tissue Liquid Based Cytology Smear Images by Optomagnetic Imaging Spectroscopy. Teh. Vjesn. 2019, 26, 1694–1699. [Google Scholar] [CrossRef]
- Papic-Obradovic, M.; Kojic, D.; Matija, A.L. Optomagnetic method for epstein@ barr virus and cytomegalovirus detection in blood plasma samples. Acta Phys. Pol. A 2010, 117, 782–785. [Google Scholar] [CrossRef]
- Wiesendanger, R. ,and Roland. W., Scanning probe microscopy and spectroscopy: Methods and applications. Cambridge University Press, Cambridge, 1994.
- Yasumura KY Energy dissipation mechanisms in microcantilever oscillators with applications to the detection of small forces. Dissertation, Stanford University, USA (2002).
- Albrecht, T.R.; Grütter, P.; Horne, D.; Rugar, D. Frequency modulation detection using high-Q cantilevers for enhanced force microscope sensitivity. J. Appl. Phys. 1991, 69, 668–673. [Google Scholar] [CrossRef]
- Hut, I.V.; Muncan, J.S.; Jeftic, B.D.; Dogramazi, S.T.; Matija, L.R. Multivariate Analysis and Self Organizing Feature Maps Applied for Data Analysis of Opto-Magnetic Spectra of Water. FME Trans. 2014, 42, 256–262. [Google Scholar] [CrossRef]
- Milica Jovanović,Medojević, Aleksandra Dragičević, Ivana Milanović, Lidija Matija,Slavoljub Živković, Opto-magnetic imaging spectroscopy in analyzing rotary NiTi endodontic instruments. J. Mech. Behav. Biomed. Mater. 2023, 141, 105789 . [CrossRef]
- Aleksandra Debeljkovic1,a, Ivana Mileusnic1,b, Ivan Djuricic1,c, Aleksandra Dragicevic1,d, Igor Hut1,e and Srecko Nijemcevic, Nanoscale Material Characterization Under the Influence of Aggressive Agents by Magnetic Force Microscopy and Opto-Magnetic Spectroscopy, Advanced Materials Research Vol. 633 (2013) pp 209-223 © (2013) Trans Tech Publications, Switzerland. [CrossRef]
- Šakota, R.J.; Conte, M.; Munćan, J.; Matija, L.; Koruga, Đ. Characterization of Fullerenes Thin Film Oon Glasses by UV/VIS/NIR and Opto-Magnetic Imaging Spectroscopy. FME Trans. 2014, 42, 172–176. [Google Scholar] [CrossRef]
- Tomic, M.; Stamenkovic, D.; Muncan, J.; Jnkovic, M.; Matija, L. Biocompatibility and cytotoxicity study of nanophotonic rigid gas permeable contact lens material This article has been downloaded from IOPscience. Please scroll down to see the full text article. J. Phys. Conf. Ser. 2013, 429, 012016. [Google Scholar] [CrossRef]
- Dragomir Stamenković, Dušan Kojić, lidija Matija, Zoran mMljković, Bojan Babić, Physical properties of contact lenses characterized by scanning probe microscopy and optomagnetic fingerprint, International Journal of Modern Physics B VOL. 24, NO. 06n07. [CrossRef]
- Zunic, S.S. , Rakic, LJ.M.,Koruga, DJ, Lalic, M., The Hormesis-Threshold Biodosimetric Model for Estimation of Low-Slow Dose Effects from Internal Sources of Ionizing Radiation. Comparative study of hormesis-threshold biodosimetric model and the optomagnetic imaging spectroscopy method in characterization of biophysical properties of pulmonary tissue, International Conference on Radiation Safety: Improving Radiation Protection in Practice (1) Report No.IAEA-CN--279, International Atomic Energy Agency (IAEA), 2021.
- Brittany Garry, Nikola Stoiljkovic, Zorana Jovic, Radmila Pavlovic, Derese Getnet, Samandra T. Demons, Stuart D. Tyner4, Daniel V. Zurawski, Brett E. Swierczewski, Djuro Koruga, Alexander G. Bobrov, and Vlado Antonic, Optomagnetic Imaging Spectroscopy (OMIS) for in situ detection of bacteria in blood – feasibility study, 4open 2022, 5, 10. [CrossRef]
- Miljkovic S, Jeftic B, Sarac D, Matovic V, Slavkovic M, Koruga D. Influence of hyper-harmonized fullerene water complex on collagen quality and skin function. J Cosmet Dermatol. [CrossRef]
- Miljkovic S, Jeftic B, Stankovic I, Stojiljkovic N, Koruga D. Mechanisms of skin moisturization with hyperharmonized hydroxyl modified fullerene substance. J Cosmet Dermatol. [CrossRef]
Figure 1.
The relation between the vertical (r⊥) linearly polarized light and the horizontal (r|| ) linearly polarized light (α is the angle of secular reflection - the incidence angle equals the reflection angle, β is the angle of refraction–the angle of light refraction in the medium). If diffuse light passes through a filter, efficiency depends on the incident light and the medium (Brewster angle for water at the room temperature is 53.10, while for skin is 53.60).
Figure 2.
Schematic representation of imaging spectroscopy using diffuse white light (left) and special imaging spectroscopy using polarized light (right). The relative positions of light sources for the two imaging spectroscopies are indicated. Light source of six light-emitting diodes, arranged in the circle, are used to generate reflected diffuse white light, which is perpendicular to the sample and same number of while reflected polarized light (right) arises from the light source positioned at Brewster’s angle. Each matter has specific Brewster angle (magnetic component equal zero). For biological tissues, it is approximately 53
0 degrees [
5,
20].
Figure 4.
Cervix sample no. 3348 was analysed in three states: fresh, fixed and stained. The diagrams in all three cases are similar. The differences exist because the fixed sample, and especially the dye (stained sample), interacts with the tissue and changes its the ratio of paired and unpaired electrons. The best diagrams and results are obtained with a fresh sample (see Chapter of results).
Figure 5.
OMIS spectra of copper (diamagnetic) and aluminium (paramagnetic) samples. As can be seen, the spectra in the domain of 30 nm (125-155 nm) are opposite, as is the case with MFM. The experiments were done several times (lines on the diagram) and the same or similar results were always obtained. Small difference is obtained because there is a dynamic of pairing and pairing of electrons even with materials in the solid state. The diagram shows that this process is more pronounced in the copper sample (140-155 nm) than in the aluminium.
Figure 6.
Images of two moles (nevus) and it's hard to estimate which one is a regular and which one is melanoma. The histopathological findings showed that the mole on the left is regular and the mole on the right is melanoma.
Figure 6.
Images of two moles (nevus) and it's hard to estimate which one is a regular and which one is melanoma. The histopathological findings showed that the mole on the left is regular and the mole on the right is melanoma.
Figure 7.
The OMIS findings showed that the moles from
Figure 6 are: on the left is healthy (blue line) and the mole on the right is melanoma (red line) [9].
Figure 7.
The OMIS findings showed that the moles from
Figure 6 are: on the left is healthy (blue line) and the mole on the right is melanoma (red line) [9].
Figure 10.
Workflow of the OMIS imaging and data analysis. Step 1 – set up experiment in laboratory; Step 2 – sampling blood; Step 3 – placement of 50 mL of blood on glass slide; Step 4 – cover the blood using glass cover slip; Step 5 – positioning of the slide in the OMIS slide.[26].
Figure 10.
Workflow of the OMIS imaging and data analysis. Step 1 – set up experiment in laboratory; Step 2 – sampling blood; Step 3 – placement of 50 mL of blood on glass slide; Step 4 – cover the blood using glass cover slip; Step 5 – positioning of the slide in the OMIS slide.[26].
Figure 11.
Representative diagram of results for all classes of samples analysed with significant wavelengths used for differentiation of samples .[26].
Figure 11.
Representative diagram of results for all classes of samples analysed with significant wavelengths used for differentiation of samples .[26].
Figure 12.
The image shows overlapping values for different tissue conditions and this is one of the main disadvantages of the existing OMIS method based on white light.
Figure 12.
The image shows overlapping values for different tissue conditions and this is one of the main disadvantages of the existing OMIS method based on white light.
Figure 13.
Our ultimate goal is for the classification to be such that only adjacent categories can overlap between 5-10%, while non-adjacent categories cannot overlap (notation: C –cancer, HG- high grade, LG- low grade, N – normal).
Figure 13.
Our ultimate goal is for the classification to be such that only adjacent categories can overlap between 5-10%, while non-adjacent categories cannot overlap (notation: C –cancer, HG- high grade, LG- low grade, N – normal).
Table 1.
Comparative review of the results of the MFM and initial study by OMIS method on 118 histopathological skin samples (35 - normal, 25 – skin diseases, 20 – benign lesions, 38 – malignant). The results are normalized in relation to the normal skin condition [3].
Table 1.
Comparative review of the results of the MFM and initial study by OMIS method on 118 histopathological skin samples (35 - normal, 25 – skin diseases, 20 – benign lesions, 38 – malignant). The results are normalized in relation to the normal skin condition [3].
Table 2.
Oral cavity classification efficacy of the OMIS method naïveNaive Bayes method, DT- Decision Tree method, RF - Random Forest method, and SVM - Support Vector Machine) [
13].
Table 2.
Oral cavity classification efficacy of the OMIS method naïveNaive Bayes method, DT- Decision Tree method, RF - Random Forest method, and SVM - Support Vector Machine) [
13].
Table 3.
Results of the OMIS-20ML evaluation based on 3 independent validation experiments. Results are presented as mean ± standard deviation for ANN and RFC. Since those two values of accuracy are very close our results strongly indicate that input data (interaction of light with paired and unpaired electrons) and output data (classification into sterile versus nonsterile blood (irrespective of the concentration of bacteria) is valid.[26].
|
Disclaimer/Publisher’s Note: The statements, opinions and data contained in all publications are solely those of the individual author(s) and contributor(s) and not of MDPI and/or the editor(s). MDPI and/or the editor(s) disclaim responsibility for any injury to people or property resulting from any ideas, methods, instructions or products referred to in the content. |
© 2023 by the authors. Licensee MDPI, Basel, Switzerland. This article is an open access article distributed under the terms and conditions of the Creative Commons Attribution (CC BY) license (http://creativecommons.org/licenses/by/4.0/).
