Preprint
Article

Application of Various Genomic Selection Models in Cotton Fiber Quality

Altmetrics

Downloads

116

Views

54

Comments

0

This version is not peer-reviewed

Submitted:

09 November 2023

Posted:

10 November 2023

You are already at the latest version

Alerts
Abstract
Cotton is the most important natural fiber cash crop, which has high commodity economic benefits and provides an important material foundation for China's construction. With the improvement of textile technology and living standard, higher requirements are put forward for raw cotton quality. Traditional cotton breeding methods need typing and selection. With the development of biotechnology and the research of genomics, genomic selection has been widely used in cotton breeding. Genomic selection is a new breeding method, which can be selected and bred by constructing a prediction model and using high-density molecular markers covering the whole genome. In this study, the application of various genomic selection models in cotton fiber quality was explored, which provided more reliable information for genetic breeding improvement in the future, thus helping to improve the efficiency of actual cotton breeding.
Keywords: 
Subject: Biology and Life Sciences  -   Agricultural Science and Agronomy

Introduction

Cotton (Gossypium spp.) is a strategic material related to the national economy and people's daily life, and also an important fiber and oil crop. Cotton is a commodity composed of two main industries, such as agriculture and textile. At present, cotton production and sustainable development in China are related to the fate of 60 million rural workers and 20 million textile workers. Cotton can also be used to produce tire ropes, gunpowder, paper money and medical cotton. Cottonseed oil is one of the important sources of edible oil in China, with an annual output of about 1 million tons. Cottonseed protein is an important feed protein after dephenolization, and its content is about 54%. Cottonseed hulls are usually used as culture materials for edible fungi. Gossypol is an important pharmaceutical raw material. The production, circulation, processing and consumption of cotton are closely related to people's lives and the interests of cotton farmers, which is necessary for economic development. Therefore, breeding new cotton varieties with high yield and high quality has become a crucial task for cotton breeders.
Traditional cotton breeding methods need typing and selection. Although molecular marker-assisted selection (MAS) is a method to improve the selection efficiency in the process of breeding selection, it is relatively effective only for traits with high heritability and controlled by major genes [1,2,3,4]. Genomic selection (GS) is developed for selecting traits controlled by multiple genes, which has high prediction accuracy and selection efficiency for traits with low heritability. With the development of biotechnology and the research of genomics, whole genome selection has been widely used in cotton breeding. However, due to the great difference in the prediction accuracy of different populations, there is a lack of an efficient genotyping platform, which has not been applied in practice[5]. Genomic selection is marker-assisted selection by using high-density molecular genetic markers covering the whole genome. At present, methods such as the best linear unbiased prediction (GBLUP) based on linear mixed model and Bayesian methods (Bayes A, Bayes B, Bayes C) based on prior information are mainly used for calculation.

1. Genomic selection

1.1. The principle of GS

1.1.1. Overview of GS

The concept of genomic selection was put forward by Professor Meuwissen of Norwegian University of Life Sciences in 2001. GS used the molecular markers and phenotypic data covering the whole genome to construct a prediction model, and based on the genome estimated breeding value (GEBV), early individuals were predicted and excellent strains were quickly identified. Firstly, a reference population is established. Each individual in the reference population has a known phenotype and genotype, and the effect value of each SNP or different chromosome fragment can be estimated through a suitable statistical model. Then, genotyping is carried out for each individual in the candidate population, and the GEBV; of each individual in the candidate population is calculated by using the SNP effect value estimated in the reference population; Finally, individuals are selected and retained according to the GEBV ranking. After the performance of selected candidates is measured, these individuals can be put into the reference population to re-estimate the effect value of SNP, and so on. Genomic selection can estimate GEBV at the early growth stage of the tested individuals because it does not depend on the late measurement phenotype, which greatly shortens the generation interval. It uses marker information covering the whole genome to estimate GEBV, which greatly improves the accuracy of GEBV estimation and selection. Moreover, genomic selection can directly estimate some traits that are difficult to measure phenotypically.

1.1.2. Reference group and candidate group

In genomic selection, the reference population refers to the population with genotype and phenotype information. According to the data of the reference group, the phenotype value of only genotype individuals is predicted. The efficiency of genome selection is mainly affected by the size of reference population, scale and the relationship with candidate population [6].Genomic selection divides the population into reference population and candidate population, and the reference population is used to model and estimate the breeding value of the candidate population. The reference group has phenotype and genotype, and the candidate group only has genotype [7].

1.1.3. Breeding principle of GS

As shown in Figure 1, genomic selective breeding collects genotype data, phenotypic data and related environmental factors (regional differences, experimental treatment and seasons, etc.) by designing a specific Trainning group, and constructs a training model by using a specific modeling algorithm. Through the model, the individual breeding value or the contribution value of each marker to the target trait and the phenotypic prediction value in the group to be tested can be calculated [8].The evaluation of model accuracy is usually expressed by Pearson correlation coefficient between the predicted value and the actual value [9], but the prediction effect of the model built in the training group is often poor in the Test group, and there may be Overfitting phenomenon [10]. In order to enhance the prediction ability of the model in the test population and screen the optimal model parameters, it is necessary to use the Cross-validation method to evaluate the actual prediction ability of the model, and then predict the target traits of all possible combinations through the genotype data and environmental factors provided by the test population, so as to achieve the purpose of prediction and screening.

1.2. Research methods of GS

1.2.1. Bayesian method

When Meuwissen first put forward the GS theory, he provided two Bayes methods to solve the problem that the number of SNP markers is usually far more than phenotypic records, namely Bayes A, Bayes B. Bayes A assumes that all SNP loci have effects, and the variance of all SNP effects obeys the normal distribution of scale inverse chi-square distribution. The difference between Bayes B and Bayes A lies in the different prior assumptions of SNP effect. Bayes A assumes that all SNPs are effective, while Bayes B assumes that only a small number of marker loci are effective, and the effect of most other chromosome fragments is 0 (the proportion of ineffective loci is π); The distribution of effect variance of this small number of effective sites is the same as Bayes A. In addition, Bayes A uses MCMC (Markov Chain Monte Carlo Method) to construct Gibbs sampling chain, and solves the labeling effect in the model, while Bayes B uses MH(Metropolis-Hasting) sampling to jointly sample the labeling effect and variance.
On the basis of two Bayesian models proposed by Meuwissen, the researchers put forward a variety of Bayes models for GEBV estimation. Bayes C model [11] uses mixed distribution as prior distribution of labeling effect, but in Bayes C model, π is unknown and needs to be solved in the model, and the others are the same as Bayes B.

1.2.2. Best linear unbiased prediction method

In 2008, VanRaden[12] proposed a GBLUP (genomic best linear unbiased prediction) method based on G matrix, in which G matrix was constructed by all SNP markers, with homozygous genotypes coded as 1 and -1 respectively and heterozygous genotype as 0. Compared with Bayesian method, GBLUP does not need to estimate SNP marker effect by reference population first, and then calculate GEBV. Instead, individuals with phenotype and without phenotype can be placed in the same model directly, and the GEBV of individuals with phenotype and without phenotype and its accuracy can be estimated at the same time [13].RRBLUP has been proved to be equivalent to GBLUP in mathematical statistics[14]. RRBLUP is to replace the genetic relationship matrix of individuals who construct covariates in GBLUP with the relationship matrix composed of SNP markers, and then build a model to predict individuals.

1.2.3. LASSO method

Tibshirani[15] developed a regression method, that is, the Least Absolute Shrinkage and Selection Operator (LASSO), which is a compressed estimation and an improvement of ridge regression. It obtained a more refined model by constructing a penalty function, so that it compressed some regression coefficients, that is, the sum of absolute values of forced coefficients was less than a fixed value, and at the same time set some regression coefficients to zero.

1.2.4. PLS method

Partial least squares can be regarded as an improvement of least squares. The shortcomings of least squares have affected the results by citing all the data in X variables and involving irrelevant variables. Partial least squares mainly uses the idea of component extraction, PCA, to extract the data to the maximum extent with the specified number of components, continuously extract effective information from the residual, and solve the final result to get the fitting coefficient. Sparse partial least squares, on this basis, delete some variables with less contribution, introduce as few variables as possible, and try to make the final predicted value reach the target value.

1.2.5. SVM method

SVM is a kind of supervised classification algorithm [16]. Its general idea is: Assuming there are two kinds of points in the sample space, we hope to find a dividing hyperplane to separate the two kinds of samples, and the dividing hyperplane should choose the one with the best generalization ability, that is, it can make the distance between the nearest sample points in the two kinds of samples the largest. Among them, the Gaussian kernel function of support vector machine (SVM-RBF) sometimes leads to over-fitting, but it has wide adaptability and can be applied to any distribution of training samples [17].

1.2.6. RKHS method

The full name of RKHS is Reproducing kernel Hilbert space, which is a function space composed of kernel functions. It can be solved by sampling method under Bayesian framework or by mixed linear model [18].

1.3. Application of GS in Breeding

With the popularization of commercial high-density SNP chips and the decline in the price of second-generation sequencing, GS is increasingly applied to crop breeding practice, such as rice (Oryza sativa)[19] and maize (Zea mays)[20]. In addition, GS is also used in cotton breeding.Based on 215 upland cotton varieties, Gapare[21] studied the cotton fiber length and strength by using five forecasting models, and found that the multi-environment forecasting model was better than the single environment forecasting model, emphasizing the importance of considering environmental factors in GS. Islam[22] used 550 multi-parent advanced generation inter-cross (MAGIC population) to analyze the GS of six cotton fiber quality traits. The study showed that increasing marker density and expanding the size of training population could improve the prediction accuracy of GS in a certain range. Li[23] used 8 statistical methods to conduct GS analysis for the first time based on the data from 1385 cotton commercial varieties with the largest scale in many years. The research showed that the interaction between genes and environment had a significant impact on the prediction results when considering the complex traits controlled by multiple genes, and it was very important to add pedigree and environmental factors to optimize the prediction performance. Genomic selection is widely used in crops in China. In 2013, Guo[24] used GS to study maize for the first time in China, and predicted the phenotype of F1 hybrid combinations produced by these recombinant inbred lines through the data of recombinant inbred lines Zong 3 and 87-1, and obtained 114 hybrid combinations that may be superior to the excellent single-cross variety Yuyu 22. Li[25] evaluated 8 GS methods (parameter methods: RR, EN, LASSO, BayesB, BayesC, RKHS; Non-parametric methods: RF and SVM), it is found that parametric methods are better than nonparametric methods in most cases. Xiao[266] predicted four characters of japonica rice by RRBLUP, and found that the real yield-related characters of two materials (YG7313 and NG9108) were highly consistent with the predicted values. Using these two materials as high-yield core parents, two backbone lines XY99 and JXY1 have been successfully bred, which shows that GS is very practical. Qin[27] identified the candidate genes of soybean seed protein, and then combined GWAS with GS to predict the content of soybean seed protein by RRBLUP and LASSO model. TianGan’s team used multi-group data, combined multi-source remote sensing data with machine learning algorithm, and used decision tree (DT), random forest (RF), support vector machine (SVM), ridge regression (RR) and other models to improve the accuracy of yield prediction, which provided a reference for yield prediction in winter wheat breeding. Liu[28] confirmed that the utility and efficiency of GS can be improved by using genes significantly related to target traits in cotton breeding. High yield and high quality are the main goals of cotton breeding. At present, there are few studies on cotton GS in China, which are largely in the development stage.

2. Materials and methods

2.1. Data source

The data used in this study were provided by the cotton breeding research group of Hebei Agricultural University [29], including 419 cotton core germplasm resources. The material was planted in 6 locations and repeated twice every two years. In this study, two phenotypic data related to fiber quality were used, including Spinning Consistance Index (SCI) and Maturity (MAT). Genotype data were used for quality control, and finally 157989 SNPs were obtained for this study.

2.2. Research method

2.2.1. Research on different GS models

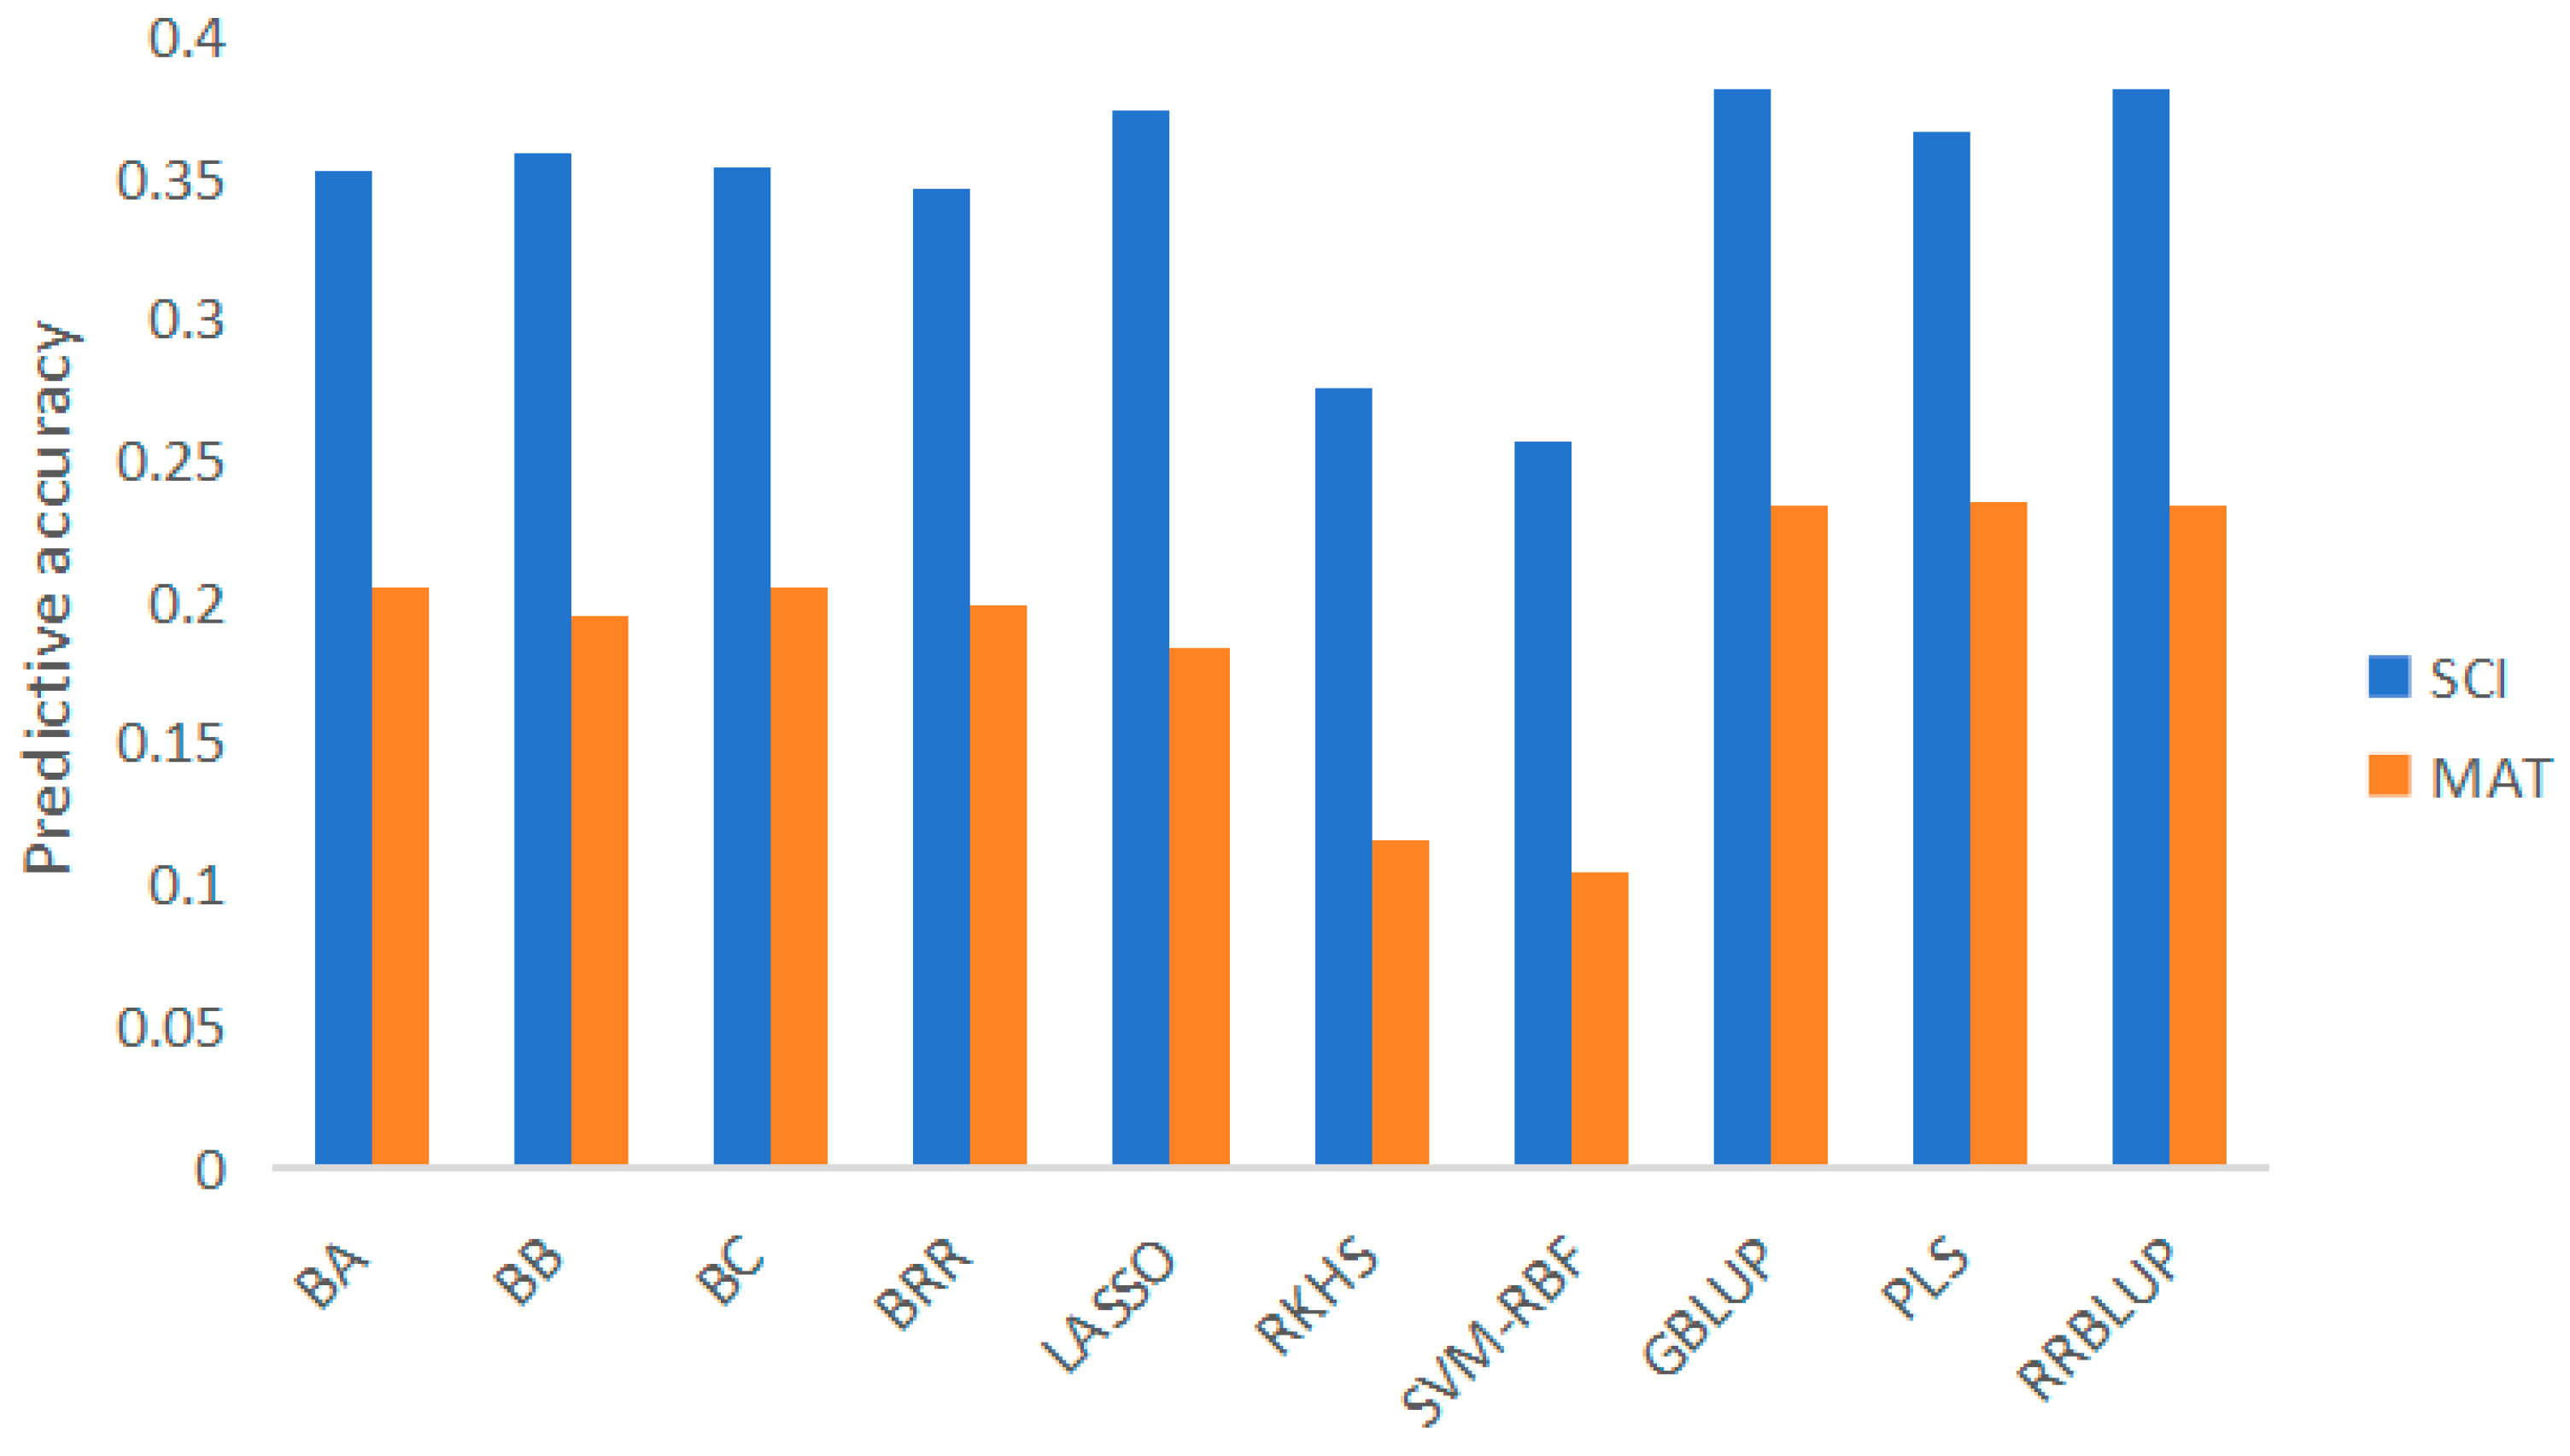
In this study, a variety of GS models are used for genome prediction, including Bayes A, Bayes B, Bayes C, BRR, LASSO, RKHS, SVM-RBF, GBLUP, PLS, RRBLUP, etc. Different methods are all realized by R language. Two cotton fiber quality traits in 419 materials were predicted and analyzed by genome-wide, and 10-fold cross-validation method was obtained by N repetitions. The prediction accuracy was the average of Pearson correlation coefficient square (r2) between the predicted estimated value of N repetitions and the actual phenotypic value [30].

2.2.2. Study on the density of failing marks

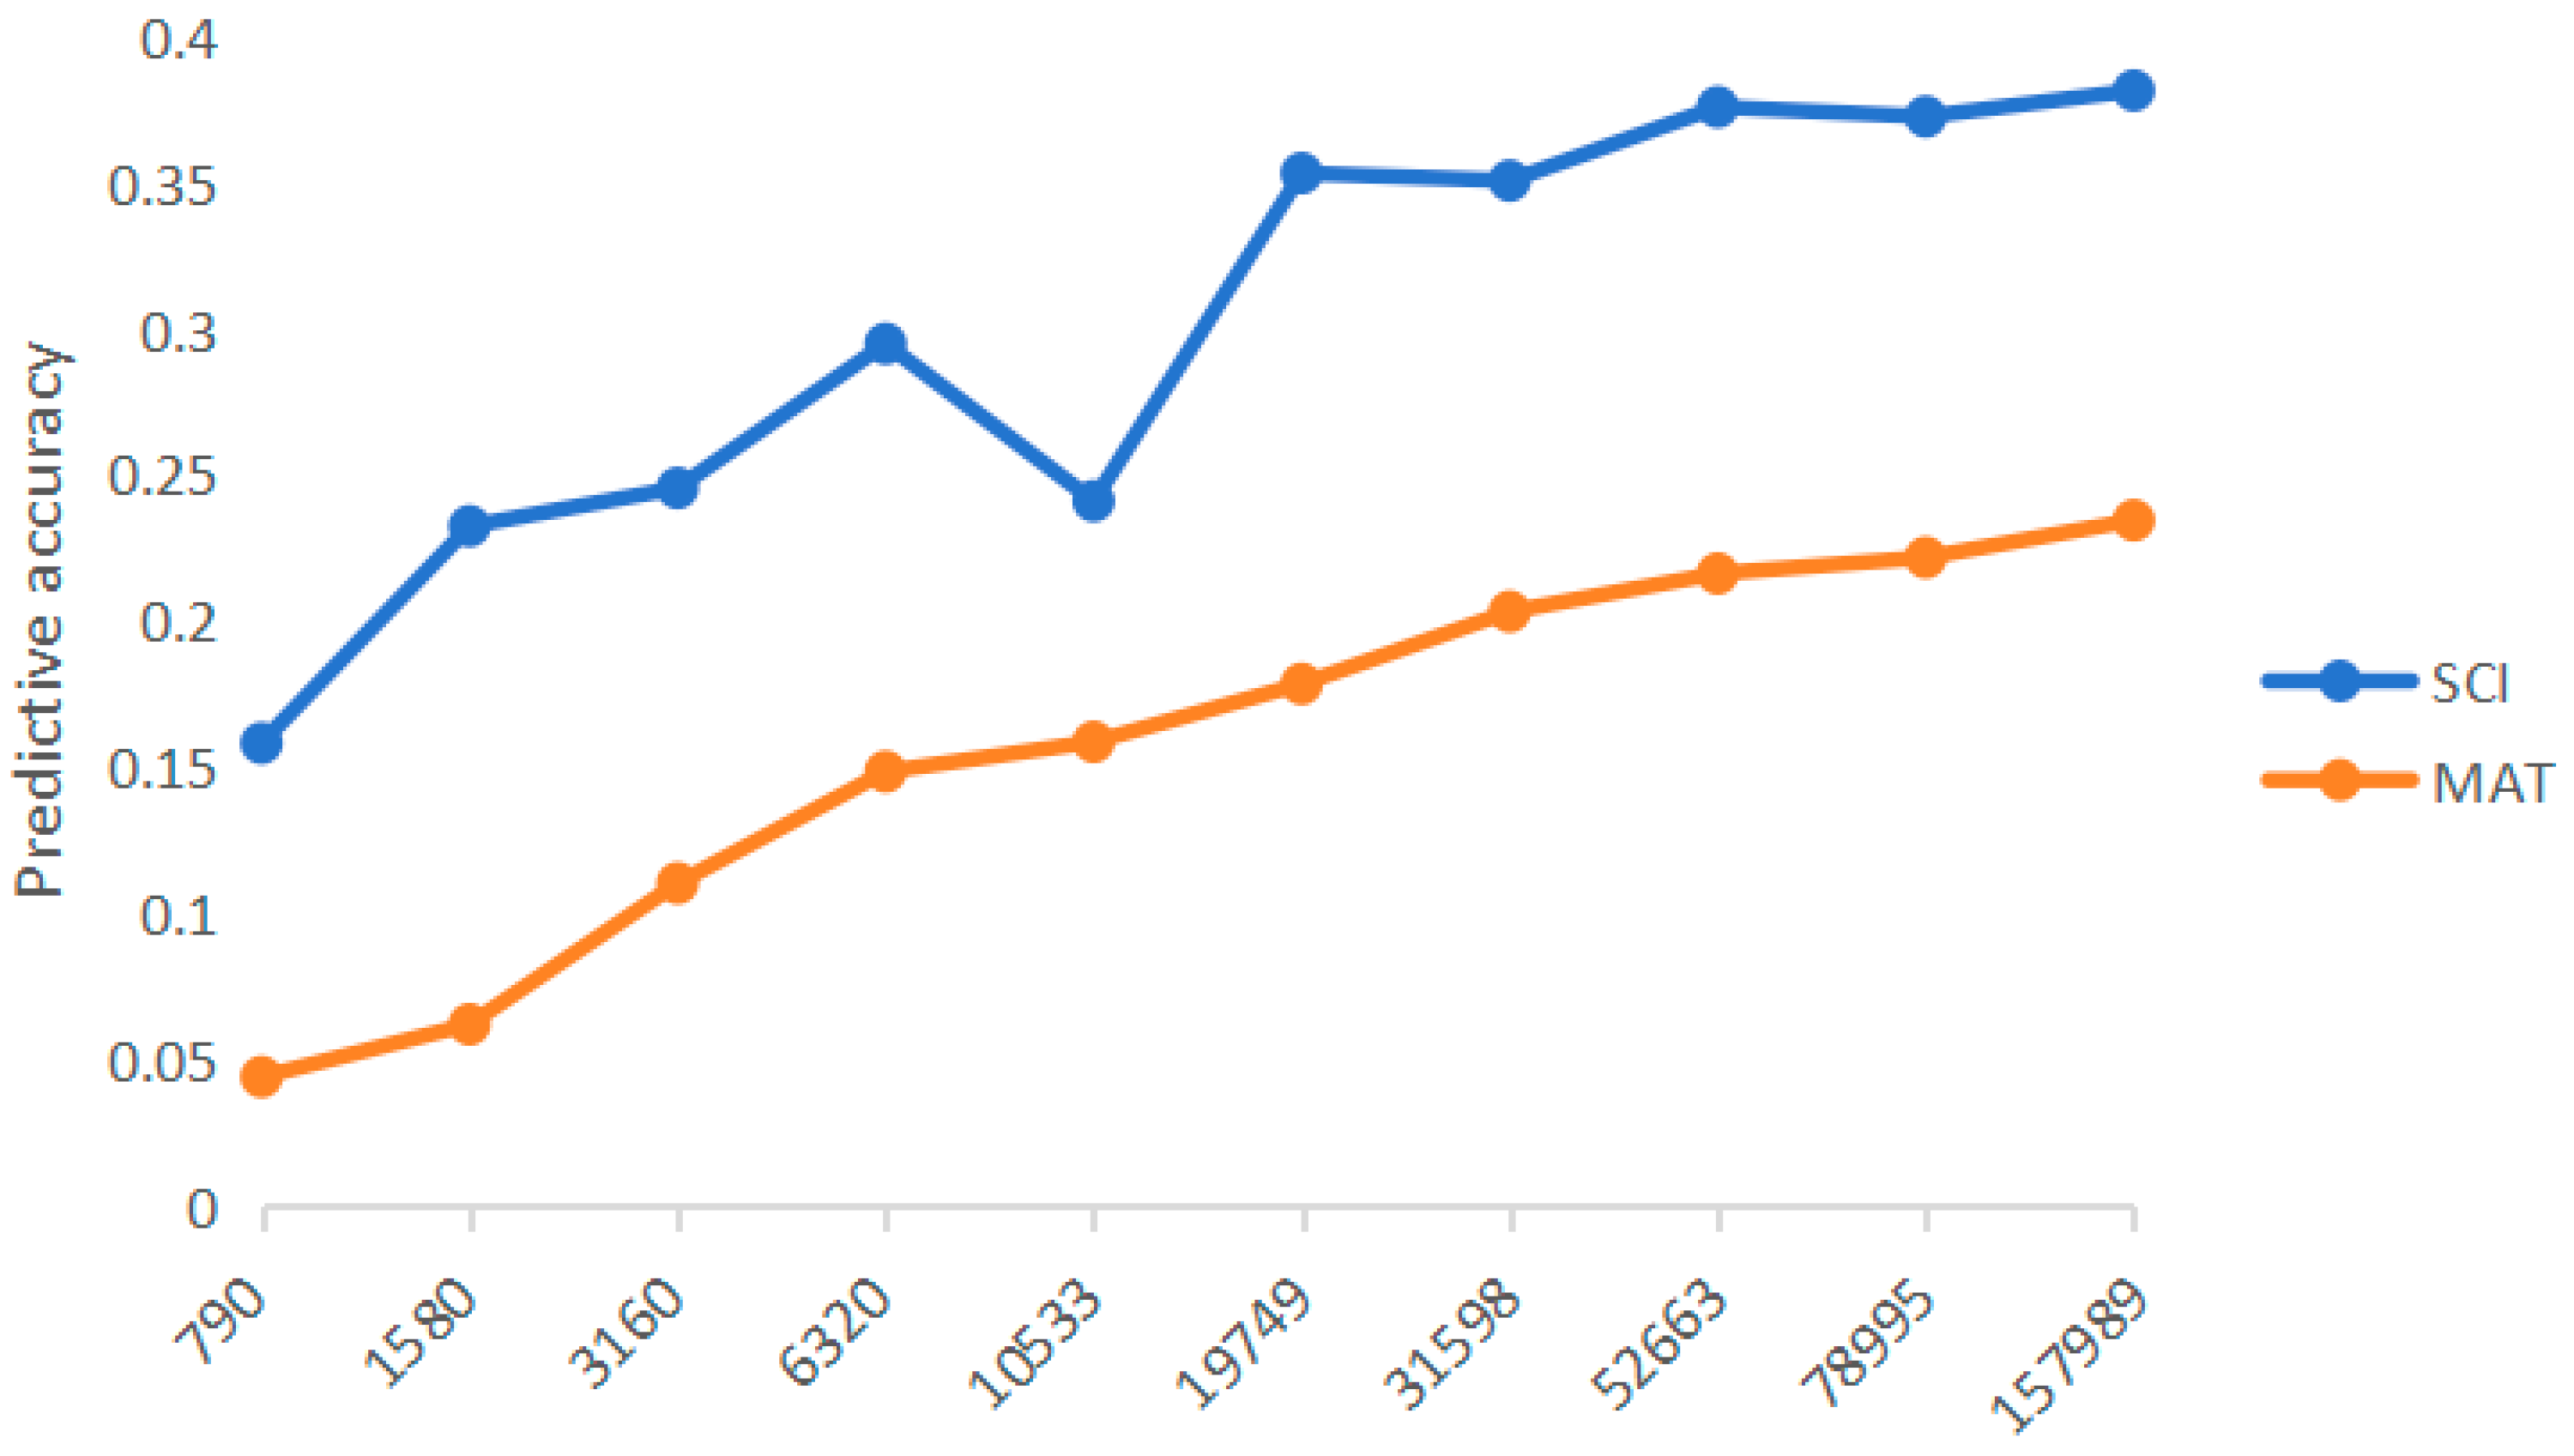
In this study, 10 groups of marker subsets were randomly selected from 157989 SNPs, including 790, 1580, 3160, 6320, 10533, 19749, 31598, 52663, 78995 and all markers, respectively. GBLUP method was used for prediction, and 10-fold cross-validation method was also used.

3. Result

3.1. Prediction accuracy of different models

419 genotypes and phenotypes of cotton materials were used to evaluate the prediction accuracy of 10 prediction models for 2 fiber quality-related traits. The results show (Figure 2) that the average prediction accuracy of SCI is 0.3817, and the range of different methods is 0.2564-0.3817. The average prediction accuracy of MAT is 0.2362, and the range of different methods is 0.1044-0.2362. From the method point of view, RRBLUP has the highest prediction accuracy for trait SCI; For trait MAT, PLS has the highest prediction accuracy. On the whole, the prediction accuracy of parametric methods (Bayes A, Bayes B, Bayes C, BRR, LASSO, GBLUP, PLS, RRBLUP) is better than that of nonparametric methods (RKHS, SVM-RBF).

3.2. Comparison of prediction accuracy based on different marker densities

GBLUP method was used to explore the influence of marker density on genome prediction ability of two traits. As shown in Figure 3, with the increase of marker density, the prediction accuracy gradually improves. It can be seen that the smaller the number of markers, the greater the change of prediction accuracy, and the prediction accuracy of both traits basically reached a plateau when the number of markers was 52,663. When all available markers are used, the prediction accuracy of all traits is the highest.

4. Discussion

4.1. Influence of different forecasting methods on forecasting accuracy

In this study, 10 kinds of GS methods were compared, and it was found that the method with the highest prediction accuracy was different for different fiber quality traits. In addition, compared with the average prediction accuracy of nonparametric method, parametric method will have better prediction accuracy. However, some studies show that when there is a non-additive genetic structure, the performance of parametric methods may become poor. In this case, nonparametric methods may perform better because these methods do not need strict statistical assumptions. Howard[31] used simulated genetic structure to evaluate the prediction accuracy of 14 parametric methods and nonparametric methods, and found that the effect of parametric method was slightly better than nonparametric method for traits controlled by additive effect. Budhlakoti[32] simulated the genotype and phenotype data of epistatic genetic structure with different genetic levels and population sizes, and compared several most commonly used nonparametric methods (RKHS, SVM, ANN and RF). SVM performed well on the whole. No model is suitable for all situations, and most cotton traits are controlled by minor polygenes. Considering epistatic interaction is still the key to explain the genetic variation of complex quantitative traits. Therefore, it is very important to further develop new prediction models for different species and data types.

4.2. Influence of different marker densities on prediction accuracy

The number of markers is one of the key factors to obtain high predictive power. In theory, high-density markers covering the whole genome ensure that the linkage imbalance between markers and QTL in the genome is close to perfection, which is conducive to improving the prediction accuracy. However, in the actual prediction process, when the marker density reaches a certain level, the accuracy hardly increases. Therefore, it is very important to choose the best number of SNPs for developing SNP chips and reducing the cost of genotyping. In this study, GBLUP model was used to evaluate the influence of different marker densities on the accuracy of GS prediction. Before reaching the platform period, increasing the number of markers can increase the linkage imbalance between markers, which is helpful to improve the accuracy of prediction. The study of cotton GS is not mature, so we need to further select the appropriate marker density according to different situations to reduce the statistical time and cost.

5. Conclusion

Generally speaking, the prediction ability increases with the increase of marker density until the platform period is reached. Genome selection is also influenced by traits, and the accuracy of genome prediction of different traits is very different, which is mainly caused by different heritability. Heritability and prediction accuracy are usually positively correlated [33], and the genetic structure of traits should be fully considered when applying GS method. The linkage disequilibrium between marker and QTL will also affect the accuracy of genome prediction. The marker density is mainly determined by the LD attenuation distance. The increase of marker density can increase the LD degree between marker and QTL, thus improving the prediction accuracy. The selection of statistical methods and models will also affect the prediction results of whole genome selection to some extent.

References

  1. Huang, G.; Zhu, Y.X. Breeding cotton with superior fiber quality: identification and utilization of multiple elite loci and exotic genetic resources. Science China Life sciences 2021, 64, 1197–1198. [Google Scholar] [CrossRef]
  2. Collard, B.C.; Jahufer, M.Z.Z.; Brouwer, J.B.; Pang, E.C.K. An introduction to markers, quantitative trait loci (QTL) mapping and markerassisted selection for crop improvement: the basic concepts. Euphytica 2005, 142, 169–196. [Google Scholar] [CrossRef]
  3. Xu, Y.; Crouch, J.H. Marker-Assisted Selection in Plant Breeding: From Publications to Practice. Crop. Sci. 2008, 48, 391–407. [Google Scholar] [CrossRef]
  4. Xu, Y.; Lu, Y.; Xie, C.; Gao, S.; Wan, J.; Prasanna, B.M. Whole-genome strategies for marker-assisted plant breeding. Mol. Breed. 2012, 29, 833–854. [Google Scholar] [CrossRef]
  5. Patil, G.; Mian, R.; Vuong, T.; Pantalone, V.; Song, Q.; Chen, P.; Shannon, G.J.; Carter, T.C.; Nguyen, H.T. Molecular mapping and genomics of soybean seed protein: a review and perspective for the future. Theor. Appl. Genet. 2017, 130, 1975–1991. [Google Scholar] [CrossRef]
  6. Grevenhof, I.E.V.; Werf, J.H.V.D. Design of reference populations for genomic selection in crossbreeding programs. Genetics Selection Evolution 2015, 47, 1–9. [Google Scholar] [CrossRef]
  7. Goddard, M.E.; Hayes, B.J. Genomic selection. Journal of Animal Breeding & Genetics 2015, 124, 323–330. [Google Scholar]
  8. Heffner, E.L.; Sorrells, M.E.; Jannink, J. Genomic Selection for Crop Improvement. Crop. Sci. 2009, 49, 1–12. [Google Scholar] [CrossRef]
  9. Luan, T.; Woolliams, J.A.; Lien, S.; Kent, M.; Svendsen, M.; Meuwissen, T.H. . The accuracy of genomic selection in Norwegian red cattle assessed by cross-validation. Genetics 2009, 183, 1119–1126. [Google Scholar] [CrossRef]
  10. Jia, Z. Controlling the Overfitting of Heritability in Genomic Selection through Cross Validation. Sci. Rep. 2017, 7, 13678–13678. [Google Scholar] [CrossRef]
  11. Meuwissen, T.H.; Hayes, B.J.; Goddard, M. Prediction of total genetic value using genome-wide dense marker maps. Genetics 2001, 157, 1819–1829. [Google Scholar] [CrossRef]
  12. VanRaden, P.M. Efficient methods to compute genomic perdictions. J Dairy Sci 2008, 91, 4414–4423. [Google Scholar] [CrossRef]
  13. Ricard, A.; Danvy, S.; Legarra, A. Computation of deregressed proofs for genomic selection when own phenotypes exist with an application in French show-jumping horses1. J. Anim. Sci. 2013, 91, 1076–1085. [Google Scholar] [CrossRef]
  14. Goddard, M. Genomic selection: prediction of accuracy and maximisation of long term response. Genetica 2009, 136, 245–257. [Google Scholar] [CrossRef]
  15. Tibshirani, R. Regression Shrinkage and Selection via the Lasso. Journal of the royal statistical society series b-methodological 1996, 58, 267–288. [Google Scholar] [CrossRef]
  16. Cortes, C.; Vapnik, V.N. Support-Vector Networks. Machine Learning 1995, 20, 273–297. [Google Scholar] [CrossRef]
  17. Cherkassky, V.; Ma, Y. Practical selection of SVM parameters and noise estimation for SVM regression. Neural networks : the official journal of the International Neural Network Society 2004, 17, 113–126. [Google Scholar] [CrossRef]
  18. Gianola, D.; Fernando, R.L.; Stella, A. Genomic-Assisted Prediction of Genetic Value With Semiparametric Procedures. Genetics 2006, 173, 1761–1776. [Google Scholar] [CrossRef]
  19. Beyene, Y.; Semagn, K.; Mugo, S.; Tarekegne, A.; Babu, R.; Meisel, B.; Sehabiague, P.; Makumbi, D.; Magorokosho, C.; Oikeh, S.; et al. Genetic Gains in Grain Yield Through Genomic Selection in Eight Bi-parental Maize Populations under Drought Stress. Crop. Sci. 2015, 55, 154–163. [Google Scholar] [CrossRef]
  20. Zhao, Y.; Gowda, M.; Liu, W.; Würschum, T.; Maurer, H.P.; Longin, F.H.; Ranc, N.; Reif, J.C. Accuracy of genomic selection in European maize elite breeding populations. Theor. Appl. Genet. 2011, 124, 769–776. [Google Scholar] [CrossRef]
  21. Gapare, W.; Liu, S.; Conaty, W.; Zhu, Q.H.; Gillespie, V.; Llewellyn, D.; Stiller, W.; Wilson, I. Historical Datasets Support Genomic Selection Models for the Prediction of Cotton Fiber Quality Phenotypes Across Multiple Environments. G3 (Bethesda, Md) 2018, 8, 1721–1732. [Google Scholar] [CrossRef]
  22. Islam, S.; Fang, D.D.; Jenkins, J.N.; Guo, J.; McCarty, J.C.; Jones, D.C. Evaluation of genomic selection methods for predicting fiber quality traits in Upland cotton. Mol. Genet. Genom. 2019, 295, 67–79. [Google Scholar] [CrossRef] [PubMed]
  23. Li, Z.; Liu, S.; Conaty, W.; Zhu, Q.H.; Moncuquet, P.; Stiller, W.; Wilson, I. Genomic prediction of cotton fibre quality and yield traits using Bayesian regression methods. Heredity 2022, 129, 103–112. [Google Scholar] [CrossRef]
  24. Guo, T.; Li, H.; Yan, J.; Tang, J.; Li, J.; Zhang, Z.; Zhang, L.; Wang, J. Performance prediction of F1 hybrids between recombinant inbred lines derived from two elite maize inbred lines. Theoretical and Applied Genetics 2013, 126, 189–201. [Google Scholar] [CrossRef]
  25. Li, G.; Dong, Y.; Zhao, Y.; Tian, X.; Würschum, T.; Xue, J.; Chen, S.; Reif, J.C.; Xu, S.; Liu, W. Genome-wide prediction in a hybrid maize population adapted to Northwest China. The Crop Journal 2020, 8, 830–842. [Google Scholar] [CrossRef]
  26. Xiao, N.; Pan, C.; Li, Y.; Wu, Y.; Cai, Y.; Lu, Y.; Wang, R.; Yu, L.; Shi, W.; Kang, H.; et al. Genomic insight into balancing high yield, good quality, and blast resistance of japonica rice. Genome Biology 2021, 22, 283. [Google Scholar] [CrossRef]
  27. Qin, J.; Wang, F.; Zhao, Q.; Shi, A.; Zhao, T.; Song, Q.; Ravelombola, W.; An, H.; Yan, L.; Yang, C.; et al. Identification of Candidate Genes and Genomic Selection for Seed Protein in Soybean Breeding Pipeline. Front. Plant Sci. 2022, 13, 882732. [Google Scholar] [CrossRef]
  28. Liu, Y.-H.; Xu, Y.; Zhang, M.; Cui, Y.; Sze, S.-H.; Smith, C.W.; Xu, S.; Zhang, H.-B. Accurate Prediction of a Quantitative Trait Using the Genes Controlling the Trait for Gene-Based Breeding in Cotton. Front. Plant Sci. 2020, 11. [Google Scholar] [CrossRef]
  29. Ma, Z.; He, S.; Wang, X.; Sun, J.; Zhang, Y.; Zhang, G.; Wu, L.; Li, Z.; Liu, Z.; Sun, G.; et al. Resequencing a core collection of upland cotton identifies genomic variation and loci influencing fiber quality and yield. Nat. Genet. 2018, 50, 803–813. [Google Scholar] [CrossRef]
  30. Wang, J.; Zhang, Z. GAPIT Version 3: Boosting Power and Accuracy for Genomic Association and Prediction. Genomics, Proteomics&Bioinformatics.
  31. Howard, R.; Carriquiry, A.L.; Beavis, W.D. Parametric and nonparametric statistical methods for genomic selection of traits with additive and epistatic genetic architectures. G3 (Bethesda, Md) 2014, 4, 1027–1046. [Google Scholar] [CrossRef]
  32. Budhlakoti, N.; Rai, A.; Mishra, D.C.; Jaggi, S.; Kumar, M.; Rao, A.R. Comparative study of different non-parametric genomic selection methods under diverse genetic architecture. Indian J. Genet. Plant Breed. (The) 2020, 80, 395–401. [Google Scholar] [CrossRef]
  33. Villumsen, T.; Janss, L.; Lund, M. The importance of haplotype length and heritability using genomic selection in dairy cattle. J. Anim. Breed. Genet. 2009, 126, 3–13. [Google Scholar] [CrossRef] [PubMed]
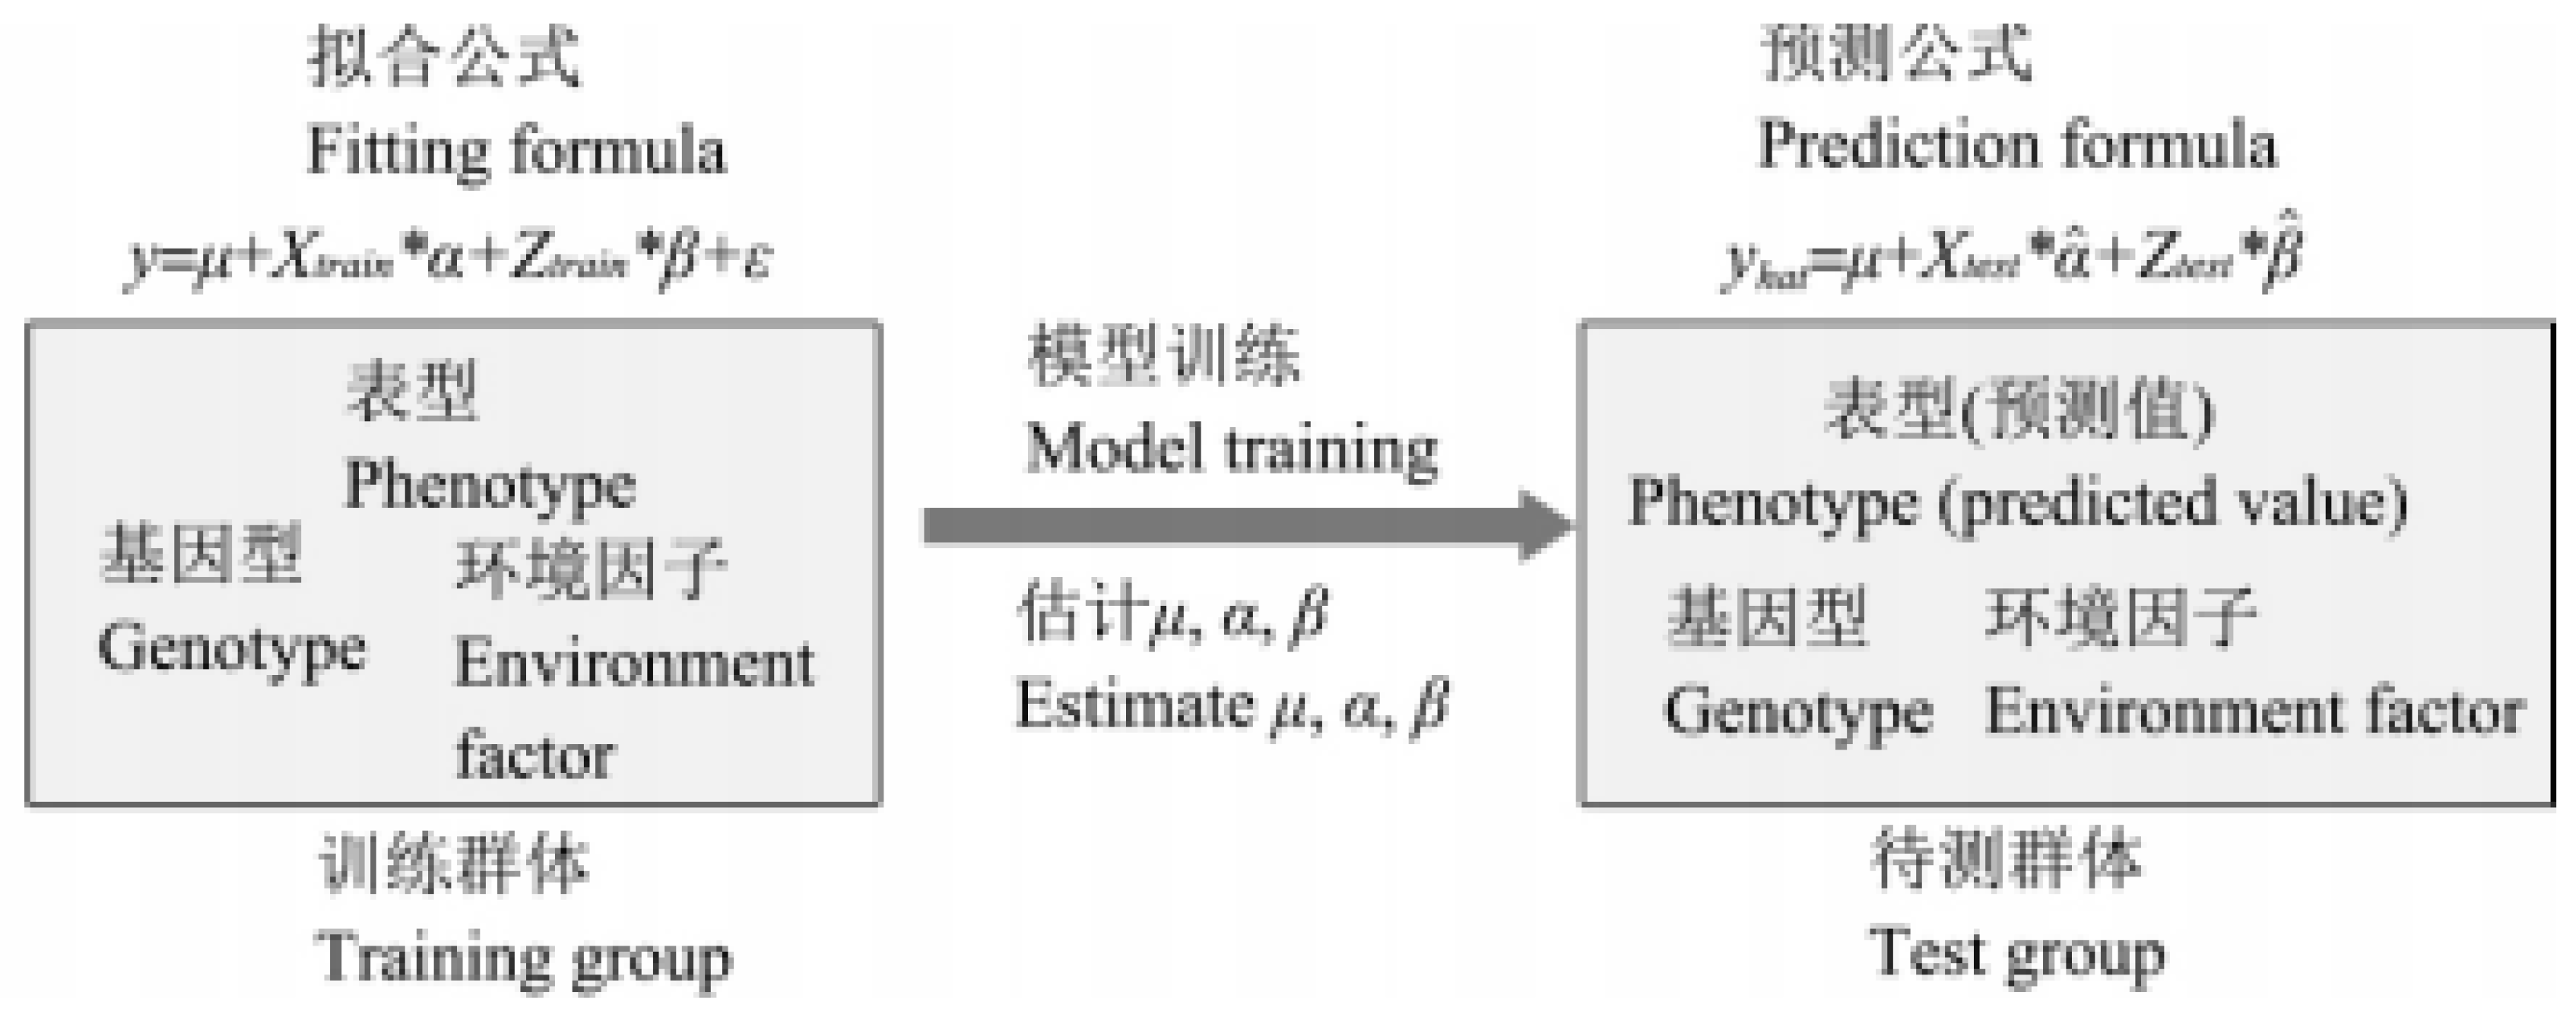
Figure 1. Principle of Genomic Selection Breeding.
Preprints 90068 g001
Figure 2. Prediction accuracy of different models. Note: SCI, Spinning Consistance Index; MAT, Maturity.
Preprints 90068 g002
Figure 3. Influence of different marker densities on prediction accuracy Note: SCI, Spinning Consistance Index; MAT, Maturity.
Preprints 90068 g003
Disclaimer/Publisher’s Note: The statements, opinions and data contained in all publications are solely those of the individual author(s) and contributor(s) and not of MDPI and/or the editor(s). MDPI and/or the editor(s) disclaim responsibility for any injury to people or property resulting from any ideas, methods, instructions or products referred to in the content.
Copyright: This open access article is published under a Creative Commons CC BY 4.0 license, which permit the free download, distribution, and reuse, provided that the author and preprint are cited in any reuse.
Prerpints.org logo

Preprints.org is a free preprint server supported by MDPI in Basel, Switzerland.

Subscribe

© 2024 MDPI (Basel, Switzerland) unless otherwise stated