1. Introduction
During the last decade, the environmental concerns were becoming very important to shift from fossil energy to renewable energy [
1,
2,
3,
4,
5].
These concerns were intensively promoted in Morocco, as many farmers were converted to use PVWPS supported by the governmental subsidy programs to enhance sustainability of agricultural irrigation systems [
6,
7,
8,
9].
Otherwise, innovative solutions and R&D actions were still required to increase performances of PVWPS and to widely promote use and adoption of PV energy solutions in developing countries. The PVWPS performances have been evoked by several researchers to address three mains aspects regarding effect of temperature, effect of irradiance and adequation between PV generator offers and load demands [
10,
11,
12,
13,
14,
15,
16,
17,
18,
19,
20,
21,
22,
23,
24,
25,
26,
27,
28,
29,
30,
31,
32,
33,
34,
35,
36,
37,
38]. To address problems due to the effects of temperature, several studies tested various methods and techniques of PV panels cooling by air and water to improve PV generators efficiencies [
12,
13,
14,
15,
16]. Other studies worked on Tracking PV generators orientation and inclination to evaluate impacts on yielding PV energy [
17,
18,
19,
20].
Concerning the effect of irradiance on PV systems, several authors have been studied on possibilities of intercepting more electrical energy using different MPPT configurations and algorithms [
21,
22,
23,
24,
25,
26,
27,
28,
29].
Other Authors have been worked on valorization of irradiance through hydraulic energy performance [
30,
31,
32,
33,
34,
35,
36,
37,
38]. They compared use of centrifugal and positive displacement pumps to show better efficiencies of the last ones [
30,
31,
32,
33,
34]. Some other works treated PVWPS hydraulic performance due to choosing of optimal pumping heads [
35,
36,
37,
38].
By referring to the previous art, majority of the performance improvements have been focused on the PVWPS electrical efficiencies regarding use of MPPT technologies . However, matching between PV electrical energy and its hydraulic use still requiring more innovations to adapt and maintain constant hydraulic charge of directly coupled irrigation system. One new concept of HPPT (Hydraulic Power Point Tracking) has been introduced [
39,
41] to improve hydraulic efficiencies of PVWPS as complement to the MPPT electrical performance. . The new HPPT innovation is based on varying hydraulic operating point (Pressure and flow) of pump using analogy to the MPPT concept of varying electrical operating point (Voltage and current). The HPPT configurations can be implemented using an upstream control of multi-parallel pumps [
40,
41,
42] or downstream control of multi-parallel valves [
39].
This paper aims to firstly design and evaluate the HPPT concept based on using multi-parallel pumps switching for yielding performance with reference to potential change of daily irradiance. Secondly, the hydraulic performance scenarios were tested using the curve fitting and comparing behaviors of the hydraulic energy growth with standard exponential and power growth model.
2. Materials and Methods
2.1. PVWPS and HPPT design
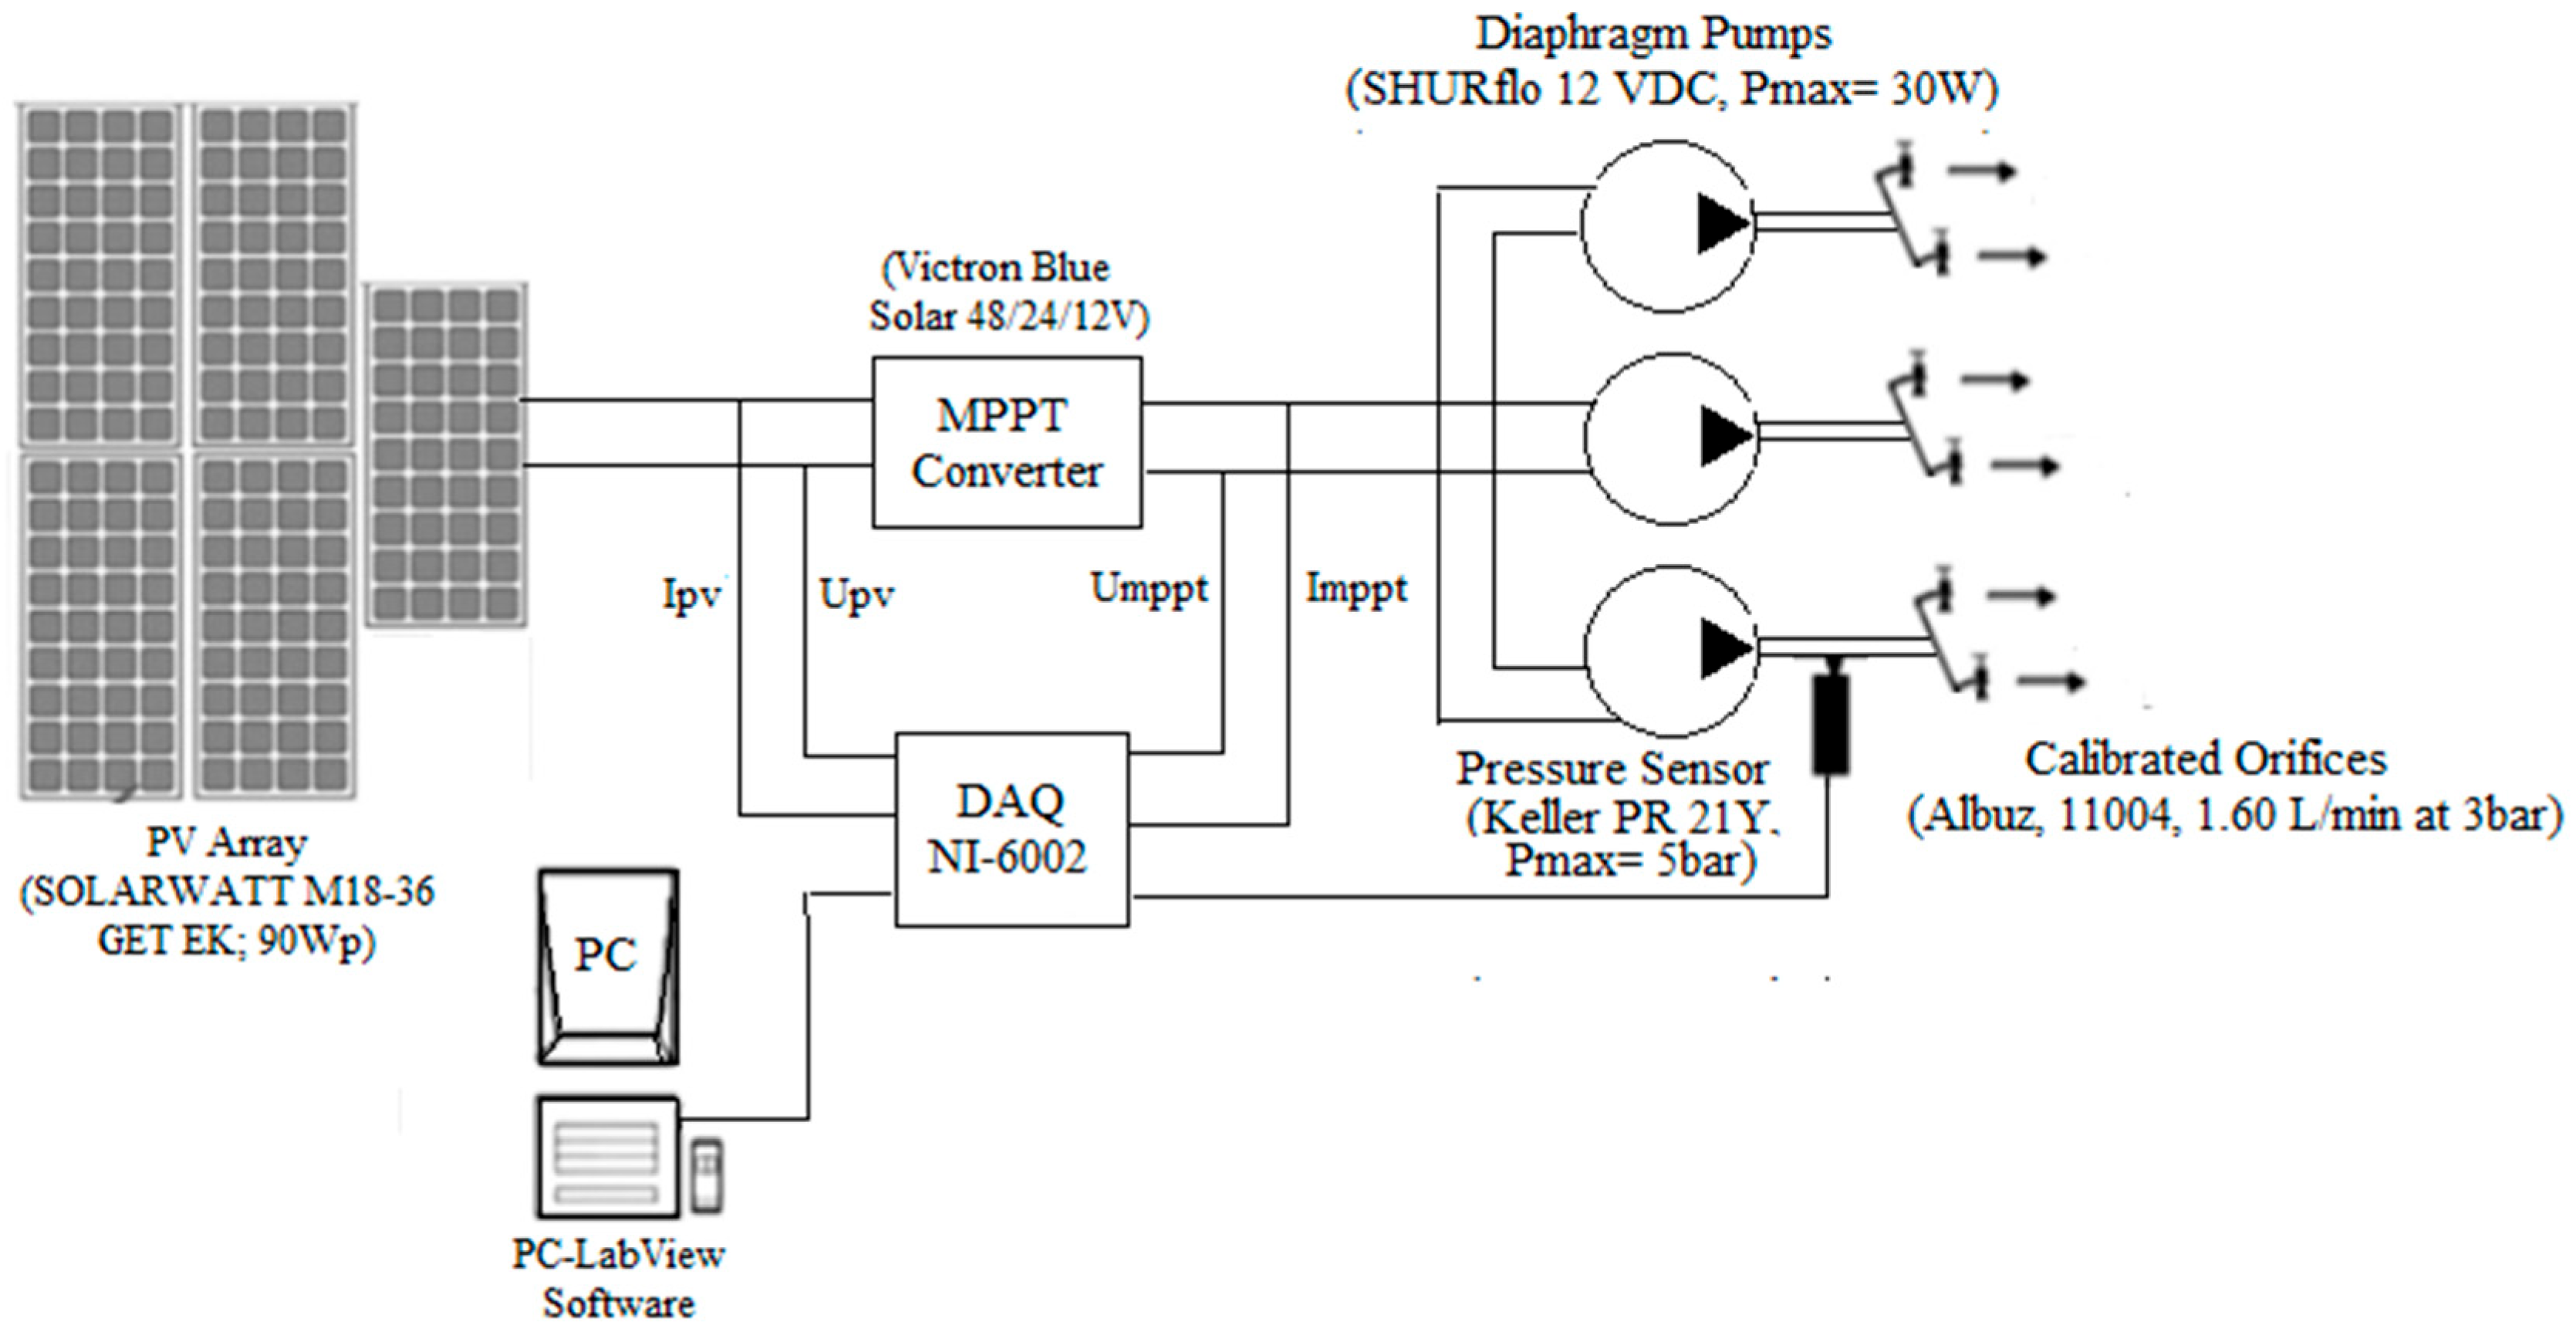
PVWPS standalone performance was evaluated using test bench (
Figure 1). Five solar panels (SOLARWATT M18-36 GET EK; 18Wp) were used to power three DC diaphragm pumps (SHURflo, 12 VDC, P=30W). A solar DC/DC converter (Victron Blue Solar 48/24/12V) is implemented to adapt the PV generator output to the pumps demand using the MPPT perturb and observe method. The pumps were mounted in parallel scheme to be switched manually in order adjust the hydraulic operating point according to the potential of the PV generator varying with the potential of the occurring daily irradiance.
The solar panel and converter output currents were measured using the current sensor (ACS712). The operating pressure measurement was done by a digital sensor (Keller PR 21Y, Pmax = 5 bar) to evaluate the flow rate with reference to the output of calibrated orifice (Albus, 11004, 1.3 L/min (
Figure 1).
Figure 2 present the calibration curve of the pressure sensor. This curve present the converted pressure measurements from the voltage readings. Flow rates were determined using the potting method and compared with the model output of the calibrated orifice (Q= K*P
X). This allows determining the flow value for each detected pressure value. The pressures and flow rate outputs of the pumps were manually recorded three times to validate how the calibration test is stable and precise (
Figure 2).
Data were acquired during a period of one day from 8:00 am to 6:00 pm using data acquisition system (NI USB-6002). An average of five values per second was used to evaluate the electrical and hydraulic efficiencies according to the number (from 1 to 3) of switched pumps and the occurring hydraulic operating point due to intensity of the solar irradiance during the day.
where, P
pv, P
mppt, a
1, b
1, a
2, b
2, V
s1 and V
s2 are power of PV panel, power of MPPT converter, intercepts and constants of current calibration curves and Voltages sensors outputs, respectively
2.2. Variability within five years irradiance data (2017-202)
As we are looking for testing performance of PVPS system regarding use of HPPT concept to overcome the problems of low efficiencies due to daily irradiance change, it will be interesting for us to show the potential changes of irradiance that can occur during days, seasons and years.
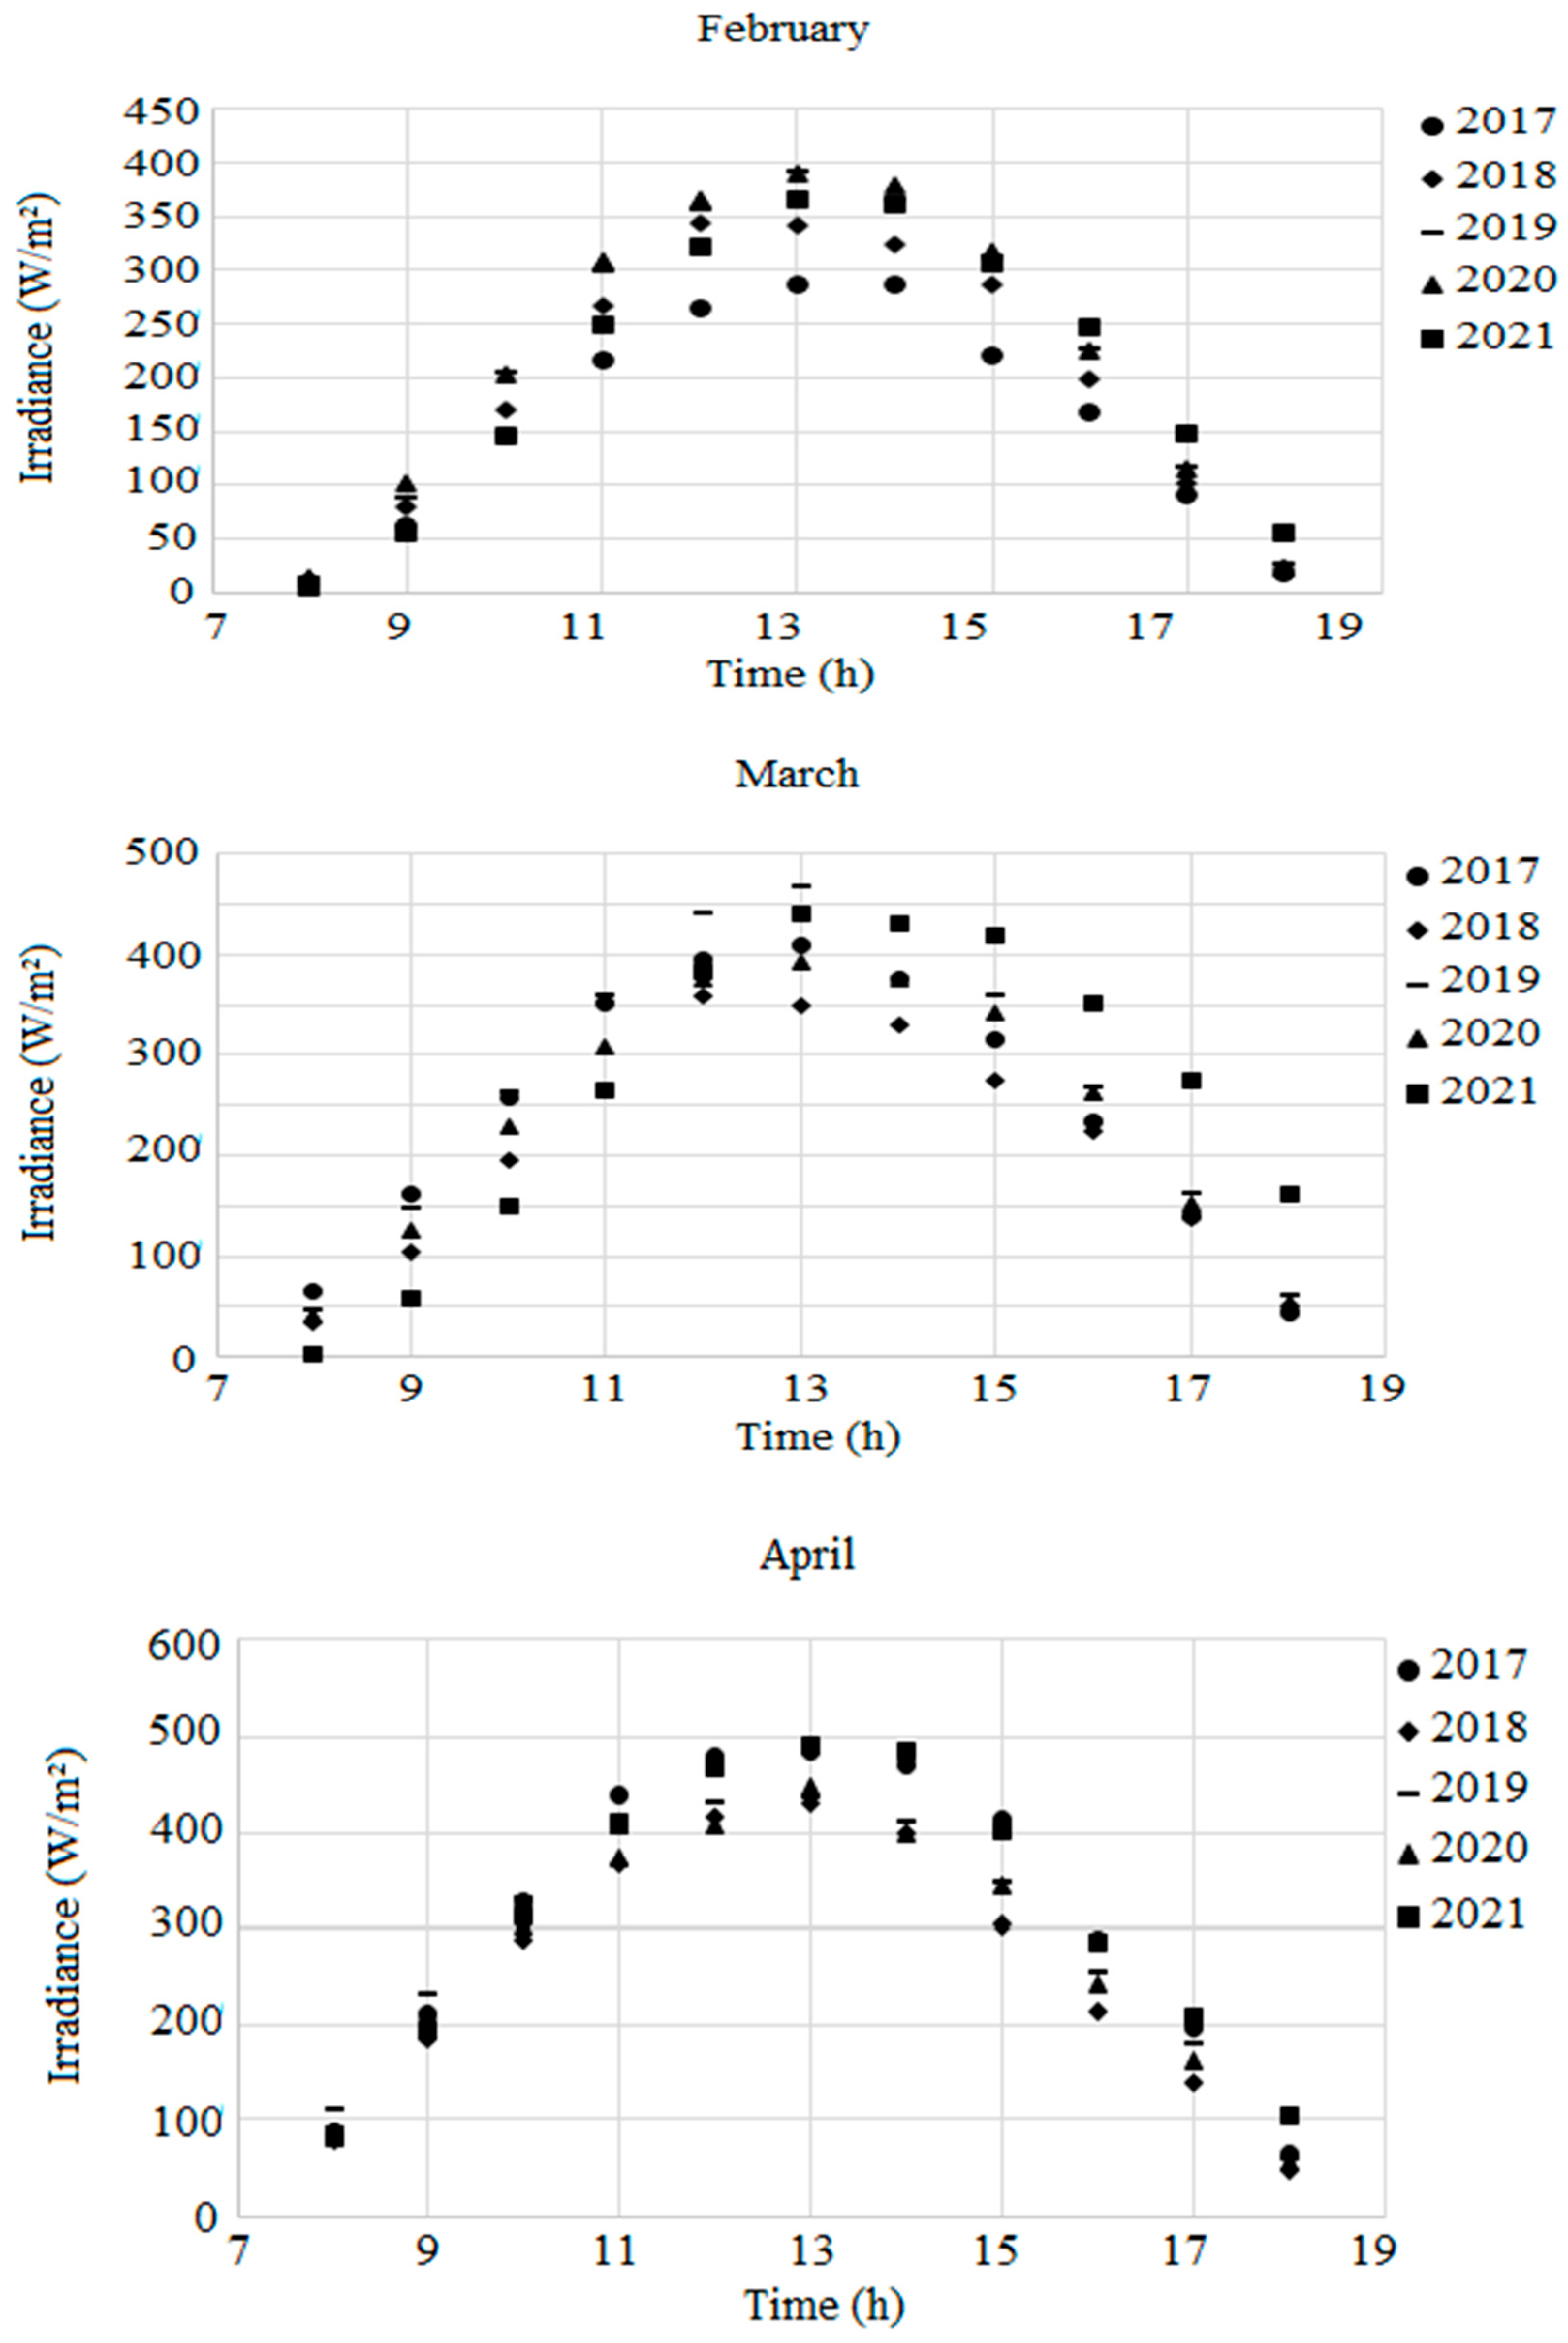
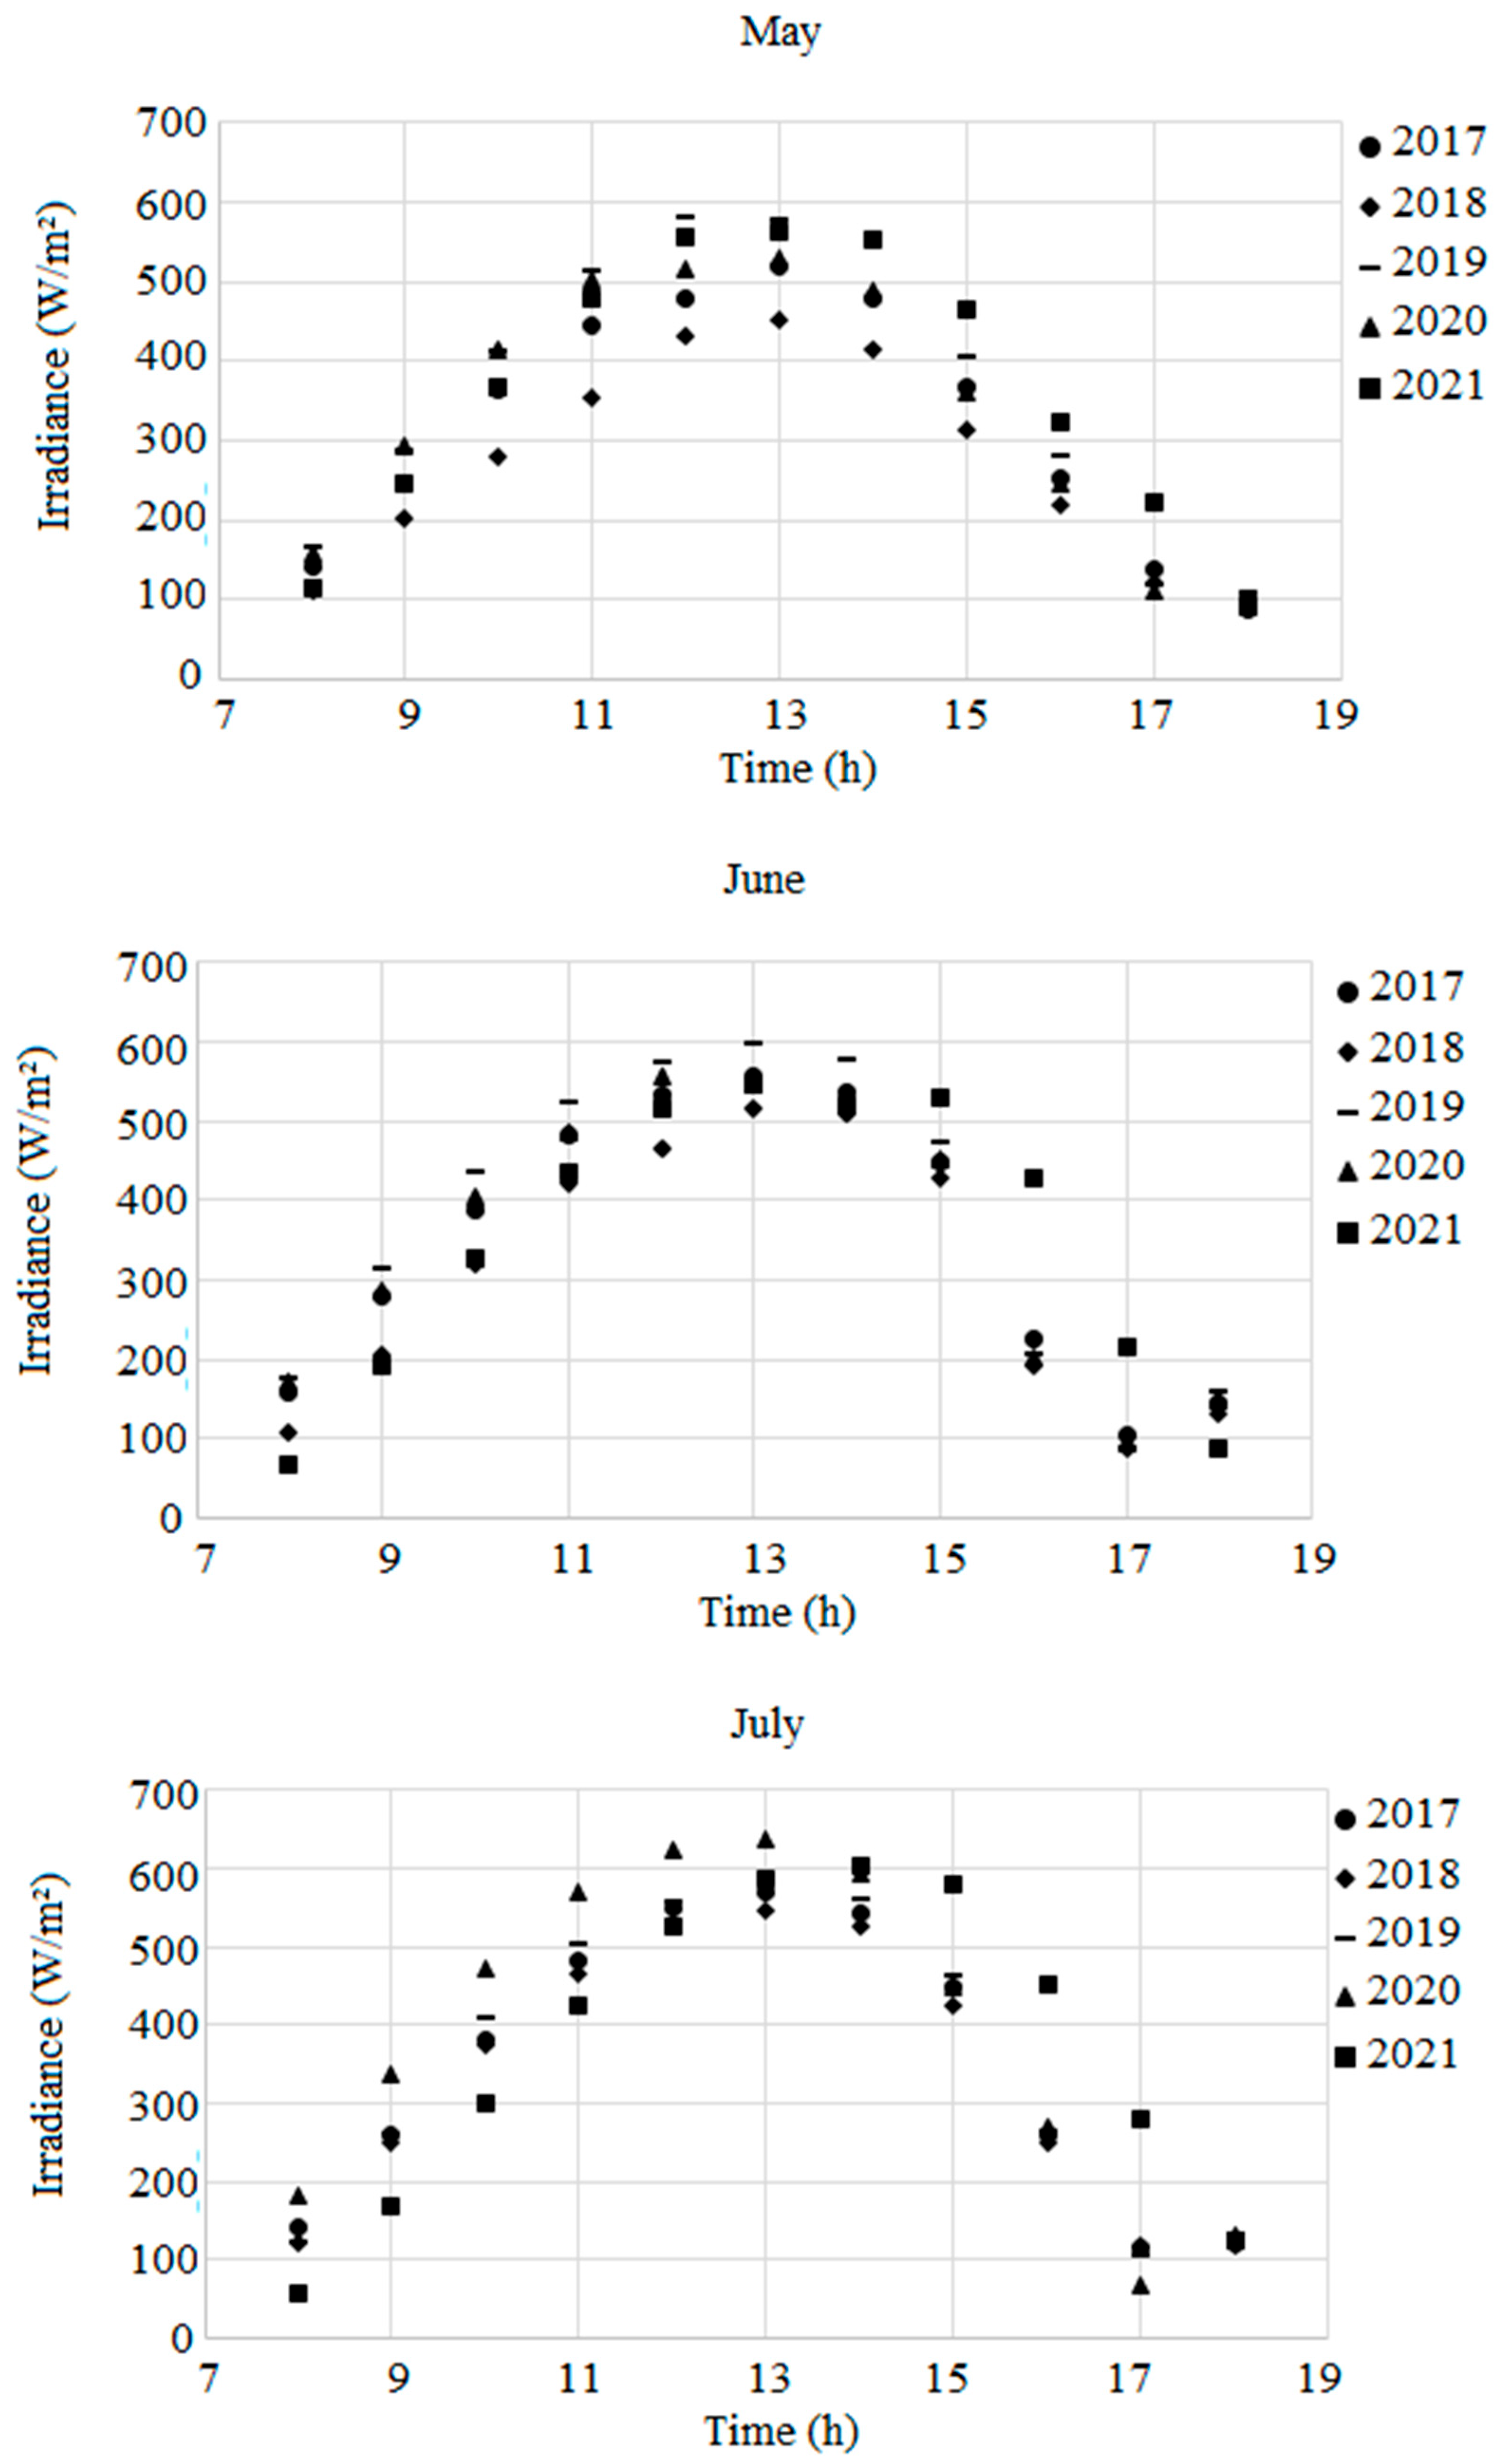
Irradiance data of Settat City (at Regional Center of Agronomic Research (X –7.624233, Y: 32.953487) Morocco) were treated to presented the average trends (
Figure 3) and to illustrate the irradiance changes of five years period (from 2017 to 2021).
This irradiance change can directly affects the performance of Photovoltaic Water Pumping Systems (PVWPS) according to miss-adaptability between the varying PV energy offers and the hydraulic demand. By analyzing trends of the monthly occurring irradiance, we state an average increase from 391W/m
2 in February to 466W/m
2 in March, 491W/m
2 in April, 579W/m
2 in May, 598W/m
2 in June, to reached its peak at 632W/m
2 in July (
Figure 3).
2.3. Variability within annual irradiance data (2019)
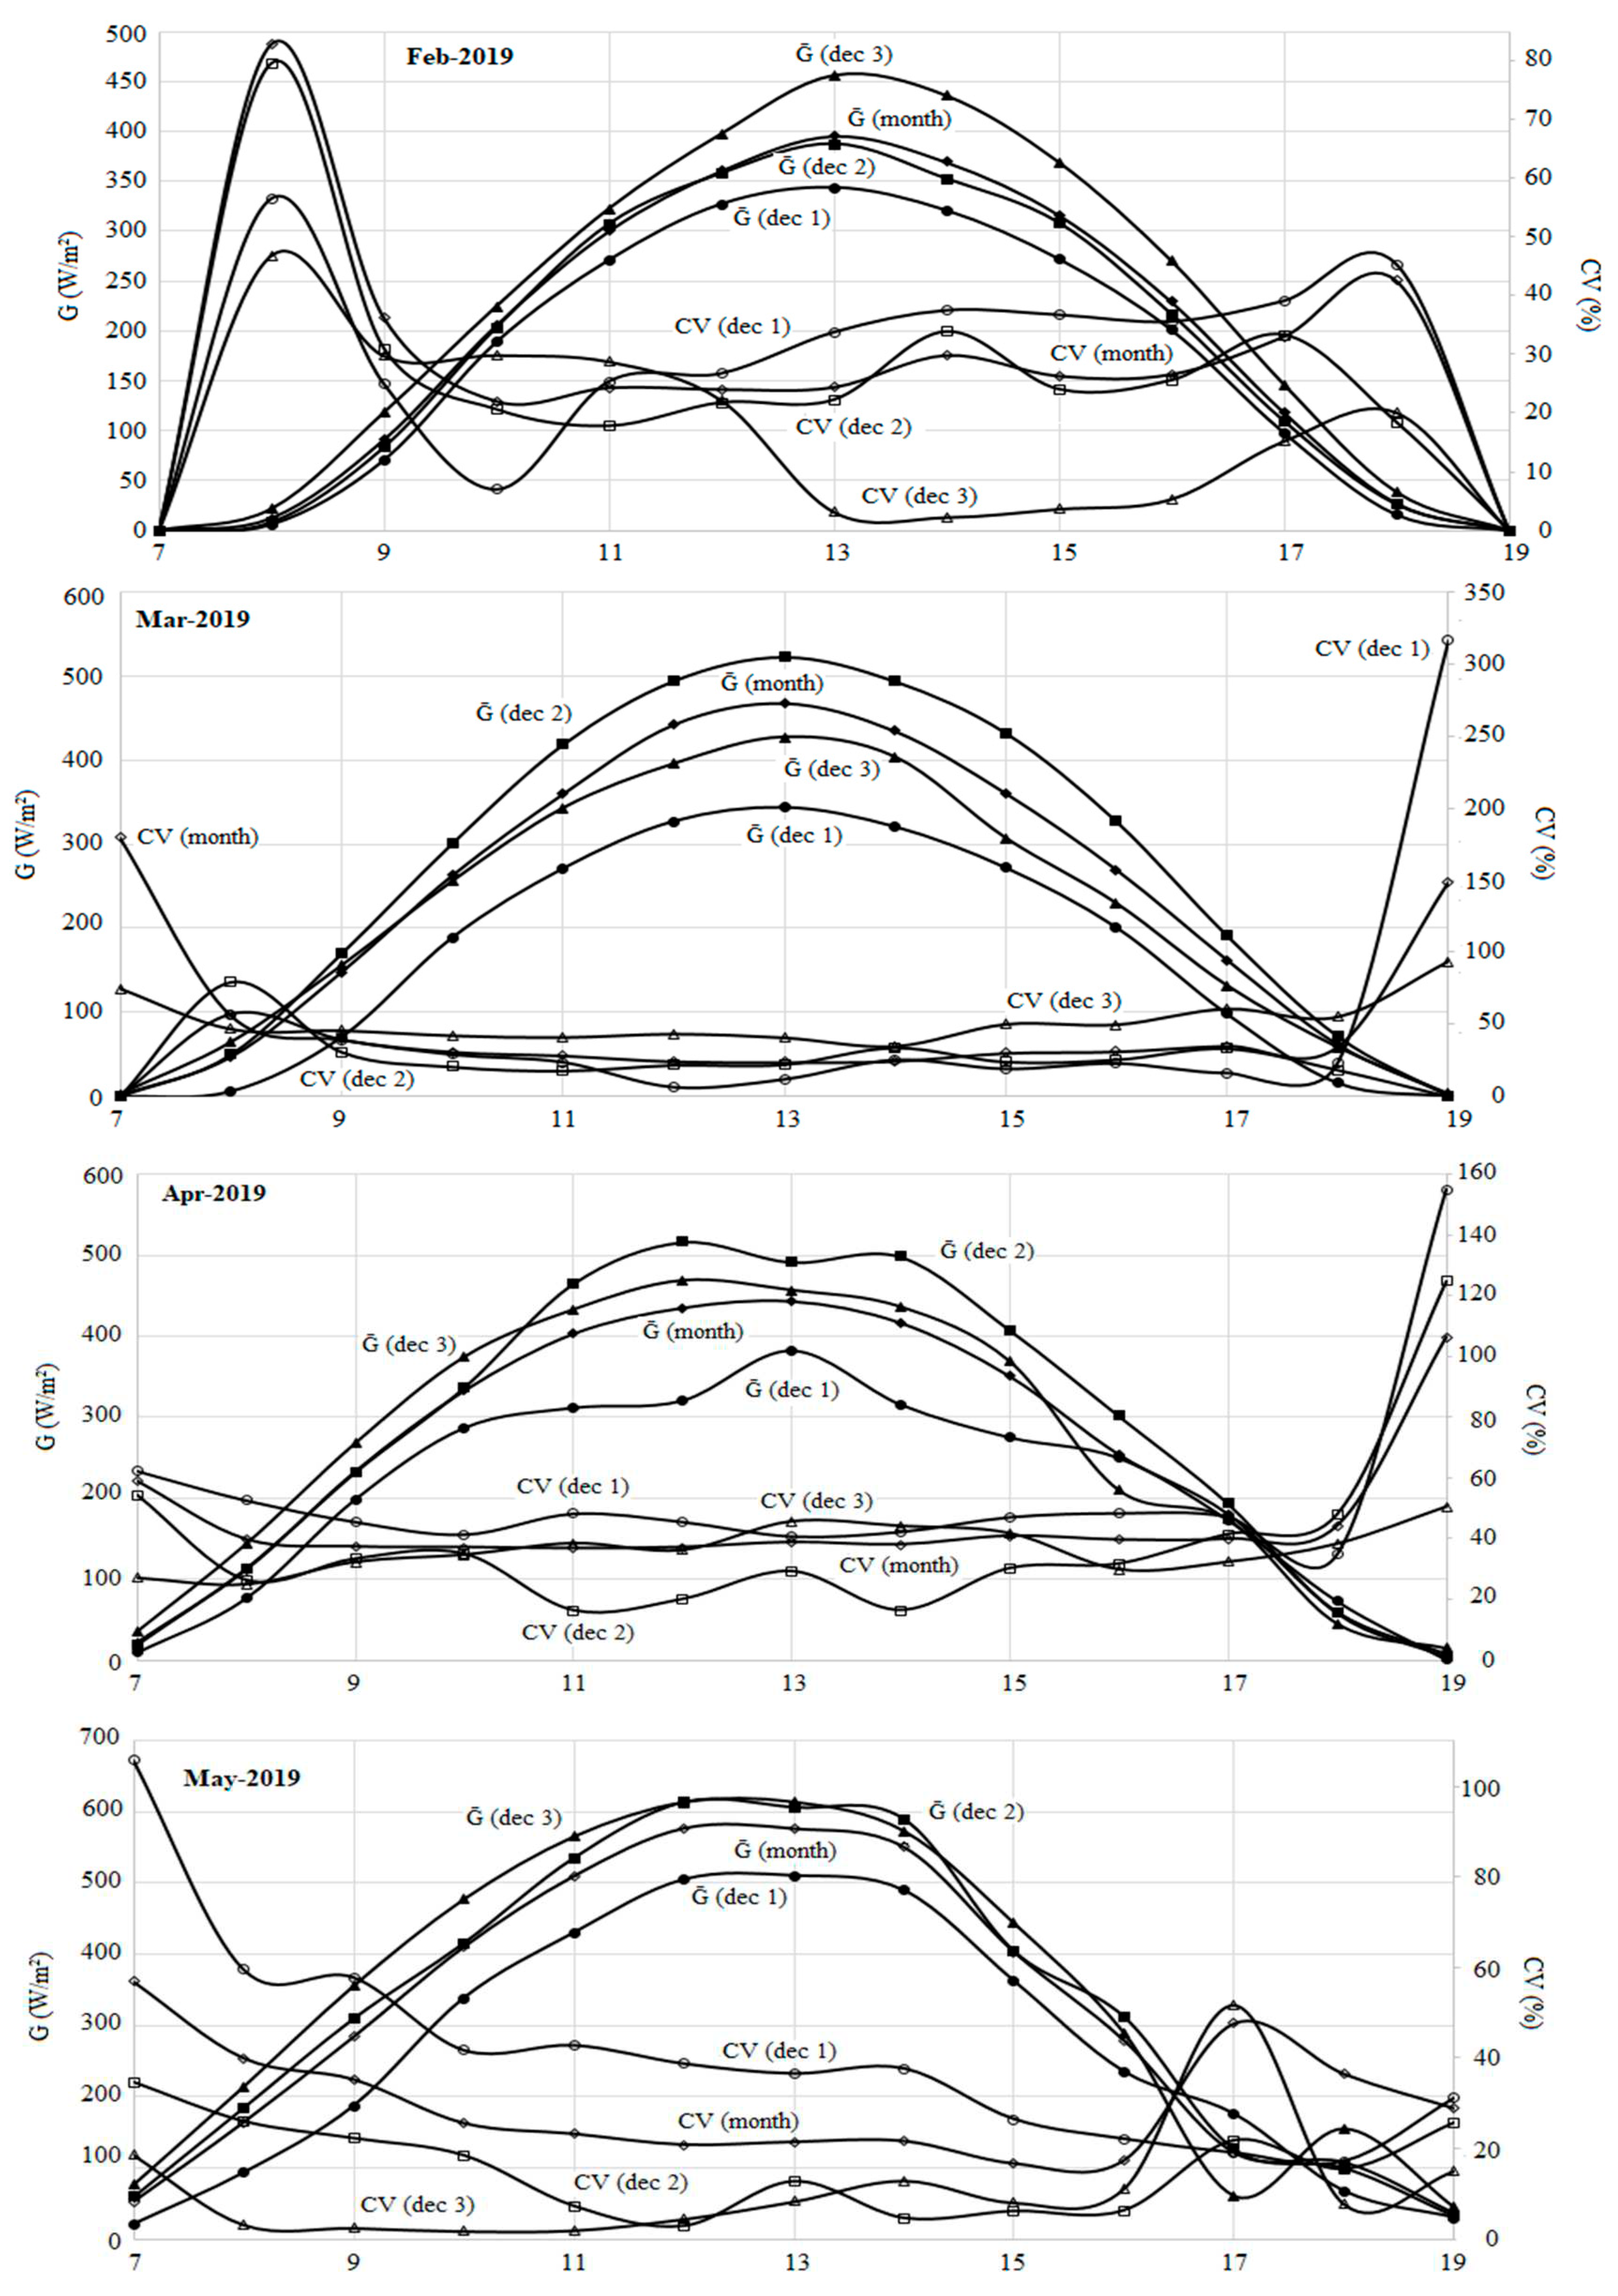
The behavior of irradiance change was closely presented for six months (from February to July) to show the occurring variability during 2019.
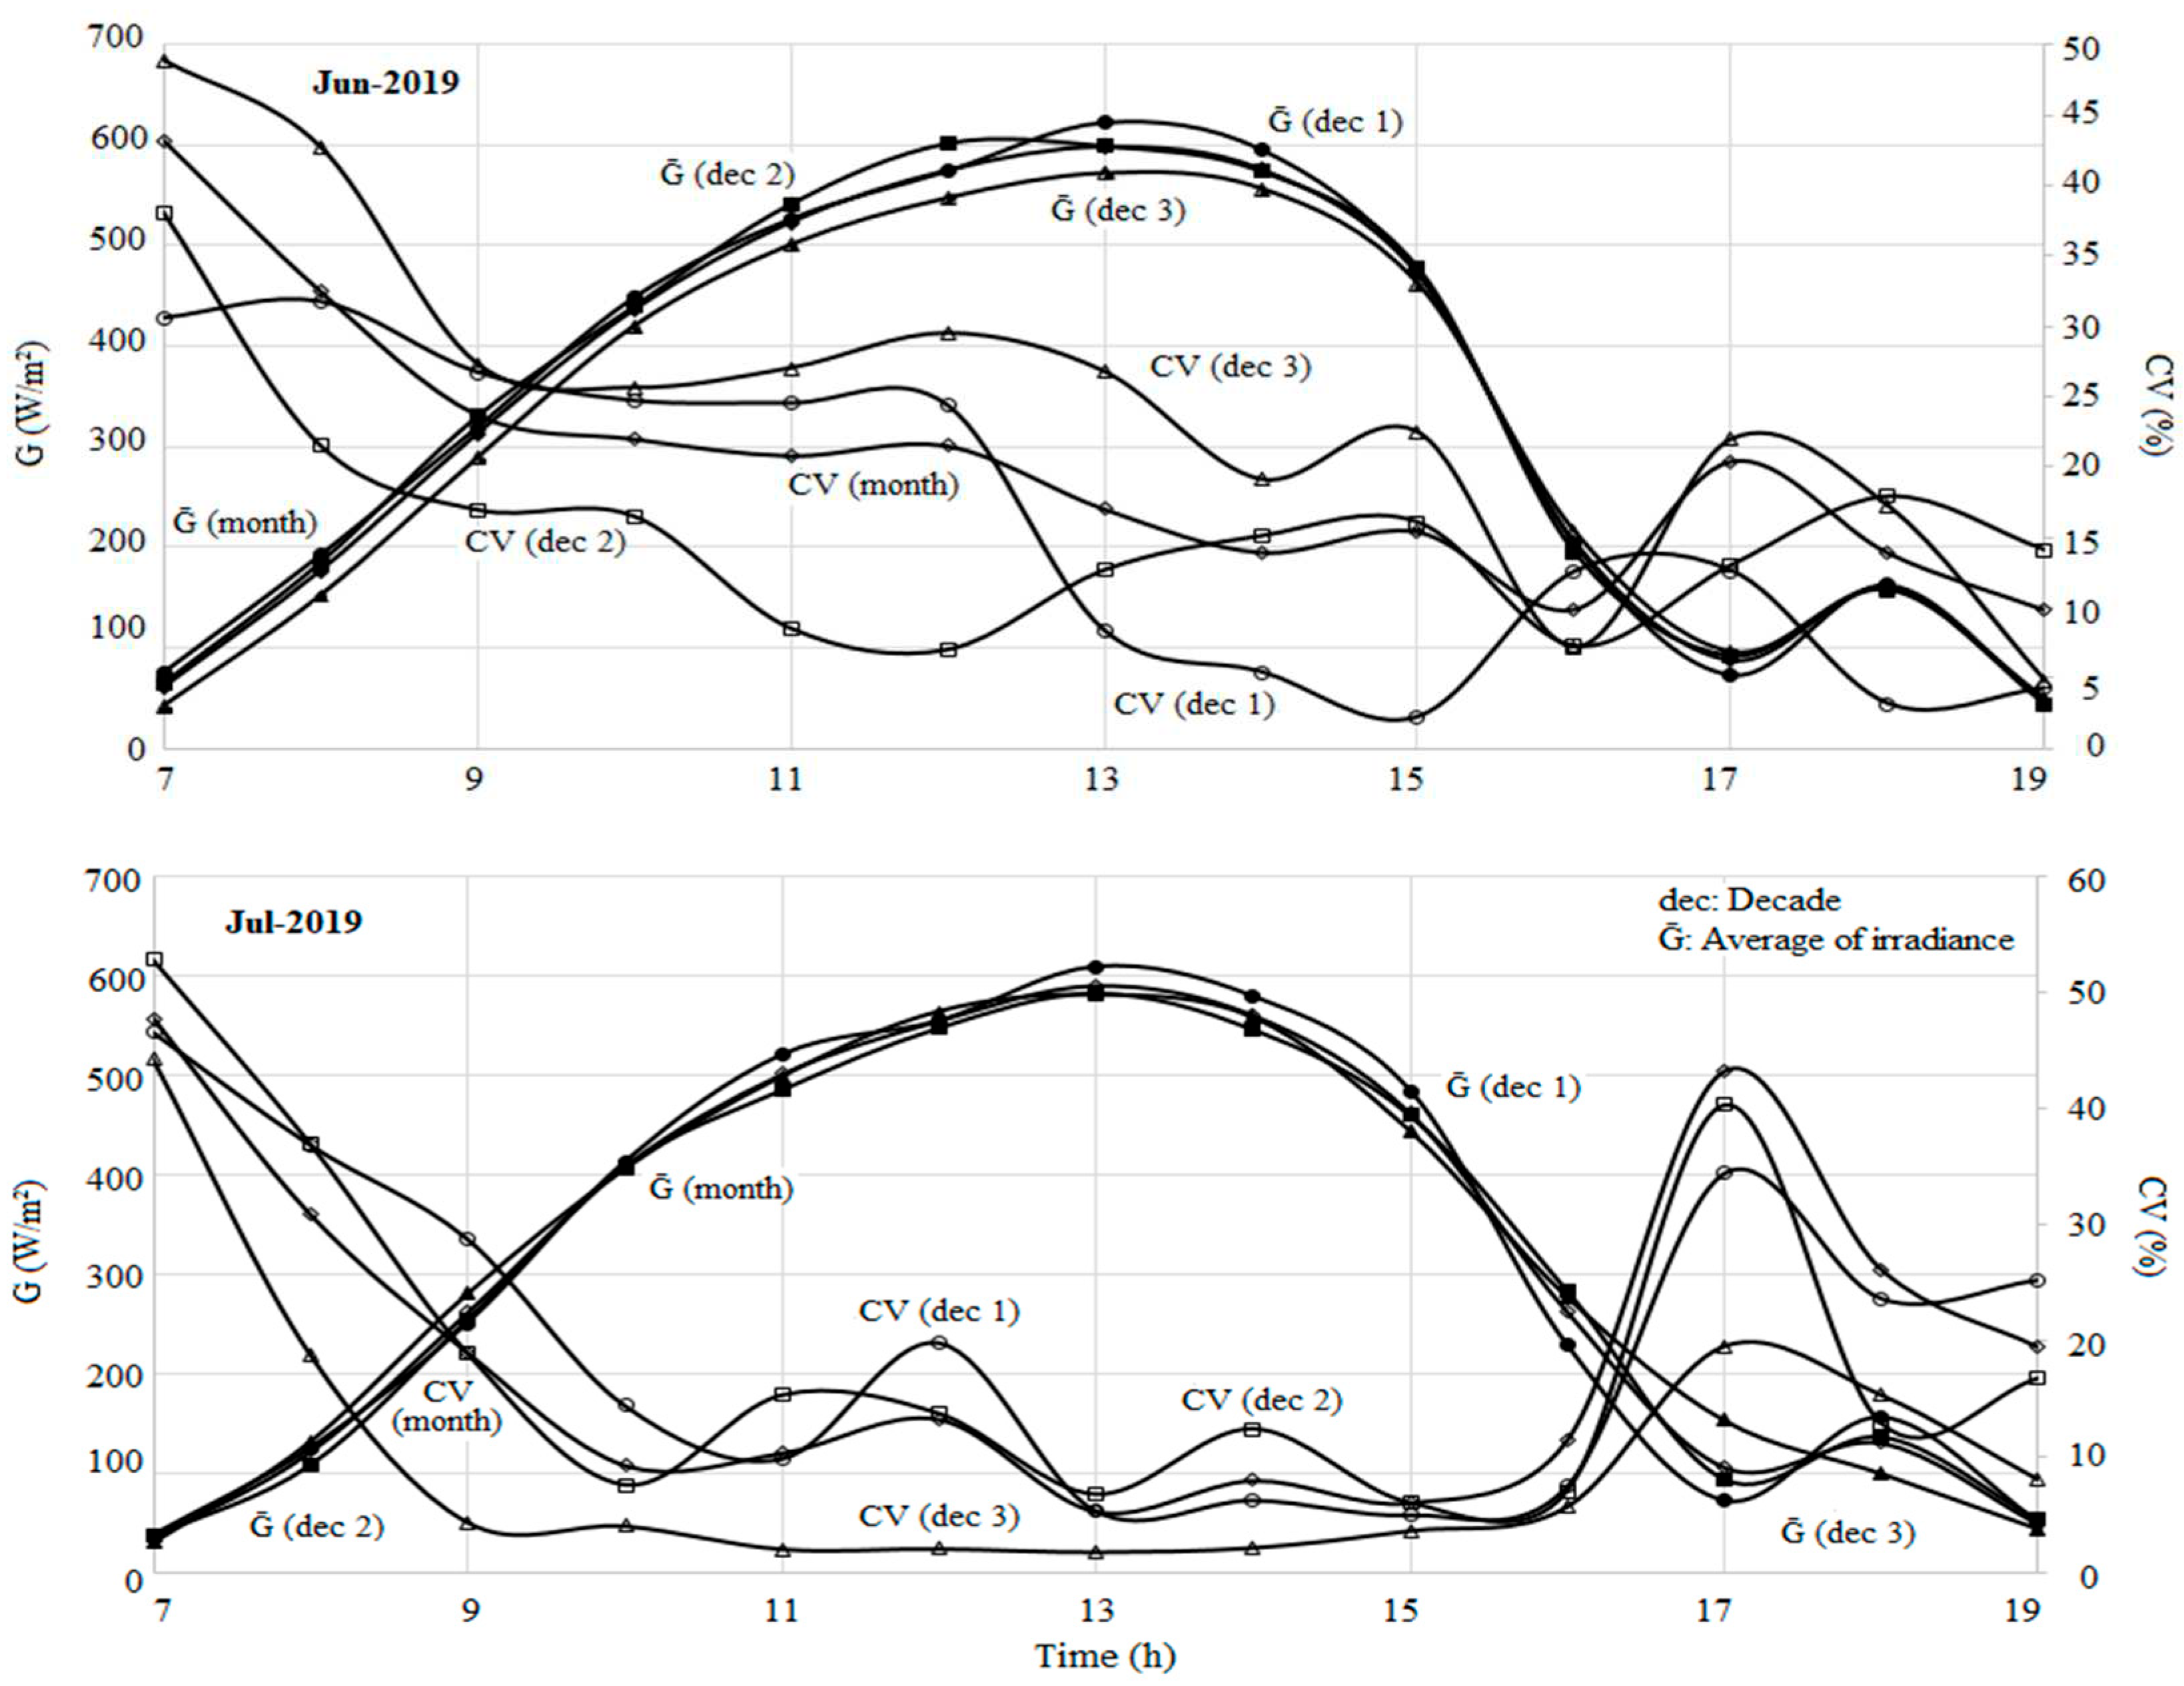
Figure 4 shows a significant daily irradiance change (high coefficients of variation from decade to decade and from month to month during 2019). The trends show a big potential to explore for testing the HPPT concept as main objective of this paper to overcome the effect of irradiance change that can potentially lower the PVWPSs performances.
2.4 Testing of PVWPS and performance growth modeling
By referring to the previous data (
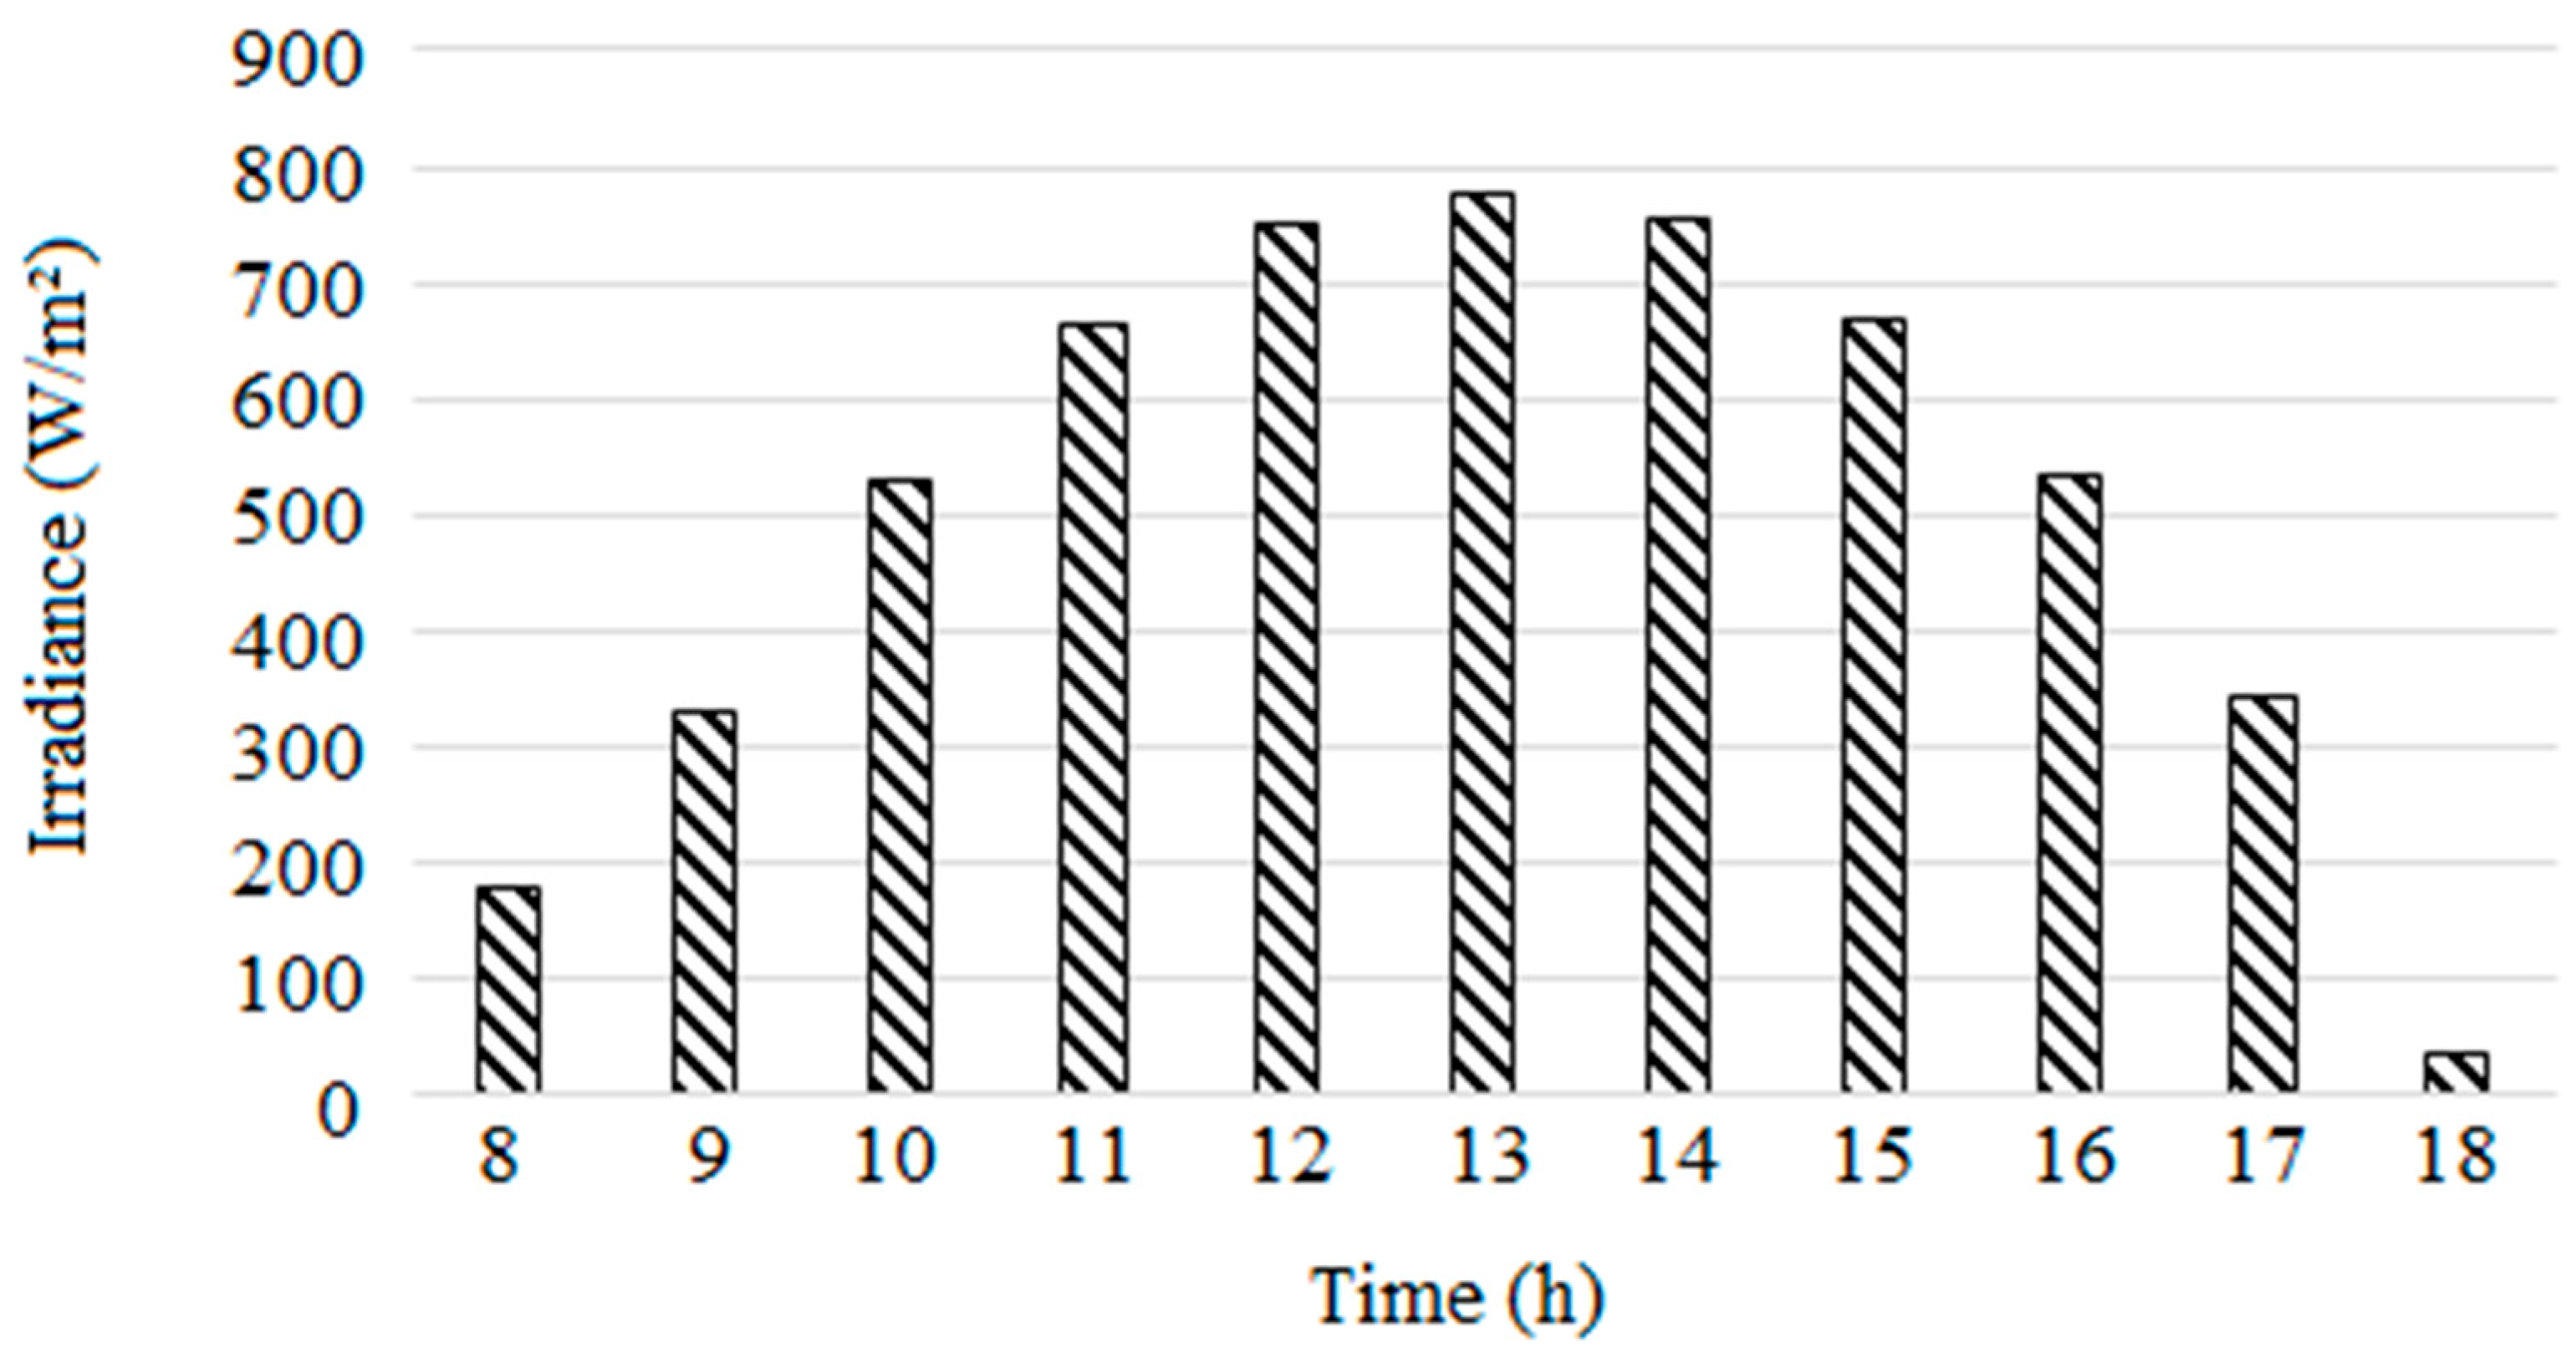
Figure 4), the March irradiance data showed an important variability (CV of 316%) during both morning and evening daily periods. This variability was of great importance for us to conduct our test during the day of 20
th March (
Figure 5) as a representative case among the trends irradiance stated before (
Figure 3 and
Figure 4).
As shown in paragraph 2.1, we have evaluate the electrical and hydraulic efficiencies of the PVWPS according to the number (from 1 to 3) of switched pumps and the occurring hydraulic operating point with reference to varying intensity of the irradiance during the day of 20th 2019. This daily performance of PVWPS is presented to show the effect of changing the number of switched pumps on the system performance according to the daily irradiance change influencing the photovoltaic generator output. The switching of the pumps helped to search for matching the energy offer-demand for better hydraulic power efficiency and energy performance.
As our test is searching for increasing the hydraulic power efficiency and energy performance, it will interesting to compare behavior of the growth energy according to the usual modeling tools used to explain the power and/or exponential energy growth trends due to implementation of the HPPT concept.
In order to assess the connection between solar irradiance and the hydraulic efficiency of our photovoltaic pumping setup, we tested use of both power and exponential growth models [
43,
44] according to their potential adaptability to show great fitting with the output experimental data. Both exponential and power models are presented in
Table 1.
Evaluation of The models fitting is done using indicators of the Root Mean Square Error (RMSE), the Mean Absolute Error (MAE) and the correlation coefficient (R
2) were employed to show how each model is better converging.
where Mi, Ci, SSR and SST are measured values, calculated values, sum of squared residuals and total sum of squares, respectively and N is the number of measurements.
4. Results and Discussions
4.1. Results of the experimental study
Standalone DC PVWPS performance was evaluated using multi parallel pumps switching to approach performance growth due to influence on hydraulic operating point with reference to daily change of irradiance. The electrical and hydraulic parameters of the PVWPS was monitored from 08:00 am to 06:00 pm to show its performance behavior. Taking into consideration irradiance, electrical and hydraulic power outputs, three distinct performance behaviors were showed according to potential change of irradiance from morning, to mid-day and to afternoon (
Table 2). The hydraulic performance of the PVWPS was tested for three cases of using one equivalent pump (30W), two equivalent pumps (2*30W) and three equivalent pumps (3*30W).
The PVWPS performances relative to the daily irradiance was shown in
Table 2. At morning (8:00 am; 9:00 am 10:00 am), three hydraulic performance behaviors are taken by distinctly operating three pumps to change the hydraulic operating point. By switching between the three pumps, the better performance can be satisfied as the number of operating pumps is yielded to the occurring irradiance. In fact, the better performance is corsatisfied by switching o one pump during this morning period.
During the mid-period (At 11:00 am, 12:00 pm, 2:00 pm, and 3:00 pm), the irradiance increasing required another operating hydraulic point adapted to simultaneous switching on of two pumps for satisfying an increase of hydraulic pressure and power. In fact, a maximum pressure (2.12 bar) is reached using two pumps to show an efficiency increase from 12% to 17%. At 1:00 pm, the irradiance (777 W/m2) was high to operate the system using simultaneously three pumps without influencing its efficiencies as showed during the morning period of low irradiance. After that in the afternoon, the system performance showed a similar behavior as in the morning. This is practically due to irradiance drop from 517 to 38 W/m2. By switching between one and three pumps, an efficiency shifting from 8% and 19% is showed when opting for use of one instead of two or three pumps.
The PVWPS performance was clearly variable according to number of switched pumps to show a significant dispersion in terms of efficiency due to the engaged hydraulic operating point and to the occurring irradiance (
Table 2).
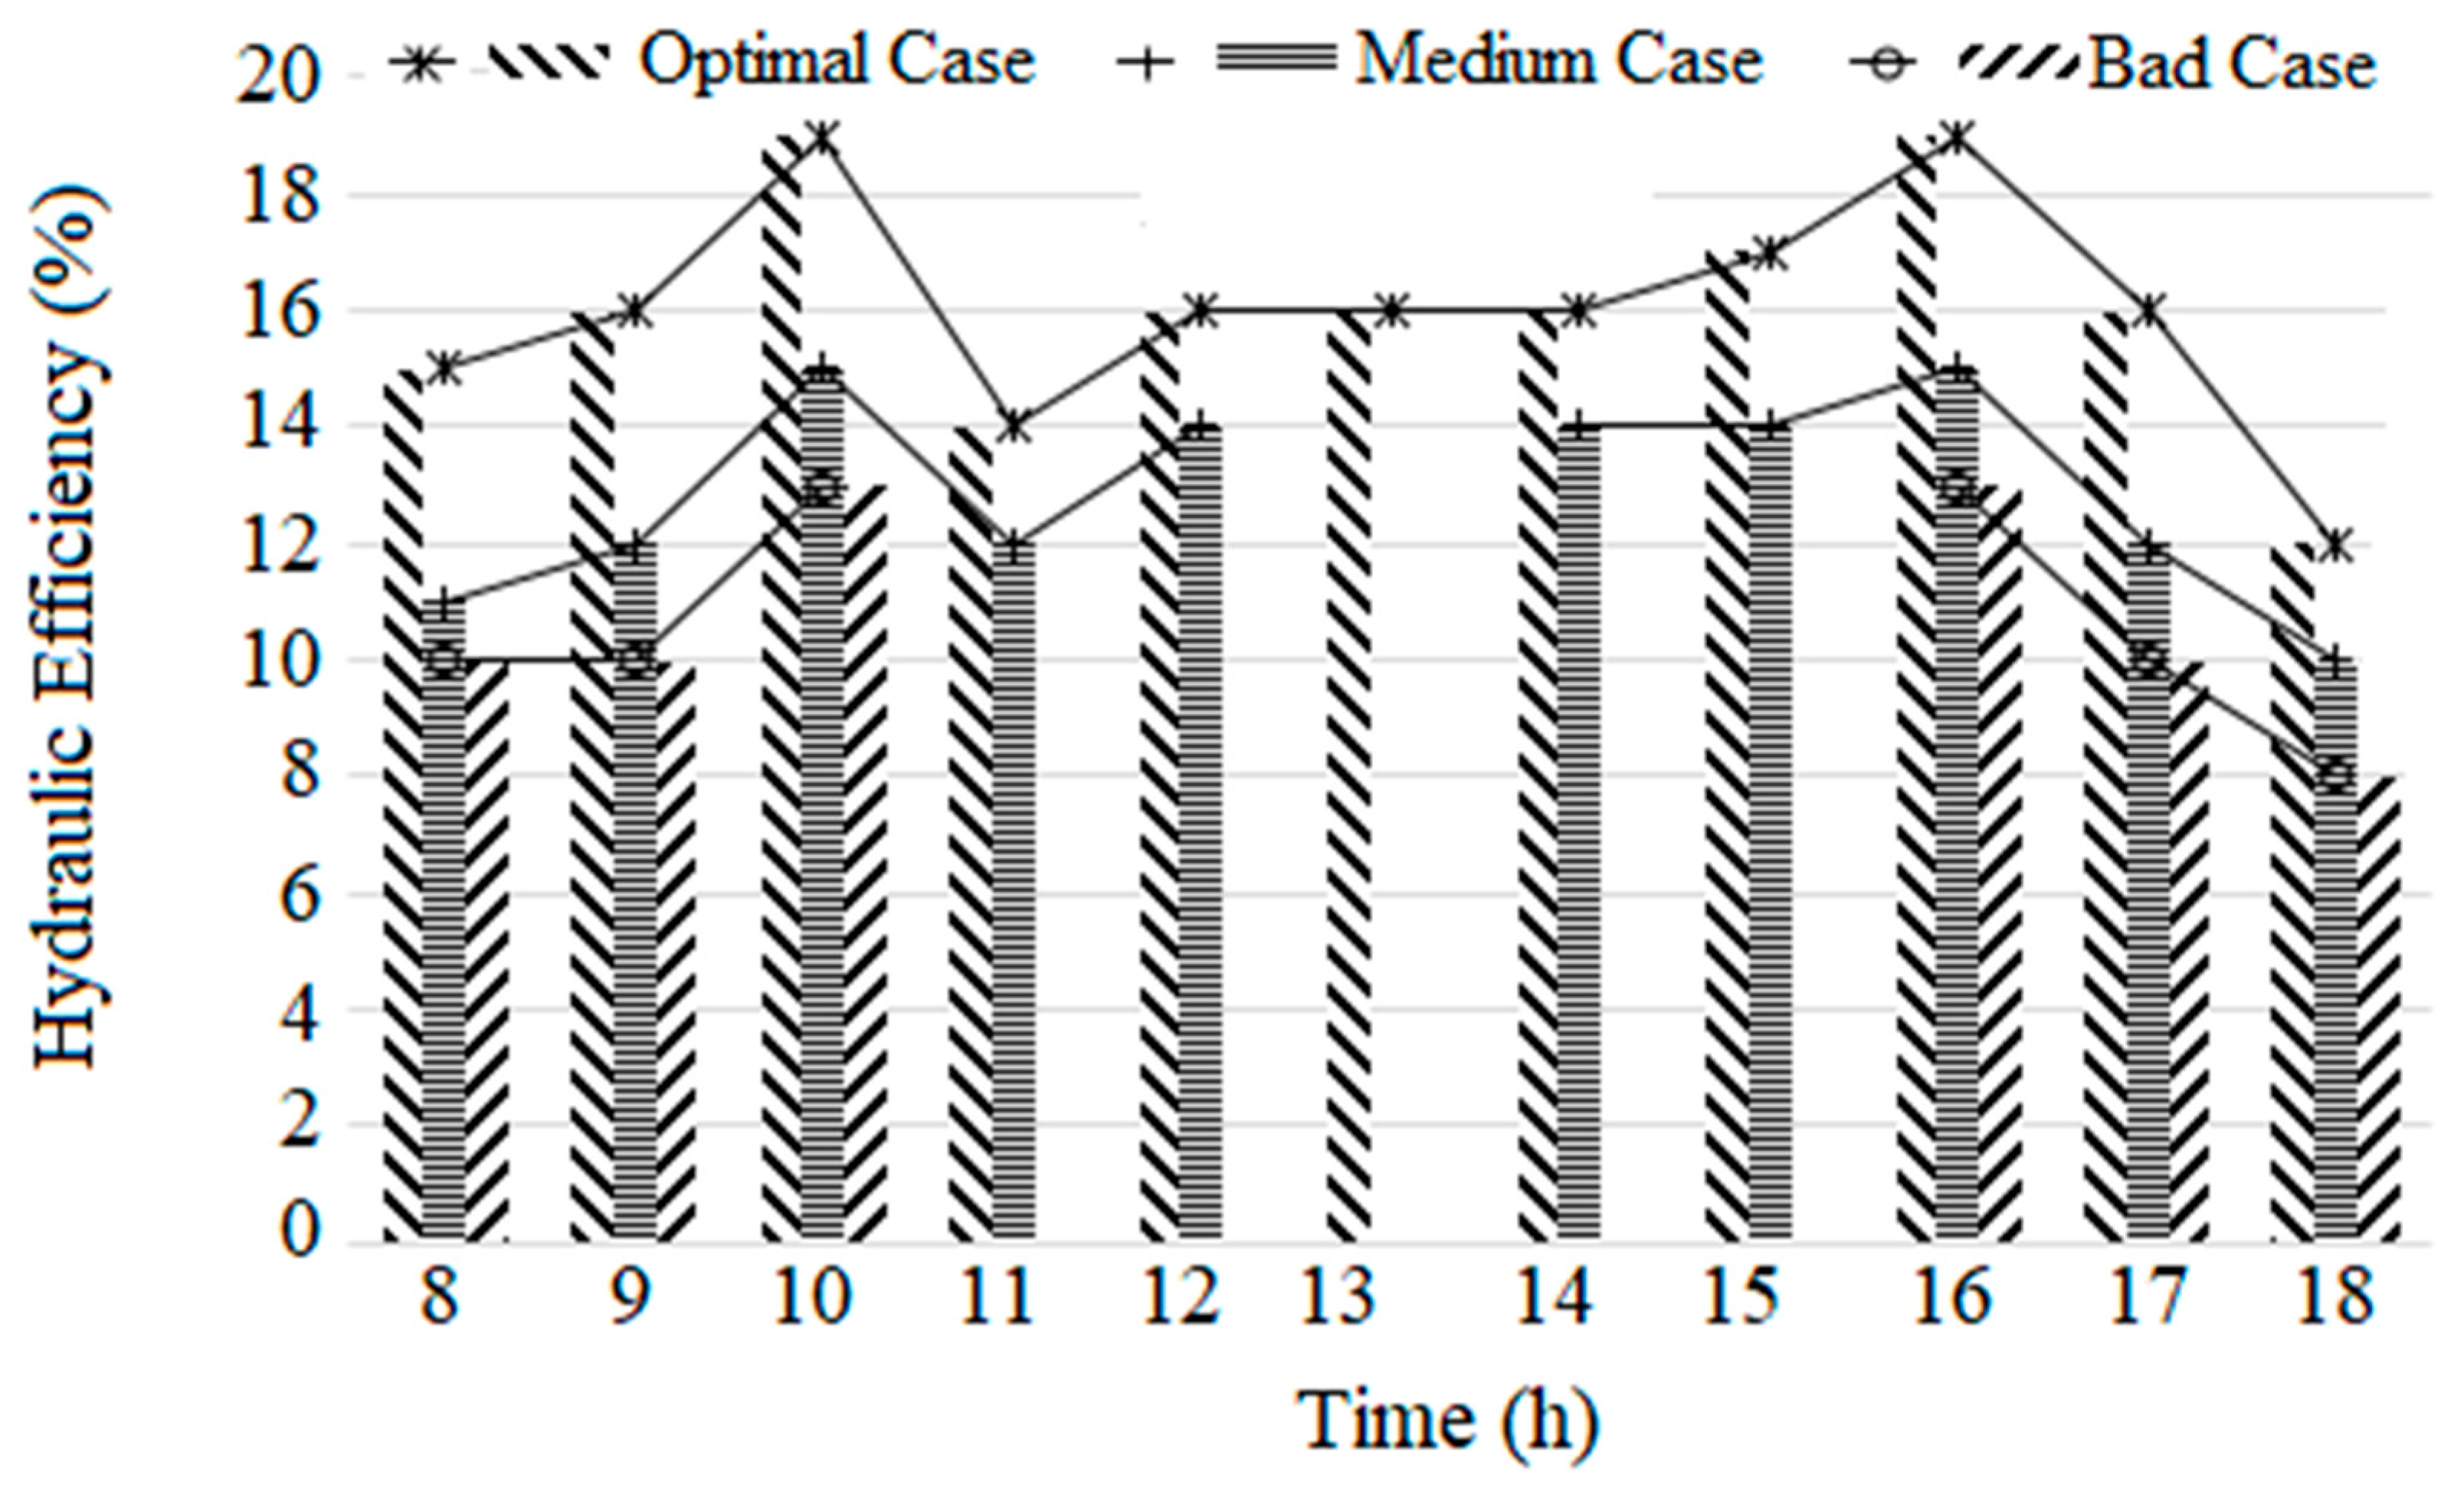
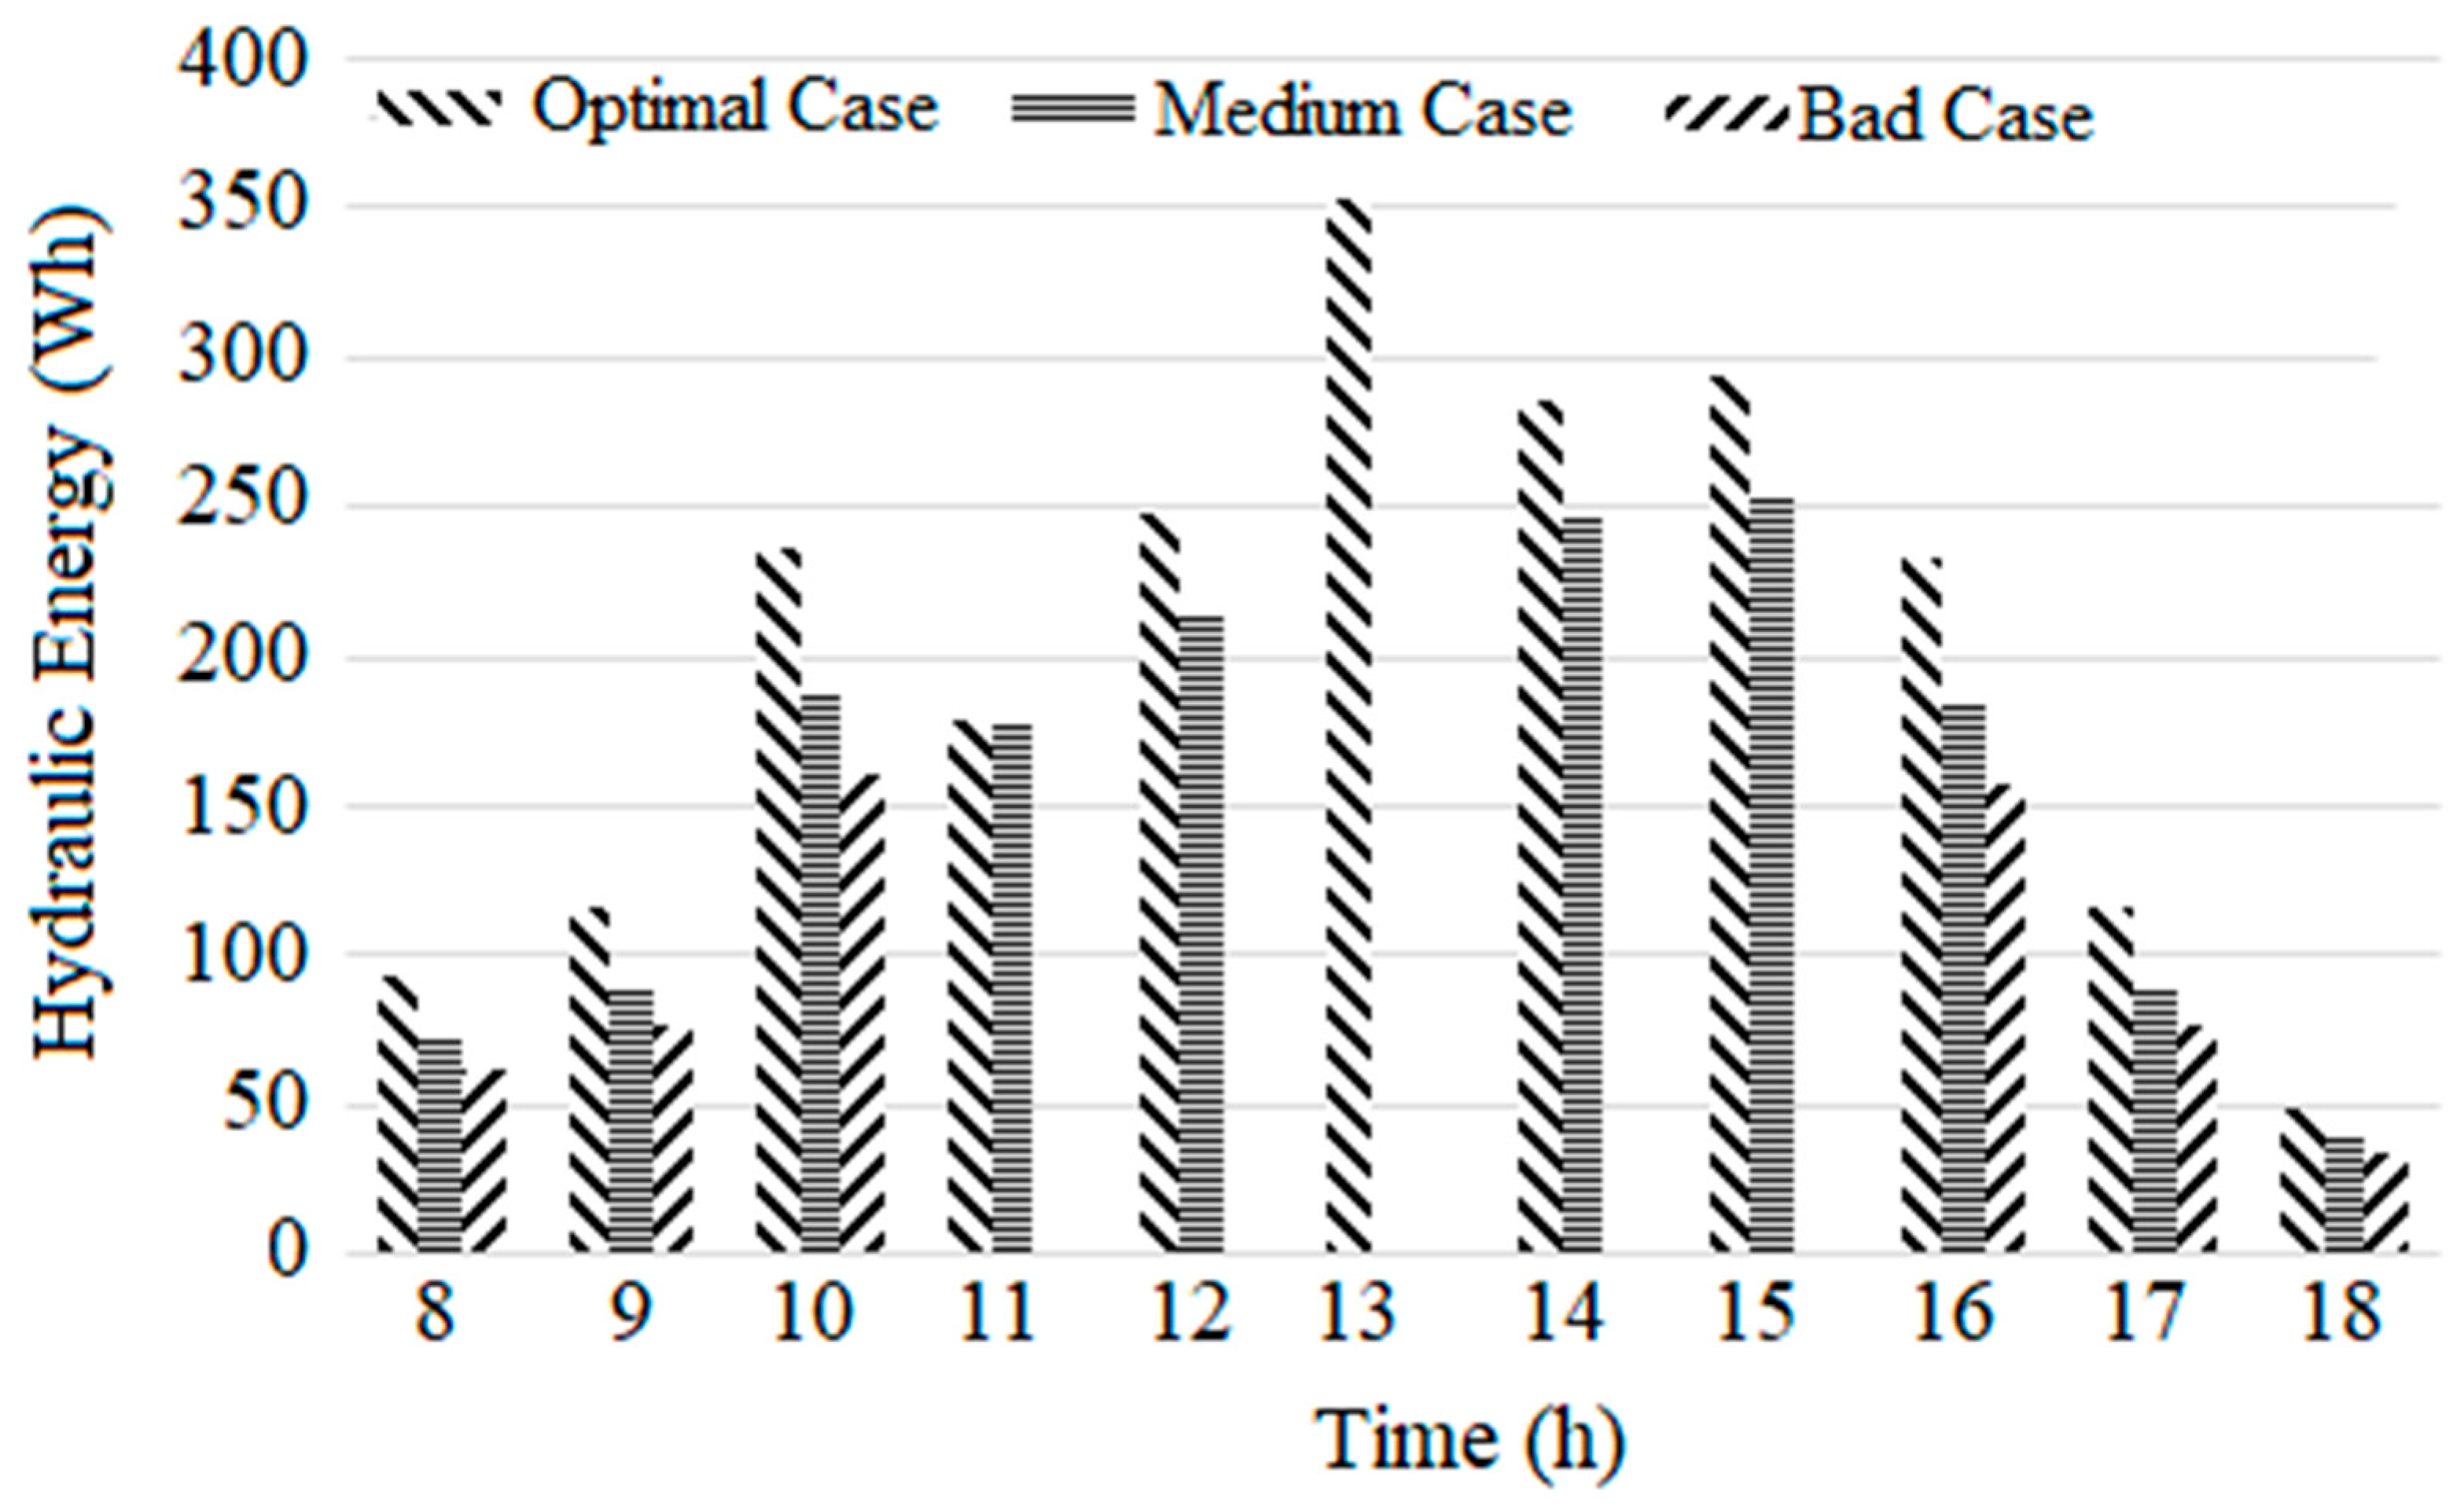
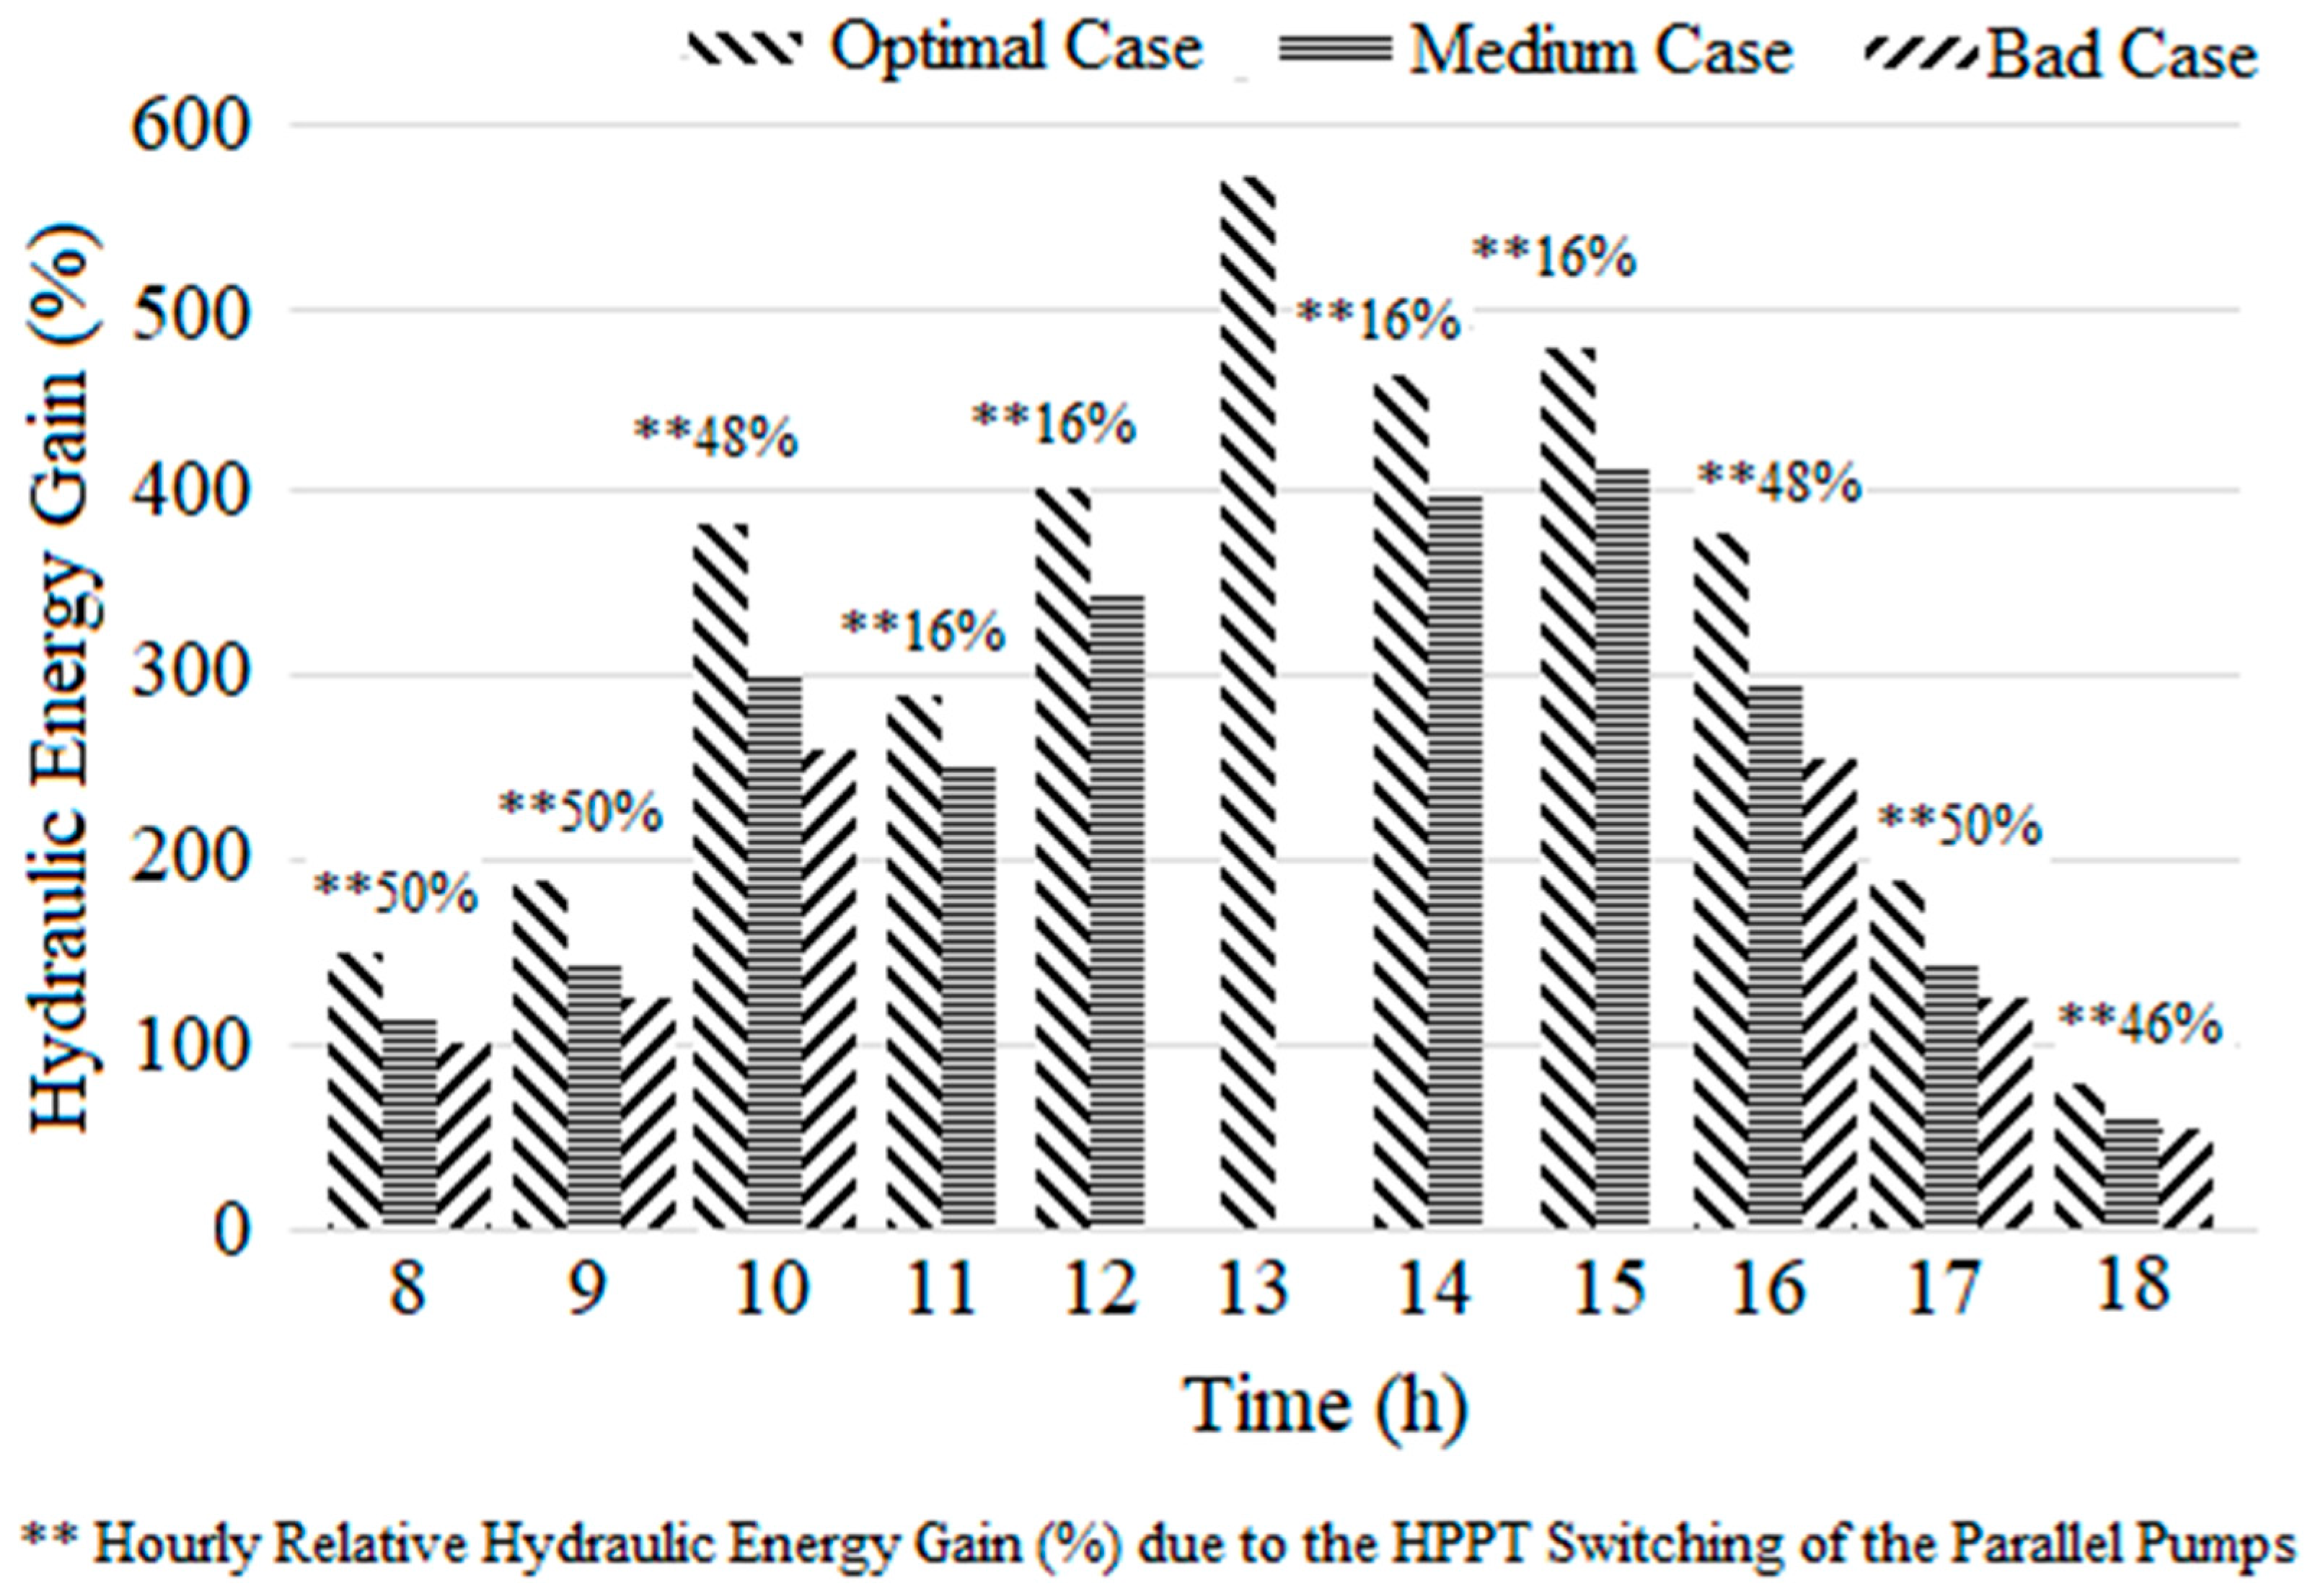
Figure 6 illustrates that for the optimal case of operating one pump (30W) gives an important efficieny (15%) to valorize the low power relative to low irradiance period. However, the system's efficiency was low (10%) using three equivalent pumps. By replacing the operating of three pumps (90W) with a single pump (30W), the average produced hydraulic energy was reached 92 Wh/month instead of 62 Wh/month (Optimal case vs Bad case,
Figure 7). Consequently, a maximum of an hourly relative hydraulic energy gain of 50% was shown during the low irradiance period of the day (
Figure 8). During high irradiance period, the PVWPS performed using two pumps (60W) to show an increase of hydraulic energy reaching a maximum of 248 Wh/month instead of 214 Wh/month for the bad case (
Figure 7). The efficiency of 16% was achieved at 01:00 pm when irradiance was at its maximum (777 W/m
2) (
Figure 6). Otherwise, for the case of using three equivalent pumps (90W) and under high irradiance, the average hydraulic energy output reached approximately 353 Wh/month (572%) (
Figure 7 and
Figure 8).
4.2. Modeling of PVWP System Using Experimental Data
4.2.1. Behaviors of Optimal and bad Growth Performance
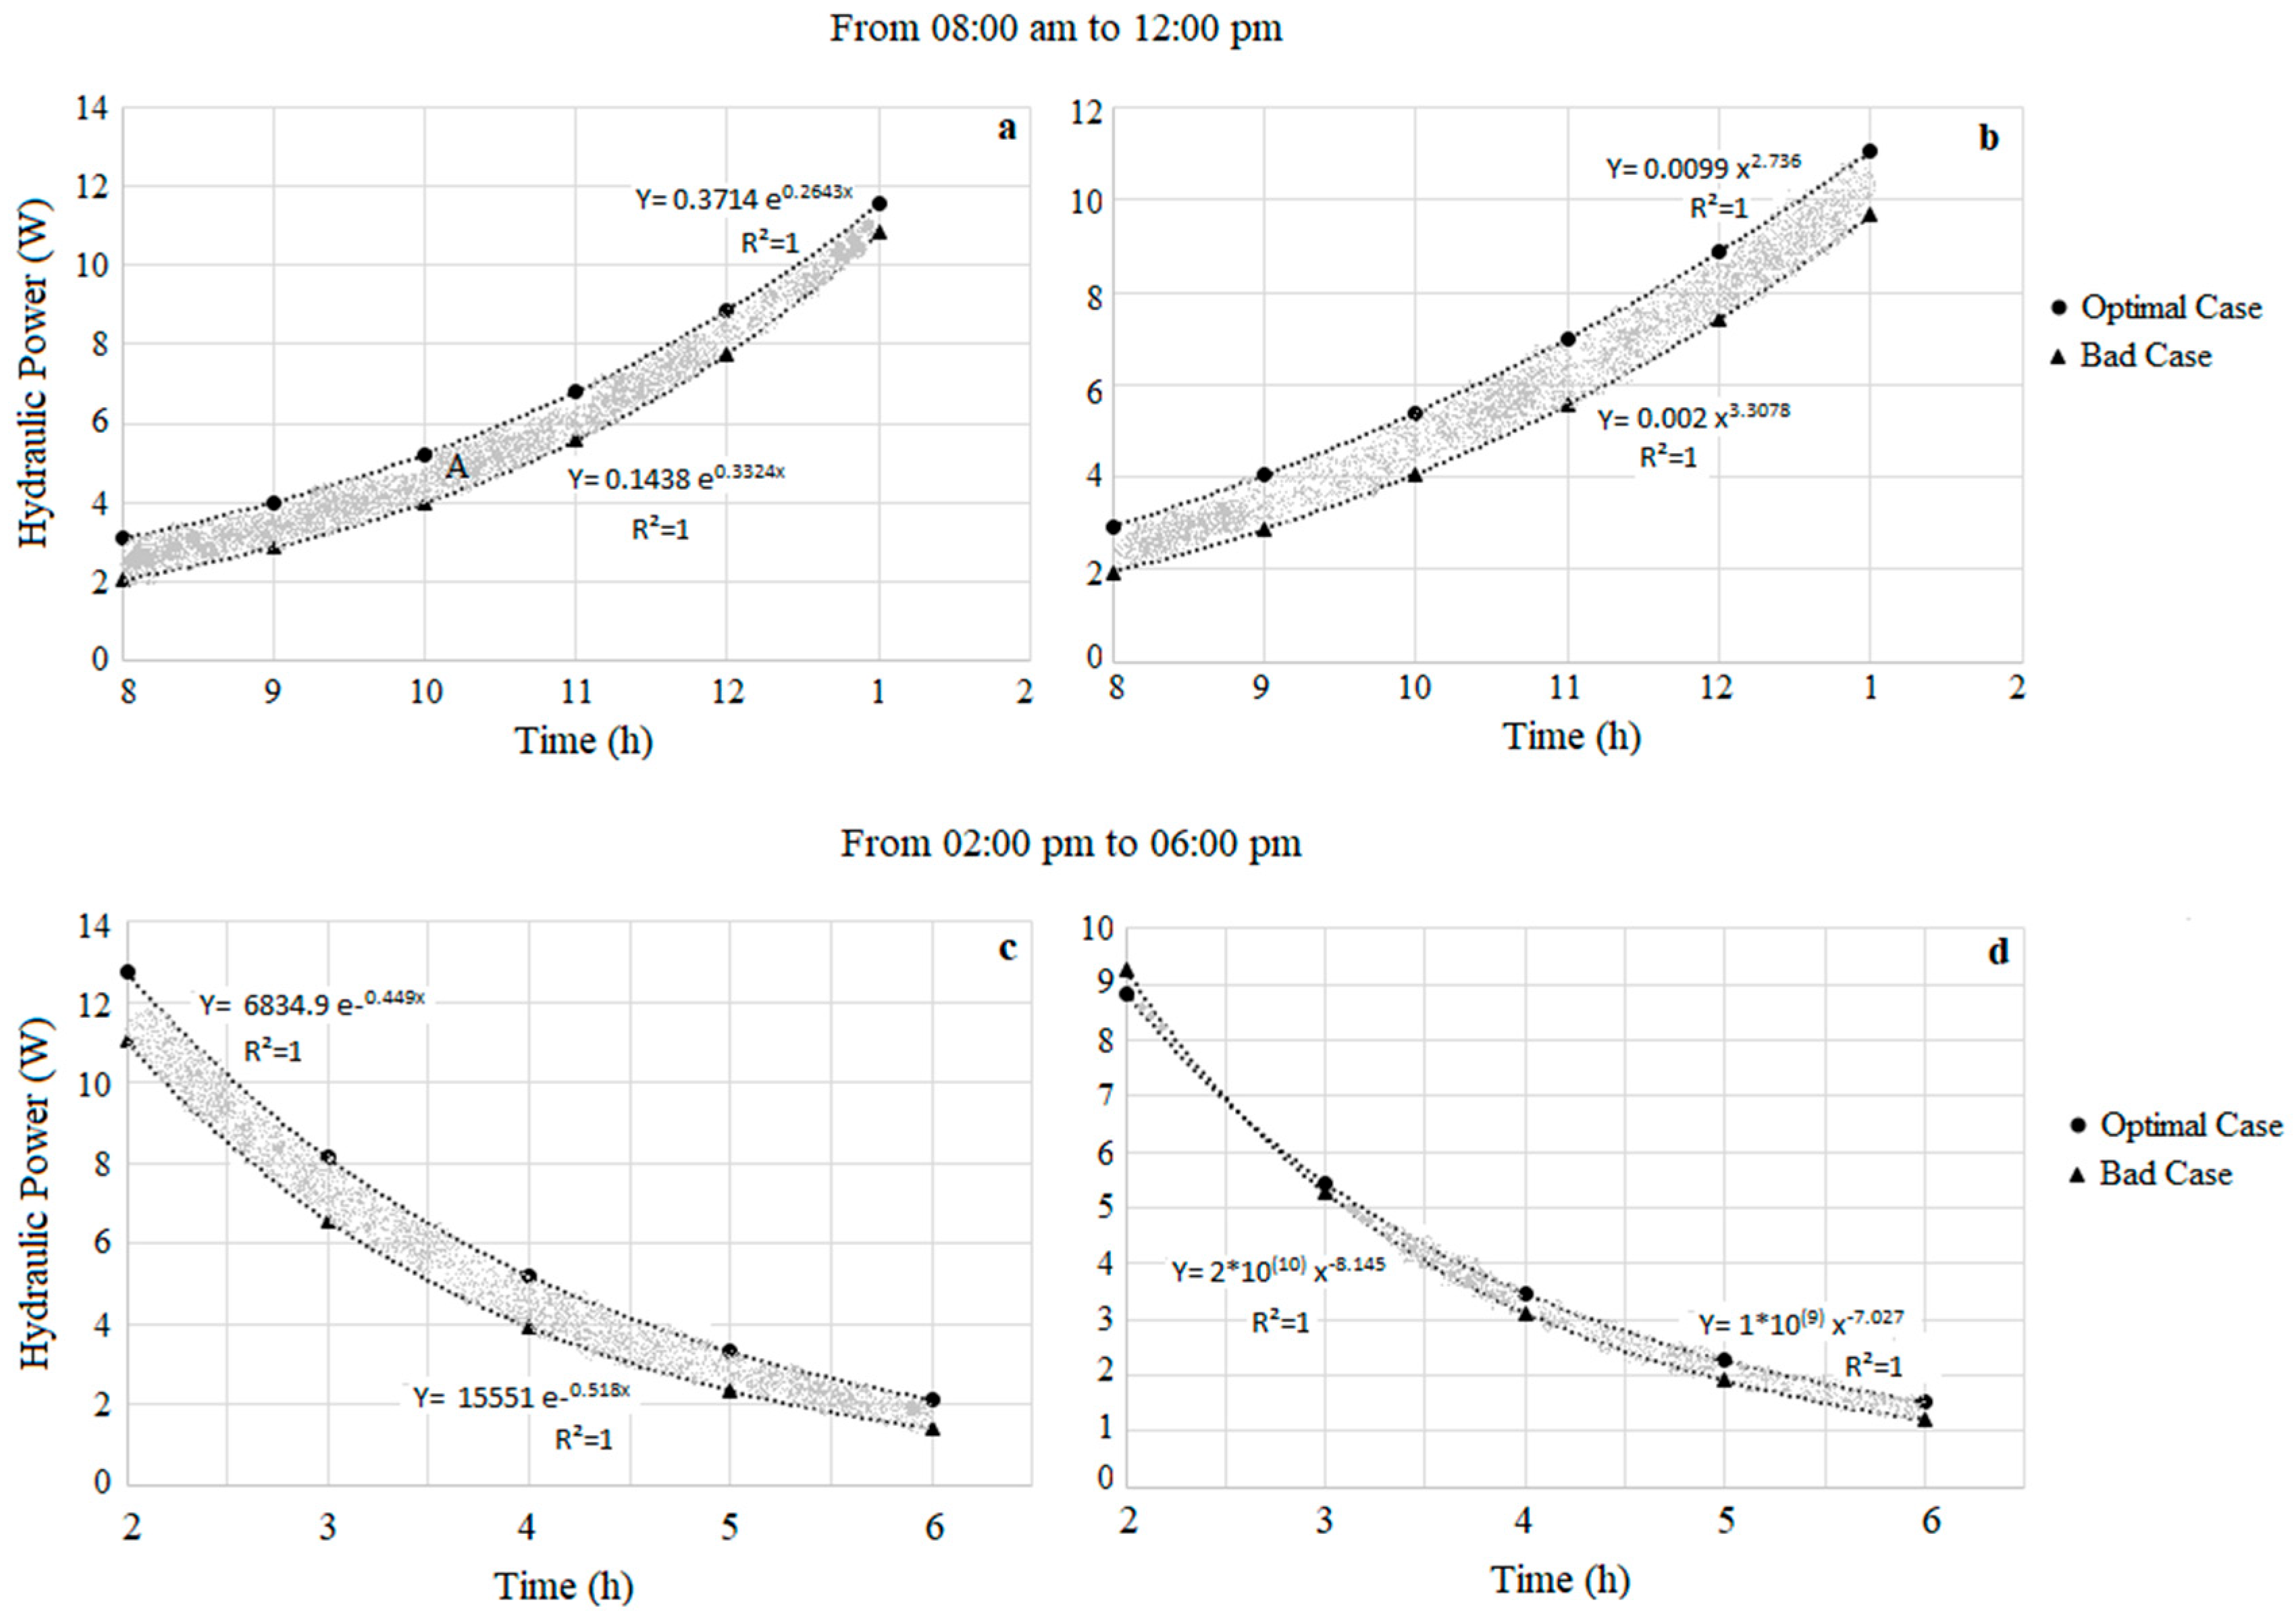
By modeling the performance of the PVWPS, we can choose the interesting performance growth taken from the optimal operating case for use as decisional tools to manage control of the HPPT concept. From the experimental results, the area under the curves of different hydraulic power outputs were evaluated to select the optimal one. The exponential and power models (
Table 1) for both the optimal and bad performance cases of operating PVWPS were presented in
Figure 9.
By referring to
Figure 9, the optimal and bad cases of presenting the performance gains were compared. The difference area under the curves is computed to indicate different surfaces of 6.45, 7.74, 6.24, and 2.05 relatives to a, b, c and d, respectively. The "Optimal case" outperforms the "Bad case" for both use of exponential and power curve fitting during both the morning and evening period of irradiance. Based on these preliminary findings, it will be of great importance to evaluate the fitting of both models behaviors to present the gain of the hydraulic performance due to testing of the HPPT concept.
4.2.2. Fitting test presenting optimal performance growth model
Behaviors of the optimal performance growths (
Figure 9) were
modeled using curve fitting with the exponential and the power growth models (
Table 3).
Table 3 represents the both models and their indicators of fitting to experimental data. In fact, during the morning period (from 08:00 am to 01:00 pm), the exponential model showed a better fitting to present correlations between irradiance, electrical power, and hydraulic power (R
2 of 0.86, 0.94, and 0.97, respectively). This fitting was relatively lower during the evening period (R
2 of 0.82, 0.9, and 0.84, respectively) but it keeps valid to adequately present the decreasing behavior with reference to the irradiance decrease.
After that, the exponential and power models (
Table 3) were tested to evaluate their fitting using RMSE and MAE indicators (
Table 4). By evaluating the importance of RMSE and MAE indicators (<10%), these results show that is possible to use the exponential and power models as a potential decision tool to predict hydraulic performance of PVWPS using HPPT concept to improve hydraulic output with reference to daily variable trends of irradiance inputs.
5. Conclusion
This paper present a testing of an HPPT concept based on operating multi-parallel pumps to yield performance of PVWPS. The concept consists on switching on/off a number of parallel pumps to adequately select an optimal hydraulic impedance of a connected irrigation network and boost the daily hydraulic energy output for a better water pumping performance.
The HPPT energy management method proposed showed that is possible to use a set of parallel pump powers rather than using a single large pump having an equivalent power. The HPPT approach based on switching multi-parallel pumps can be an effective solution to increase PVWPS performance. This approach has the potential to boost daily hydraulic energy gains up to 50% during periods of low irradiance.
Experimental Data were tested for the possibility of modeling the behavior of the energy growth due to implementation of the HPPT concept with reference to daily occurrence of varying irradiance and predicting scenarios of optimal performance outputs. The exponential and power models fitting showed the feasibility of predicting operating conditions for improving the PVWPS performances according to variable daily irradiance.
The curve fitting indicators (R2, RMSE and MAE) showed that is possible to predict PVWPS hydraulic performance using HPPT concept of switching multi-parallel pumps and monitoring irradiance data as input.
Abbreviations
| CV |
Coefficient of Variation (%) |
| dec |
Decade |
| EP |
Electrical Power (W) |
| EPR
|
Real Electrical Power (W) |
| EPP
|
Predicted Electrical Power (W) |
| G |
Irradiance (W/m2) |
| HP |
Hydraulic Power (W) |
| HPR
|
Real Hydraulic Power (W) |
| HPP
|
Predicted Hydraulic Power (W) |
| HPPT |
Hydraulic Power Point Tracking |
| MAE |
Mean Absolute Error |
| MPPT |
Maximum Power Point Tracking |
| PV |
Photovoltaic |
| PVWPS |
Photovoltaic Water Pumping System |
| R&D |
Research and Development |
| RMSE |
Root Mean Square Error |
| t |
Time (h) |
References
- Vafaeipour, M., Hashemkhani, Z.S., Morshed, V.M.H, Derakhti, A. and Keshavarz, E. M. (2014). Assessment of regions priority for implementation of solar projects in Iran: new application of a hybrid multi-criteria decision-making approach. Energy Conversion and Management.86,653–663.
- Ellen MacArthur Foundation. Towards a circular economy: business rationale for an accelerated transition [Internet]. Ellen MacArthur Foundation; 2015. p. 20. Available from: https://www.ellenmacarthurfoundation.org/assets/downloads/ publications/TCE_Ellen-MacArthur-Foundation_26-Nov-2015.pdf.
- IRENA, Renewable Energy Prospects for the Russian Federation, IRENA, Abu Dhabi, 2017https://www.irena.org/-/media/Files/IRENA/Agency/Publication/2017/ Apr/IRENA_REmap_Russia_paper_2017.pdf.
- Yang M, Chen L, Wang J, Msigwa G, Osman AI, Fawzy S, Rooney DW, Yap P-S (2022) Circular economy strategies for combating climate change and other environmental issues. Environ Chem Lett. [CrossRef]
- African Development Bank. Revisiting power sector reforms in Africa. Abidjan: Africa Development Bank and Association of Power Utilities of Africa; 2019.
- Luis Narvarte, Eduardo Lorenzo, Mohamed Aandam. Lessons from a PV pumping programme in south Morocco. Prog Photovolt: Res Appl 2005;13 (3):261–70. [CrossRef]
- Moumen, M. (2014). Guide D’Irrigation Localize De L’Agriculteur. Maroc: FAO, Office Régional de la Mise en Valeur Agricole Doukkala.
- Sarah Abdourraziq. Photovoltaic Water Pumping System Application in Morocco. 2017 International Conference on Electromechanical and Power Systems (SIELMEN). 11-13 October 2017. Iasi, Romania.
- Abdelali Mana. opportunities to Integration of renewable energies in Moroccan agriculture. Engineering Sciences [physics]. USMBA- FST, 2021. English. ffNNT : ff. fftel-04025164f.
- Tiwari, A., Sodha, M. S., Chandra, A., Joshi, J. C. 2006. Performance evaluation of photovoltaic thermal solar air collector for composite climate of India, Sol. Energy Mater. Sol. Cells, 90(2), 175–189, 2006. [CrossRef]
- Jordehi, A. R. 2016. Parameter estimation of solar photovoltaic (PV) cells: A review, Renew. Sustain. Energy Rev., 61, 354–371. [CrossRef]
- Hasanuzzaman, M., Malek, A. B. M. A., Islam, M. M., Pandey, A. K., Rahim, N. A. 2016. Global advancement of cooling technologies for PV systems: A review, Sol. Energy, 137, 25–45. [CrossRef]
- Bahaidarah, H. M. S., Baloch, A. A. B., Gandhidasan, P. 2016. Uniform cooling of photovoltaic panels: A review, Renew. Sustain. Energy Rev., 57, 1520–1544. [CrossRef]
- Zubeer, S. A., Mohammed, H. A., Ilkan, M. 2017. A review of photovoltaic cells cooling techniques, E3S Web Conf., 22, 00205. [CrossRef]
- Sathe, T. M., Dhoble, A. S. 2017. A review on recent advancements in photovoltaic thermal techniques, Renew. Sustain. Energy Rev., 76, 645– 672. [CrossRef]
- Chandel, S. S., Agarwal, T. 2017. Review of cooling techniques using phase change materials for enhancing efficiency of photovoltaic power systems, Renew. Sustain. Energy Rev., 73, 1342–1351. [CrossRef]
- Duffie JA, Beckman WA. Solar engineering of thermal processes. Wiley; 2006.
- Ghoneim AA. Design optimization of photovoltaic powered water pumping systems. Energy Convers Manag 2006;47(11):1449–63. [CrossRef]
- Wenham SR, Green MA, Watt ME, Corkish R. Applied photovoltaics. UK: Earthscan Publishers; 2007.
- Campana PE, Li H, Zhang J, et al. Economic optimization of photovoltaic water pumping systems for irrigation. Energy Convers Manag 2015;95:32–41. [CrossRef]
- Kitano, T., Matsui, M., and Xu, D.H. (2001). Power sensor-less MPPT control scheme utilizing power balance at DC link-system design to ensure stability and response. Proc. 27th Annual Conf. of the IEEE Industrial Electronics Society. pp. 1309–1314. Denver, CO, USA, USA. [CrossRef]
- Benlarbi, K., Mokrani, L., and Nait-Said, M.S. (2004). A fuzzy global efficiency optimization of a photovoltaic water pumping system, Solar Energy, 77(2), 203–216. [CrossRef]
- Femia, N., Petrone, G., Spagnuolo, G., and Vitelli, M. (2005). Optimization of perturb and observe maximum power point tracking method. IEEE Transactions on Power Electronics, 20(4), 963–973. [CrossRef]
- Akihiro, Oi.T., Anwari, M., and Taufik, M. (2009). Modeling and simulation of photovoltaic water pumping system. Proc. 3rd Asia Int. Conf. Modelling & Simulation. pp. 497-502. Bali, Indonesia. [CrossRef]
- Sefriti, B., and Boumhidi, I. (2015). Neural network incremental conductance MPPT algorithm for photovoltaic water pumping system. Proc. 10th Int. Conf. on Intelligent Systems: Theories and Applications (SITA). pp. 1-6. Rabat, Morocco.
- Zahab, E.A., Zaki, A.M., and El-sotouhy. M.M. (2017). Design and control of a standalone PV water pumping system. Journal of Electrical Systems and Information Technology (JESIT), 4 (2), 322-337. [CrossRef]
- Sellami, A., Kandoussi, K., El Otmani, R. et al. A Novel Auto-Scaling MPPT Algorithm based on Perturb and Observe Method for Photovoltaic Modules under Partial Shading Conditions. Appl. Sol. Energy 54, 149–158 (2018). [CrossRef]
- Altimania, M.R.; Elsonbaty, N.A.; Enany, M.A.; Gamil, M.M.; Alzahrani, S.; Alraddadi, M.H.; Alsulami, R.; Alhartomi, M.; Alghuson, M.; Alatawi, F.; et al. Optimal Performance of Photovoltaic-Powered Water Pumping System. Mathematics 2023, 11, 731. [Google Scholar] [CrossRef]
- Ankit Gupta, Yogesh K. Chauhan, Rupendra Kumar Pachauri. Review : A comparative investigation of maximum power point tracking methods for solar PV system. Solar Energy 136 (2016), pp : 236-253.
- Yahya, H.N., Sambo, A.S. (1995). Design and installation of solar photovoltaic powered water pumping system at Usmanu Danfodiyo University, Sokoto. Renewable Energy, 6(3), 311– 312. [CrossRef]
- Vick, B.D., and Clark, R.N. (2005). Water pumping performance of a solar-PV helical pump. Proc. ISES 2005 solar world congress: solar energy – bringing water to the world. pp. 6– 12. Orlando, Florida.
- Hamidat, A., Benyoucef, B., and Boukadoum, M.T. (2007). New approach to determine the performances of the photovoltaic pumping system. Revue des Energies Renouvelables ICRESD-07 Tlemcen, 101 – 107.
- Hamidat, A., and Benyoucef, B. (2008). Mathematic models of photovoltaic motor-pump systems. Renewable Energy, 33, 933–942. [CrossRef]
- Nabil, M., Allam, S.M., and Rashad, E.M. (2013). Performance improvement of a photovoltaic pumping system using asynchronous reluctance motor. Electric Power Components and Systems, 41(4), 447–464. [CrossRef]
- Cueto J. Energy production and performance of polycrystalline silicon technology photovoltaic modules in the field. NCPV Program Review Meeting, NREL, Colorado, USA; 2001.
- Mokeddem A, Midoun A, Kadri D, Hiadsi S, Raja IA. Performance of a directlycoupled PV water pumping system. Energy Convers Manag 2011;52:3089–95. [CrossRef]
- Belgacem BG. Performance of submersible PV water pumping systems in Tunisia. Energy Sustain Dev 2012;16:415–20. [CrossRef]
- Benghanem M, Daffallah KO, Alamri SN, Joraid AA. Effect of pumping head on solar water pumping system. Energy Convers Manag 2014;77:334–9. [CrossRef]
- Harkani, A., El Aissaoui, A., Fihri Fassi, H., El Kacimi, O. (2019). Performance Study of a Standalone Direct Pumping Photovoltaic System Used for Drip Irrigation, CIGR journal. 21 (3): 114-122.
- Koor, M., Vassiljev, A., Koppel, T. (2015). Optimization of pump efficiencies with different pumps characteristics working in parallel mode. Advances in Engineering Software. 101: 69-76. [CrossRef]
- Harkani A., Oudadda M, Elaissaoui A., Fihri Fassi H. (2019). Performance Management of Photovoltaic Parallel Pumps for Optimal Hydraulic Power Point Tracking, International Journal of Renewable Energy Research, Vol.9, No.3, 1398- 1405.
- Zhounian, L., Qian, L., An, Z., Wenjie, Z., Hailiang, X., AND Dazhuan, W. (2020). Improving Reliability of Pumps in Parallel Pump Systems Using Particle Swam Optimization Approach. IEEE Access. 8: 58427- 58434. [CrossRef]
- Boas L. M. (2005). Mathematical Methods in the Physical Sciences. Wiley.
- Sornette D.(2006). Critical Phenomena in Natural Sciences: Chaos, Fractals, Selforganization and Disorder: Concepts and Tools. Springer.
Figure 1.
Experimental design of DC PVWPS mounted in laboratory to evaluate concept of HPPT using multi-parallel pump switching with reference to variation of daily irradiance.
Figure 1.
Experimental design of DC PVWPS mounted in laboratory to evaluate concept of HPPT using multi-parallel pump switching with reference to variation of daily irradiance.
Figure 2.
Test bench (a) and pressure vs voltage calibration curve (b).
Figure 2.
Test bench (a) and pressure vs voltage calibration curve (b).
Figure 3.
Irradiance data trends (Averages data from 2017 to 2012) of Settat City (X –7.624233 and Y: 32.953487), Morocco.
Figure 3.
Irradiance data trends (Averages data from 2017 to 2012) of Settat City (X –7.624233 and Y: 32.953487), Morocco.
Figure 4.
Irradiance data trends (Averages and CVs) for decades and months (From February to July 2019) of Settat City (X –7.624233 and Y: 32.953487), Morocco.
Figure 4.
Irradiance data trends (Averages and CVs) for decades and months (From February to July 2019) of Settat City (X –7.624233 and Y: 32.953487), Morocco.
Figure 5.
Daily irradiance data used for testing the HPPT concept (Irradiance of 20th March, 2019, City of Settat, Morocco (X: –7.624233 and Y: 32.953487)).
Figure 5.
Daily irradiance data used for testing the HPPT concept (Irradiance of 20th March, 2019, City of Settat, Morocco (X: –7.624233 and Y: 32.953487)).
Figure 6.
Evaluation of the hydraulic performance of the PVWPS using distinction between three scenarios of optimal, medium and low performance.
Figure 6.
Evaluation of the hydraulic performance of the PVWPS using distinction between three scenarios of optimal, medium and low performance.
Figure 7.
Average hydraulic energy outputs (Wh/month) relatives to the three scenarios of optimal, medium and low performance.
Figure 7.
Average hydraulic energy outputs (Wh/month) relatives to the three scenarios of optimal, medium and low performance.
Figure 8.
Hourly Relative Hydraulic Energy Gains (%) due to the HPPT switching of the pumps (referenced to initial hourly energy output of 08 am).
Figure 8.
Hourly Relative Hydraulic Energy Gains (%) due to the HPPT switching of the pumps (referenced to initial hourly energy output of 08 am).
Figure 9.
Exponential model (a: morning, c: evening) vs Power model (b: morning, d: evening) presenting performance gains due to implementation of HPPT to boost PVWPS hydraulic energy output.
Figure 9.
Exponential model (a: morning, c: evening) vs Power model (b: morning, d: evening) presenting performance gains due to implementation of HPPT to boost PVWPS hydraulic energy output.
Table 1.
Presentation of exponential and power equations used for modeling performance growth of the PVWPS.
Table 1.
Presentation of exponential and power equations used for modeling performance growth of the PVWPS.
| Models |
Equation |
Parameters |
| Exponential |
y= a. exp (b*x)
|
y: the desired output at a given time,
a : the initial value of y (when x=0),
b : the base of the exponential, often called the growth factor,
x : the independent variable. |
| Power |
y= a. xb
|
y : the desired output at a given time,
a : the initial value of y (when x=0),
b : the base of the exponential, often called the growth factor,
x : the independent variable. |
Table 2.
Daily performance of PVWPS according to irradiance change and number of switched on pumps (Irradiance and experimental data of 20th March 2019, city of Settat, Morocco (X: –7.624233 and Y: 32.953487)).
Table 2.
Daily performance of PVWPS according to irradiance change and number of switched on pumps (Irradiance and experimental data of 20th March 2019, city of Settat, Morocco (X: –7.624233 and Y: 32.953487)).
| Time |
Average Irradiance (W/m2) |
Number of operating Pumps |
Mean Pressure (bar) (CV%) |
Mean Flowrate (L/min) (CV%) |
Mean Hydraulic Power
(CV%) |
Mean Hydraulic Yield%
(CV%) |
| 08.00 am |
196 |
1 |
01.55 (16) |
01.15 (08) |
02.98 (24) |
15 (19)*** |
| |
2 |
00.82 (20) |
01.68 (11) |
02.30 (28) |
11 (31)** |
| |
3 |
00.57 (19) |
02.10 (10) |
01.99 (27) |
10 (26)* |
| 09.00 am |
350 |
1 |
01.81 (17) |
01.24 (09) |
03.75 (24) |
16 (18)*** |
| |
2 |
00.96 (20) |
01.81 (10) |
02.89 (28) |
12 (23)** |
| |
3 |
00.66 (22) |
02.26 (12) |
02.49 (32) |
10 (32)* |
| 10.00 am |
530 |
1 |
02.90 (27) |
01.57 (14) |
07.62 (37) |
19 (28)*** |
| |
2 |
01.56 (37) |
02.31 (19) |
06.01 (56) |
15 (38)** |
| |
3 |
01.08 (32) |
02.88 (17) |
05.16 (45) |
13 (40)* |
| 11.00 am |
670,5 |
2 |
01.52 (37) |
02.28 (19) |
05.77 (55) |
14 (42)*** |
| |
3 |
01.05 (35) |
02.984 (20) |
04.96 (47) |
12 (38)** |
| 12.00 pm |
753,5 |
2 |
01.89 (24) |
02.54 (13) |
08.00 (32) |
16 (31)*** |
| |
3 |
01.30 (26) |
03.417 (15) |
06.89 (36) |
14 (38)** |
| 01.00 pm |
777 |
3 |
01.82 (31) |
03.75 (17) |
11.38 (41) |
16 (38)*** |
| 02.00 pm |
751 |
2 |
02.08 (33) |
02.62 (18) |
09.22 (46) |
16 (37)*** |
| |
3 |
01.44 (28) |
03.33 (16) |
07.396 (40) |
14 (38)** |
| 03.00 pm |
589 |
2 |
02.12 (32) |
02.69 (18) |
09.49 (45) |
17 (38)*** |
| |
3 |
01.46 (27) |
03.36 (15) |
08.20 (37) |
14 (36)** |
| 04.00 pm |
517 |
1 |
02.87 (29) |
01.57 (16) |
07.51 (40) |
19 (35)*** |
| |
2 |
01.54 (29) |
02.30 (16) |
05.92 (40) |
15 (37)** |
| |
3 |
01.06 (38) |
02.86 (22) |
05.08 (53) |
13 (39)* |
| 05.00 pm |
327,33 |
1 |
01.81 (53) |
001.24 (31) |
03.75 (73) |
16 (48)*** |
| |
2 |
00.96 (32) |
01.81 (19) |
02.90 (44) |
12 (38)** |
| |
3 |
00.66 (30) |
02.526 (19) |
02.50 (38) |
10 (38)* |
| 06.00 pm |
38 |
1 |
01.01 (28) |
00.93 (16) |
01.58 (38) |
12 (35)*** |
| |
2 |
00.54 (25) |
01.36 (13) |
01.23 (35) |
10 (47)** |
| |
3 |
00.38 (34) |
01.71 (19) |
01.08 (46) |
08 (55)* |
Table 3.
Curve fitting Indicators of the performance growth models: Irradiance vs Electrical Power vs Hydraulic Power.
Table 3.
Curve fitting Indicators of the performance growth models: Irradiance vs Electrical Power vs Hydraulic Power.
| From 08:00 am to 01:00 pm |
| |
Exponential Model |
R2 |
Power Model |
R2 |
Transfer Function |
| G (W/m2) Vs t (h) |
y= 62.07. exp (0.20*t)
|
0.86 |
y=2.87* t2.22
|
0.90 |
G= EP* 21.779* exp (-0,05*t)
|
| EP (W) Vs t (h) |
y= 2.85. exp (0.25*t)
|
0.94 |
y=0.07* t2.66
|
0.91 |
EP= HP*6.477 |
| HP (W) Vs t (h) |
y= 0.44. exp (0.25*t)
|
0.97 |
y=0.01* t2.70
|
0.93 |
|
| From 01:00 pm to 06:00 pm |
| |
Exponential Model |
R2 |
Power Model |
R2 |
Transfer Function |
| G (W/m2) Vs t (h) |
y= 22.50*103.exp (-0.25*t)
|
0.82 |
y=10.87*106.t-3.68
|
0.78 |
G= EP*11,43 |
| EP (W) Vs t (h) |
y= 19.68*102 .exp (-0.25*t)
|
0.9 |
y=99.79*104. t-3.69
|
0.88 |
EP= 6.88 .HP*exp (0.01 * t)
|
| HP (W) Vs t (h) |
y= 2.86*102 .exp (-0.24*t)
|
0.84 |
y=11.67*104* t-3.57
|
0.81 |
|
Table 4.
Evaluation of exponential and power models fitting using RMSE and MAE indicators based.
Table 4.
Evaluation of exponential and power models fitting using RMSE and MAE indicators based.
| Use of morning increasing trend irradiance (From 08:00 am to 01:00 pm) |
| Time |
G (W/m2) |
EPR (W) |
EPP (W) |
|
HPR (W) |
HPP (W) |
|
08:00
09:00
10:00
11:00
12:00
01:00 |
196
350
530
671
754
777 |
20.40
24.13
41.03
39.68
50.63
73.02 |
13.45
25.25
40.20
53.50
63.20
68.47 |
EP= G*0.046*e (0.05t)
R2 : 00.77
RMSE : 08.37
MAE : 06.64 |
02.98
03.75
05.77
07.62
08.00
11.38 |
02.08
03.90
06.20
08.26
09.75
10.57 |
HP= G*0.0071*e (0.05t)
R2 : 00.89
RMSE : 00.92
MAE : 00.78 |
08:00
09:00
10:00
11:00
12:00
01:00 |
196
350
530
671
754
777 |
20.40
24.13
41.03
39.68
50.63
73.02 |
11.94
22.46
35.62
47.02
54.90
58.61 |
EP= G*0.024*t (0.44)
R2 : 00.80
RMSE : 07.99
MAE : 06.93 |
02.98
03.75
05.77
07.62
08.00
11.38 |
01.86
03.52
05.60
07.42
08.70
09.31 |
HP= G*0.0035*t (0.48)
R2 : 00.87
RMSE : 01.01
MAE : 00.75 |
| Use of evening decreasing trend irradiance (From 01:00 pm to 06:00 pm) |
01:00
02:00
03:00
04:00
05:00
06:00 |
777
751
589
517
327
38 |
73.02
56.22
57.44
40.59
24.14
12.83 |
67.96
65.69
51.52
45.22
28.60
03.32 |
EP= G*0.875*10(-1)
R2 : 00.89
RMSE : 06.86
MAE : 06.51 |
11.38
09.49
09.22
07.51
03.75
01.58 |
10.70
10.44
08.27
07.34
04.69
00.55 |
HP= G*0.0127*e (0.01t)
R2 : 00.94
RMSE : 00.84
MAE : 00.79 |
01:00
02:00
03:00
04:00
05:00
06:00 |
777
751
589
517
327
38 |
73.02
56.22
57.44
40.59
24.14
12.83 |
69.86
67.45
52.84
46.34
29.28
03.40 |
EP= G*0.024*t (0.44)
R2 : 00.88
RMSE : 07.13
MAE : 06.55 |
11.38
09.49
09.22
07.51
03.75
01.58 |
10.49
10.27
08.15
07.23
04.61
00.54 |
HP= G*0.01074*t (0.11)
R2 : 00.94
RMSE : 00.86
MAE : 00.82 |
|
Disclaimer/Publisher’s Note: The statements, opinions and data contained in all publications are solely those of the individual author(s) and contributor(s) and not of MDPI and/or the editor(s). MDPI and/or the editor(s) disclaim responsibility for any injury to people or property resulting from any ideas, methods, instructions or products referred to in the content. |
© 2023 by the authors. Licensee MDPI, Basel, Switzerland. This article is an open access article distributed under the terms and conditions of the Creative Commons Attribution (CC BY) license (http://creativecommons.org/licenses/by/4.0/).
