1. Introduction
Because of the wide range of microbial corrosion, many metal materials may suffer from microbial corrosion [
1]. sulfate-reducing prokaryote (SRP) accounted for more than 50 percent of all cases of microbial influence on corrosion [
2]. The mechanisms of MIC induced by SRP are mainly divided into two categories [
3]. One is extracellular electron transfer (EET): bacteria enhance corrosion by obtaining electrons directly from the surface of the metal matrix [
4]. The corrosive media secreted by bacteria, such as inorganic and organic acids, can also cause microbial corrosion [
5]. For this reason, they are also known as metabolites-MIC (M-MIC) [
6]. Since there may be many corrosion mechanisms involved in the process of microbial corrosion of metals, it is still difficult to determine the main factors in the corrosion of SRP [
7,
8]. Therefore, the influence of different metabolites on the metal corrosion process must be explored and clarified.
As a sacrificial anode material, magnesium alloy is easy to corrode due to its high chemical activity [
9], so its large-scale application is limited. Magnesium alloy anode has been widely used in cathodic protection of buried pipelines [
10]. With the continuous development of offshore oil and gas facilities, the corrosion of carbon steel in pipelines has been paid more and more attention, but the magnesium alloy anode which provides protection has been neglected. The research on magnesium anode corrosion is also worthy of attention [
11]. In actual production operations, engineers often find that the current efficiency of magnesium anodes is too low. These anodes often do not achieve the expected protection effect [
12]. Considering the low efficiency of commercial magnesium alloy sacrificial anode [
13], combined with the high detection rate of SRP in the actual engineering environment [
14], we assume that the failure of magnesium alloy dissolution corrosion process is influenced by SRP.
At present, although there are many reports on the surface corrosion of magnesium alloys [
15,
16], only a few works focused on the effect of SRP metabolites on magnesium alloys [
17]. Most studies have focused on the effects of SRP growth and sulfide production on the corrosion of carbon steel or copper [
18,
19]. Researchers have even reached opposite conclusions in exploring the corrosion effects of different metabolites on carbon steel. For example, how can extracellular polymeric substances (EPS) protect Q235 steel from corrosion during the initial phase of the experiment, but its inherent inorganic metabolite sulfide accelerates corrosion [
20]. Moreover, it is difficult to find the influence of EPS organic compounds on magnesium alloy corrosion. Therefore, it is difficult to determine the effect of different organic metabolites of SRP on the anode corrosion of magnesium alloy, and it is necessary to determine the contribution of different organic metabolites to the corrosion process.
In this study, the effects of three organic metabolites including mannose, glucose, and glucuronic acid of SRP strain on the anode corrosion behavior of AZ31B magnesium alloy in seawater were determined by electrochemical tests and surface morphology characterization. The effect of SRP organic metabolites on the corrosion properties of magnesium alloys was discussed.
2. Materials and Methods
2.1. Experimental Reagent
The test material was a commercial AZ31B magnesium alloy sacrificial anode of 10 mm ×10 mm ×10 mm. The chemical composition of the alloy is shown in
Table 1. Copper screws (Φ3 mm) were inserted into one end of the magnesium alloy. After welding the screws with copper wire, the working face was exposed, and the rest was sealed with epoxy resin. According to national standard GB 5776-86, sandpaper step by step to 2000#. After ultrasonic cleaning, the sample was rinsed with ultra-pure water, and wiped the working surface using anhydrous ethanol.
In the blank control group, the filtrated seawater was used as the experimental solution. According to the usual metabolic profiles of SRP [
21], the relevant solutions were configured using analytically pure mannose, glucuronic acid, glucose, and filtered seawater. Three kinds of seawater solutions with concentrations of organic matter of 1 ppm, 5 ppm, and 10 ppm were configured respectively.
2.2. Weightlessness Experiment
AZ31B magnesium alloy anode with the size of 20 mm×50 mm×4 mm was used for the weightlessness experiment. After the samples were weighed three times with a high-precision balance, they were suspended and immersed in seawater solutions of different concentrations of different metabolites with different concentrations with fishing lines. Three parallel samples were set for each component, and the weightlessness experiment lasted for 12 days. After the experiment, the test pieces were immersed in the dedusting solution containing CrO
2 150 g/L and Ag
2CrO
4 10 g/L for 5 min, and the corrosion products on the surface of the samples were washed off. The samples were weighed according to the national standard (GB/T39637-2020). The corrosion rate was calculated as follows:
v is the average corrosion rate of the sample (mm/a), w
0-w
1 is the weight of the corrosion product after removal (g), A is the sample area (m
2), T is the test period (h), ρ is the density of the magnesium anode (1.78 g/cm
3).
2.3. Surface Characterization of Samples
AZ31B magnesium alloy test pieces of 10 mm×10 mm×1 mm were immersed in seawater solution containing different metabolites with different concentrations. Three pieces in each group after a 12-day immersion experiment were used for the surface characterization test. After the soaking experiment, the AZ31B magnesium alloy anode test pieces were taken out and dried in a vacuum drying oven. Scanning electron microscope (SEM) was used to observe the morphology of corrosion products on the surface of test pieces. X-ray diffractometer (XRD) (D/MAX-2500/PC, Tokyo, Japan) determines the composition of the compounds in the corrosion products. The XRD patterns were collected from 5° to 80° at a rate of 10°min−1.
2.4. Corrosion Electrochemical Experiment
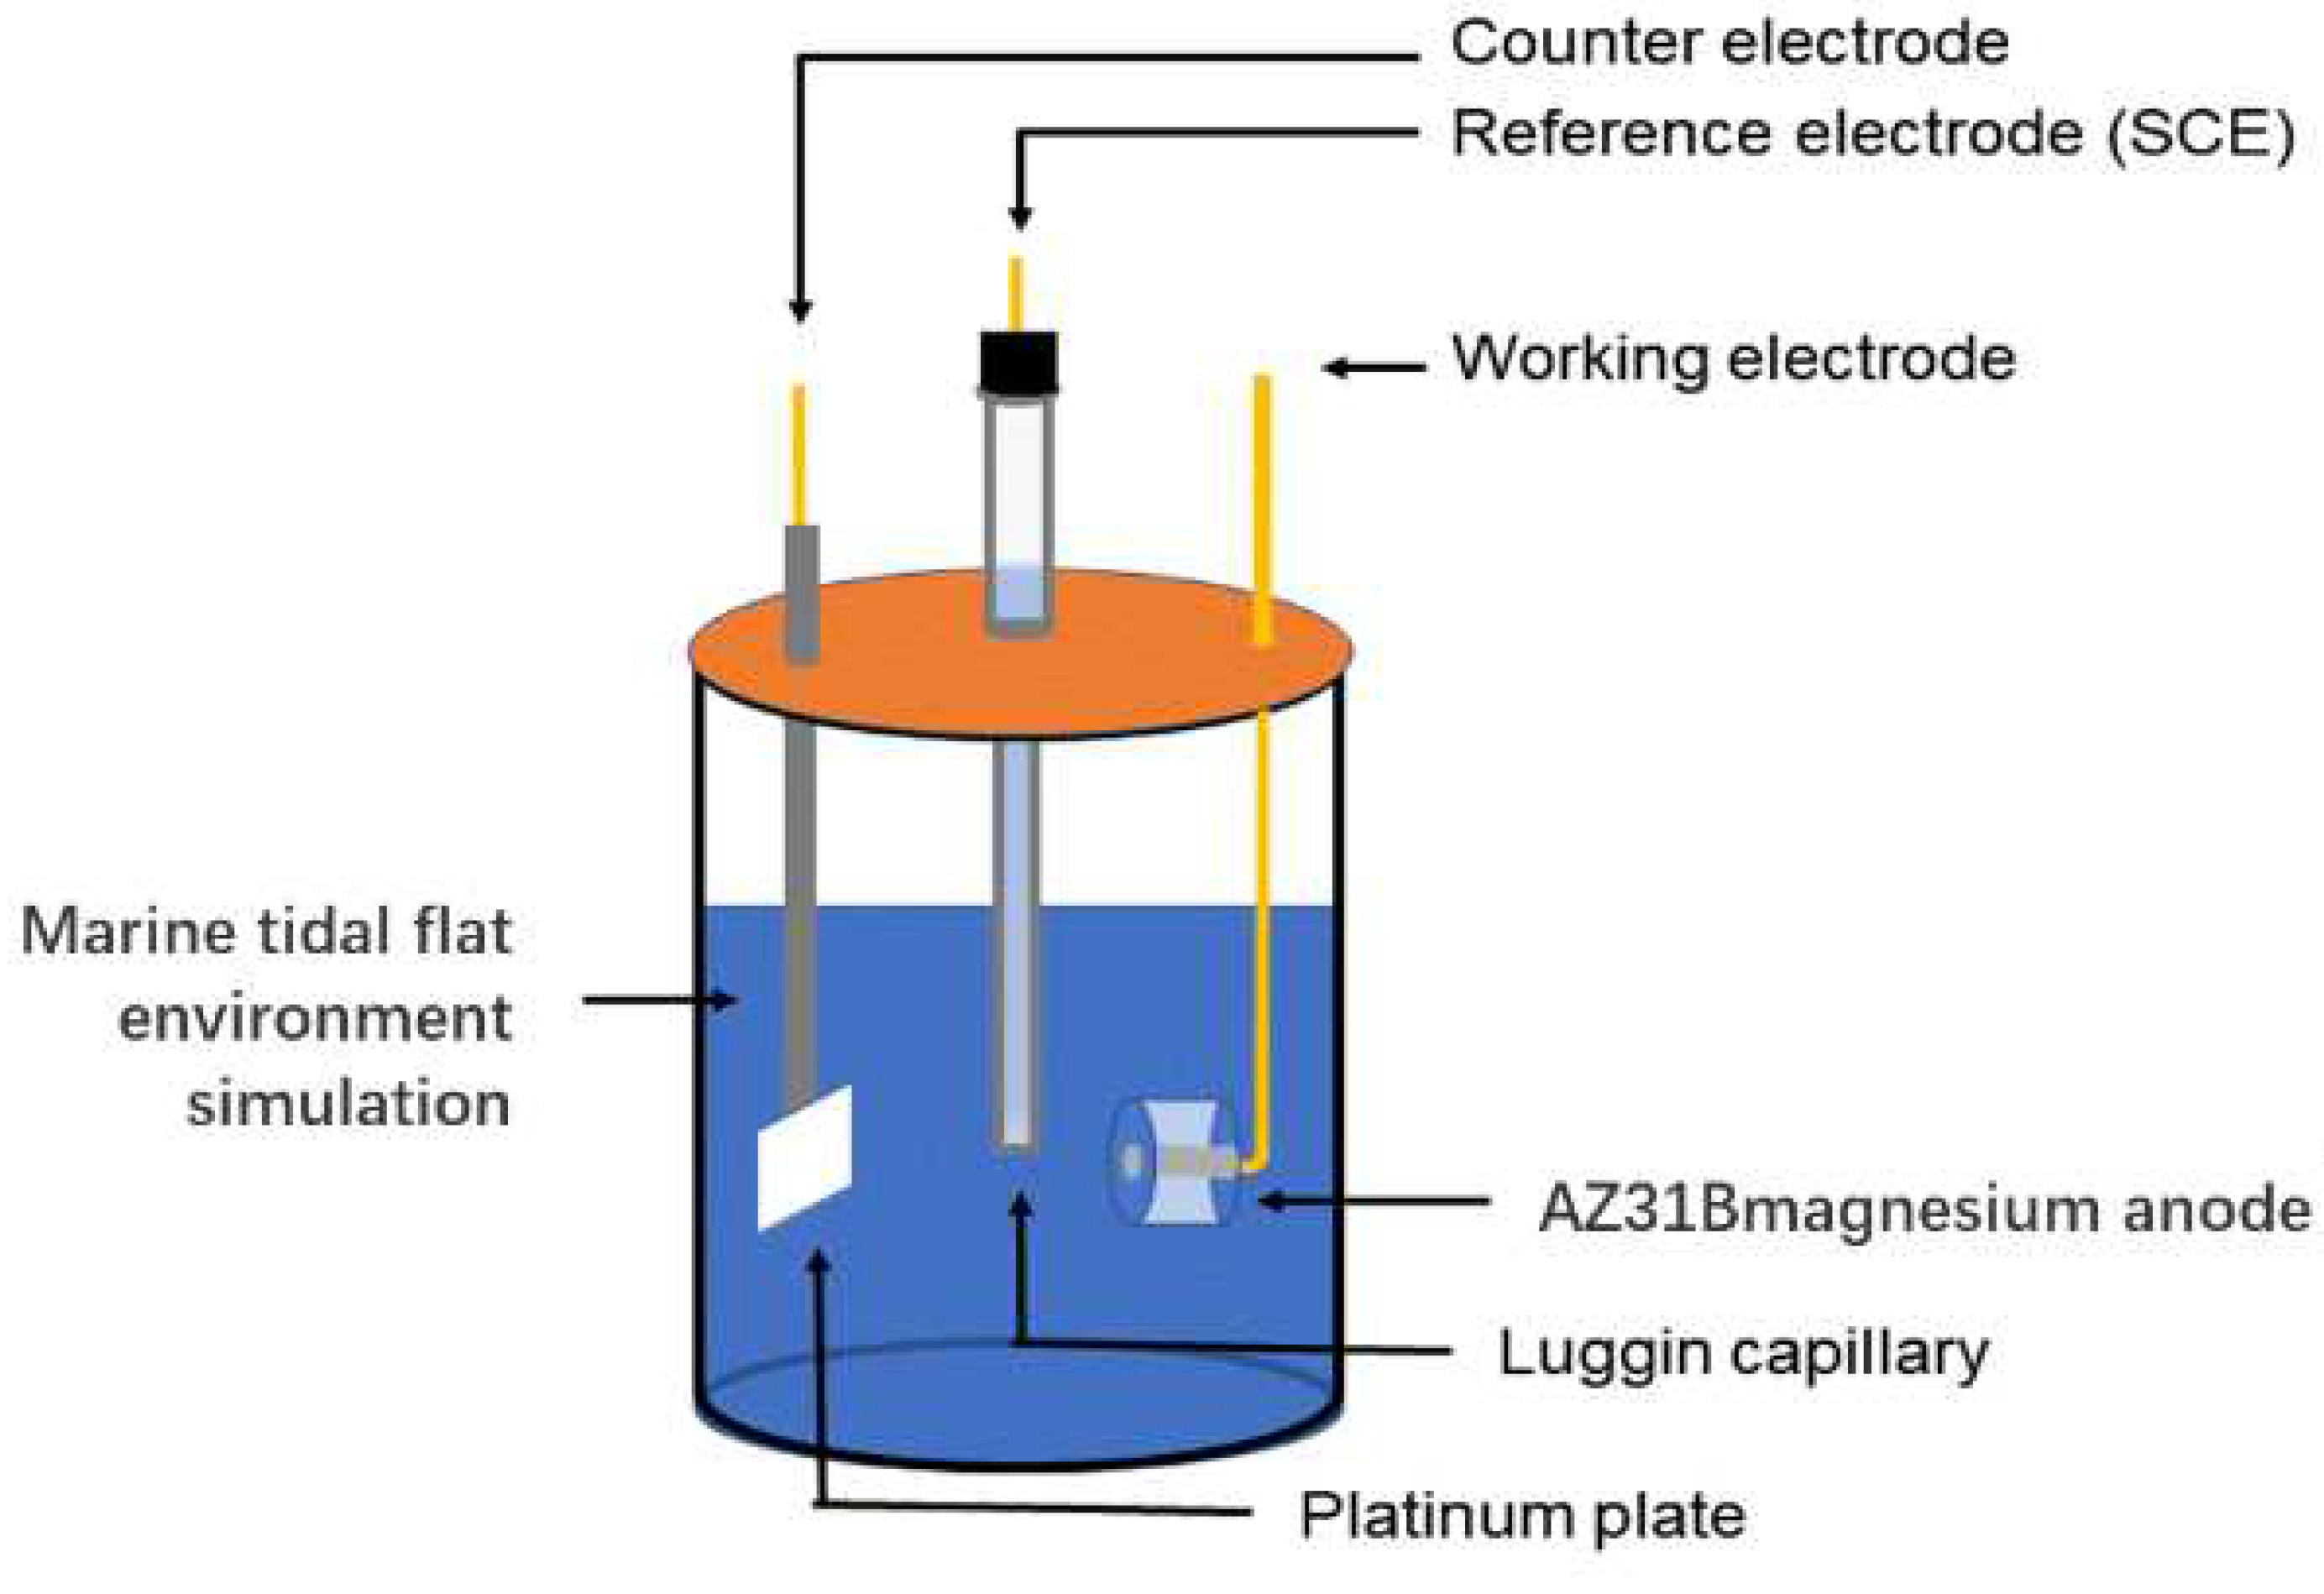
Electrochemical measurement of AZ31B magnesium anode was taken using an electrochemical workstation CHI760E. The working electrode (WE) of AZ31B magnesium anode was embedded in epoxy resin. The exposed surface was 10 mm×10 mm. Saturated calomel electrode (SCE) and platinum electrode were used as reference electrode (RE) and counter electrode (CE). Linear polarization resistance (LPR) scans from -1 mV to 1 mV compared to the stable open-circuit potential. The Tafel polarization curve was performed at a scanning rate of 0.167 Mv/s. Electrochemical impedance spectroscopy (EIS) was performed at an open-circuit potential (OCP), a sinusoidal AC voltage signal with a frequency range of 10
−2 to 10
5 Hz and an amplitude of 10 mV [
22]. Curve fitting of the data was performed using ZsimpWin version 3.60. All measurements were made at 25 ± 2 °C and three parallel samples were set up.
Figure 1.
Schematic diagram of the electrochemical experimental tests.
Figure 1.
Schematic diagram of the electrochemical experimental tests.
3. Results and Discussion
3.1. Influence of Mannose on Corrosion Process of AZ31B Magnesium Alloy
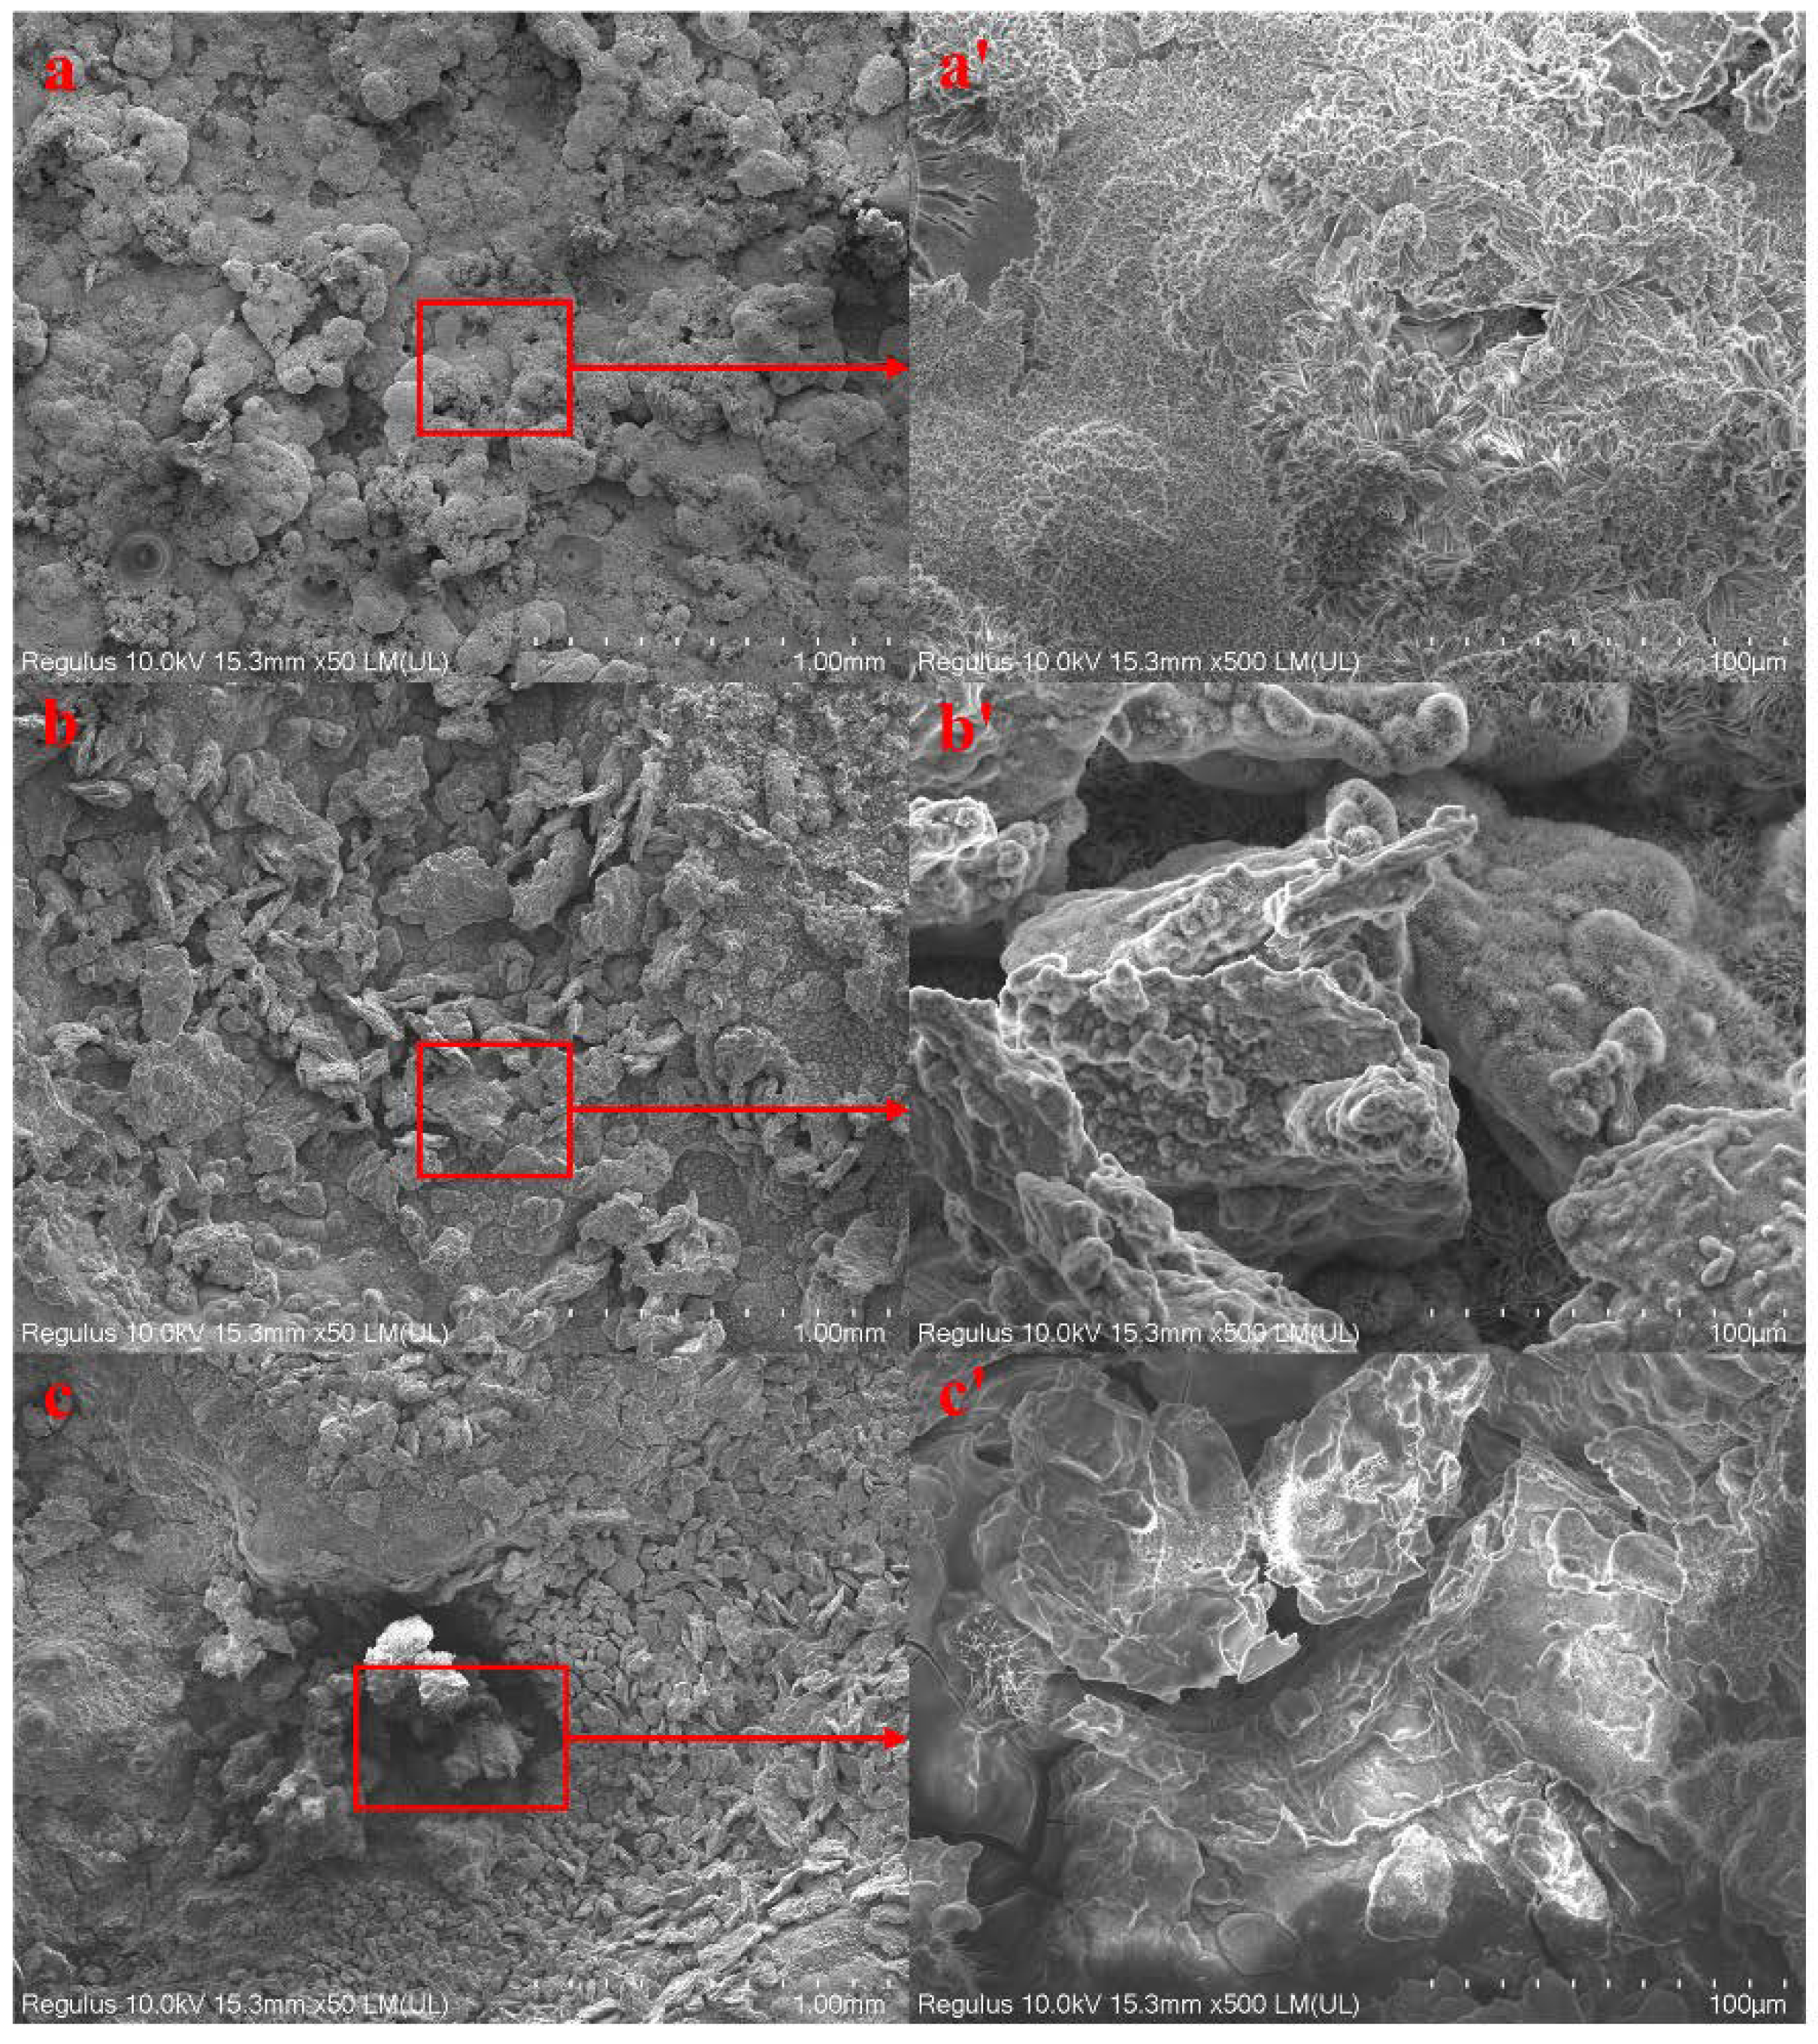
Figure 2 shows the SEM images of the surface corrosion products of AZ31B magnesium alloy anode test piece after 12 days of immersion in three different concentrations of mannose seawater solution. It can be seen that the corrosion product presents a non-dense granular shape on the sample surface. It can also be seen that there are obvious pits in
Figure 2c. a', b', c' in
Figure 2 was obtained after partial magnification of a, b, and c in
Figure 2. It was observed that the corrosion products showed pinnacle-like shape, which was the characteristic shape of Mg(OH)
2 [
23], and covered the sample surface in a cascading manner.
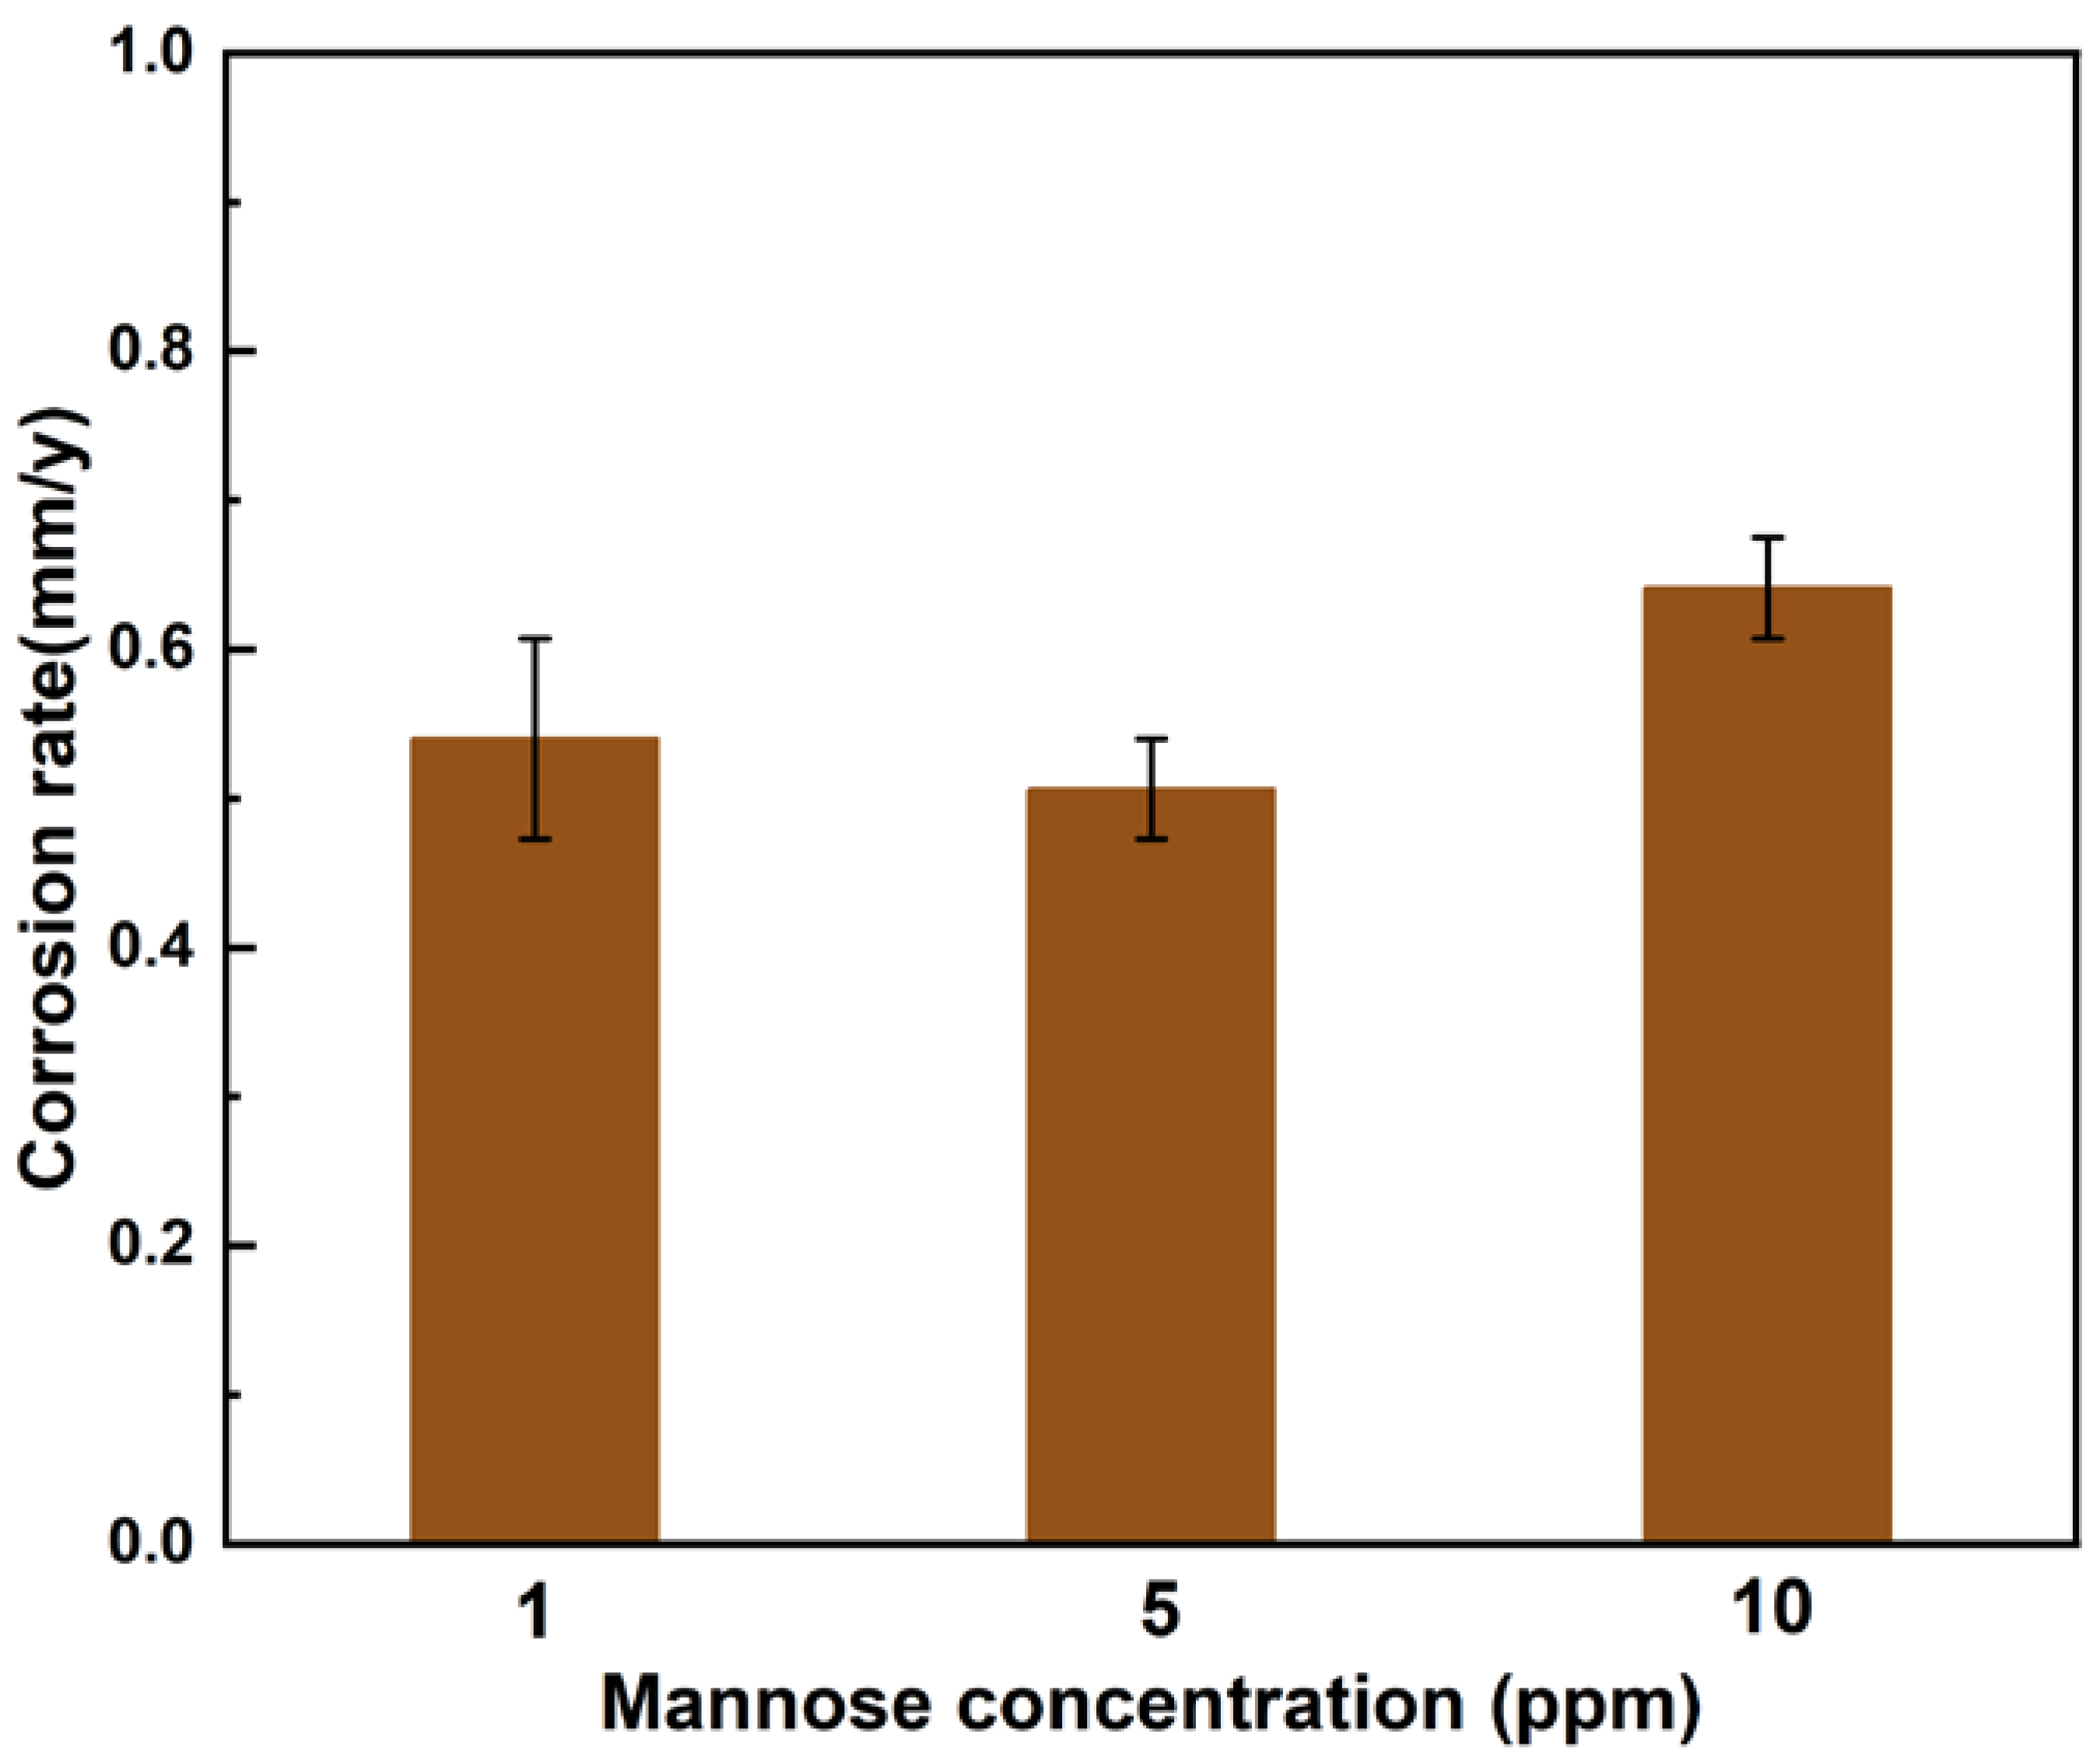
Figure 3 shows the weight loss data after 12 d of experiment in seawater solution with different mannose concentrations. The weight loss of AZ31B magnesium anode sample in solution with a mannose concentration of 5 ppm reaches the minimum value of 0.51±0.03 mm/year. The weight loss of samples in 10 ppm mannose solution reached the maximum of 0.64±0.03 mm/year. This indicates that the corrosion rate of the sample first decreases and then increases with the increase of mannose concentration, which is not a simple positive relationship.
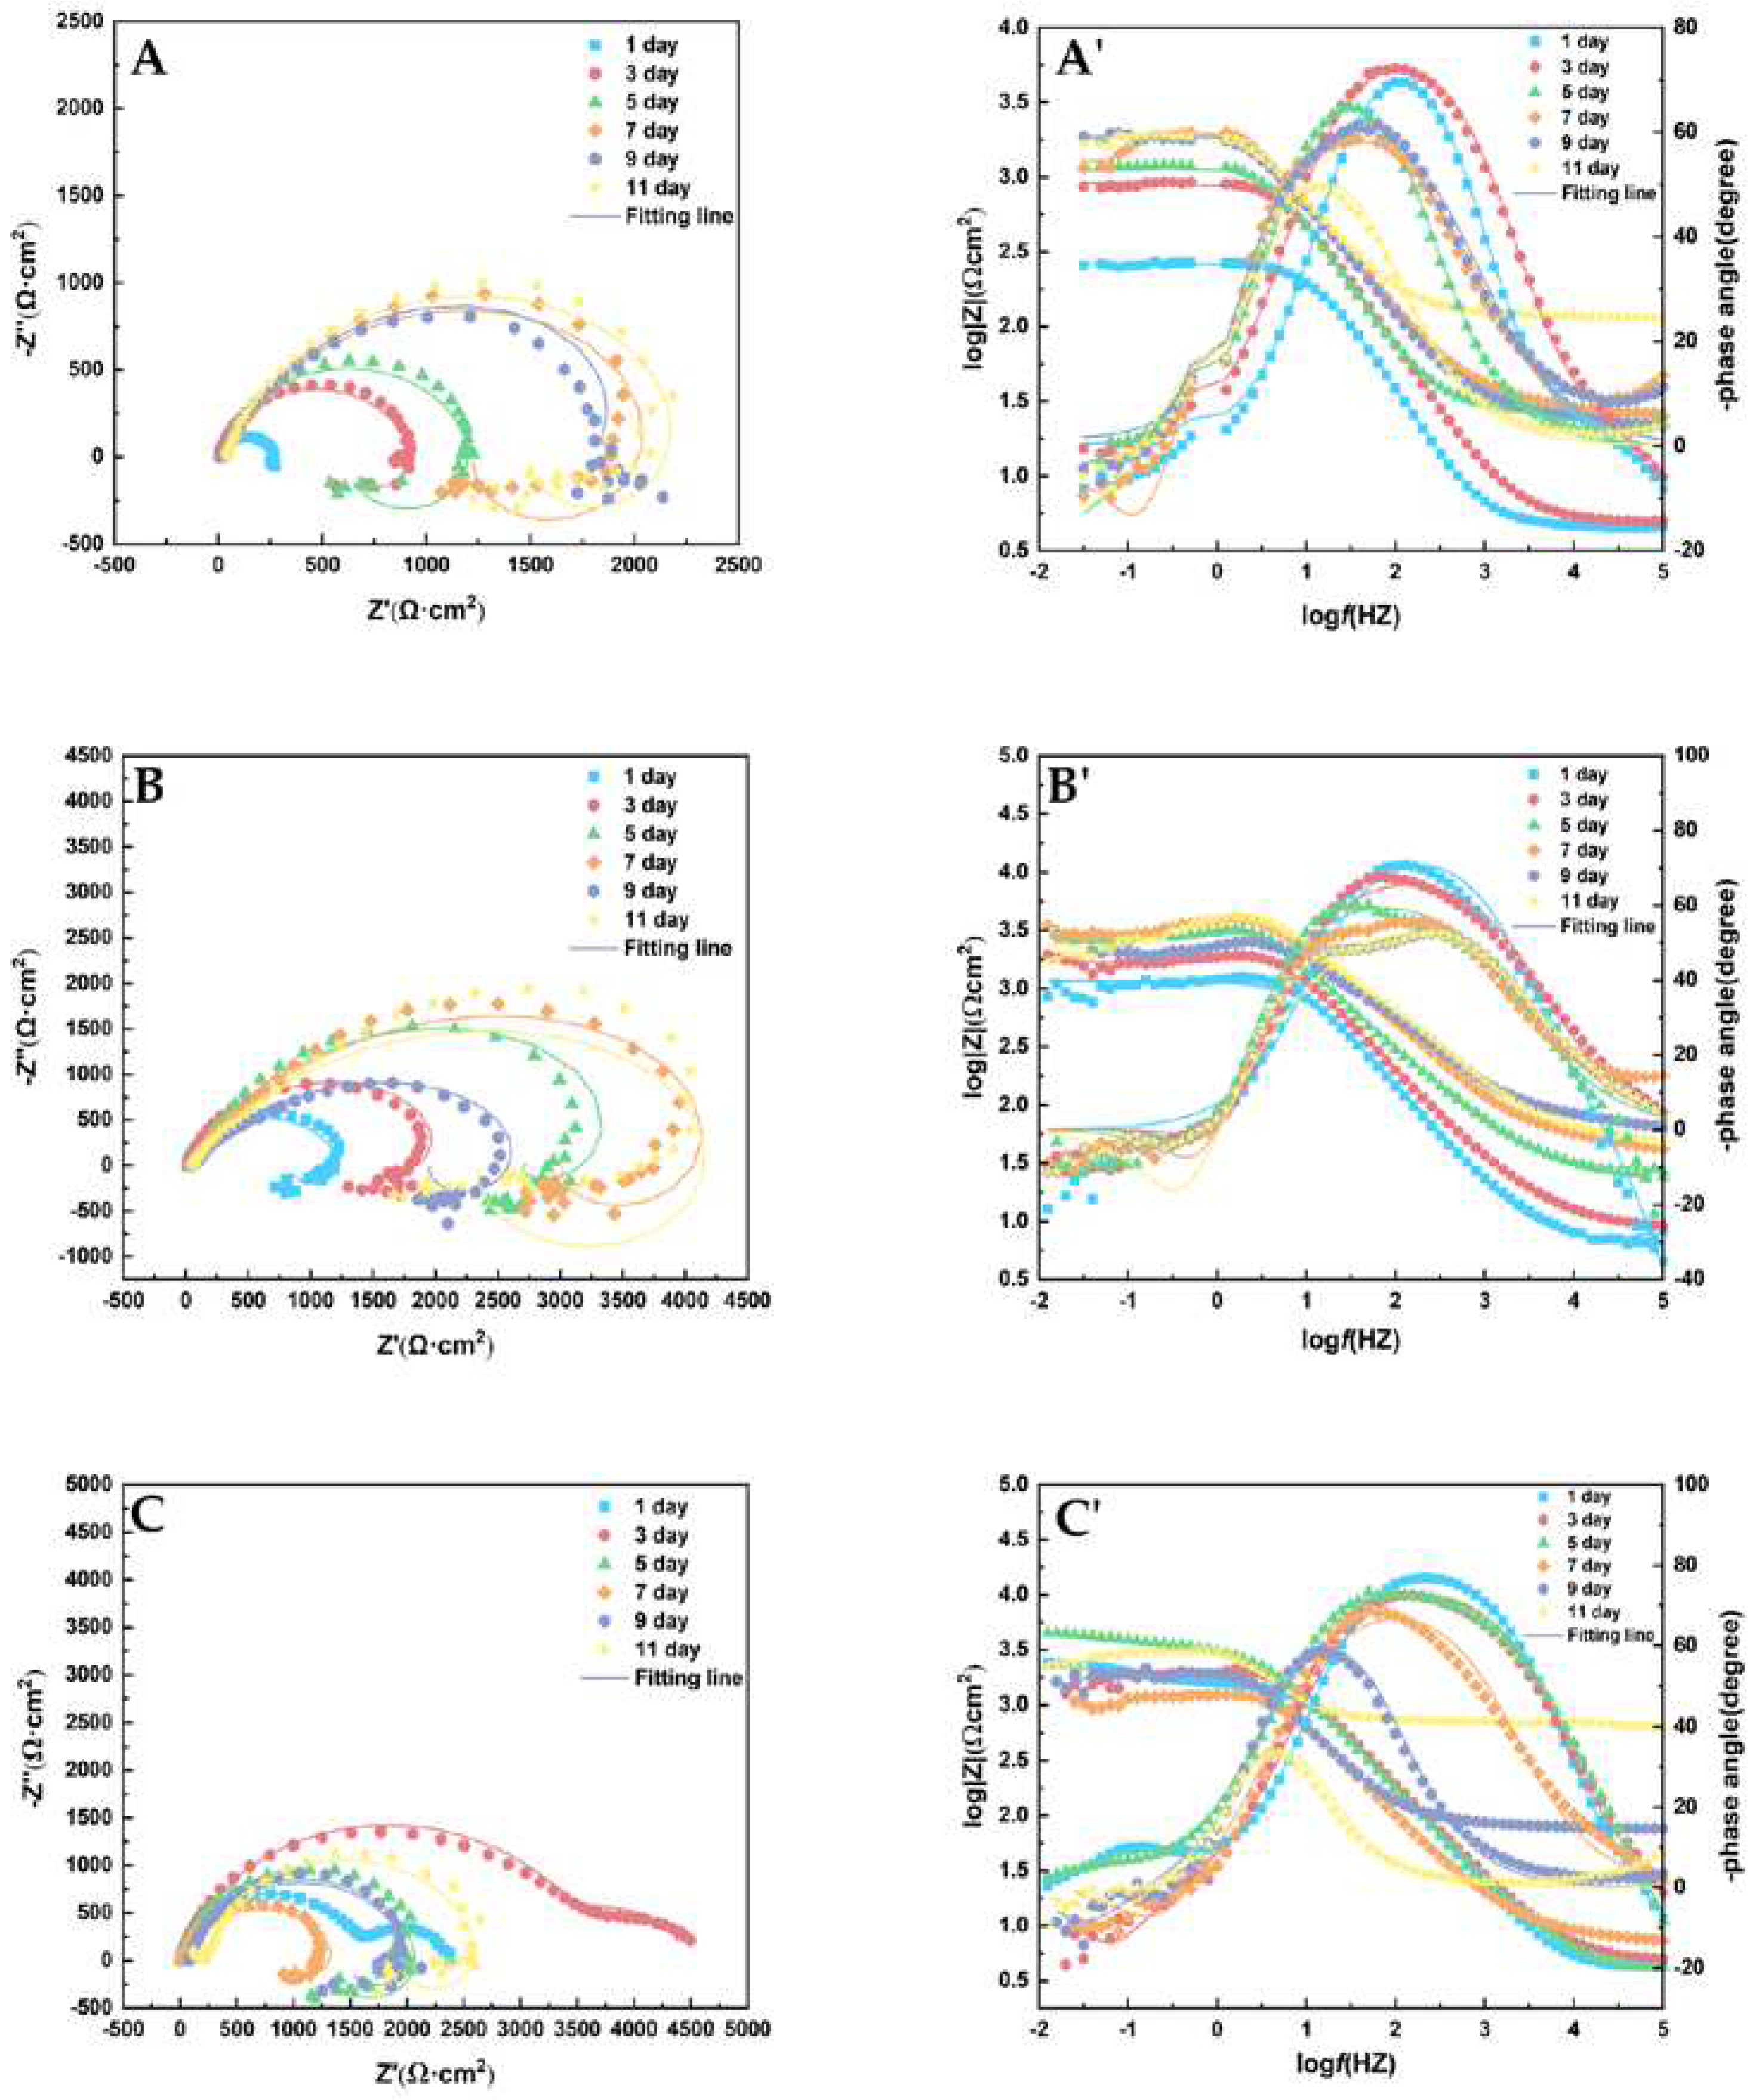
The Nyquist and Bode diagrams are shown in
Figure 4. ZsimpWin 3.50 was used to analyze the results. The Nyquist chart in
Figure 4 showed that the arc diameter of the capacitive redactable presented a dynamic fluctuation rule with time, and showed a change rule of first increasing, then decreasing, and then increasing with the increase of experimental days. This is related to the fact that the corrosion products of magnesium alloy cannot protect the surface of the matrix densely [
24]. When the corrosion products fall off and the magnesium alloy matrix is exposed, the corrosion products become the cathode side and the metal matrix becomes the anode side, which will aggravate the corrosion.
The equivalent circuit diagram in
Figure 5 was used to fit the impedance data, and the fitting parameters of the circuit elements in
Table 3 were obtained. R
sol stands for solution resistance; Q
dl and R
ct correspond to double-layer capacitance and charge transfer resistance respectively. Due to the inhomogeneity of the specimen surface caused by the corrosion reaction, impedance data was fitted using the constant phase Angle element (Q) instead of the standard capacitance (C). The impedance of Q can be calculated by the following formula [
25]:
w is the angular frequency (rad/s), Y
0 and n are obtained by the exponential fitting indicating the sample deviating from the ideal capacitance behavior. The inductance of low frequency region is represented by L
pit. The generation of L
pit of low-frequency inductance is generally attributed to the adsorption and shedding of the reactants on the metal matrix surface and the pitting behavior of the matrix surface, which is related to the falling of the corrosion products in the course of the experiment.
The R
ct value in
Table 3 of the fitting parameter data can more intuitively reflect the variation rule of corrosion resistance of the sample. At 1 ppm, the corrosion rate of samples from day 1 to day 7 decreased with the increase of time and fluctuated slightly from day 9 to day 11. This is related to the surface corrosion morphology. The magnification (a') of
Figure 2 a, showed more densely distributed on the surface, which results in less fluctuation of corrosion rate of AZ31B magnesium alloy anode at this concentration. While b '(5 ppm) and c' (10 ppm) showed blocky and obvious void, indicating that the corrosion products could not be well adsorbed on the surface with the increase of concentration, and the corrosion rate fluctuated with the fall off of corrosion products in the process of the experiment [
9].
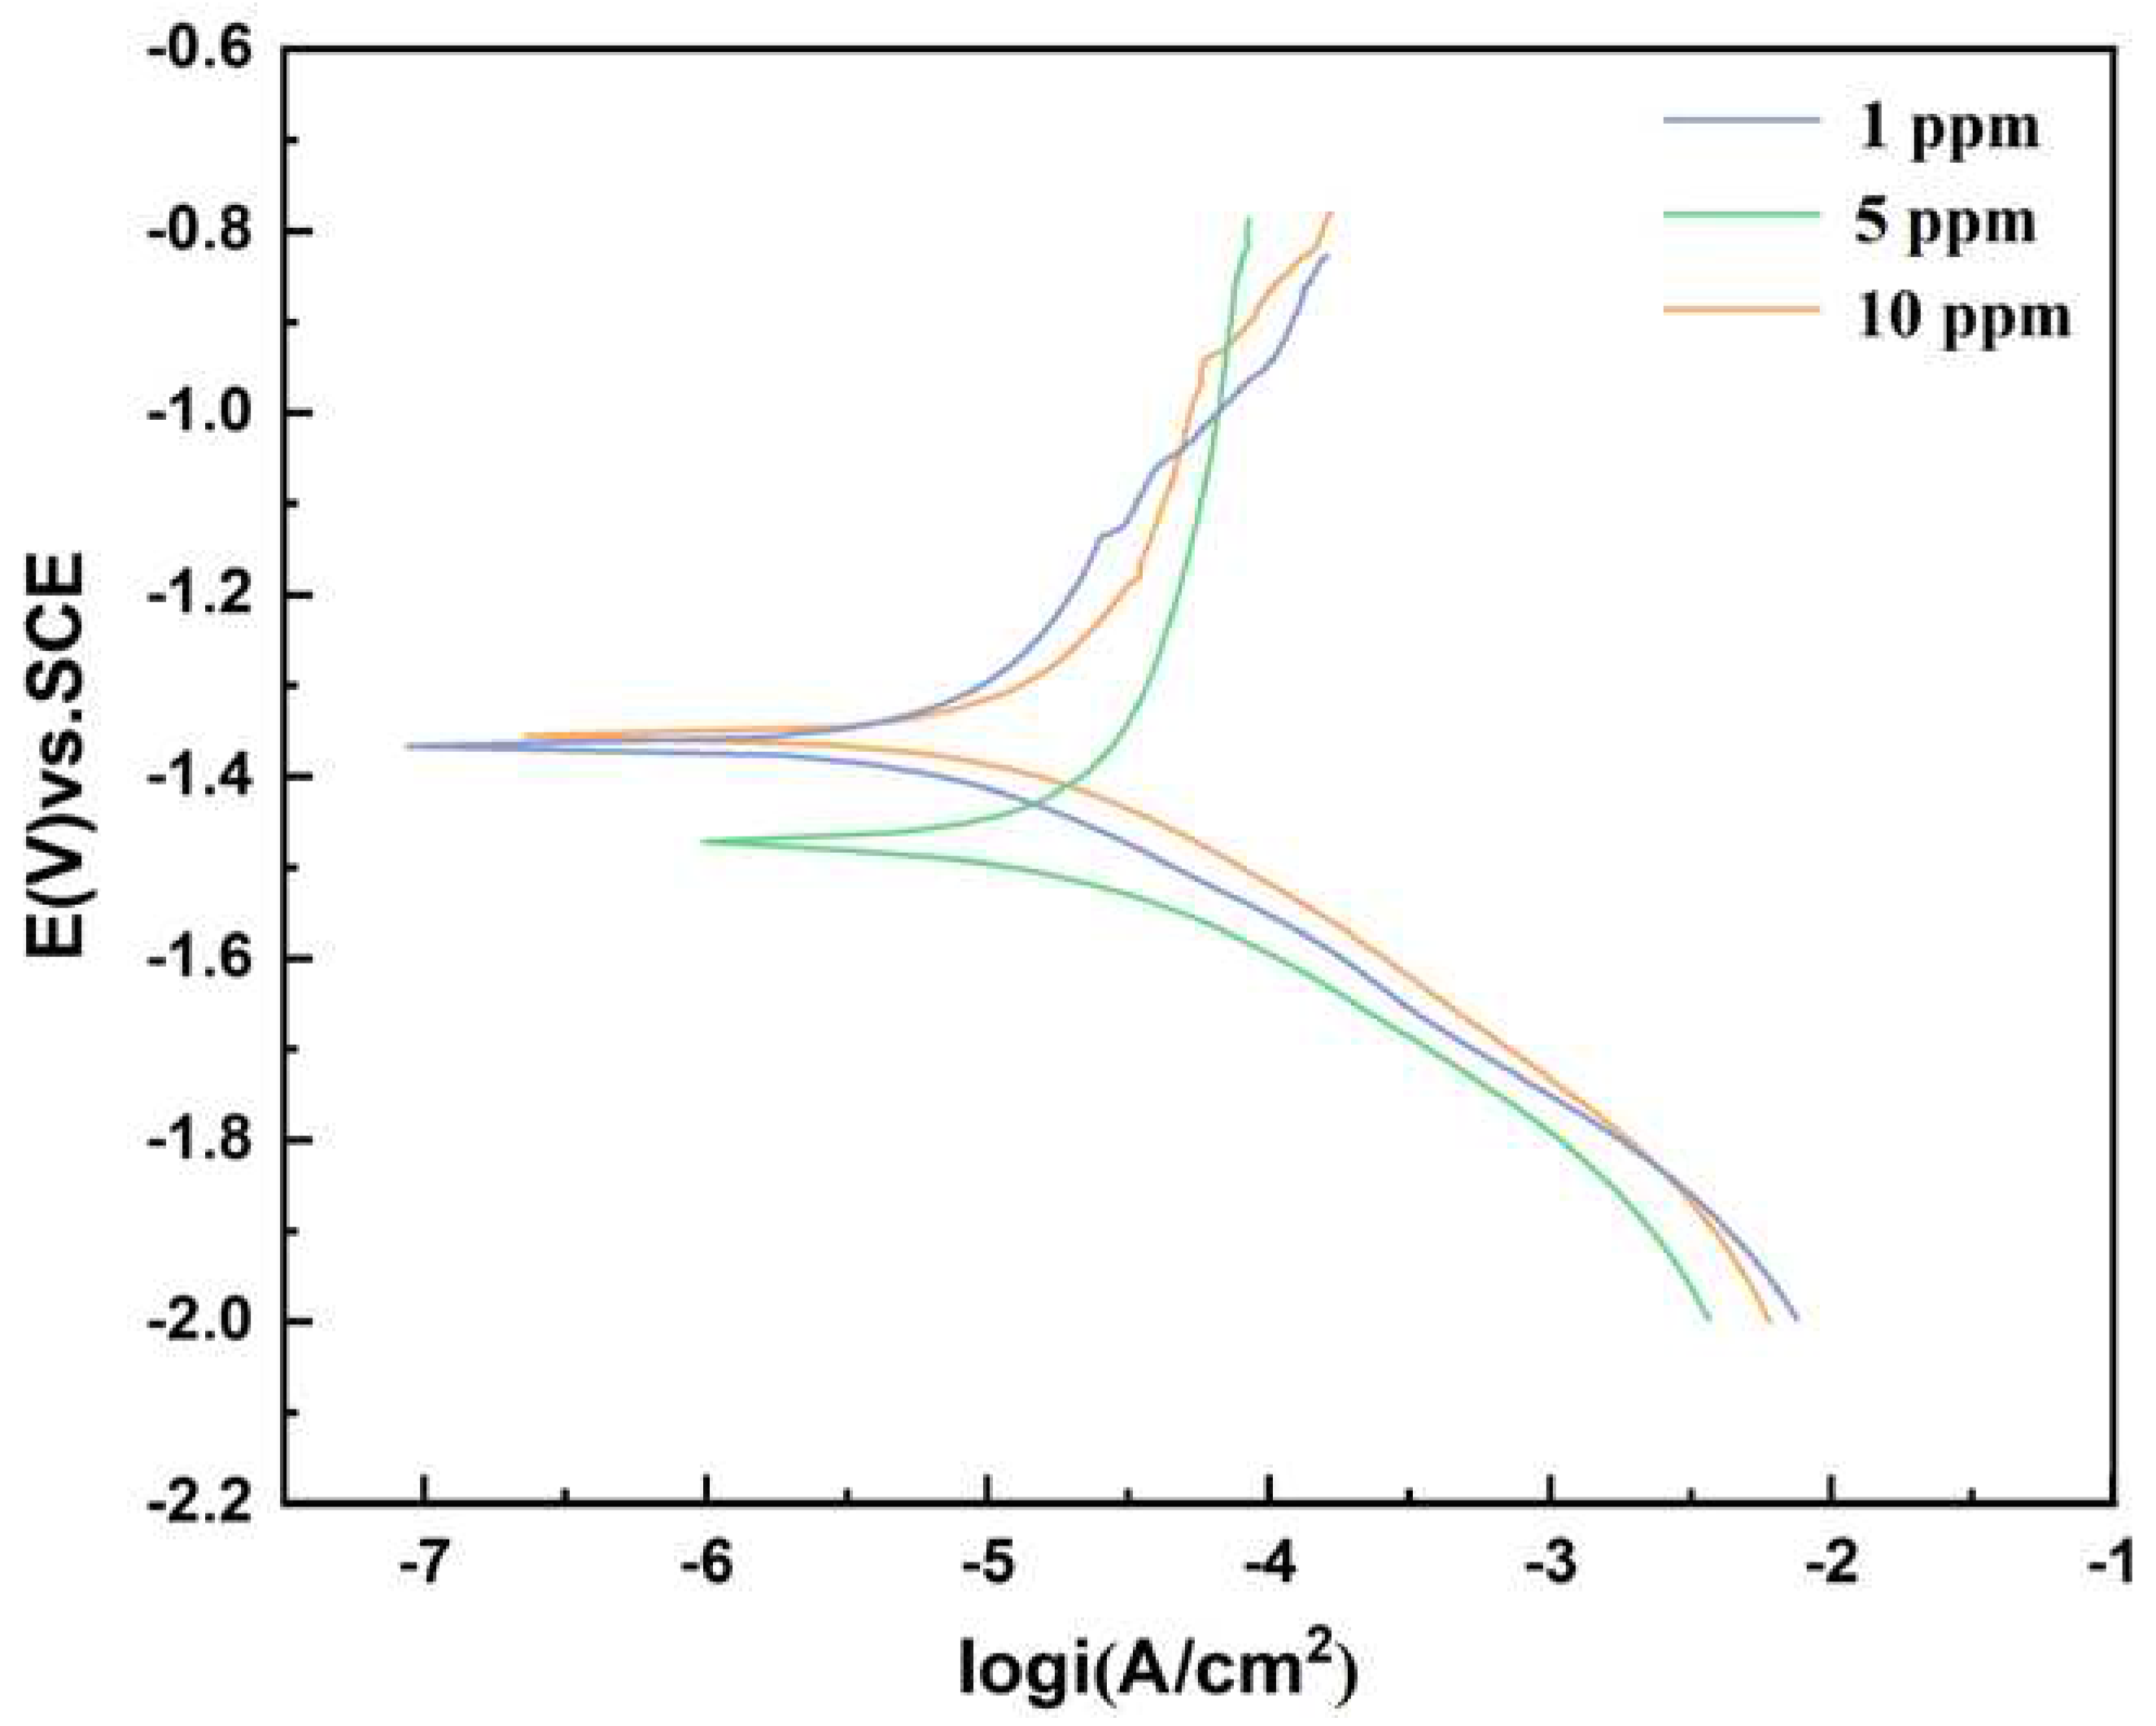
Potentiodynamic polarization curves measured at the end of the experiment are shown in
Figure 6.
Table 4 shows the parameter analysis of Tafel curve. According to Faraday’s second law, corrosion current density is proportional to corrosion rate. The test results show that the corrosion current density is minimum when the mannose concentration is 5 ppm and maximum when the mannose concentration is 10 ppm. The results showed that the corrosion rate of the sample was the maximum when the mannose concentration was 10 ppm. The measured results of potentiodynamic polarization curve were consistent with the weight loss data.
3.2. Influence of Glucose on the Corrosion Process of AZ31B Magnesium Alloy
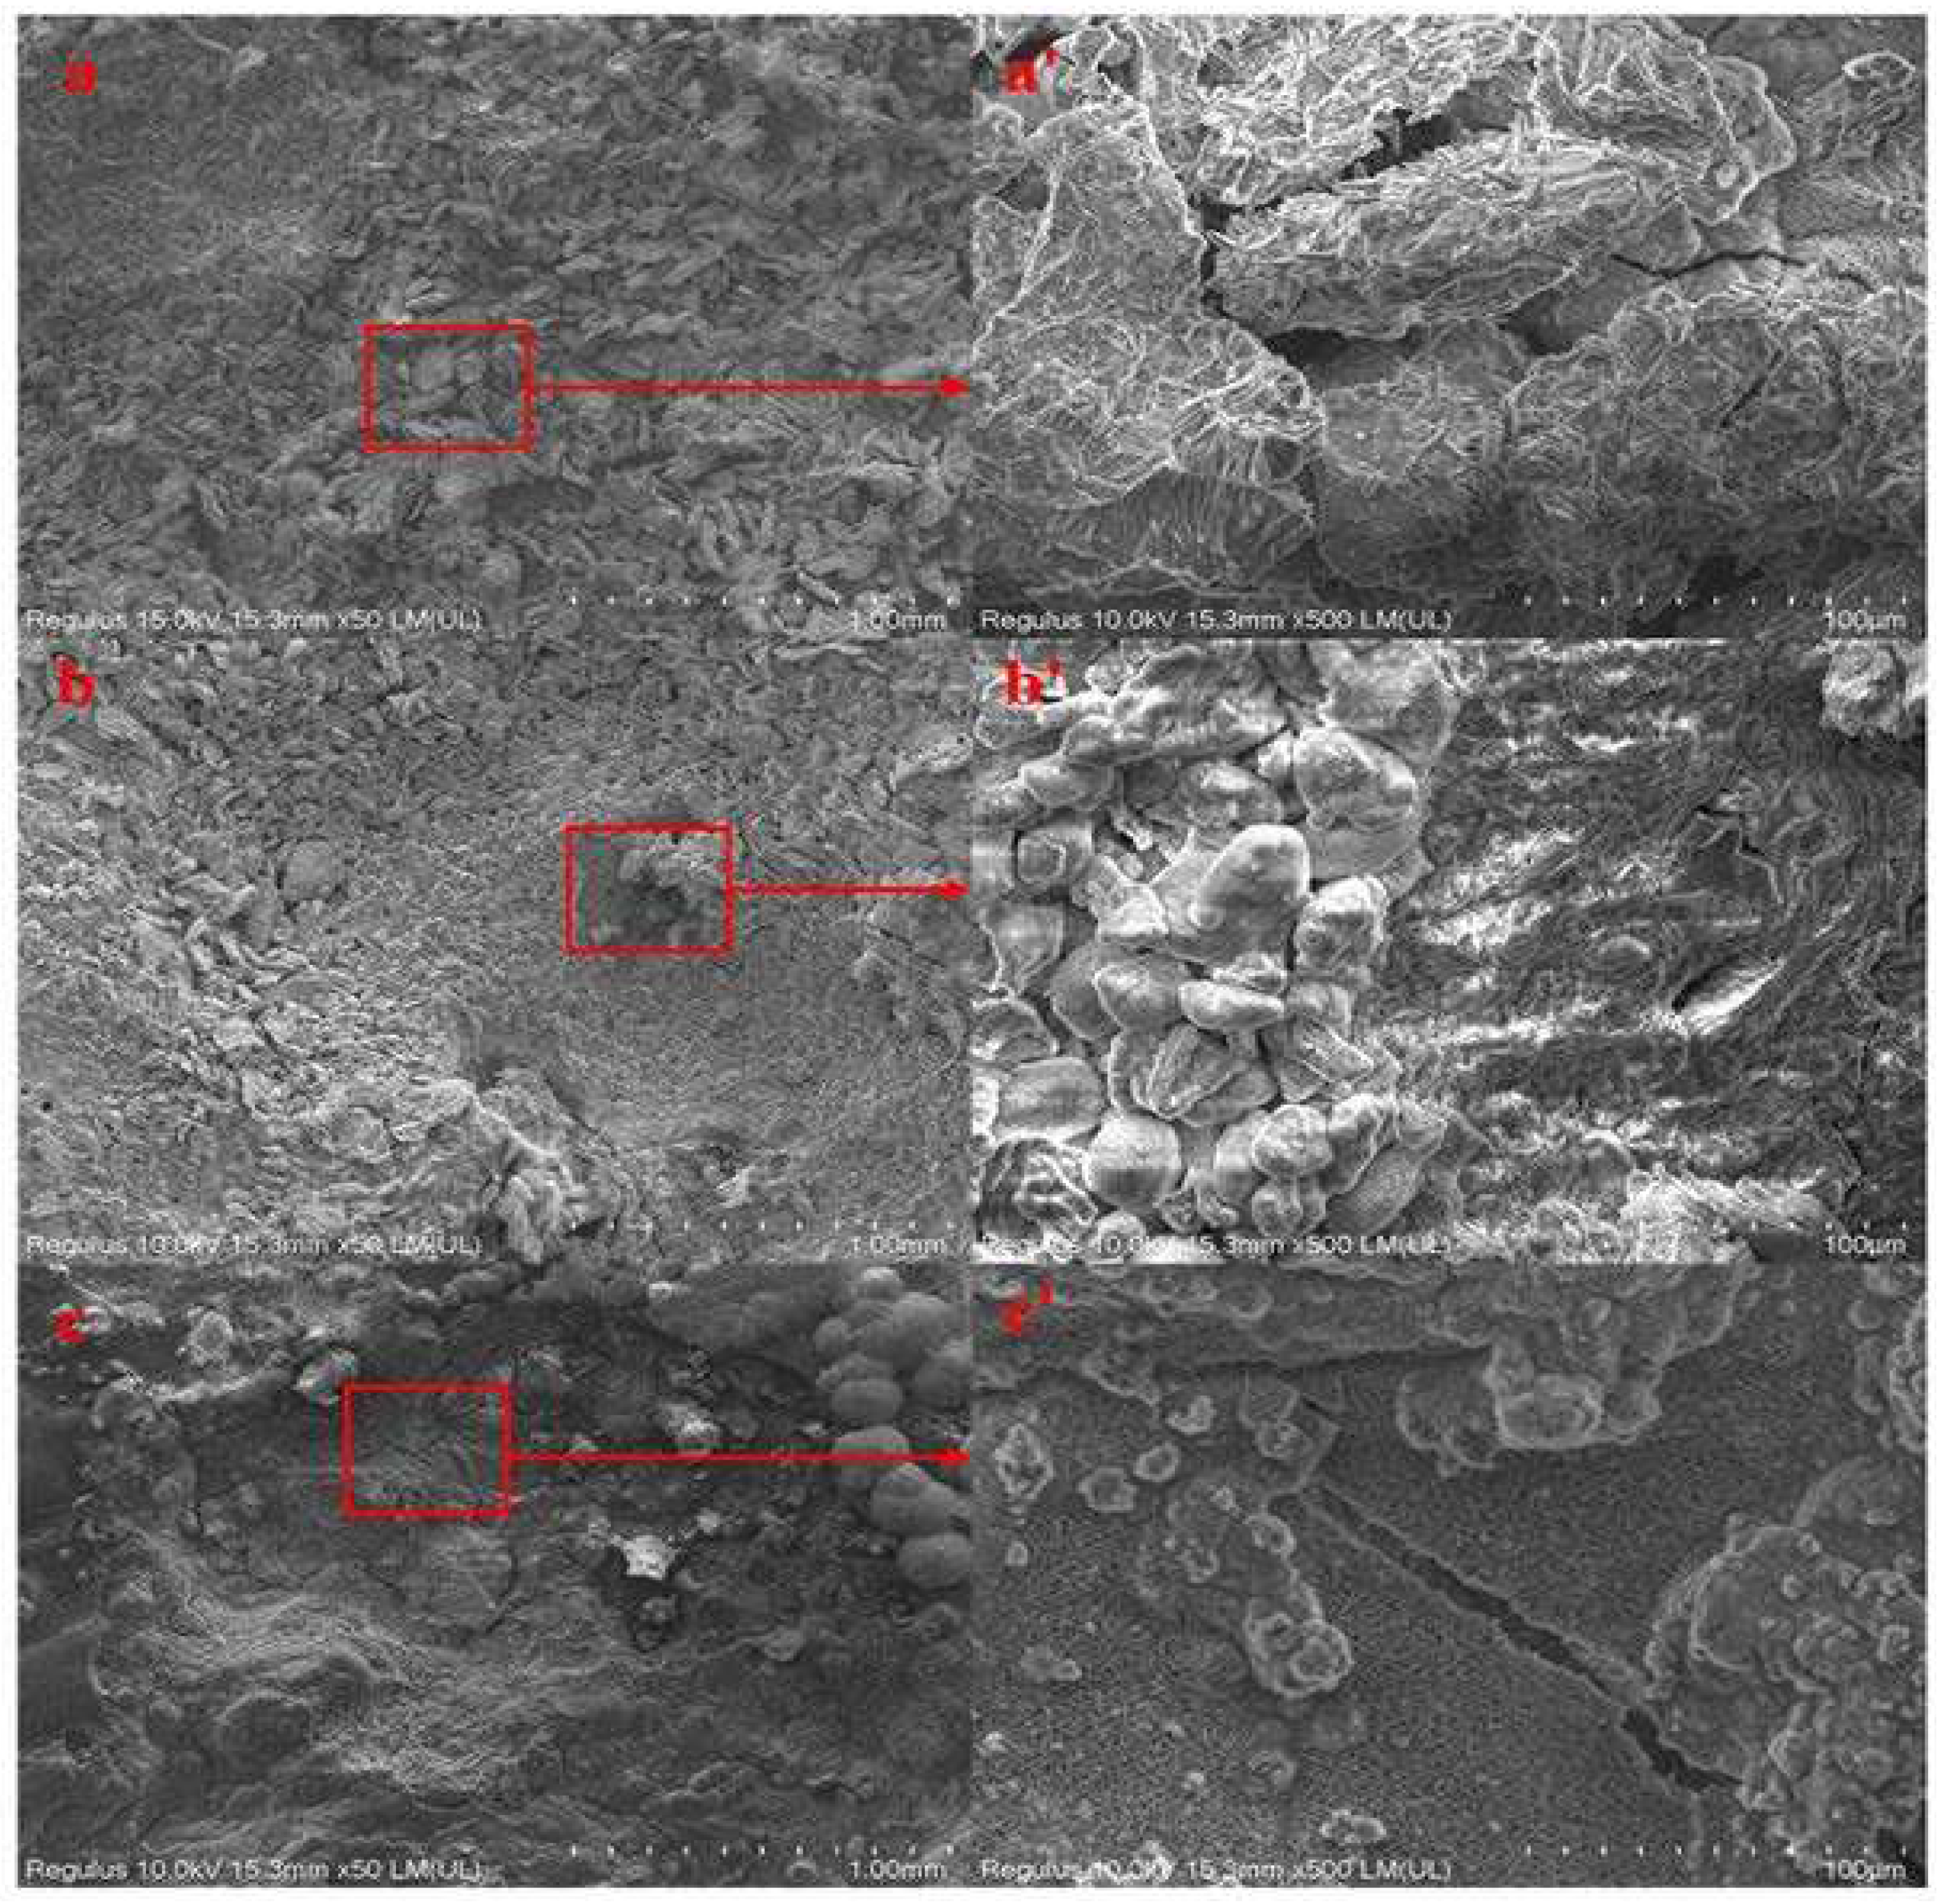
Figure 7 shows SEM images of the surface corrosion products of AZ31B magnesium alloy anode test piece in seawater solution with three different concentrations of glucose after 12 d immersion. Acicular corrosion products appeared to be layered on the specimen surface. As can be seen from
Figure 7 a'(1 ppm concentration), massive corrosion products were not adsorbed on the surface of the matrix but piled up in layers, or even partially suspended on the layer of corrosion products. The pitting site in Fig. 7b (5 ppm) was selected for further magnification, and Fig. 7b' was obtained. Granular corrosion products were accumulated together, indicating that corrosion products should fall off on the surface of the sample in the course of the experiment. In Fig. 7c (10 ppm), it can also be seen that the corrosion product layer had obvious cracks. It indicated that the corrosion product film generated by AZ31B magnesium alloy anode during the corrosion process is not dense, and the exposed matrix will aggravate the corrosion rate [
26].
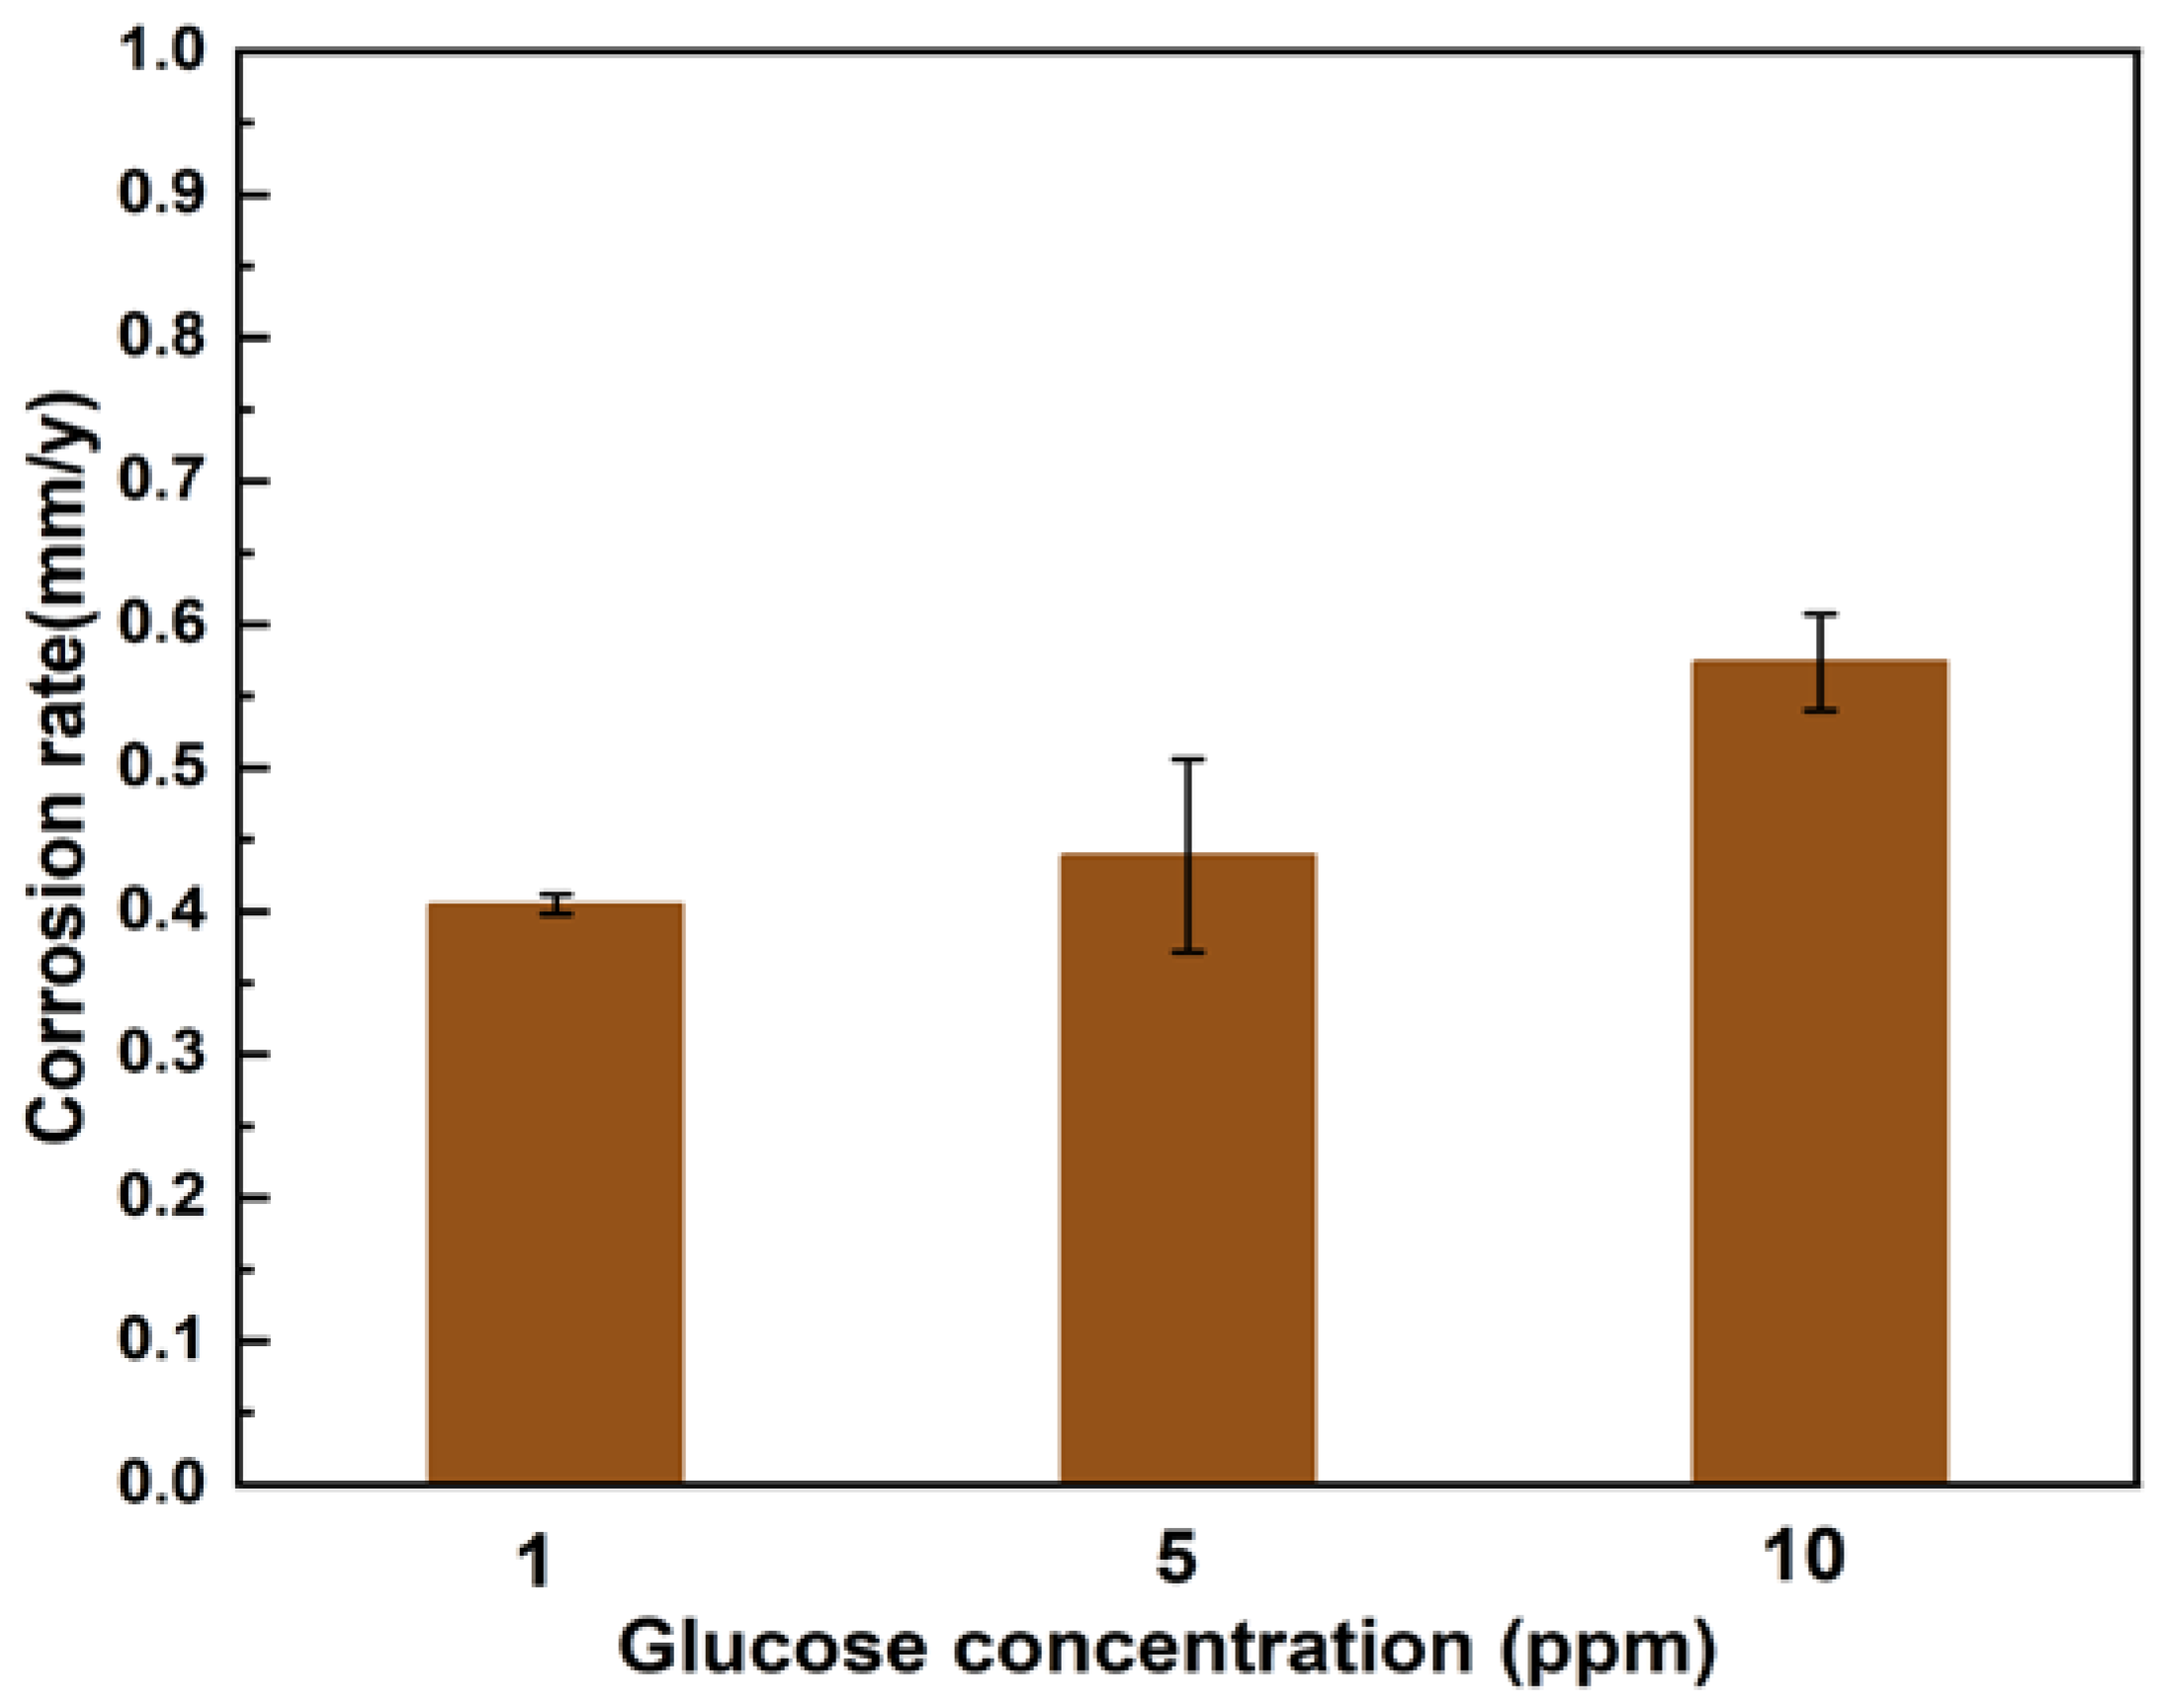
Figure 8 shows the weight loss data after 12 d of experiment in seawater solution with different concentrations of glucose. The weight loss reached the minimum value of 0.41± 0.01 mm/y in the assays with 1 ppm glucose. The maximum weight loss in the assays with 10 ppm glucose was 0.57±0.03 mm/y. With the increase in glucose concentration, the weight loss rate of the sample increased slightly.
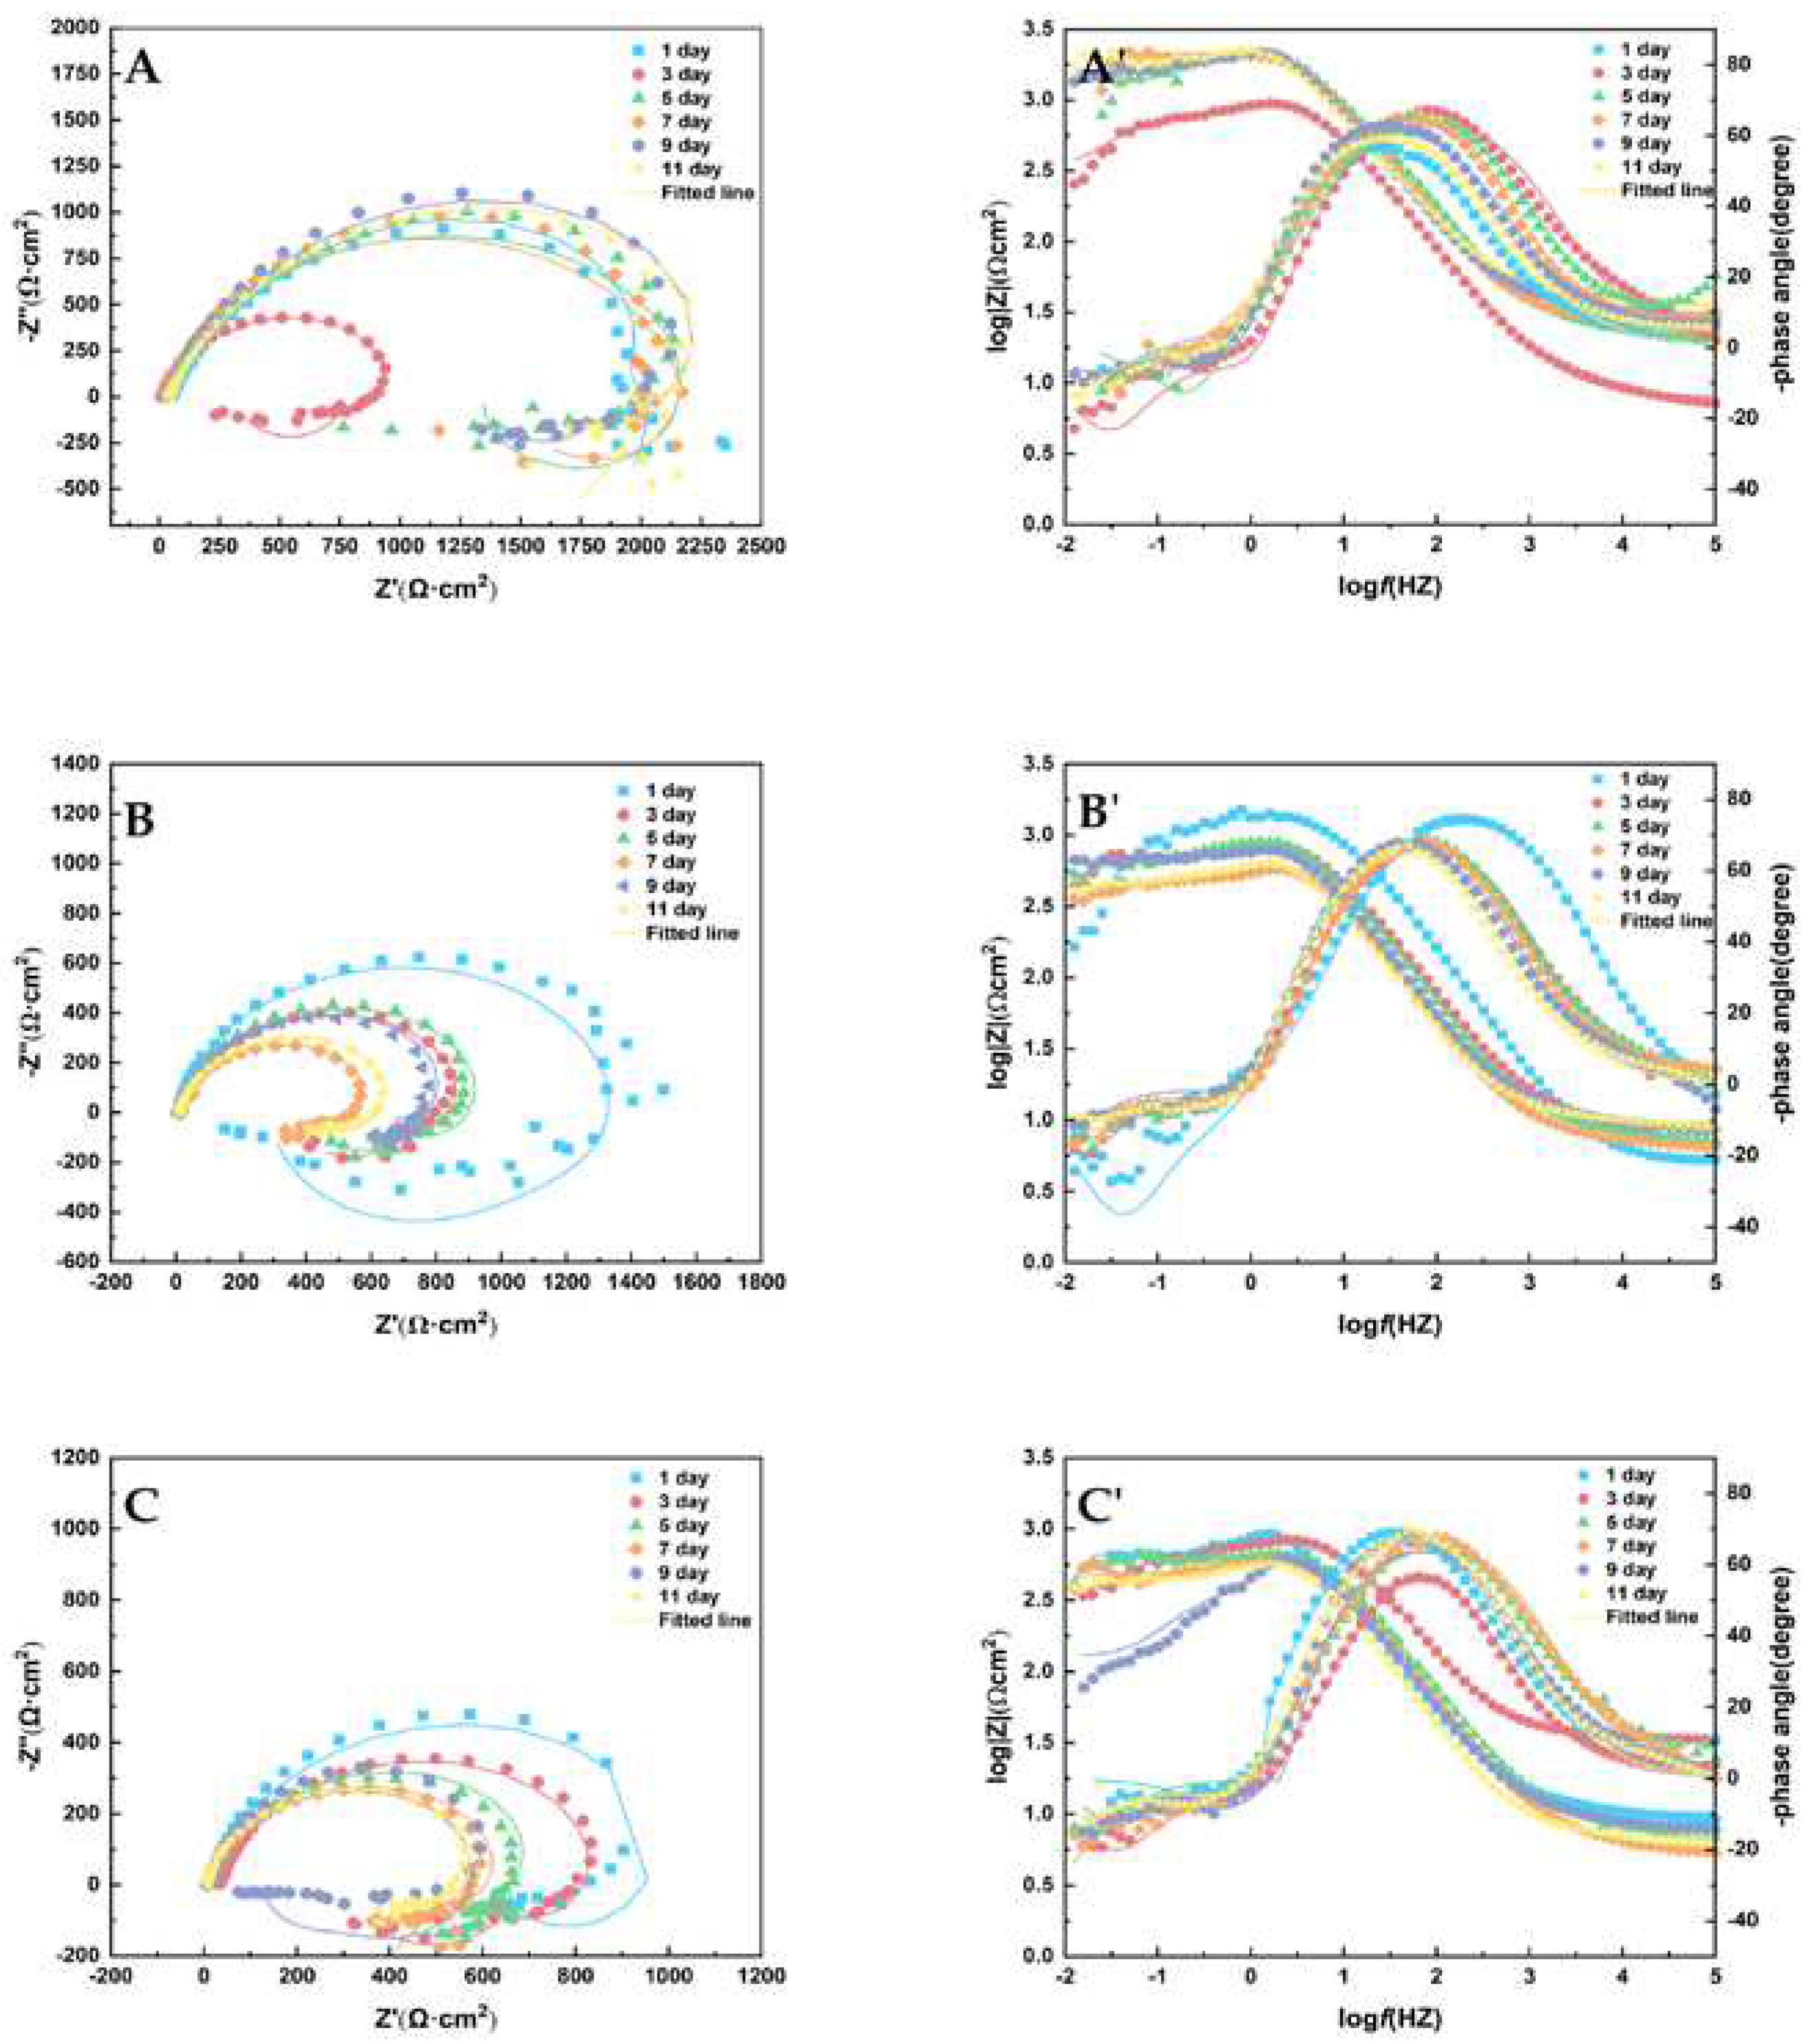
The Nyquist and Bode diagrams are shown in
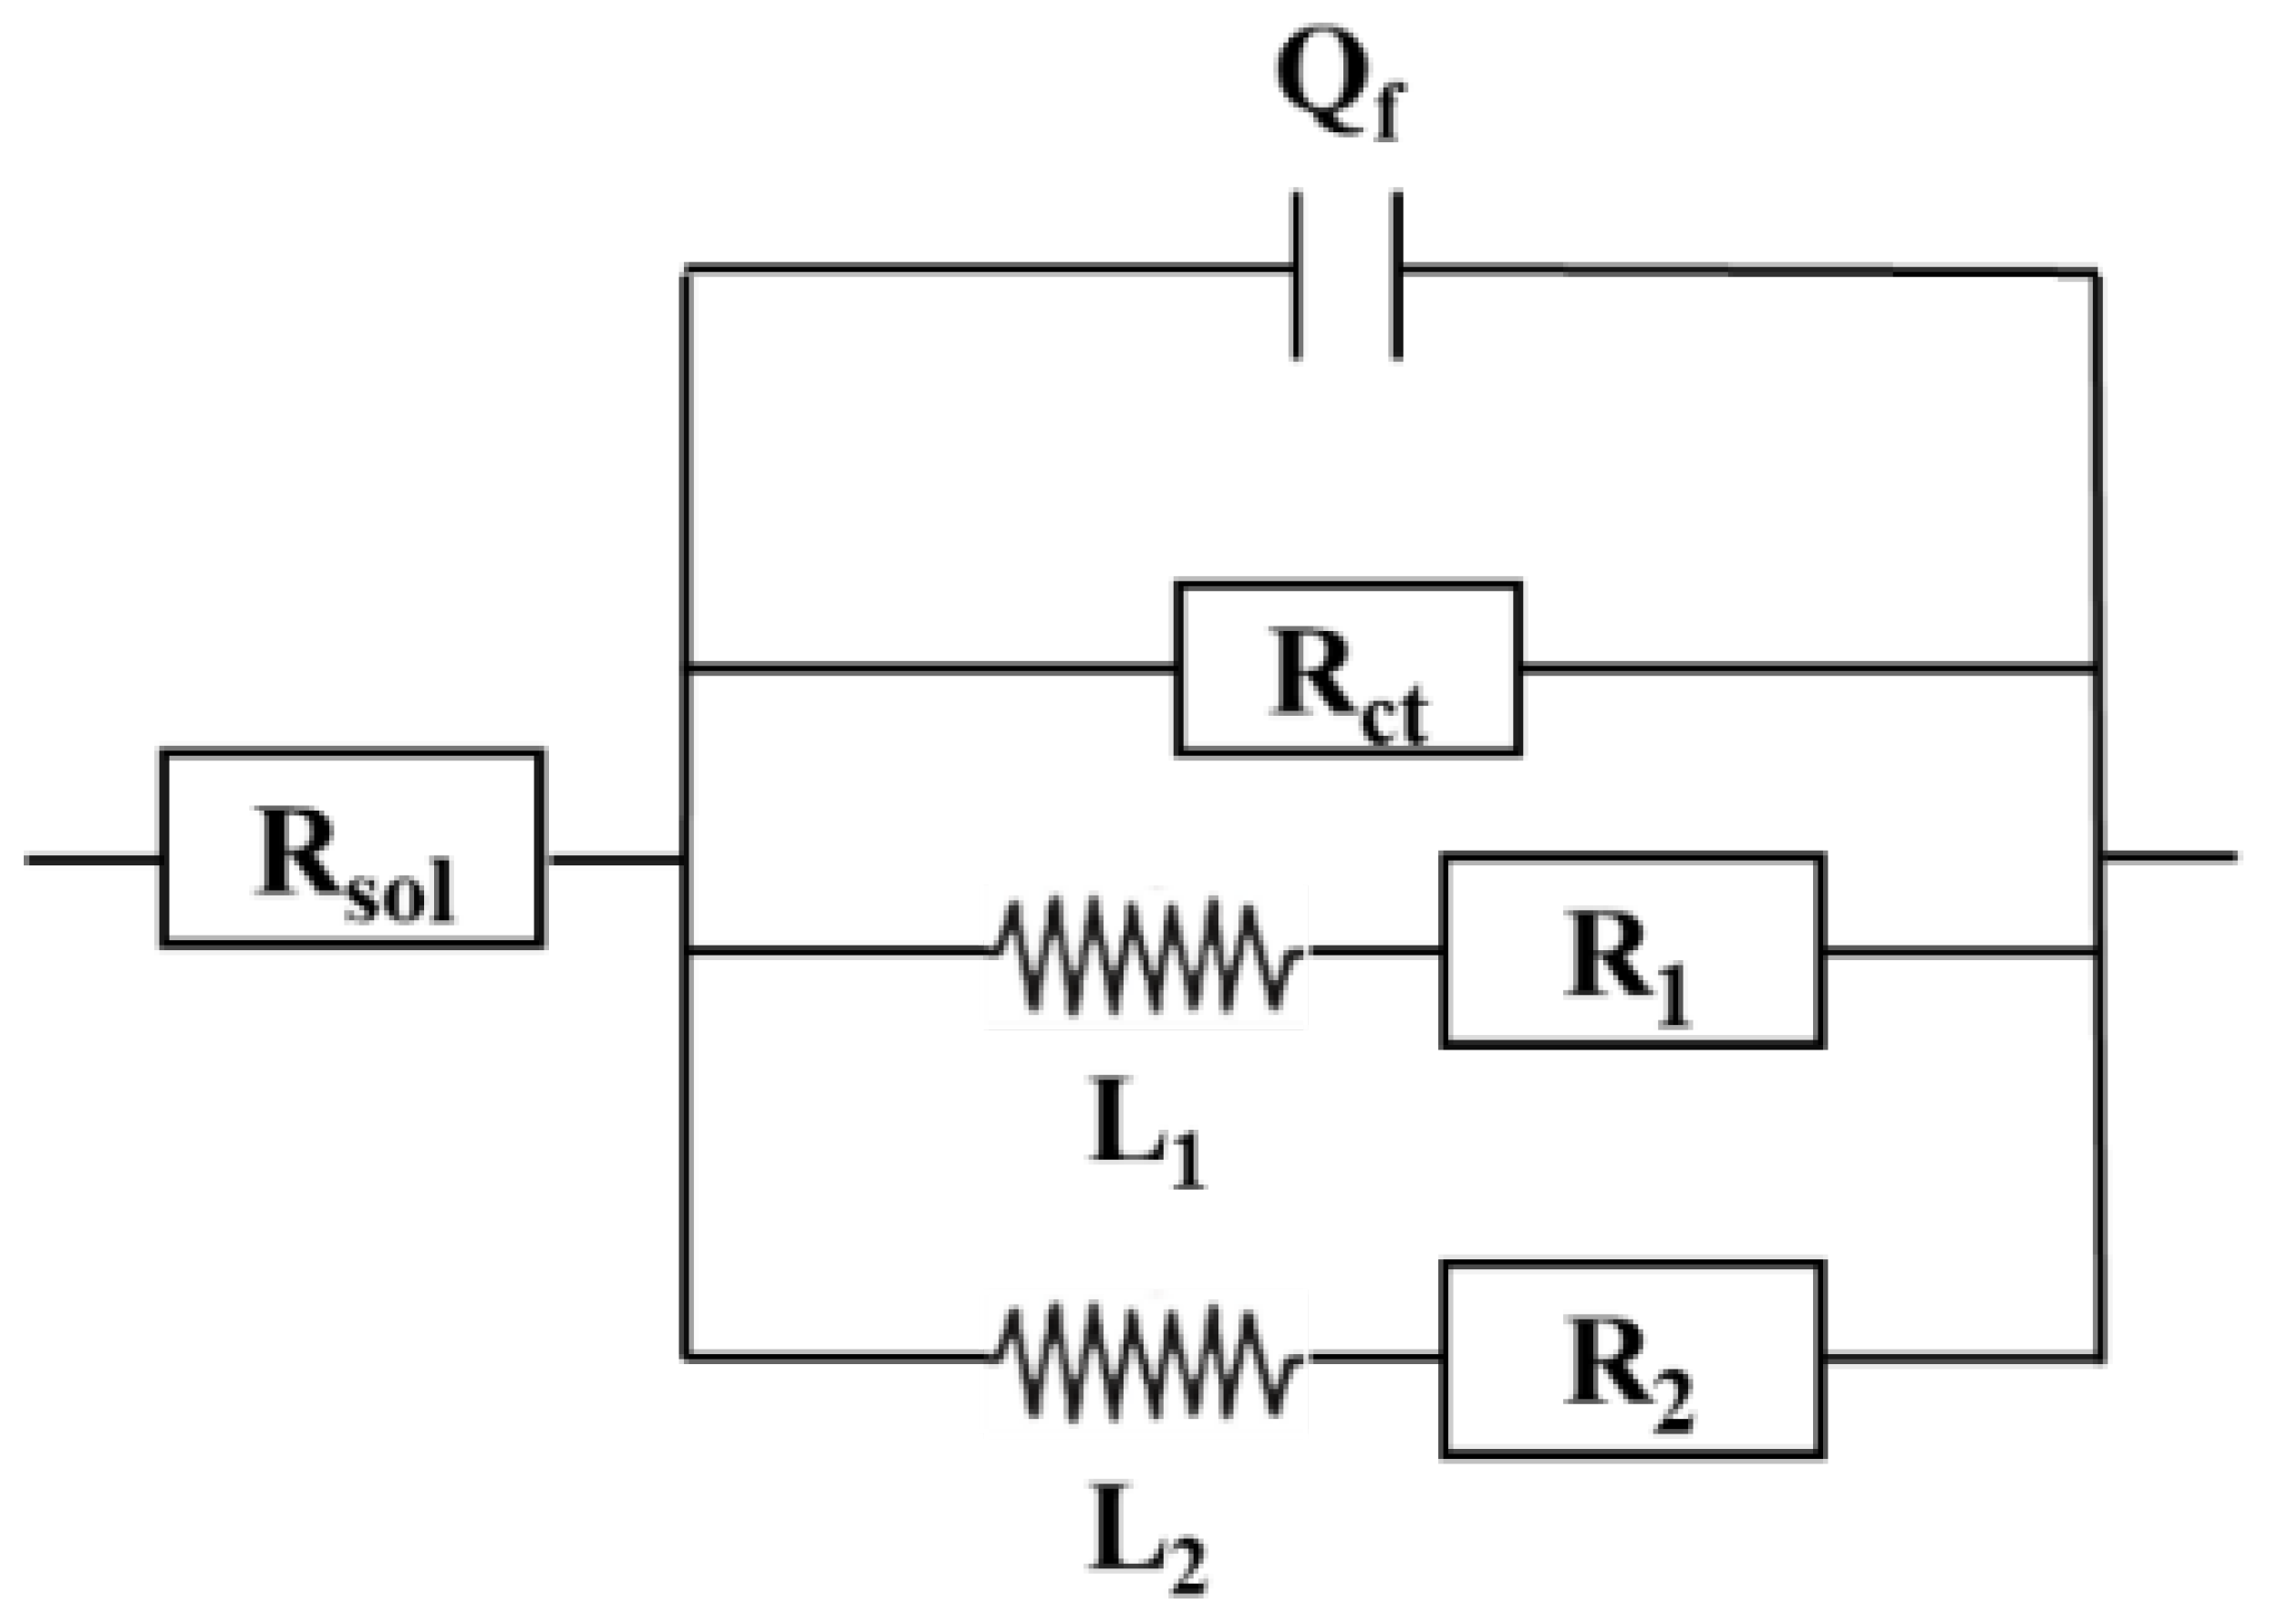
Figure 9. The equivalent circuit diagram in
Figure 10 was used to fit the impedance data, and the fitting parameters of the circuit elements in Tab. 5 were obtained. Rsol stands for solution resistance; Q
f and R
ct correspond to double layer capacitance and charge transfer resistance respectively. There are two inductors in the low frequency region denoted by L1 and L2. When the glucose concentration was 1 ppm, the arc diameter of the capacitive reactance appeared at the minimum value on the third day, and the corrosion resistance of the sample increased during the rest time. When glucose concentration was 5 ppm and 10 ppm, the maximum arc diameter of capacitive reactance appeared on the first day, which was related to the presence of a corrosion product layer on the sample surface to prevent corrosion [
27]. Subsequently, the diameter decreases gradually with the extension of the experiment time, reaching the minimum value from day 7 to day 11, and the metal corrosion resistance reaches the lowest value. The results show that the corrosion rate of AZ31B magnesium alloy anode decreases with the increase of experimental time at low concentration, while the corrosion rate increases with the increase of concentration.
With the increase in glucose concentration, the diameter of the capacitive reactance decreases during the experiment. This indicates that the increase of glucose concentration in seawater will accelerate the corrosion rate of samples, and the results are consistent with the experimental data of weight loss. The Rct data in
Table 5 also show that the corrosion rate of AZ31B magnesium alloy anode was faster when glucose concentration was 5 ppm and 10 ppm than when glucose concentration was 1 ppm.
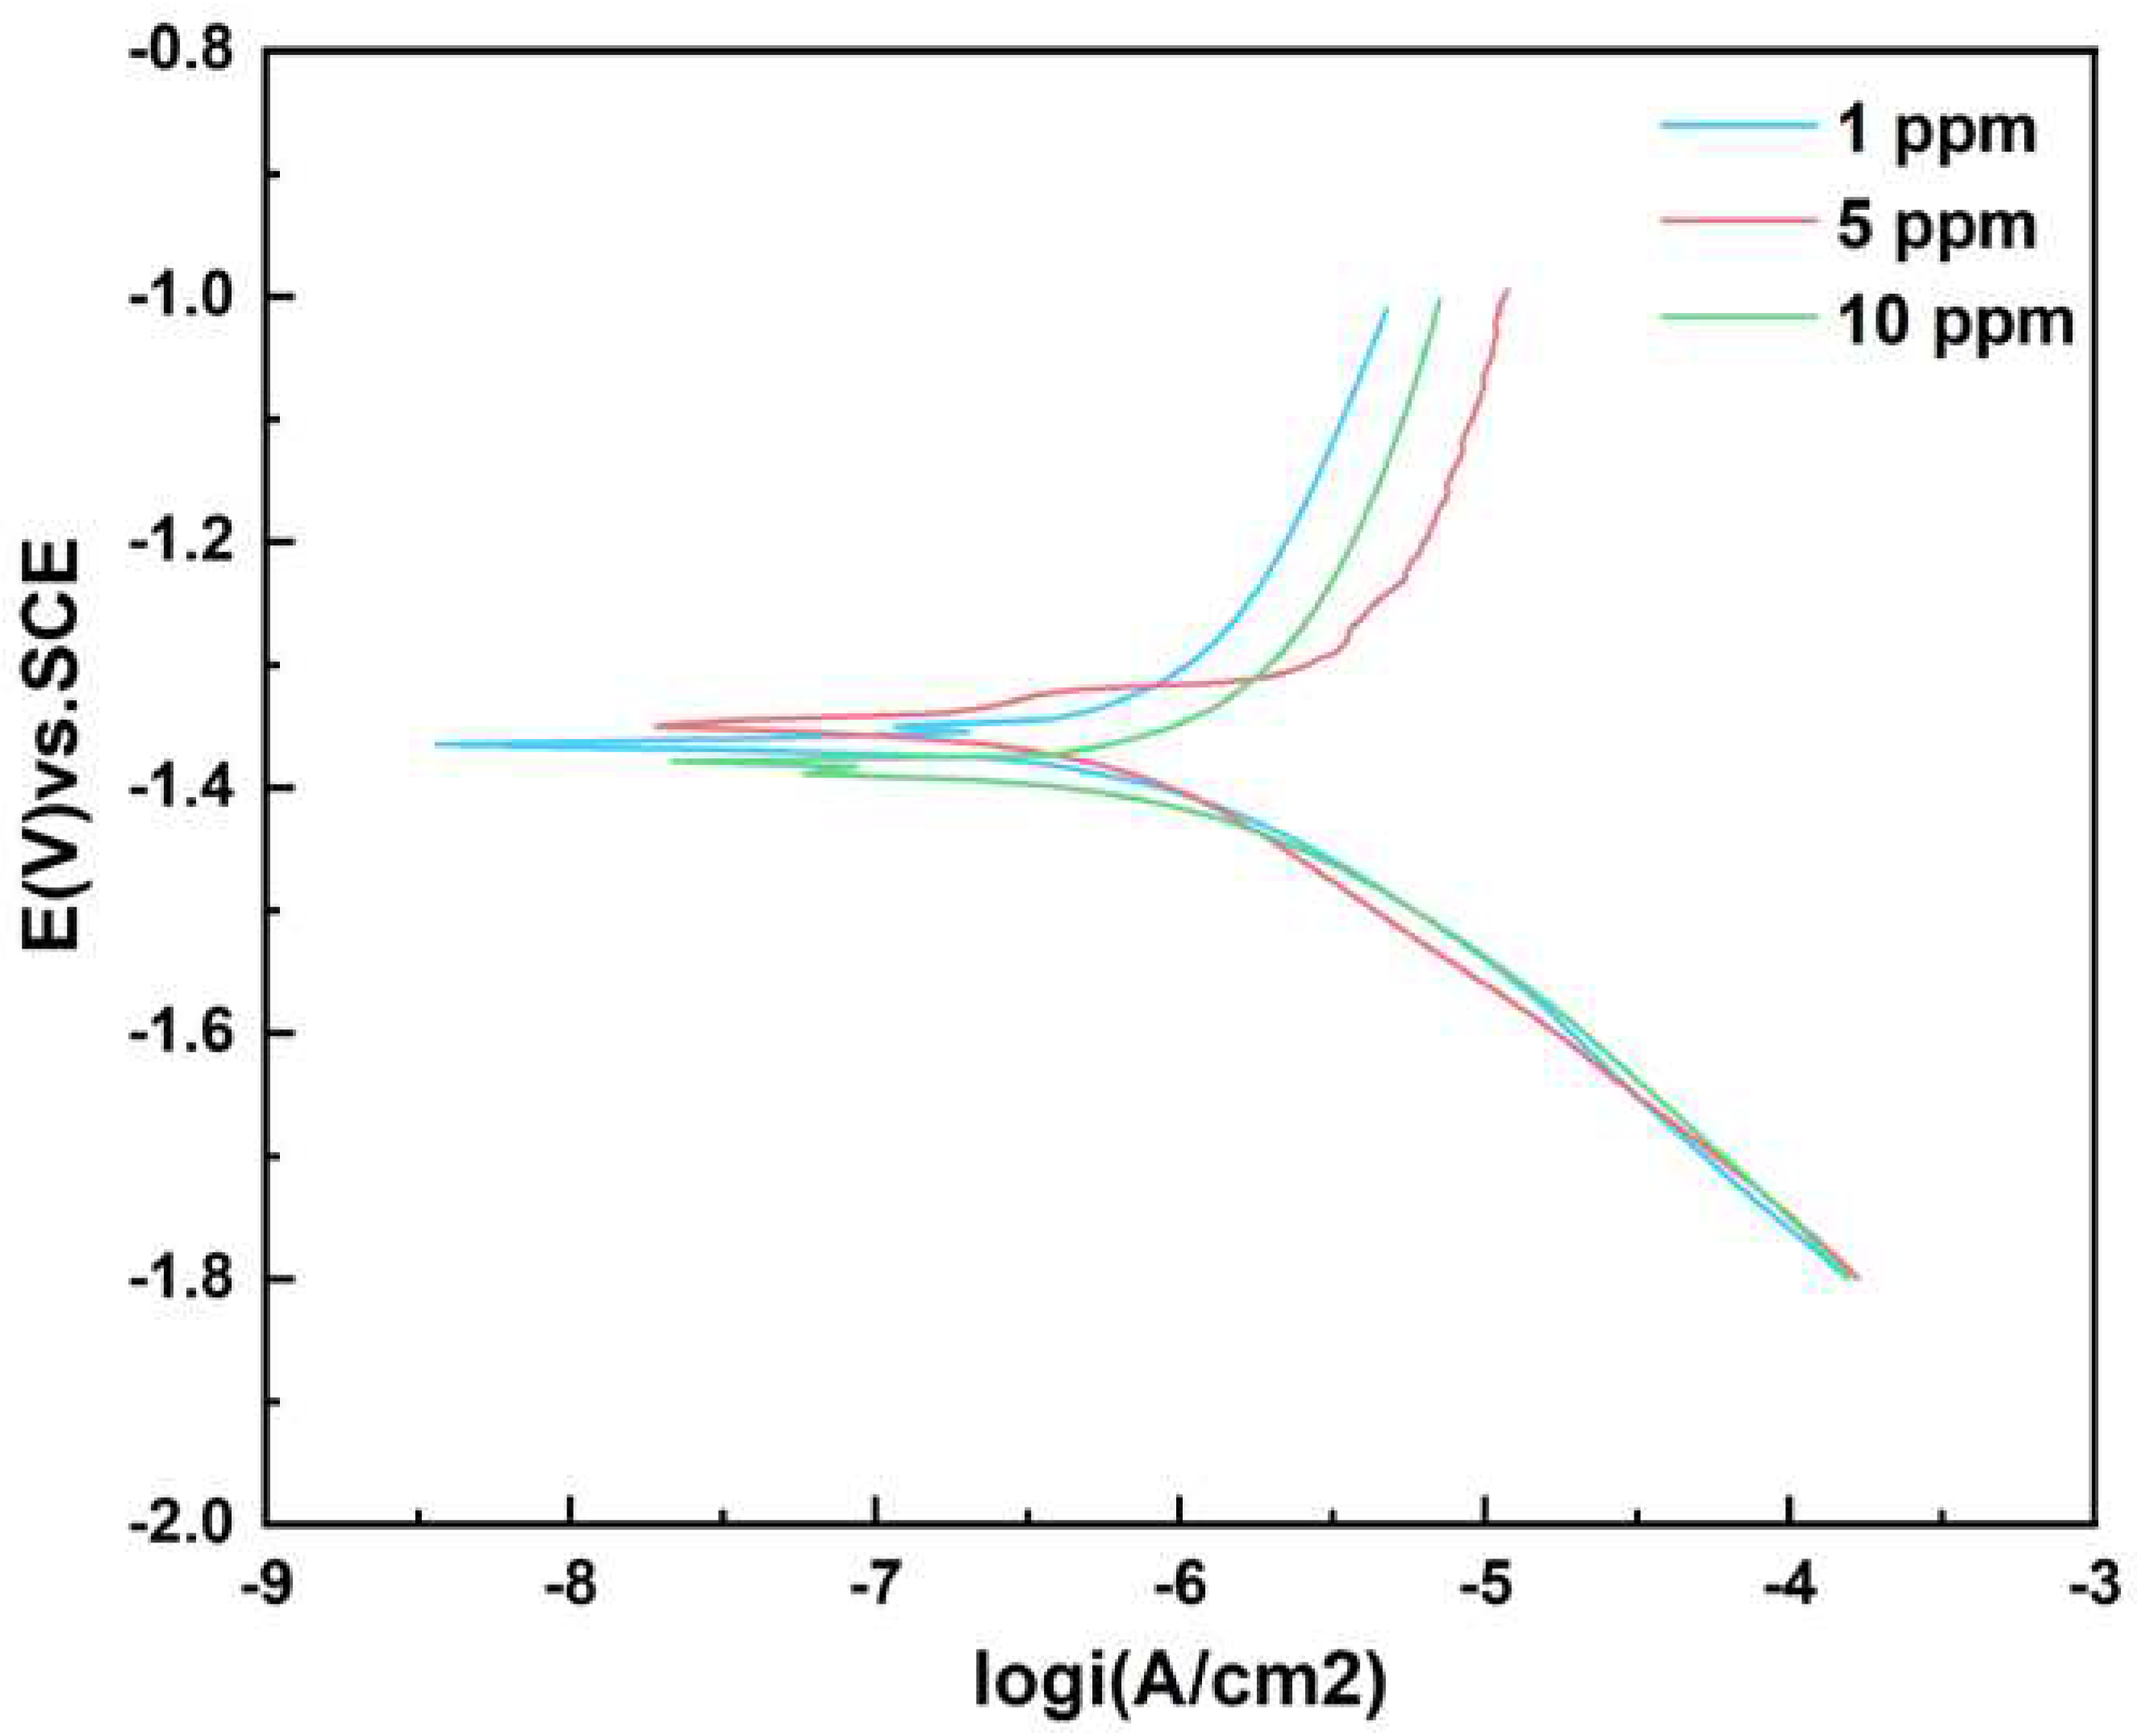
The potentiodynamic polarization curve was tested at the end of the 12 d experiment, as shown in
Figure 11.
Table 6 shows the parameter analysis of Tafel curve. The test results showed that the corrosion current density was minimum when the glucose concentration was 1 ppm and maximum when the glucose concentration was 10 ppm. The analysis results of corrosion current density were consistent with the above experimental data. According to the data βa > βc, the corrosion process was probably dominated by anode polarization.
3.3. Influence of Glucuronic Acid on the Corrosion Process of AZ31B Magnesium Alloy
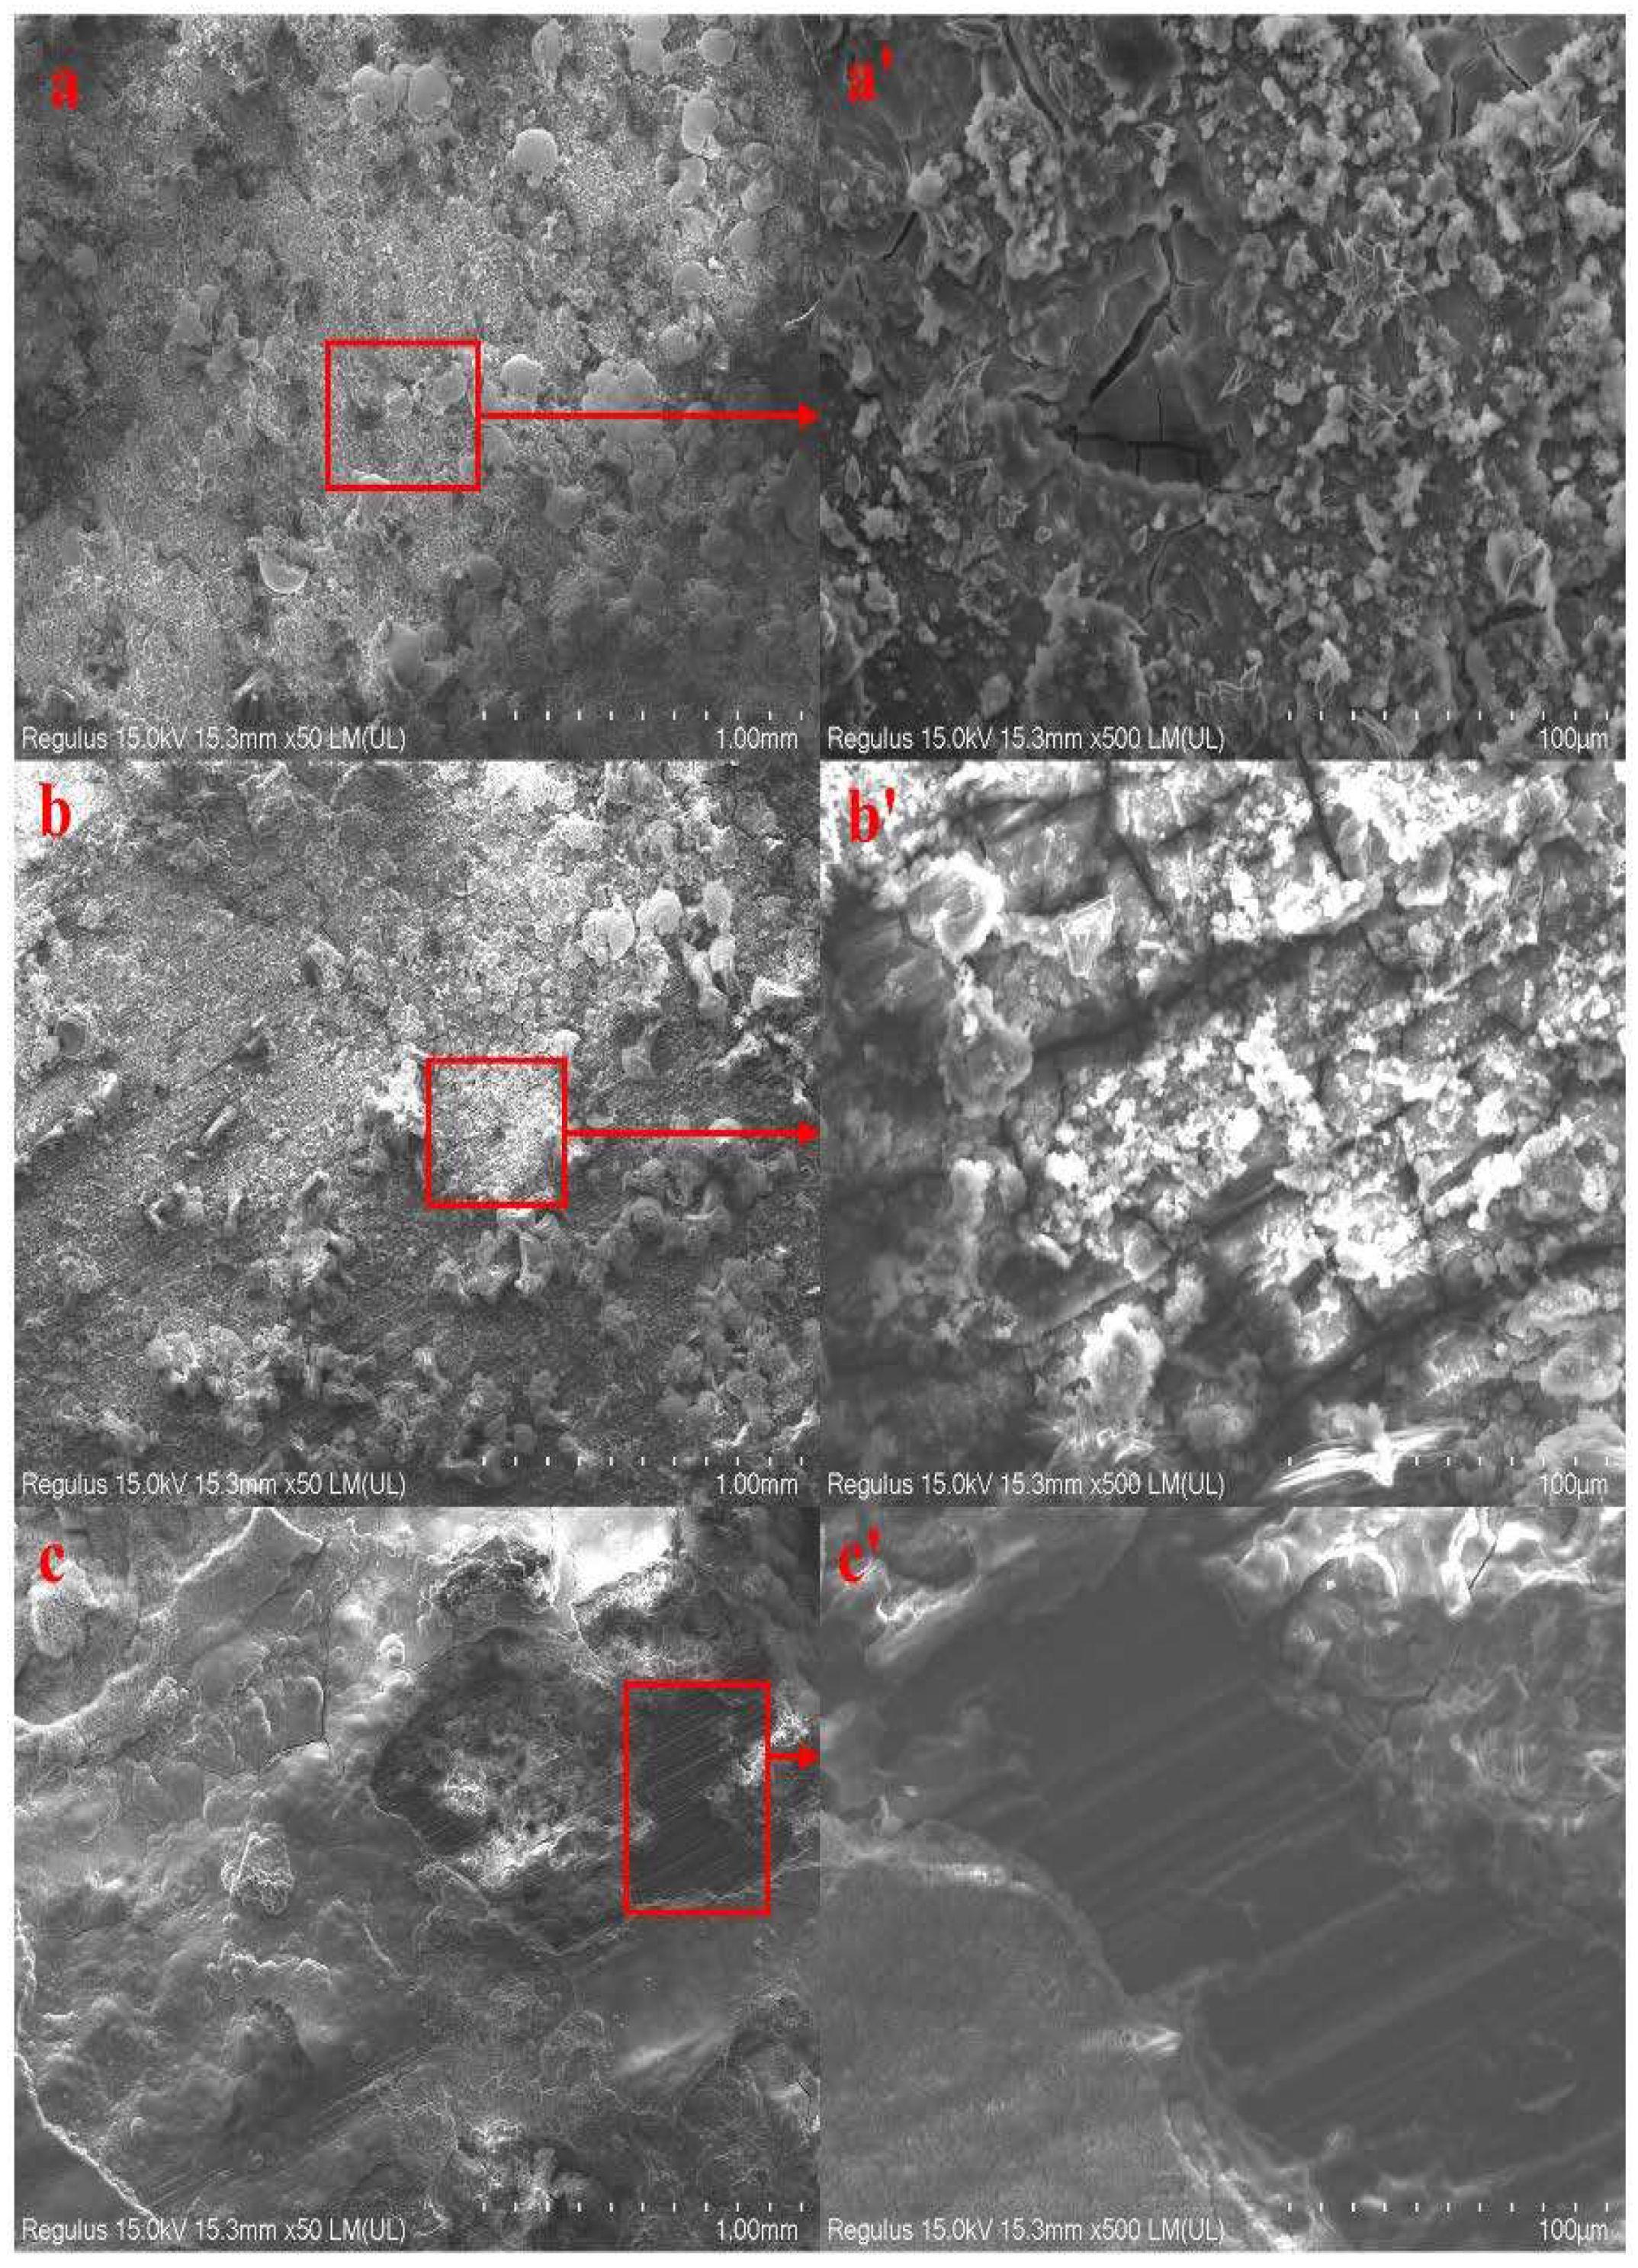
Figure 12 shows the SEM image of corrosion products on the surface of AZ31B magnesium alloy anode after incubation with seawater solution with three different concentrations of glucuronic acid for 12 d. The corrosion products in
Figure 12a' and b' are laminated on the surface of the metal matrix. In
Figure 12 c and c', the magnesium alloy matrix was exposed, indicating that the corrosion product film on the surface could not completely cover the sample surface[
25], and the alloy matrix was indeed exposed by the fall of corrosion products during the experiment.
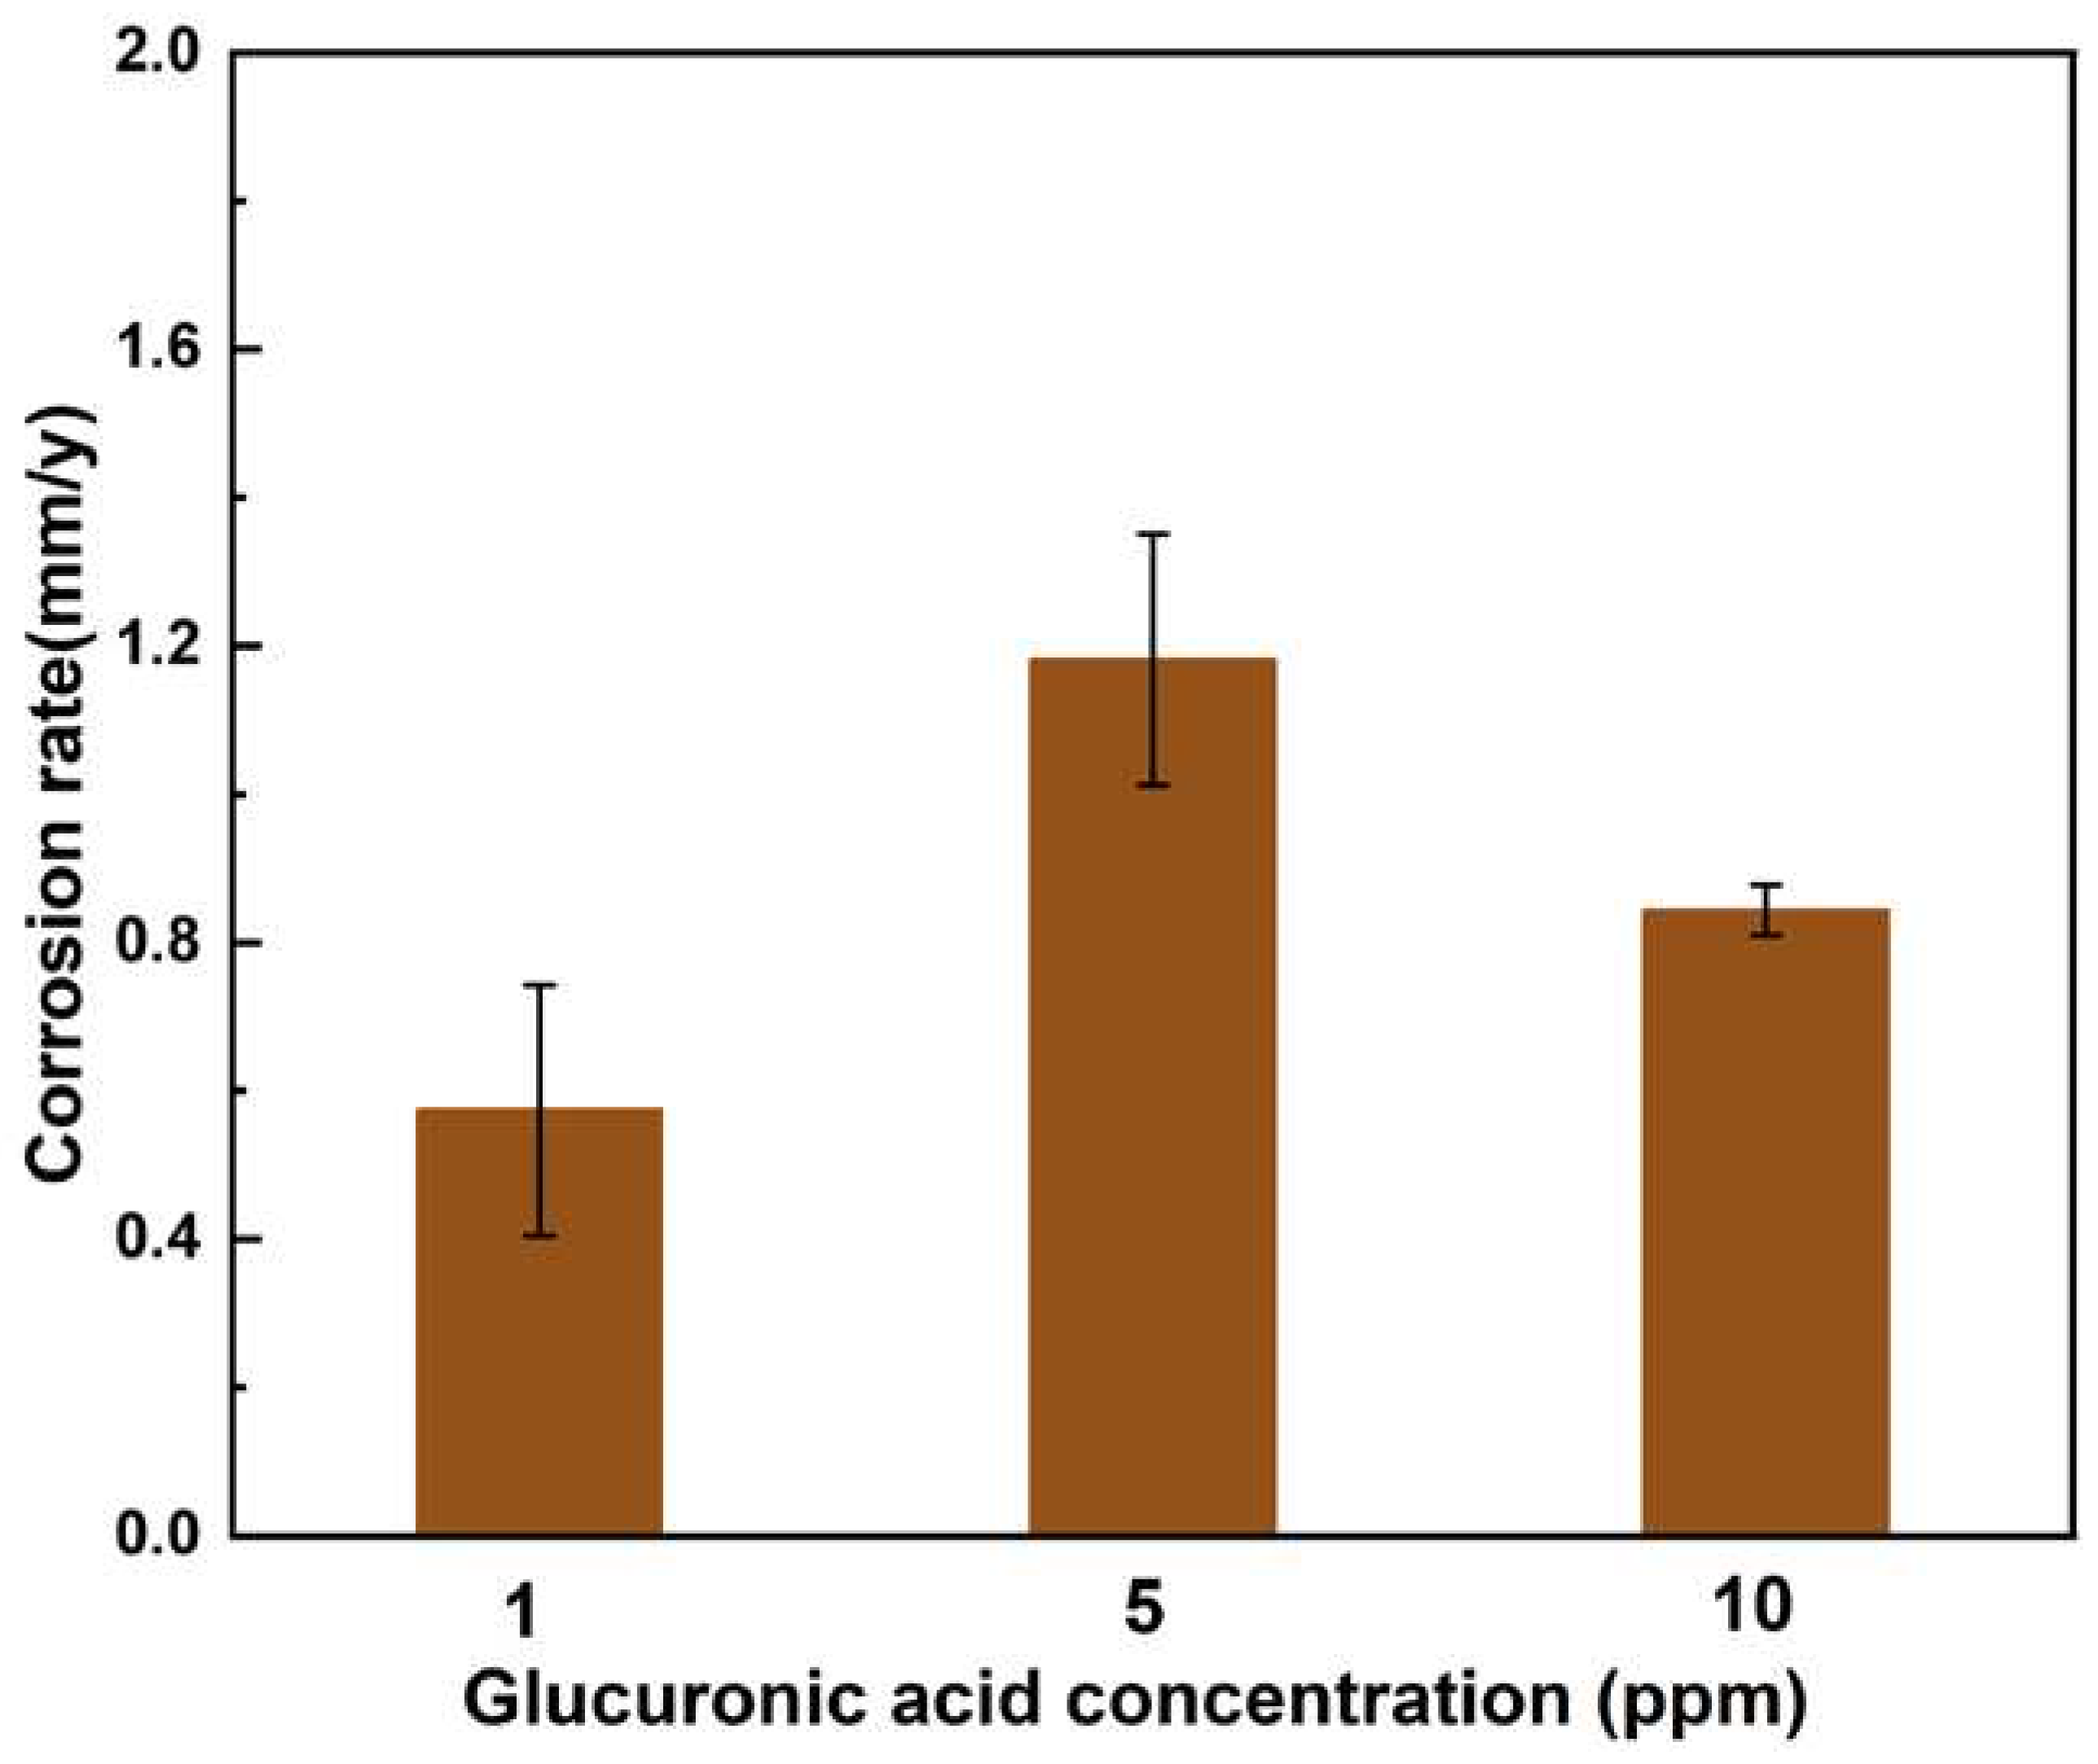
Figure 13 shows the weight loss data after a 12-day experiment in seawater solution with different concentrations of glucuronic acid. The weight loss of AZ31B magnesium anode samples in the assays with 1 ppm glucuronic acid reached the minimum value of 0.57±0.17 mm/y. The weight loss of samples in the assays with 5 ppm glucuronic acid reached the maximum value of 1.18±0.04 mm/y. With the increase in glucuronic acid concentration, the corrosion rate first increased and then decreased.
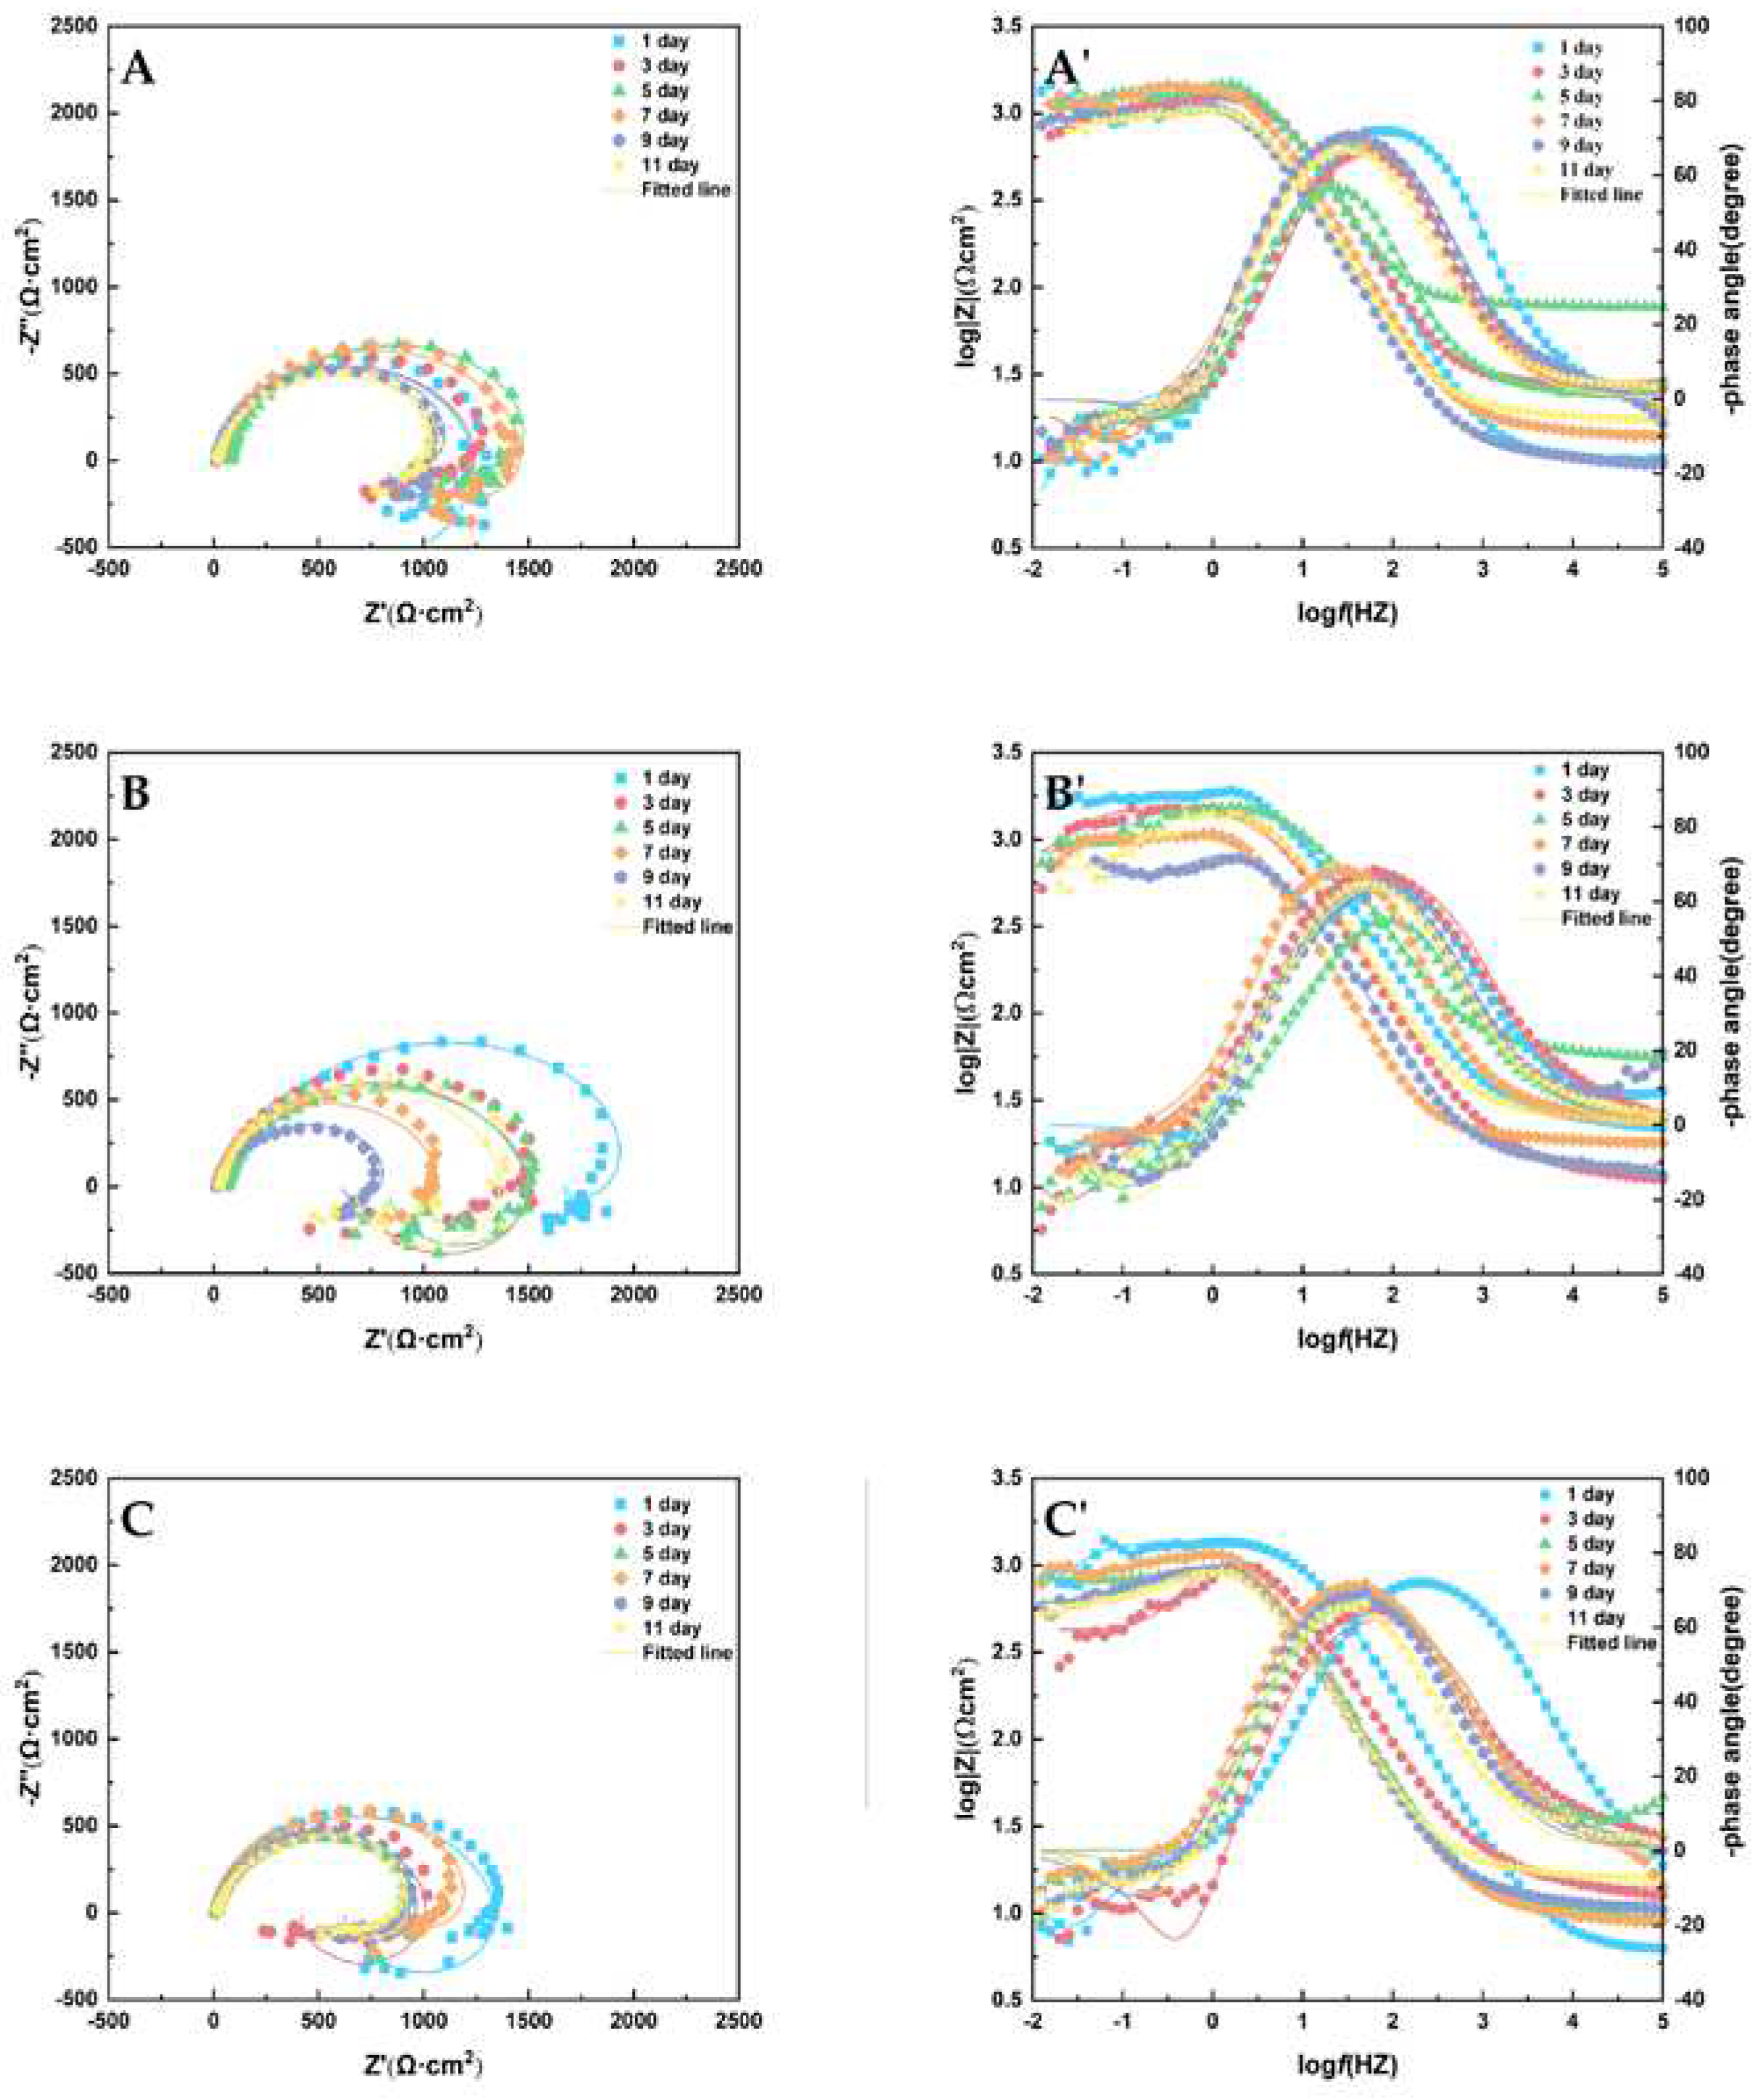
Figure 14 shows the Nyquist (A, B, C) and Porte charts (A', B', C') obtained from the tests. The equivalent circuit diagram in
Figure 15 was used to fit the impedance data obtained, and the parameter values of the circuit original in
Table 7 were obtained. The inductance in the low frequency region is represented by L
pit. The induction of the low frequency inductance is generally attributed to the adsorption and shedding of the reactants on the metal matrix surface and the pitting behavior on the matrix surface [
28].
The diameter of the capacitive reactance arc was observed in Nyquist plots with concentrations of 1 ppm and 10 ppm. It can be seen that the capacitive reactance arc diameters were similar throughout the experiment. In
Table 7, the R
ct parameters with concentrations of 1 ppm and 10 ppm slightly changed with time. When glucuronic acid was 5 ppm, the capacitive reactable arc diameter of the sample fluctuated greatly from day 1 to day 11, and corrosion products of AZ31B magnesium alloy anode were produced and dropped more frequently in seawater solution with 5 ppm glucuronic acid than in other concentrations, or caused more serious corrosion. EIS can reflect the corrosion rate of AZ31B magnesium anode in seawater solution with different concentrations of glucuronic acid during the whole experiment.
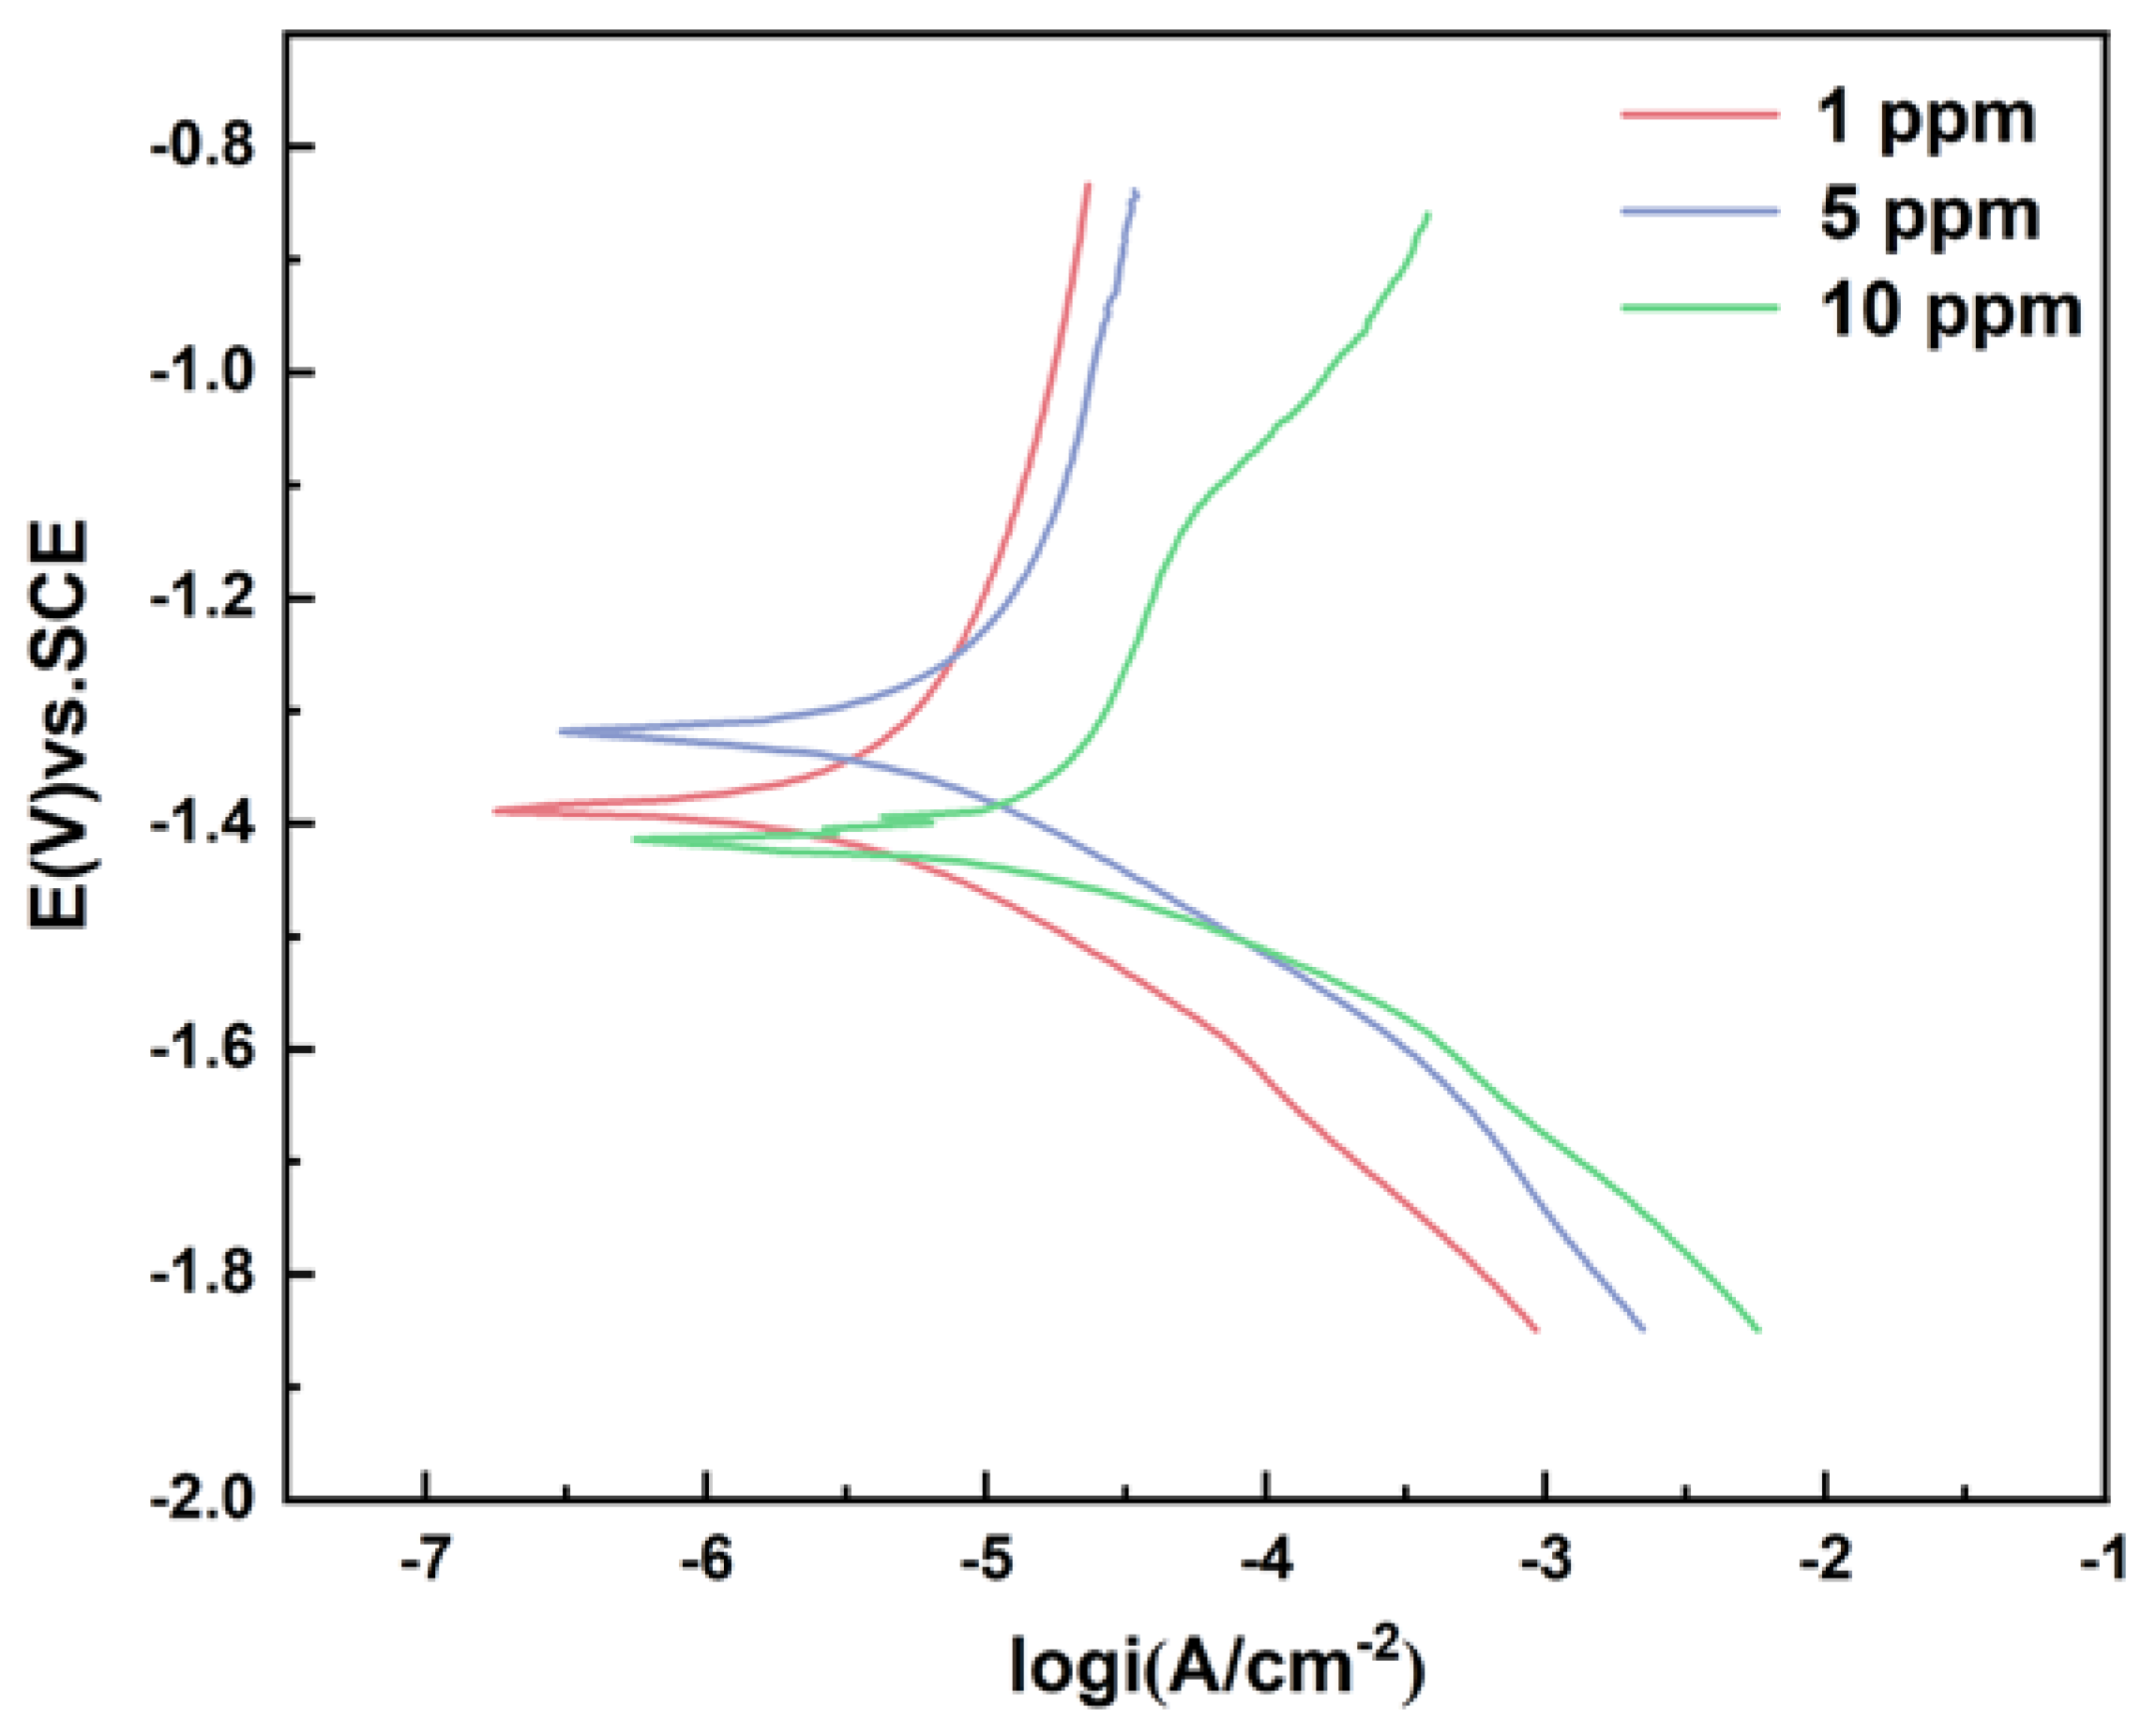
Tafel polarization curve measured on day 12 is shown in
Figure 16.
Table 8 shows the parameter analysis of Tafel curve. The test results show that the corrosion current density was minimal when the glucose concentration was 1 ppm and maximum when the glucose was 5 ppm. The results of current density were consistent with the experimental results of weight loss.
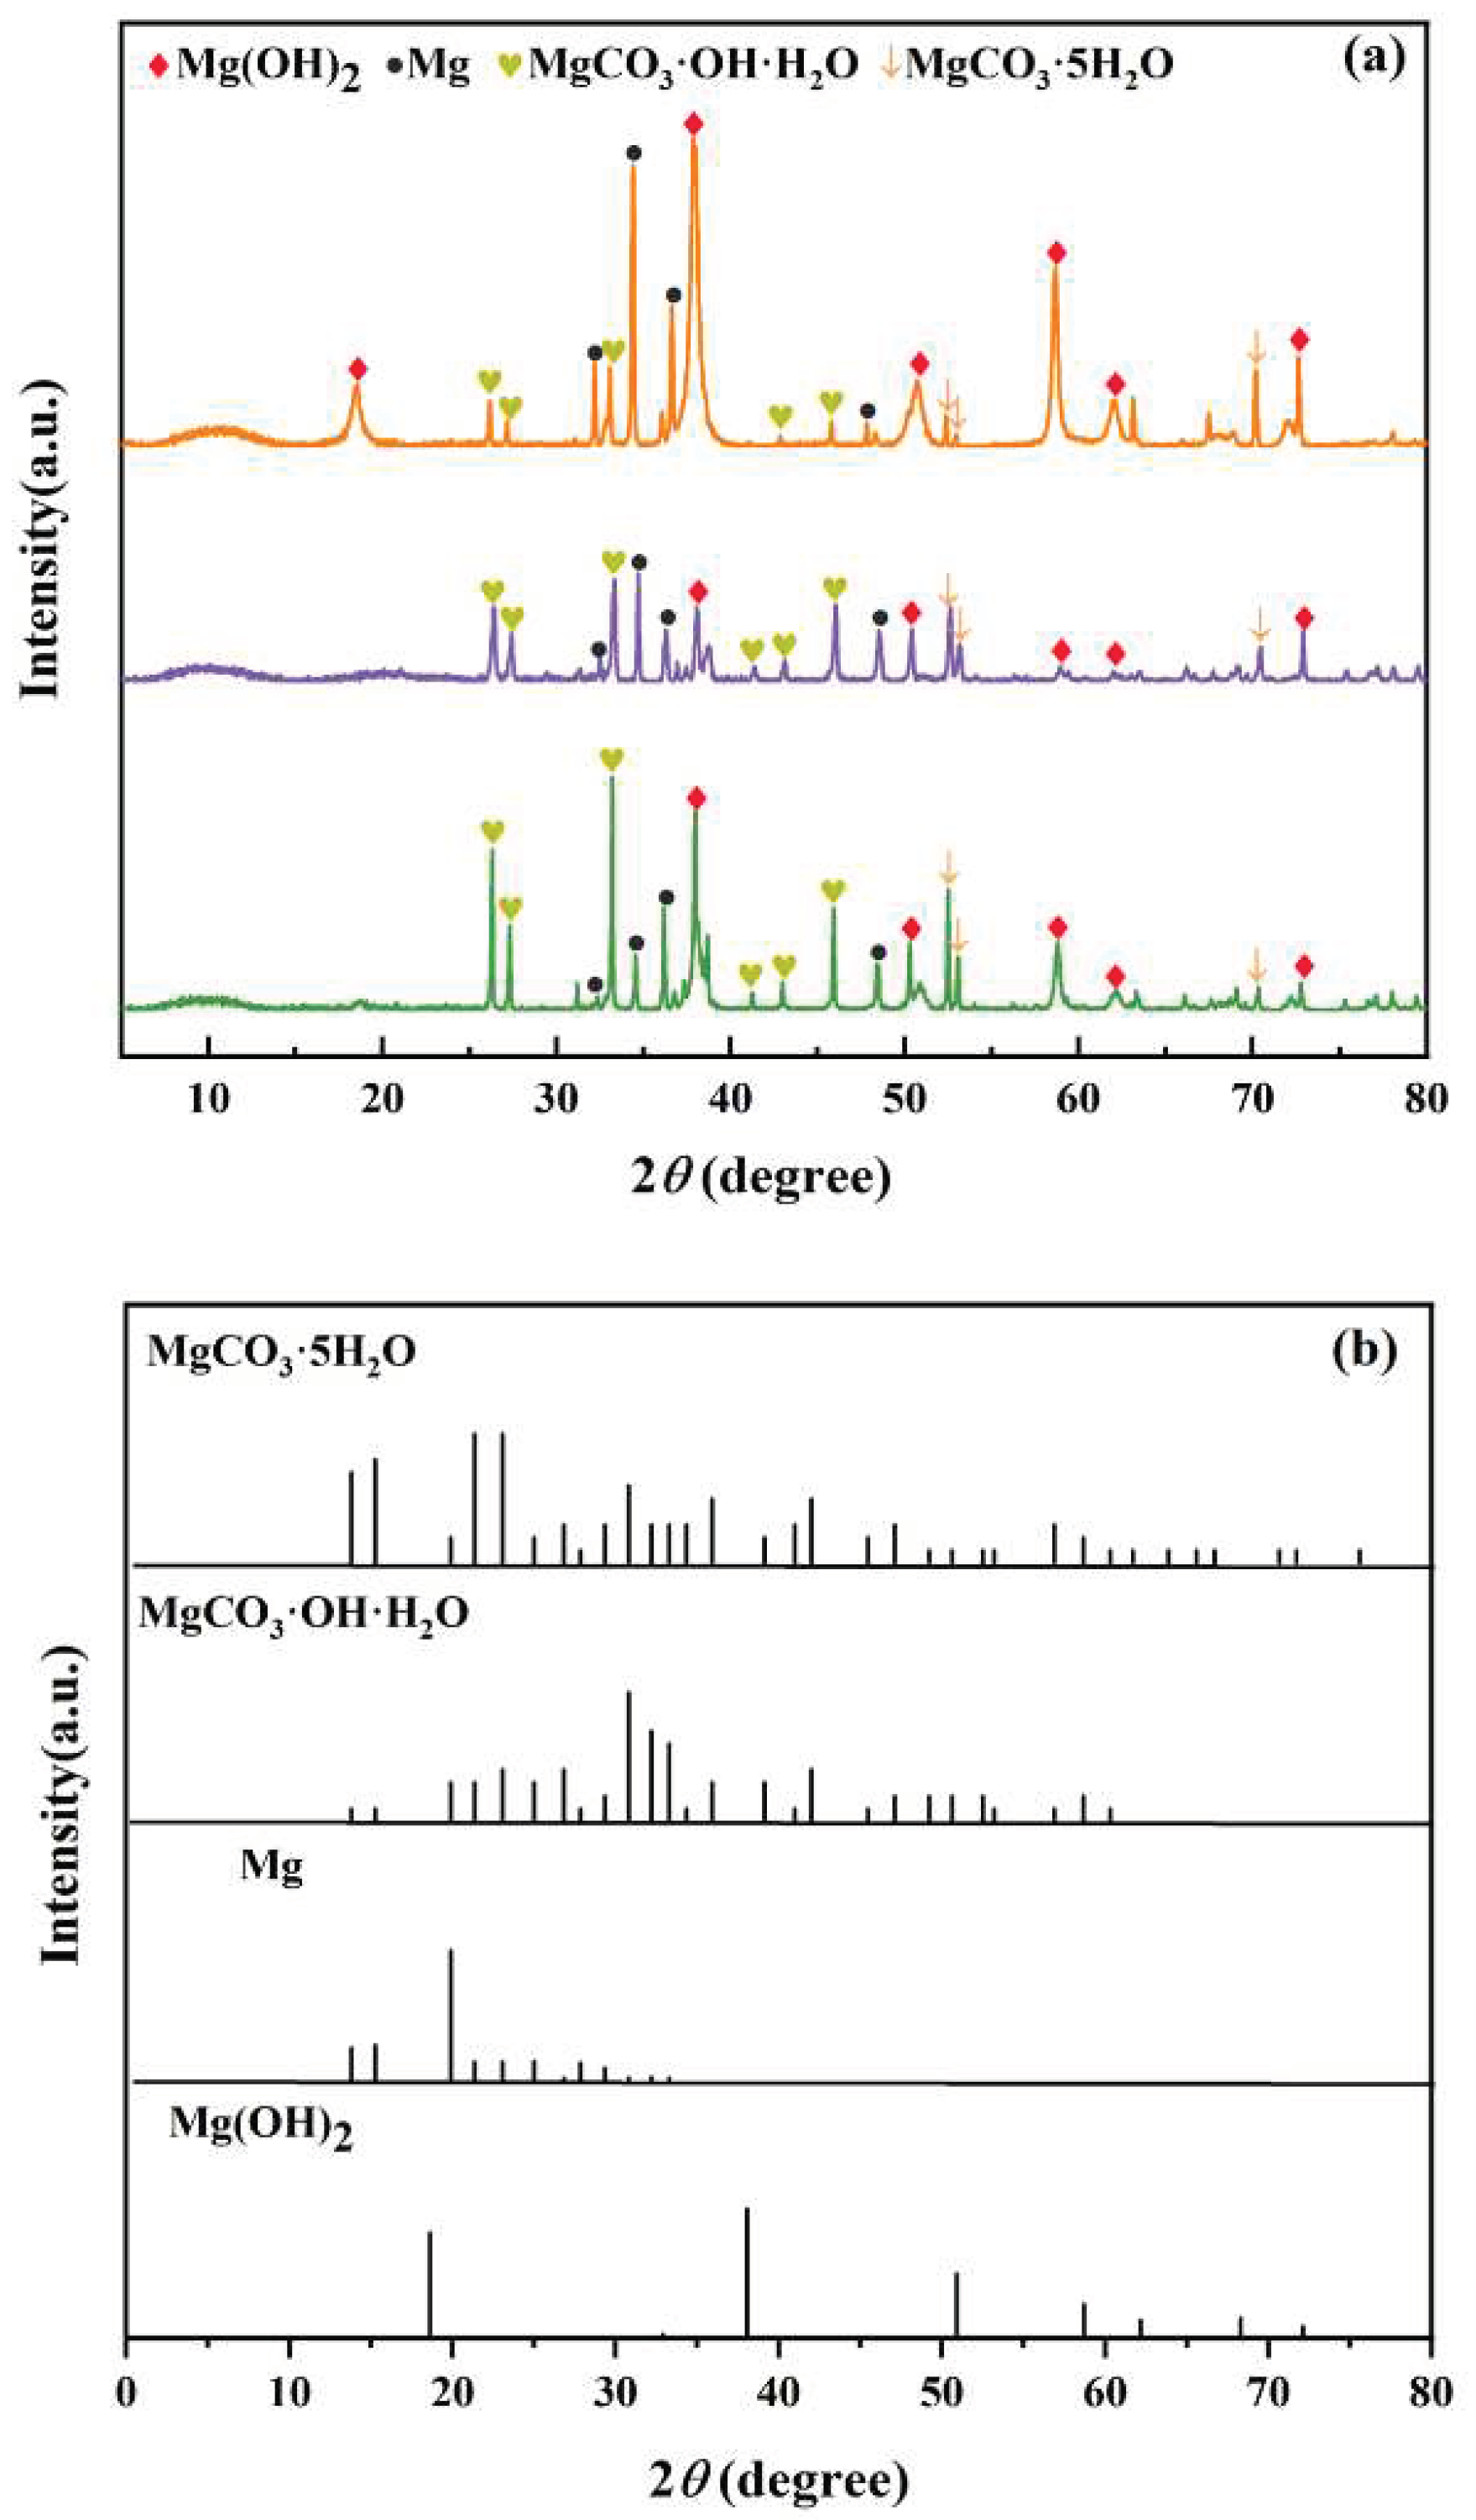
The test samples immersed in seawater solution with a 10 ppm concentration of three metabolites were taken for an XRD test, and the results are shown in
Figure 17. Among the three metabolites, the composition of the produced corrosion products was similar, mainly Mg(OH)
2 and MgCO
3·OH·H
2O. Mg(OH)
2 is widely reported as a corrosion product of magnesium alloy magnesite[
29]. MgCO
3·OH·H
2O and MgCO
3·5H
2O were detected because the experiments were conducted in an aerobic environment, in which Mg(OH)
2 was easy to absorb carbon dioxide in the air and generate basic carbonates[
30]. The detection of Mg in the XRD pattern confirmed that the corrosion product film could not cover the metal surface well, and part of the anode metal surface of AZ31B magnesium alloy was directly exposed.
The crystallinity of the corrosion products was proportional to the thickness and the peak strength of the XRD pattern. The peak value of the main corrosion products and the peak value of the magnesium group in the glucuronic acid solution are higher than those in the other two metabolites. This is similar to the result of the weight loss experiment: the corrosion rate of magnesium alloy is faster in glucuronic acid solution.
4. Conclusions
By testing and analyzing the corrosion of AZ31B magnesium alloy anode samples in different metabolites of SRP, the following conclusions can be drawn:
(1) At the beginning of the experiment, the corrosion product film initially generated can hinder the corrosion reaction to a certain extent, but the corrosion product layer attached to the sample surface is not dense and cannot provide effective protection for the metal with the extension of time. In addition, the magnesium alloy matrix will be exposed during the experiment, which will aggravate the corrosion.
(2) The corrosion rate fluctuates with the increase in the concentration of glucuronic acid. In glucuronic acid seawater solution, the corrosion rate increases with the increase of the concentration. Compared with the three organic metabolites, the corrosion rate of AZ31B magnesium alloy anode material in glucuronic acid seawater solution is the fastest.
The metabolites of different components of SRP can accelerate the corrosion of magnesium alloy anode, and even trace organic metabolites can promote the corrosion. Therefore, in the actual engineering operation, after sterilization by physical or chemical methods, the residual metabolites of bacteria should be removed by effective means in time to prevent further corrosion. It is worth noting that we only studied the effects of different organic products on magnesium alloy, and the synergistic effect of various metabolites produced by SRP in the corrosion process of magnesium alloy is also worth considering, which can be carried out in the subsequent research.
Author Contributions
Conceptualization, R.Z. and J.Z.; methodology, J.L.; software, J.D. and B.H.; validation, J.L., J.Z.; formal analysis, Z.H.;organic metabolites analysis, J.L. and J.Z.; investigation, J.L.; resources, J.D. and J.Z.; data curation, J.D. and J.Z.; writing—original draft preparation, J.L. and J.Z.; writing—review and editing, R.Z., K.M. and W.S.; visualization, J.L.; supervision, R.Z., J. D. and J. Z.; project administration, J.Z.; funding acquisition, R.Z. and J.Z. All authors have read and agreed to the published version of the manuscript.
Funding
This research was funded by the National Natural Science Foundation of China (No. 42076043) and the Major Basic Research Project of Natural Science Foundation of Shandong Province (ZR2023ZD31).
Data Availability Statement
We encourage all authors of articles published in MDPI journals to share their research data. In this section, please provide details regarding where data supporting reported results can be found, including links to publicly archived datasets analyzed or generated during the study. Where no new data were created, or where data is unavailable due to privacy or ethical restrictions, a statement is still required. Suggested Data Availability Statements are available in section “MDPI Research Data Policies” at
https://www.mdpi.com/ethics.
Conflicts of Interest
The authors declare no conflict of interest.
References
- B.W.A. Sherar, I.M. Power, P.G. Keech, S. Mitlin, G. Southam, D.W. Shoesmith, Characterizing the effect of carbon steel exposure in sulfide containing solutions to microbially induced corrosion, Corrosion Science, 53 (2011) 955-960.
- J.J. Wu, D. Zhang, P. Wang, Y. Cheng, S.M. Sun, Y. Sun, S.Q. Chen, The influence of Desulfovibrio sp and Pseudoalteromonas sp on the corrosion of Q235 carbon steel in natural seawater, Corrosion Science, 112 (2016) 552-562.
- X.J. Yang, J.M. Shao, Z.Y. Liu, D.W. Zhang, L.Y. Cui, C.W. Du, X.G. Li, Stress-assisted microbiologically influenced corrosion mechanism of 2205 duplex stainless steel caused by sulfate-reducing bacteria, Corrosion Science, 173 (2020) 18.
- T.Y. Gu, D. Wang, Y. Lekbach, D.K. Xu, Extracellular electron transfer in microbial biocorrosion, Curr. Opin. Electrochem., 29 (2021) 7.
- D.Z. Yang, Y.H. Lei, J. Xie, Z.T. Shu, X.W. Zheng, The microbial corrosion behaviour of Ni-P plating by sulfate-reducing bacteria biofouling in seawater, Mater. Technol., 34 (2019) 444-454.
- Y.C. Li, D.K. Xu, C.F. Chen, X.G. Li, R. Jia, D.W. Zhang, W. Sand, F.H. Wang, T.Y. Gu, Anaerobic microbiologically influenced corrosion mechanisms interpreted using bioenergetics and bioelectrochemistry: A review, J. Mater. Sci. Technol., 34 (2018) 1713-1718.
- J. Yang, Z.B. Wang, Y.X. Qiao, Y.G. Zheng, Synergistic effects of deposits and sulfate reducing bacteria on the corrosion of carbon steel, Corrosion Science, 199 (2022) 11.
- Y. Lekbach, T. Liu, Y.C. Li, M. Moradi, W.W. Dou, D.K. Xu, J.A. Smith, D.R. Lovley, Microbial corrosion of metals: The corrosion microbiome, in: R.K. Poole, D.J. Kelly (Eds.) Advances in Microbial Physiology, Vol 78, Academic Press Ltd-Elsevier Science Ltd, London, 2021, pp. 317-390.
- M.R. Saeri, A. Keyvani, Optimization of Manganese and Magnesium Contents in As-cast Aluminum-Zinc-Indium Alloy as Sacrificial Anode, J. Mater. Sci. Technol., 27 (2011) 785-792.
- D.Z. Tang, Y.X. Du, X.X. Li, Y. Liang, M.X. Lu, Effect of alternating current on the performance of magnesium sacrificial anode, Mater. Des., 93 (2016) 133-145.
- F.Y. Cao, G.L. Song, A. Atrens, Corrosion and passivation of magnesium alloys, Corrosion Science, 111 (2016) 835-845.
- J. Genesca, C. Rodriguez, J. Juarez, B. Campillo, L. Martinez, Assessing and improving current efficiency in magnesium base sacrificial anodes by microstructure control, Corros. Rev., 16 (1998) 95-125.
- J.A. Juarezislas, J. Genesca, R. Perez, IMPROVING THE EFFICIENCY OF MAGNESIUM SACRIFICIAL ANODES, JOM-J. Miner. Met. Mater. Soc., 45 (1993) 42-44.
- X. Lan, J. Zhang, Z.F. Wang, R.Y. Zhang, W. Sand, L. Zhang, J.Z. Duan, Q.J. Zhu, B.R. Hou, Corrosion of an AZ31B Magnesium Alloy by Sulfate-Reducing Prokaryotes in a Mudflat Environment, Microorganisms, 10 (2022) 12.
- J.Y. Zhu, C.X. Jia, Y.Z. Duan, Study on Corrosion Resistance of Alkali-Heat Modified Magnesium Alloy Surface, Met. Mater.-Int., 14.
- R. Gu, J. Shen, Q. Hao, J.H. Wang, D. Li, L. Hu, H. Chen, Harnessing superhydrophobic coatings for enhancing the surface corrosion resistance of magnesium alloys, J. Mat. Chem. B, 9 (2021) 9893-9899.
- G.Z. Yang, H.W. Yang, L. Shi, T.L. Wang, W.C. Zhou, T. Zhou, W. Han, Z.Y. Zhang, W. Lu, J.Z. Hu, Enhancing Corrosion Resistance, Osteoinduction, and Antibacterial Properties by Zn/Sr Additional Surface Modification of Magnesium Alloy, ACS Biomater. Sci. Eng., 4 (2018) 4289-4298.
- W.W. Dou, R. Jia, P. Jin, J.L. Liu, S.G. Chen, T.Y. Gu, Investigation of the mechanism and characteristics of copper corrosion by sulfate reducing bacteria, Corrosion Science, 144 (2018) 237-248.
- F.S. Li, M.Z. An, G.Z. Liu, D.X. Duan, Effects of sulfidation of passive film in the presence of SRB on the pitting corrosion behaviors of stainless steels, Materials Chemistry and Physics, 113 (2009) 971-976.
- S.Q. Chen, D. Zhang, Study of corrosion behavior of copper in 3.5 wt.% NaCl solution containing extracellular polymeric substances of an aerotolerant sulphate-reducing bacteria, Corrosion Science, 136 (2018) 275-284.
- Y. Wan, D. Zhang, H.Q. Liu, Y.J. Li, B.R. Hou, Influence of sulphate-reducing bacteria on environmental parameters and marine corrosion behavior of Q235 steel in aerobic conditions, Electrochimica Acta, 55 (2010) 1528-1534.
- A.V. Vitaller, U.M. Angst, B. Elsener, A setup for electrochemical corrosion testing at elevated temperature and pressure, Measurement, 155 (2020) 11.
- Q. Jin, G.Y. Tian, J.X. Li, Y. Zhao, H. Yan, The study on corrosion resistance of superhydrophobic magnesium hydroxide coating on AZ31B magnesium alloy, Colloid Surf. A-Physicochem. Eng. Asp., 577 (2019) 8-16.
- J.S. Liao, M. Hotta, Corrosion products of field-exposed Mg-Al series magnesium alloys, Corrosion Science, 112 (2016) 276-288.
- W.W. Dou, J.L. Liu, W.Z. Cai, D. Wang, R. Jia, S.G. Chen, T.Y. Gu, Electrochemical investigation of increased carbon steel corrosion via extracellular electron transfer by a sulfate reducing bacterium under carbon source starvation, Corrosion Science, 150 (2019) 258-267.
- H. Aghamohammadi, S.J. Hosseinipour, S.M. Rabiee, R. Jamaati, Influence of Crystallographic Texture on the Corrosion Product Morphology and Corrosion Rate of AZ31 Plate in Simulated Body Fluid, J. Mater. Eng. Perform., 29 (2020) 3824-3830.
- J. Stoulil, T. Prosek, A. Nazarov, J. Oswald, P. Kriz, D. Thierry, Electrochemical properties of corrosion products formed on Zn-Mg, Zn-Al and Zn-Al-Mg coatings in model atmospheric conditions, Mater. Corros., 66 (2015) 777-782.
- W.C. Xu, B.B. Zhang, Y. Deng, L.H. Yang, J. Zhang, Nitrate on localized corrosion of carbon steel and stainless steel in aqueous solutions, Electrochimica Acta, 369 (2021) 13.
- X.T. Wu, H.L. Huang, H. Liu, J. Hu, K. Wu, J.X. Wei, Q.J. Yu, A new self-healing agent for accelerating the healing kinetics while simultaneously binding seawater ions in cracked cement paste, Mater. Lett., 283 (2021) 4.
- C. Sierra, S. Chouinard, L.C. Pasquier, G. Mercier, J.F. Blais, Feasibility Study on the Utilization of Serpentine Residues for Mg(OH)(2) Production, Waste Biomass Valorization, 9 (2018) 1921-1933.
Figure 2.
SEM images of AZ31B magnesium alloy immersed in the seawater solution with different concentrations of mannose: 1 ppm (a), 5 ppm (b), 10 ppm (c).
Figure 2.
SEM images of AZ31B magnesium alloy immersed in the seawater solution with different concentrations of mannose: 1 ppm (a), 5 ppm (b), 10 ppm (c).
Figure 3.
Weight loss of AZ31B magnesium alloy anode material after 12 d of incubation in seawater solution with different concentrations of mannose.
Figure 3.
Weight loss of AZ31B magnesium alloy anode material after 12 d of incubation in seawater solution with different concentrations of mannose.
Figure 4.
Nyquist (A), (B), (C) and Bode (A'), (B'), (C') plots of AZ31B magnesium alloy anode measured in seawater solution with mannose at 1 ppm (A), 5 ppm (B) and 10 ppm (C) for 11 d.
Figure 4.
Nyquist (A), (B), (C) and Bode (A'), (B'), (C') plots of AZ31B magnesium alloy anode measured in seawater solution with mannose at 1 ppm (A), 5 ppm (B) and 10 ppm (C) for 11 d.
Figure 5.
Fitted equivalent circuit for EIS data in Fig. 4. (a): 1 ppm and 5 ppm from day 1 to day 11, 10 ppm from day 1 to day 3; (b): 10 ppm from day 3 to day 11.
Figure 5.
Fitted equivalent circuit for EIS data in Fig. 4. (a): 1 ppm and 5 ppm from day 1 to day 11, 10 ppm from day 1 to day 3; (b): 10 ppm from day 3 to day 11.
Figure 6.
Potentiodynamic polarization curves of AZ31B magnesium alloy anode samples after 12-day immersion in the seawater solution with different concentrations of mannose.
Figure 6.
Potentiodynamic polarization curves of AZ31B magnesium alloy anode samples after 12-day immersion in the seawater solution with different concentrations of mannose.
Figure 7.
SEM images of AZ31B magnesium alloy immersed in seawater solution with different concentrations of glucose: 1 ppm (a), 5 ppm (b), 10 ppm (c). a', b', and c' correspond to the framed area in higher magnification.
Figure 7.
SEM images of AZ31B magnesium alloy immersed in seawater solution with different concentrations of glucose: 1 ppm (a), 5 ppm (b), 10 ppm (c). a', b', and c' correspond to the framed area in higher magnification.
Figure 8.
Weight loss data of AZ31B magnesium alloy anode material after 12 d of weight loss experiment in seawater solution with different concentrations of glucose.
Figure 8.
Weight loss data of AZ31B magnesium alloy anode material after 12 d of weight loss experiment in seawater solution with different concentrations of glucose.
Figure 9.
Nyquist (A), (B), (C) and Bode (A'), (B'), (C') plots of AZ31B magnesium alloy anode measured in seawater solution with 1 ppm (A), 5 ppm (B) and 10 ppm (C) glucose for 11 d.
Figure 9.
Nyquist (A), (B), (C) and Bode (A'), (B'), (C') plots of AZ31B magnesium alloy anode measured in seawater solution with 1 ppm (A), 5 ppm (B) and 10 ppm (C) glucose for 11 d.
Figure 10.
Equivalent circuits simulating experimental impedance diagrams in
Figure 9.
Figure 10.
Equivalent circuits simulating experimental impedance diagrams in
Figure 9.
Figure 11.
Potentiodynamic polarization curves of AZ31B magnesium alloy anode soaked in seawater solution with different concentrations of glucose for 12 d.
Figure 11.
Potentiodynamic polarization curves of AZ31B magnesium alloy anode soaked in seawater solution with different concentrations of glucose for 12 d.
Figure 12.
SEM images of AZ31B magnesium alloy immersed in seawater solution with different concentrations of glucuronic acid: 1 ppm (a), 5 ppm (b), and 10 ppm (c).
Figure 12.
SEM images of AZ31B magnesium alloy immersed in seawater solution with different concentrations of glucuronic acid: 1 ppm (a), 5 ppm (b), and 10 ppm (c).
Figure 13.
Weight loss data of AZ31B magnesium alloy anode after 12 d of immersion in seawater solution with different concentrations of glucuronic acid.
Figure 13.
Weight loss data of AZ31B magnesium alloy anode after 12 d of immersion in seawater solution with different concentrations of glucuronic acid.
Figure 14.
Nyquist (A), (B), (C) and Bode (A'), (B'), (C') plots of AZ31B magnesium alloy anode measured in seawater solution with different concentrations glucuronic acid for 11 d: 1 ppm (A), 5 ppm (B) and 10 ppm (C).
Figure 14.
Nyquist (A), (B), (C) and Bode (A'), (B'), (C') plots of AZ31B magnesium alloy anode measured in seawater solution with different concentrations glucuronic acid for 11 d: 1 ppm (A), 5 ppm (B) and 10 ppm (C).
Figure 15.
Equivalent circuits simulating experimental impedance diagrams in
Figure 14.
Figure 15.
Equivalent circuits simulating experimental impedance diagrams in
Figure 14.
Figure 16.
Potentiodynamic polarization curves of AZ31B magnesium alloy anode samples after 12-day immersion in the seawater solution with different concentrations of glucuronic acid.
Figure 16.
Potentiodynamic polarization curves of AZ31B magnesium alloy anode samples after 12-day immersion in the seawater solution with different concentrations of glucuronic acid.
Figure 17.
XRD patterns and corresponding standard peaks of corrosion products on the sample surface after 12 d immersion in seawater solution with different concentrations of organic metabolites.
Figure 17.
XRD patterns and corresponding standard peaks of corrosion products on the sample surface after 12 d immersion in seawater solution with different concentrations of organic metabolites.
Table 1.
The chemical composition of AZ31B Mg alloy sacrificial anodes (wt.%).
Table 1.
The chemical composition of AZ31B Mg alloy sacrificial anodes (wt.%).
| Composition |
Al |
Be |
Si |
Ca |
Zn |
Mn |
Cu |
Fe |
Ce |
Mg |
| AZ31B |
3.19 |
0.100 |
0.020 |
0.040 |
0.810 |
0.334 |
0.050 |
0.005 |
- |
95.5 |
Table 3.
EIS fitting parameters in seawater solution with mannose at 1 ppm, 5 ppm, and 10 ppm for 11 d.
Table 3.
EIS fitting parameters in seawater solution with mannose at 1 ppm, 5 ppm, and 10 ppm for 11 d.
Time
(d) |
Rsol
(Ω cm2) |
Qct
(Ω−1 cm−2sn) |
n |
Rct
(Ω cm2) |
Lpit
(H·cm2) |
Rpit
(Ω cm2) |
| 1 ppm |
|
|
|
|
|
|
| 1 |
4.57 |
6.43×10⁻⁵
|
0.93 |
2.59×10²
|
3.51×10³
|
48.9 |
| 3 |
5.04 |
4.23×10⁻⁵
|
0.89 |
9.24×10²
|
2.19×10⁴
|
1.48×10²
|
| 5 |
27.0 |
4.69×10⁻⁵
|
0.89 |
1.19×10³
|
7.76×10³
|
1.13×10²
|
| 7 |
27.1 |
5.84×10⁻⁵
|
0.76 |
2.59×10³
|
1.56×10³
|
2.23×10³
|
| 9 |
23.1 |
5.82×10⁻⁵
|
0.77 |
2.74×10³
|
1.11×10³
|
5.96×10³
|
| 11 |
38.5 |
4.49×10⁻⁵
|
0.82 |
2.47×10³
|
3.12×10³
|
3.55×10³
|
| 5 ppm |
|
|
|
|
|
|
| 1 |
7.05 |
2.20×10⁻⁵
|
0.88 |
1.16×10³
|
5.89×10²
|
2.58×10²
|
| 3 |
9.43 |
2.79×10⁻⁵
|
0.79 |
2.71×10³
|
5.92×10²
|
4.46×10³
|
| 5 |
27.3 |
2.78×10⁻⁵
|
0.74 |
5.25×10³
|
1.03×10³
|
5.61×10³
|
| 7 |
42.9 |
2.08×10⁻⁵
|
0.70 |
5.68×10³
|
1.78×10⁵
|
6.35×10³
|
| 9 |
64 |
2.51×10⁻⁵
|
0.66 |
3.31×10³
|
1.10×10³
|
4.48×10²
|
| 11 |
47.7 |
1.87×10⁻⁵
|
0.68 |
5.13×10³
|
2.34×10²
|
4.17×10³
|
| 10 ppm |
|
|
|
|
|
|
| 5 |
5.11 |
1.87×10⁻⁵
|
0.86 |
2.12×10³
|
1.04×10²
|
3.20×10³
|
| 7 |
8.04 |
4.41×10⁻⁵
|
0.83 |
1.44×10³
|
2.75×10³
|
3.21×10²
|
| 9 |
80.8 |
3.64×10⁻⁵
|
0.88 |
1.96×10³
|
2.84×10⁴
|
4.85×10³
|
| 11 |
70.6 |
3.65×10⁻⁵
|
0.90 |
2.48×10³
|
1.75×10⁵
|
5.80×10³
|
Table 4.
The fitted data of the mannose Tafel polarization curve.
Table 4.
The fitted data of the mannose Tafel polarization curve.
| Concentration |
icorr (Acm-2) |
Ecorr(V)vs.SCE |
βa(mv/decade) |
βc(mv/decade) |
| 1 ppm |
3.66×10⁻⁶
|
-1.37 |
568.3 |
-187.5 |
| 5 ppm |
3.09×10⁻⁶
|
-1.39 |
215.1 |
-169.5 |
| 10 ppm |
6.61×10⁻⁶
|
-1.38 |
683.8 |
-218.8 |
Table 5.
EIS fitting parameters in seawater solution with glucose at 1 ppm, 5 ppm, and 10 ppm.
Table 5.
EIS fitting parameters in seawater solution with glucose at 1 ppm, 5 ppm, and 10 ppm.
Time
(d) |
Rsol
(Ω cm2) |
Qct
(Ω−1 cm−2sn) |
n |
Rct
(Ω cm2) |
L1
(H·cm2) |
R1
(Ω cm2) |
L2
(H·cm2) |
R2
(Ω cm2) |
| 1 ppm |
|
|
|
|
|
|
|
| 1 |
49.1 |
5.87×10⁻⁵
|
0.75 |
3.69×10³
|
5.49×10²
|
4.43×10³
|
6.09×10³
|
7.46×10²
|
| 3 |
7.94 |
6.11×10⁻⁵
|
0.80 |
1.24×10³
|
3.06×10²
|
1.91×10²
|
4.64×10³
|
5.62×10²
|
| 5 |
22.0 |
3.11×10⁻⁵
|
0.81 |
1.06×10³
|
2.98×10³
|
2.97×10³
|
1.43×10³
|
2.38×10³
|
| 7 |
25.9 |
2.93×10⁻⁵
|
0.84 |
2.19×10³
|
9.01×10³
|
1.49×10³
|
2.16×10³
|
4.30×10³
|
| 9 |
30.9 |
4.72×10⁻⁵
|
0.78 |
3.47×10³
|
2.71×10⁴
|
4.93×10³
|
7.94×10²
|
3.84×10³
|
| 11 |
38.5 |
5.15×10⁻⁵
|
0.77 |
3.29×10³
|
7.24×10⁴
|
4.09×10²
|
1.16×10³
|
4.71×10³
|
| 5 ppm |
|
|
|
|
|
|
|
| 1 |
5.26 |
2.03×10⁻⁵
|
0.88 |
1.39×10³
|
2.50×10⁵
|
6.18×10³
|
2.97×10³
|
3.87×10²
|
| 3 |
9.28 |
5.33×10⁻⁵
|
0.85 |
1.01×10³
|
1.15×10⁵
|
7.13×10²
|
5.03×10³
|
2.30×10³
|
| 5 |
7.82 |
6.38×10⁻⁵
|
0.84 |
1.09×10³
|
5.92×10²
|
1.91×10³
|
1.32×10⁵
|
9.54×10²
|
| 7 |
6.95 |
8.39×10⁻⁵
|
0.85 |
7.31×10²
|
8.41×10³
|
7.91×10²
|
1.99×10³
|
1.27×10³
|
| 9 |
9.48 |
7.96×10⁻⁵
|
0.84 |
1.06×10³
|
2.82×10⁵
|
4.91×10²
|
3.24×10⁵
|
1.83×10³
|
| 11 |
9.76 |
9.77×10⁻⁵
|
0.84 |
8.14×10²
|
1.16×10⁵
|
1.27×10³
|
2.90×10²
|
1.23×10³
|
| 10 ppm |
|
|
|
|
|
|
|
| 1 |
10.1 |
8.11×10⁻⁵
|
0.84 |
1.20×10³
|
2.65×10⁵
|
1.47×10⁵
|
5.44×10²
|
1.41×10³
|
| 3 |
34.2 |
4.27×10⁻⁶
|
0.83 |
9.09×10²
|
4.69×10³
|
5.40×10²
|
4.44×10²
|
1.94×10³
|
| 5 |
7.32 |
6.65×10⁻⁵
|
0.82 |
8.81×10²
|
1.31×10⁵
|
7.38×10²
|
2.51×10²
|
2.05×10²
|
| 7 |
5.79 |
7.15×10⁻⁵
|
0.83 |
7.28×10²
|
1.39×10³
|
1.76×10²
|
3.55×10²
|
1.46×10³
|
| 9 |
8.39 |
8.35×10⁻⁵
|
0.83 |
7.42×10²
|
1.17×10²
|
6.36×10²
|
4.24×10²
|
1.82×10²
|
| 11 |
6.78 |
8.93×10⁻⁵
|
0.86 |
6.83×10²
|
1.45×10⁵
|
5.26×10²
|
3.13×10²
|
1.23×10³
|
Table 6.
The data of glucose Tafel polarization curve obtained by fitting.
Table 6.
The data of glucose Tafel polarization curve obtained by fitting.
| Concentration |
icorr (Acm-2) |
Ecorr(V) vs SCE |
βa(mv/decade) |
βc(mv/decade) |
| 1 ppm |
8.17×10⁻⁶
|
-1.38 |
1179 |
-220.7 |
| 5 ppm |
9.07×10⁻⁶
|
-1.33 |
805.4 |
-172.7 |
| 10 ppm |
1.89×10⁻⁵
|
-1.41 |
662.7 |
-134.2 |
Table 7.
EIS fitting parameters in assays with different concentrations of glucuronic acid.
Table 7.
EIS fitting parameters in assays with different concentrations of glucuronic acid.
Time
(d) |
Rsol
(Ω cm2) |
Qct
(Ω−1 cm−2sn) |
n |
Rct
(Ω cm2) |
Lpit
(H·cm2) |
Rpit
(Ω cm2) |
| 1 ppm |
|
|
|
|
|
|
| 1 |
10.4 |
2.65×10⁻⁵
|
0.92 |
1.23×10³
|
3.36×10⁶
|
1.02×10²
|
| 3 |
27.2 |
3.46×10⁻⁵
|
0.91 |
1.24×10³
|
6.77×10³
|
2.16×10⁴
|
| 5 |
78.4 |
3.76×10⁻⁵
|
0.89 |
1.62×10³
|
1.19×10⁴
|
3.70×10³
|
| 7 |
14.9 |
4.72×10⁻⁵
|
0.90 |
1.50×10³
|
8.77×10³
|
2.96×10⁴
|
| 9 |
10.4 |
7.08×10⁻⁵
|
0.88 |
1.30×10³
|
1.25×10³
|
3.36×10³
|
| 11 |
18.2 |
7.52×10⁻⁵
|
0.89 |
1.18×10³
|
2.29×10³
|
3.07×10²
|
| 5 ppm |
|
|
|
|
|
|
| 1 |
23.4 |
2.93×10⁻⁵
|
0.81 |
2.28×10³
|
1.69×10³
|
6.04×10²
|
| 3 |
12.3 |
3.76×10⁻⁵
|
0.85 |
1.51×10³
|
1.29×10⁴
|
1.35×101
|
| 5 |
58.9 |
1.84×10⁻⁵
|
0.83 |
1.49×10³
|
3.58×10³
|
1.62×10³
|
| 7 |
19.0 |
5.78×10⁻⁵
|
0.93 |
1.06×10³
|
1.78×10⁵
|
1.89×10³
|
| 9 |
13.3 |
5.67×10⁻⁵
|
0.85 |
9.15×10²
|
5.50×10⁴
|
1.77×10³
|
| 11 |
25.1 |
3.19×10⁻⁵
|
0.86 |
1.41×10³
|
1.99×10³
|
1.20×10³
|
| 10 ppm |
|
|
|
|
|
|
| 1 |
6.42 |
1.72×10⁻⁵
|
0.88 |
1.35×10³
|
1.13×10⁴
|
1.25×10²
|
| 3 |
14.1 |
5.44×10⁻⁵
|
0.82 |
1.17×10³
|
3.64×10²
|
6.37×10²
|
| 5 |
10.3 |
7.05×10⁻⁵
|
0.85 |
1.23×10³
|
4.80×10³
|
2.74×10³
|
| 7 |
9.60 |
6.73×10⁻⁵
|
0.87 |
1.38×10³
|
1.50×10³
|
2.86×10³
|
| 9 |
11.6 |
6.55×10⁻⁵
|
0.89 |
1.02×10³
|
1.93×10³
|
1.50×10³
|
| 11 |
16.7 |
7.16×10⁻⁵
|
0.87 |
1.01×10³
|
1.07×10⁴
|
1.33×10³
|
Table 8.
The Tafel polarization curves of samples in seawater solution with glucuronic acid were fitted to obtain the data.
Table 8.
The Tafel polarization curves of samples in seawater solution with glucuronic acid were fitted to obtain the data.
| Concentration |
icorr (Acm-2) |
Ecorr(V)vs.SCE |
βa(mv/decade) |
βc(mv/decade) |
| 1 ppm |
6.56×10⁻⁶
|
-1.36 |
992.7 |
-228.6 |
| 5 ppm |
3.93×10⁻⁵
|
-1.48 |
2123 |
-226.1 |
| 10 ppm |
2.29×10⁻⁵
|
-1.36 |
336.7 |
-189.6 |
|
Disclaimer/Publisher’s Note: The statements, opinions and data contained in all publications are solely those of the individual author(s) and contributor(s) and not of MDPI and/or the editor(s). MDPI and/or the editor(s) disclaim responsibility for any injury to people or property resulting from any ideas, methods, instructions or products referred to in the content. |
© 2023 by the authors. Licensee MDPI, Basel, Switzerland. This article is an open access article distributed under the terms and conditions of the Creative Commons Attribution (CC BY) license (http://creativecommons.org/licenses/by/4.0/).
