0. Introduction
In recent years, building industrialization has become the main development trend of China’s construction industry, so Prefabricated buildings are widely used in China. In prefabricated structures, stairs are the weak link during earthquakes [
1], and the node connections of stairs have a significant impact on their failure. In conventional design, stairs are usually not considered to participate in the joint work of the overall structure, nor are they designed for seismic resistance on their own [
2]. Therefore, the research on the seismic performance of connecting nodes is particularly important. At present, there are two common types of connection nodes for prefabricated concrete stairs: fixed hinges and sliding hinges [
3]. There has been relevant research on the connection nodes of stairs in China. In 2012, Zhu Yuyu [
4] designed a frame staircase using fixed and sliding bearings, and conducted pseudo static experiments on them respectively. The research results indicate that the use of sliding bearings in stairwells has good ductility and deformation performance, which can improve the later seismic performance of frame stairwells. In 2014, Hu Xiaoliang [
5] established a frame structure model using sliding support stairs and conducted modal analysis and response spectrum analysis on it. The research results indicate that when the frame columns of the sliding support staircase are separated from the platform plate, the seismic performance of the frame structure under earthquake is basically not affected by the staircase. When using sliding support stairs, the internal force of the staircase frame beam has a certain impact, but the staircase frame column is not affected.
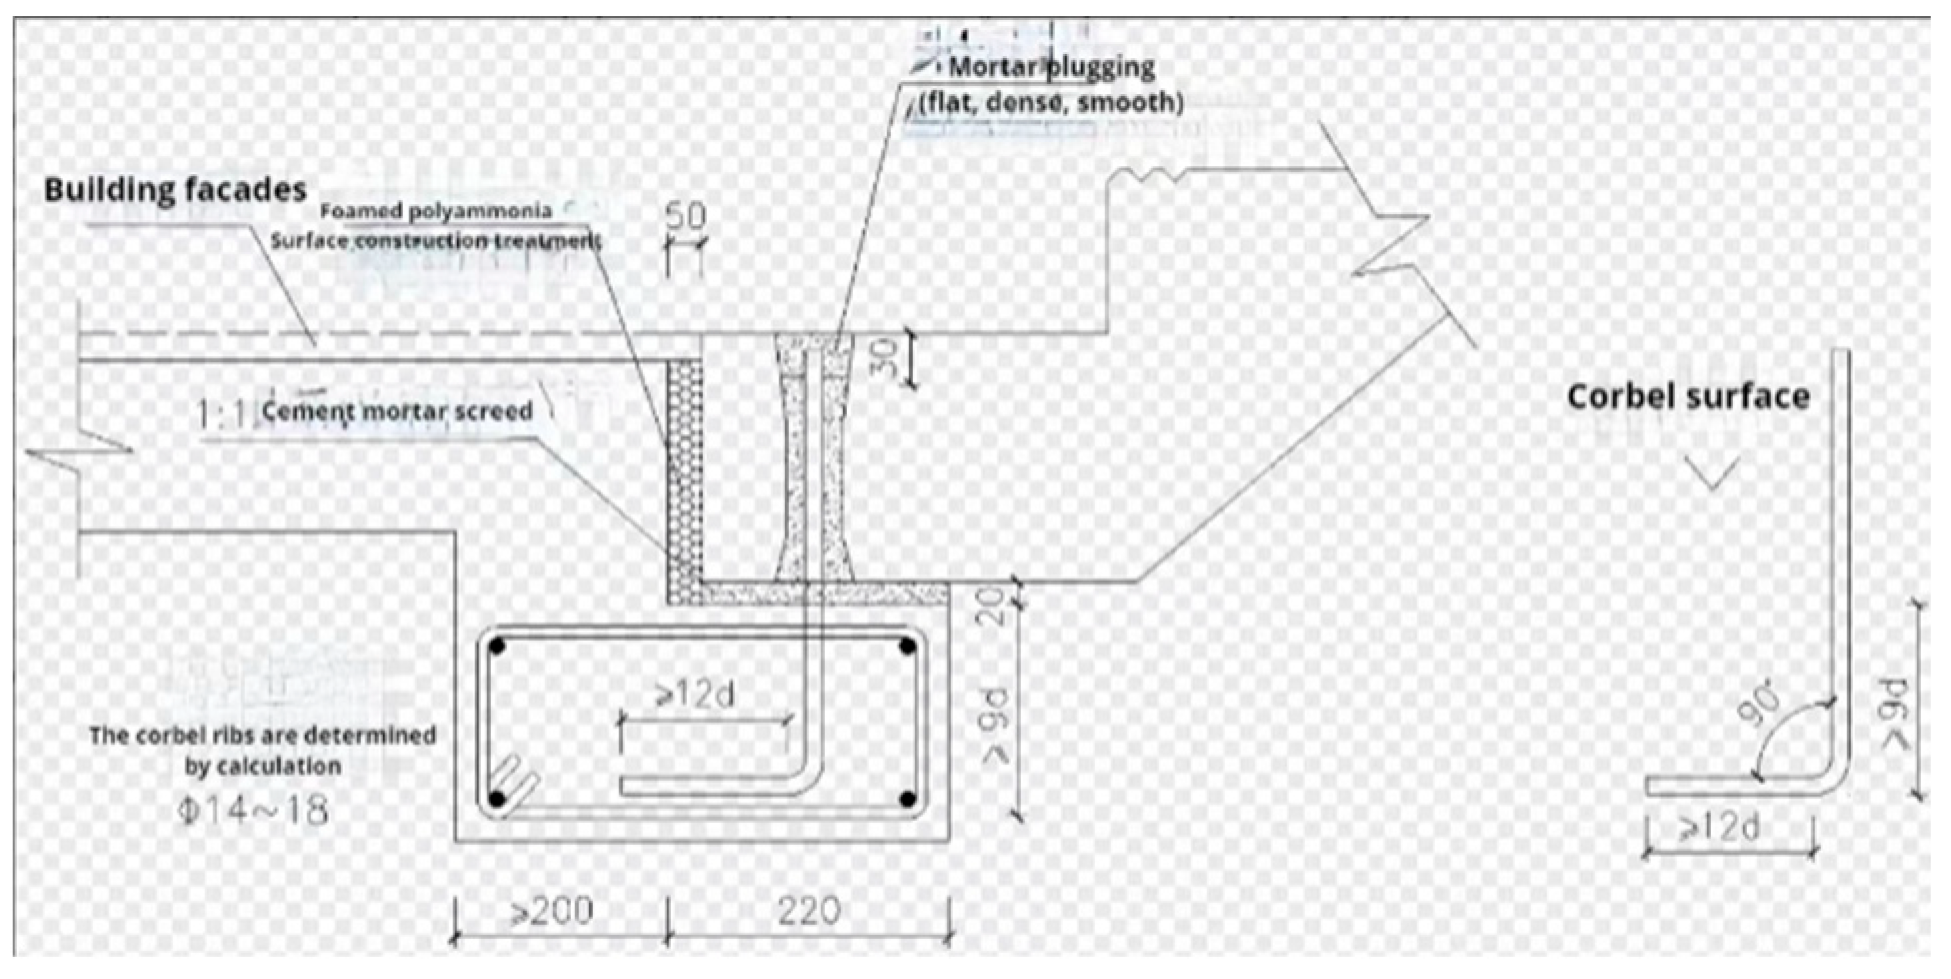
After in-depth study of the existing connection mode of precast concrete stairs in China, China Architectural Design and Research Institute Co., Ltd. proposed an innovative connection mode, namely, "flexible connection", as shown in
Figure 1. The connection of precast stair flight in Prefabricated building can not only eliminate (weaken) the adverse effects of the slant support effect of stairs on the main structure, but also resist the seismic force perpendicular to the stair run direction.
The principle of this connection method is to set two connection points at both ends of the ladder segment, each with the same structure, that is, to reserve a circular hole on the stairs. During installation, the pin bolt reinforcement reserved on the ladder beam is inserted into the hole, and then filled with flexible grouting material. At this point, the connection point is between the fixed hinge support and the sliding hinge support, which has a certain bearing capacity and deformation capacity. When subjected to an earthquake in the direction of the stairs, the stair plates move in a staggered manner relative to the stair beams, causing the steel bars to compress the flexible materials. The deformation of the flexible materials releases seismic force to reduce the stress on the steel bars and stairs. When subjected to an earthquake in the direction of the vertical stairs, the relative positions of the upper and lower stair beams change, causing the stairs to twist and the deformation of the flexible materials releases seismic force to protect the steel bars and stairs from damage. This paper will conduct quasi-static tests on the end of stairs to study the mechanical performance of stair end nodes under in-plane and out of plane low cycle reciprocating loads.
2. Technical Proposal
2.1. Structural design of specimens
According to the purpose and research plan of this experiment, the specimens were designed, and the detailed parameter information of the specimens is listed in
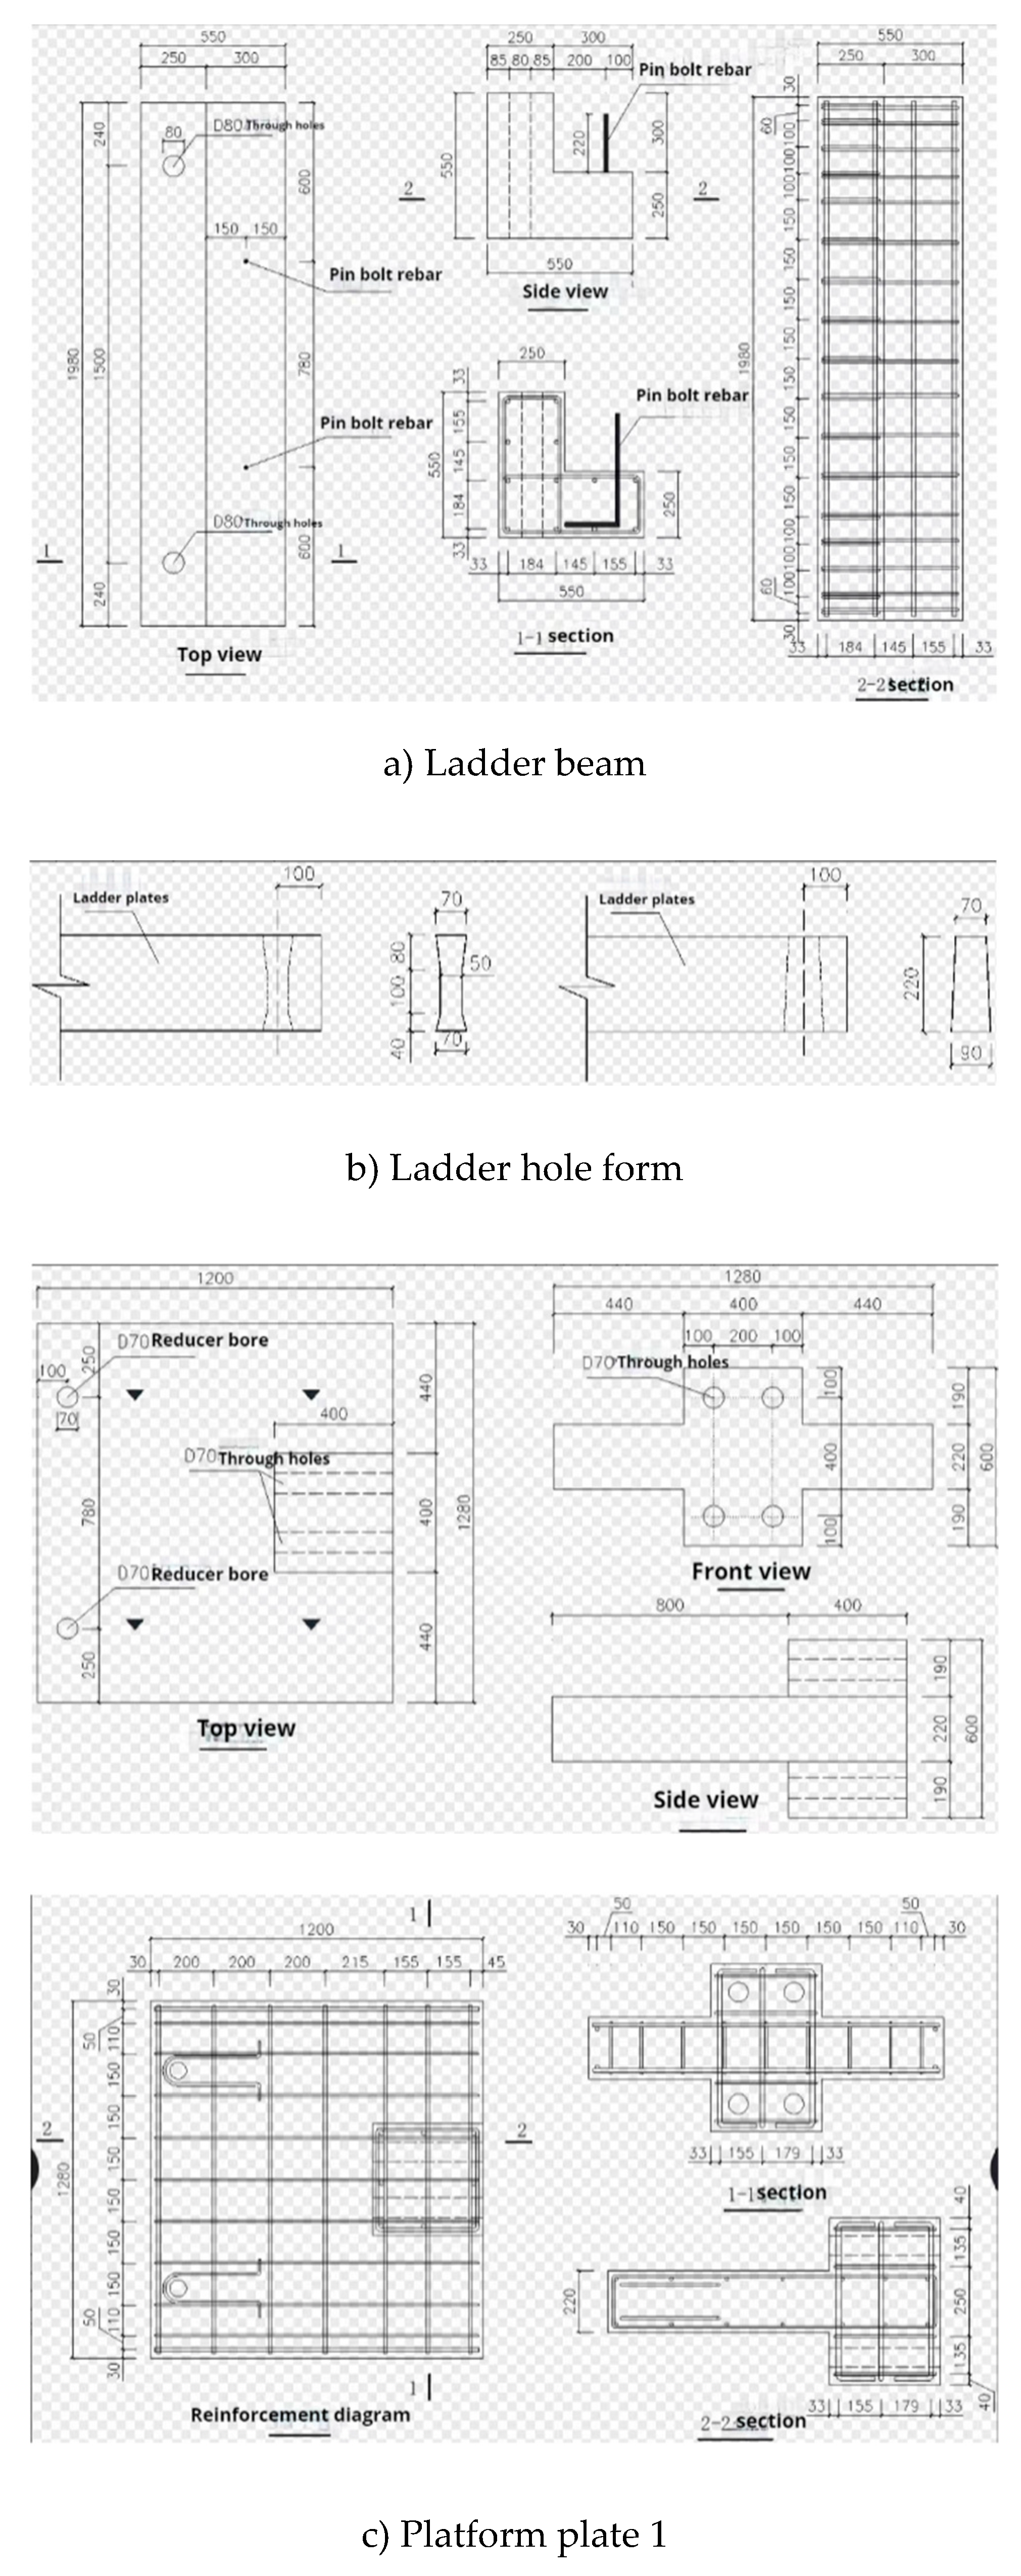
Table 1. This experiment compares the parameter ladder hole form and loading direction. The test specimen is designed as a fixed ladder beam at both ends, a section of flat step plate, and a connecting node. The ladder beam is designed according to general dimensions, with the thickness of the ladder plate taking the common end thickness size of 200mm and the width of the ladder plate taking 1280mm. Two pin bolts are set up, and the processing diagram of the test piece is shown in
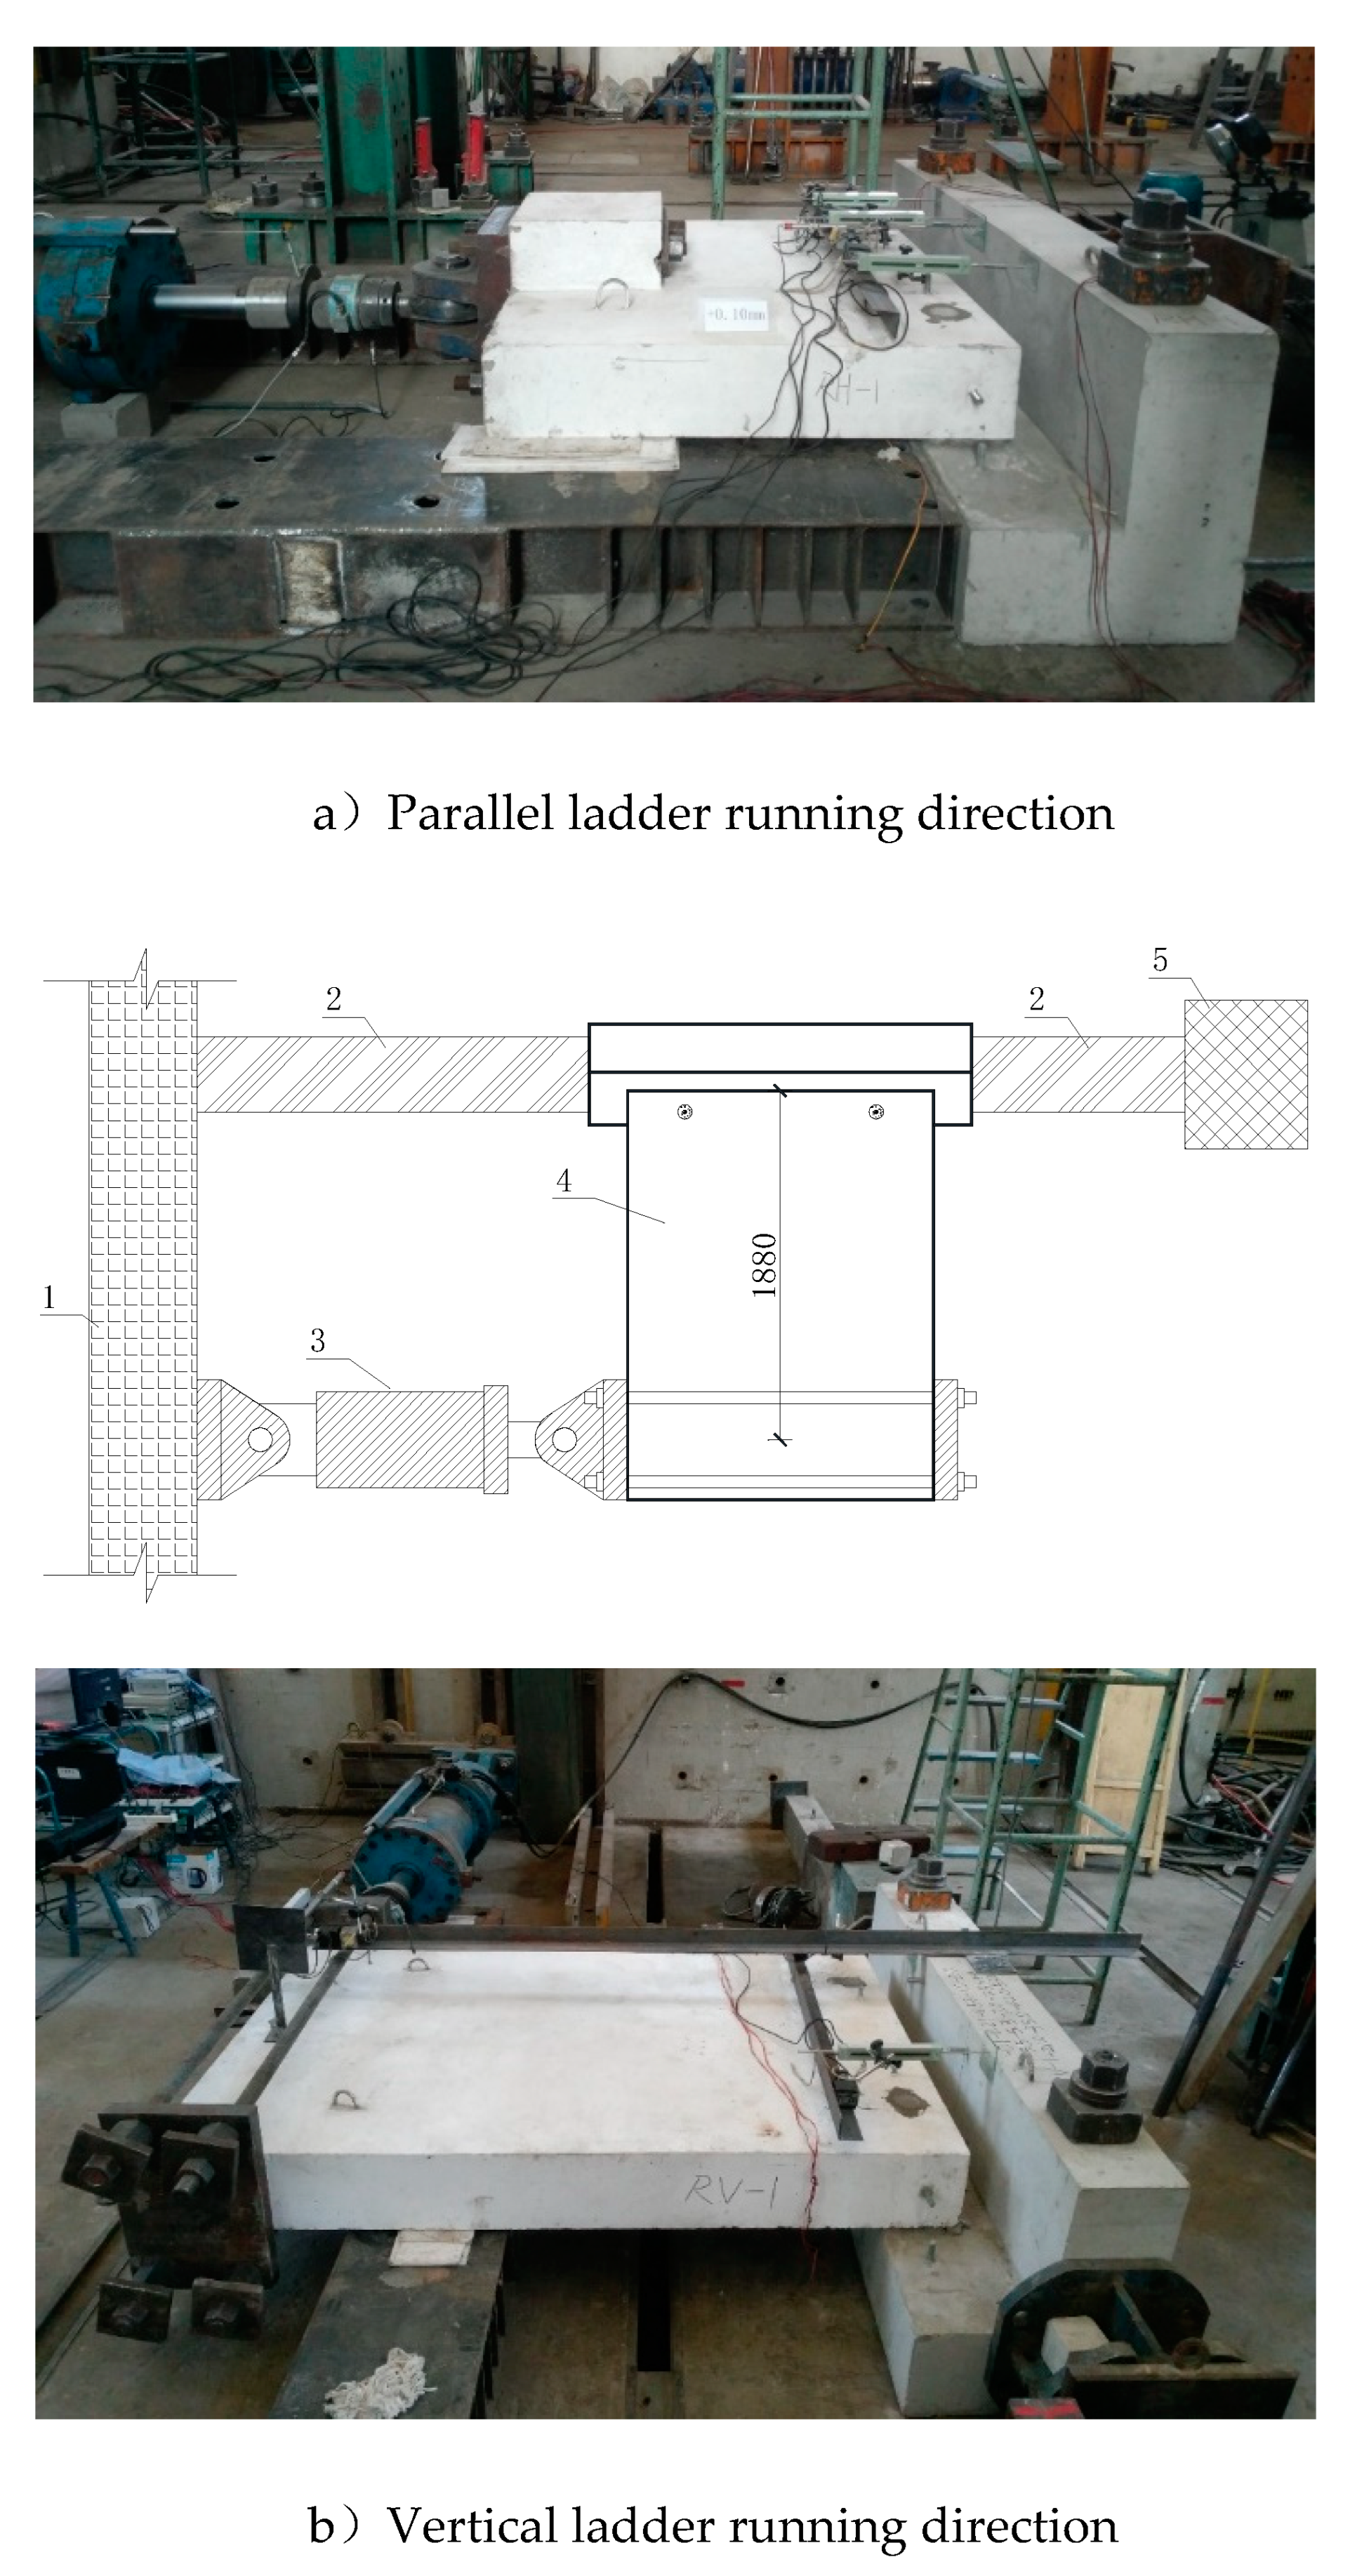
Figure 2, while the finished product diagram of the test piece is shown in
Figure 3.
2.2. Test Plan
According to the relevant provisions of the "Code for Seismic Testing of Buildings" JGJ/T 101-2015 [
6] and the "Standard for Testing Methods of Concrete Structures" GB/T 50152-2012 [
7], combined with the research purpose of this experiment, the loading device is determined and the loading system is formulated.
2.2.1. Test setup
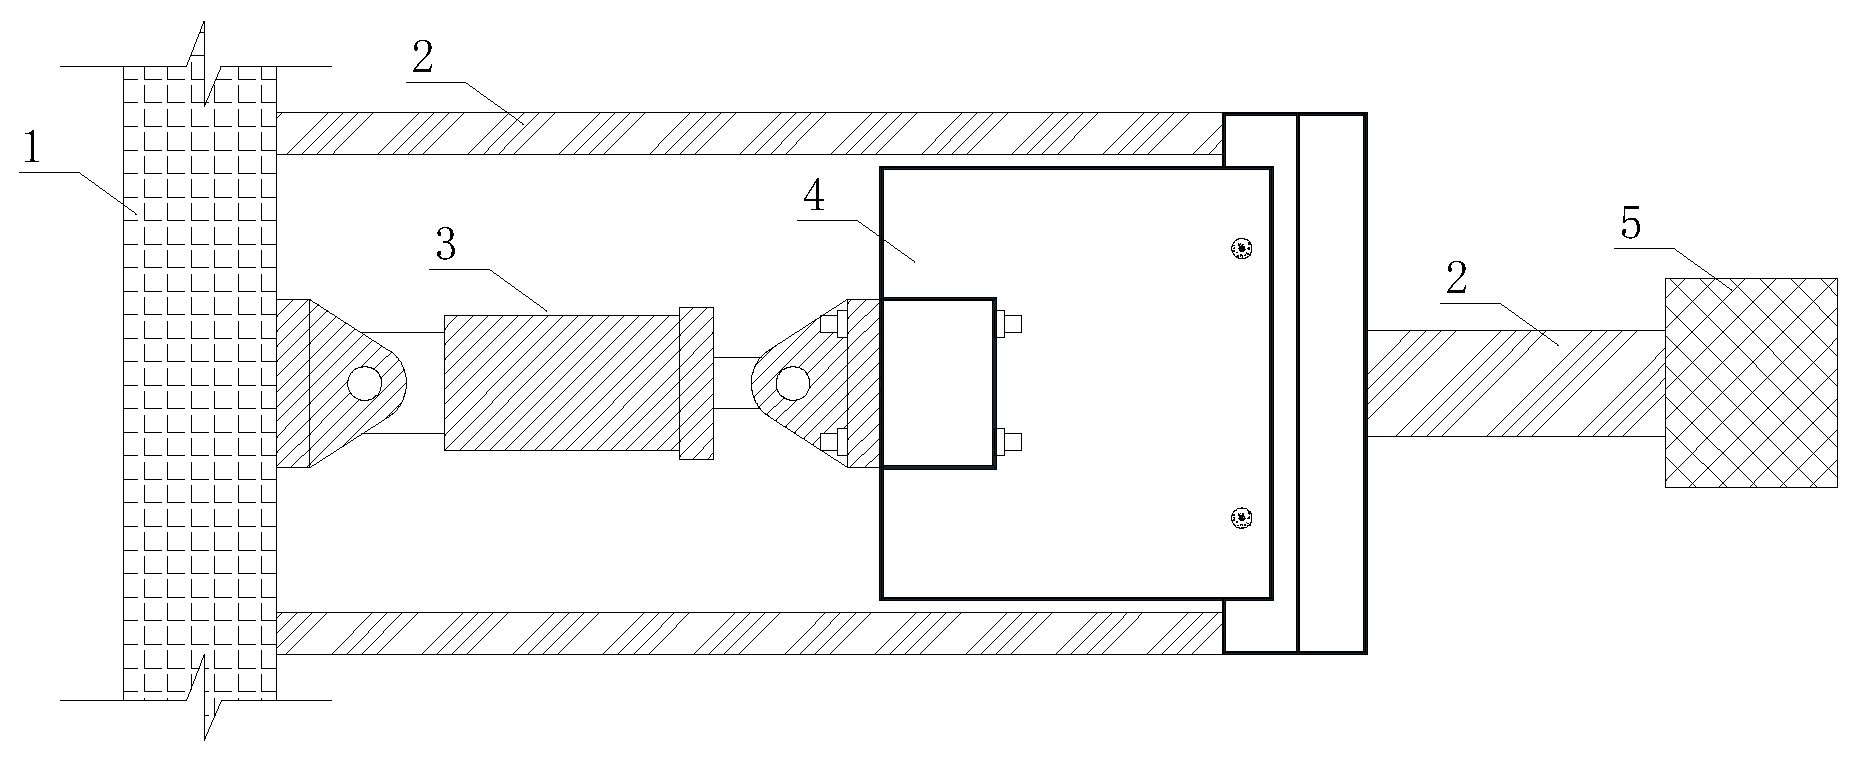
This experiment adopts a pseudo-static loading test scheme, as shown in
Figure 4. The test piece is fixed on the test bench with ground anchors, and horizontal low-cycle repeated loads are applied to the step plate during the experiment. The lateral force is applied through a 150-ton electro-hydraulic servo actuator and a reaction wall.
2.2.2. Test loading
The experiment adopts a low-cycle reciprocating loading test scheme. When applying horizontal loads to the specimens, the loading is controlled according to the interlayer displacement angle. The highest floor in the "Prefabricated Concrete Stairs (Public Buildings)" [
8] diagram set is selected to determine the loading level, which is 4200mm in height. The specific loading level is shown in
Table 2. In the experiment, the steel bars are cycled once before yielding and twice after yielding.
2.2.3. Measurement plan
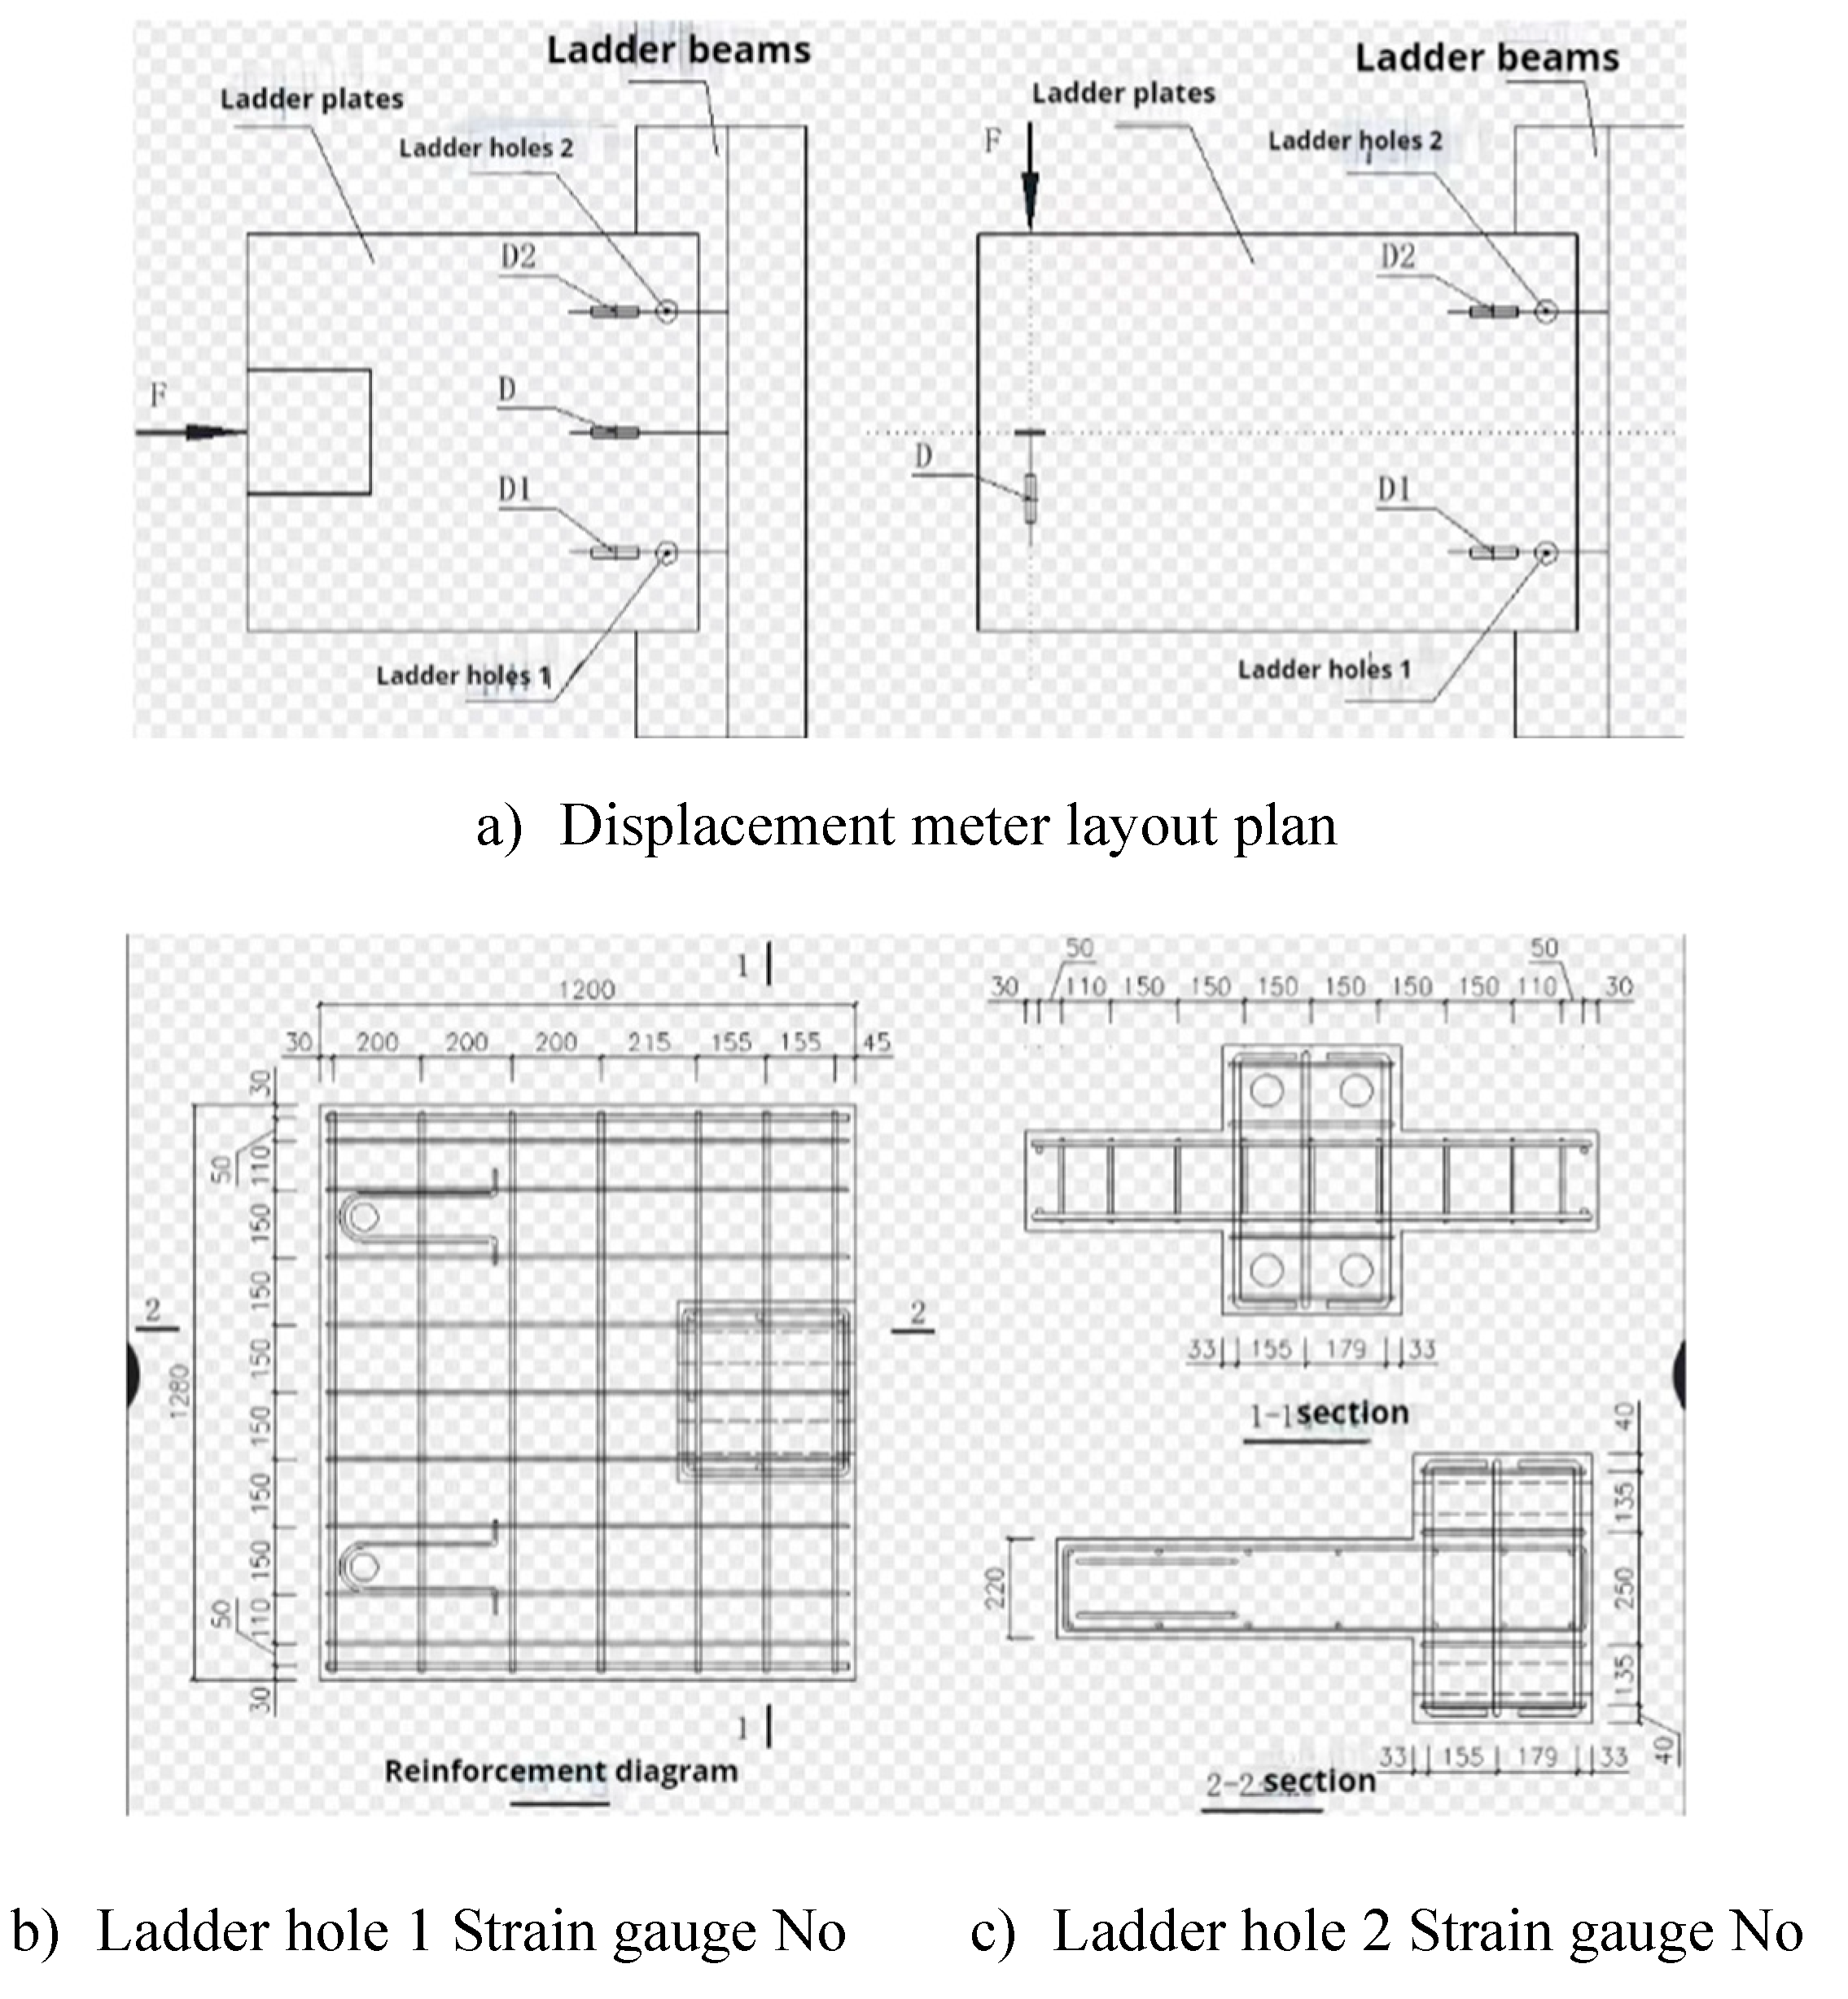
During the test, measure the load displacement change of the loading point, the displacement change of the stair board at the stair hole of the test piece relative to the ladder beam, and the strain change of the pin bolt reinforcement. The load F of the loading point is automatically collected and recorded by the actuator. The arrangement of the specimen displacement meter and Strain gauge is shown in
Figure 5a, where D, D1, D2 are the displacement meter numbers, and the displacement meter data are all negative when pulled out, and W1, W2, N1, N2 are the Strain gauge numbers.
Principle of ladder hole numbering: When observing the specimen from the side of the ladder beam, the left ladder hole is ladder hole 1, and the right ladder hole is ladder hole 2, as shown in
Figure 5b.Numbering principle of Strain gauge: W/N+ladder hole number, as shown in
Figure 5c.
3. Test results and analysis
3.1. Test phenomenon
3.1.1. RH test piece
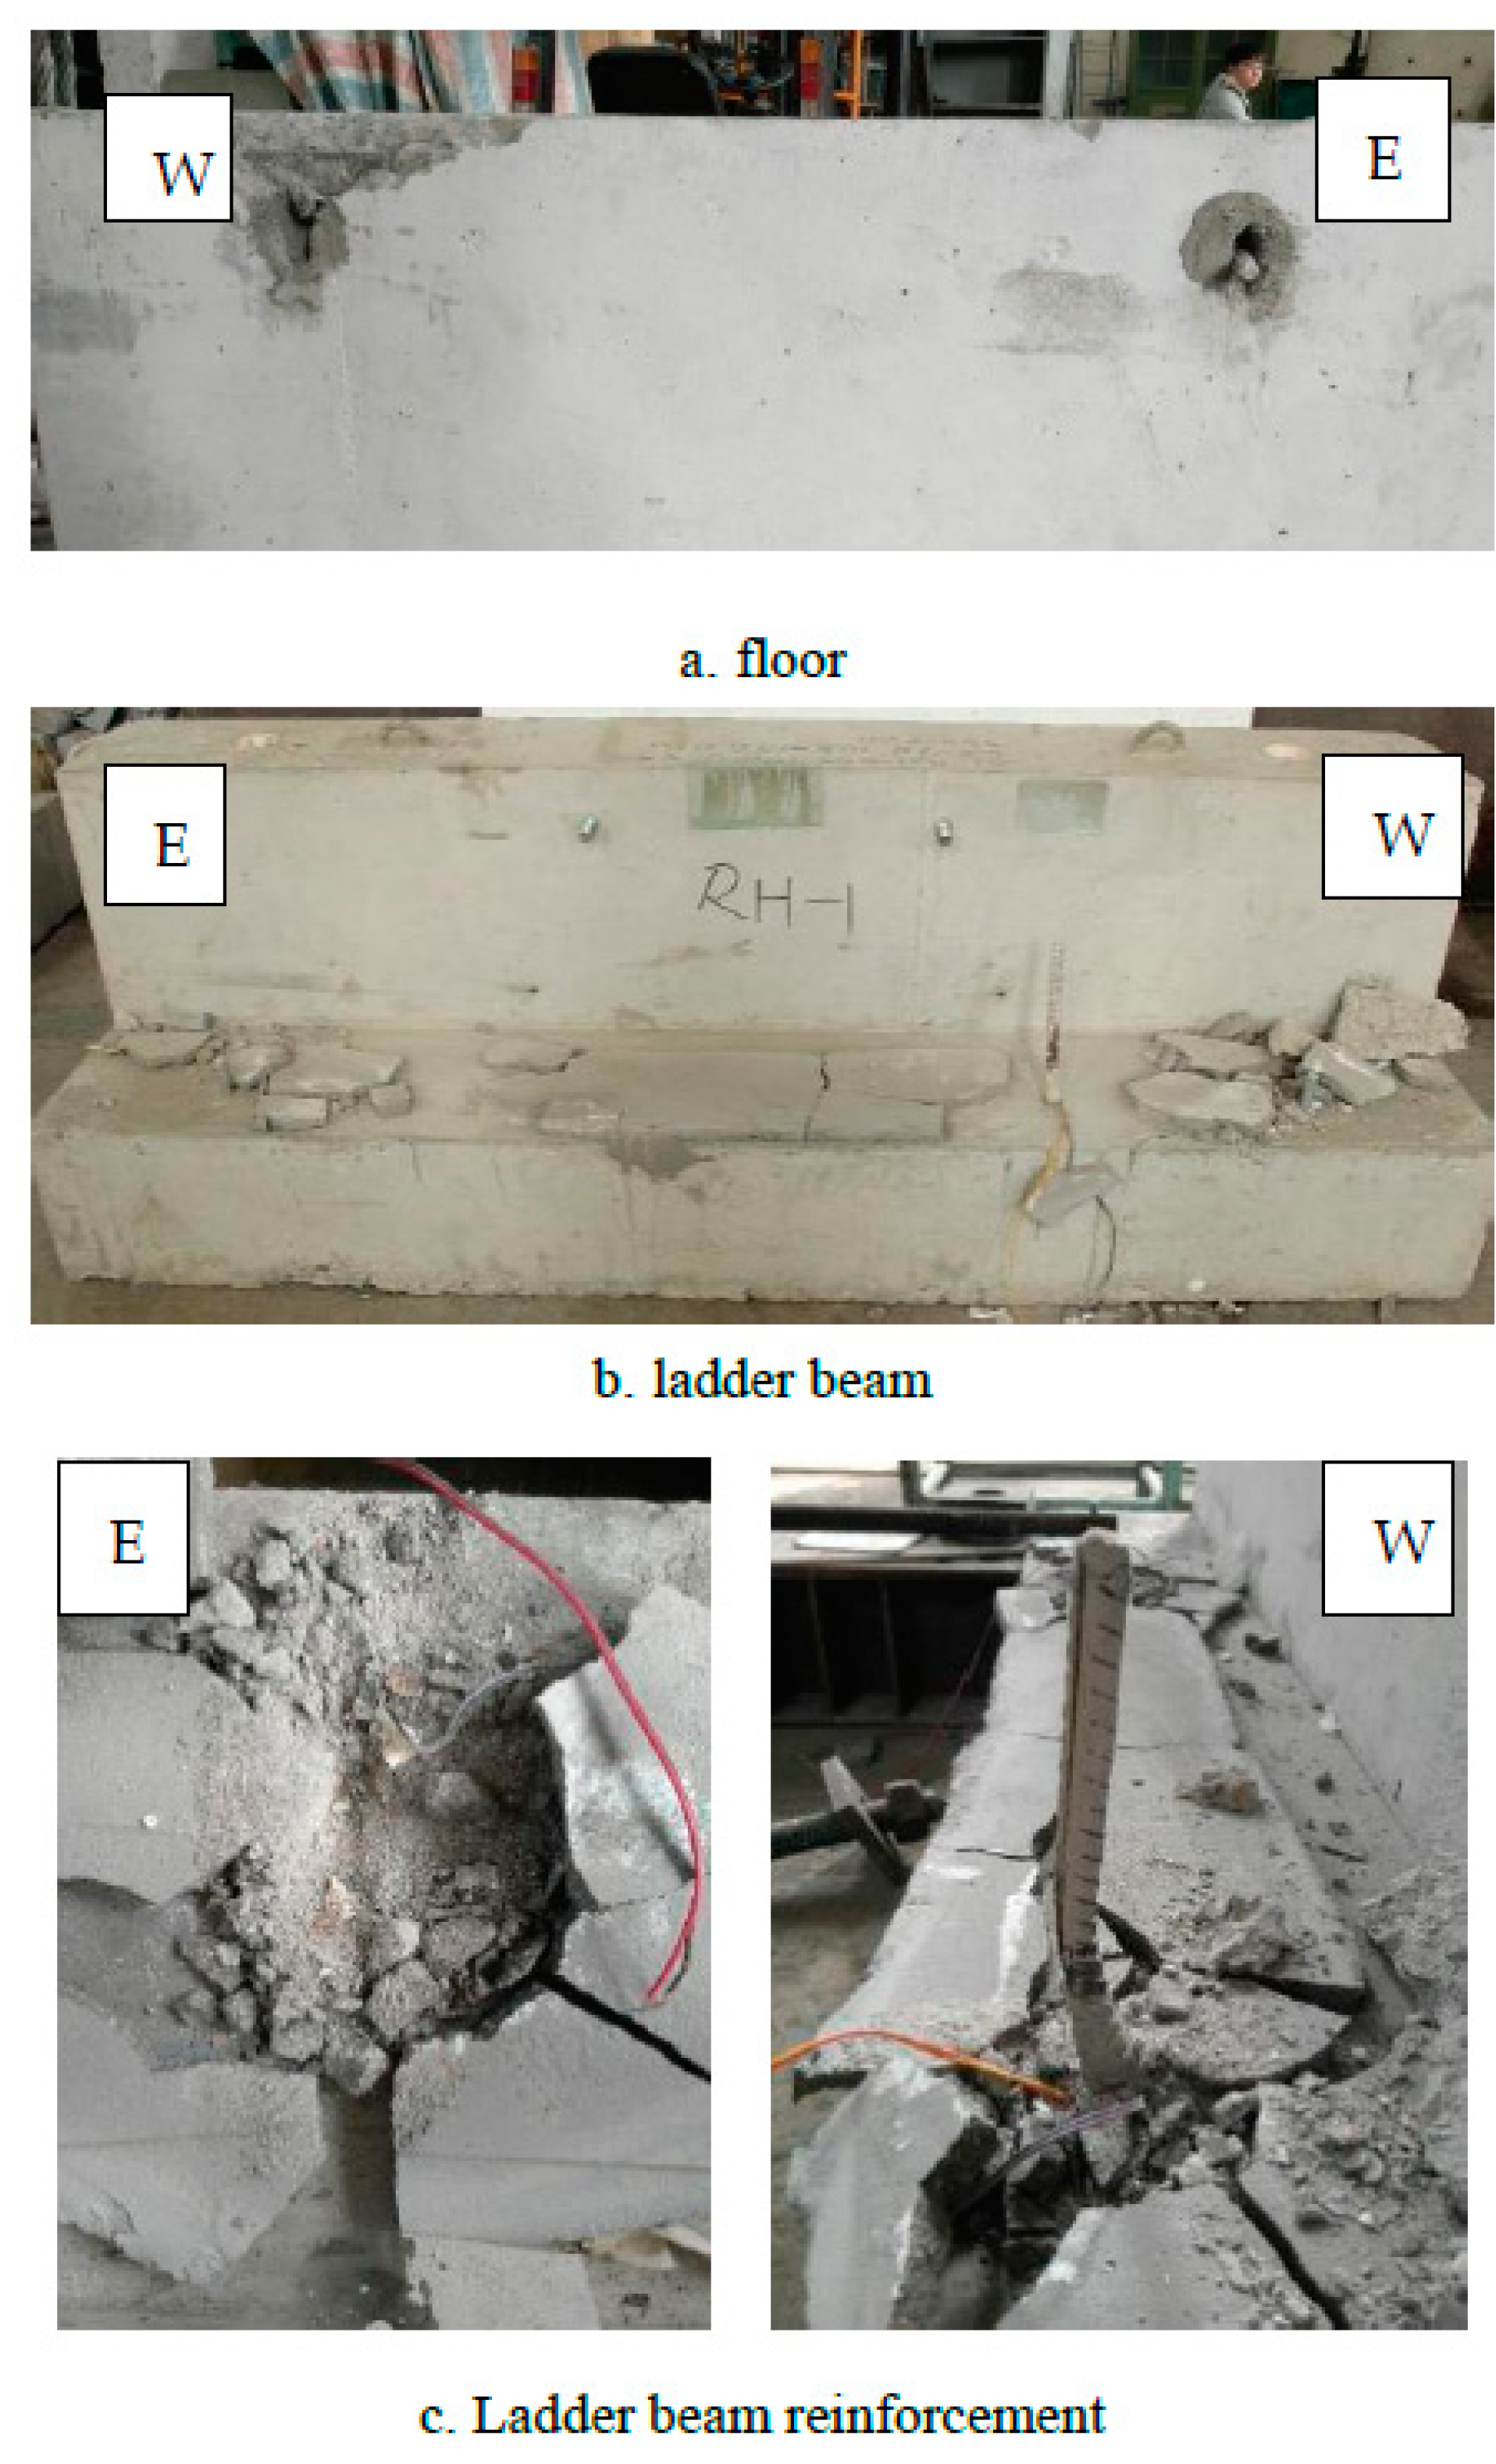
The description of the RH-1 test process is shown in
Table 3.
The final failure photo of the specimen is shown in
Figure 6:
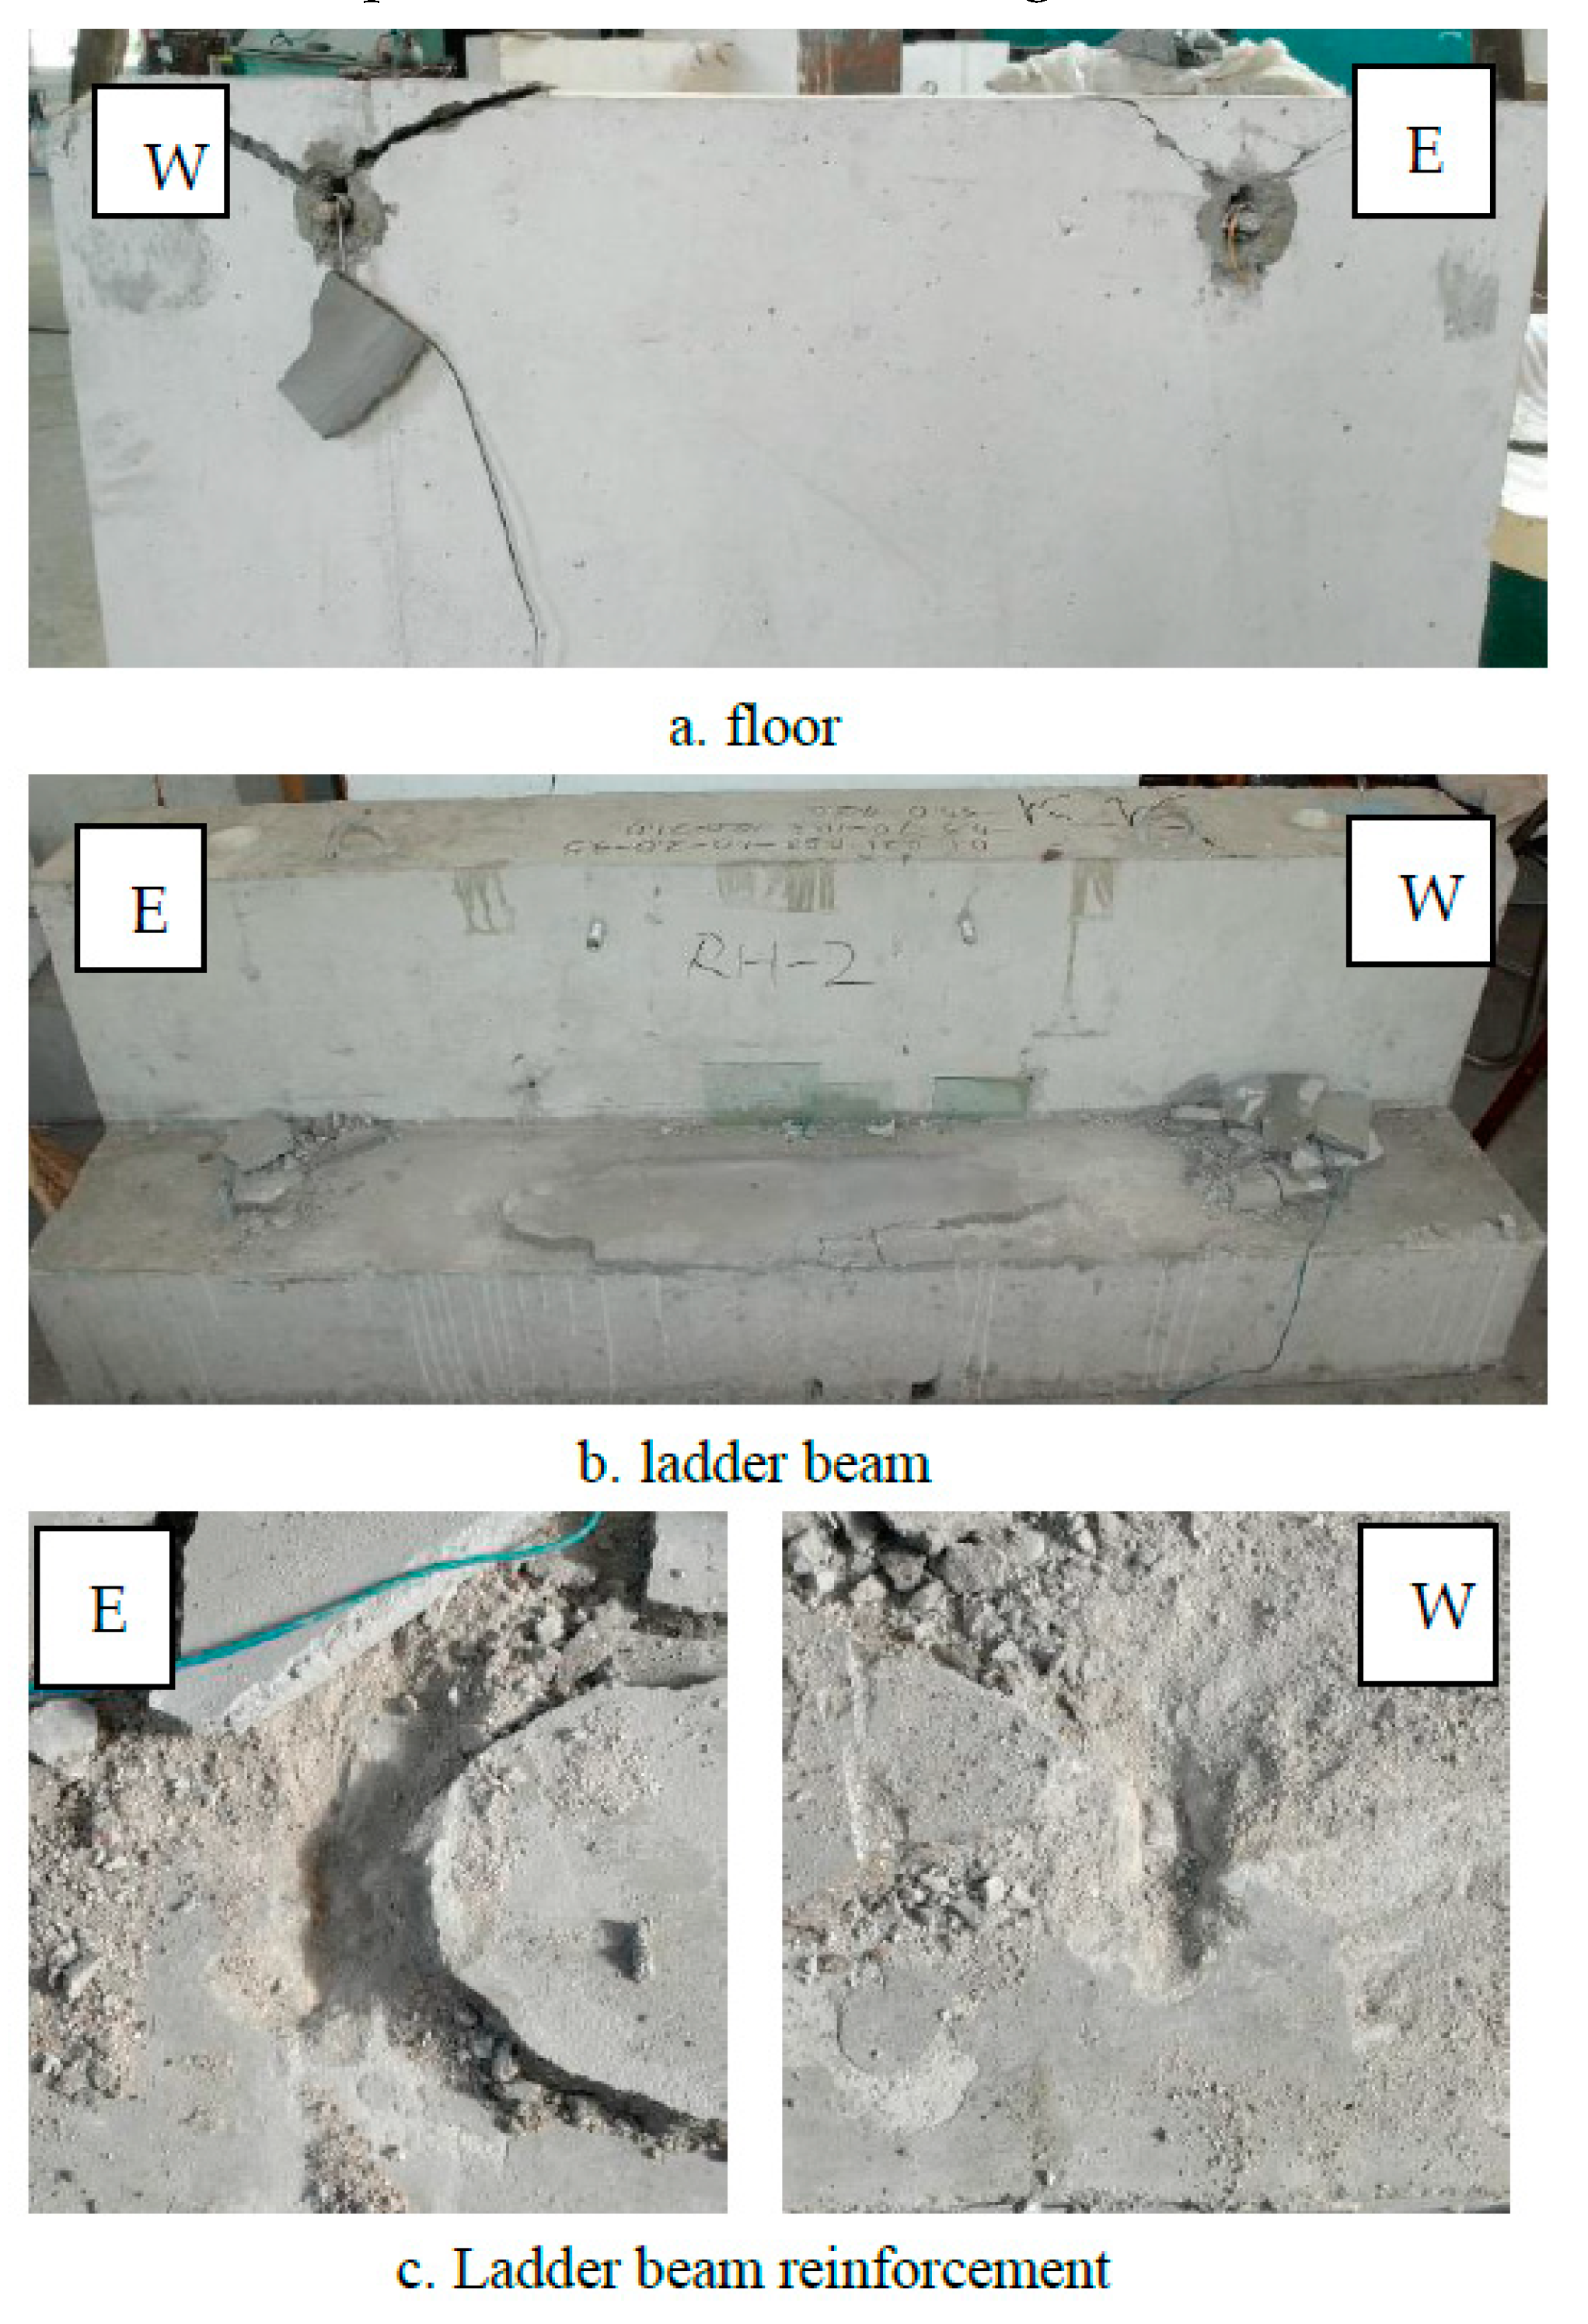
The description of the RH-2 test process is shown in
Table 4.
The final failure photo of the specimen is shown in
Figure 7:
3.1.2. RHG specimens
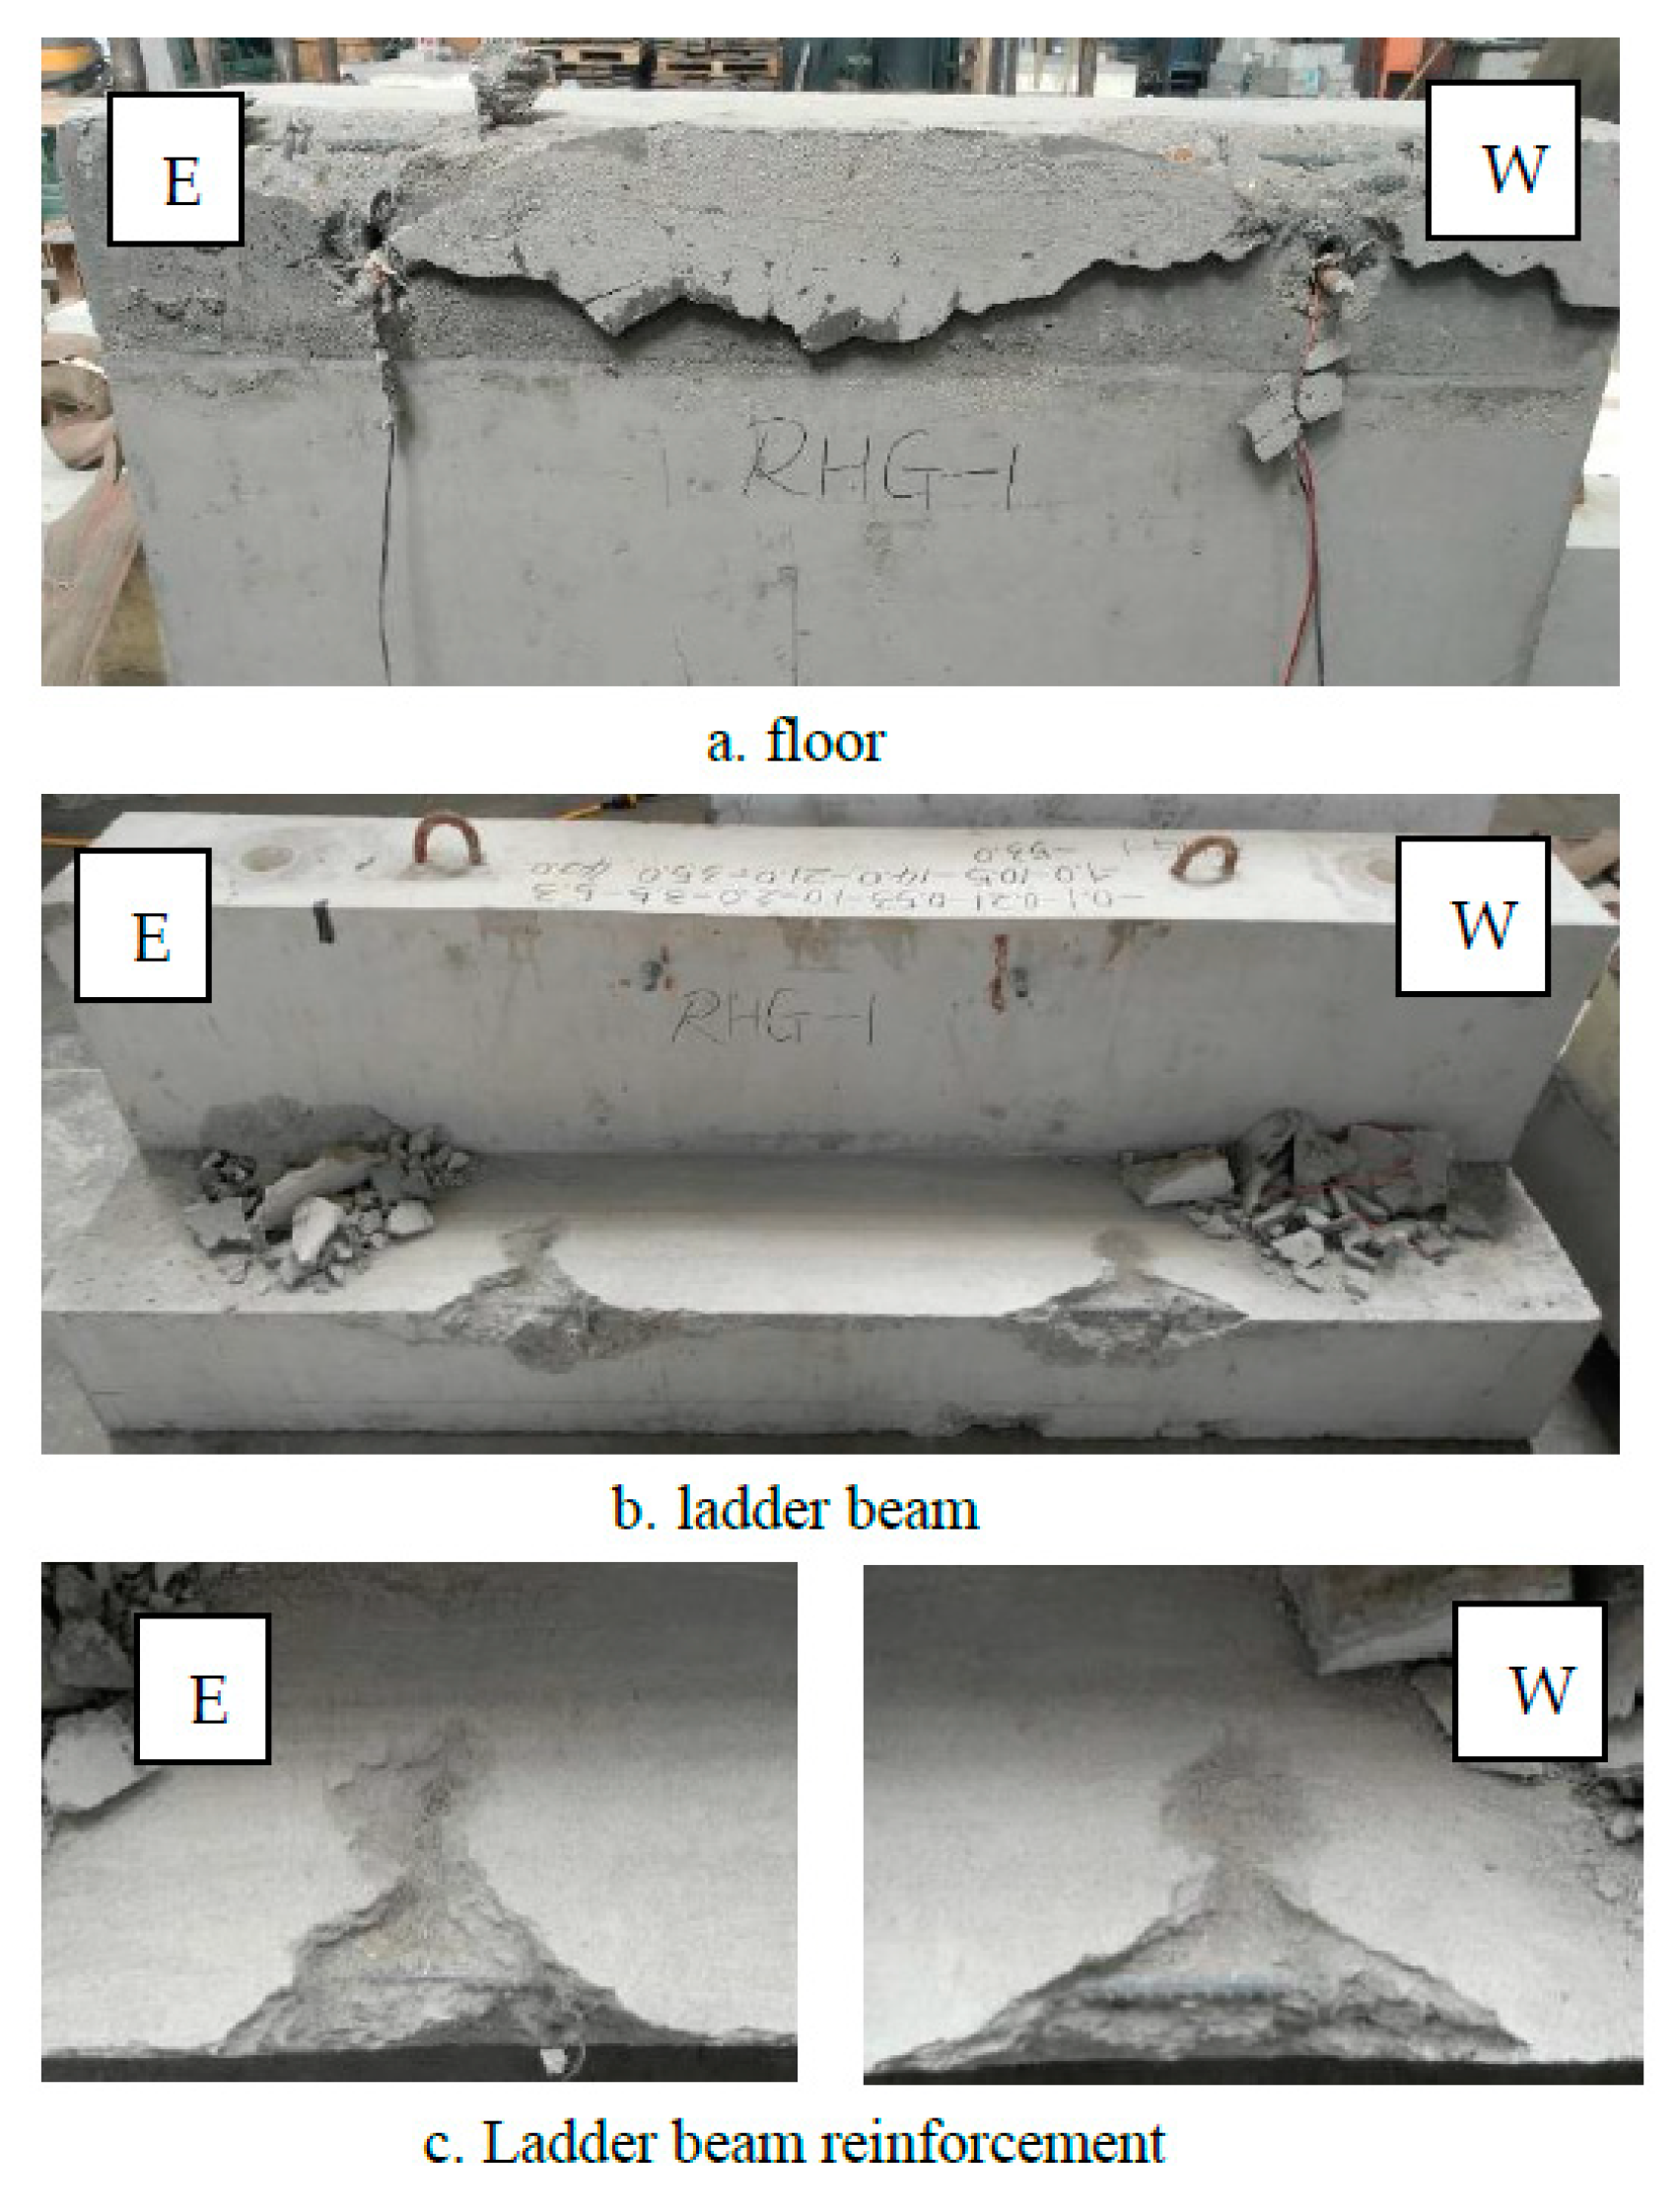
The phenomenon description of the RHG-1 test process is shown in
Table 5.
The final failure photo of the specimen is shown in
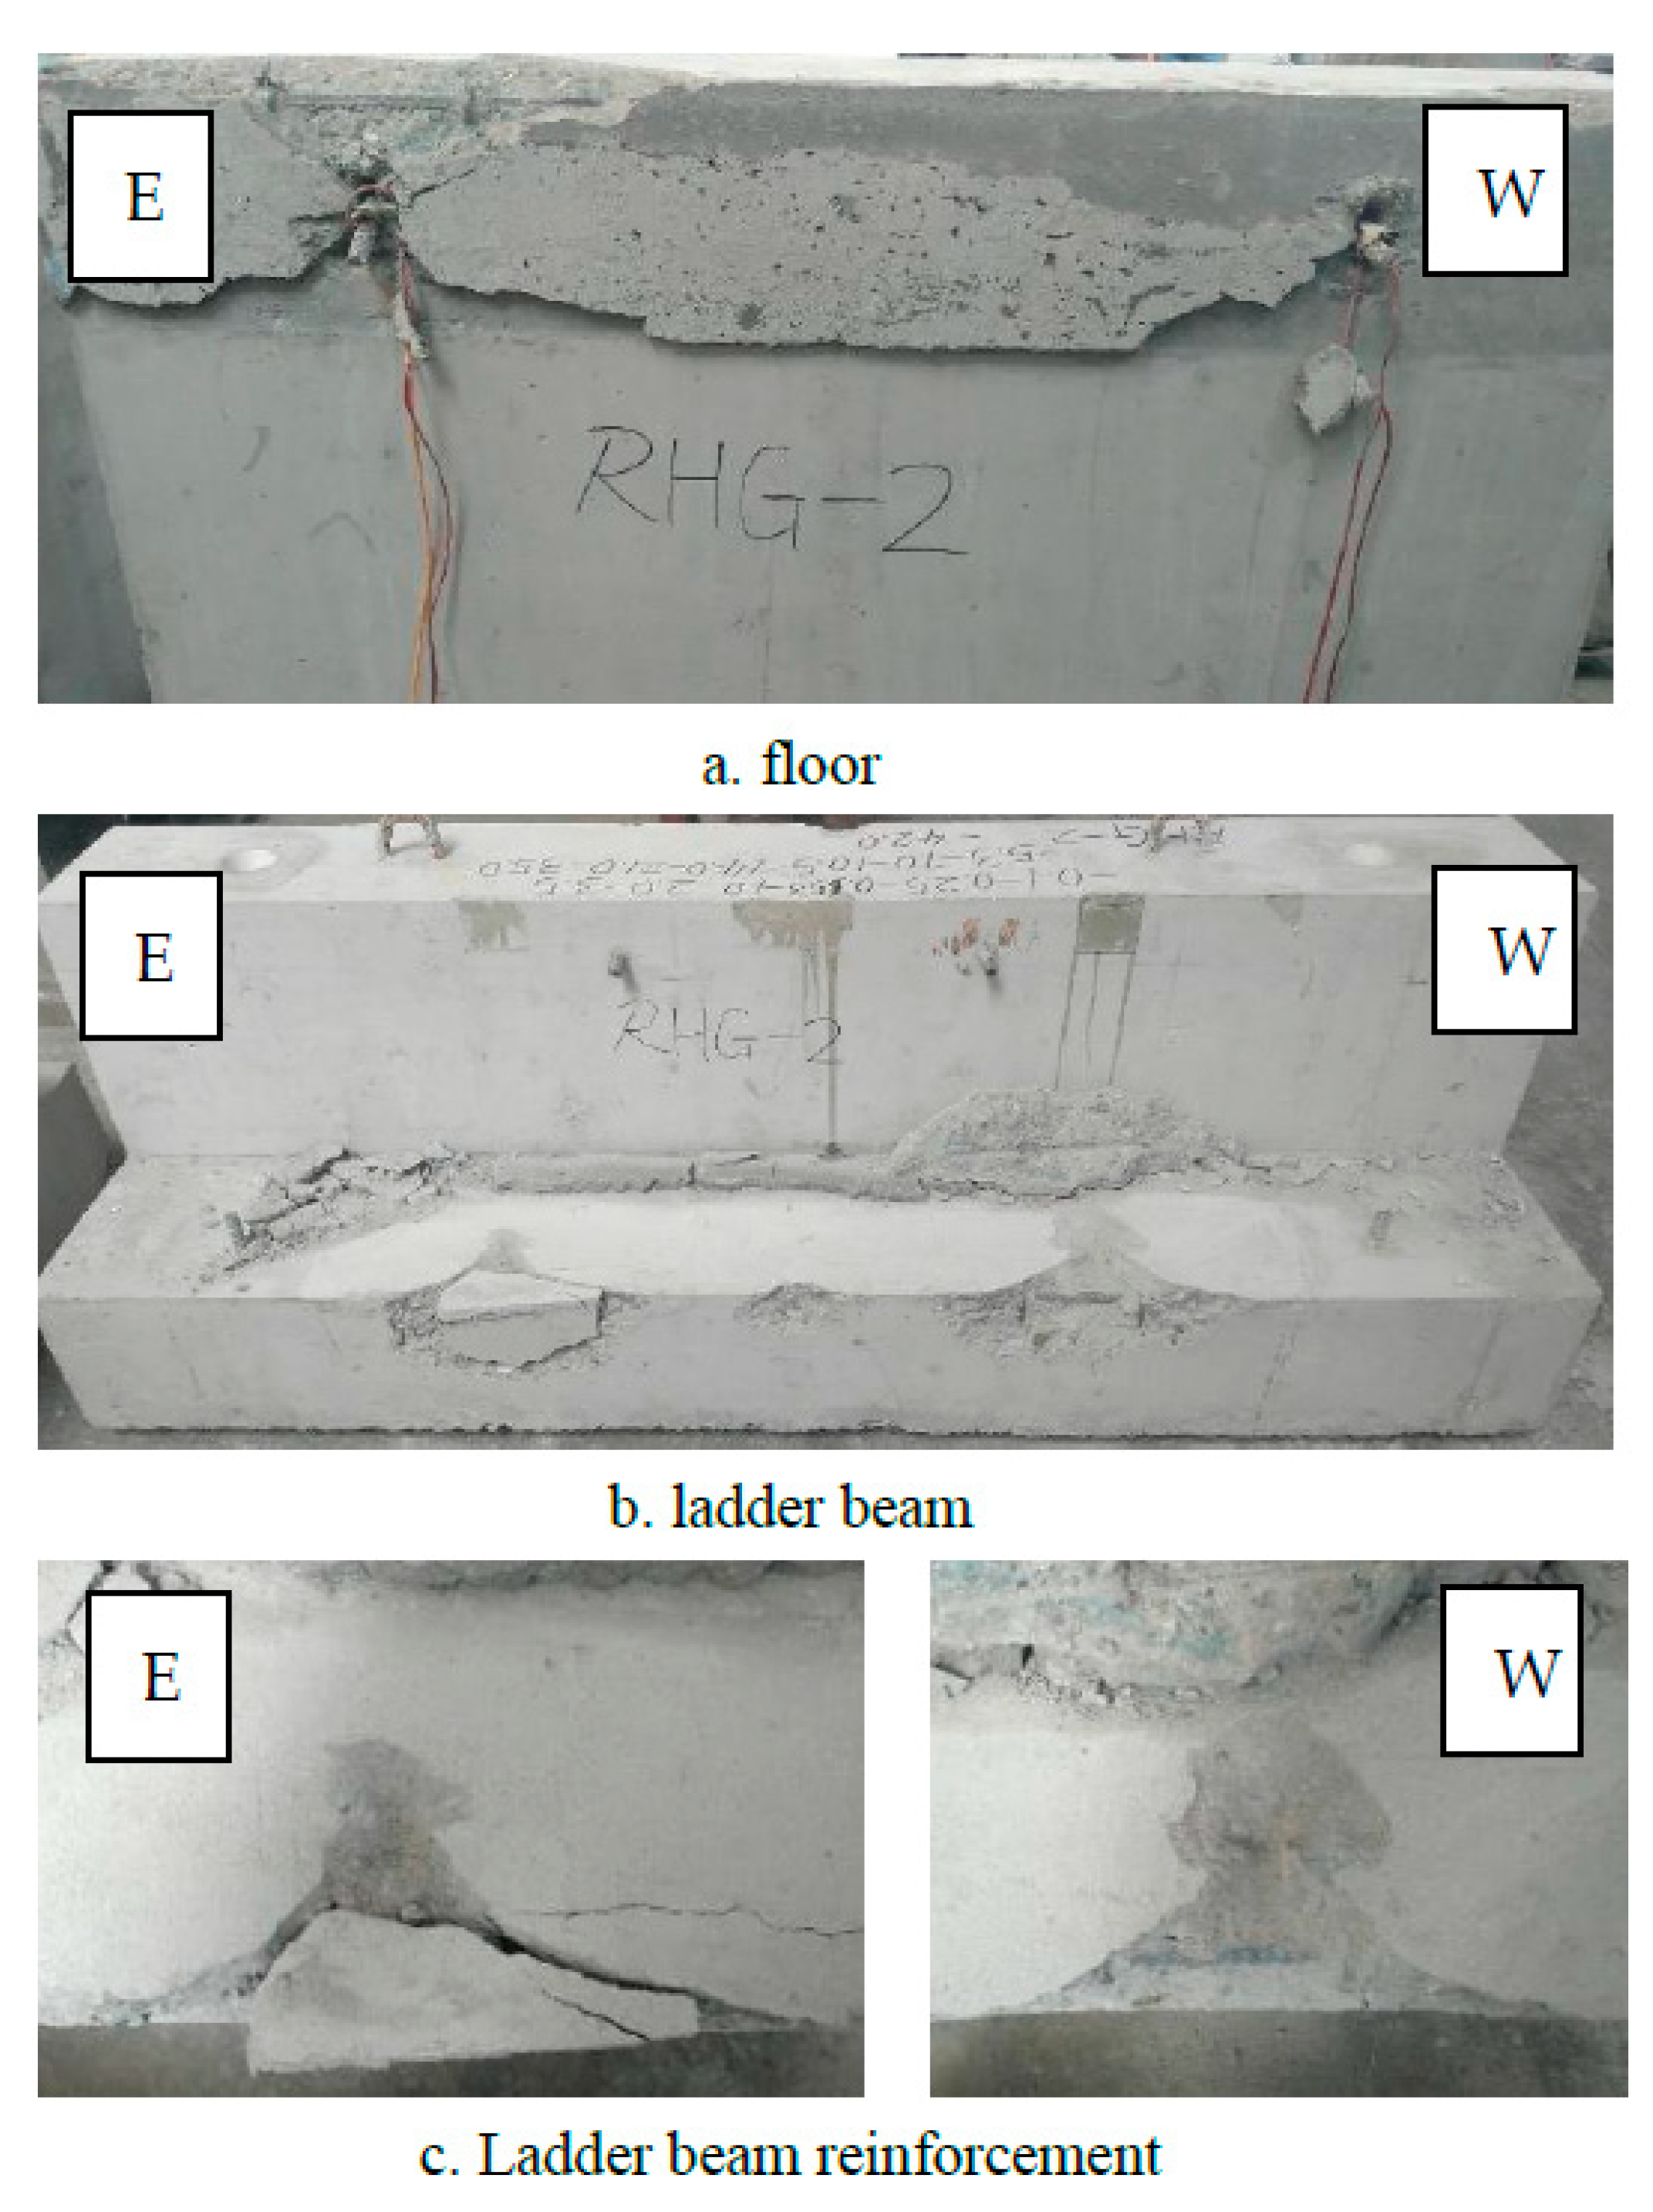
Figure 8:
The phenomenon description of the RHG-2 test process is shown in
Table 6.
The final failure photo of the specimen is shown in
Figure 9:
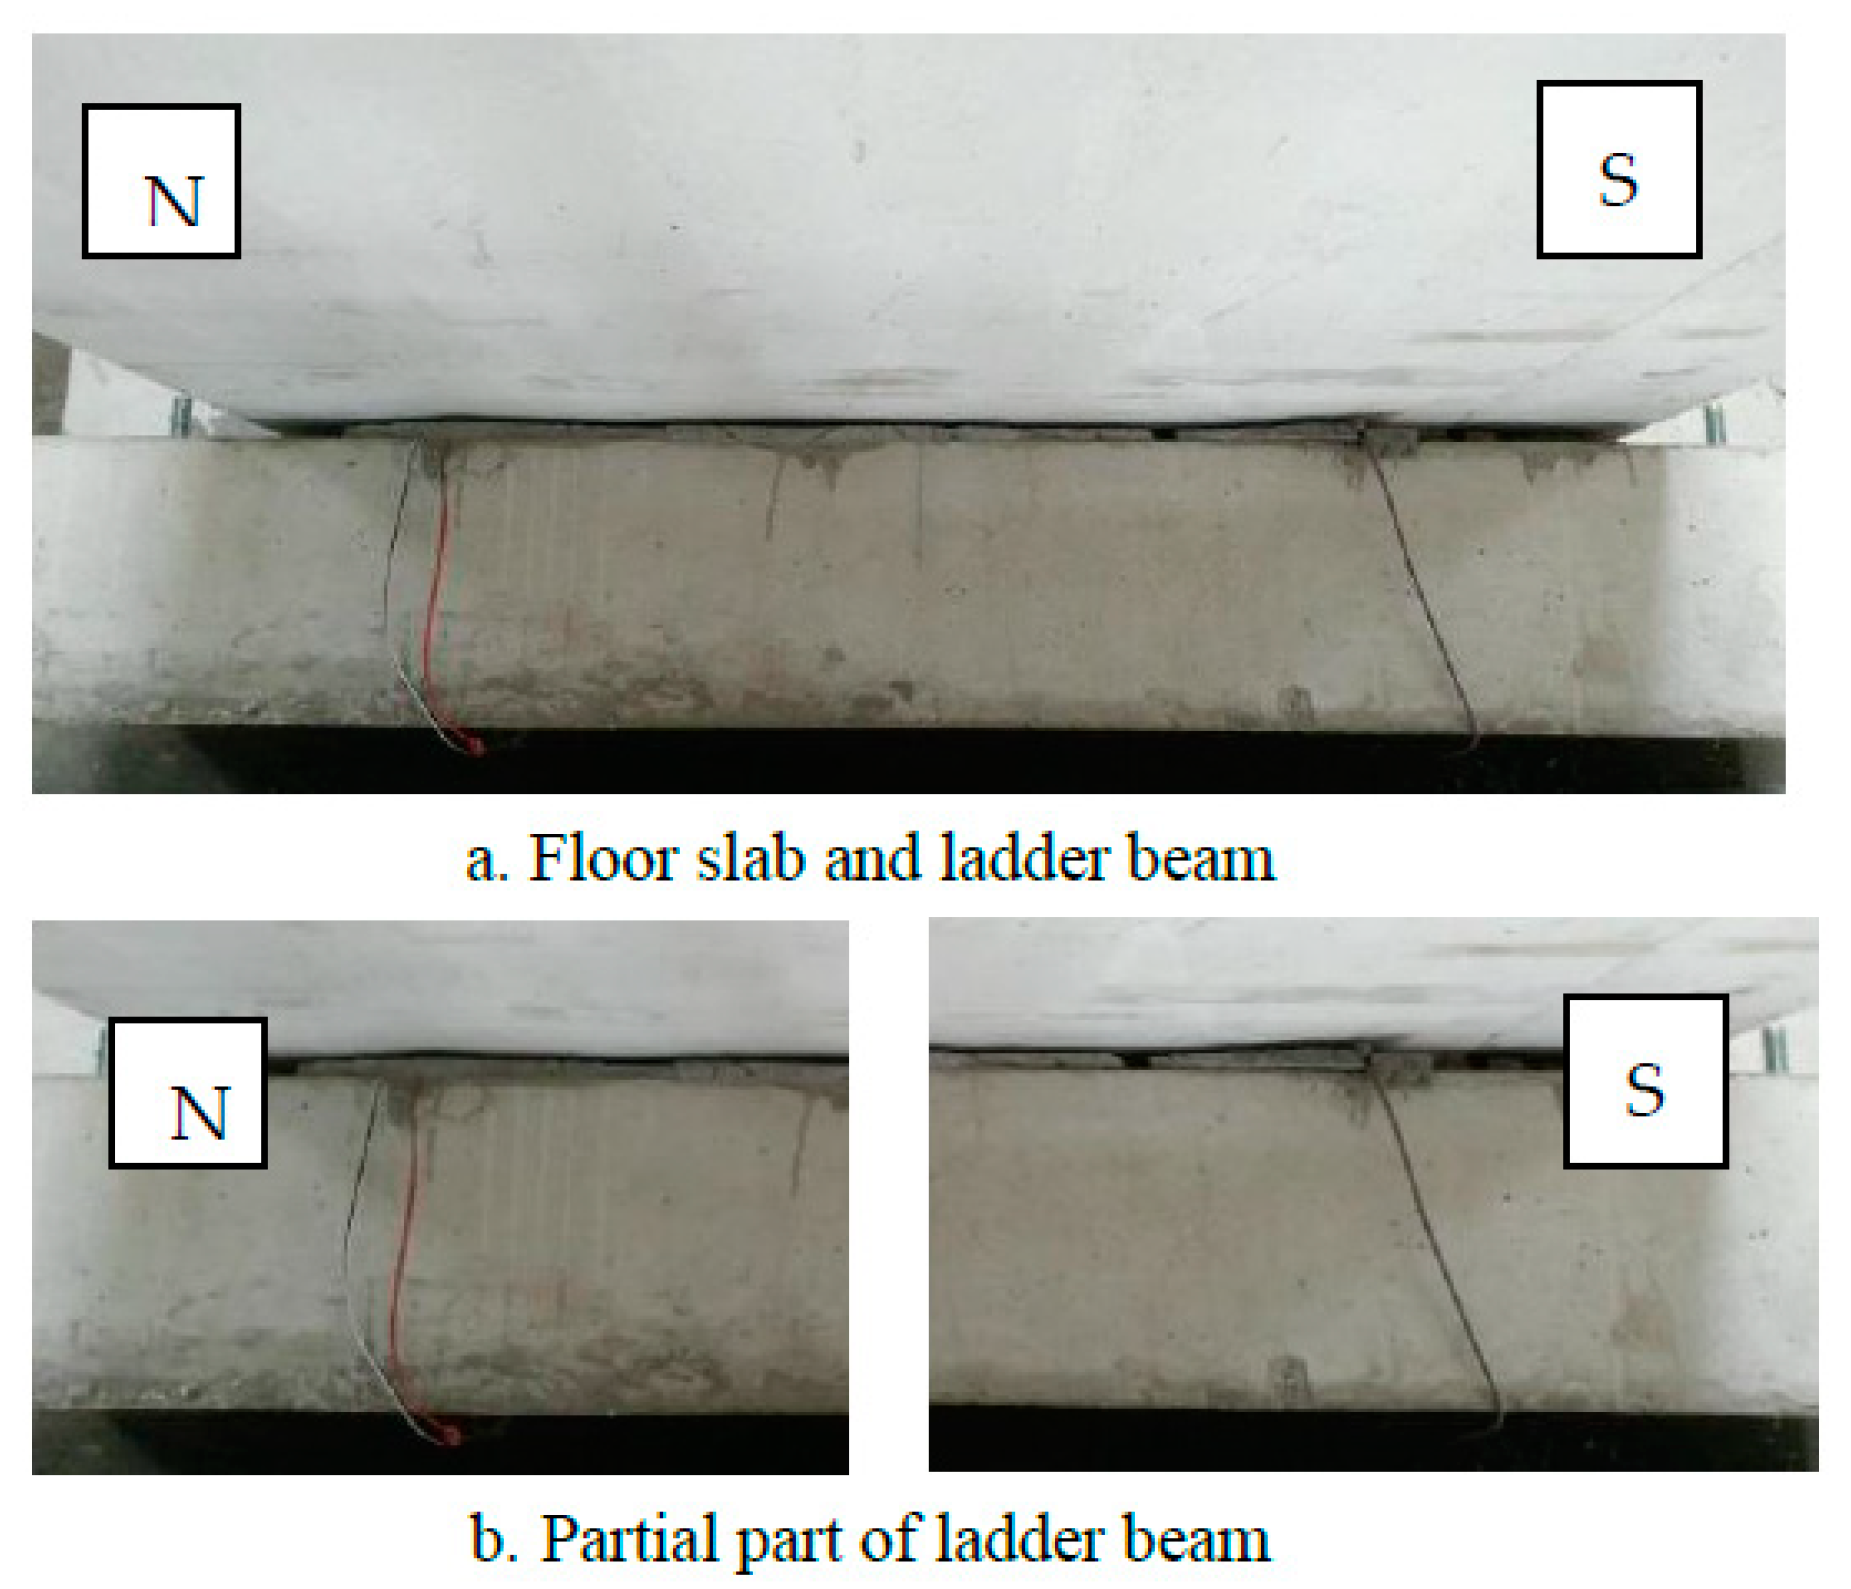
3.1.3. RV specimen
The phenomenon description of the RV-1 test process is shown in
Table 7.
The final failure photo of the specimen is shown in
Figure 10:
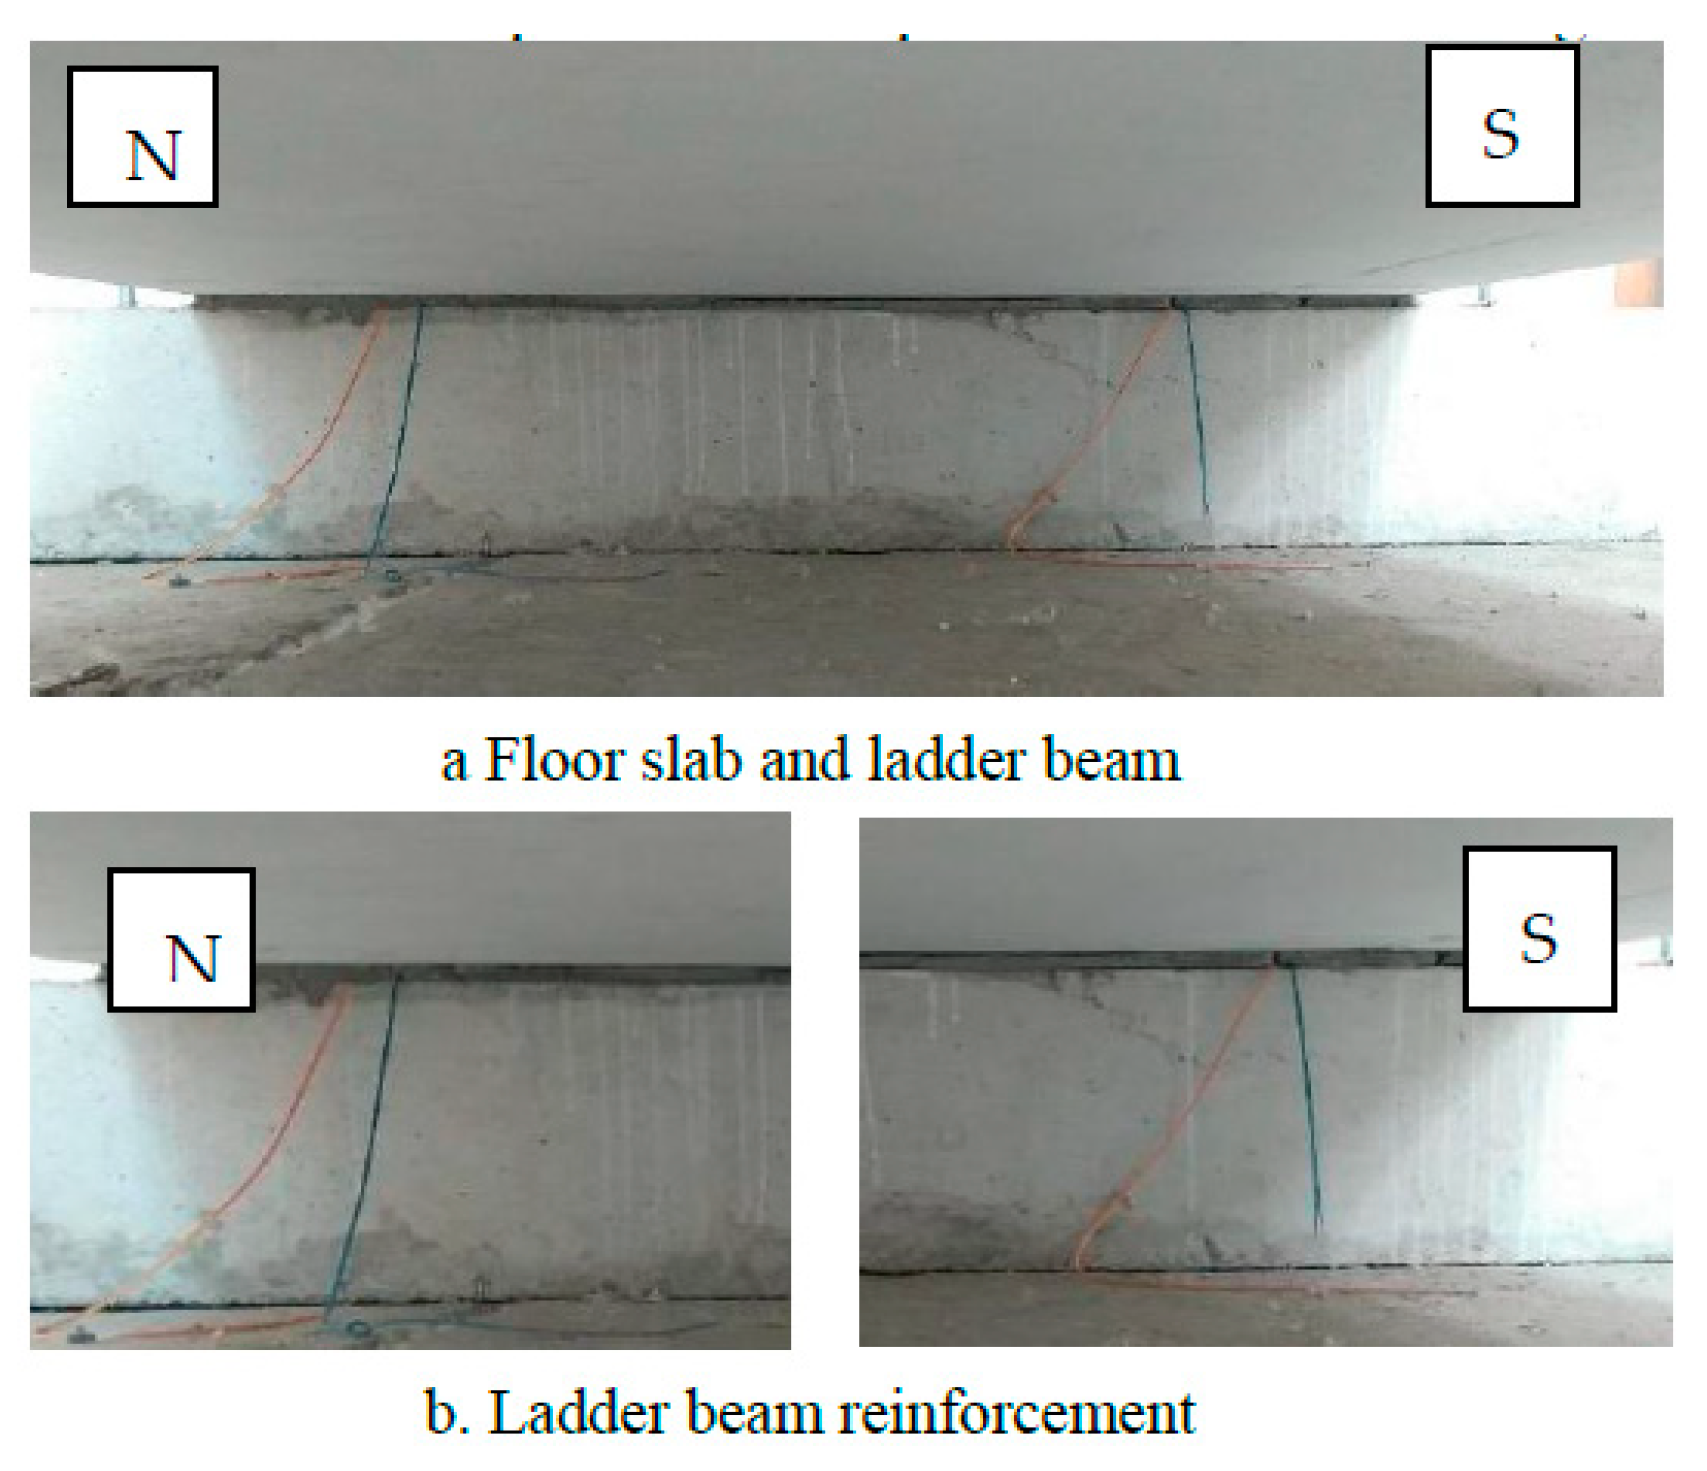
The phenomenon description of the RV-2 test process is shown in
Table 8.
The final failure photo of the specimen is shown in
Figure 11:
3.2. Analysis of Test Results
3.2.1. Hysteresis curve
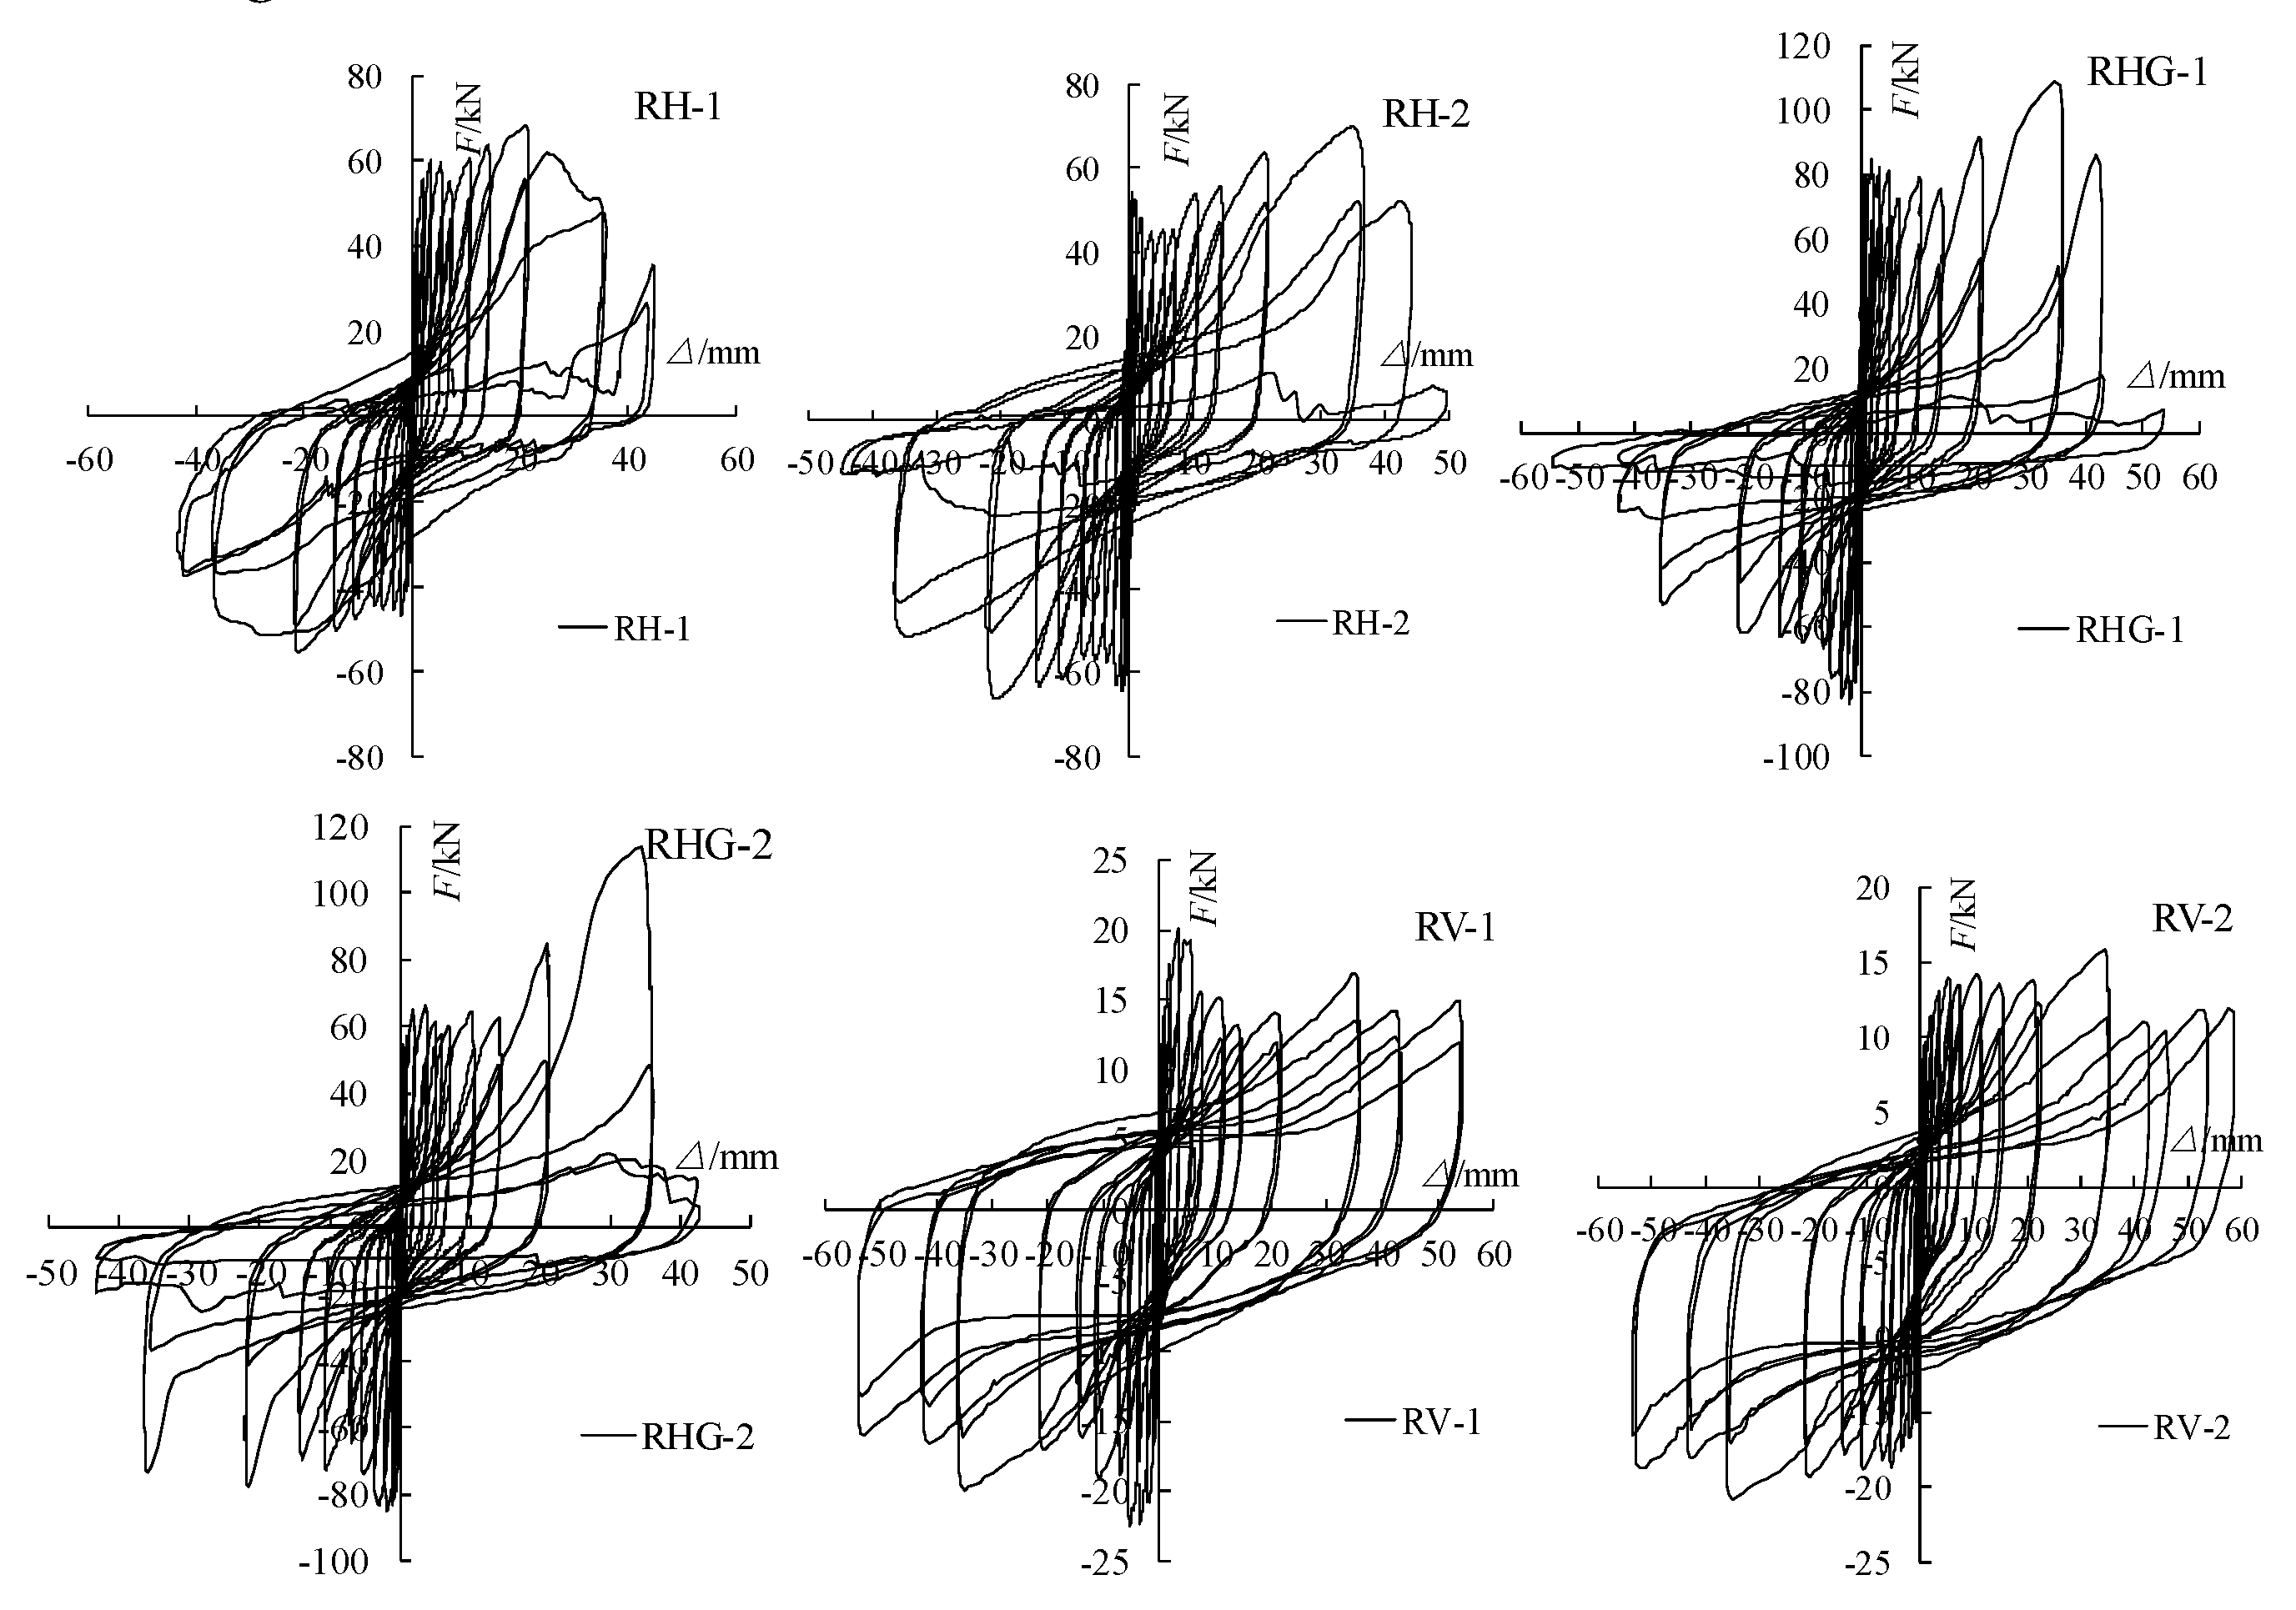
The hysteresis curve is shown in
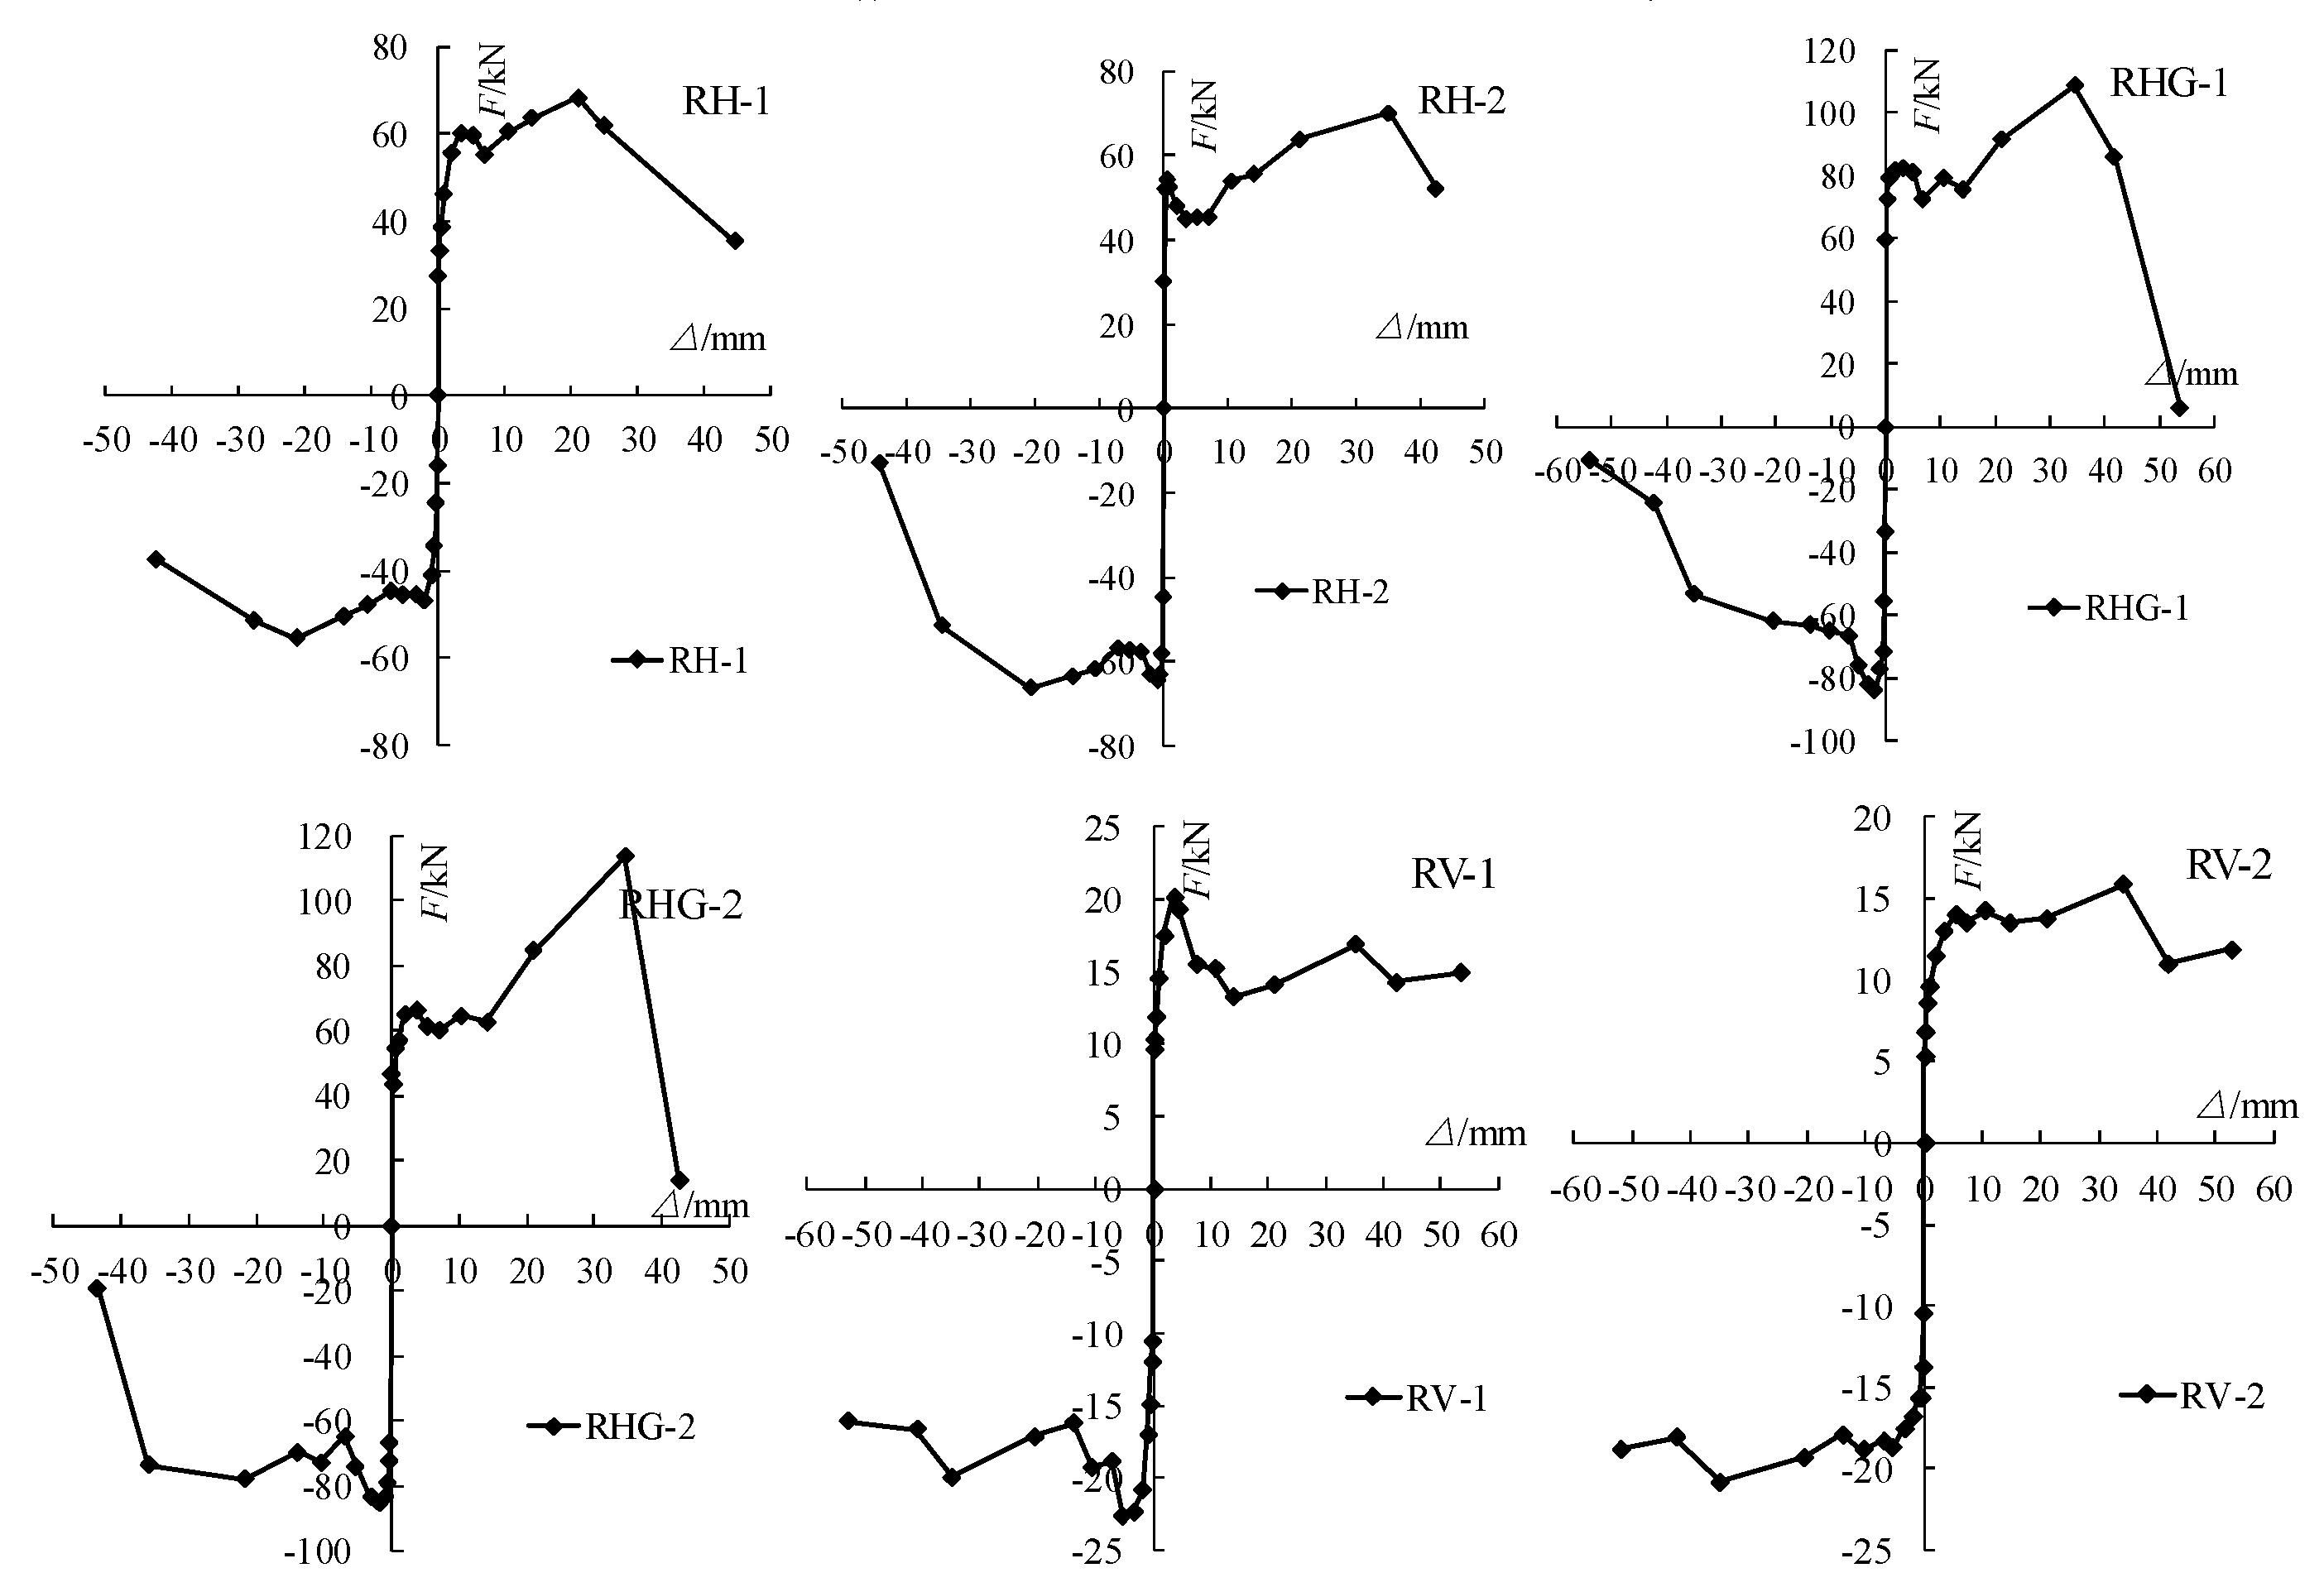
Figure 12, and it can be seen that the shape of the hysteresis curve of the RH and RHG specimens is almost the same. In the initial stage of loading, the hysteresis curve is shuttle shaped, and the hysteresis curve is full. The stiffness and bearing capacity of the specimen do not deteriorate. In the middle stage of loading, it quickly changes to an inverse S-shaped shape, and the specimen experiences significant slip. In the later stage of loading, it becomes Z-shaped, and the specimen experiences greater slip; The hysteresis curve of the RV specimen shows a shuttle shape in the initial stage of loading, and the hysteresis curve is full. The stiffness and bearing capacity of the specimen do not deteriorate, but in the middle stage of loading, it becomes an inverse S-shape. The hysteresis curve is slightly pinched, and there is a certain amount of sliding in the specimen. In the later stage of loading, it is a slight Z-shape, and the sliding of the specimen increases, but the overall sliding amount is still small;
3.2.2. Skeleton curve
The skeleton curve refers to the envelope line formed by connecting the peak points of the hysteresis curve of components under each level of load. The horizontal force vertex displacement skeleton line is the trajectory of the maximum horizontal load that can be achieved during each cyclic loading, reflecting the characteristics of different stages of the component’s stress and deformation. The skeleton curves of the three sets of specimens are shown in
Figure 13.
(1) The trend of the skeleton curve of the parallel ladder running direction specimen can be divided into elastic upward section, elastic-plastic upward section, large deformation section, and downward section:
The elastic rise section corresponds to the elastic deformation stage of all the specimen grouting materials and pin bolt reinforcement before the mortar layer cracks or less, and the overall performance is elastic. The load increases linearly with the increase of displacement; The elastic-plastic rise section corresponds to an increase in mortar layer cracking, and the load slowly increases to a level. During this process, all specimens with mortar layer cracking and damage are withdrawn from work, while the flexible grouting materials of RH and RHG specimens are subjected to compression damage and enter plasticity. All specimens’ steel bars yield and enter plasticity, and the stiffness of the specimens gradually decreases, exhibiting significant elastic-plastic behavior; The stage of large deformation corresponds to a significant increase in specimen deformation. During this process, the RH and RHG specimens yield due to damage to the flexible material, but do not enter reinforcement, resulting in a slight increase in specimen bearing capacity; After the load reaches its peak in the descending section, the parallel running direction specimen exits the work due to steel bar fracture, and more mortar layers are broken and exit the work. The skeleton curve enters the descending section, and the bearing capacity of the vertical running direction specimen steel bar without fracture slowly decreases.
(2) The trend of the skeleton curve of the vertical ladder running direction specimen can be divided into elastic upward section, elastic-plastic upward section, and downward section:
The elastic rise section corresponds to the elastic deformation stage of all the specimen grouting materials and pin bolt reinforcement before the mortar layer cracks or less, and the overall performance is elastic. The load increases linearly with the increase of displacement; The elastic-plastic rise section corresponds to an increase in mortar layer cracking, and the load slowly increases to a level. During this process, all specimens with mortar layer cracking and damage are withdrawn from work. The RV specimen flexible grouting material is subjected to compression damage and enters plasticity, while all specimen steel bars yield and enter plasticity. The specimen stiffness gradually decreases, exhibiting significant elastic-plastic behavior; After the load reaches its peak in the descending section, the vertical ladder running direction specimen exits the work due to the splitting of the concrete protective layer of the ladder beam, and more mortar layers are broken and exit the work. The skeleton curve enters the descending section, and the bearing capacity slowly decreases.
3.2.3. Bearing capacity
The bearing capacity of specimens with △=2.1mm, 5.3mm, and 21mm levels, i.e. the corresponding interlayer displacement angles of 1/500, 1/200, and 1/50, are listed in
Table 9.
From
Table 9, it can be seen that: when loaded in the direction of parallel ladder running and with an interlayer displacement angle of 1/500, the bearing capacity of each specimen is RHG>RH. When the interlayer displacement angle is 1/200, the bearing capacity of each specimen is RHG>RH. When the interlayer displacement angle is 1/50, the bearing capacity of each specimen is RHG>RH; The bearing capacity of all specimens in the parallel running direction is greater than that in the vertical running direction.
3.2.4. Stiffness degradation
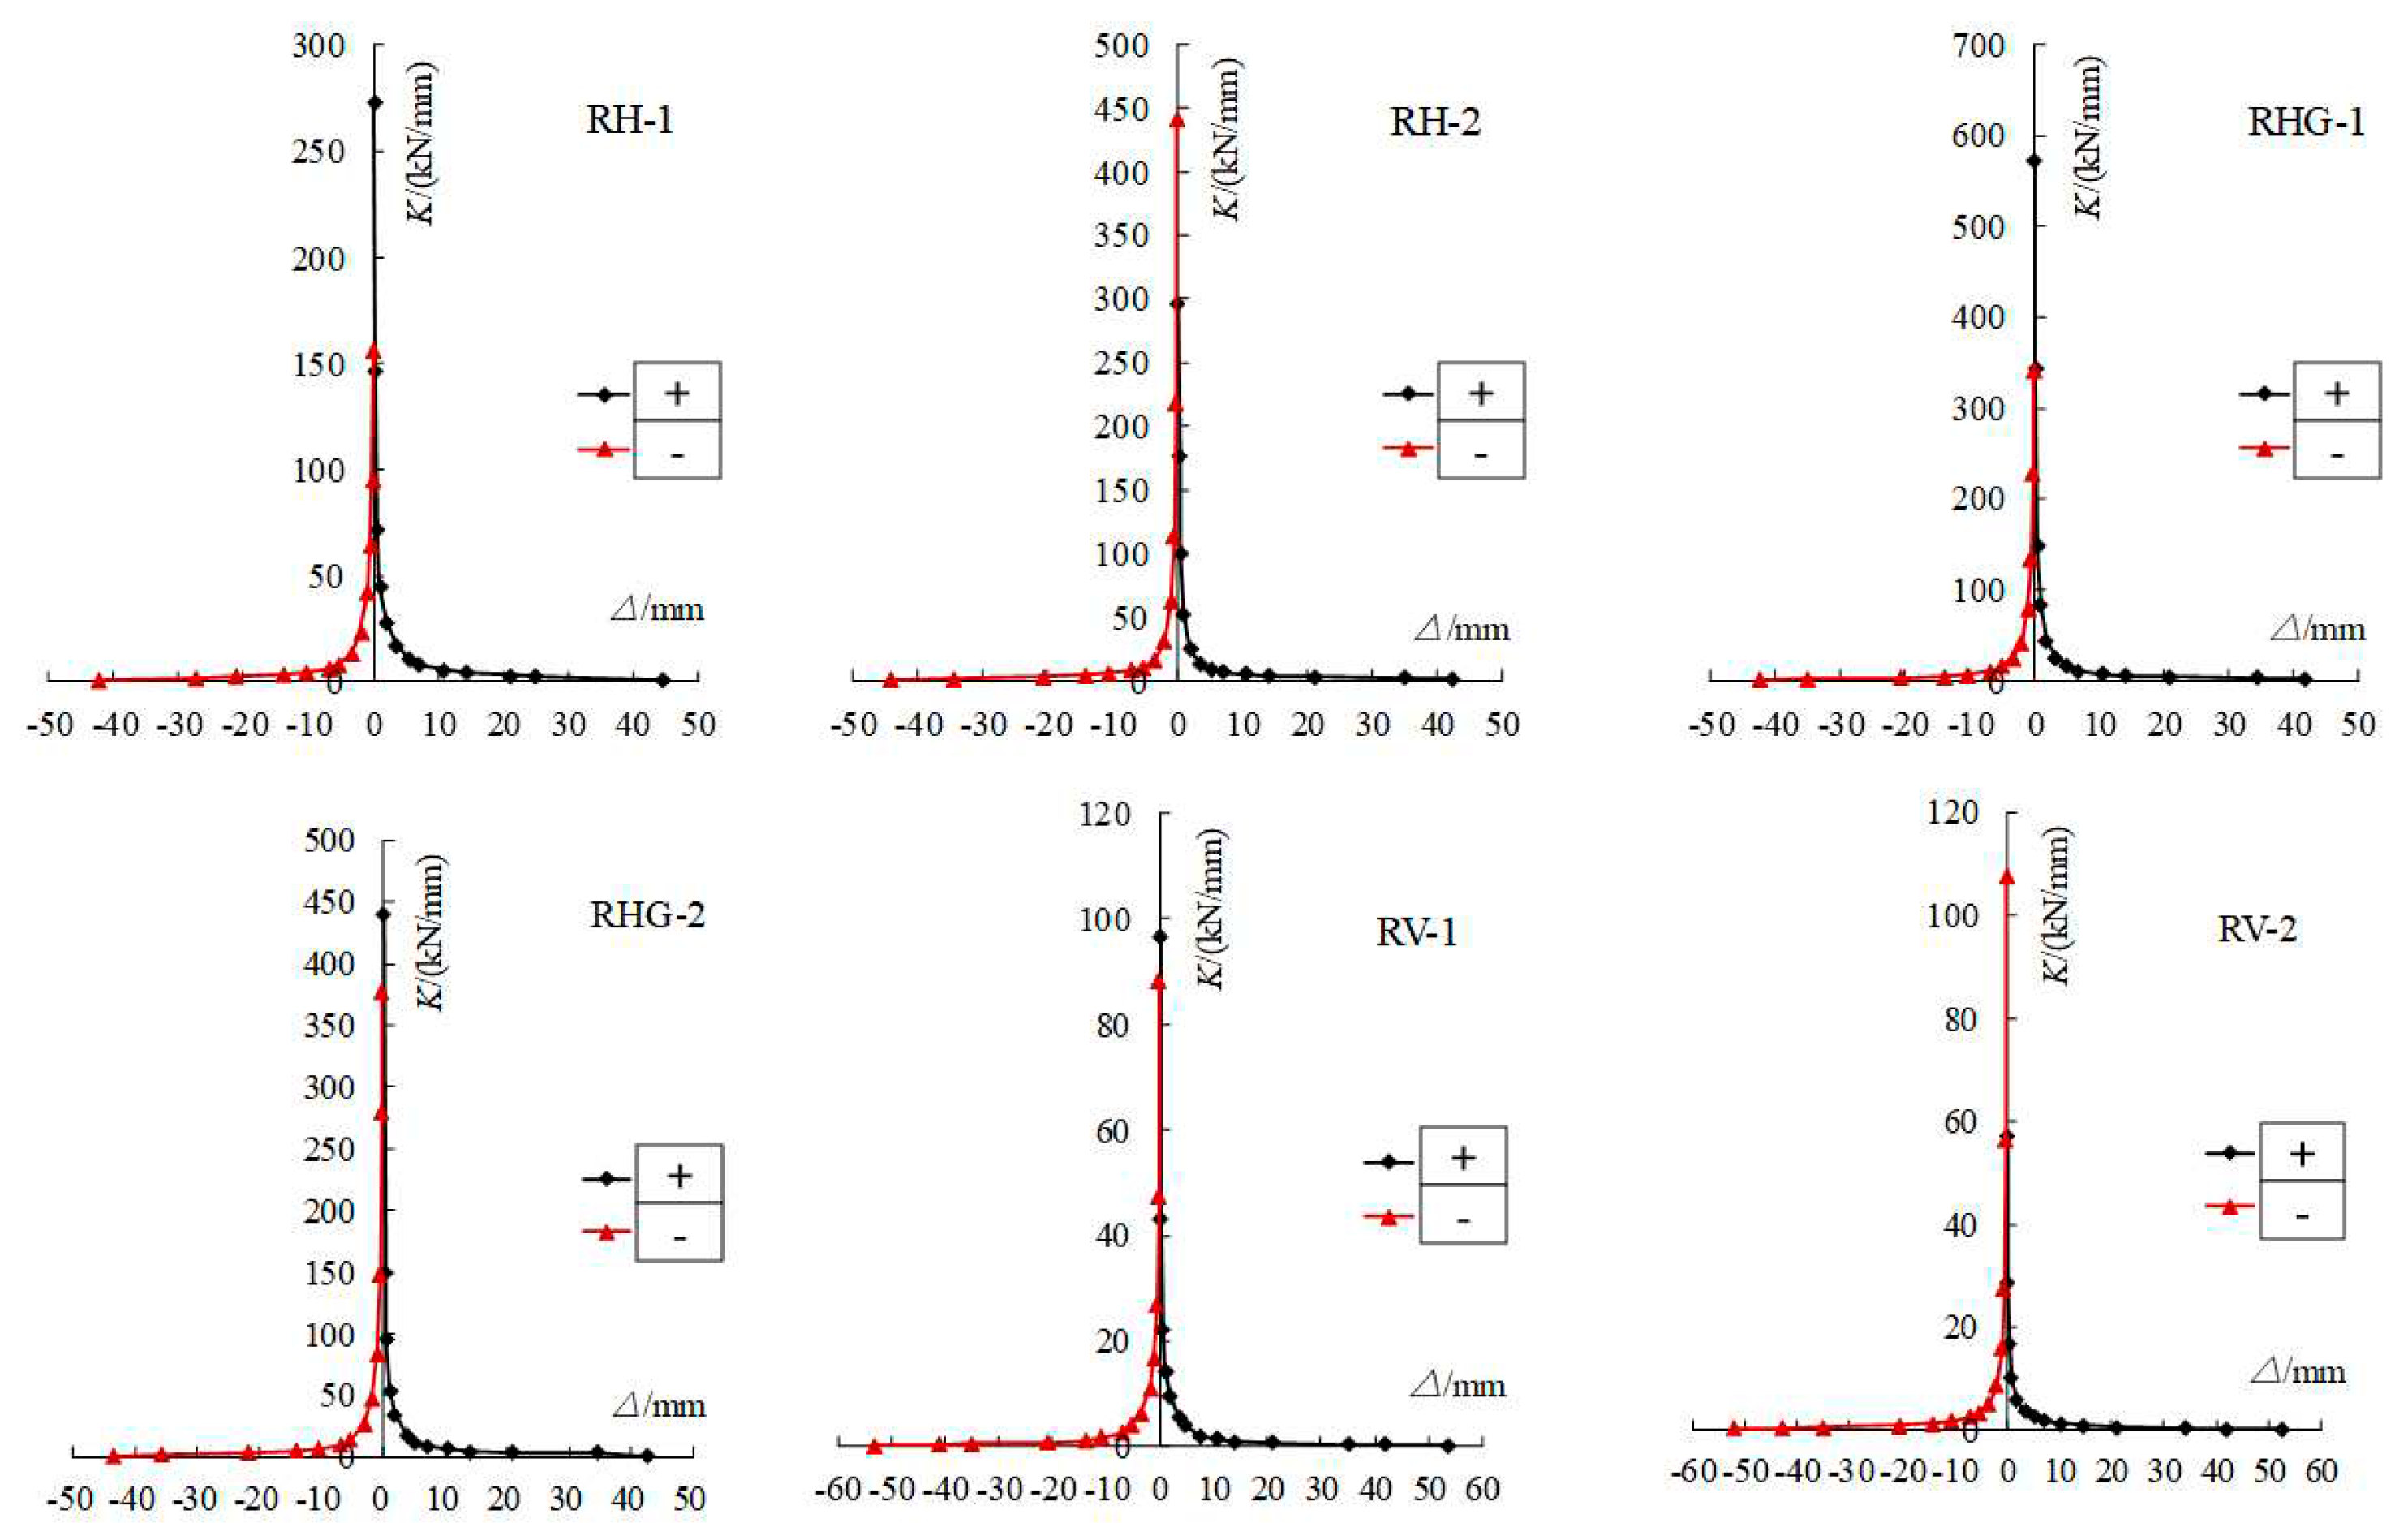
The stiffness of reinforced concrete structures or components refers to the ability of the structure or components to resist deformation under external forces. Having a certain degree of stiffness is an important indicator for a structure or component to ensure its functional performance under normal use. For the seismic design of structures or components in earthquake zones, it is of great significance to study the stiffness degradation of structures or components under low cycle repeated loads. A stiffness analysis was conducted on the specimens for this experiment. According to the relevant requirements of the "Code for Seismic Testing Methods of Buildings" [
6] (JGJl01-96), the secant stiffness was calculated according to the calculation formula given in the following equation to represent the stiffness of the specimens. The calculation results are plotted as a curve, as shown in
Figure 14.
Where:
——the load value corresponding to the i-th peak point;
——The displacement value corresponding to the i-th peak point.
From the stiffness degradation curve of the specimen, it can be seen that:
(1) With the increase of load, all specimens experienced stiffness degradation, and the stiffness degradation was significant before yield, but slowed down after yield;
(2) The initial stiffness of the RH specimen fluctuates significantly in the positive and negative directions, with an average value that is relatively close. The initial stiffness of the RHG specimen is greater in the positive direction than in the negative direction, while the initial stiffness of the RH specimen is greater in the negative direction than in the positive direction. The average initial stiffness of each specimen is: RHG>RH>RV;
(3) Average stiffness of each specimen: RHG>RH>RV;
3.2.5 energy dissipation
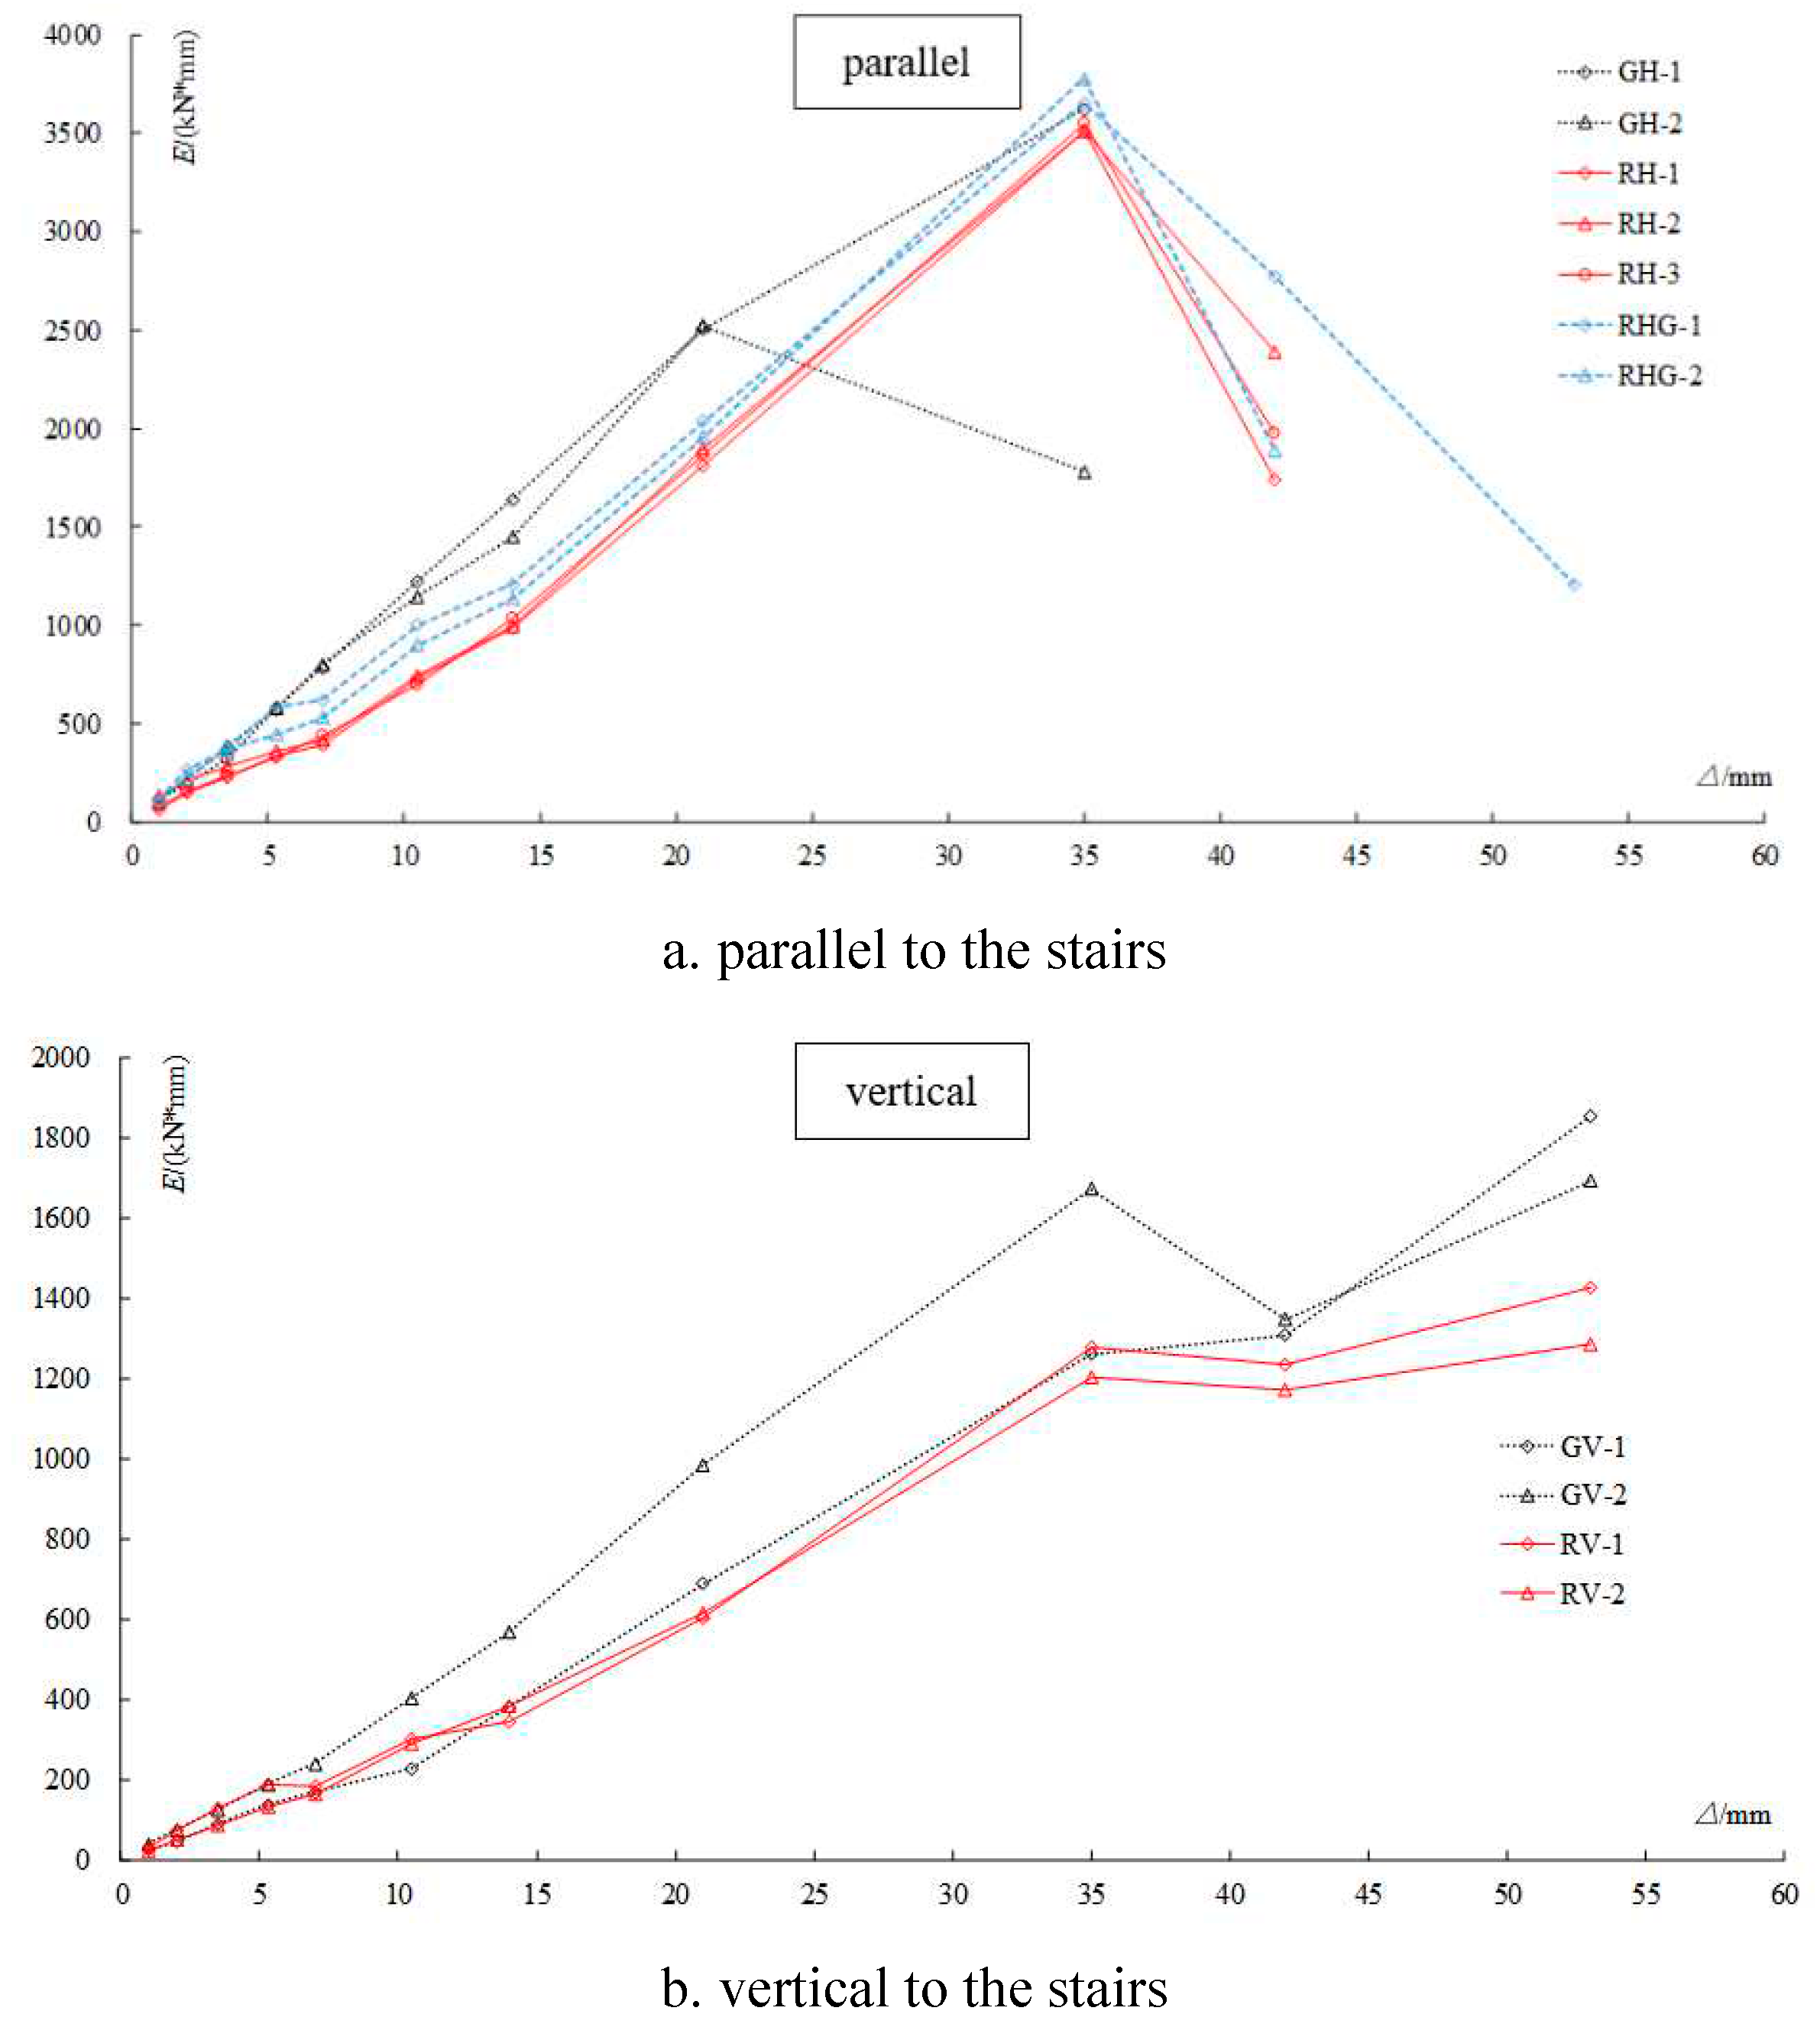
The comparison of the calculated energy dissipation coefficient curves for each specimen is shown in
Figure 15.
By comparing the energy dissipation coefficient curves of each specimen, it can be seen that:
(1) Before the load reaches its peak, the cumulative energy consumption of all specimens in the parallel running direction increases almost linearly. After reaching the peak load, the cumulative energy consumption enters a decrease; Under the same loading level, the cumulative energy consumption of the specimen is: RHG>RH;
(1) The energy dissipation coefficient of the parallel ladder running direction specimen decreases first and then increases for all specimens. The energy dissipation coefficient of the RH specimen increases slowly, while the RHG specimen remains almost unchanged without growth;
(3) Before the load reaches its peak, the cumulative energy consumption of all specimens in the vertical ladder direction increases almost linearly. After reaching the peak load, the cumulative energy consumption slightly decreases and continues to increase as the deformation increases; The energy dissipation coefficient of the specimen first decreases and then increases, with almost the same trend of change.
5 Conclusion
This article conducted pseudo static tests on three sets of six node specimens. The tests showed that compared with the vertical direction, the specimens in the parallel direction had earlier and more severe damage; When the stairs deform, the flexible hinge gives full play to its flexibility (that is, low strength and strong deformation capacity) to ease the stress on the ladder beam, pin bolt reinforcement and ladder hole, and the bearing capacity of the flexible hinge node is moderate, which can not only slow down the slant support effect under small and medium earthquakes, but also ensure that the stairs will not fall off under large earthquakes; Through experimental comparison, it has been found that using node form 2 for ladder holes can better leverage the advantages of flexible materials. Therefore, it is recommended to choose node form 2 for the next step of testing.
Author Contributions
Y.Y., T.M., investigation; D.F., Y.Y., writing. All authors have read and agreed to the published version of the manuscript.
Data Availability Statement
The data used in the manuscript can be replicated through calculation method as described in the manuscript. The data supporting the conclusions of the study can be obtained in the manuscript.
Acknowledgments
The authors wish to express their sincere to the Natural Science Foundation of Jiangsu Province (Grant No. BK20200793).
Conflicts of Interest
The authors declare that there is no conflict of interest regarding the publication of this paper.
References
- Yi Weijian, Xiao Yan, et al The joint working performance of typical teaching building frames and stairs in the "5.12" Wenchuan earthquake disaster area [J]. Journal of Building Science and Engineering, 2009, 26 (2): 38-45.
- Yan Wei, Peng Yilan, Xu Tao. Analysis of the seismic performance impact of structures [D]. Architecture Science, 2017,33 (9): 7-12.
- Construction of prefabricated concrete structure connection nodes (2015 bound edition): G310-1-2 [S]. Beijing: China Planning Press, 2015.
- Zhu Yuyu. Pseudostatic experimental study on seismic performance of reinforced concrete frame stairwells [D]. Beijing University of Technology, 2012.
- Hu Xiaoliang. Analysis of the Impact of Stairs on the Seismic Performance of Frame Structures[D]. Hefei University of Technology, 2014.
- Code for Seismic Testing of Buildings JGJ/T 101-2015 [S]. Beijing: China Planning Press, 2015.
- Standard for Test Methods of Concrete Structures GB/T 50152-2012 [S]. Beijing: China Construction Industry Press, 2012.
- Prefabricated reinforced concrete stairs (public buildings): 20G367-2 [S]. Beijing: China Planning Press, 2015.
- Lan Chung, Tae Won Park, Ji Hyun Hwang. Strengthening methods for exsting wall type structures by installing additional shear walls [J]. Structural Engineering & Mechanics, 2014, 49 (4): 523-536.
- Qi, HW; Li, MA and Huang, XN. Seismic Reinforcement Conception Design of Existing Masonry Structure [J]. 2011,3448-3452.
- Turon, CM and Alzate, YFV. Special braced stairs versus typical braced frames. New architectural-structural-seismic approach to stair design [J].
- Wang X, Hutchinson T C.Computational assessment of the seismic behavior of steel stairs[J].Engineering Structures, 2018, 166:376-386.
- Cong, SP; Zhang, Z; Zheng, Q; Xu, ZF. Seismic behavior of reinforced concrete frame staircase with separated slab stairs [J]. Bulletin of Earthquake Engineering, 2022, 21 (2):1325-1352.
- Zhipeng G, Ailin Z, Xuechun L, et al.Seismic behavior of prefabricated steel frame connection with Z-shaped cantilever beam and reduced beam section[J].Journal of Building Structures, 2017, 38(6):43-52.
- Aguiar R, Mora D, Muoz D, et al.Seismic Analysis of Stairs with Three Models Using the Spectral and the Capacity Spectrum Methods, which Give Access to a Building with Seismic Isolators[J].Revista Ingenieria de Construccion, 2018, 32(3).
Figure 1.
Detailed Drawing of New Connection Node.
Figure 1.
Detailed Drawing of New Connection Node.
Figure 2.
Processing diagram of end hysteresis test specimen.
Figure 2.
Processing diagram of end hysteresis test specimen.
Figure 3.
Finished product diagram of end hysteresis test specimen.
Figure 3.
Finished product diagram of end hysteresis test specimen.
Figure 4.
Schematic diagram of end hysteresis test of end hysteresis test device. 1- Reaction wall; 2- Limit steel beam; 3- actuator; 4- Test piece; 5- Limit block;
Figure 4 Hysteresis Test Device.
Figure 4.
Schematic diagram of end hysteresis test of end hysteresis test device. 1- Reaction wall; 2- Limit steel beam; 3- actuator; 4- Test piece; 5- Limit block;
Figure 4 Hysteresis Test Device.
Figure 5.
Test Plan for Stair End Node Test.
Figure 5.
Test Plan for Stair End Node Test.
Figure 6.
Photo of RH-1 specimen failure.
Figure 6.
Photo of RH-1 specimen failure.
Figure 7.
Photo of RH-2 specimen failure.
Figure 7.
Photo of RH-2 specimen failure.
Figure 8.
Photo of RH1 specimen failure.
Figure 8.
Photo of RH1 specimen failure.
Figure 9.
Photo of RHG1 specimen failure.
Figure 9.
Photo of RHG1 specimen failure.
Figure 10.
Photo of RV-1 specimen failure.
Figure 10.
Photo of RV-1 specimen failure.
Figure 11.
Photo of RV-2 specimen failure.
Figure 11.
Photo of RV-2 specimen failure.
Figure 12.
Hysteresis curves of each specimen.
Figure 12.
Hysteresis curves of each specimen.
Figure 13.
Skeleton curves of each specimen.
Figure 13.
Skeleton curves of each specimen.
Figure 14.
Stiffness degradation curve of each specimen.
Figure 14.
Stiffness degradation curve of each specimen.
Figure 15.
Comparison of Accumulated Energy Consumption of Each Test Piece.
Figure 15.
Comparison of Accumulated Energy Consumption of Each Test Piece.
Table 1.
Parameters of End Hysteresis Test Specimens.
Table 1.
Parameters of End Hysteresis Test Specimens.
| Node type |
specimen number |
loading method |
reinforcement diameter/mm |
grouting material |
ladder hole form |
specimen quantity |
| Flexible hinge |
RH |
in-plane axial |
16 |
lotion flexible material |
form1 |
2 |
| RHG |
in-plane axial |
16 |
form2 |
2 |
| RV |
in-plane vertical axis |
16 |
form1 |
2 |
Table 2.
Loading Level and Corresponding Displacement.
Table 2.
Loading Level and Corresponding Displacement.
| Load Level |
story drift ratio/θ |
story drift /△ |
| 1 |
1/10000 |
0.1mm |
| 2 |
1/5000 |
0.21 mm |
| 3 |
1/2000 |
0.52 mm |
| 4 |
1/1000 |
1.05 mm |
| 5 |
1/550 |
1.9 mm |
| 6 |
1/300 |
3.5 mm |
| 7 |
1/200 |
5.25 mm |
| 8 |
1/150 |
7 mm |
| 9 |
1/100 |
10.5 mm |
| 10 |
1/75 |
14 mm |
| 11 |
1/50 |
21 mm |
| 12 |
1/25 |
42 mm |
| 13 |
1/20 |
52.5 mm |
Table 3.
RH-1 specimen test process.
Table 3.
RH-1 specimen test process.
| Load Level |
Experimental phenomenon |
| △=0.1, 0.2, 0.5mm |
The test piece is undamaged, and there is almost no misalignment between the step board and the mortar layer |
| △=1.0, 2.0, 3.5, 5.3mm |
Slight misalignment between the step board and the mortar layer, and the misalignment increases with the increase of loading displacement |
| △=7mm |
The mortar layer cracked at the pin bolt reinforcement, and a small amount of mortar on the inner side was pushed out by the step plate |
| △=10.5, 14, 21mm |
The mortar layer continues to crack, and the inner side of the mortar layer is crushed and pushed out |
| △=35mm |
The mortar layer is more severely broken. When subjected to negative loading, the concrete on the west side of the step plate hole wall splits and damages, and the steel bars on the east side of the pin bolt break. The specimen is tilted during loading, and the bearing capacity begins to decrease |
| △=42mm |
The specimen is more severely damaged and skewed |
Table 4.
RH-2 specimen test process.
Table 4.
RH-2 specimen test process.
| Load Level |
Experimental phenomenon |
| △=0.1, 0.2, 0.5mm |
The test piece is undamaged, and there is almost no misalignment between the step board and the mortar layer |
| △=1.0, 2.0mm |
Slight misalignment between the step board and the mortar layer, and the misalignment increases with the increase of loading displacement |
| △=3.5, 5.3, 7mm |
The mortar layer cracked at the pin bolt reinforcement, and the middle part of the mortar on the east side cracked |
| △=10.5, 14, 21mm |
Cracks on the inner side of the mortar layer increase, and some mortar is pushed out by the step board |
| △=35mm |
The cracking of the mortar layer is more severe. When subjected to negative loading, the concrete on the west side of the ladder hole wall splits and damages, and all the pin bolt reinforcement is broken |
| △=42mm |
The concrete on the west side of the ladder hole wall fell off, and the east side of the ladder hole wall slightly split, causing serious damage to the specimen |
Table 5.
RHG-1 Specimen Test Process.
Table 5.
RHG-1 Specimen Test Process.
| Load Level |
Experimental phenomenon |
| △=0.1, 0.2mm |
The test piece is undamaged, and there is almost no misalignment between the step board and the mortar layer |
| △=0.5mm |
Cracking in the middle of the east side of the mortar layer |
| △=1.0, 2.0, 3.5mm |
The cracking of the mortar layer increases, and the step board and mortar layer slightly slide, and the sliding amount increases with the increase of loading displacement |
| △=5.3mm |
The mortar layer is damaged, and the concrete on the east side of the ladder hole wall is split and damaged |
| △=7.0mm |
The mortar layer continues to be damaged, and the concrete on the west side of the ladder hole wall is cracked and damaged |
| △=10.5, 14.0mm |
The mortar continues to crack and break, and the concrete cracking on the wall of the ladder hole increases and a small amount of detachment occurs |
| △=21.0, 35.0mm |
The mortar layer is more severely broken, the wall of the ladder hole is more severely broken, and the ladder beam splits on the outside at the pin bolt reinforcement |
| △=42.0mm |
The mortar layer is more severely broken, and the wall of the ladder hole is more severely broken |
| △=53.0mm |
The specimen emits a sound, the steel bars break, and the bearing capacity is almost reduced to zero |
Table 6.
RHG-2 Specimen Test Process.
Table 6.
RHG-2 Specimen Test Process.
| Load Level |
Experimental phenomenon |
| △=0.1, 0.2, 0.5mm |
The test piece is undamaged, and there is almost no misalignment between the step board and the mortar layer |
| △=1.0, 2.0mm |
Slight sliding between the step board and the mortar layer, and the sliding amount increases with the increase of loading displacement |
| △=3.5mm |
The middle part of the east side of the mortar layer is cracked, and the west side of the mortar layer is more noticeably staggered |
| △=5.3mm |
Mortar crushing is more severe, and the concrete hole wall of the west staircase is cracked |
| △=7.0, 10.5, 14.0mm |
The mortar layer is more severely broken, and a small amount of concrete on the outer side of the ladder beam falls off |
| △=21.0mm |
The mortar layer continues to break, and the concrete on the outer side of the ladder beam at the pin bolt reinforcement splits |
| △=35.0mm |
The mortar layer continues to break, and the damage to the wall of the ladder hole on the west side is even more severe |
| △=42.0mm |
The specimen emits a sound, the steel bars break, and the bearing capacity is almost reduced to zero |
Table 7.
RV-1 specimen test process.
Table 7.
RV-1 specimen test process.
| Sample |
Load Level |
Experimental phenomenon |
| RV |
△=0.1, 0.2, 0.5mm |
The test piece is undamaged, and there is almost no sliding between the step board and the mortar layer |
| △=1.0, 2.0mm |
Slight misalignment between the step board and the mortar layer, and the misalignment increases with the increase of loading displacement |
| △=3.5mm |
A small amount of peeling off at the inner edge of the mortar layer |
| △=7, 10.5mm |
The inner side of the mortar layer falls off more severely and cracks at the pin bolt reinforcement |
| △=14, 21mm |
The cracking of the mortar layer is more severe, and a small amount of fragments on the inner side are pushed out by the step board |
| △=35, 42, 53mm |
A large number of fragments on the inner side of the mortar layer have been pushed out by the step plate, and the deformation is concentrated in the south pin bolt reinforcement |
Table 8.
RV-2 specimen test process.
Table 8.
RV-2 specimen test process.
| Load Level |
Experimental phenomenon |
| △=0.1, 0.2, 0.5mm |
The test piece is undamaged, and there is almost no misalignment between the step board and the mortar layer |
| △=1.0, 2.0, 3.5, 5.3mm |
Slight misalignment between the step board and the mortar layer, and the misalignment increases with the increase of loading displacement |
| △=7, 10.5mm |
Cracks occurred at the inner pin bolt reinforcement of the mortar layer, and a small amount of mortar fragments were pushed out by the step plate at the southern pin bolt reinforcement |
| △=14.0, 21.0mm |
The cracking of the mortar layer is more severe, and the mortar fragments at the south pin bolt reinforcement are pushed out by the step plate |
| △=35.0, 42.0, 53.0mm |
The mortar layer on the south side is pushed out in large quantities by the step board, while the mortar layer on the north side is slightly pushed out |
Table 9.
shows the bearing capacity of each specimen at △=2.1mm, 5.3mm, and 21mm levels.
Table 9.
shows the bearing capacity of each specimen at △=2.1mm, 5.3mm, and 21mm levels.
| Story displacement |
△=2.1mm |
△=-2.1mm |
△=5.3mm |
△=-5.3mm |
△=21mm |
△=-21mm |
| RH-1 |
55.7 |
-46.72 |
59.56 |
-45.25 |
68.31 |
-55.38 |
| RH-2 |
48.27 |
-63.13 |
45.58 |
-56.94 |
63.93 |
-66.2 |
| RH-3 |
51.5 |
-64.99 |
56.77 |
-56.78 |
70.98 |
-63.17 |
| RHG-1 |
81.7 |
-84.18 |
80.88 |
-75.68 |
91.56 |
-61.85 |
| RHG-2 |
65.24 |
-85.44 |
61.15 |
-74.05 |
84.51 |
-78.04 |
| RV-1 |
17.5 |
-20.79 |
19.27 |
-22.53 |
14.11 |
-17.13 |
| RV-2 |
11.47 |
-16.78 |
13.98 |
-17.87 |
13.78 |
-19.28 |
|
Disclaimer/Publisher’s Note: The statements, opinions and data contained in all publications are solely those of the individual author(s) and contributor(s) and not of MDPI and/or the editor(s). MDPI and/or the editor(s) disclaim responsibility for any injury to people or property resulting from any ideas, methods, instructions or products referred to in the content. |
© 2023 by the authors. Licensee MDPI, Basel, Switzerland. This article is an open access article distributed under the terms and conditions of the Creative Commons Attribution (CC BY) license (http://creativecommons.org/licenses/by/4.0/).
