Submitted:
14 November 2023
Posted:
15 November 2023
You are already at the latest version
Abstract
Keywords:
1. Introduction
2. Preliminaries
2.1. Surface Operators and Green’s Theorem on Surface
2.2. The Convection-Reaction-Diffusion Equations on Surface
2.3. The Reaction-Diffusion Equation with Characteristic Directional Derivative
3. A Modified Characteristic Finite Element Method (MCFEM) Based on Taylor Expansion
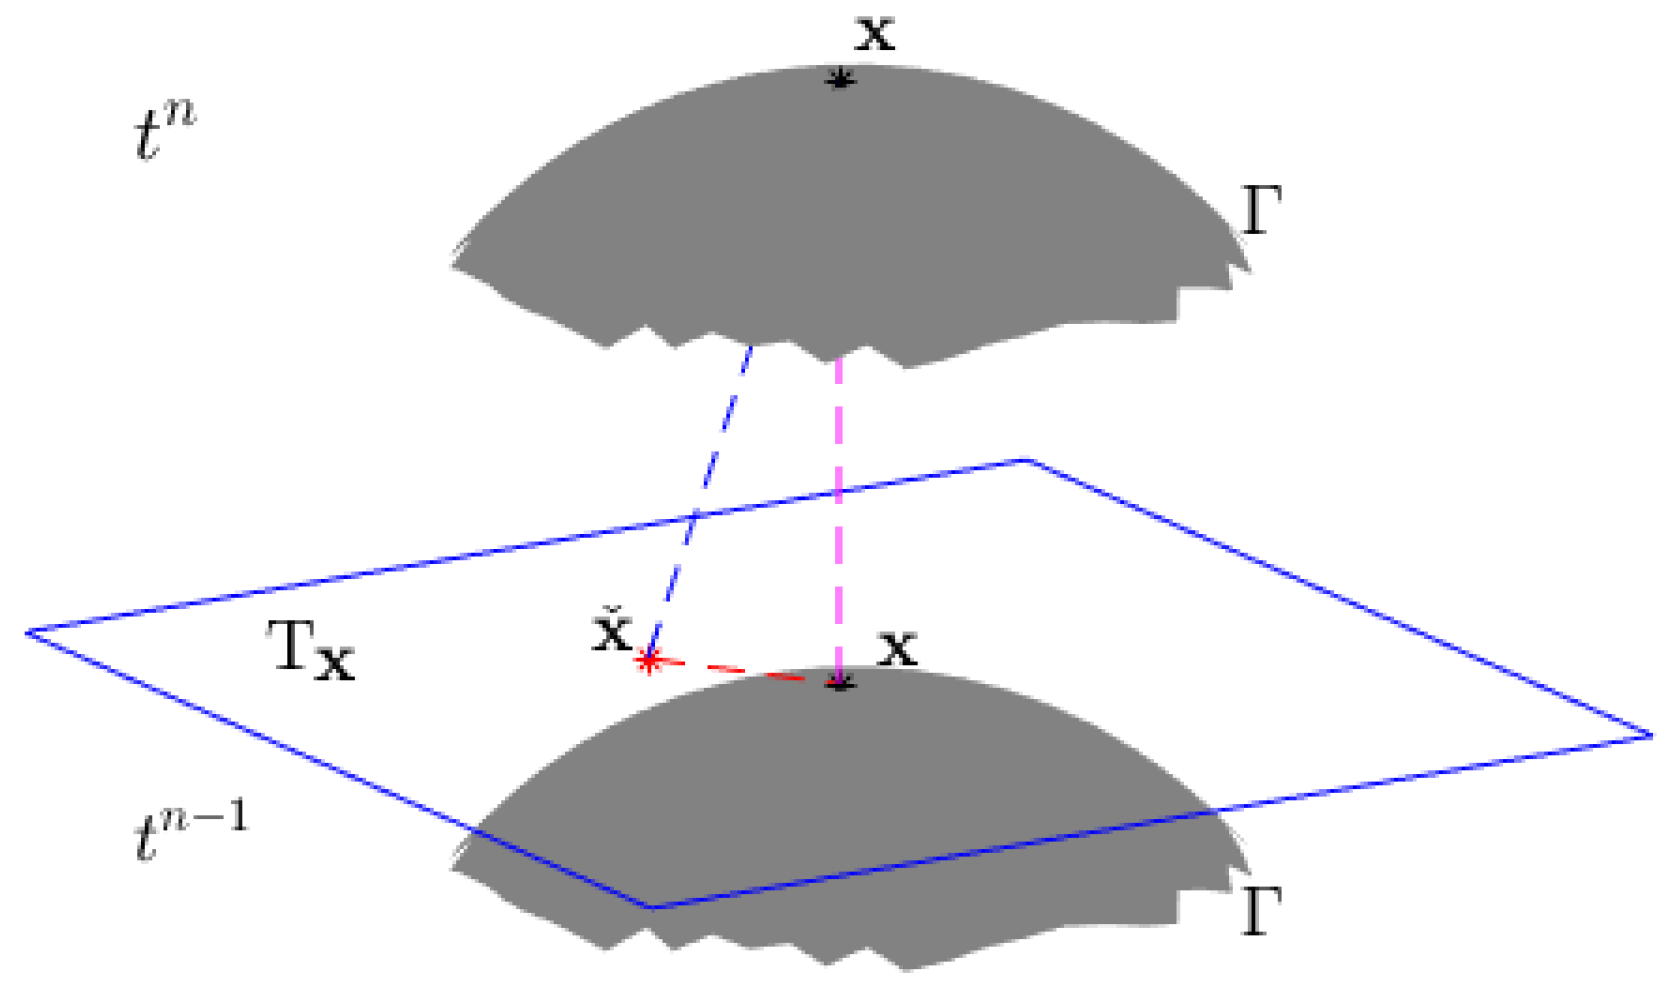
3.1. The Reconstruction Method Based on Taylor Expansion
3.2. Temporal Discretization of the MCFEM
3.3. The Surface Finite Element Method
3.4. The Analysis of Reconstruction Methods in MCFEM and CFEM
4. Numerical Examples
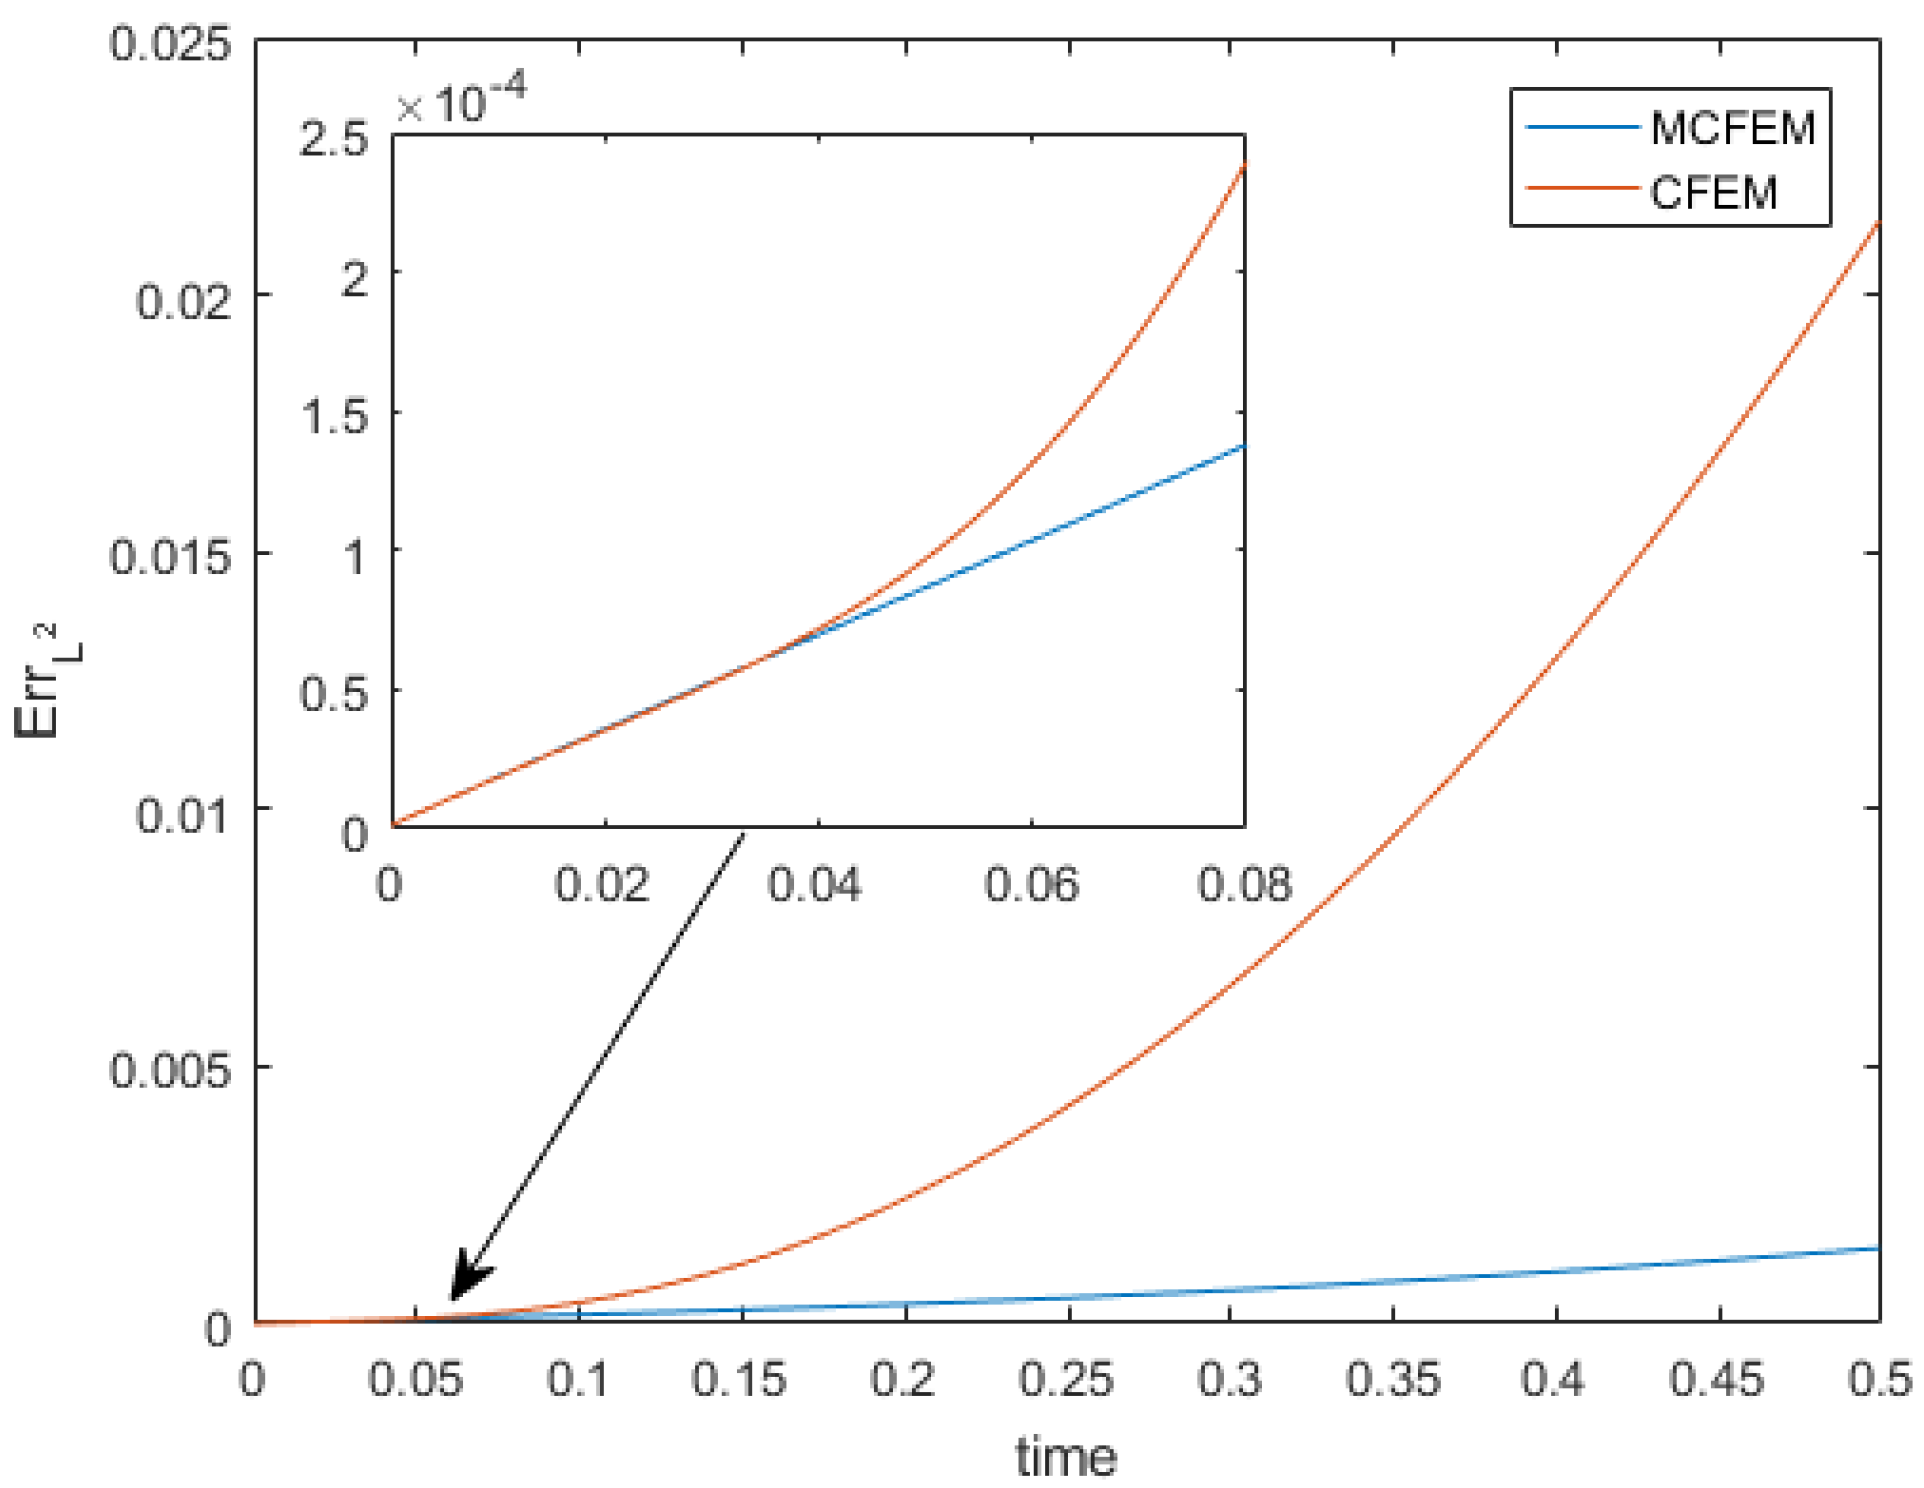
4.1. Accuracy Test on the Sphere
 |
 |
 |
 |
 |
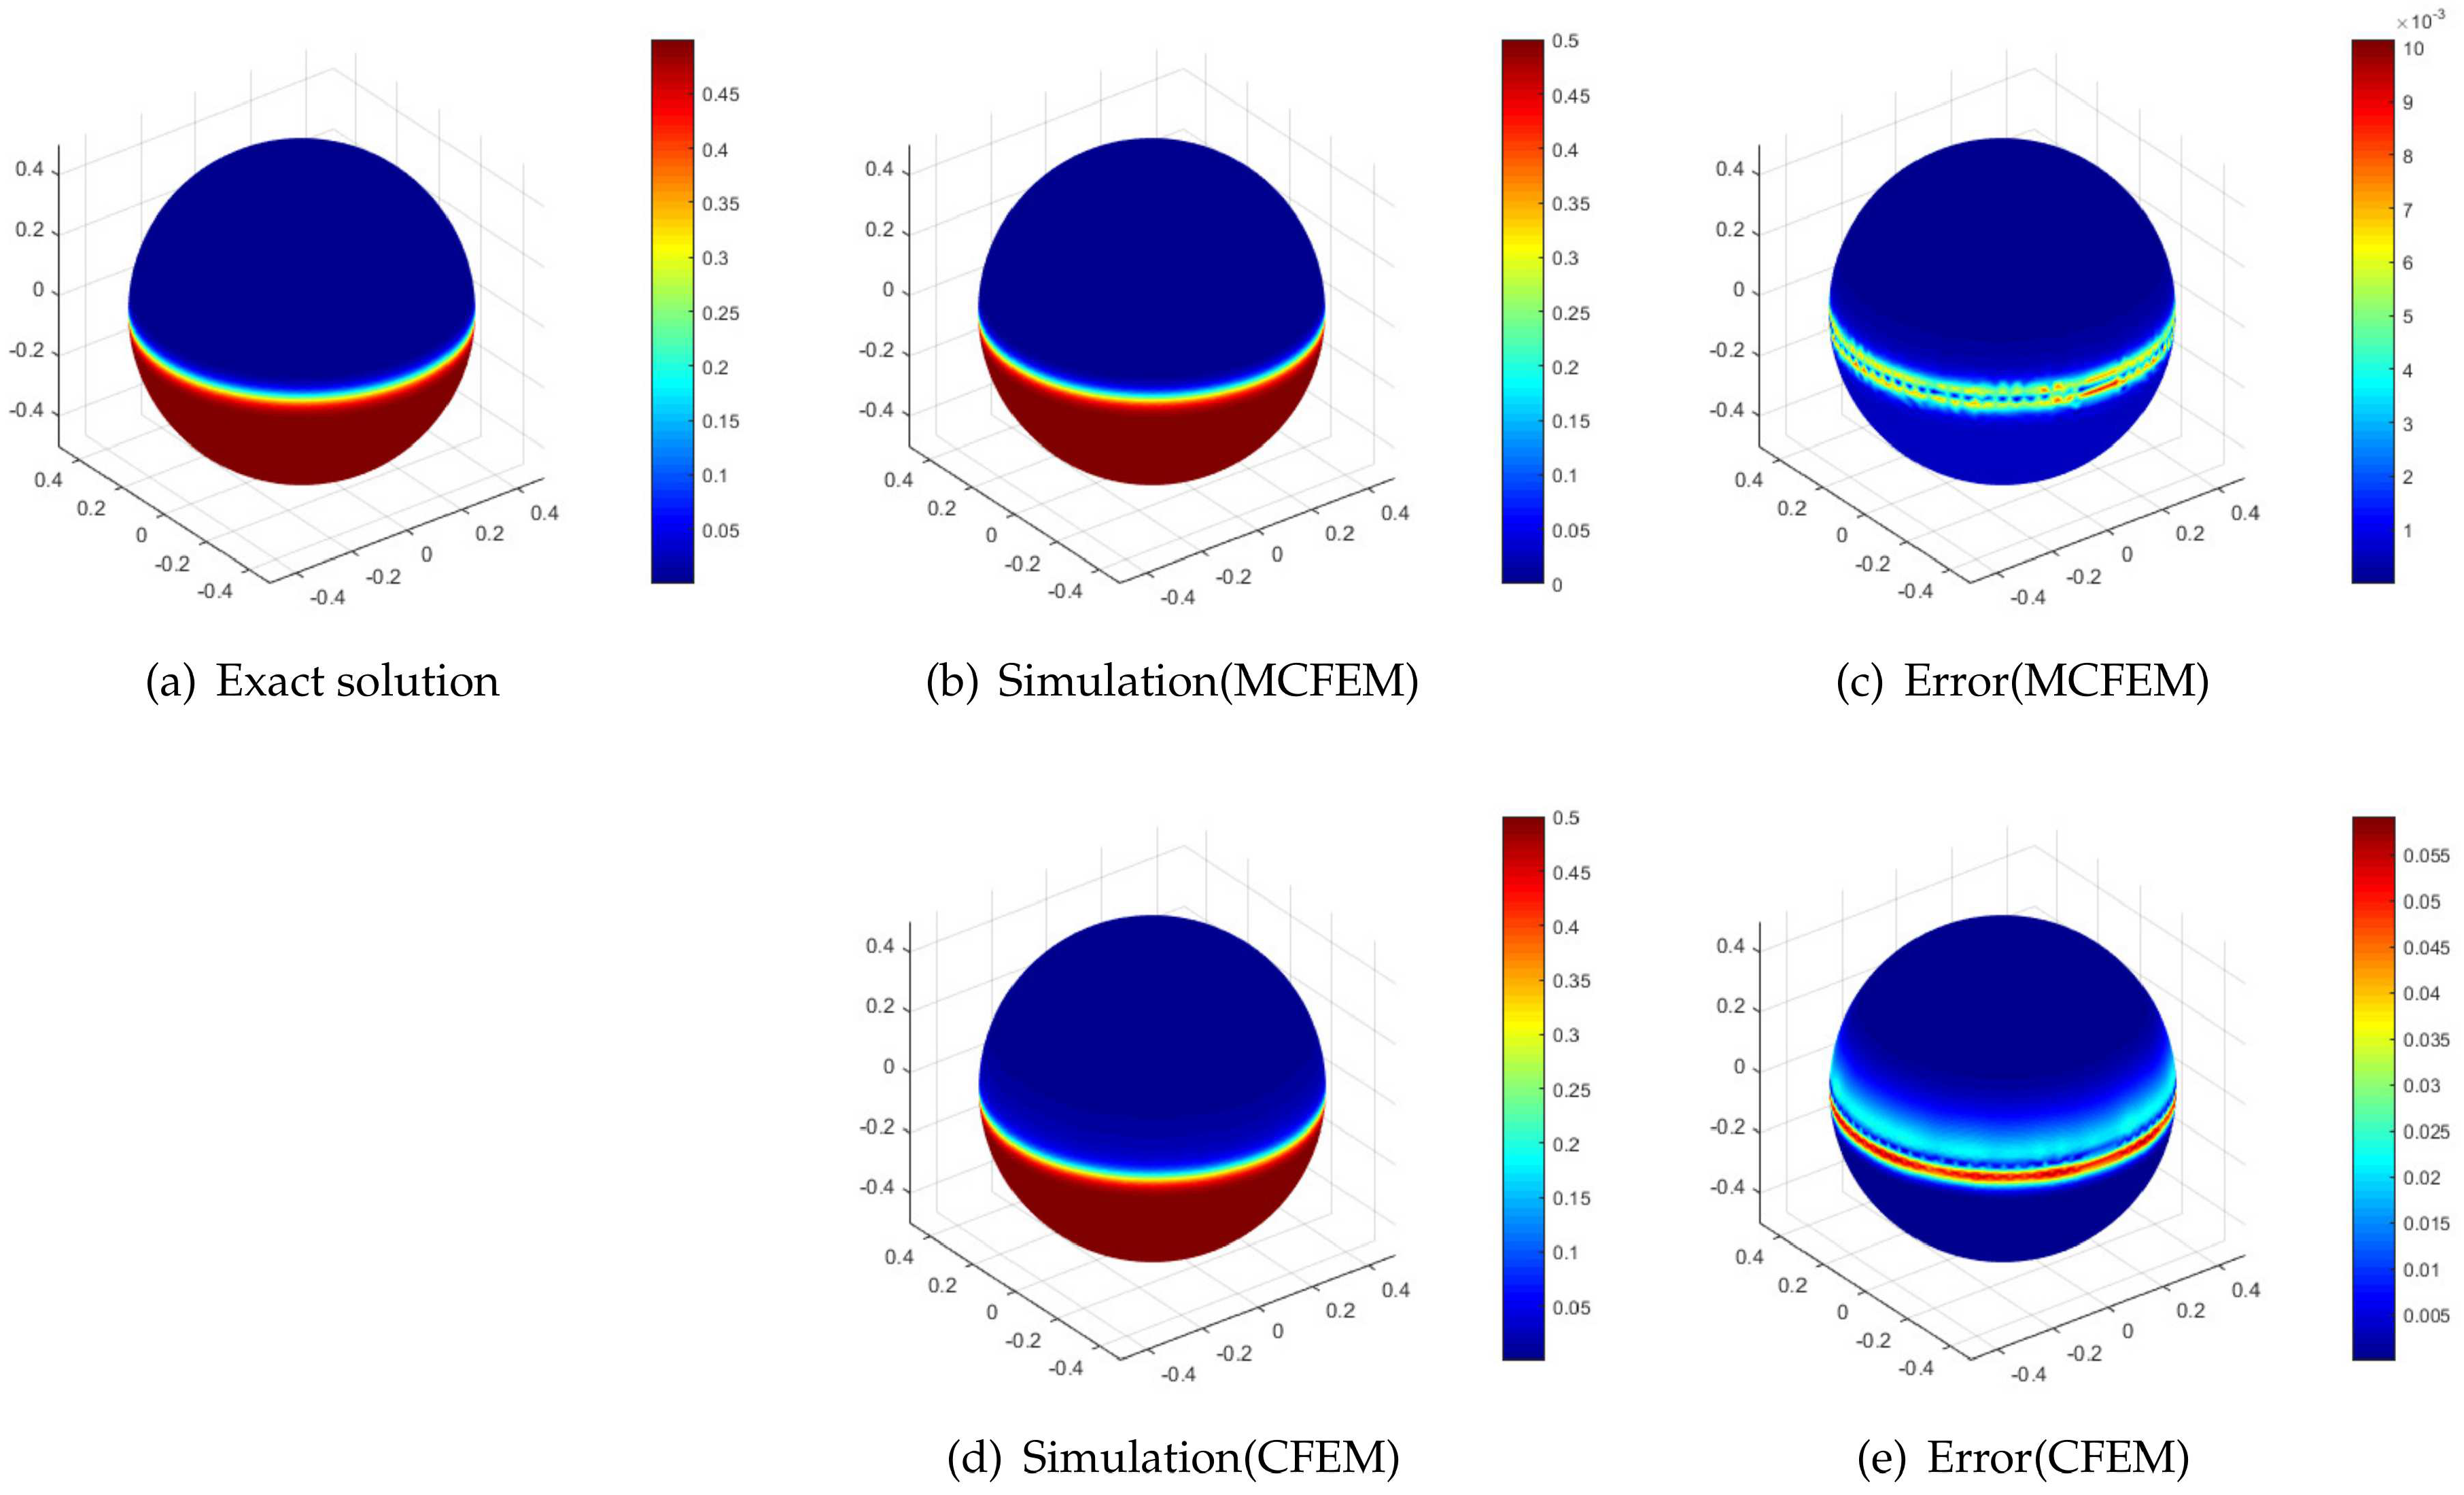
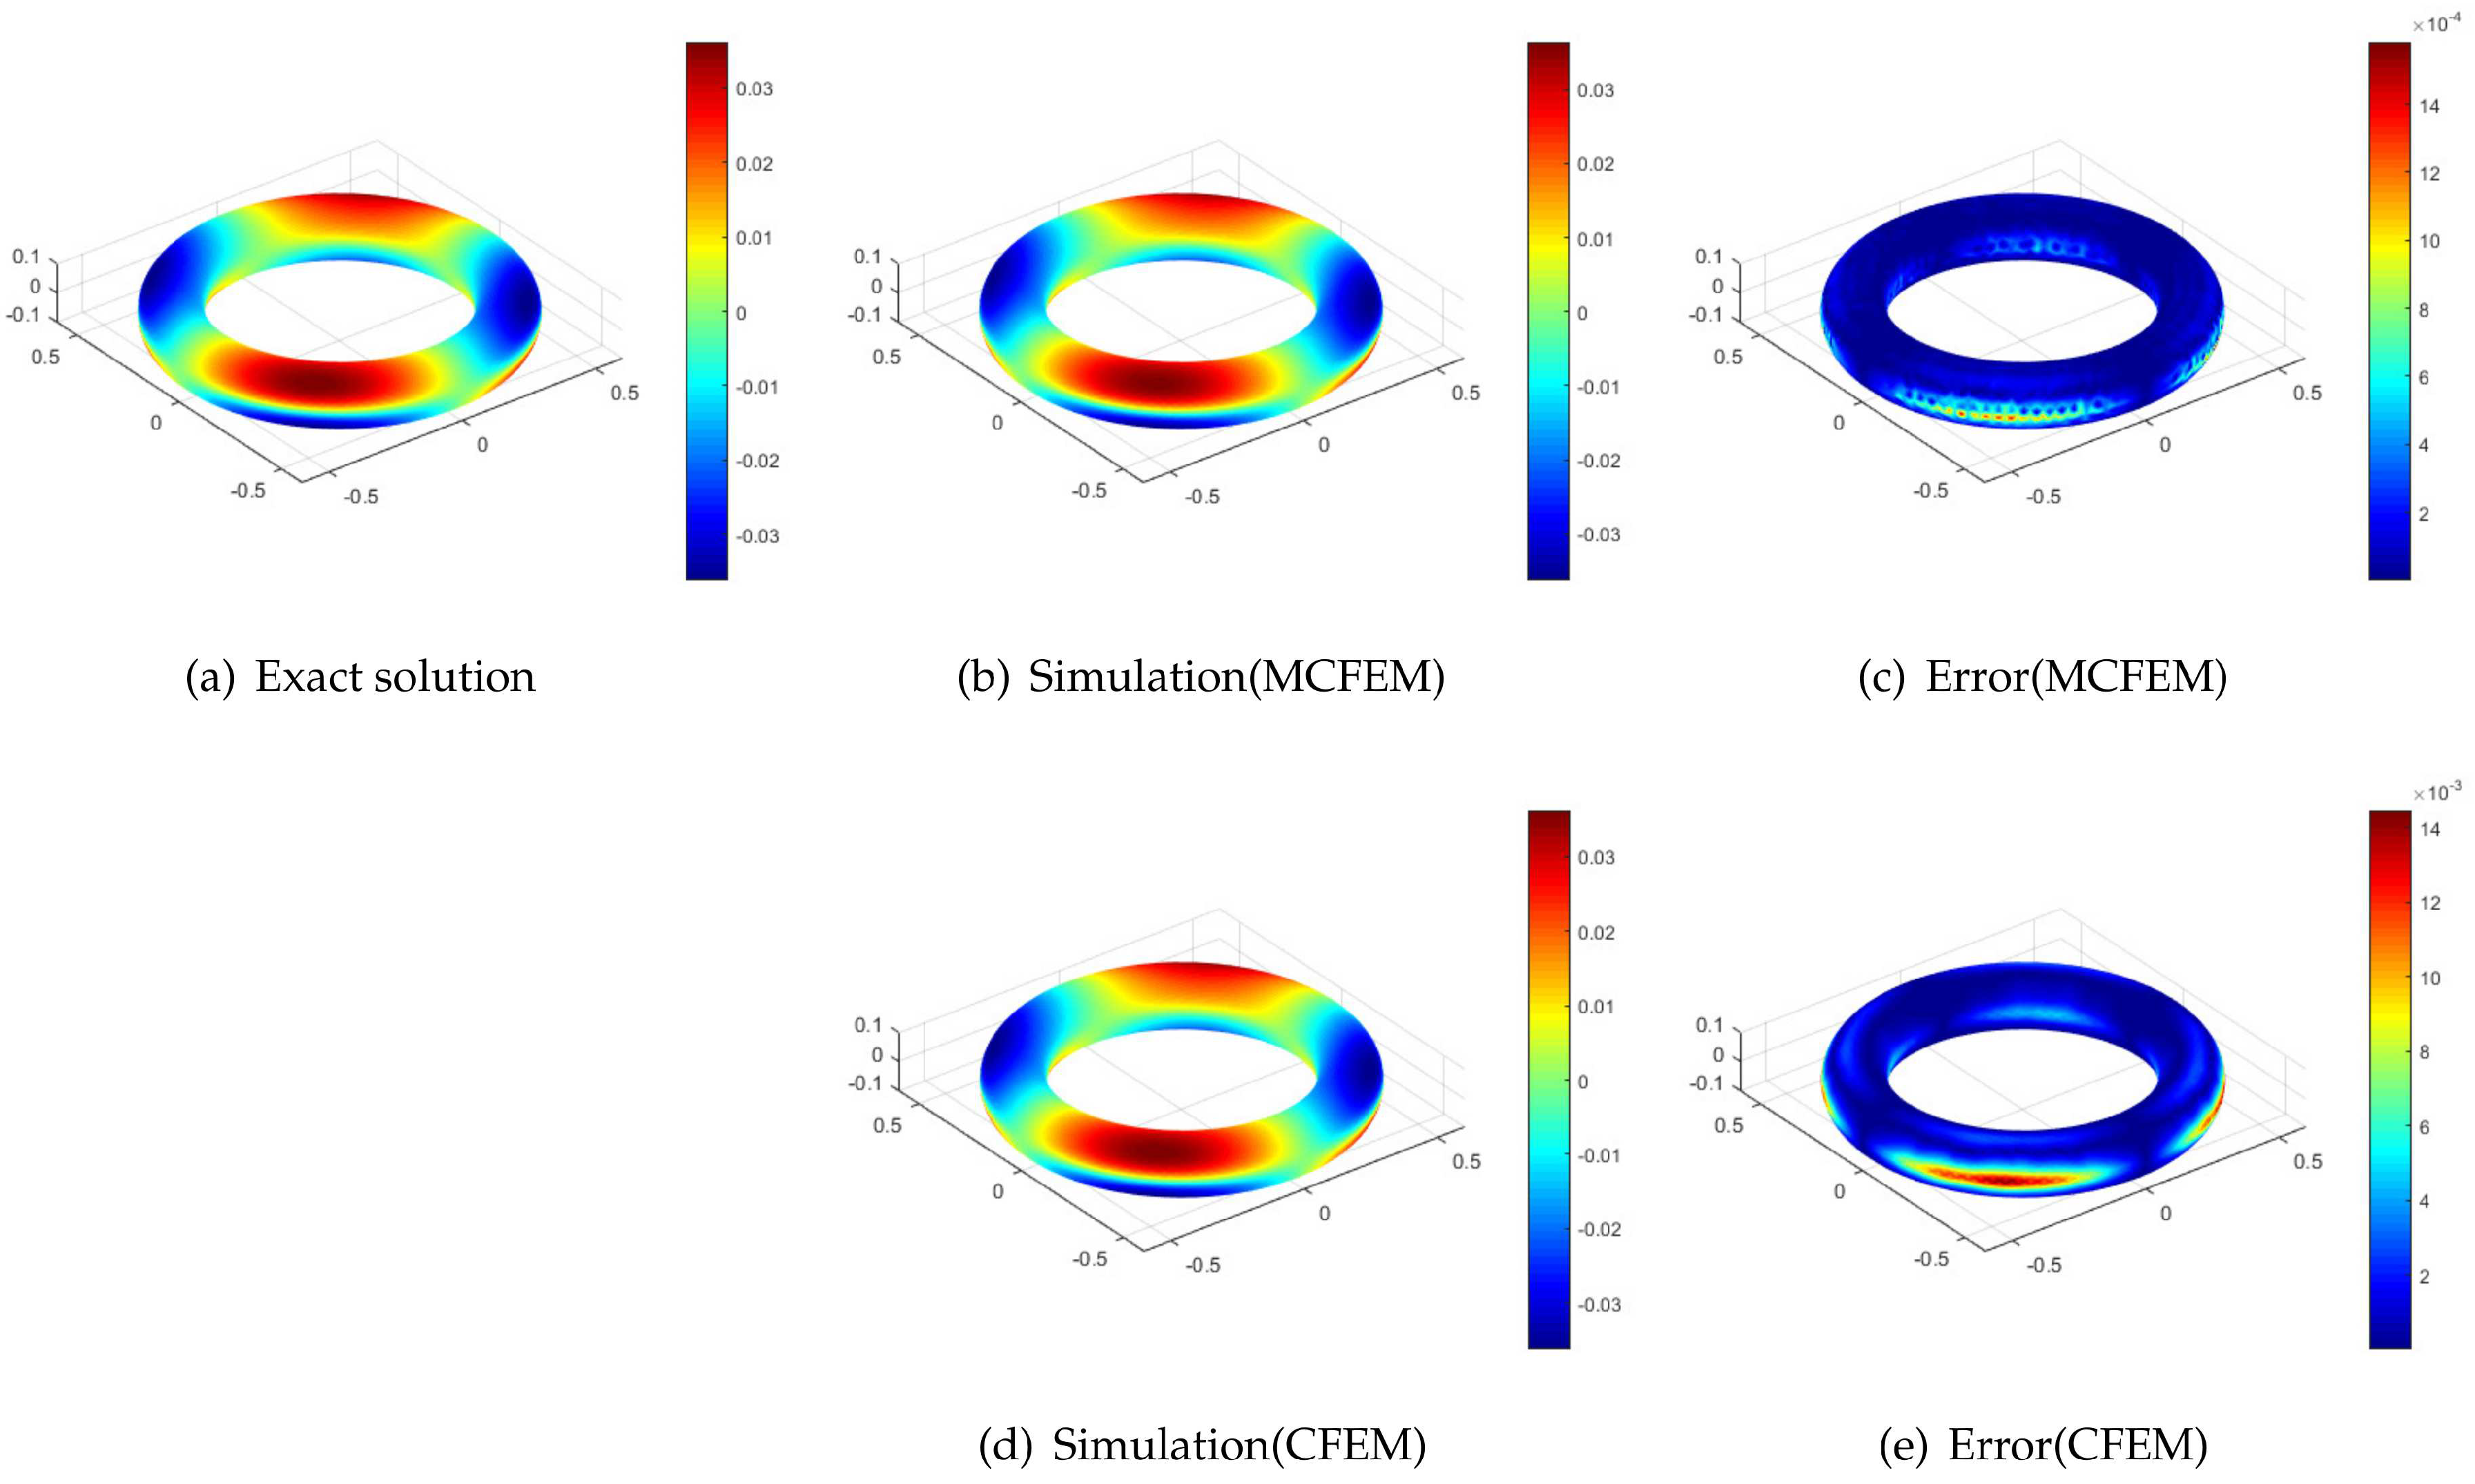
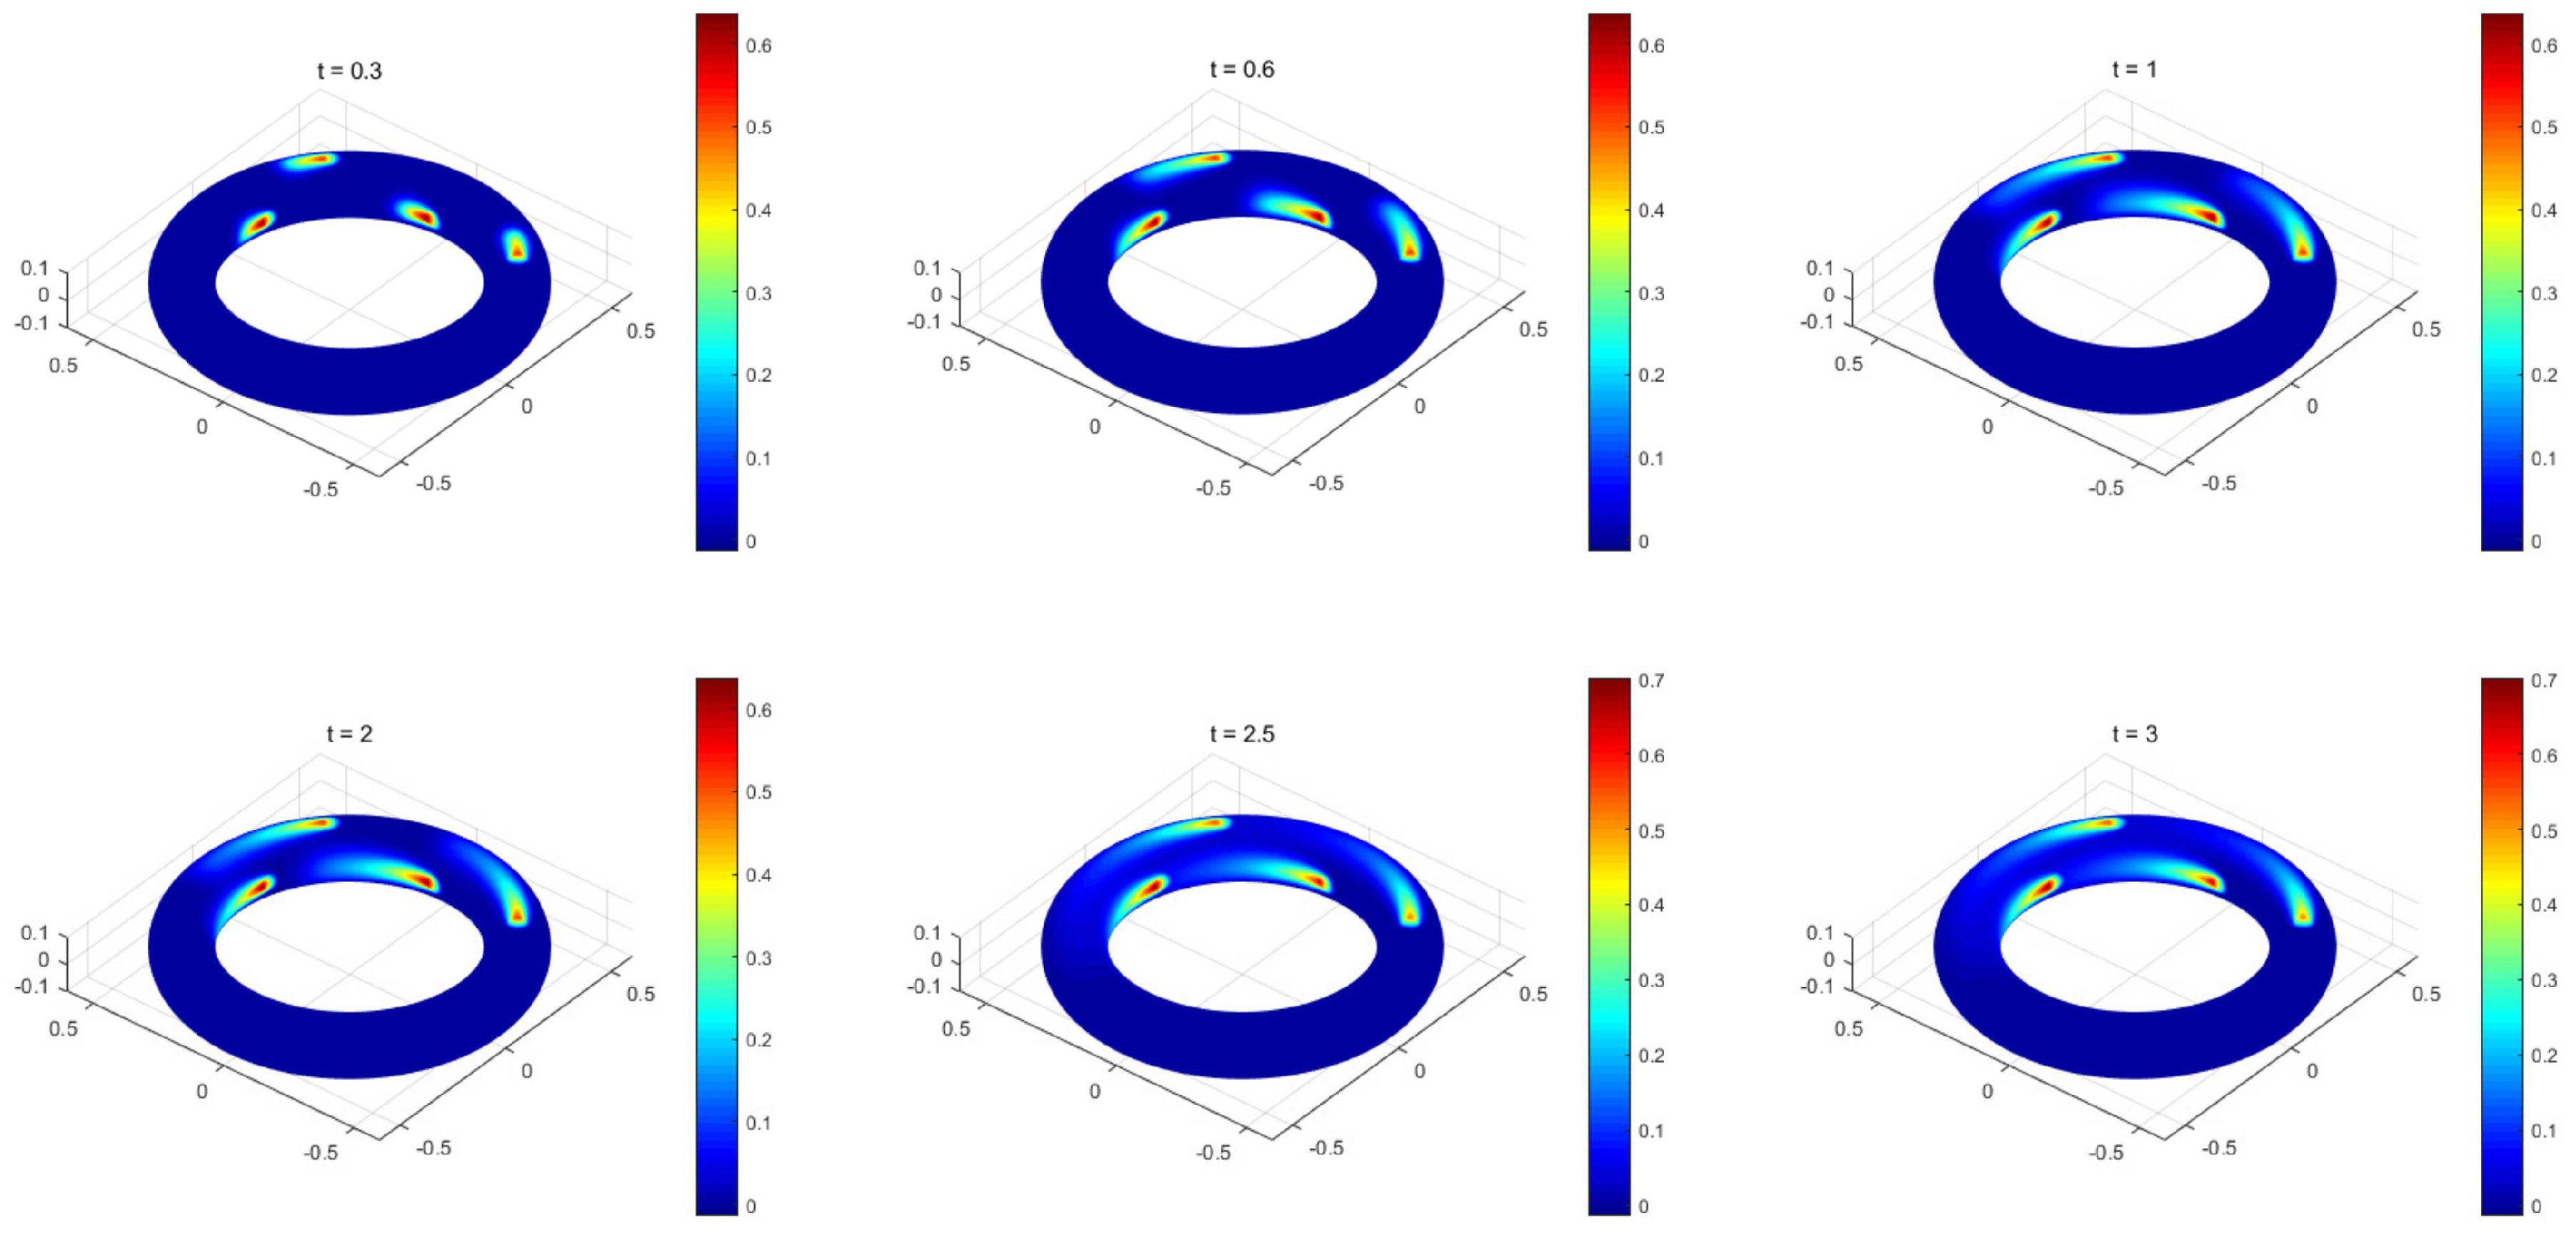
4.2. The Discontinuous Source Term Problem on Torus
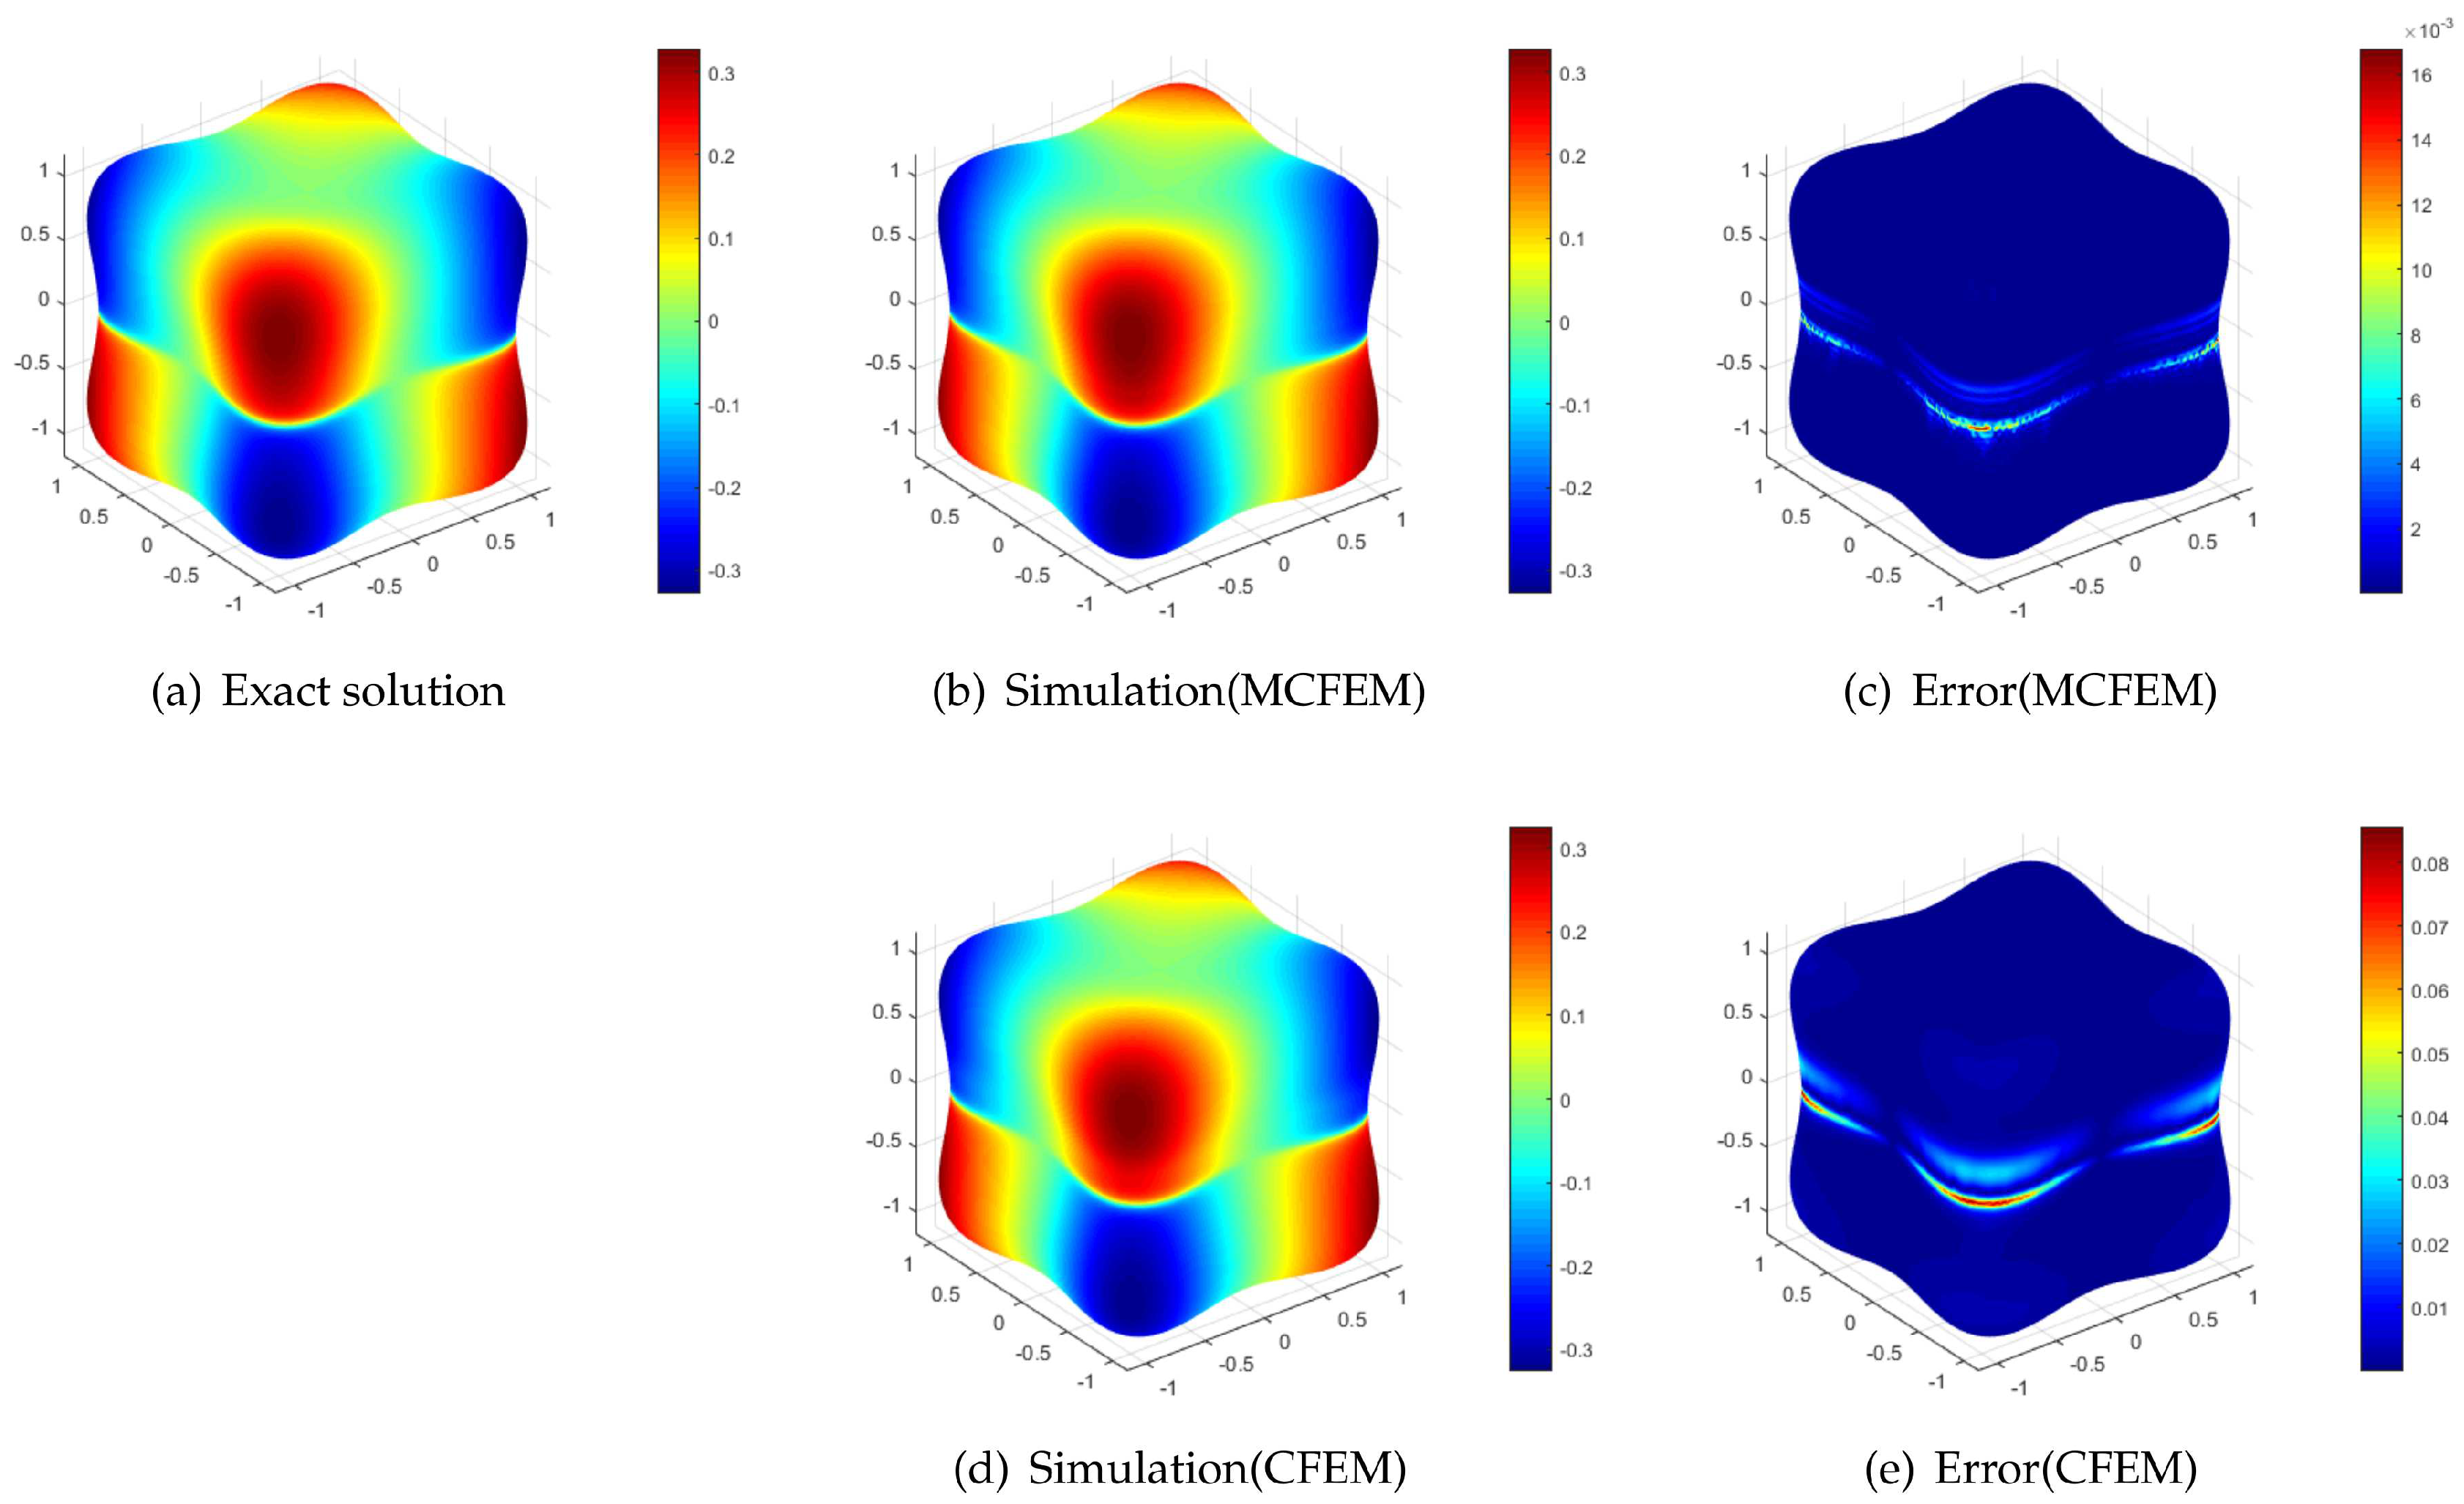
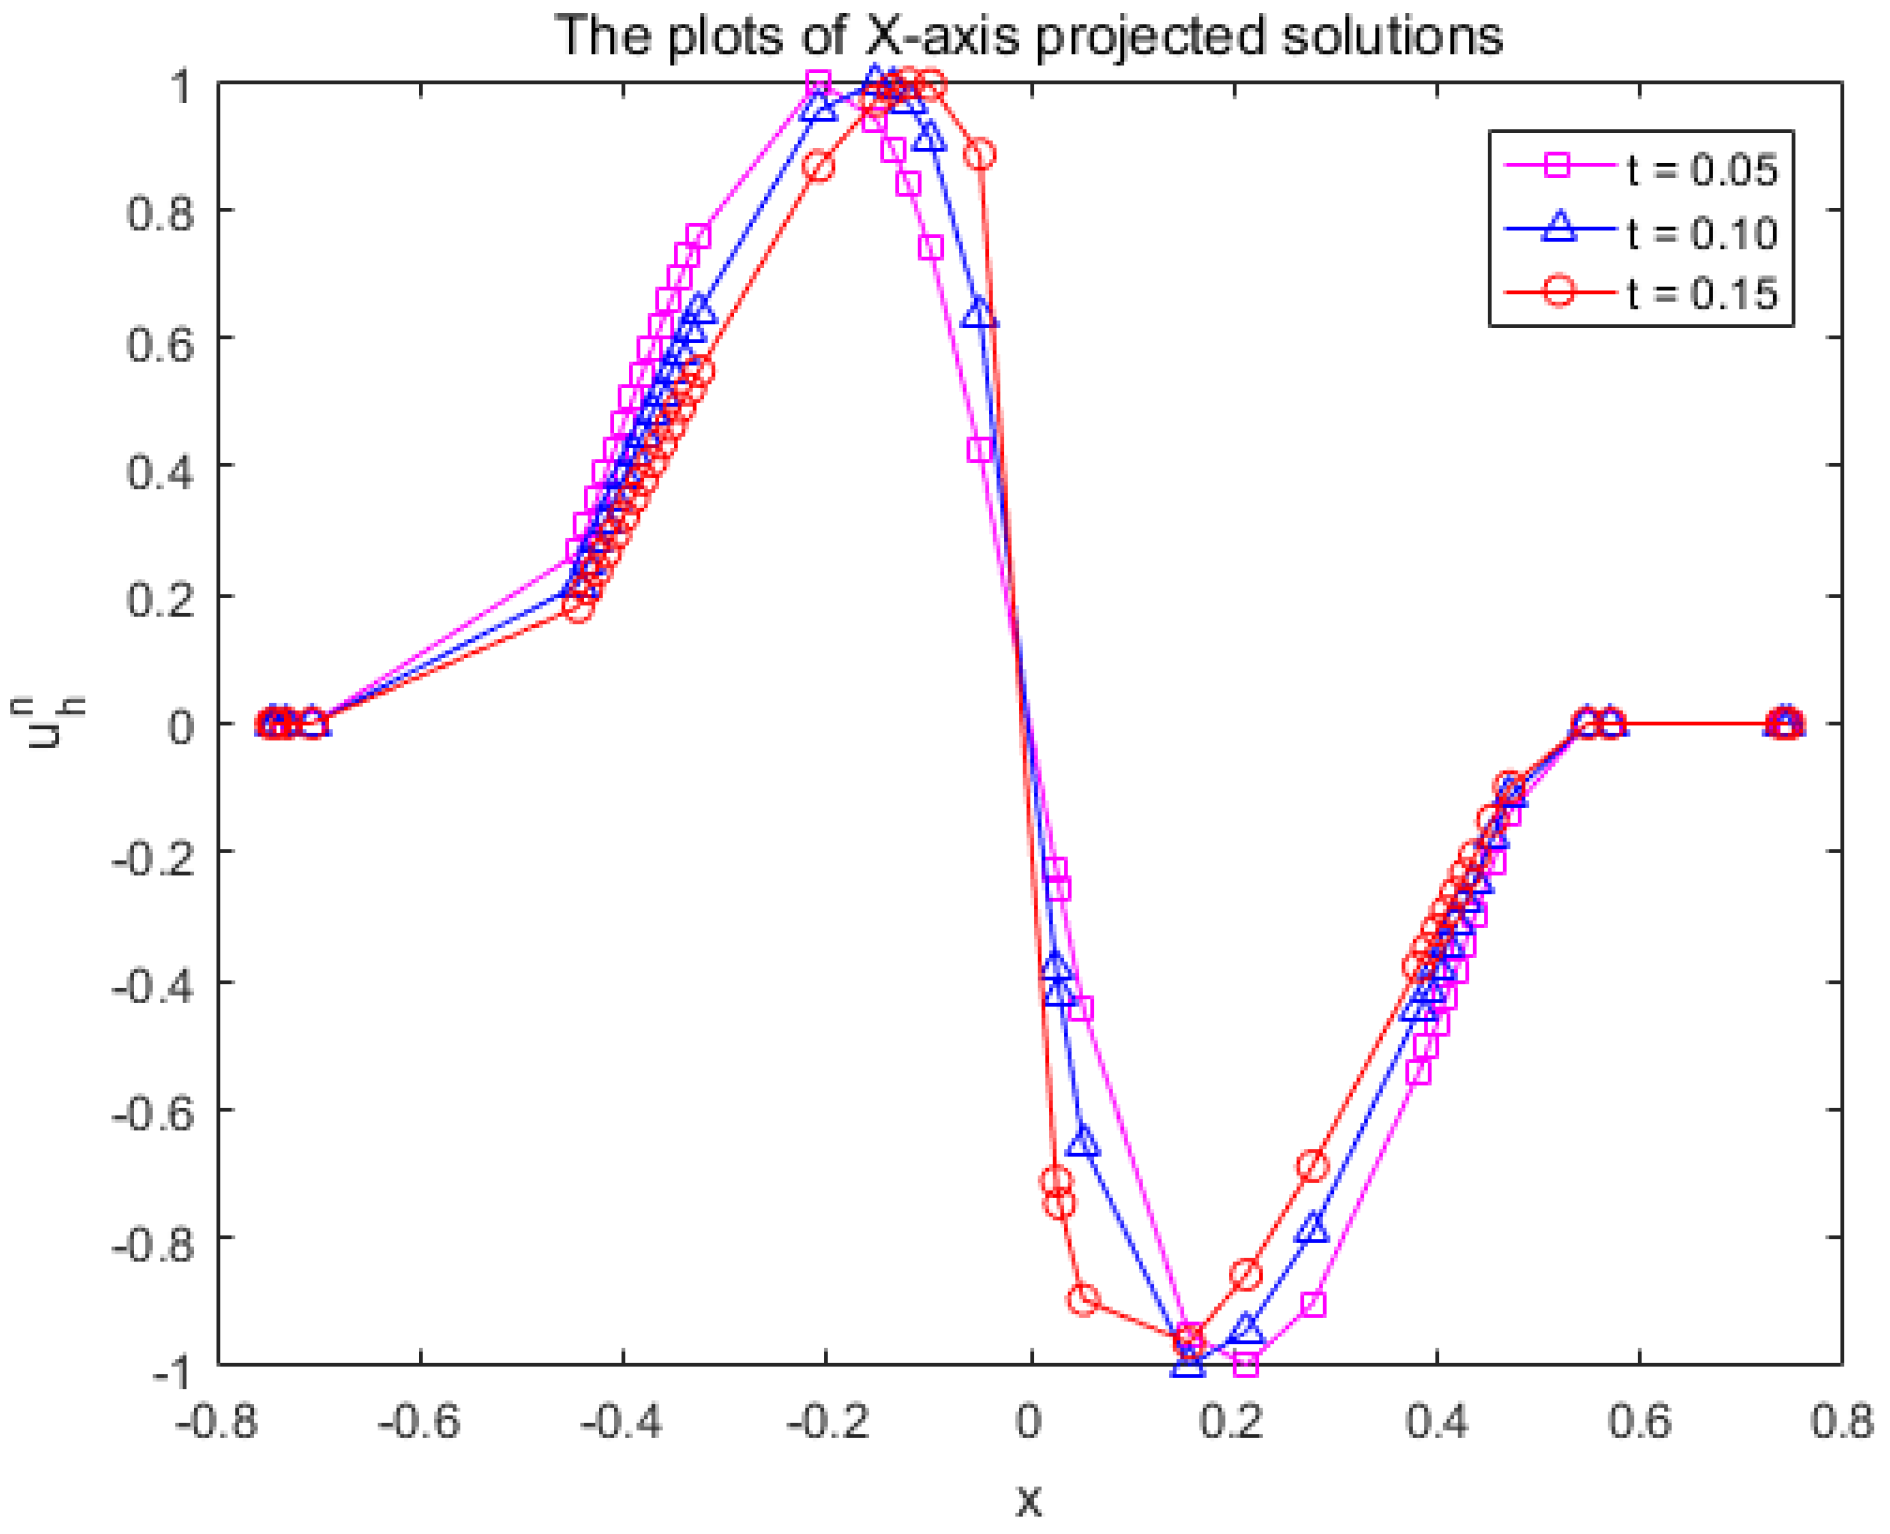
4.3. The Burgers Equation on Peanut-Shaped Surface
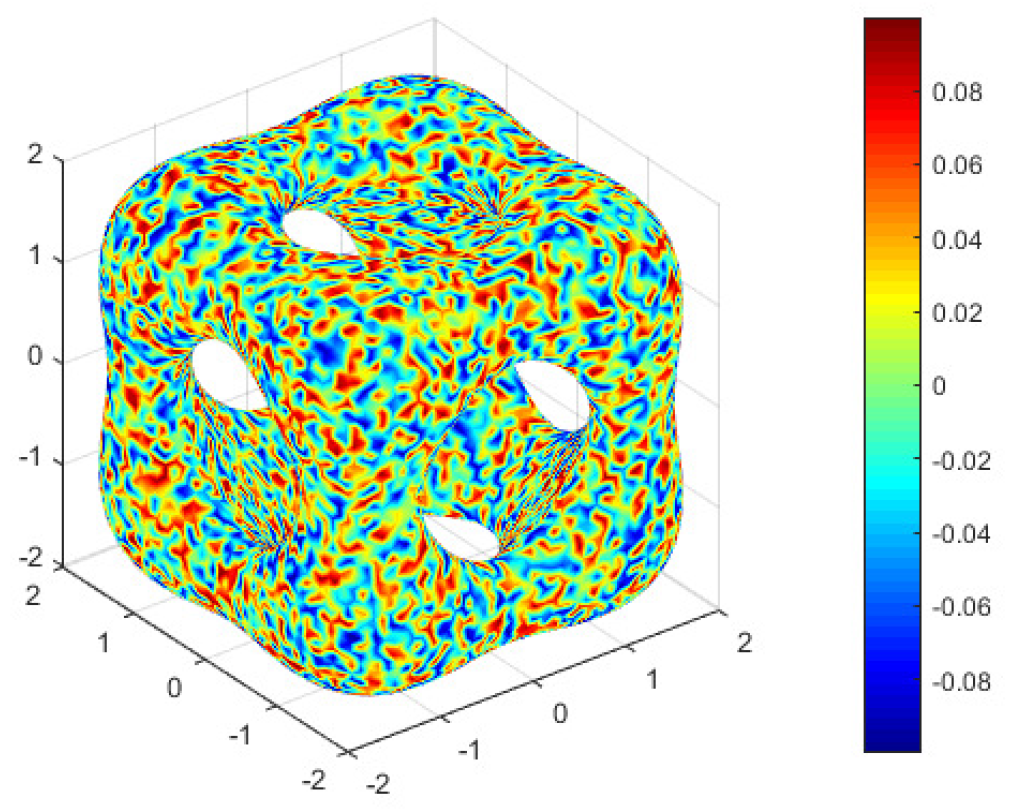
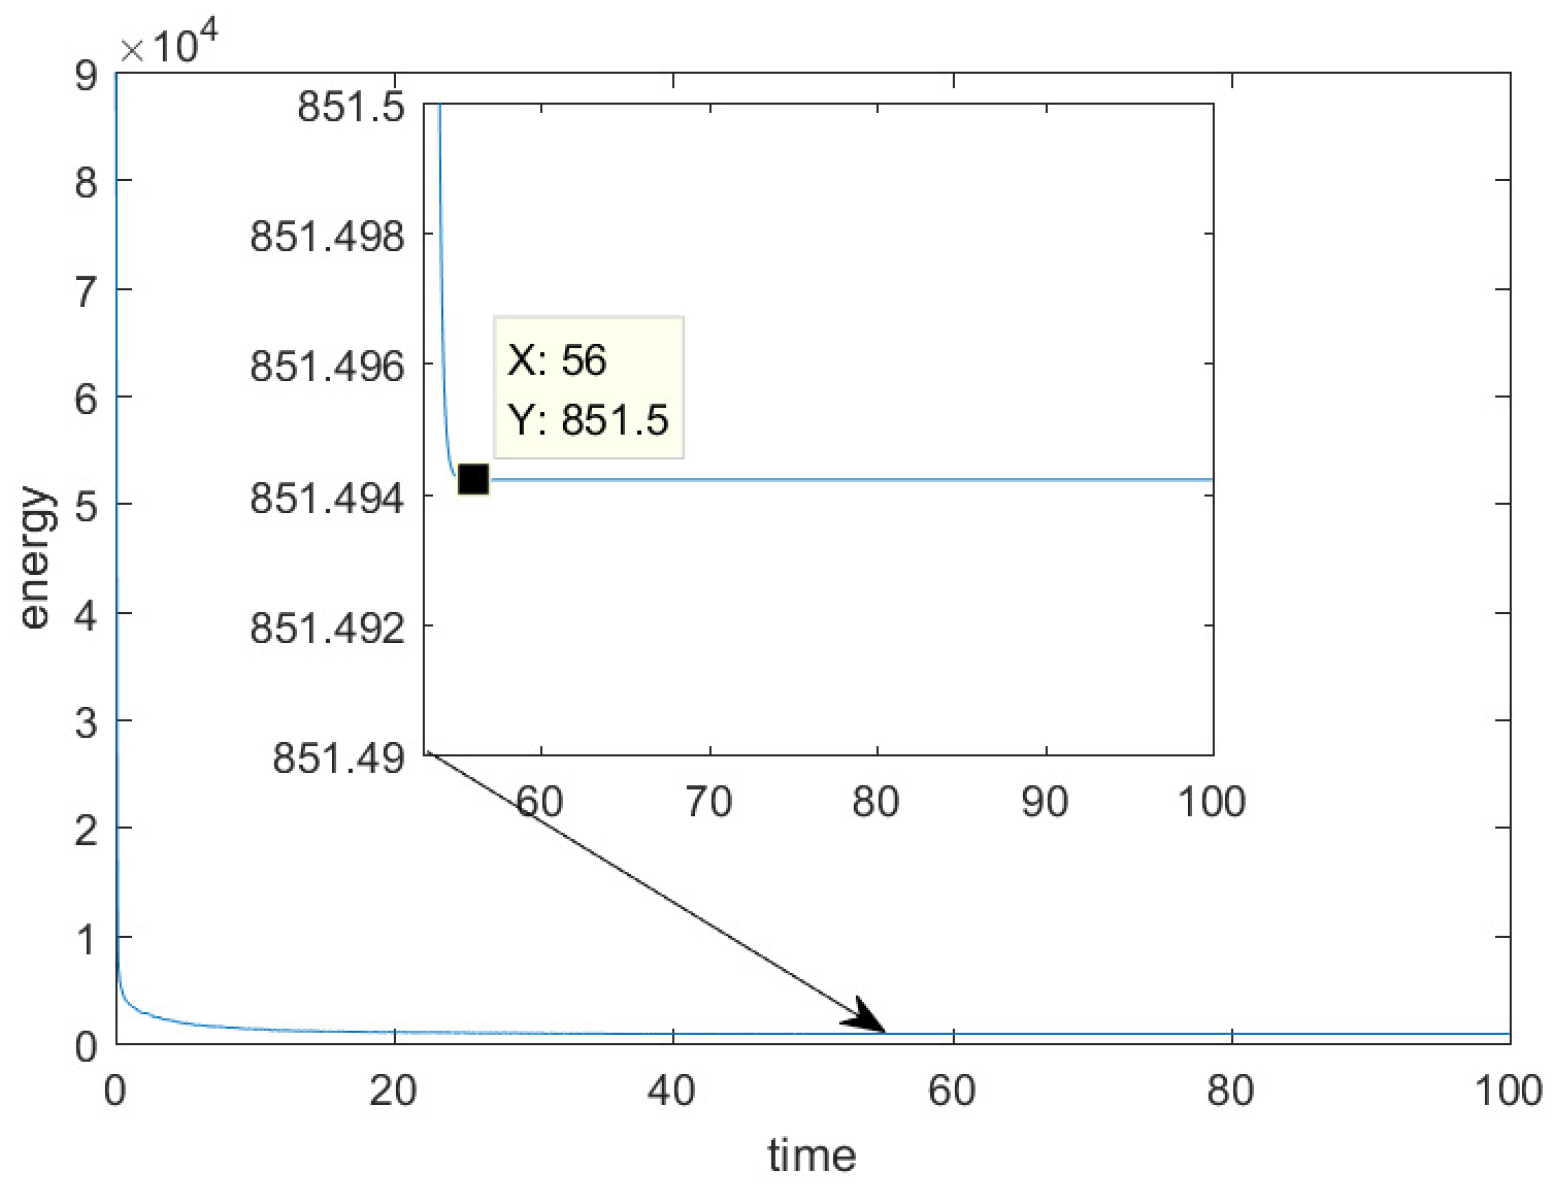
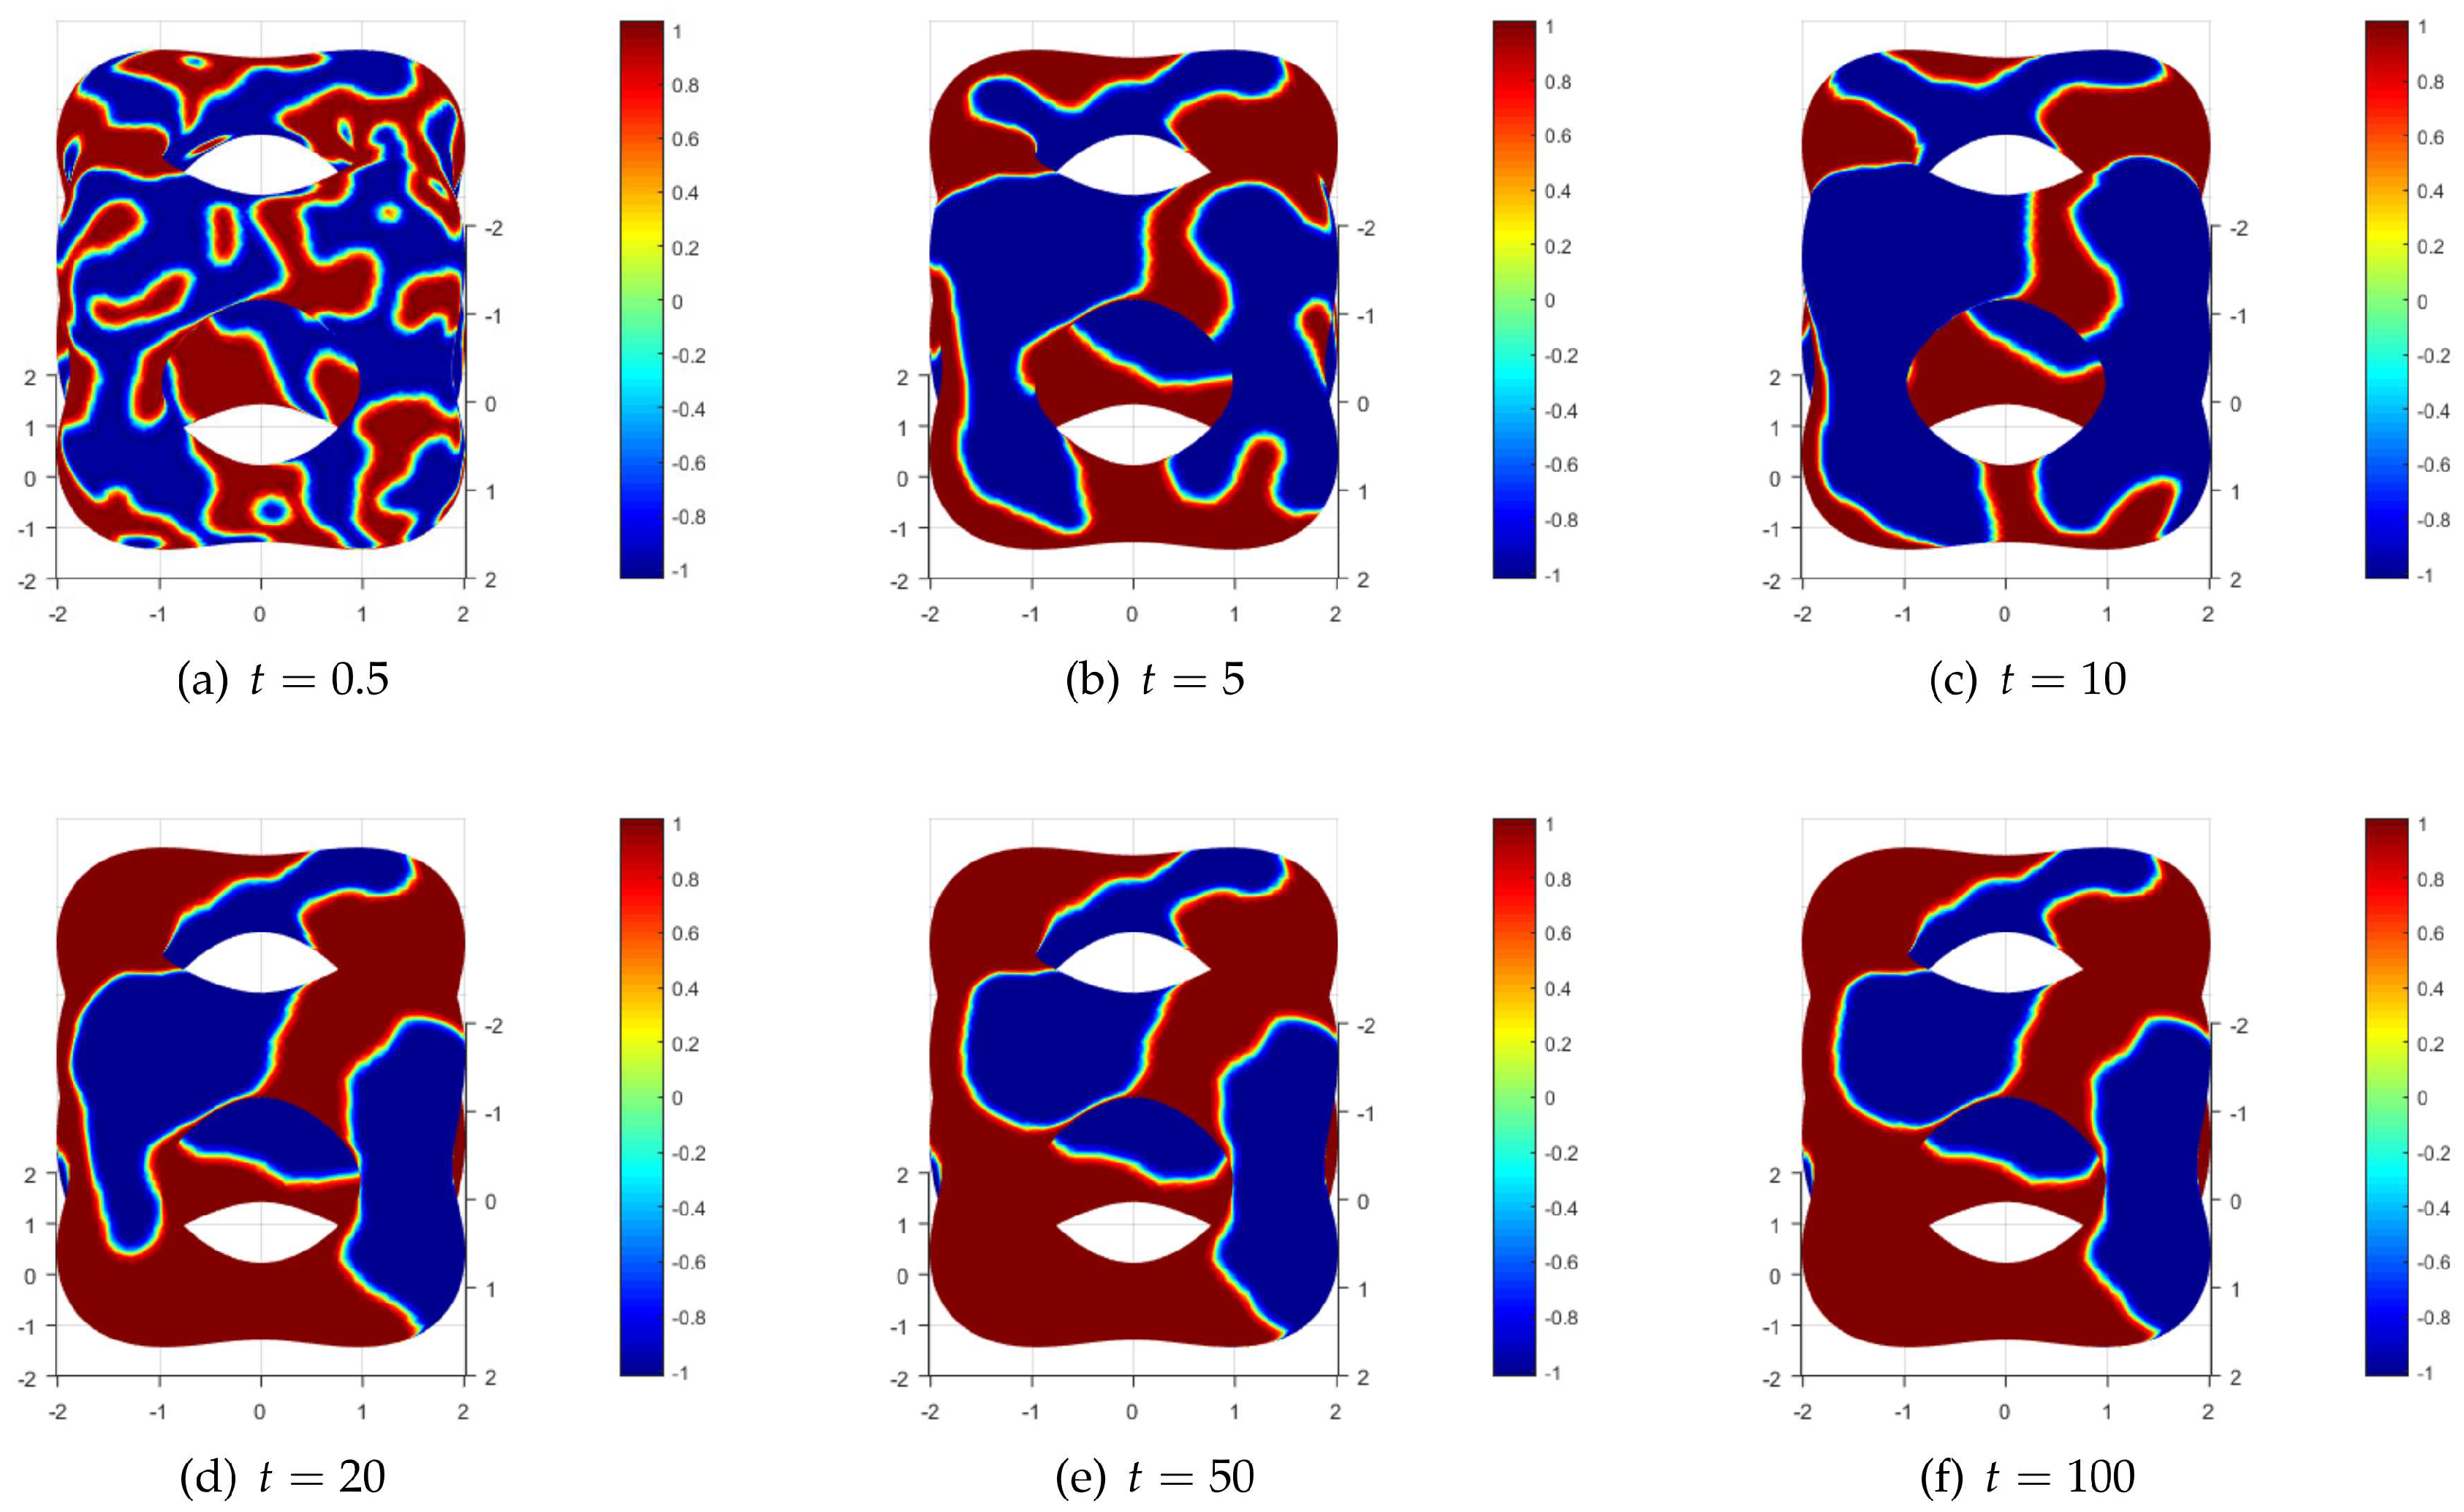
4.4. The Convection Allen-Cahn Equation on Multi-Connected Surface
5. Conclusions
Acknowledgments
References
- N. Lai, L. Li, C. Yang, J. Li, Service life of RC seawall under chloride invasion: A theoretical model incorporating convection-diffusion effect. Ocean. Eng. 2023, 279, 114590. [CrossRef]
- G. MacDonald, J.A. Mackenzie, M. Nolan, R.H. Insall, A computational method for the coupled solution of reaction-diffusion equations on evolving domains and manifolds: Application to a model of cell migration and chemotaxis. J. Comput. Phys. 2016, 309, 207–226. [CrossRef] [PubMed]
- X. Xiao, X. Feng, Y. He, Numerical simulations for the chemotaxis models on surfaces via a novel characteristic finite element method. Comput. Math. Appl. 2019, 78, 20–35. [CrossRef]
- D. Lacitignola, B. Bozzini, M. Frittelli, I. Sgura, Turing pattern formation on the sphere for a morphochemical reaction-diffusion model for electrodeposition. Commun. Nonlinear. Sci. 2017, 48, 484–508. [CrossRef]
- H. Kim, A. Yun, S. Yoon, C. Lee, J. Kim, Pattern formation in reaction-diffusion systems on evolving surfaces. Comput. Math. Appl. 2020, 80, 2019–2028. [CrossRef]
- C. Kallendorf, A.F. Cheviakov, M. Oberlack, Y. Wang, Conservation laws of surfactant transport equations. Phys. Fluids 2012, 24, 102105. [CrossRef]
- P. Hansbo, M.G. Larson, S. Zahedi, Characteristic cut finite element methods for convection-diffusion problems on time dependent surfaces. Comput. Method. Appl. M. 2015, 293, 431–461. [CrossRef]
- A. Sokolov, R. Ali, S. Turek, An AFC-stabilized implicit finite element method for partial differential equations on evolving-in-time surfaces. J. Comput. Appl. Math. 2015, 289, 101–115. [CrossRef]
- G. MacDonald, J.A. Mackenzie, M. Nolan, R.H. Insall, A computational method for the coupled solution of reaction-diffusion equations on evolving domains and manifolds: Application to a model of cell migration and chemotaxis. J. Comput. Phys. 2016, 309, 207–226. [CrossRef]
- C.M. Elliott, B. Stinner, C. Venkataraman, Modelling cell motility and chemotaxis with evolving surface finite elements. J. R. Soc. Interface 2012, 9, 3027–3044. [CrossRef]
- E. Lehto, V. Shankar, G.B. Wright, A radial basis function (RBF) compact finite difference (FD) scheme for reaction-diffusion equations on surfaces. SIAM. J. Sci. Comput. 2017, 39, A2129–A2151. [CrossRef]
- S.A. AL-Bayati, L.C. Wrobel, The dual reciprocity boundary element formulation for convection-diffusion-reaction problems with variable velocity field using different radial basis functions. Int. J. Mech. Sci. 2018, 145, 367–377. [CrossRef]
- S. Reutskiy, J. Lin, A RBF-based technique for 3D convection-diffusion-reaction problems in an anisotropic inhomogeneous medium, Comput. Math. Appl. Comput. Math. Appl. 2020, 79, 1875–1888. [CrossRef]
- Z. Sun, S. Zhang, A radial basis function approximation method for conservative Allen-Cahn equations on surfaces. Appl. Math. Lett. 2023, 143, 108634. [CrossRef]
- P. Suchde, J. Kuhnert, A meshfree generalized finite difference method for surface PDEs. Comput. Math. Appl. 2019, 78, 2789–2805. [CrossRef]
- J. Yang, Y. Li, J. Kim, A practical finite difference scheme for the Navier-Stokes equation on curved surfaces in R3. J. Comput. Phys. 2020, 411, 109403. [CrossRef]
- J. Yang, J. Wang, Z. Tan, A simple and practical finite difference method for the phase-field crystal model with a strong nonlinear vacancy potential on 3D surfaces. Comput. Math. Appl. 2022, 121, 131–144. [CrossRef]
- M.A. Olshanskii, X. Xu, A trace finite element method for PDEs on evolving surfaces. SIAM. J. Sci. Comput. 2017, 39, A1301–A1319. [CrossRef]
- C. Lehrenfeld, M.A. Olshanskii, X. Xu, A stabilized trace finite element method for partial differential equations on evolving surfaces. SIAM. J. Numer. Anal. 2018, 56, 1643–1672. [CrossRef]
- J. Grande, C. Lehrenfeld, A. Reusken, Analysis of a high-order trace finite element method for PDEs on level set surfaces. SIAM. J. Numer. Anal. 2018, 56, 228–255. [CrossRef]
- S. Gross, T. Jankuhn, M.A. Olshanskii, A. Reusken, A trace finite element method for vector-laplacians on surfaces. SIAM. J. Numer. Anal. 2018, 56, 2406–2429. [CrossRef]
- M. Olshanskii, X. Xu, V. Yushutin, A finite element method for Allen-Cahn equation on deforming surface. Comput. Math. Appl. 2021, 90, 148–158. [CrossRef]
- H. Sass, A. Reusken, An accurate and robust Eulerian finite element method for partial differential equations on evolving surfaces. Comput. Math. Appl. 2023, 146, 253–270. [CrossRef]
- M.A. Olshanskii, A. Reusken, X. Xu, A stabilized finite element method for advection-diffusion equations on surfaces. Ima. J. Numer. Anal. 2014, 34, 732–758. [CrossRef]
- F. Ivancˇic´, M. Solovchuk, Energy stable arbitrary Lagrangian Eulerian finite element scheme for simulating flow dynamics of droplets on non-homogeneous surfaces. Appl Math. Model. 2022, 108, 66–91. [CrossRef]
- G. Dziuk, C.M. Elliott, Finite element methods for surface PDEs. Acta. Numer. 2013, 22, 289–396. [CrossRef]
- C. Guo, X. Xiao, X. Feng, Z. Tan, An immersed finite element method for elliptic interface problems on surfaces. Comput. Math. Appl. 2023, 131, 54–67. [CrossRef]
- K. Simon, L. Tobiska, Local projection stabilization for convection-diffusion-reaction equations on surfaces. Comput. Method. Appl. M. 2019, 344, 34–53. [CrossRef]
- X. Xiao, X. Feng, Z. Li, A gradient recovery-based adaptive finite element method for convection-diffusion-reaction equations on surfaces. Int. J. Numer. Meth. Eng. 2019, 120, 901–917. [CrossRef]
- X. Xiao, J. Zhao, X. Feng, A layers capturing type H-adaptive finite element method for convection-diffusion-reaction equations on surfaces. Comput. Method. Appl. M 2020, 361, 112792. [CrossRef]
- M. Jin, X. Feng, K. Wang, Gradient recovery-based adaptive stabilized mixed FEM for the convection-diffusion-reaction equation on surfaces. Comput. Method. Appl. M 2021, 380, 113798. [CrossRef]
- X. Xiao, Z. Dai, X. Feng, A positivity preserving characteristic finite element method for solving the transport and convection-diffusion-reaction equations on general surfaces. Comput. Phys. Commun. 2020, 247, 106941. [CrossRef]
- A. Bonito, W. Lei, Approximation of the spectral fractional powers of the Laplace-Beltrami operator. Numer. Math. Theor. Meth. Appl. 2021, 4, 1193–1218.
- J. Douglas, T.F. Russell, Numerical methods for convection-dominated diffusion problems based on combining the method of characteristics with finite element or finite difference procedures. SIAM. J. Numer. Anal. 1982, 19, 871–885. [CrossRef]
- J.D. Frutos, J. Novo, Bubble stabilization of linear finite element methods for nonlinear evolutionary convection-diffusion equations. Comput. Method. Appl. M 2008, 197, 3988–3999. [CrossRef]


Disclaimer/Publisher’s Note: The statements, opinions and data contained in all publications are solely those of the individual author(s) and contributor(s) and not of MDPI and/or the editor(s). MDPI and/or the editor(s) disclaim responsibility for any injury to people or property resulting from any ideas, methods, instructions or products referred to in the content. |
© 2023 by the authors. Licensee MDPI, Basel, Switzerland. This article is an open access article distributed under the terms and conditions of the Creative Commons Attribution (CC BY) license (http://creativecommons.org/licenses/by/4.0/).


