1. Introduction
Quality control of medicines is essential to ensure the drug-quality because a medicine of a lower quality can either reduce or even cancel the therapeutic effectiveness of the product or constitute a danger to the health of the patient.
A non-compliant medicine can be detected in three steps. Two can be done by field control officers: traceability and careful visual inspection. In collaboration with the customs services and the medicines department of the Djiboutian Health Ministry, we wish to complete this anti-counterfeiting arsenal of medicines with qualitative and quantitative techniques: chemical analysis. The latter is based on protocols defined in different pharmacopeias such as the United States Pharmacopeia (USP), the European Pharmacopoeia (European Pharmacopoeia or Ph.Eur.), or the WHO International Pharmacopoeia.
The chemical fingerprint is observed using spectroscopy techniques which make it possible to obtain an initial indication of the product composition and to compare it to the reference characteristics, stored in the internationals databases. These three steps allow, in the vast majority of cases, to found out quickly whether or not a drug is counterfeit.
Antibiotics are under greater scrutiny due to the development of resistance throughout the world [
1]. In Africa where this problem is more worrying, the availability of counterfeit or poor-quality medicines is among the plausible causes of multi-resistant strains proliferation [
2]. The establishment of technical platforms in laboratories and efficient control bodies could limit these risks.
In our study, eight antibiotics from different sources were analyzed. Based on USP standards and publications in the field, protocols for identifying and dosing active ingredients have been put in place.
2. Materials and methods
2.1. Materials
2.1.1. Drugs analyzed
In this study, we analyzed eight antibiotics, five of which were injectable (three powders and two liquids), two in tablet form, and one capsule. These medications were collected from community health centres in Djibouti city (
Scheme 1,
Scheme 2,
Scheme 3,
Scheme 4,
Scheme 5 and
Scheme 6).
Ceftriaxone
Ceftriaxone is a synthetic bactericidal antibiotic of the third-generation cephalosporin class, belonging to the beta-lactam family [
3]. It is a penicillin sulfone, structurally related to sulbactam. Being a beta-lactamase inhibitor, it acts synergistically with many drugs such as penicillins and cephalosporins.
We were interested in its formulation intended for injections and three commercial brands were targeted:
- -
Unacefin produced in Turkey (1 g per 10 ml of sterile water);
- -
NCPC produced in China (250 mg);
- -
Injxone produced in India (1 g per 10 ml of sterile water).
Ciprofloxacine
Ciprofloxacin (1-cyclopropyl-6-fluoro-1,4-dihydro-4-oxo-7-(1-piperazinyl)-3-quinolone carboxylic acid) is a synthetic fluoroquinolone antimicrobial agent. It presents an activity
In vitro against most Gram-negative and many Gram-positive pathogenic bacteria, many of which are resistant to a wide range of antibiotics [
4].
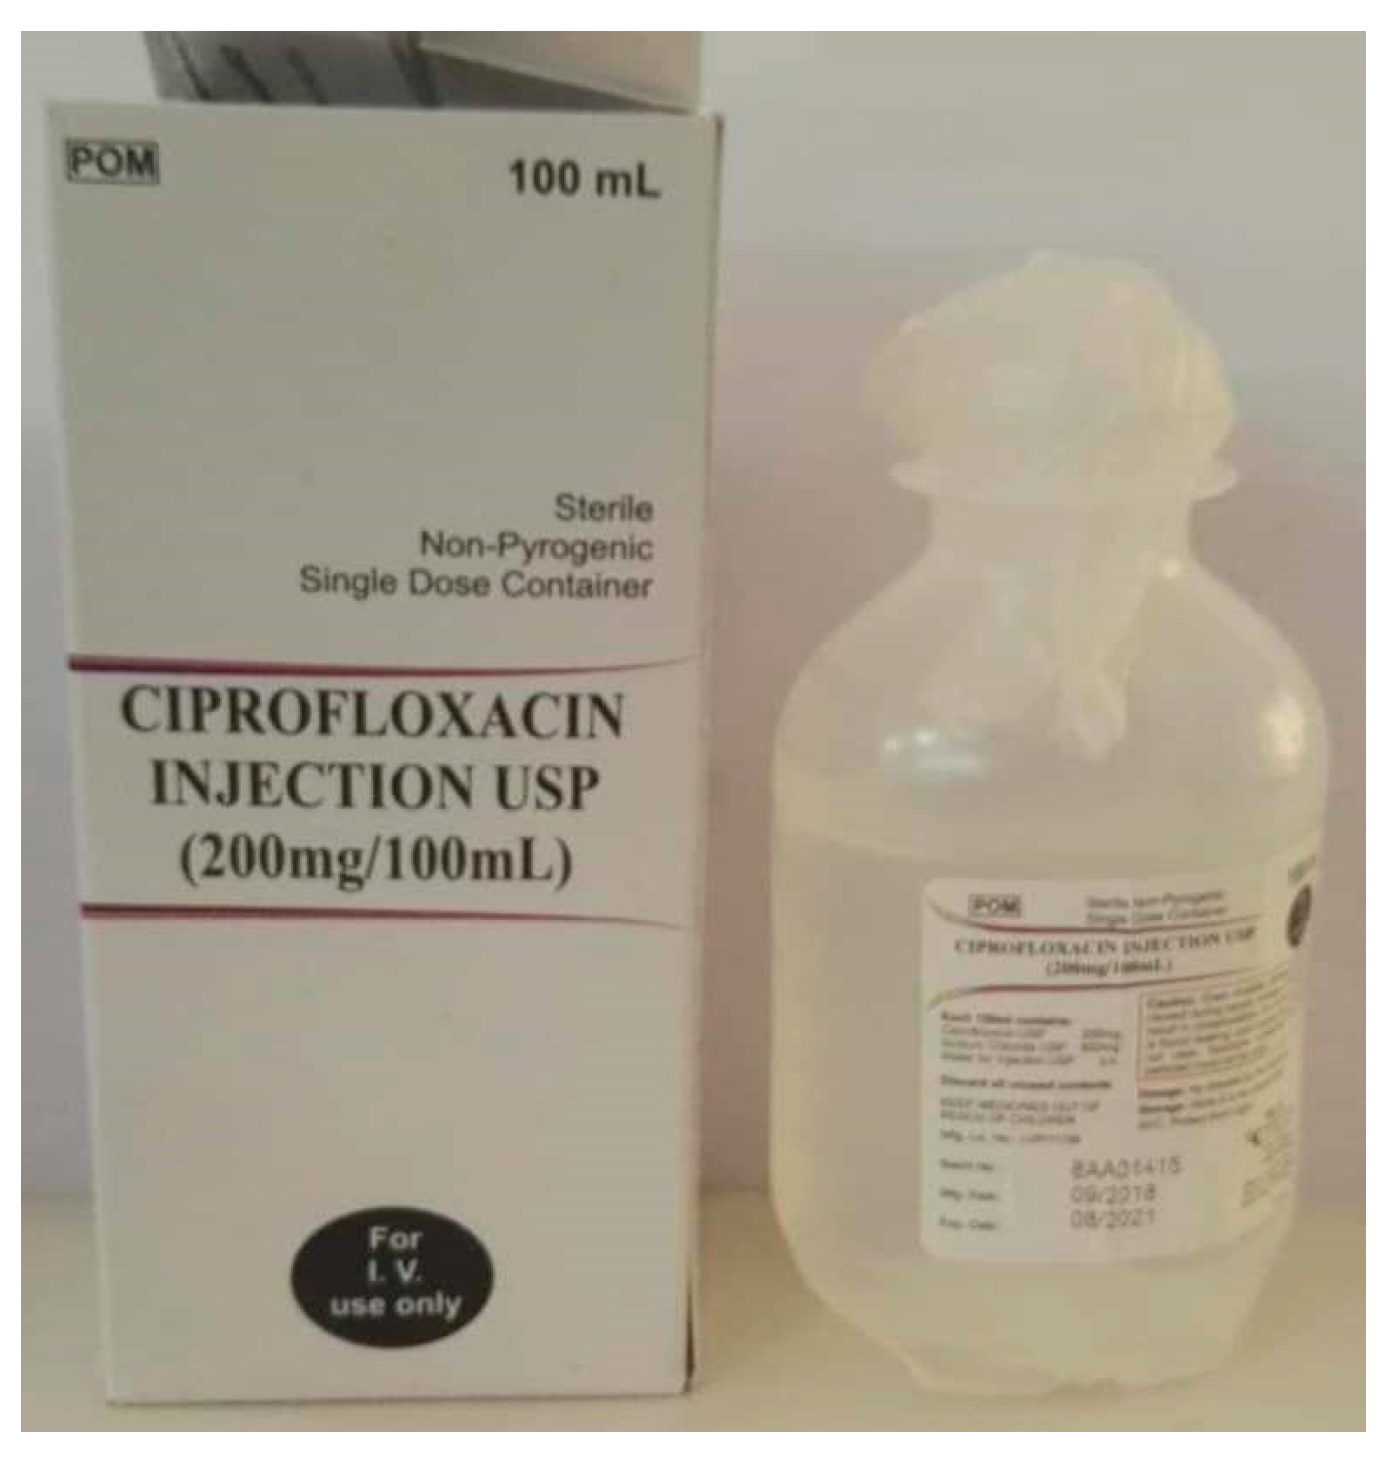
Scheme 2.
Ciprofloxacine injectable 200 mg/ 100 mL ( marque POM- Kenya).
Scheme 2.
Ciprofloxacine injectable 200 mg/ 100 mL ( marque POM- Kenya).
Gentamycine
Gentamycin belongs to the aminoglycoside antibiotic family. It is used for the treatment of serious infections caused by aerobic Gram-negative bacteria.
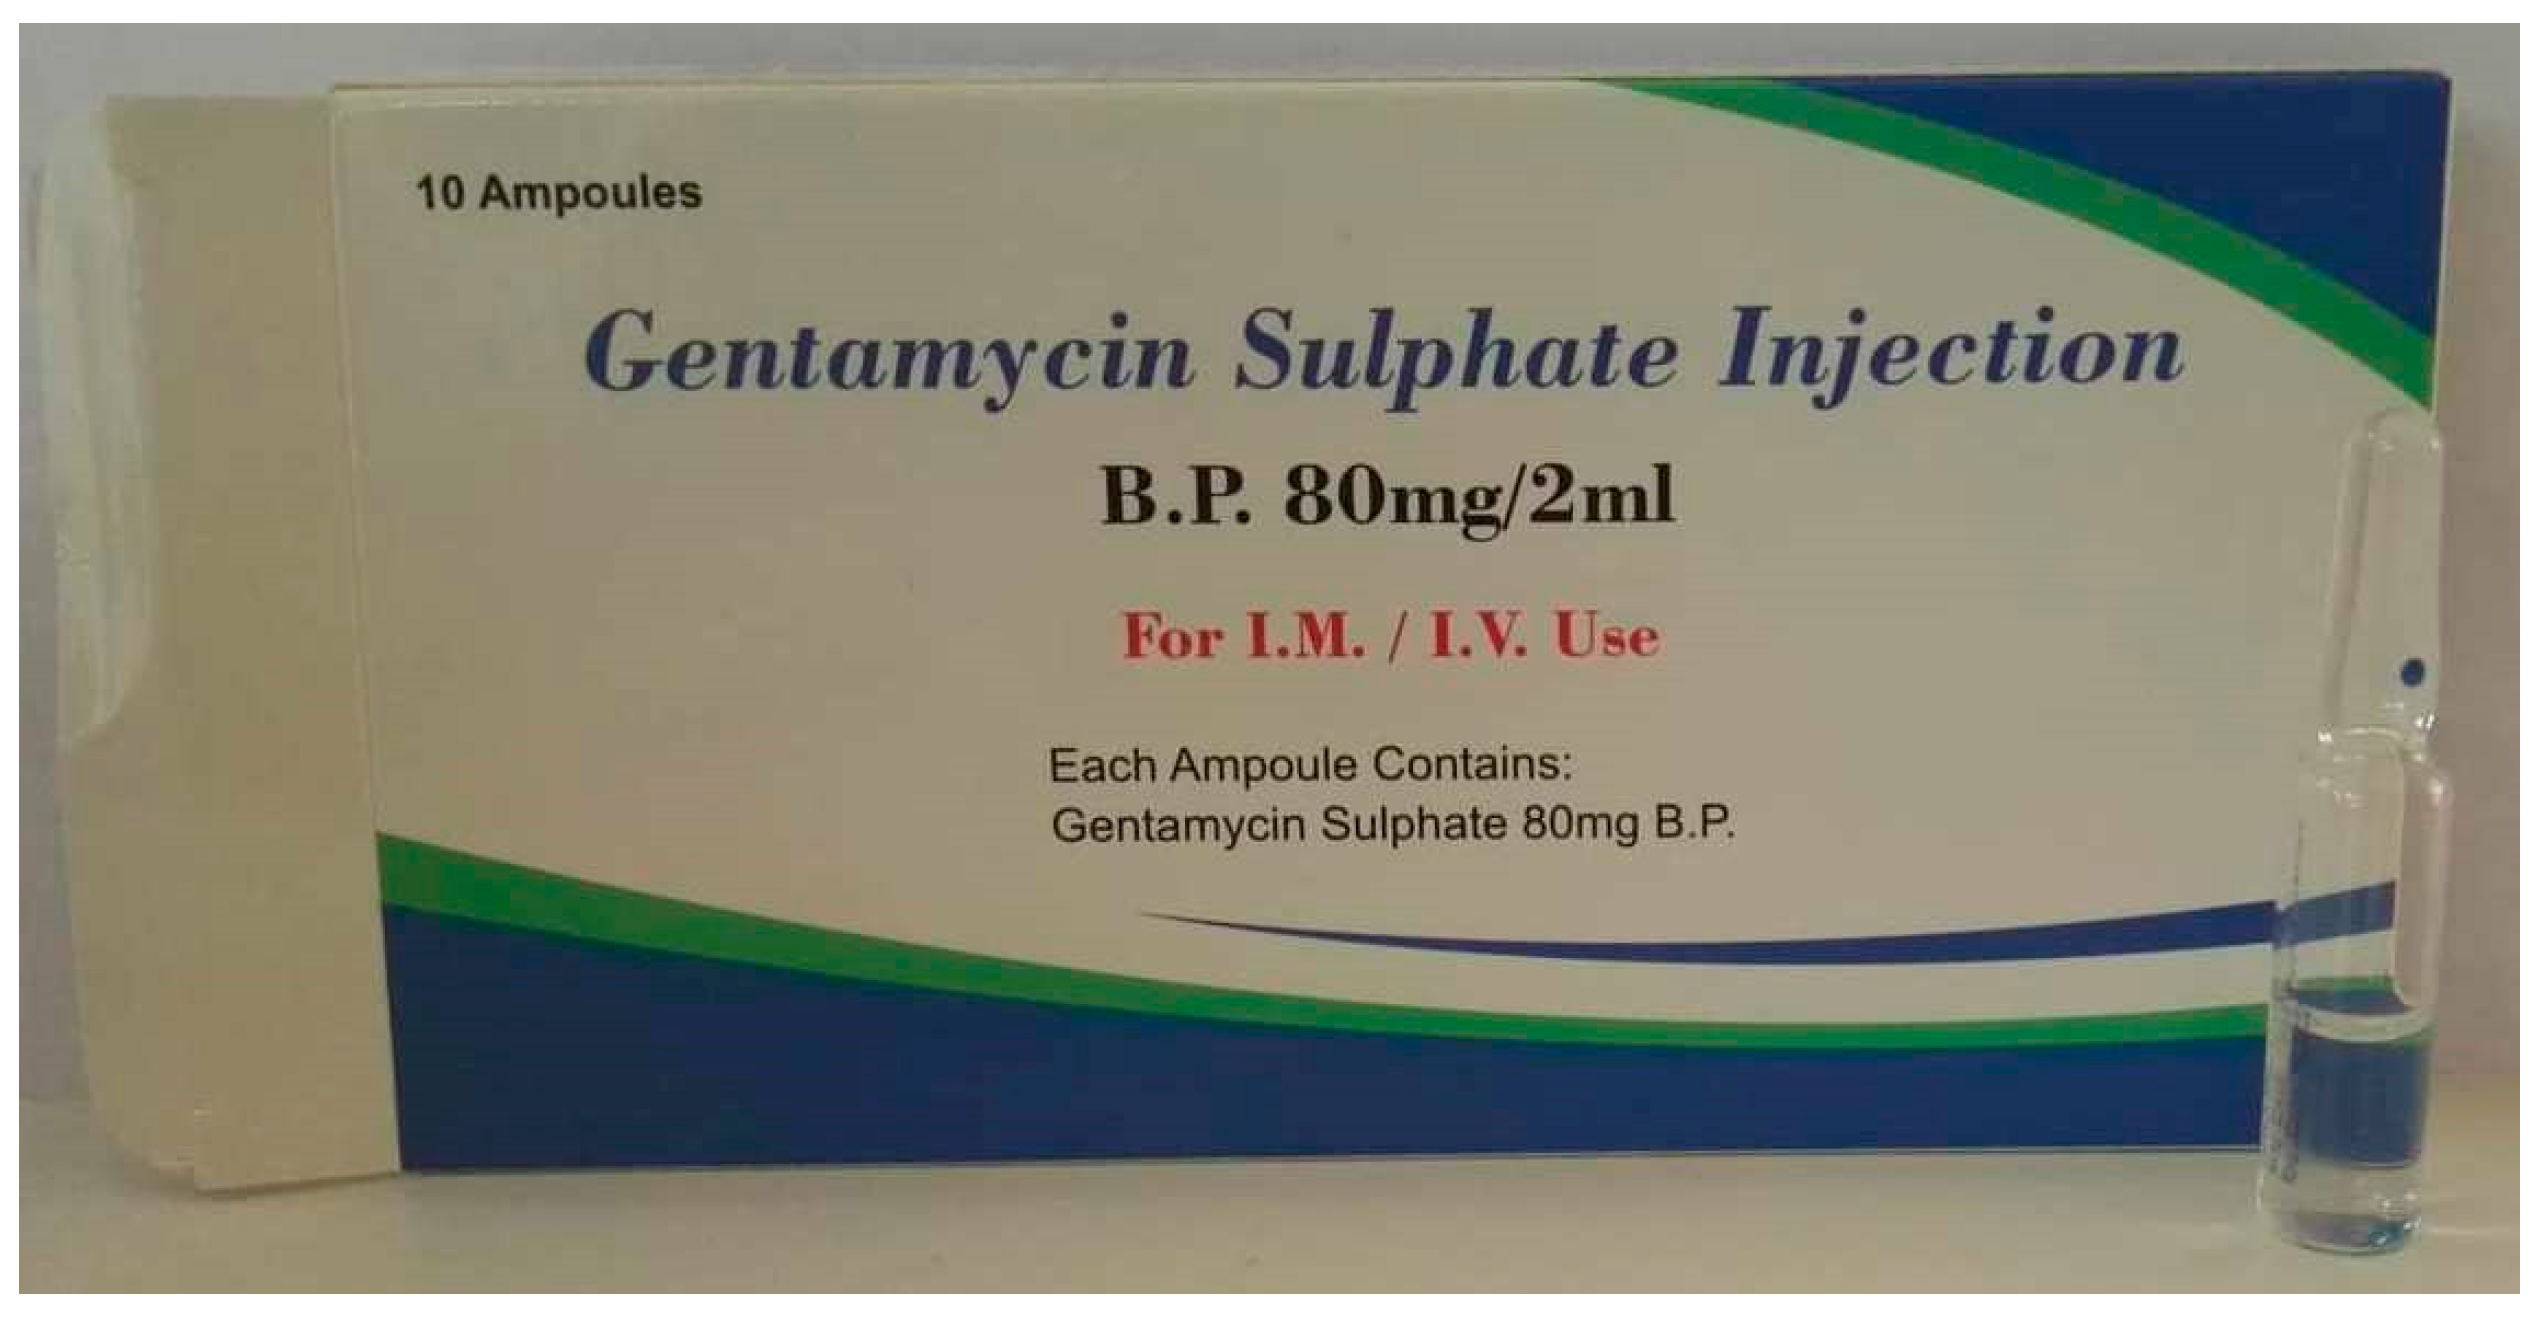
Scheme 3.
Gentamycine sulphate injectable (CROWN HEALTH CARE- China).
Scheme 3.
Gentamycine sulphate injectable (CROWN HEALTH CARE- China).
Amoxicilline
Amoxicillin, marketed as a generic drug, is a bactericidal β-lactam antibiotic of the aminopenicillin family indicated in the treatment of bacterial infections with sensitive germs [
5]. Amoxicillin is the most commonly used antibiotic, especially in children.
Its dosage form is a capsule produced by a Chinese laboratory and available in all health centres in Djibouti.
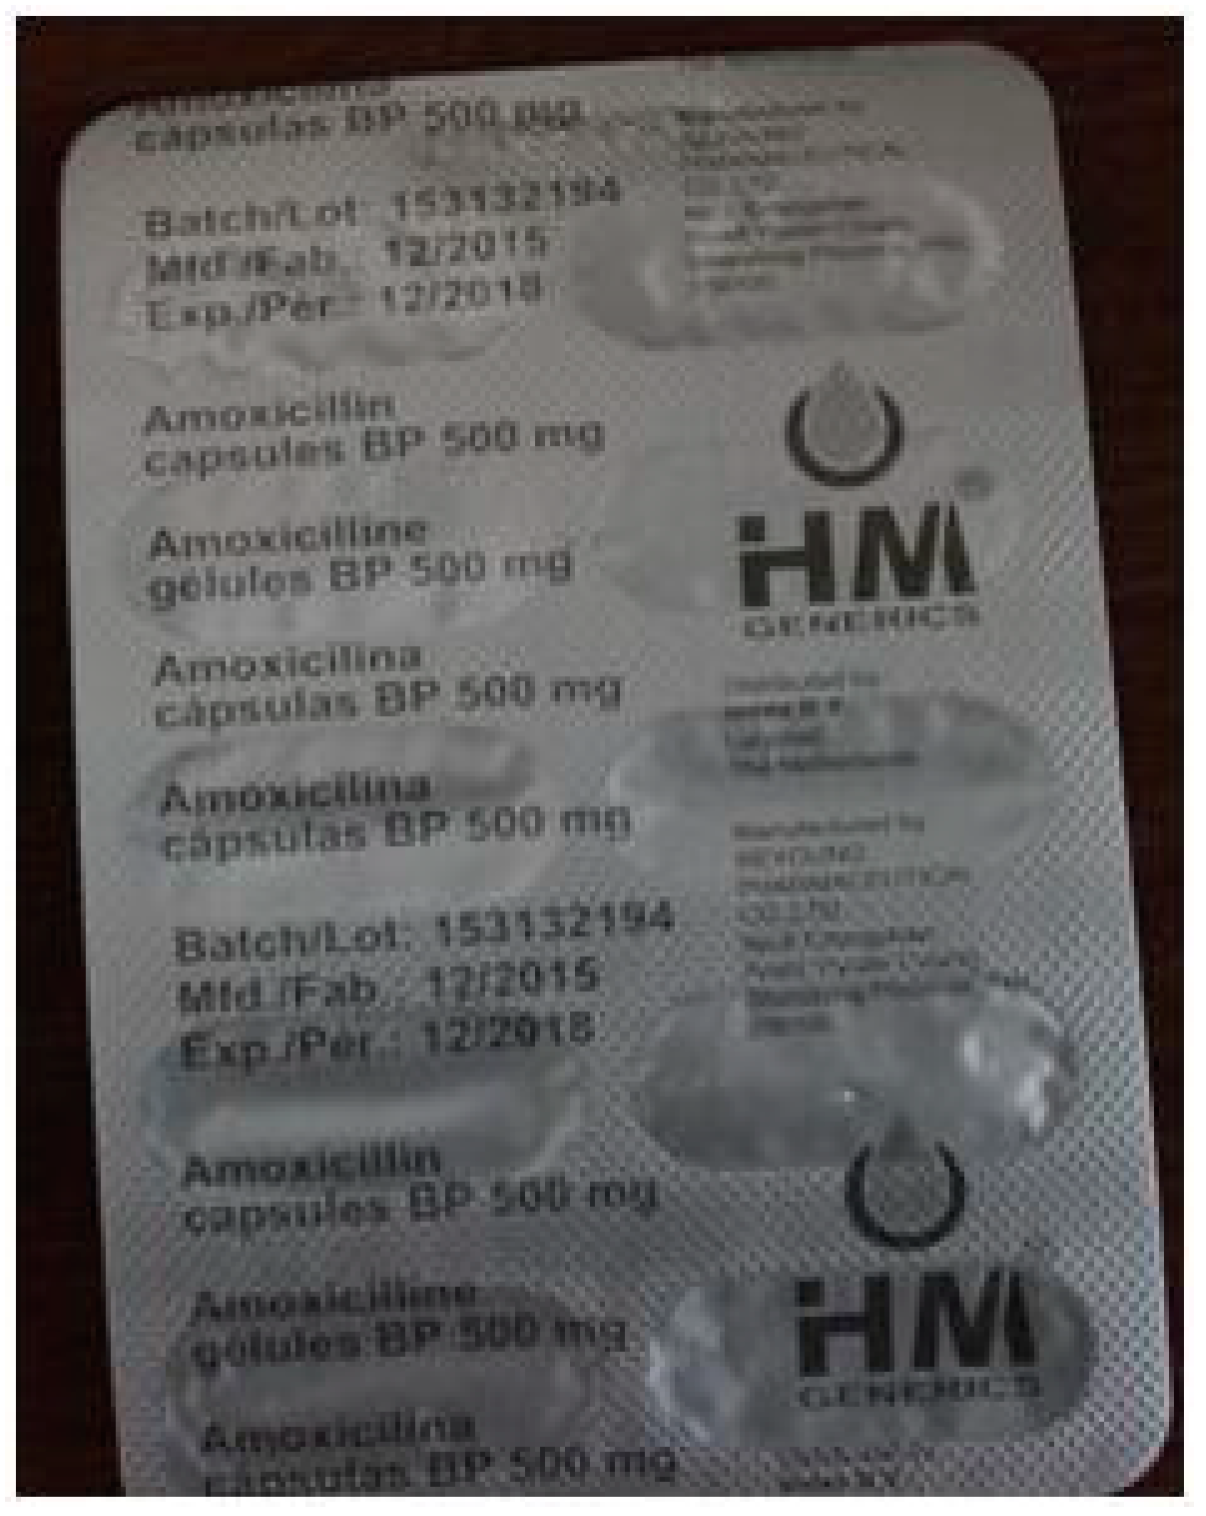
Scheme 4.
Ammoxicilline, capsule 500 mg (marque HM-china).
Scheme 4.
Ammoxicilline, capsule 500 mg (marque HM-china).
Mébendazole
Mebendazole (trade name Vermox) is an antihelmintic of the benzimidazole class, used in infestations by roundworms such Ascaris lumbricoides and Enterobius vermicularis. An anthelmintic is a class of antiparasitic medicine that helps eradicate parasitic worms, particularly gastrointestinal worms in humans.
Its dosage form is a tablet produced by an Indian laboratory and available in all health centres in Djibouti.
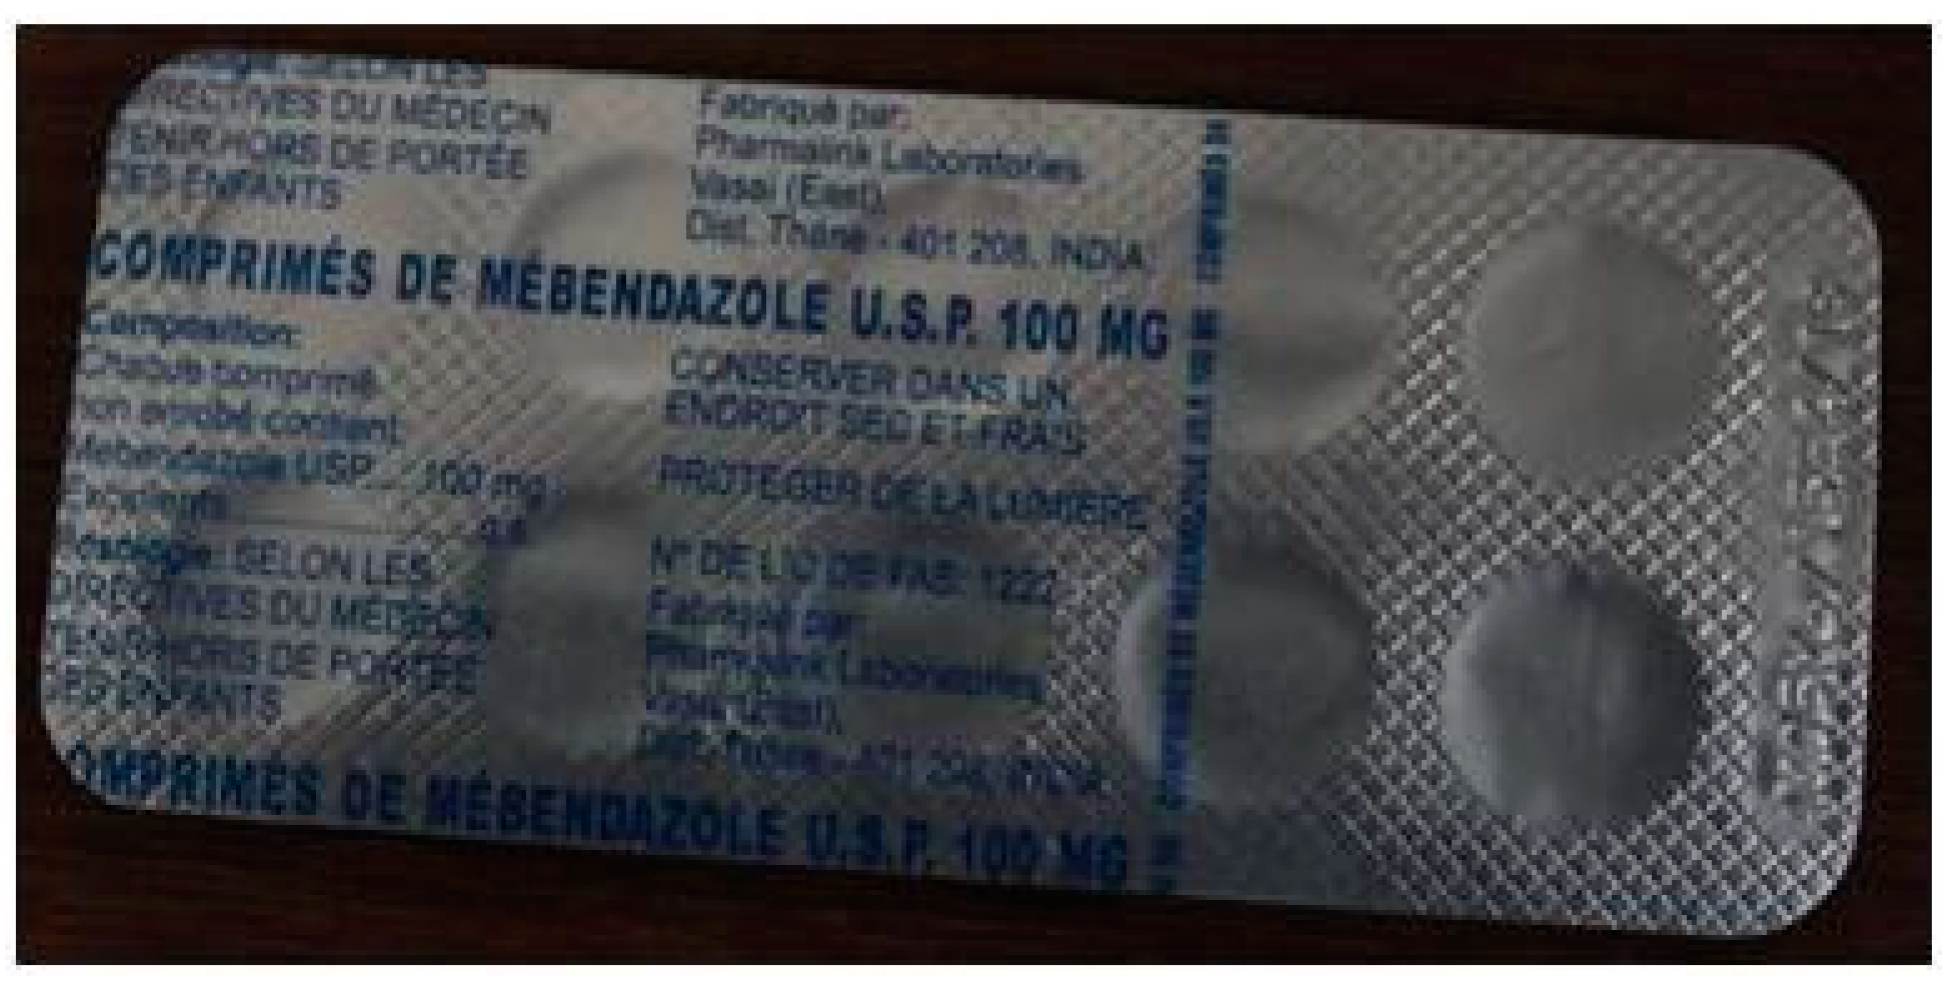
Scheme 5.
Mébendazole, comprimé 100mg (Pharmalink-India).
Scheme 5.
Mébendazole, comprimé 100mg (Pharmalink-India).
Métronidazole
Metronidazole is an antibiotic and antiparasitic belonging to the nitroimidazoles. It inhibits nucleic acid synthesis and is used for the treatment of infections related to anaerobic bacteria as well as protozoa.
Its dosage form is a tablet produced by an Indian laboratory and available in all health centres in Djibouti.
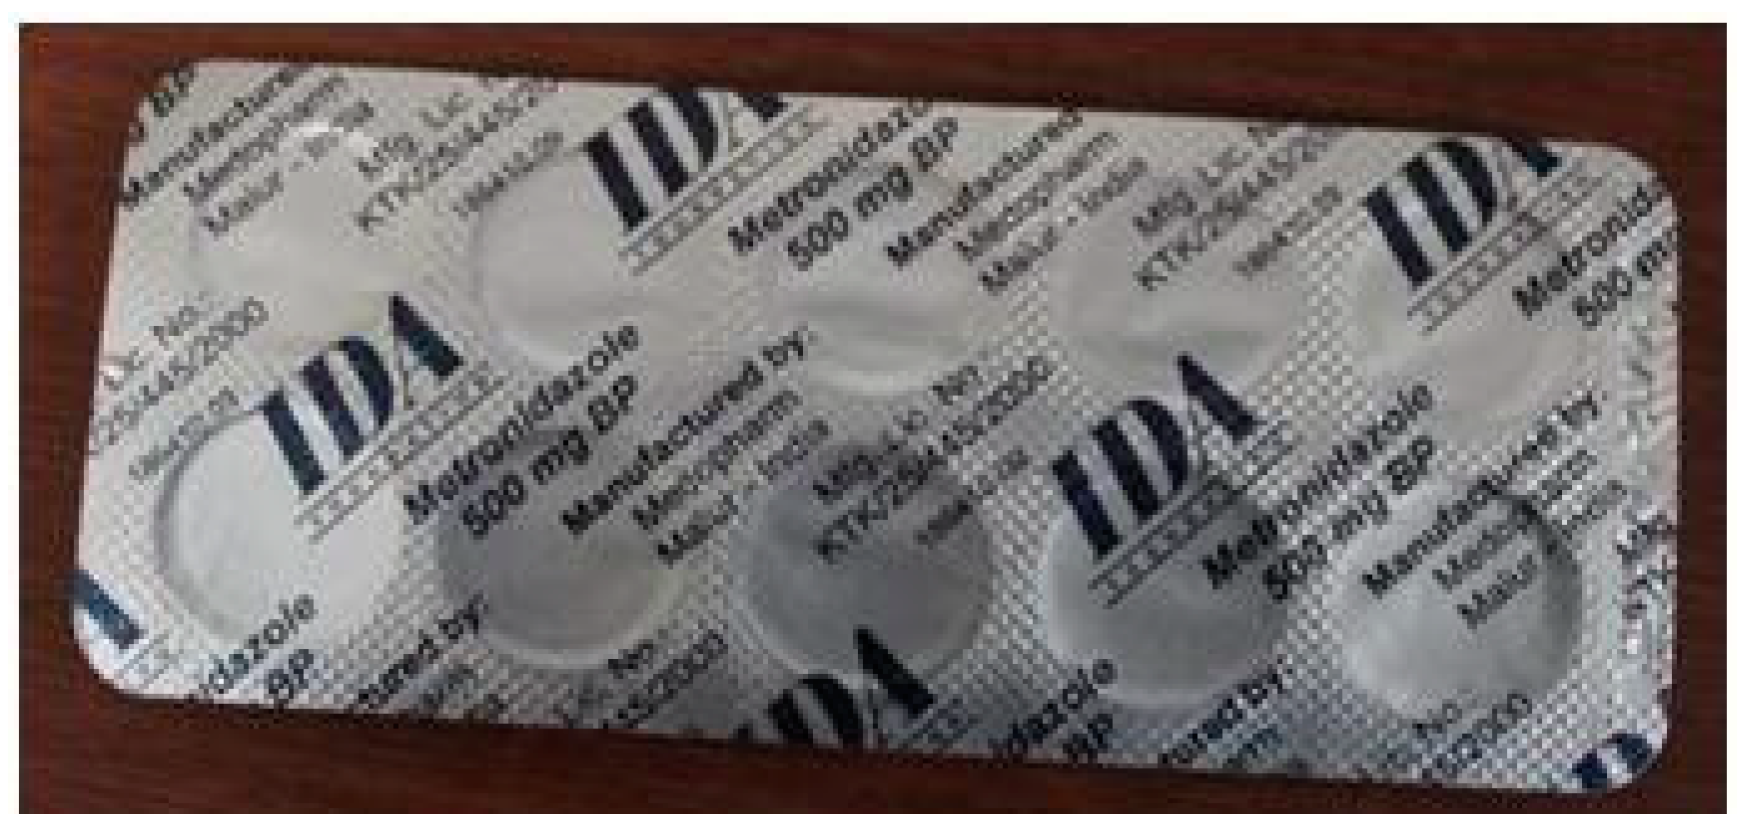
Scheme 6.
Métronidazole, tablet (Medopharm-India).
Scheme 6.
Métronidazole, tablet (Medopharm-India).
2.1.3. Analysis materials
The equipments used in this study were installed in the chemistry laboratory of the Institute of Medicinal Research (IRM) within the Center for Studies and Research of Djibouti (CERD). This is an Agilent 1260 HPLC; DU 800 Spectrophotometer; High precision balance; MEMMERT oven; dark room and chromatographic plate and its accessories.
2.1.4. Solvants and pharmaceuticals standards
The organic solvents and the USP pharmaceutical references were purchased from Sigma Aldrich, Germany.
2.2. Analyse qualitative
2.2.1. Thin layer chromatography (TLC)
Thin layer chromatography is a valuable tool in drug analysis, as it allows for obtaining information on the pharmaceutical product’s composition, identifying possible impurities, and controlling their quality. It is widely used in the pharmaceutical industry and drug quality control laboratories.
In this present study, this analysis allows us to have the first elements to rule on the conformity of targeted antibiotics. In TLC, we analyzed three active ingredients which are Ciprofloxacin, Ceftriaxone, and Gentamicin. The protocols were adapted from the literature (
Table 1).
2.2.2. Spectrophotometric profile
The characteristic absorbance curve of a compound at different wavelengths is a unique absorption signature, making it a common identification method. We dissolved the standards and drugs in the same condition and performed a scan of their UV and visible absorbances using a DU 800 spectrophotometer.
2.2.3. Profil HPLC
We performed the HPLC profile of three active ingredients: Amoxicillin, Mebendazole, and Metronidazole. The programming details of this analysis are collected in
Table 2.
2.3. Analyse quantitative
2.3.1. Assay by spectrophotometry
The dosage of Ciprofloxacin is carried out according to [
12] with some modifications. The ciprofloxacin standard was prepared at a concentration of 1 mg/ml then gradually diluted to 50, 20, 10, 5, and 2 μg/ mL. The absorbance was measured in a 1 cm cuvette using a UV-VIS spectrophotometer at the maximum absorbance wavelength of 275 nm.
For Ceftriaxone, the calibration curve was carried out with the standard of this molecule at concentrations of 70, 50, 20, and 10 μg/ mL. The absorbance measurement wavelength is 241 nm [
13].
Finally, 10 mg of accurately weighed gentamycin standard was transferred to a volumetric flask and added enough water to make 50 ml. Four dilutions of 100, 50, 25 and 10 μg/mL were made from 200 μg/mL of the standard gentamicin solution previously prepared. The maximum wavelength (λmax) at 202 nm was adopted for absorbance measurement [
14].
2.3.2. Dosage by HPLC
The analysis programming characteristics are the same as those used in qualitative analysis by HPLC (see
Section 2.2).
2.4. Statistical analysis
The analyses were carried out in triplicate and the statistical processing (mean, standard deviation) was done with Excell. The linearity of the calibration curves is evaluated with the squared correlation factor (only R2 ≥ 0.98 is considered in the calculation of contents).
For the tablet dosage form, the results relate to 10 different tablets.
3. Results and Discussions
3.1. Qualitative analysis
From the label indications, we verified the presence of the active ingredient ceftriaxone using thin layer chromatography (TLC) and a USP-grade pure cefriaxone standard purchased from Sigma Aldrich. TLC is recommended for assessing possible degradation of this pharmaceutical compound, whatever its dosage form [
15]. Three commercial brands (NCPC1, Unacefin, and Injxone) were tested (TLC 1).
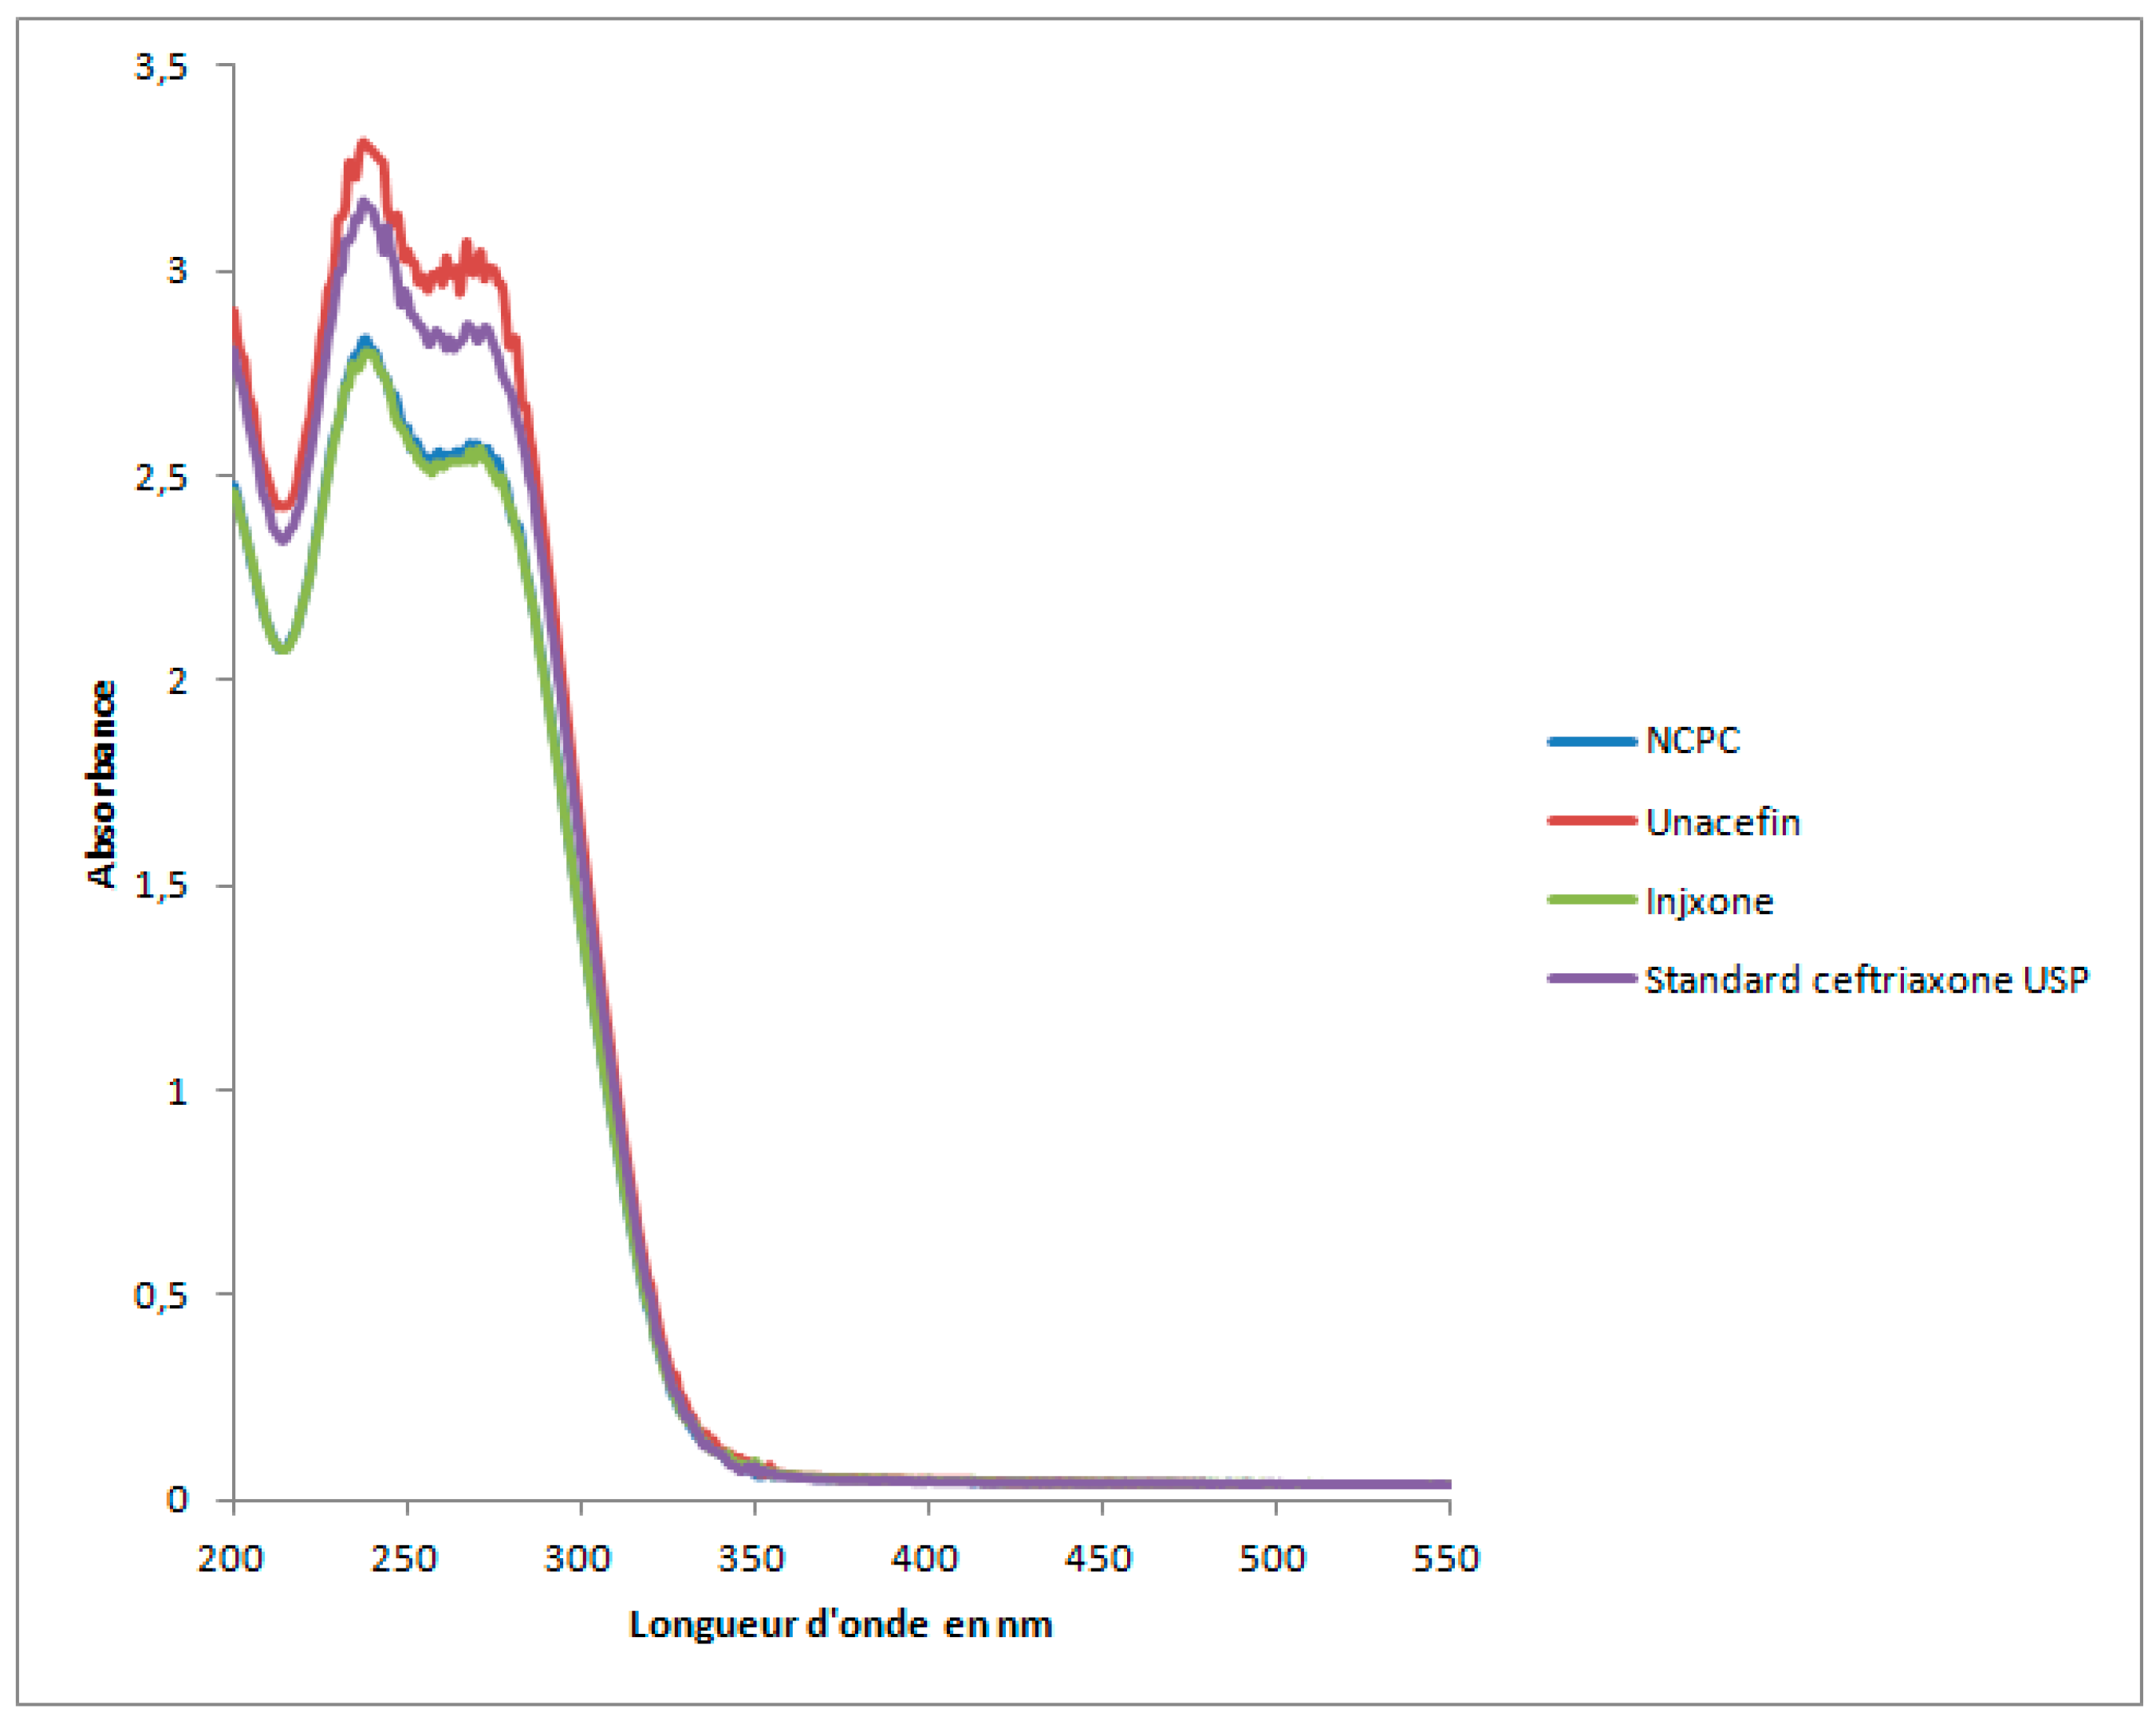
We observe a single spot for all samples (drugs and standard) which has a frontal ratio of 0.8. We do not detect impurities in this analysis condition. Also, the absorbance profiles of the three injectables are similar to that of the standard for this active ingredient (
Figure 1).
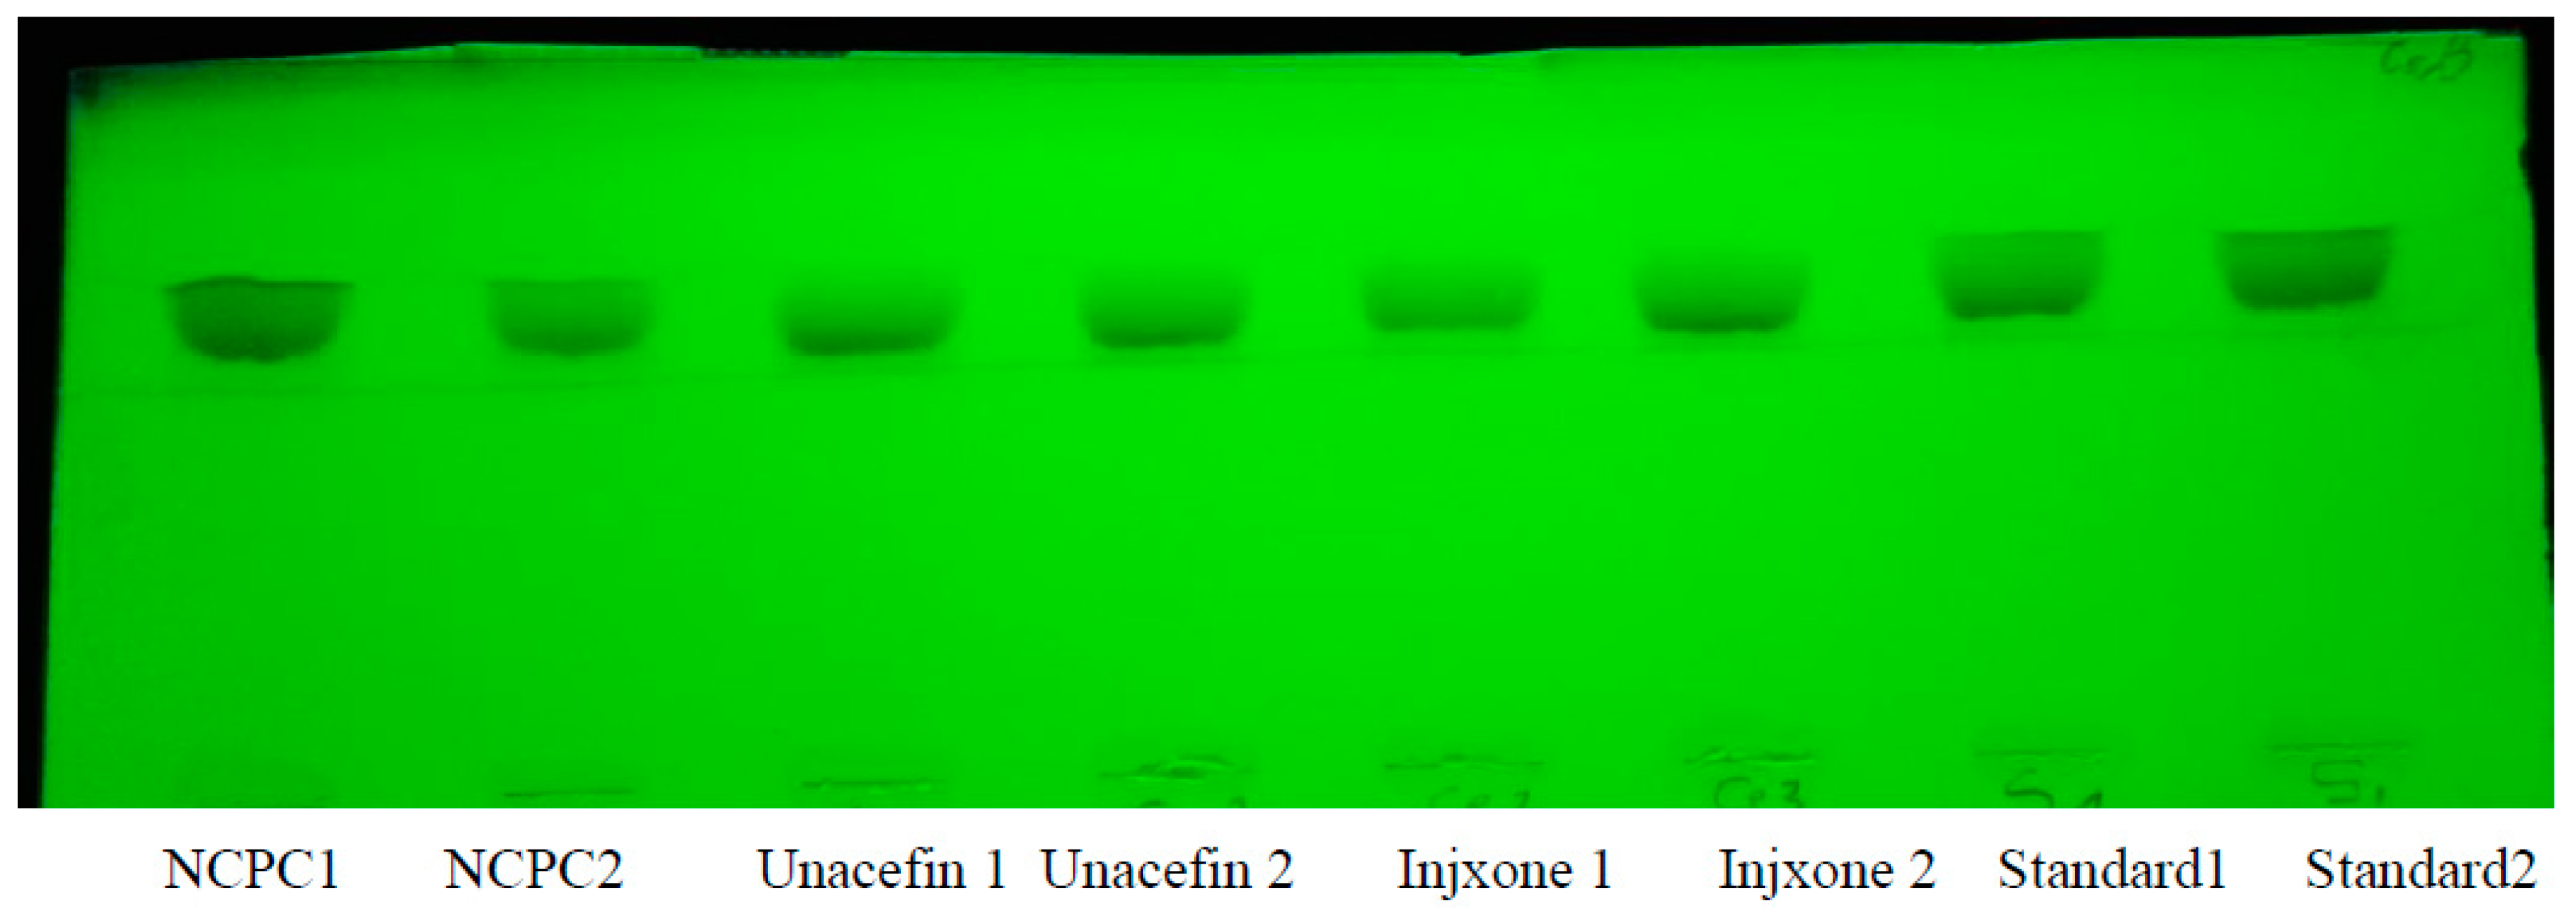
TLC 1. The profile of three ceftriaxone antibiotics and their standard (St).
Figure 1.
Spectrophotometric profile of ceftriaxone (standard and three drugs).
Figure 1.
Spectrophotometric profile of ceftriaxone (standard and three drugs).
Likewise, the TLC 2 plate containing the drug ciprofloxacin injection (M) and the pure standard ciprofloxacin USP quality shows a single blue-colored spot under UV at 356 nm. The frontal ratio of this spot is 0.35. A study using a similar protocol detected impurity products (ethylenediamine, desfluoro, and fluoroquinolonic acid) with detection limit of between 10 and 44 ng [
16]. We can therefore confirm the absence of these impurities.
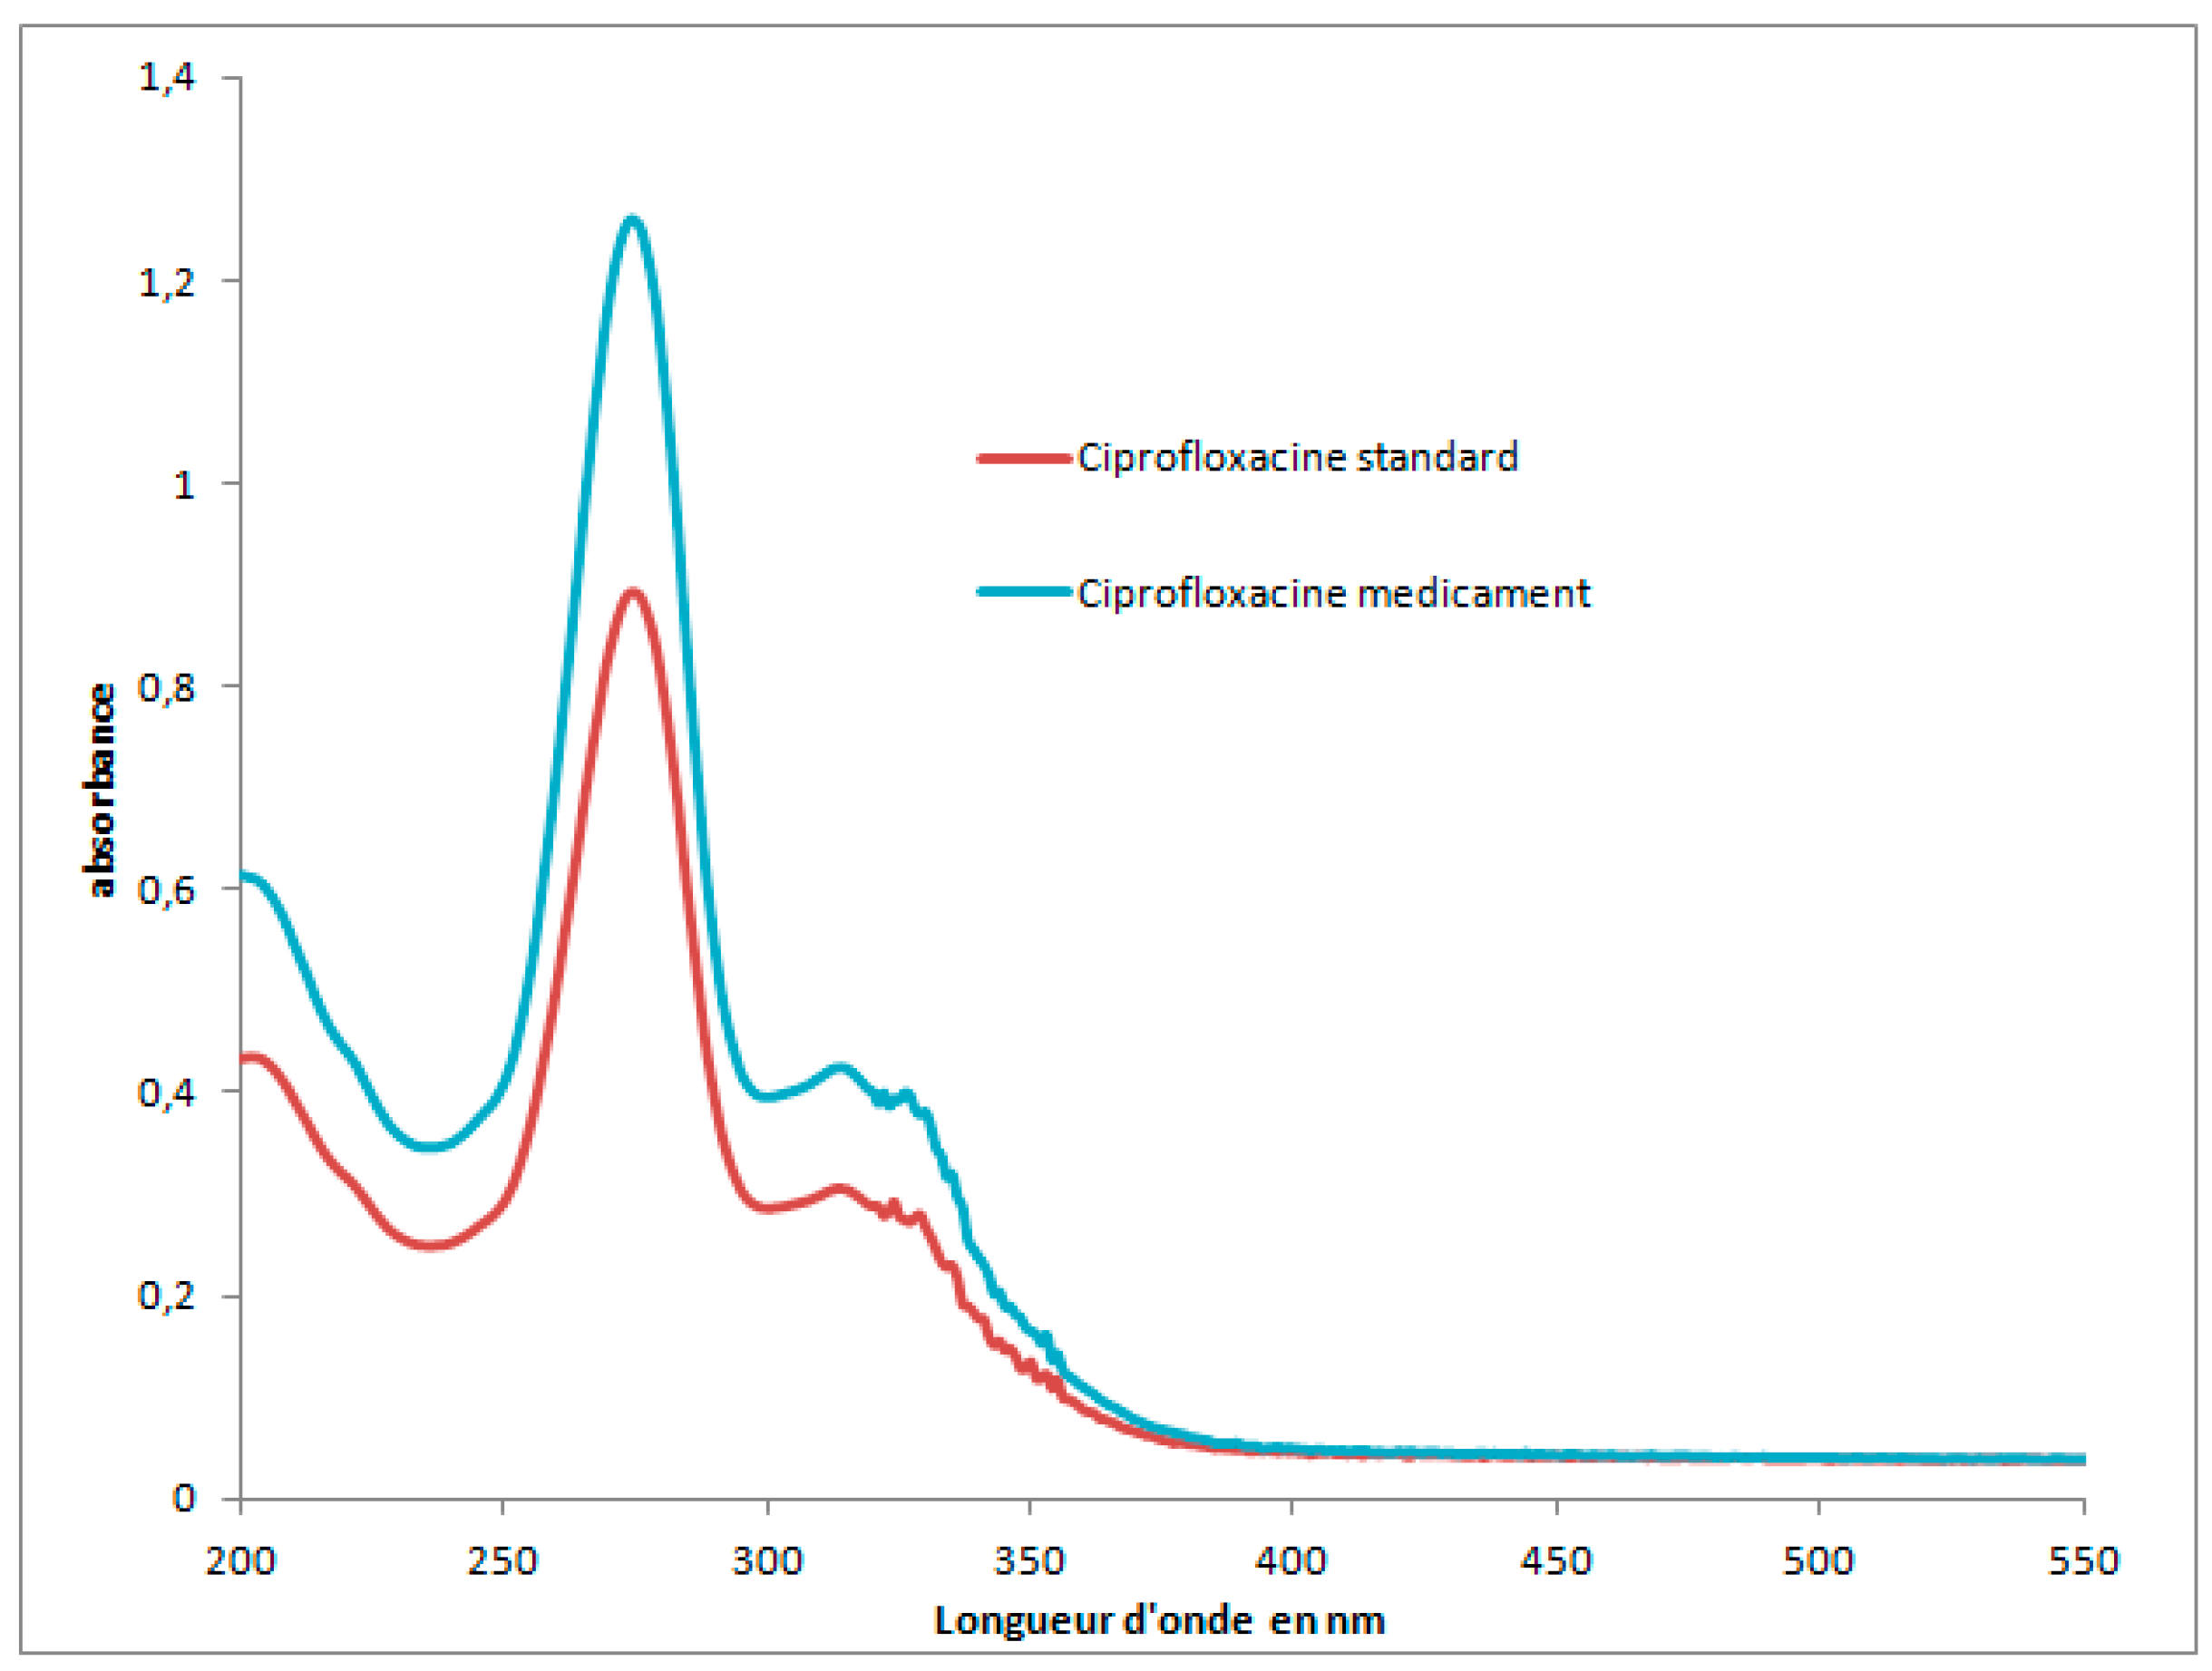
The comparison with the standard was also carried out by scanning the absorbance as a function of wavelengths. The two profiles overlap (
Figure 2).
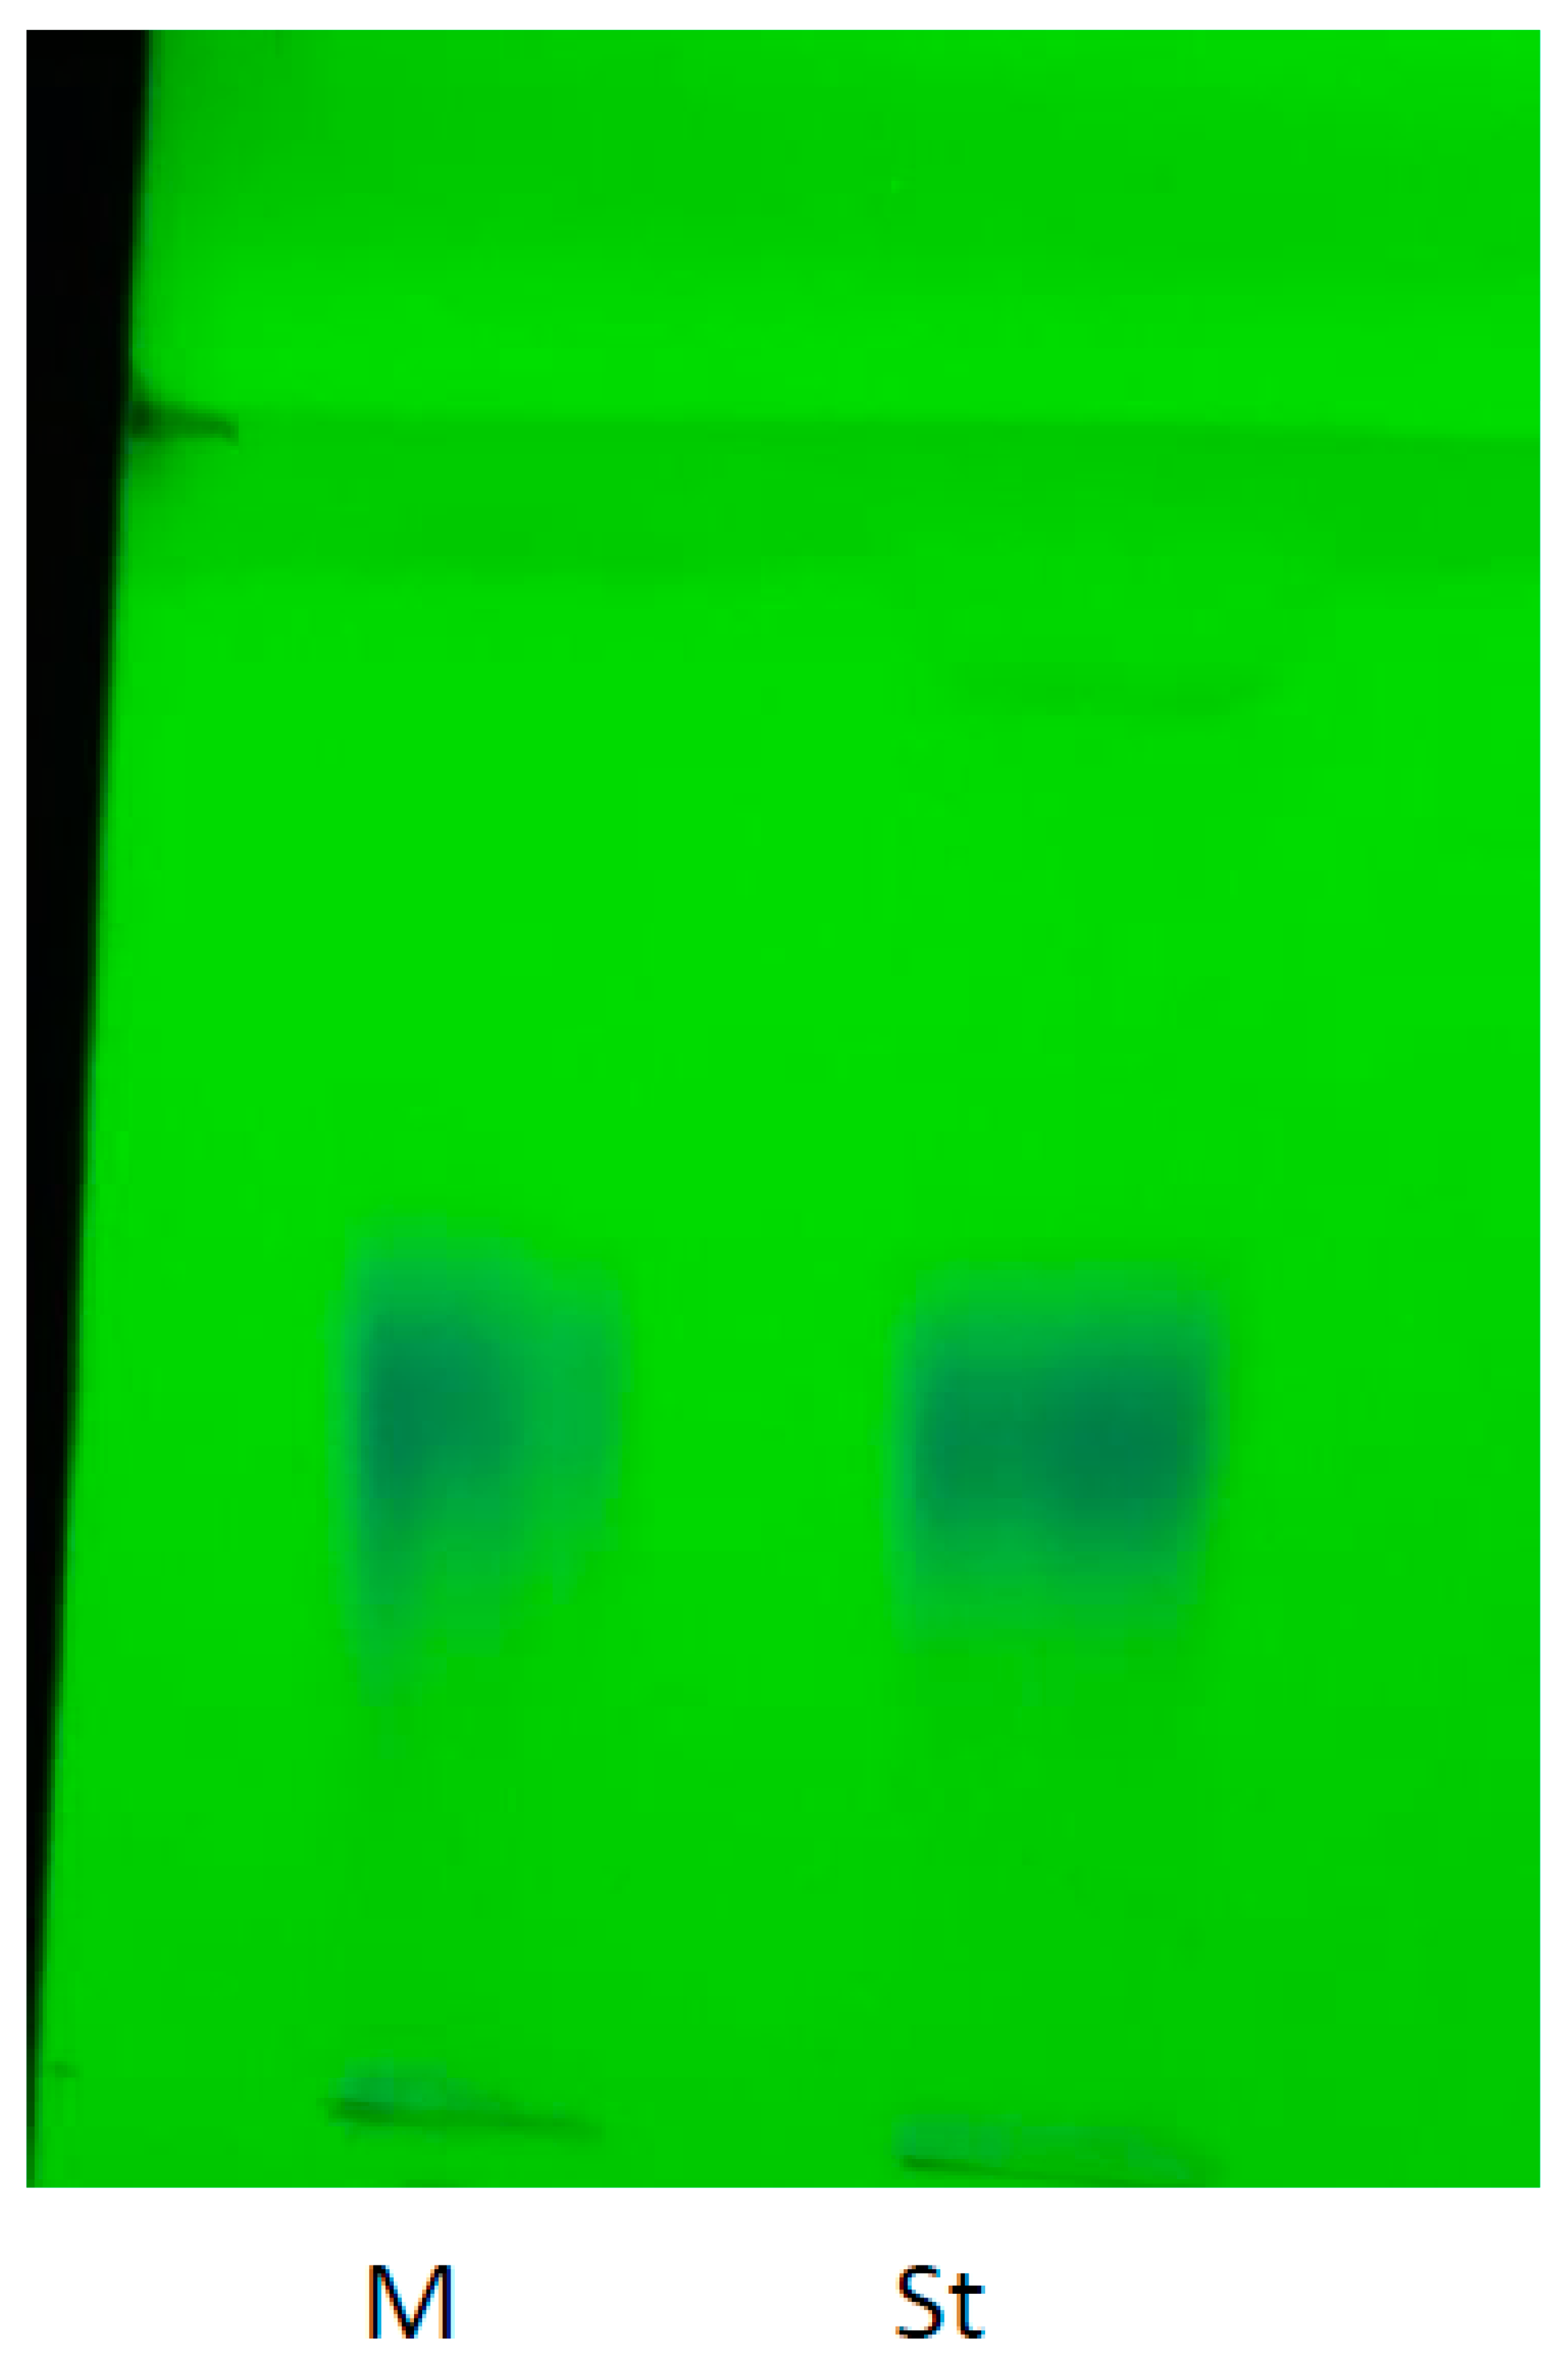
TLC 2. Ciprofloxacine injectable (M) and standard (St) under UV at 365 nm.
Figure 2.
Spectrophotometric profile of Ciprofloxacin (standard and drug).
Figure 2.
Spectrophotometric profile of Ciprofloxacin (standard and drug).
Gentamycin injection and the USP quality standard have a single dark spot in TLC under UV at 356 nm and under daylight (TLC 3a-b). The frontal ratio of this spot is 0.8. We do not observe any impurities and the medicine appears to contain only one active ingredient which is gentamycin. This molecule is very sensitive to heat and UV light [
17].
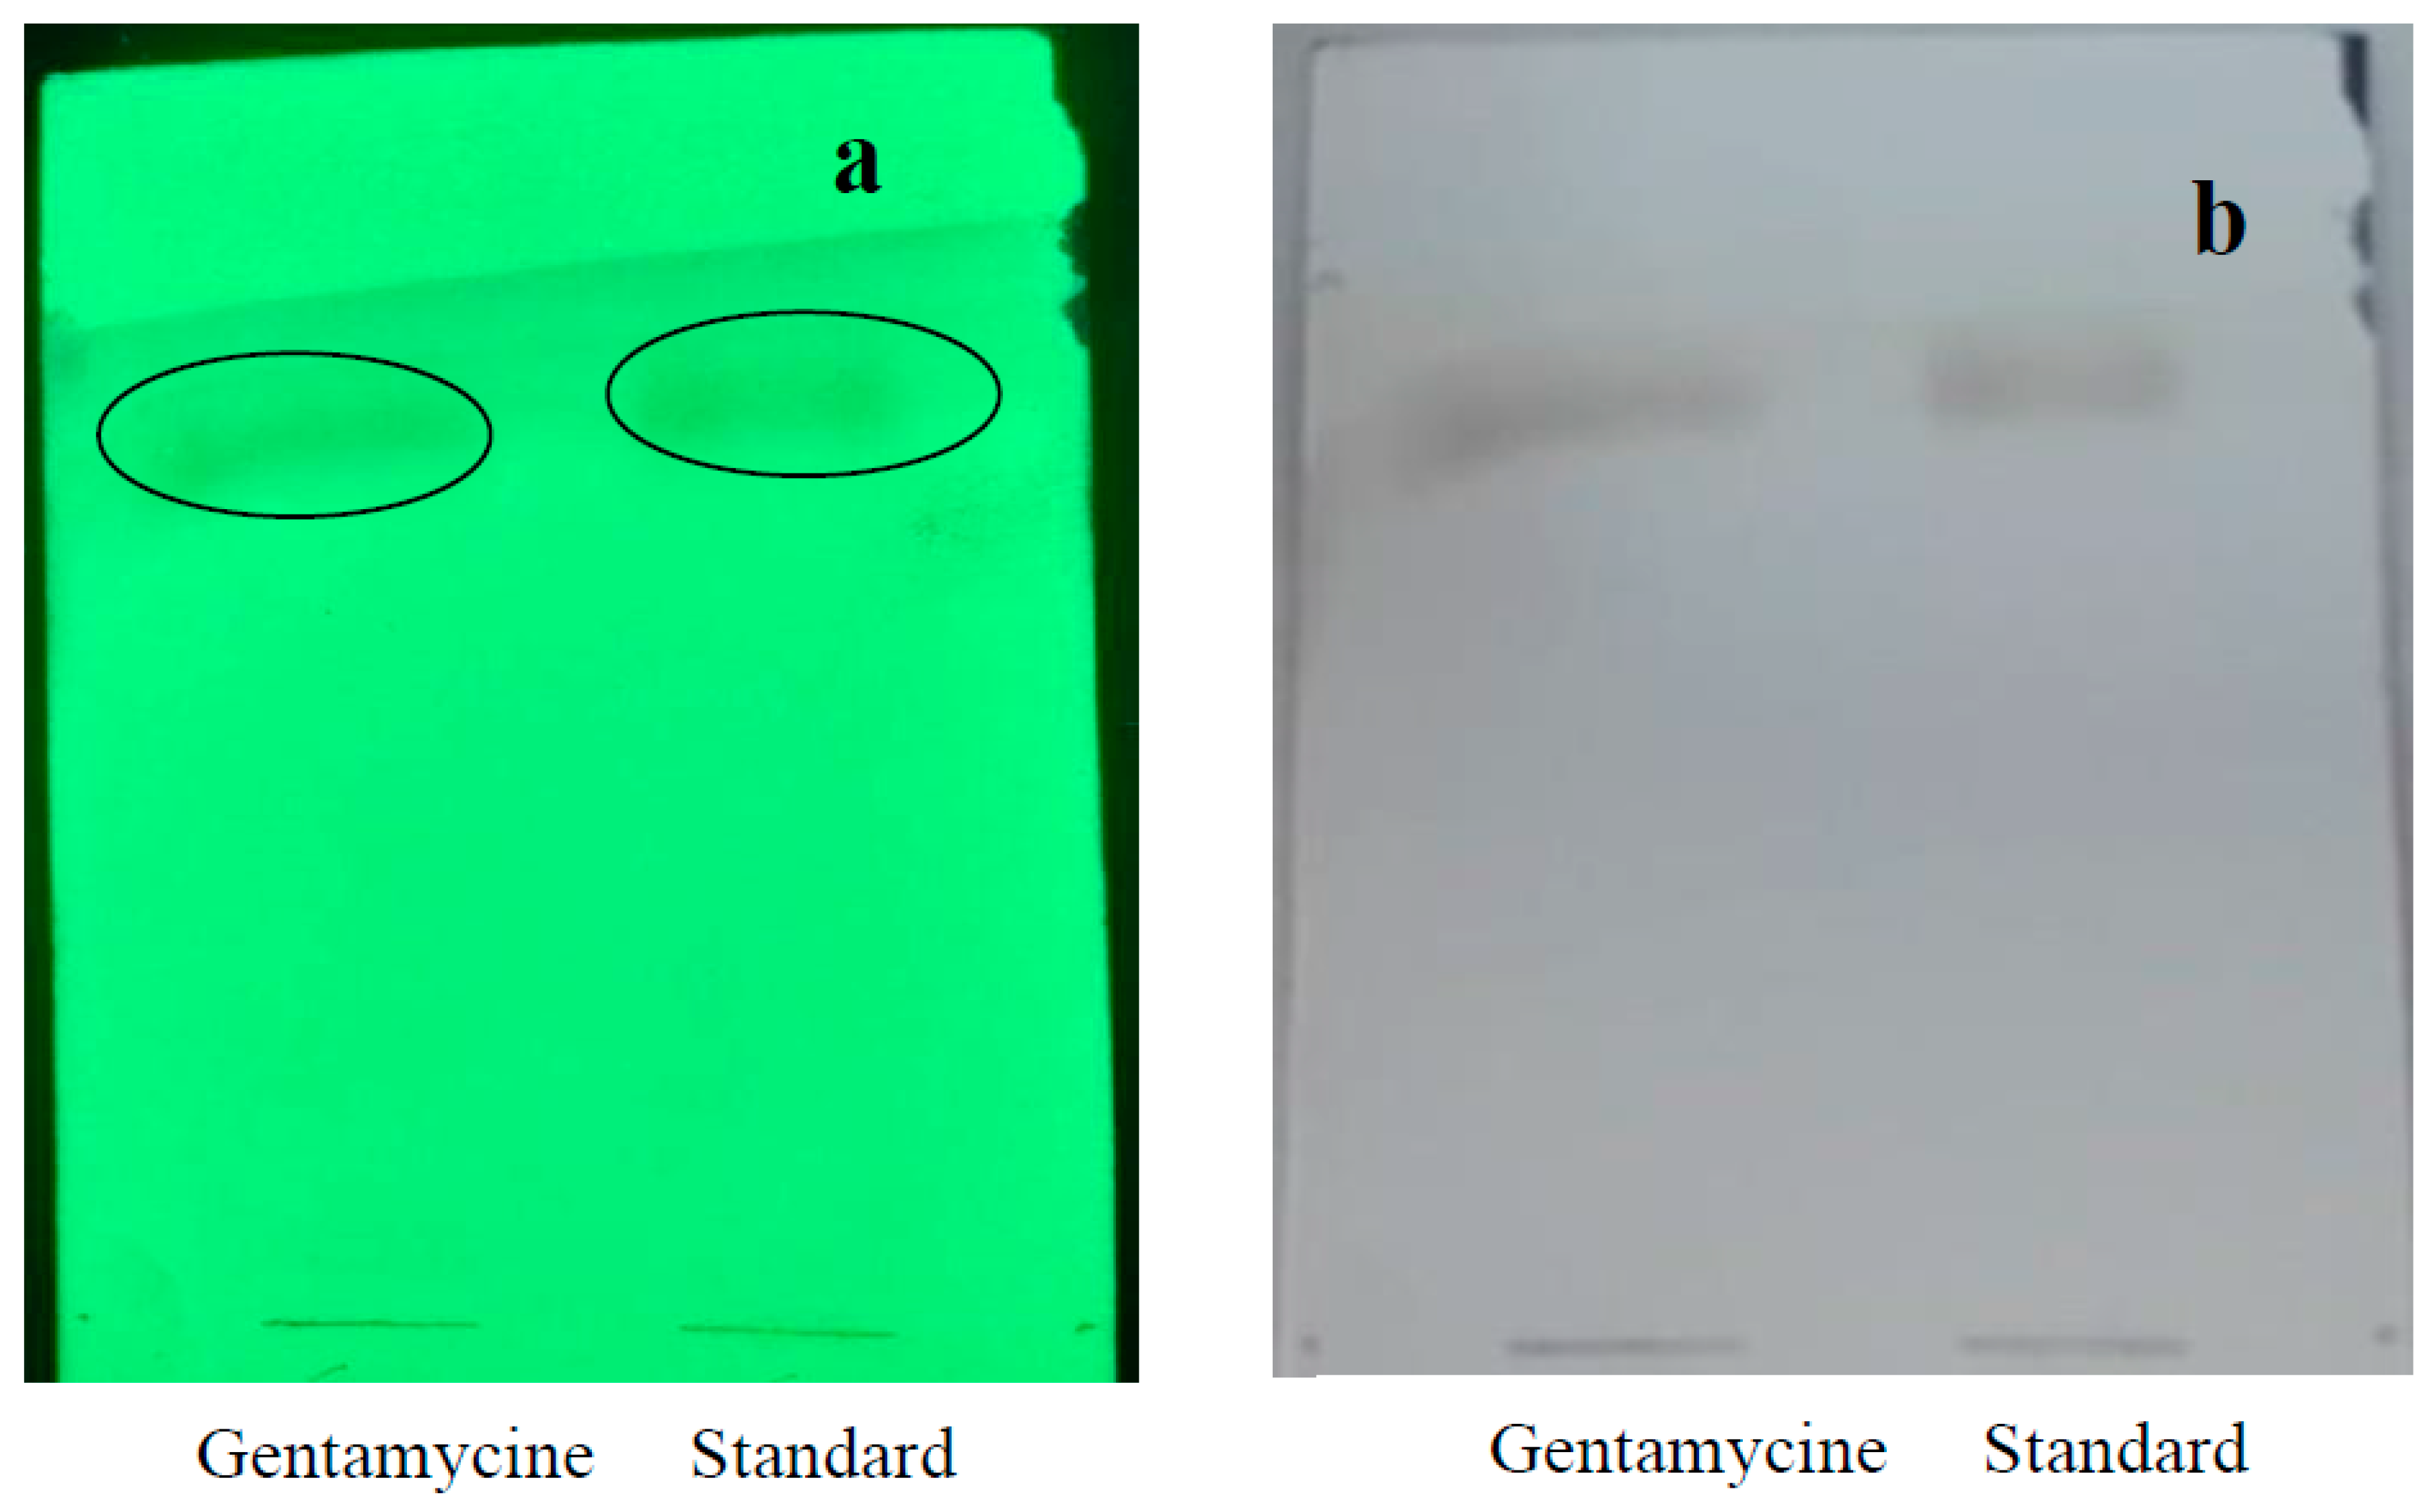
TLC 3. Injectable and standard gentamycin under 356 nm (a) and under daylight (b).
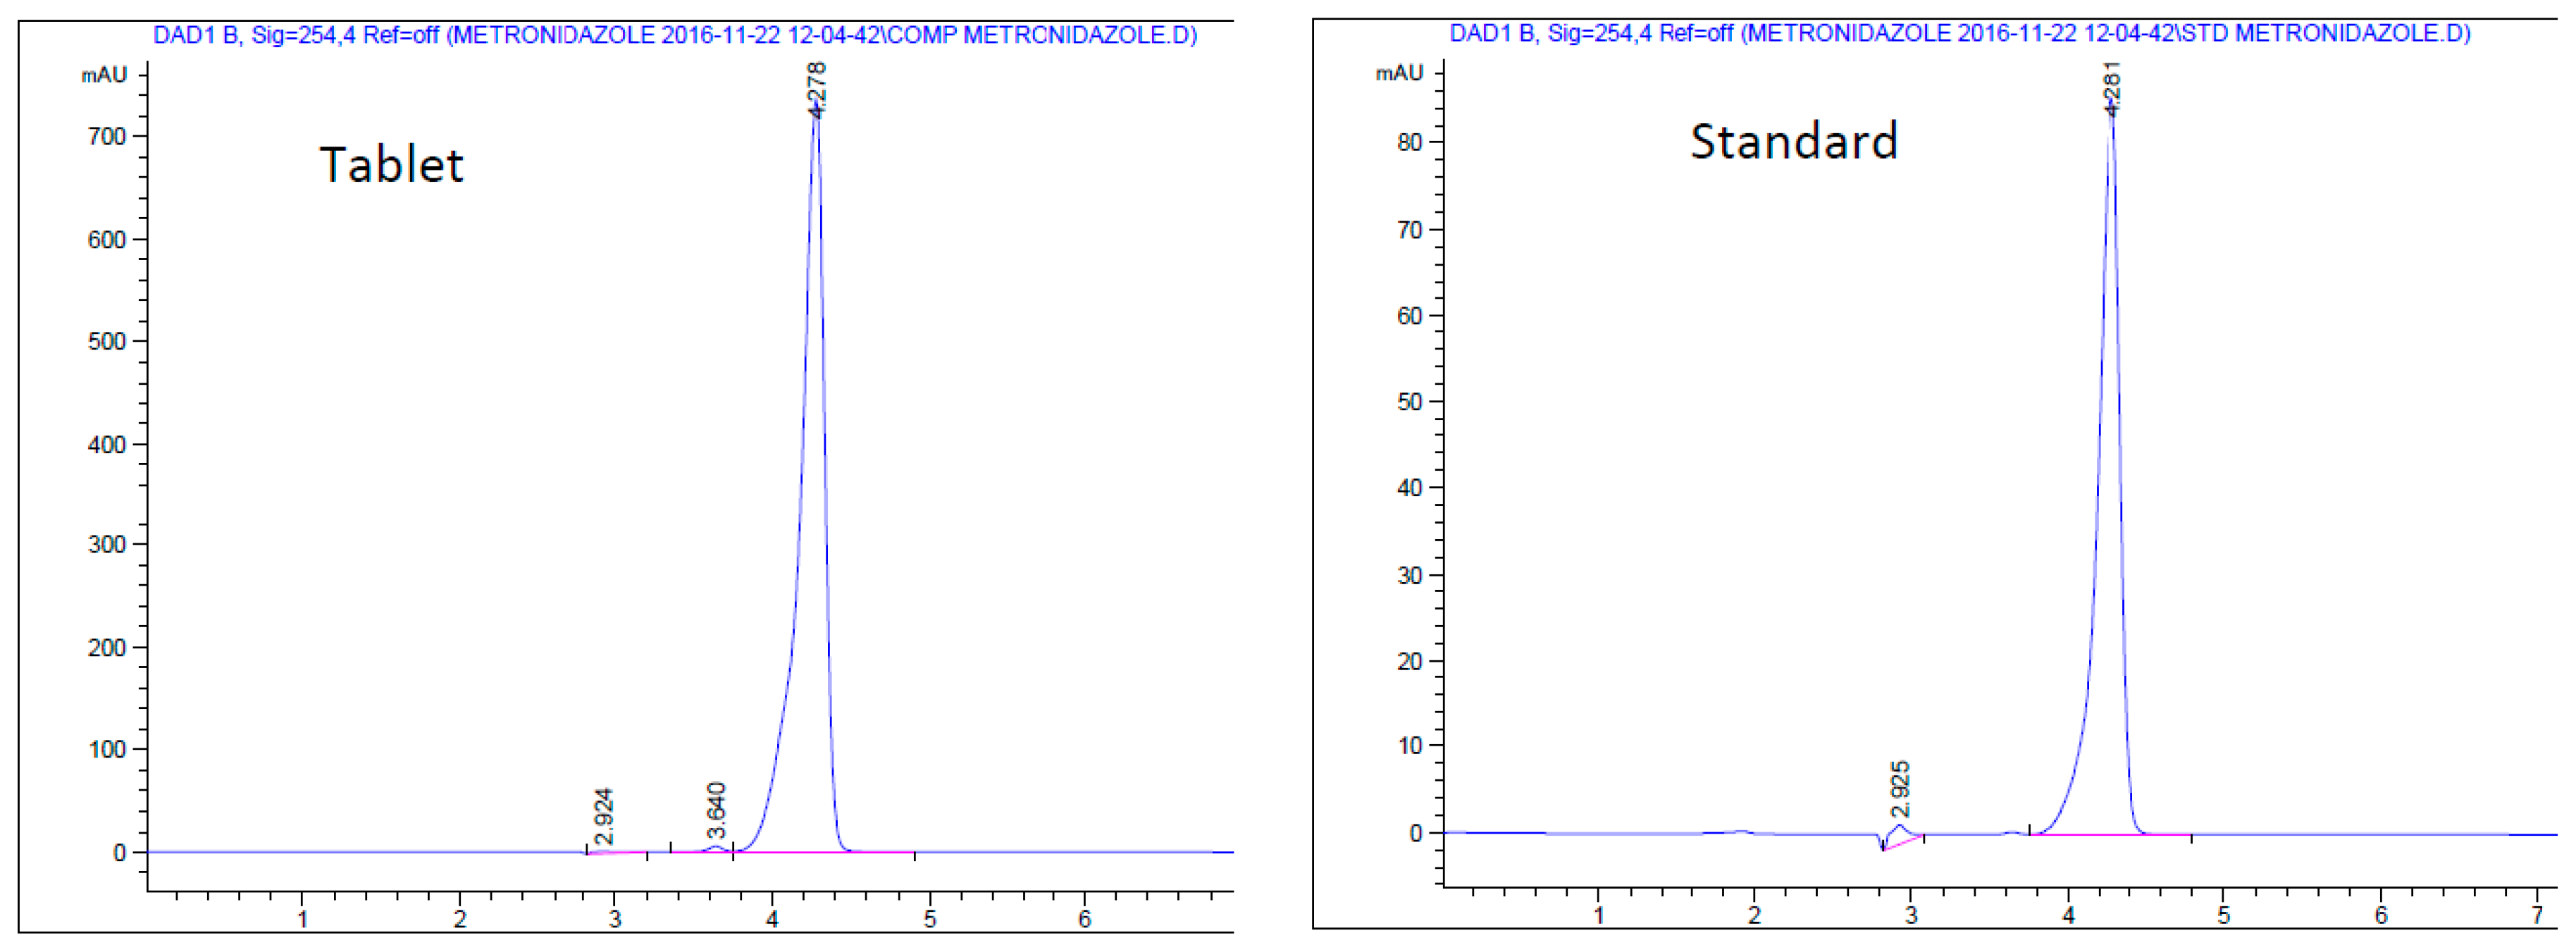
For the three active ingredients amoxicillin, mebendazole, and metronidazole, we verified their presence or not by HPLC. This identification was carried out with its standard and by comparison of retention times.
Many HPLC methods for the determination of drugs in formulations have been reported and are applicable for most dosage forms [
18].
In the case of amoxicillin, most of the analyses in the literature were carried out using an HPLC system[
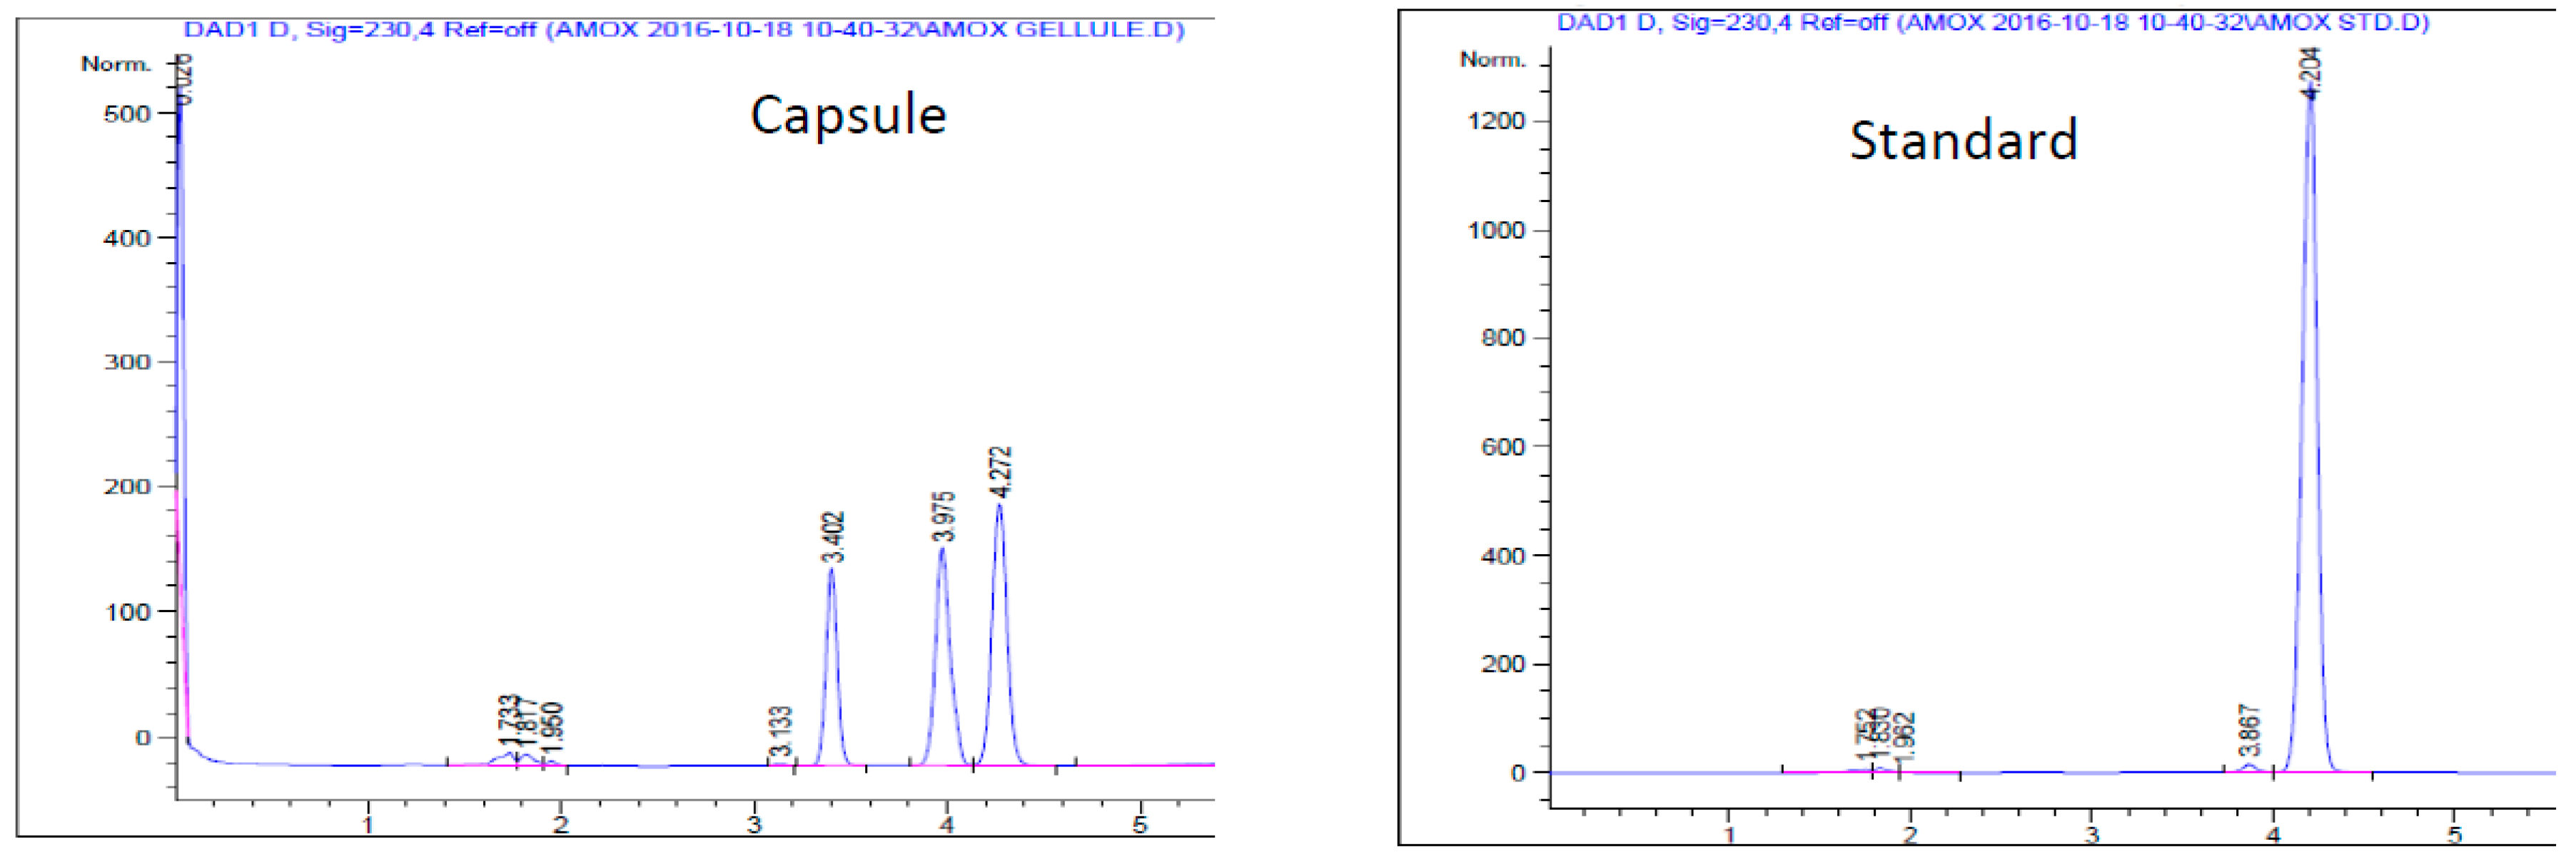
19]. In this study, the reference molecule is detected at 4.2 min and we find this same peak in the injection of the drug (
Figure 3). However, two other peaks at 3.4 and 3.9 min are also recorded. The analysis is repeated three times and changing the column to eliminate any further contamination. It is therefore clear that these peaks correspond to impurities present in the amoxicillin drug analyzed. This may involve the degradation of the principal molecule during the manufacturing process or storage [
20].
For mebendazole and metronidazole, a single main peak is recorded at 4.2 and 1.9 min respectively (
Figure 4 and
Figure 5). These two retention times correspond exactly to those obtained for the two standards. It appears that these two drugs contain only the active ingredients indicated on the label without detectable impurities. According to [
21], mebendazole is very stable even under stressful conditions (acid-base, heat, humidity and photolytic).
3.2. Quantitative Analysis
Quantitative analysis is carried out with a DU 800 spectrophotometer for ceftriaxone, ciprofloxacin, and gentamycin.
Calibration curves with the respective standards are established (graph S1-S3). The active ingredient contents in drugs are determined from the linear relationship obtained with USP standards.
The results of the content evaluation are summarized in
Table 3.
For the active ingredient ceftriaxone, all three antibiotics are in compliance with the USP pharmacopoeia, with values within the acceptability range of ±15% (
Table 3). Our calibration curve has a very good proportionality coefficient R
2 (0.98) for concentrations between 10 to 70 μg/ mL, very close to the value of [
22] which obtained R2 at 0.99 in the concentration range 0 to 48 μg/ mL.
On the other hand, for the ciprofloxacin content, the determined content is 1.52 mg which corresponds to a difference of -23.8%, beyond the acceptability interval of ±15%. This injection bottle is non-compliant (
Table 3). The instability of the injectable form and its high cost make the oral form more attractive, according to new assessments [
23].
Likewise, gentamycin where the determined content is higher than the label 43.45 and 30 mg respectively. The difference between these two contents is 30.95%, beyond the acceptability interval of 15%. This injection bottle is also non-compliant. Powdered injectables are more stable than those already constituted in a liquid [
24].
Exceeding the active dose is a major health problem worldwide, whether due to self-medication or faulty drug manufacture [
25]. Under dosing also has its drawbacks and is more frequent than overdosing [
26].
For the other active ingredients, the quantitative analysis was carried out with HPLC.
With the same protocol as the qualitative analysis, we established calibration curves of the amoxicillin (graph S4), mebendazole (graph S5), and metronidazole (graph S6) using USP standards.
For amoxicillin where in analysis mode we obtained three peaks, this affects its content. We obtained the amoxicillin content at 83.3 mg, far from the 500 mg indicated on the label (table 4). This determined value is even beyond the acceptability interval of ±15%.
For metronidazole, we obtained a slight overdose at 664.83±0.2 mg (
Table 4).
Finally, for mebendazole, the content of 99.91±0.8 mg is almost identical to the label of this medication indicating a dose of 100 mg per tablet.
In this study, we have set up two types of analysis: qualitative analysis identifies the components present in a drug sample and quantitative analysis determines the specific amounts or concentrations of those components. Both are crucial for ensuring the safety, efficacy, and quality of pharmaceutical products. These analyses are essential for products from countries that do not have strict control policies. The latter are very competitive in price and in this period of high inflation; they are very popular with Djiboutian patients.
4. Conclusion
In this present study, we evaluated the quality of the 8 antibiotics used in Djibouti.
Different analysis methods have been implemented such as thin-layer chromatography, spectrophotometry, and HPLC.
To our knowledge, this is the first study to evaluate the quality of medicines in Djibouti. We detect some defects (presence of impurities, under or overdose).
It is urgent to characterize the impurities and multiply the samples analyzed for efficient monitoring.
5. Annexes
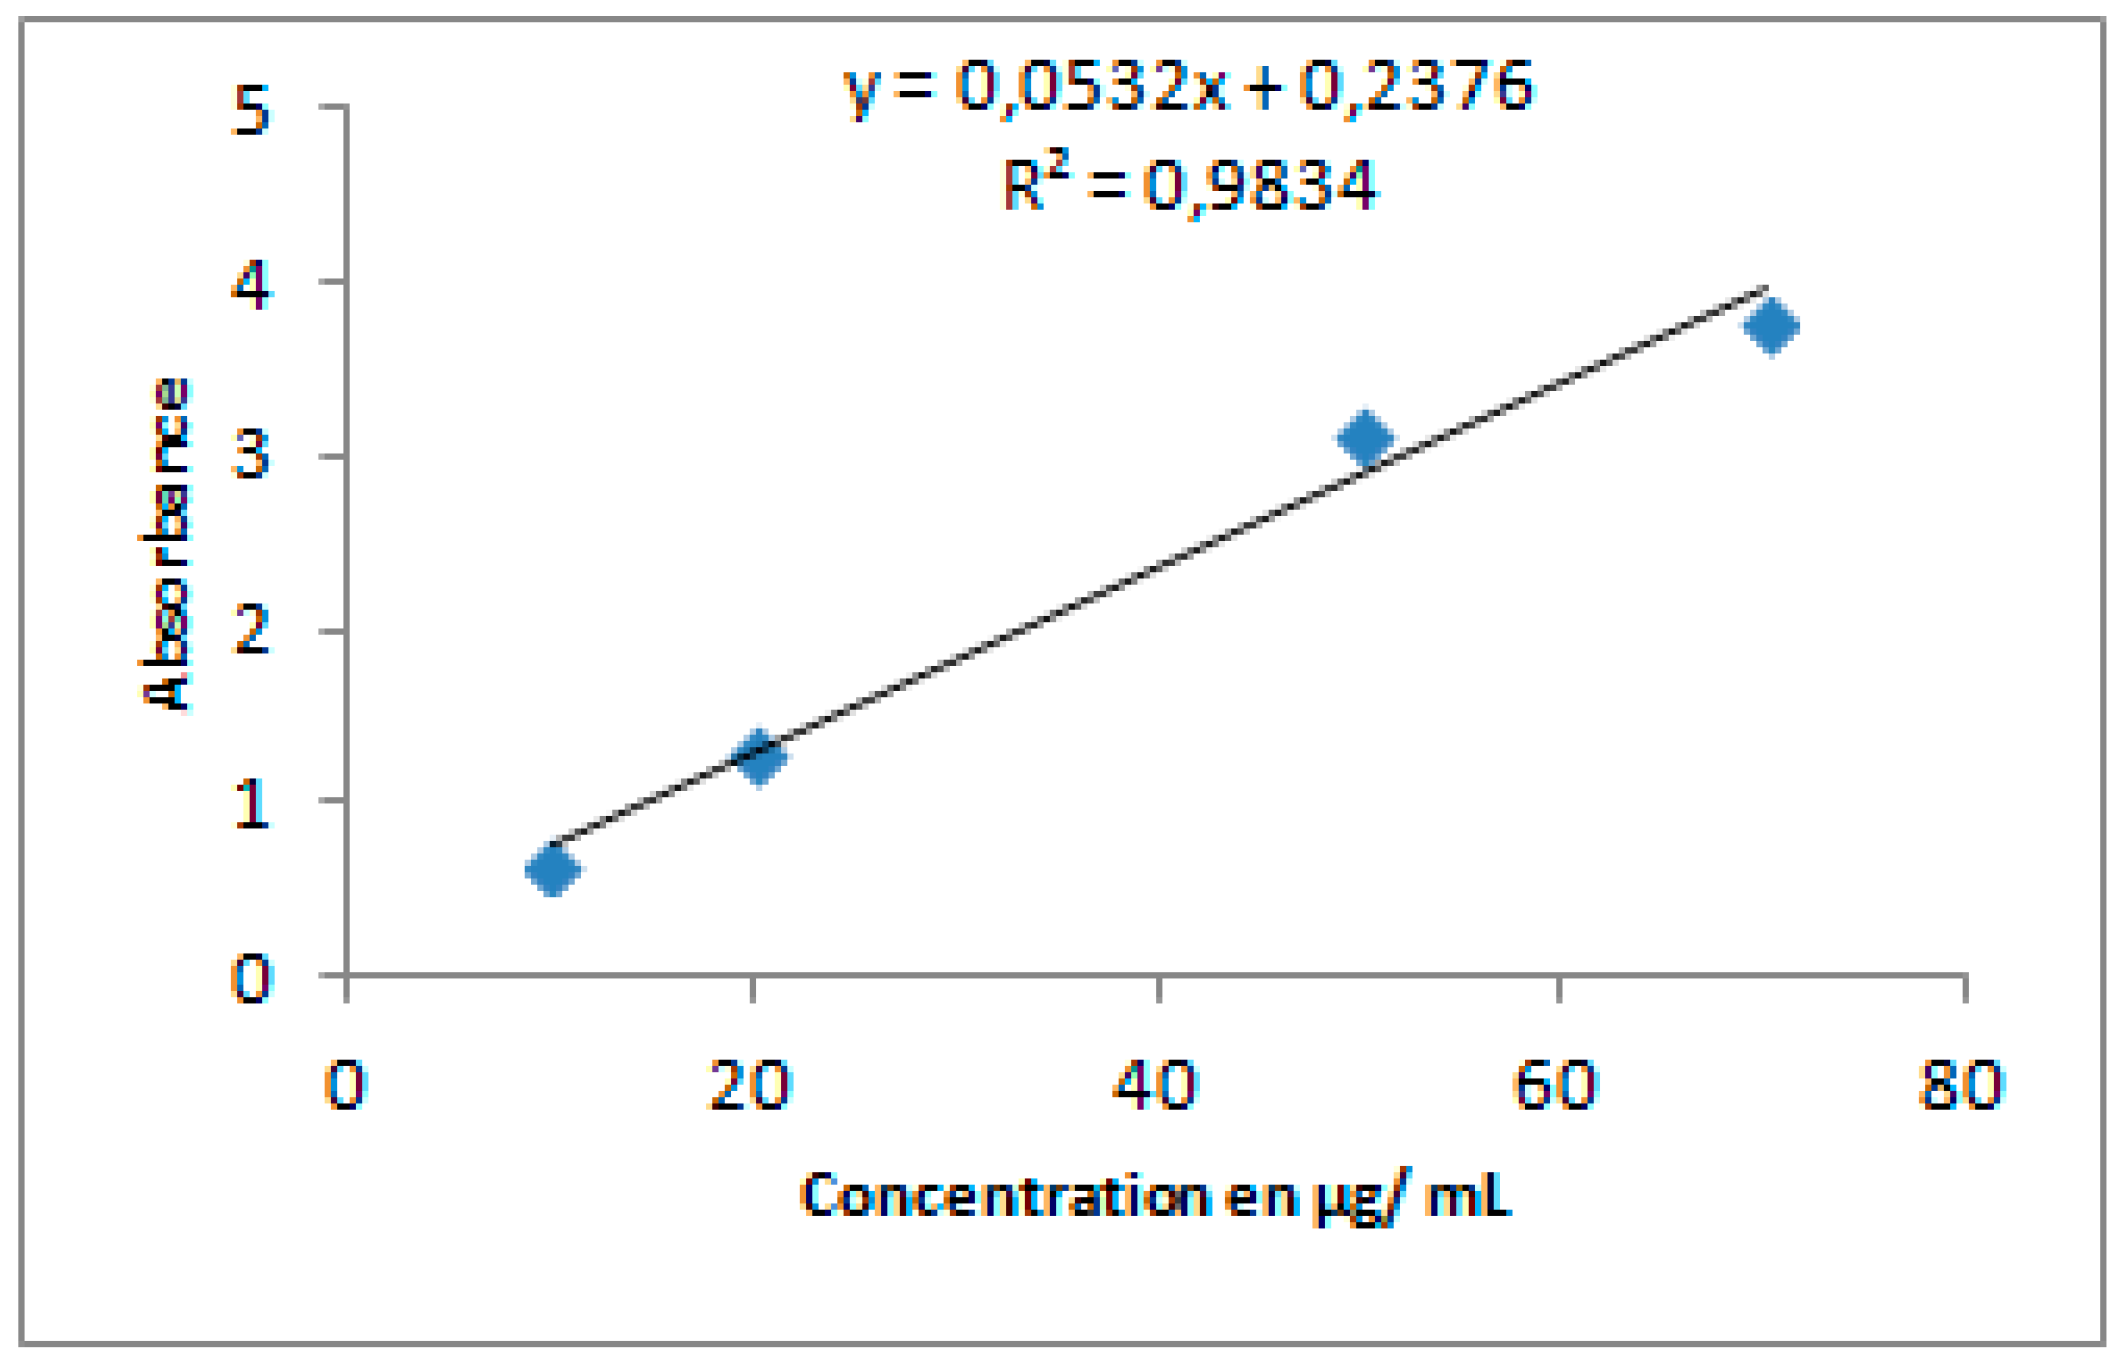
Graphe S1. Ceftriaxone calibration curve.
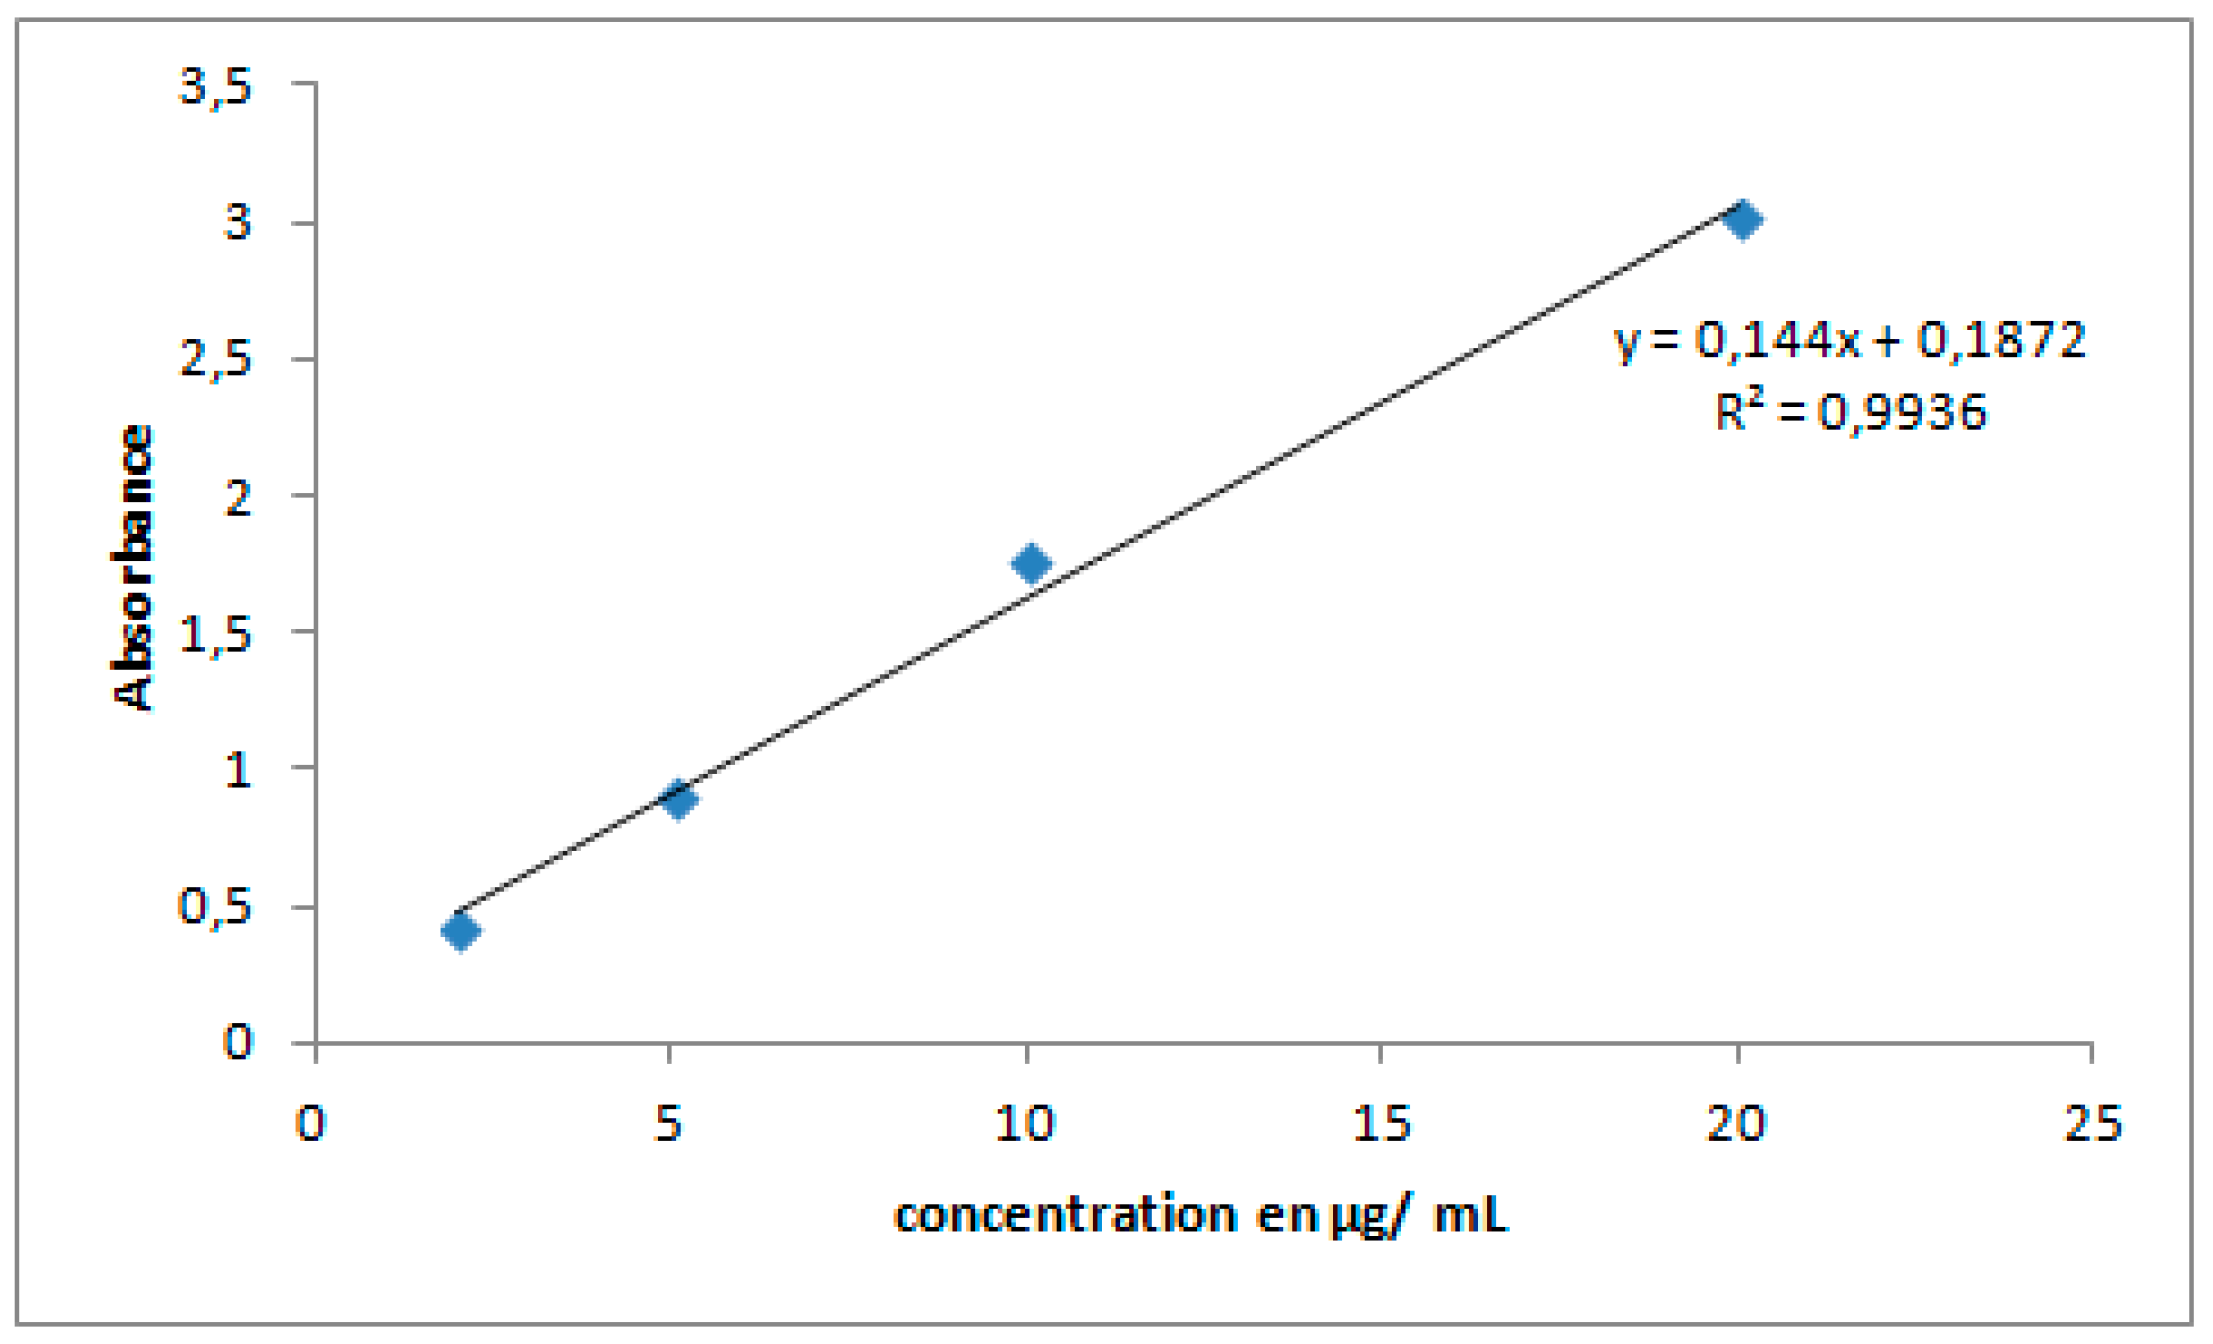
Graphe S2. Ciprofloxacin calibration curve.
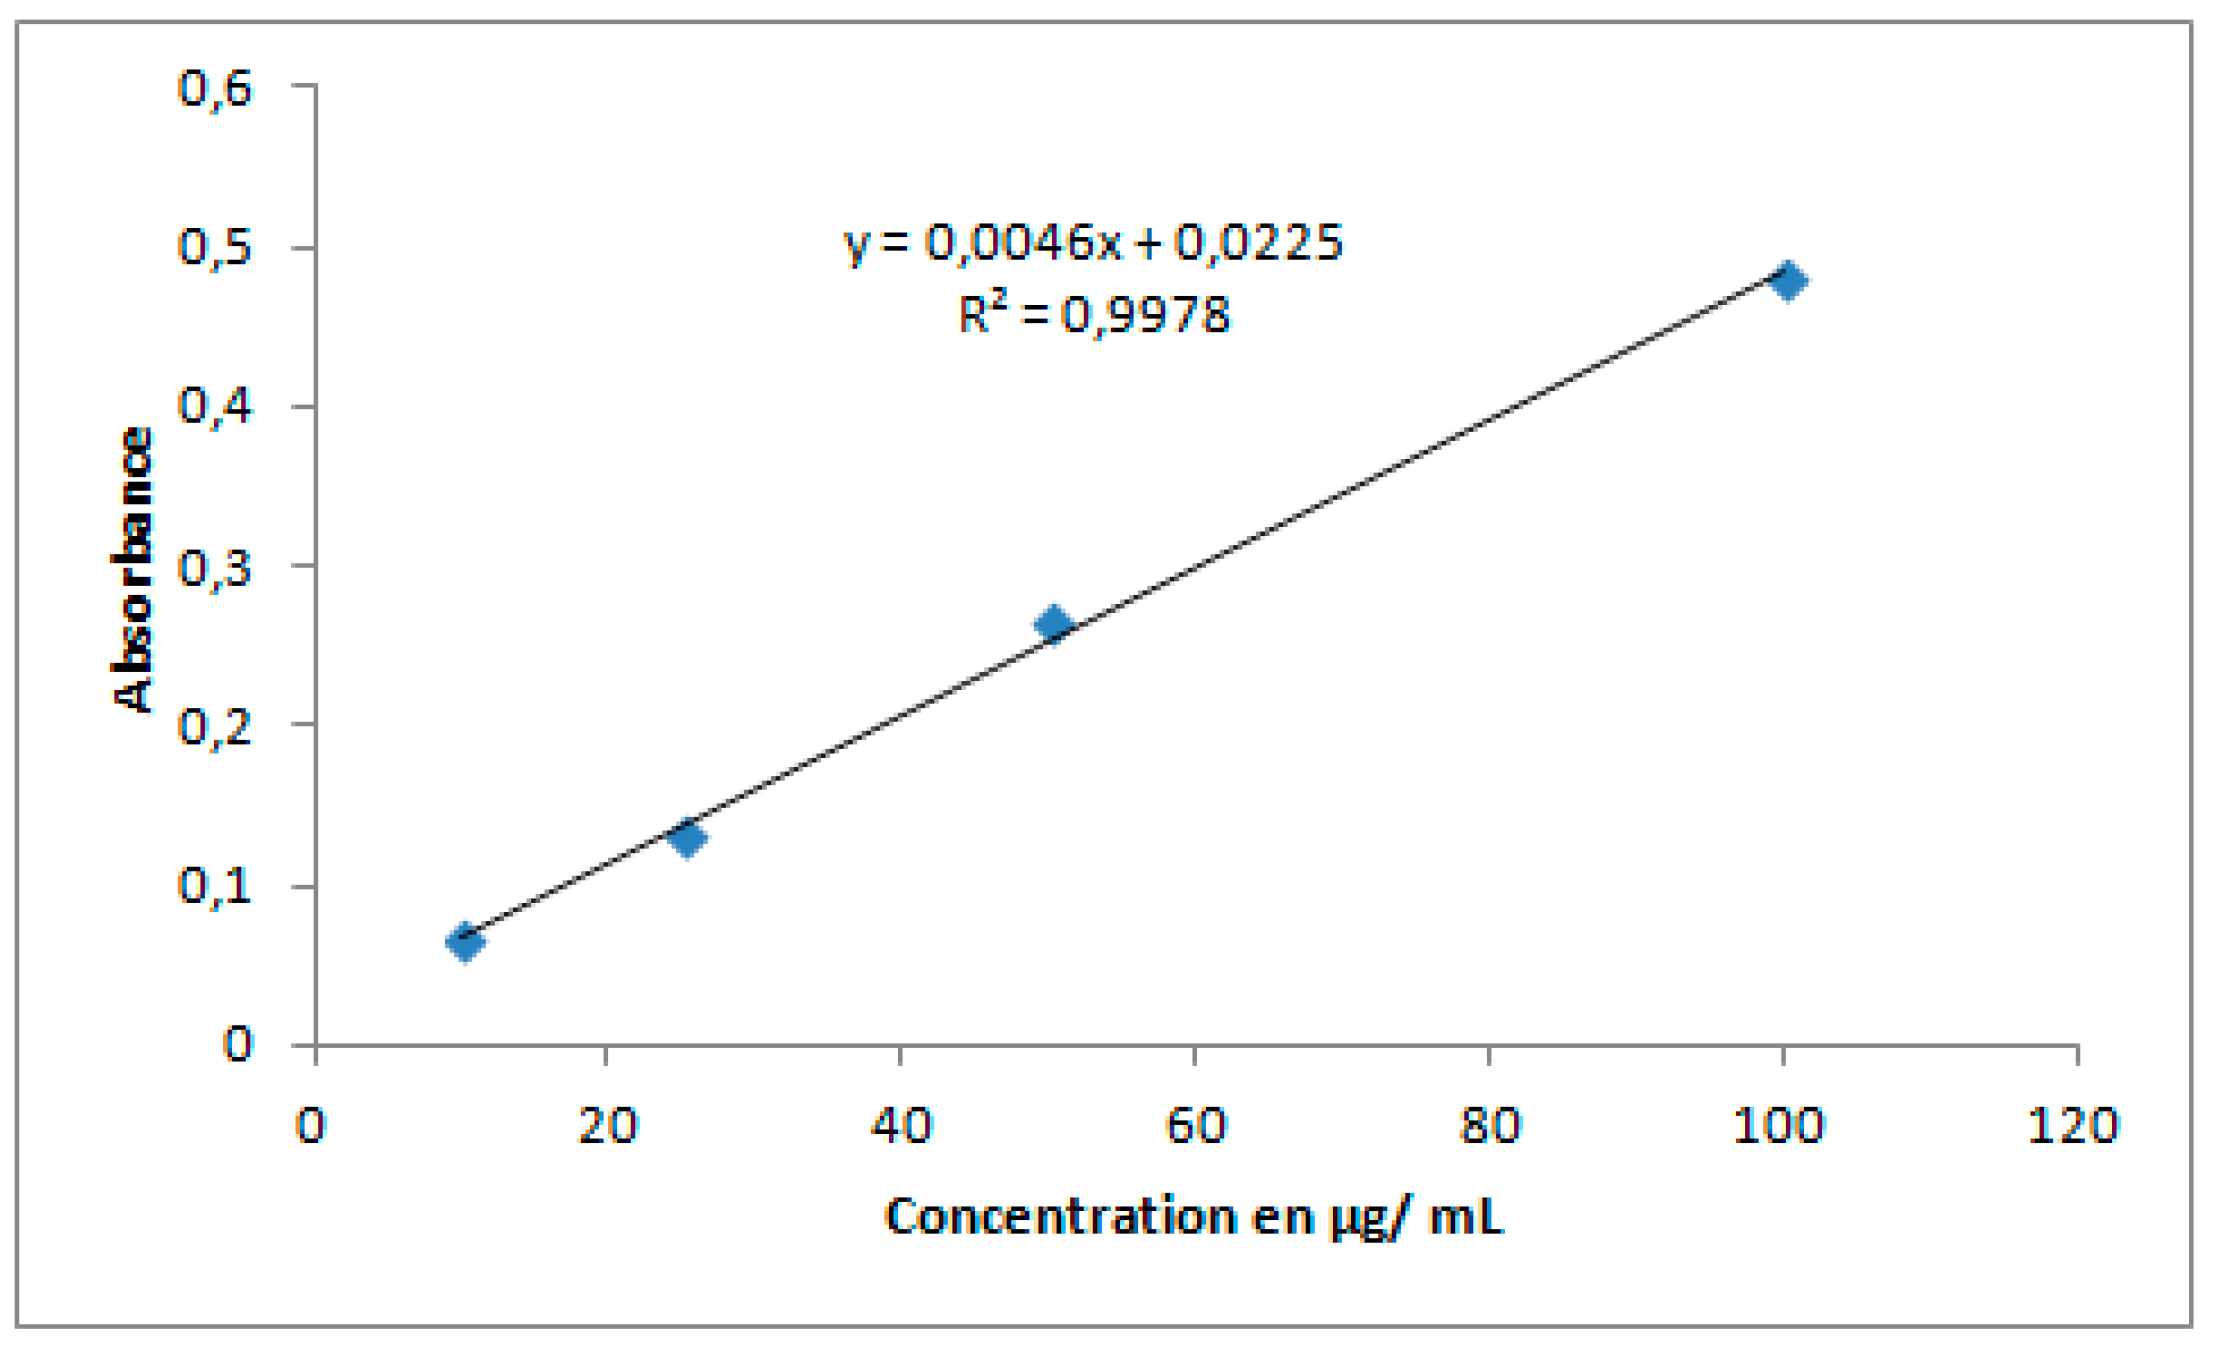
Graphe S3. Gentamicin calibration curve.
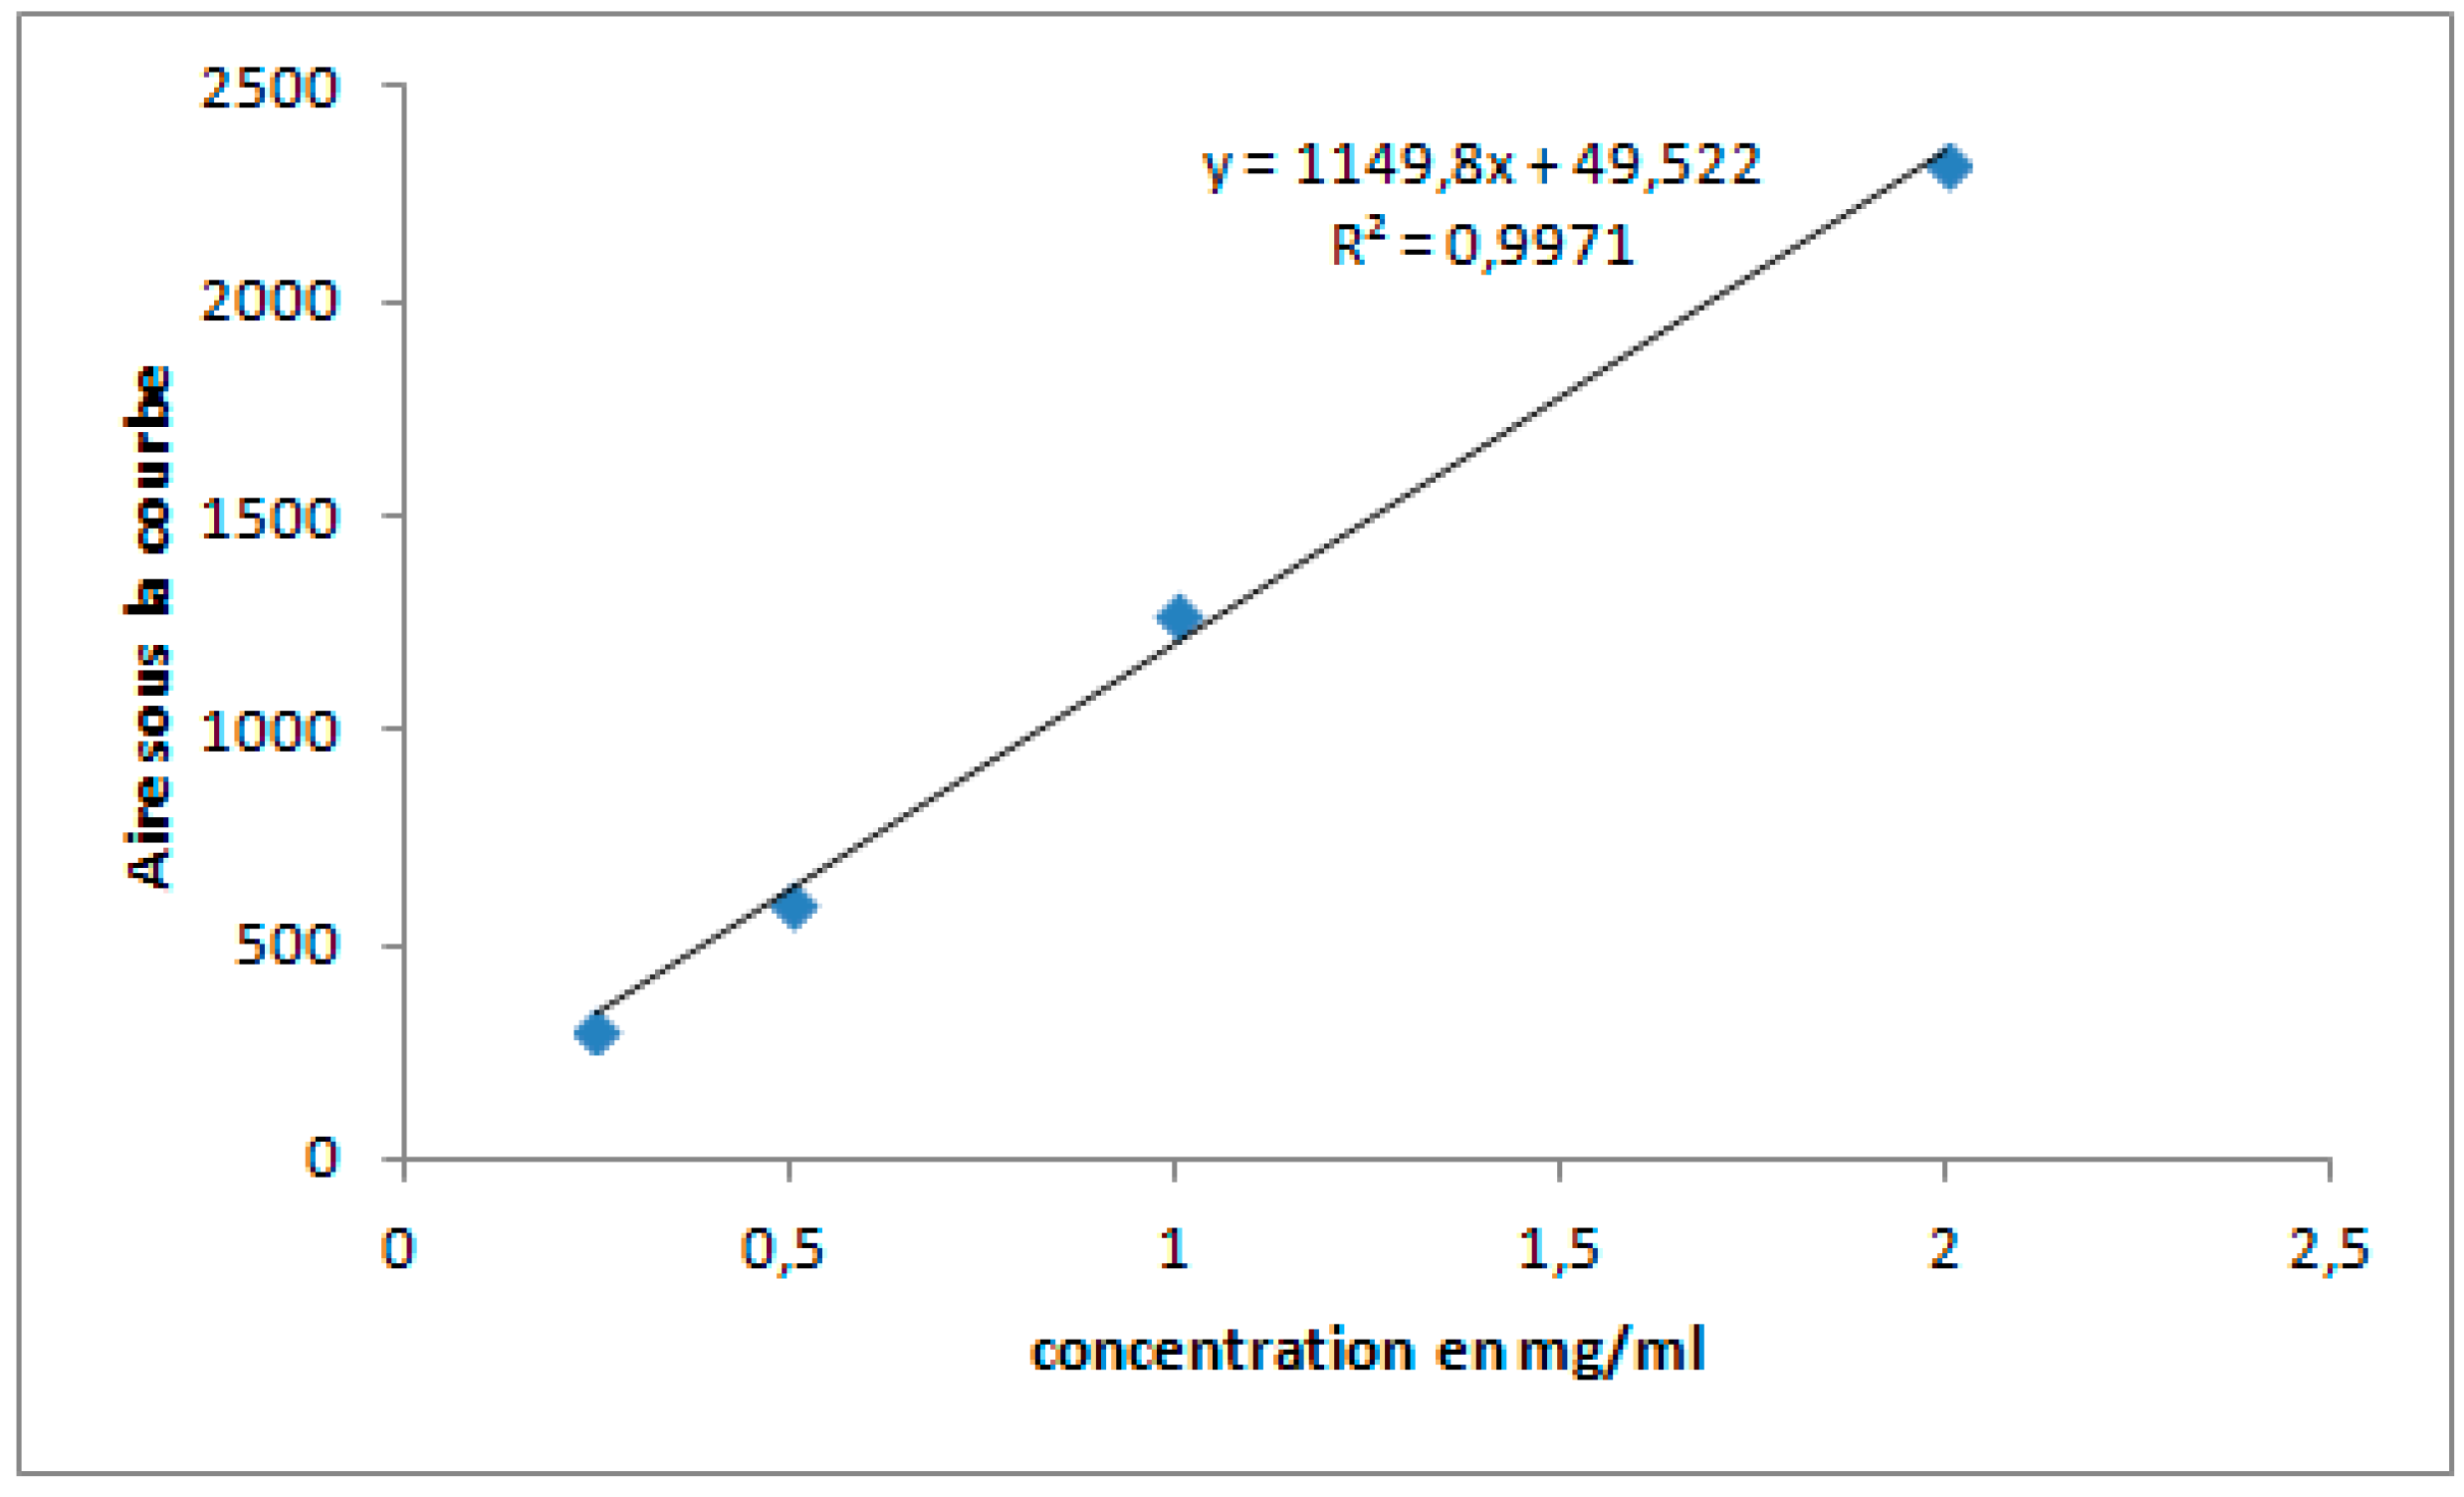
Graphe S4. Amoxicillin calibration curve.
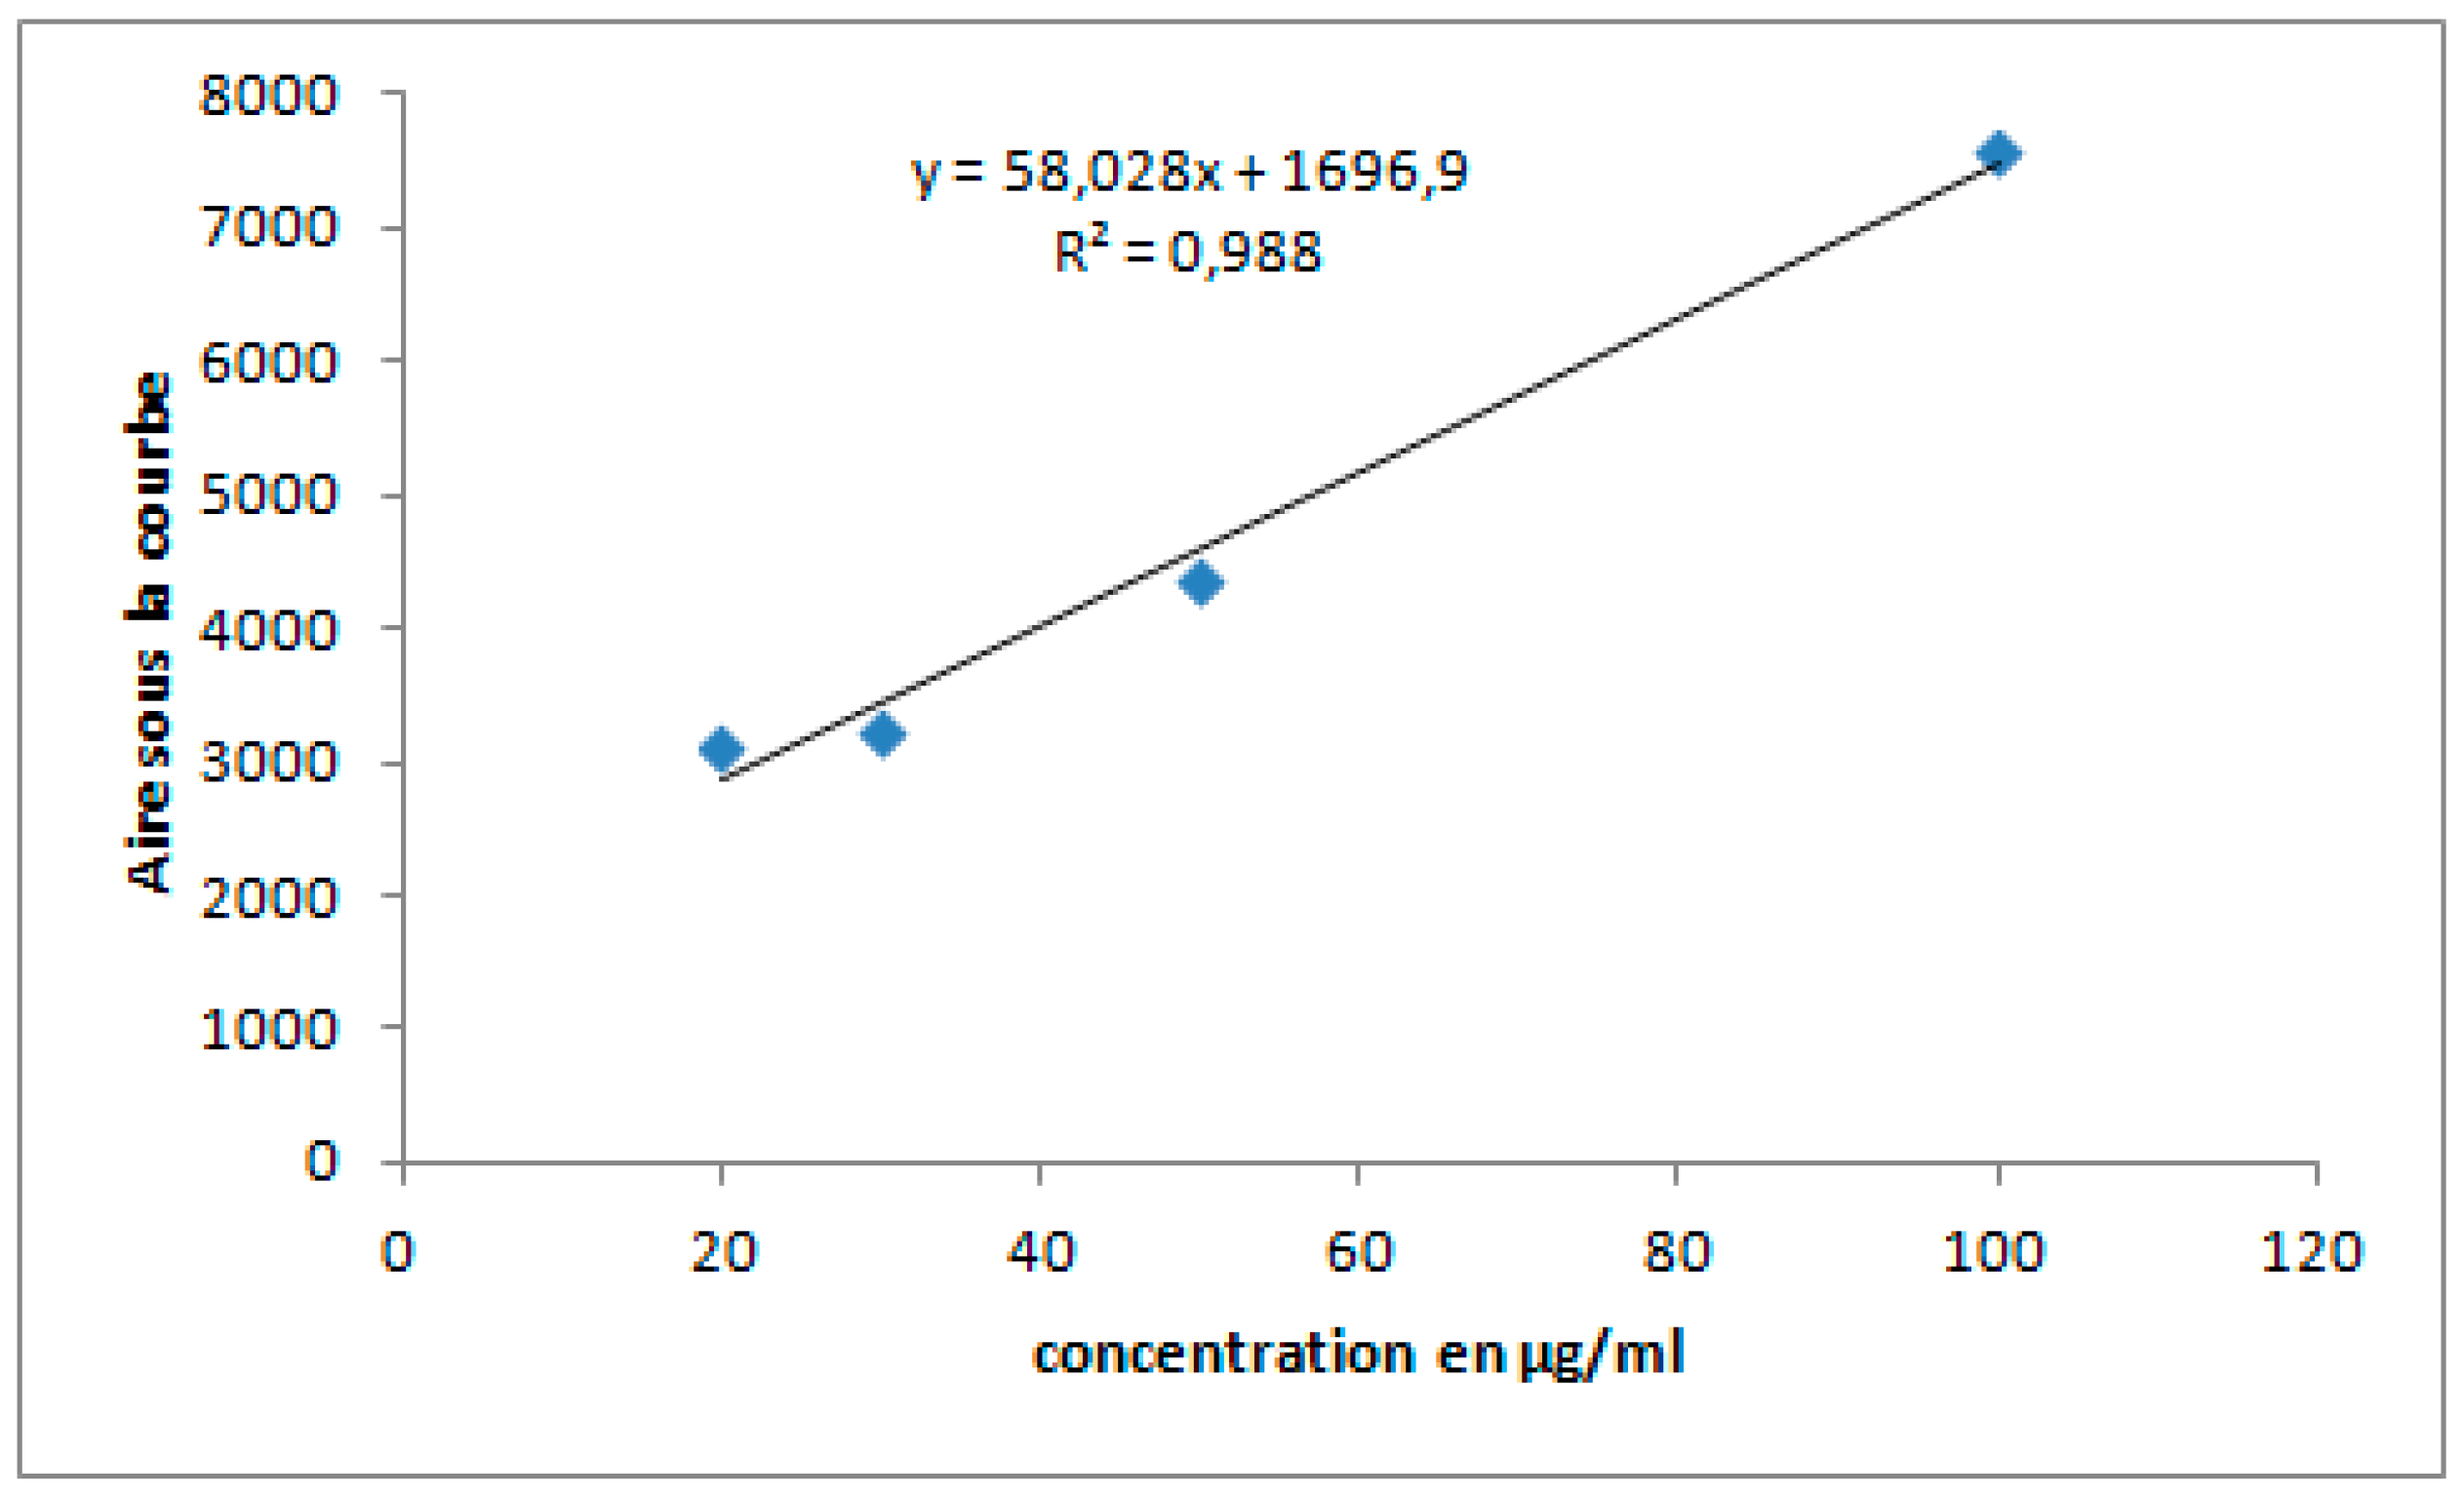
Graphe S5. Mebendazole calibration curve.
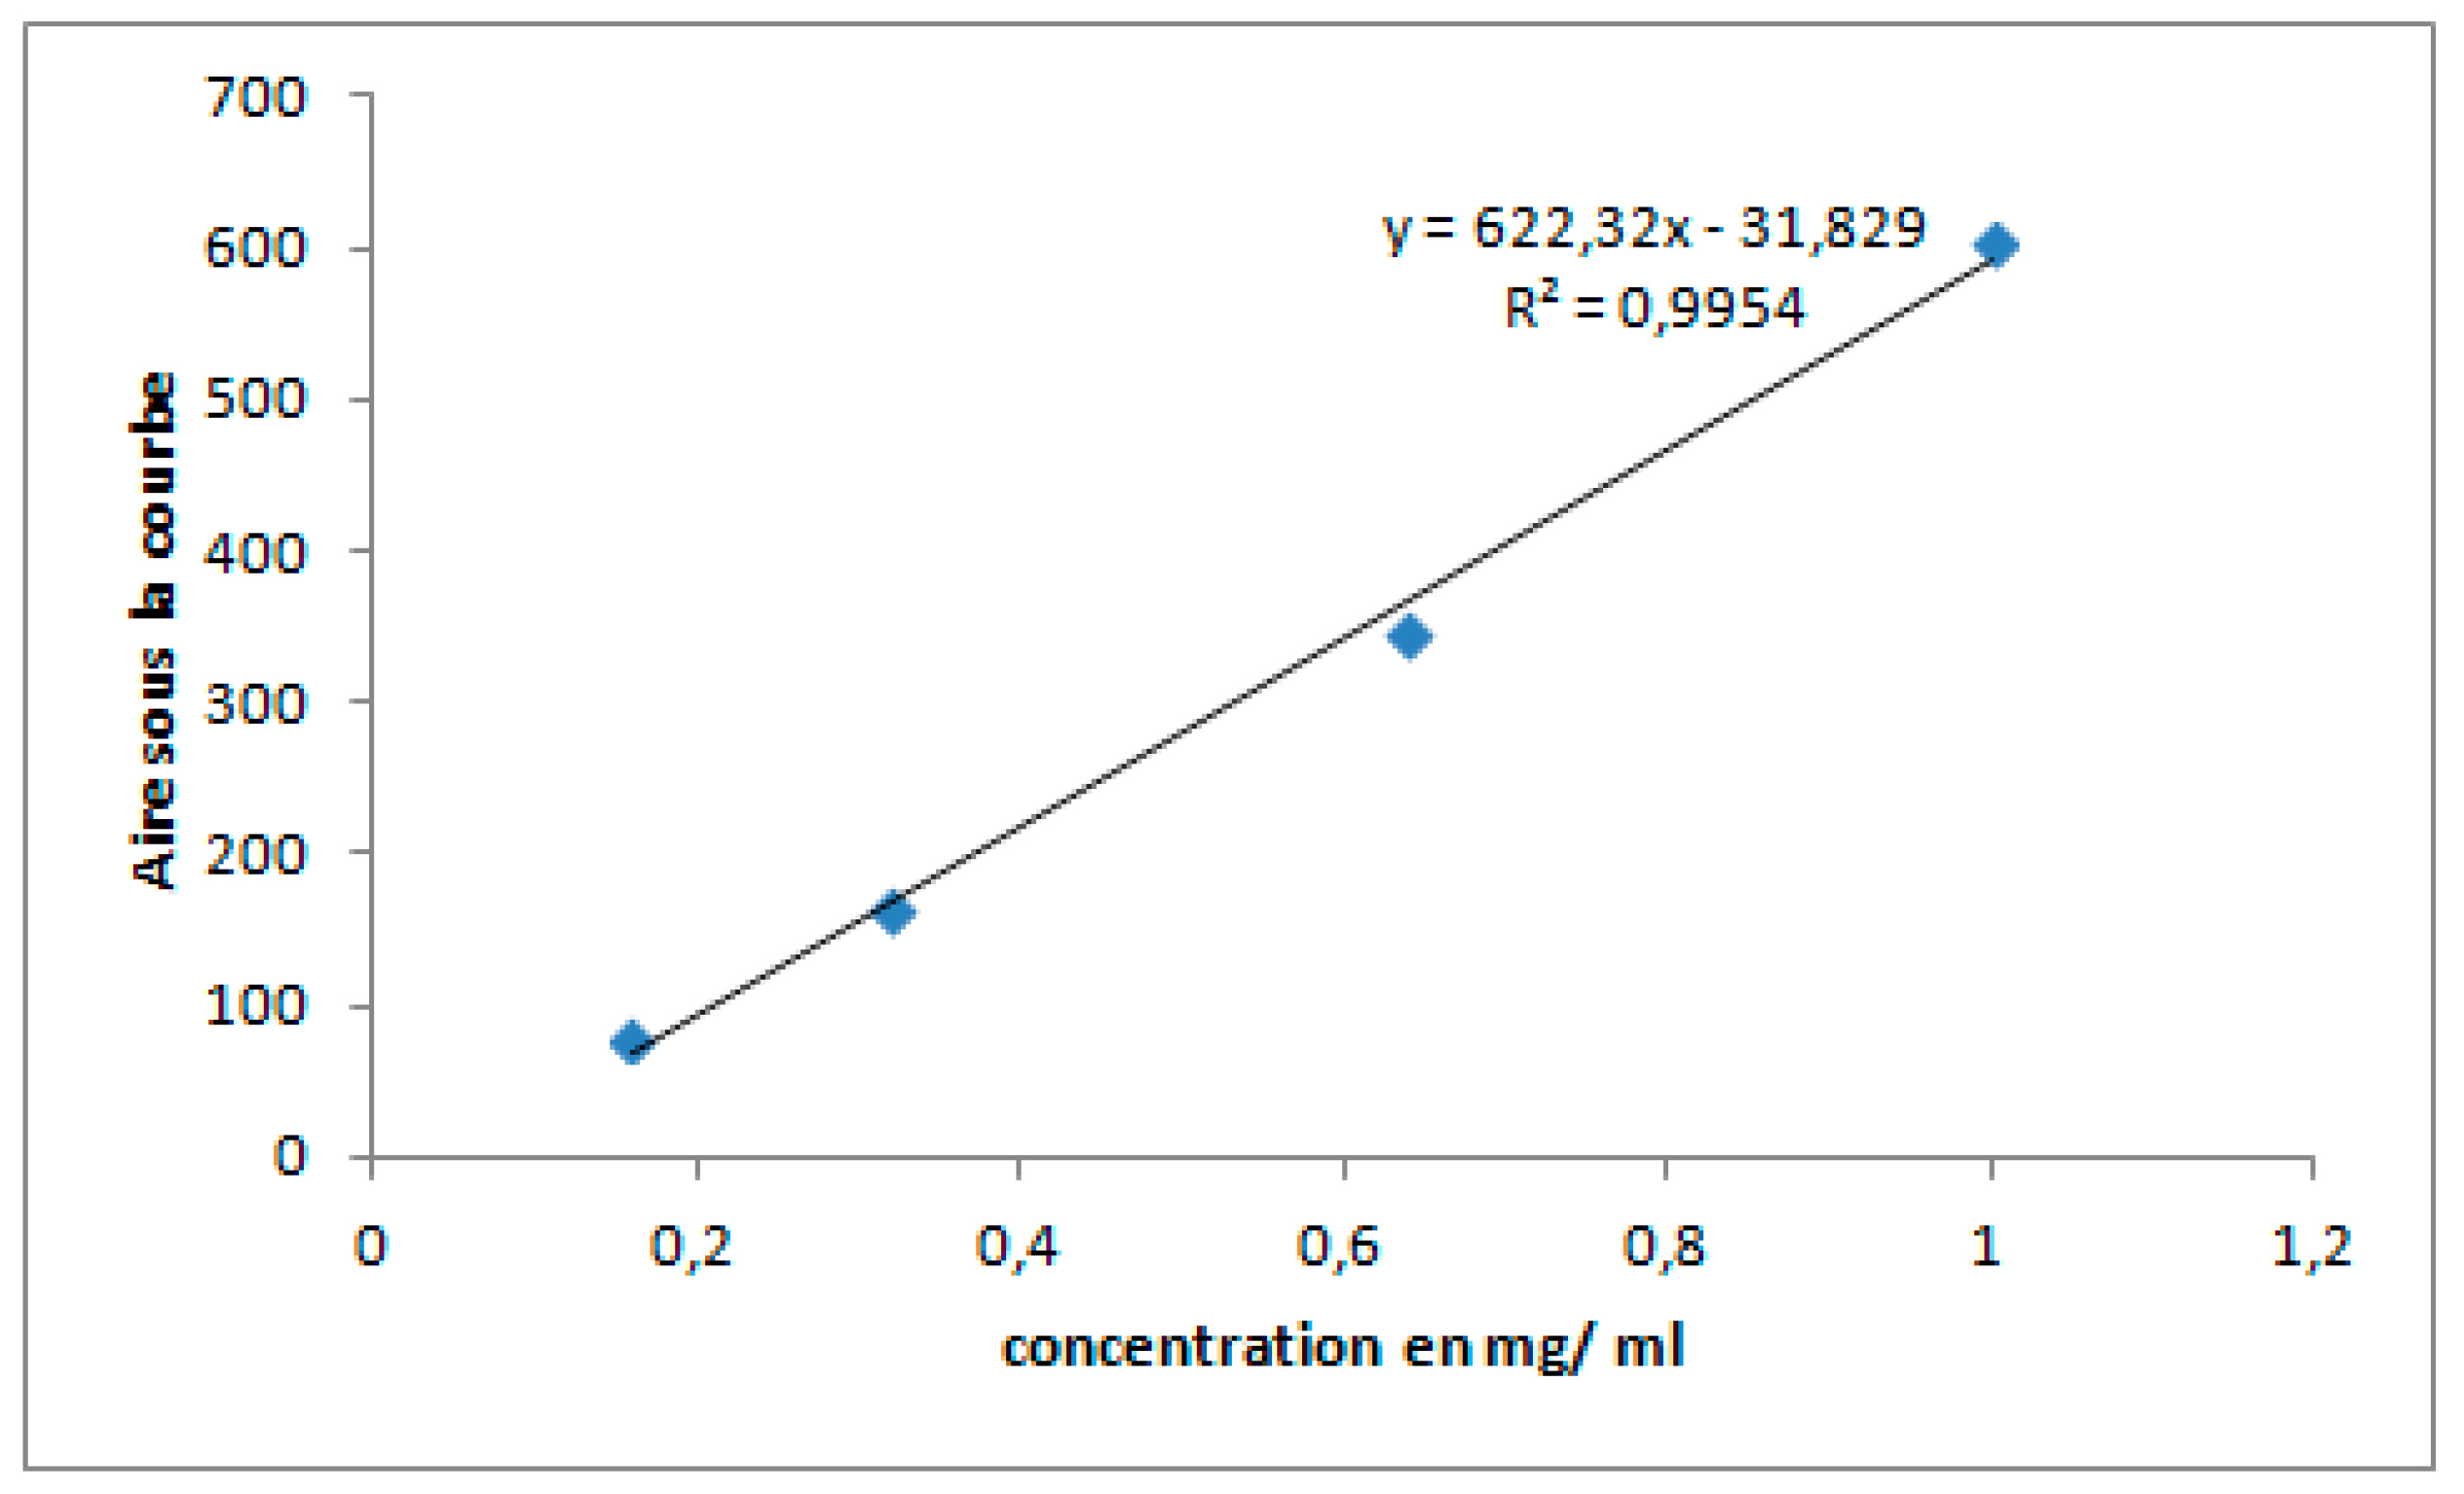
Graphe S6. Metronidazole calibration curve.
References
- Akay, C.; A Özkan, S.; Şentürk, Z.; Cevheroğlu. Simultaneous determination of metronidazole and miconazole in pharmaceutical dosage forms by RP-HPLC. Il Farm. 2002, 57, 953–957. [Google Scholar] [CrossRef]
- Brady, J.E.; Giglio, R.; Keyes, K.M.; DiMaggio, C.; Li, G. Risk markers for fatal and non-fatal prescription drug overdose: a meta-analysis. Inj. Epidemiology 2017, 4, 1–24. [Google Scholar] [CrossRef]
- Cazedey, E.C.L.; Salgado, H.R.N. Spectrophotometric Determination of Ciprofloxacin Hydrochloride in Ophthalmic Solution. Adv. Anal. Chem. 2012, 2, 74-79. [Google Scholar]
- Cree, B.A.C.; Reich, D.E.; Khan, O.; De Jager, P.L.; Nakashima, I.; Takahashi, T.; Bar-Or, A.; Tong, C.; Hauser, S.L.; Oksenberg, J.R. Modification of Multiple Sclerosis Phenotypes by African Ancestry at HLA. Arch. Neurol. 2009, 66, 226–233. [Google Scholar] [CrossRef] [PubMed]
- Da, L.; Somé, D.; Yehouenou, C.; Somé, C.; Zoungrana, J.; Ouédraogo, A.-S.; Lienhardt, C.; Poda, A. État des lieux de la résistance aux antibiotiques en Afrique subsaharienne. M�decine et Mal. Infect. Form. 2023, 2, 3–12. [Google Scholar] [CrossRef]
- Da, L.; Somé, D.; Yehouenou, C.; Somé, C.; Zoungrana, J.; Ouédraogo, A.-S.; Lienhardt, C.; Poda, A. État des lieux de la résistance aux antibiotiques en Afrique subsaharienne. M�decine et Mal. Infect. Form. 2023, 2, 3–12. [Google Scholar] [CrossRef]
- de Aléssio, P.V.; Kogawa, A.C.; Salgado, H.R.N. Quality of Ceftriaxone Sodium in Lyophilized Powder for Injection Evaluated by Clean, Fast, and Efficient Spectrophotometric Method. J. Anal. Methods Chem. 2017, 2017, 1–4. [Google Scholar] [CrossRef]
- DE Diego, M.; Godoy, G.; Mennickent, S. CHEMICAL STABILITY OF CEFTRIAXONE BY A VALIDATED STABILITY-INDICATING LIQUID CHROMATOGRAPHIC METHOD. J. Chil. Chem. Soc. 2010, 55, 335–337. [Google Scholar] [CrossRef]
- Kaur, S.P.; Rao, R.; Nanda, S.A.N.J.U. Amoxicillin: a broad spectrum antibiotic. Int. J. Pharm. Pharm. Sci. 2011, 3, 30-37. [Google Scholar]
- Krzek, J.; Hubicka, U.; Szczepańczyk, J. High-Performance Thin-Layer Chromatography with Densitometry for the Determination of Ciprofloxacin and Impurities in Drugs. J. AOAC Int. 2005, 88, 1530–1536. [Google Scholar] [CrossRef] [PubMed]
- de Marco, B.A.; Natori, J.S.H.; Fanelli, S.; Tótoli, E.G.; Salgado, H.R.N. Characteristics, Properties and Analytical Methods of Amoxicillin: A Review with Green Approach. Crit. Rev. Anal. Chem. 2017, 47, 267–277. [Google Scholar] [CrossRef] [PubMed]
- Nägele, E.; Moritz, R. Structure elucidation of degradation products of the antibiotic amoxicillin with ion trap MSn and accurate mass determination by ESI TOF. J. Am. Soc. Mass Spectrom. 2005, 16, 1670–1676. [Google Scholar] [CrossRef] [PubMed]
- Naveed, S.; Waheed, N.; Nazeer, S.; Qamar, F. Degradation study of gentamicin by UV spectroscopy. Am. J. Chem. Appl. 2014, 1, 36-39. [Google Scholar]
- OMS. 2014. Premier rapport de l’OMS sur la résistance aux antibiotiques: une menace grave d’ampleur mondiale. https://www.who.int/fr/news/item/30-04-2014-who-s-first-global-report-on-antibiotic-resistance-reveals-serious-worldwide-threat-to-public-health.
- Parakh, Durgesh Rameshlal. 2016. RP-HPLC method development and validation for Quantification of Mebendazole in API and Pharmaceutical Formulations. In Conference on Harmonization (ICH) guidelines, 2:15. https://www.academia.edu/download/47839424/Vol._4__Issue_5__May_2016__PharmaTutor__Paper-6_1_.pdf.
- Phattanawasin, P.; Sotanaphun, U.; Sriphong, L.; Kanchanaphibool, I. Stability-indicating TLC-image analysis method for quantification of Ceftriaxone sodium in pharmaceutical dosage forms. JPC – J. Planar Chromatogr. – Mod. TLC 2011, 24, 30–34. [Google Scholar] [CrossRef]
- Pinak, patel, VIDISHA VIDISHA, et chauhan gautam. 2014. development and validation of high performance thin layer chromatographic method for simultaneous estimation of ceftriaxone sodium and tazobactam sodium in their combined pharmaceutical formulation. International Journal of Pharmacy and Pharmaceutical Sciences, 623-29.
- Pereira, L.M.P.; Phillips, M.; Ramlal, H.; Teemul, K.; Prabhakar, P. Third generation cephalosporin use in a tertiary hospital in Port of Spain, Trinidad: need for an antibiotic policy. BMC Infect. Dis. 2004, 4, 59. [Google Scholar] [CrossRef]
- Schnurrer, J.; Stichtenoth, D.; Frölich, J. Knowledge on drug dosages of ward physicians. Eur. J. Clin. Pharmacol. 2002, 58, 65–67. [Google Scholar] [CrossRef] [PubMed]
- Serrano-Castañeda, P.; Pérez-Gutiérrez, D.A.; Castillo-Carmona, L.F.; Anguiano-Almazán, E.; Escobar-Chávez, J.J. Development of a Spectrophotometric Analytical Method to Quantify Ceftriaxone Content in Polymeric Microneedles. Pharm. Chem. J. 2023, 57, 1–5. [Google Scholar] [CrossRef]
- Sherma, J.; Rabel, F. Advances in the thin layer chromatographic analysis of counterfeit pharmaceutical products: 2008–2019. J. Liq. Chromatogr. Relat. Technol. 2019, 42, 367–379. [Google Scholar] [CrossRef]
- Singh, B.K.; Parwate, D.V.; Srivastava, S.; Shukla, S.K. High performance thin-layer chromatographic selective and stability indicating method for assay of ciprofloxacin in pharmaceuticals. Der Pharma Chemica 2010, 2, 178-88. [Google Scholar]
- Tharagesh, K. Stability Indicating RP-HPLC Method Development and Validation for Estimation of Mebendazole in Tablet Dosage Form. Masters, C. L. Baid Metha College of Pharmacy, Chennai. 2021. http://repository-tnmgrmu.ac.in/20943/.
- USP/NF. 2018. Advanced USP methods: Amoxicillin Tablets. 2018. https://www.uspnf.com/pharmacopeial-forum.
- Vance-Bryan, K.; Guay, D.R.P.; Rotschafer, J.C. Clinical Pharmacokinetics of Ciprofloxacin. Clin. Pharmacokinet. 1990, 19, 434–461. [Google Scholar] [CrossRef] [PubMed]
- Wada, Mitsuhiro, Suleiman Alkhalil, et Kenichiro Nakashima. 2008. Current HPLC Methods for Determination of Medicaments in Formulations and Biological Samples. Jordan Journal of Pharmaceutical Sciences 1 (1). https://archives.ju.edu.jo/index.php/jjps/article/view/1076.
|
Disclaimer/Publisher’s Note: The statements, opinions and data contained in all publications are solely those of the individual author(s) and contributor(s) and not of MDPI and/or the editor(s). MDPI and/or the editor(s) disclaim responsibility for any injury to people or property resulting from any ideas, methods, instructions or products referred to in the content. |
© 2023 by the authors. Licensee MDPI, Basel, Switzerland. This article is an open access article distributed under the terms and conditions of the Creative Commons Attribution (CC BY) license (http://creativecommons.org/licenses/by/4.0/).
