Submitted:
14 November 2023
Posted:
15 November 2023
You are already at the latest version
Abstract
Keywords:
1. Introduction
2. Materials and Methods
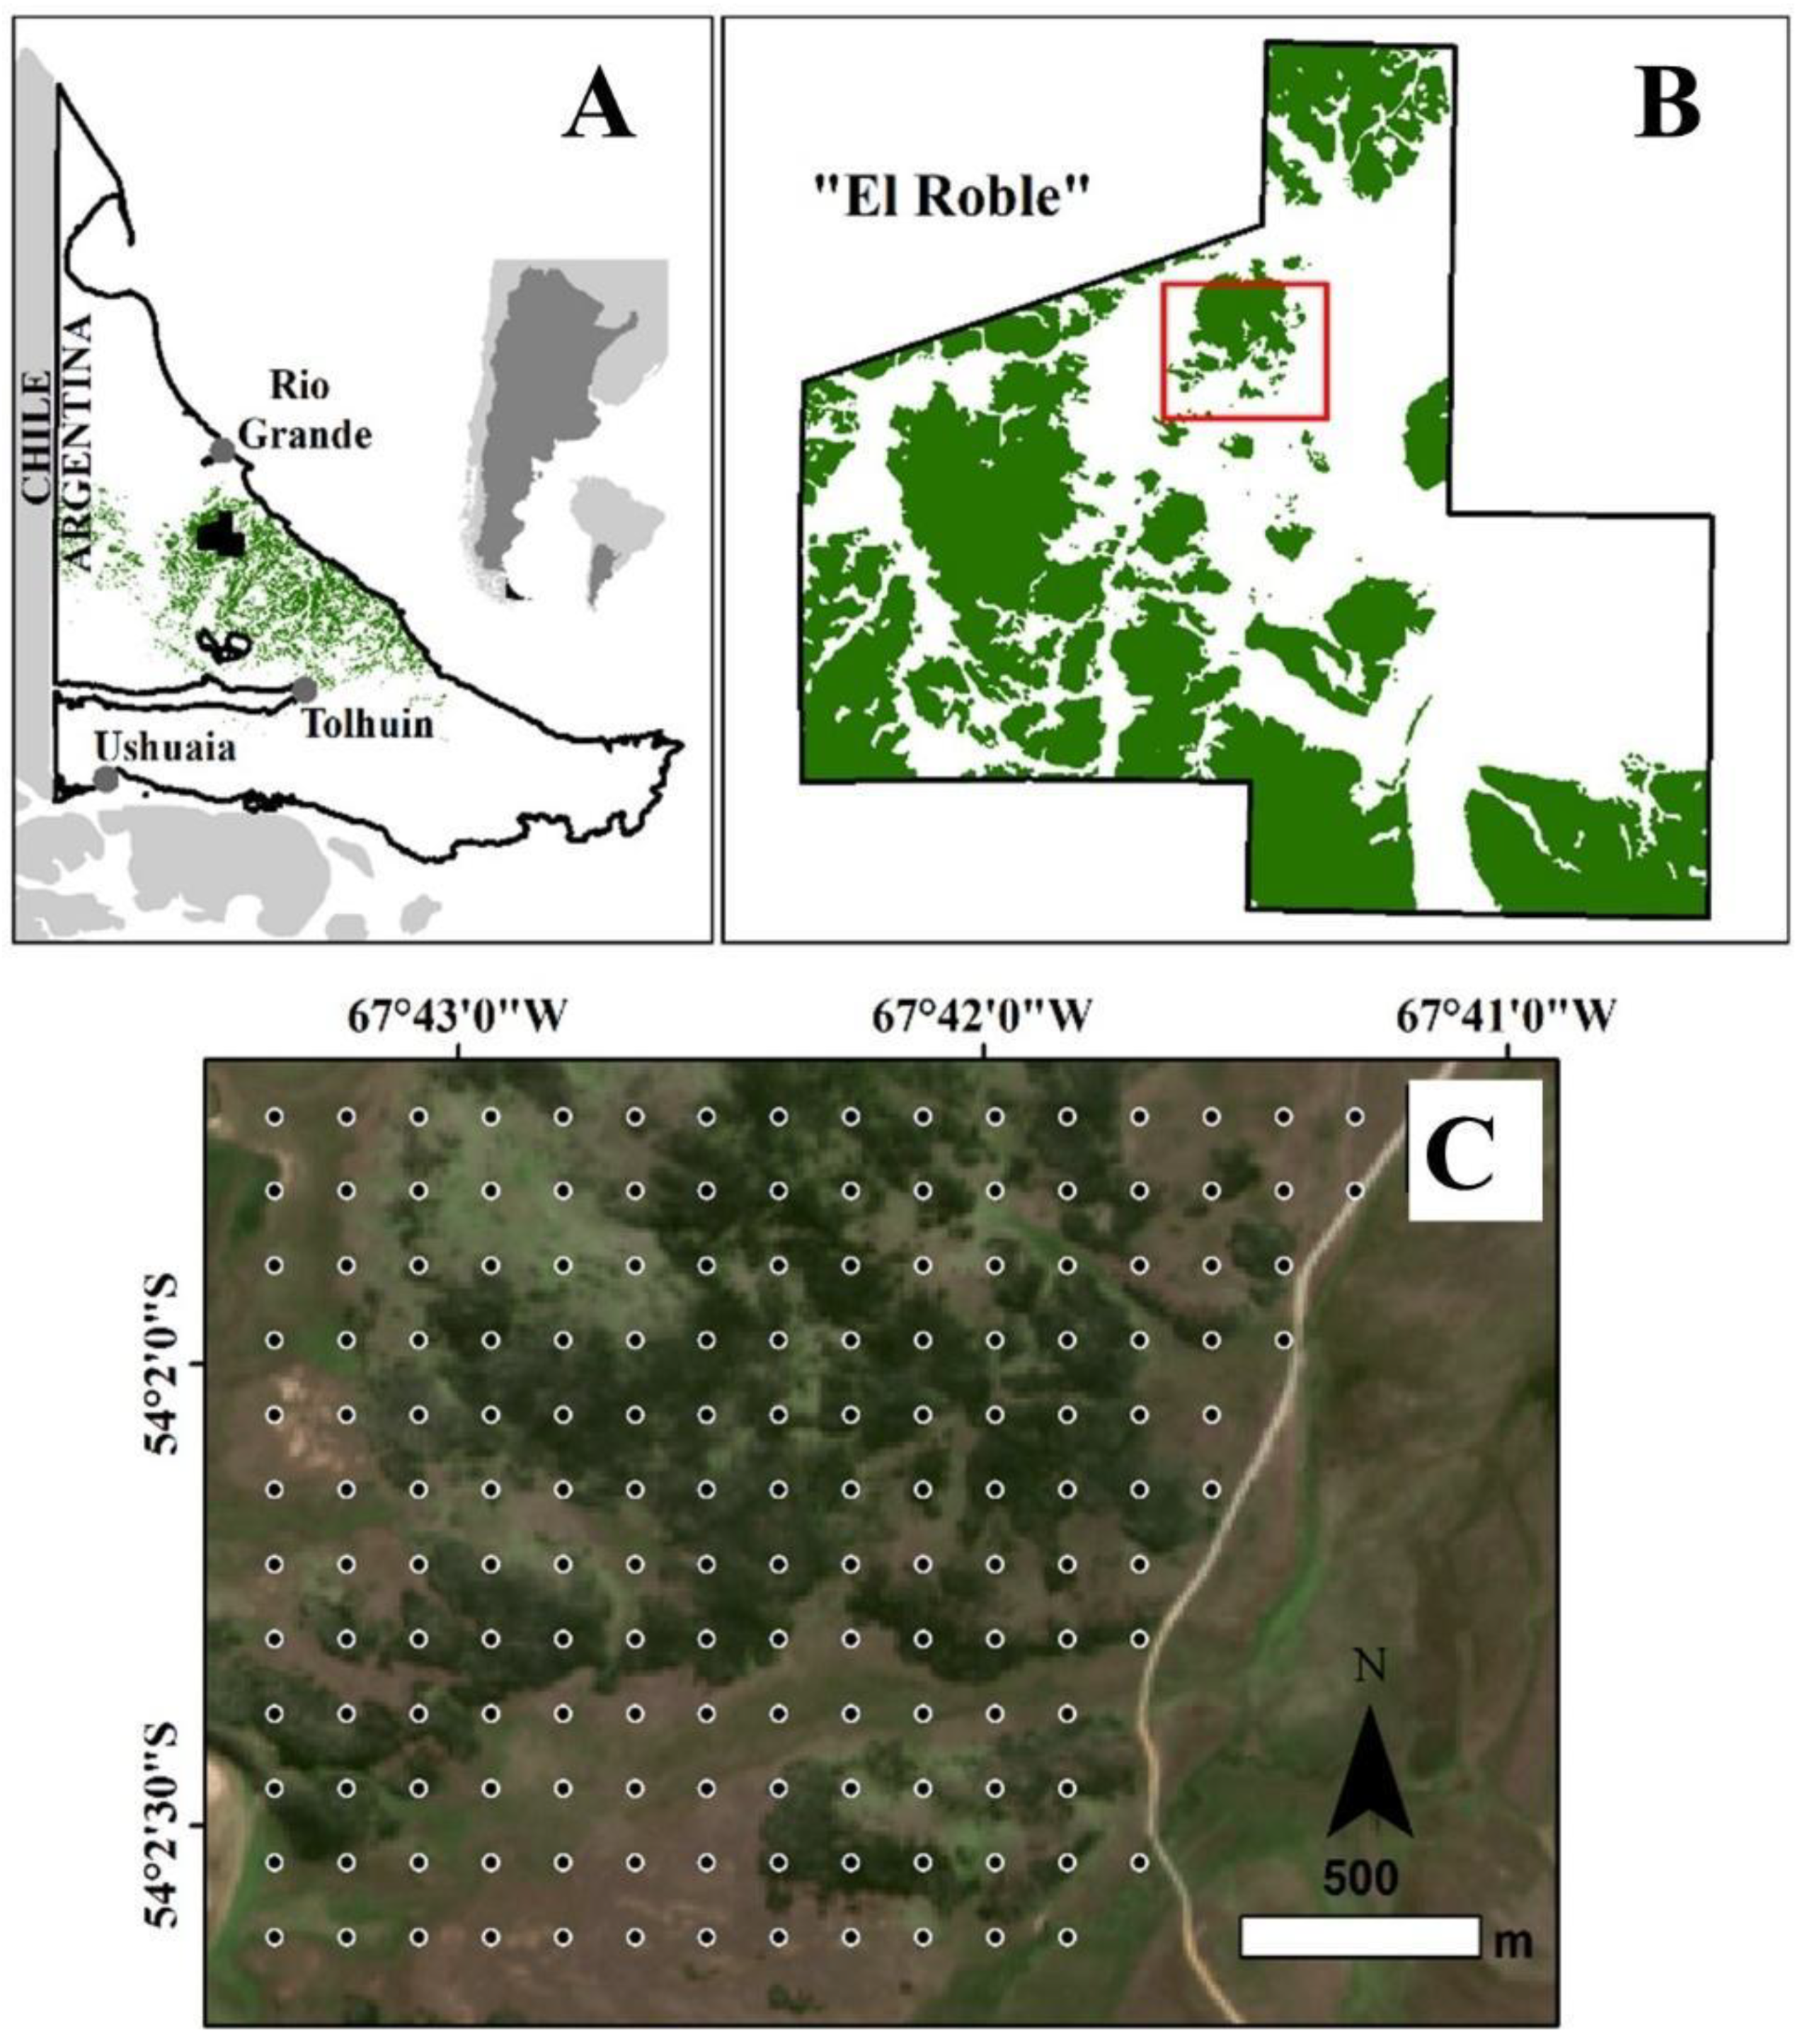
2.1. Study Area
2.2. Sampling Design, Data Taking and Calculations
2.3. Statistical Analyses
3. Results
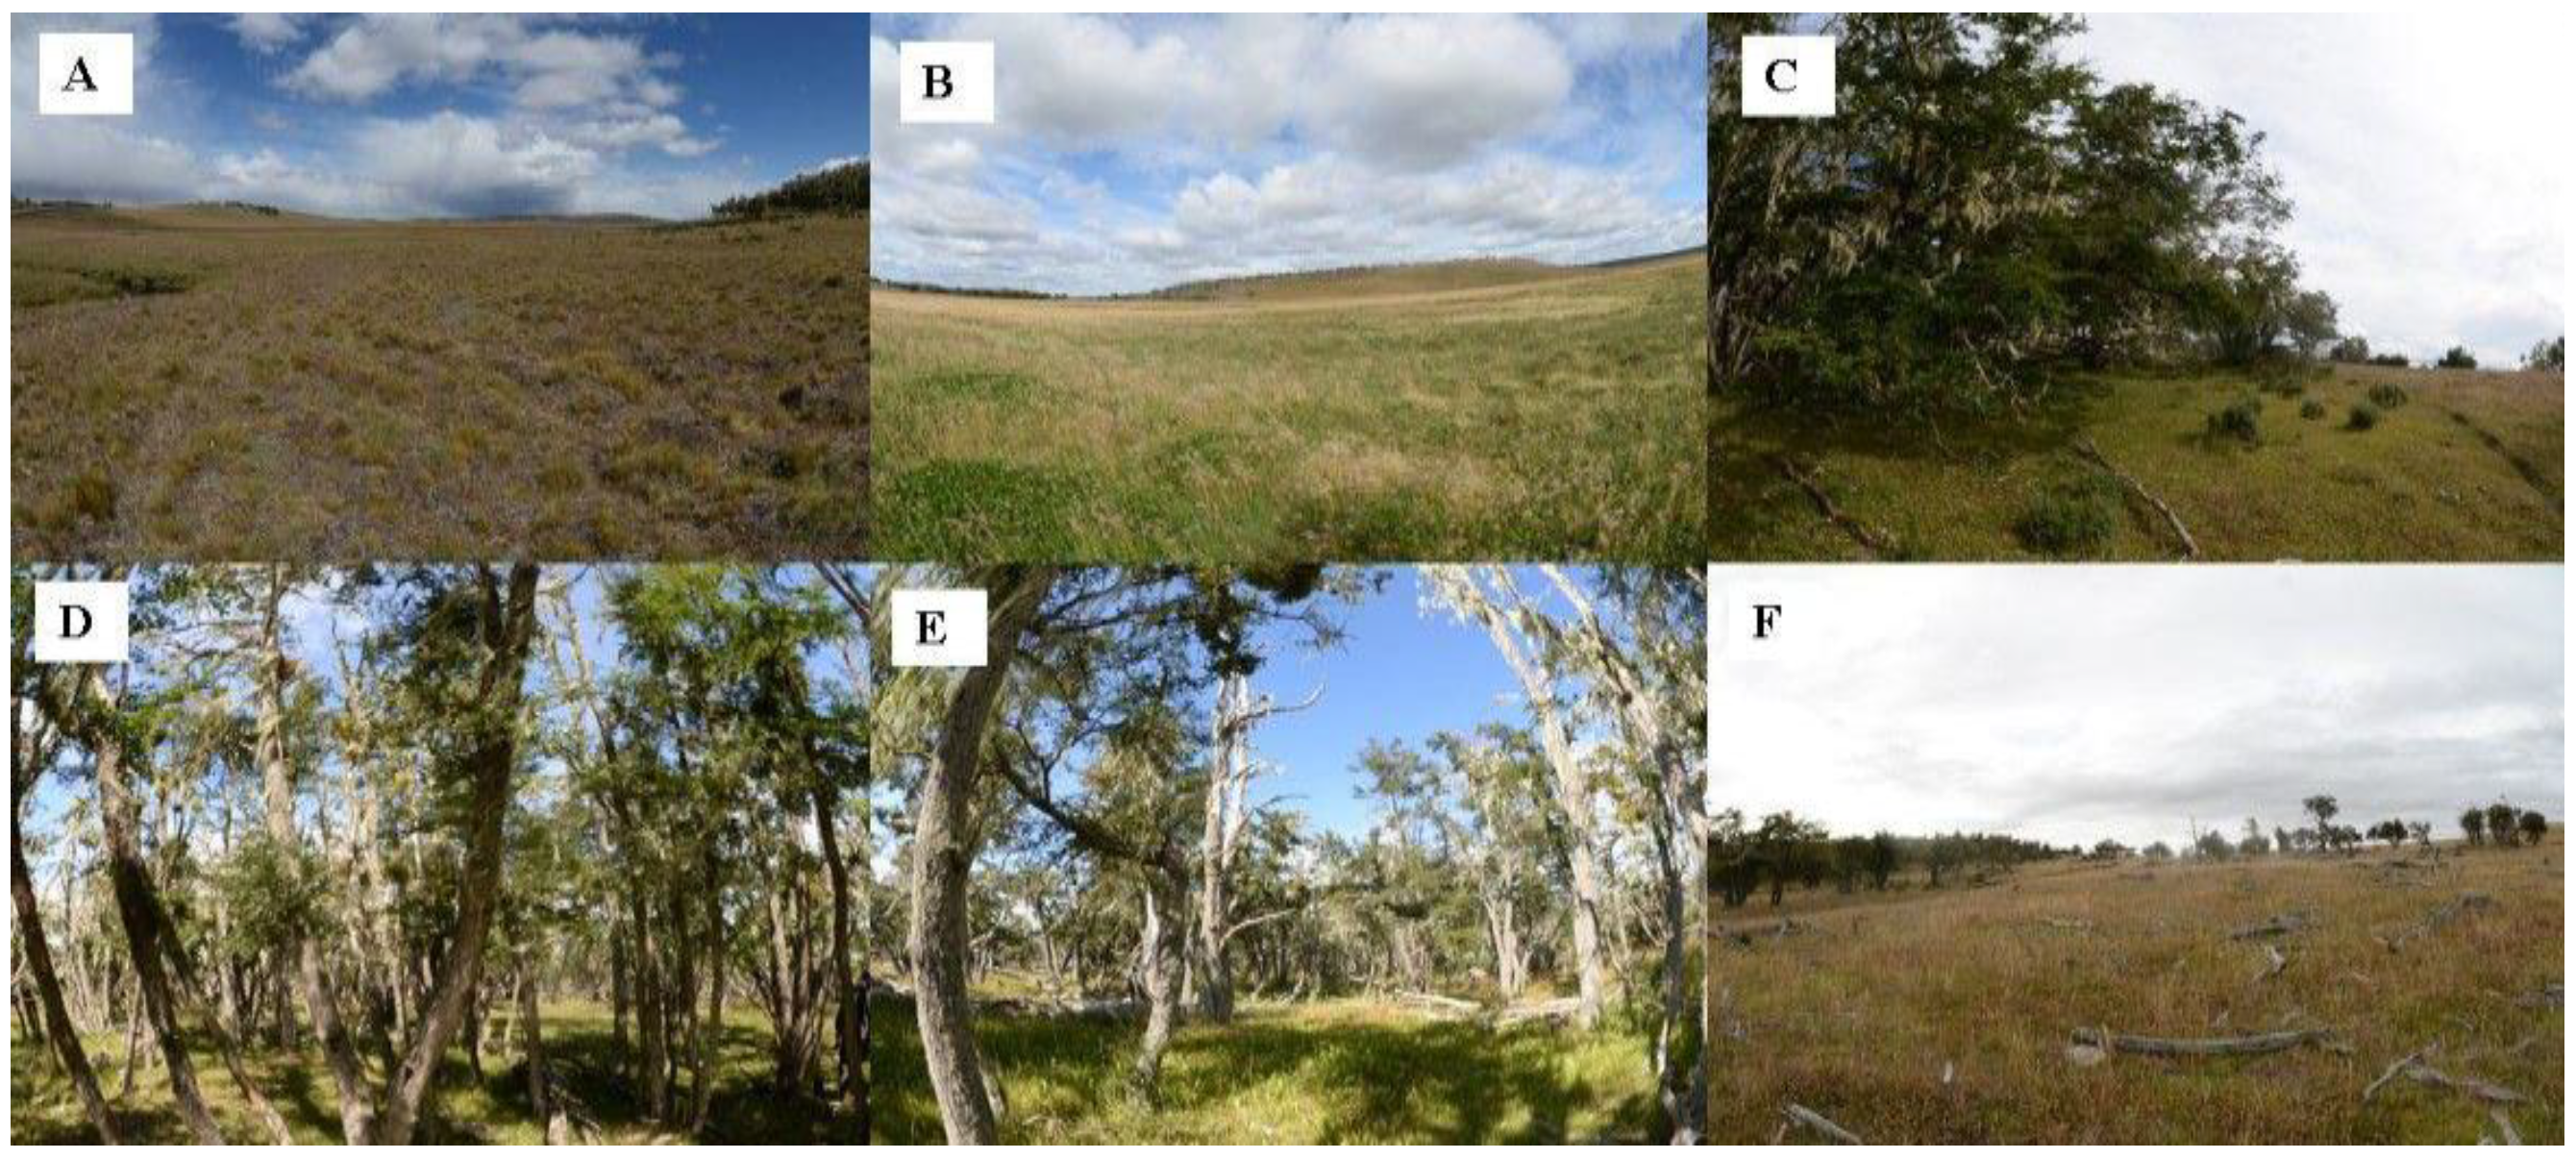
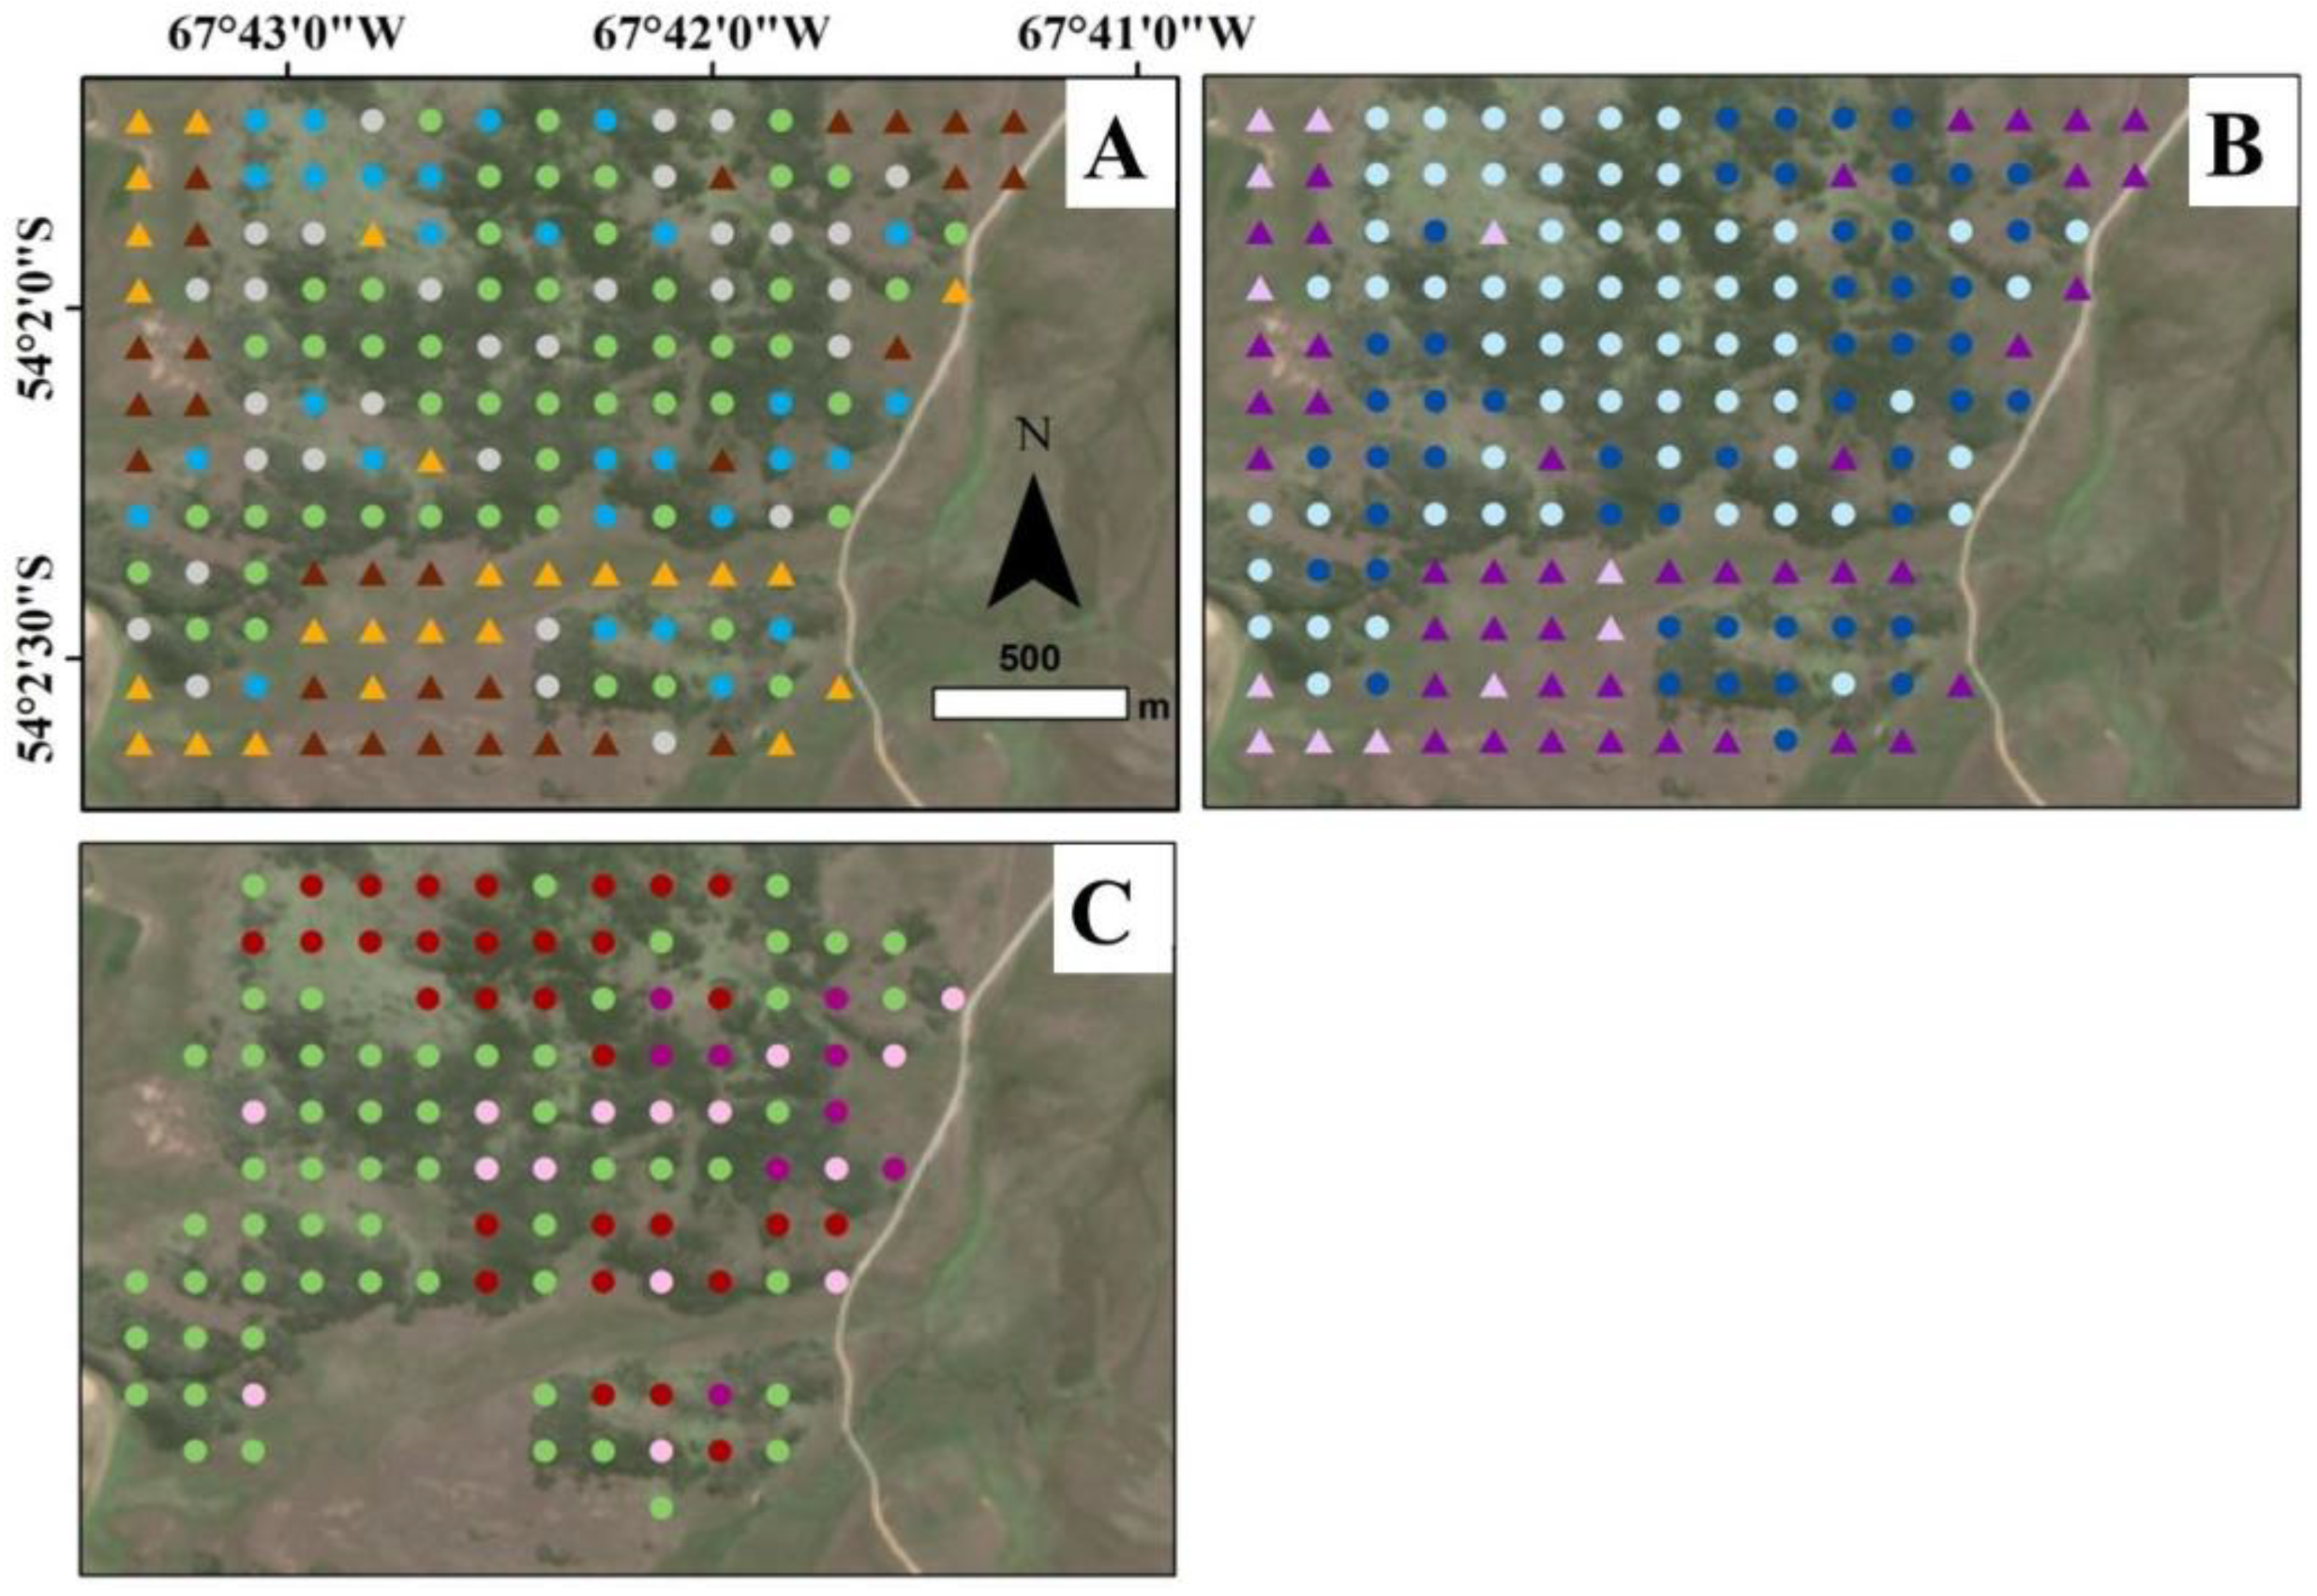
3.1. Landscape Characterization
3.2. Changes of the Environment Characteristics across the Landscape
3.3. Vegetation Cover
3.4. Degradation Indicator Plant Species
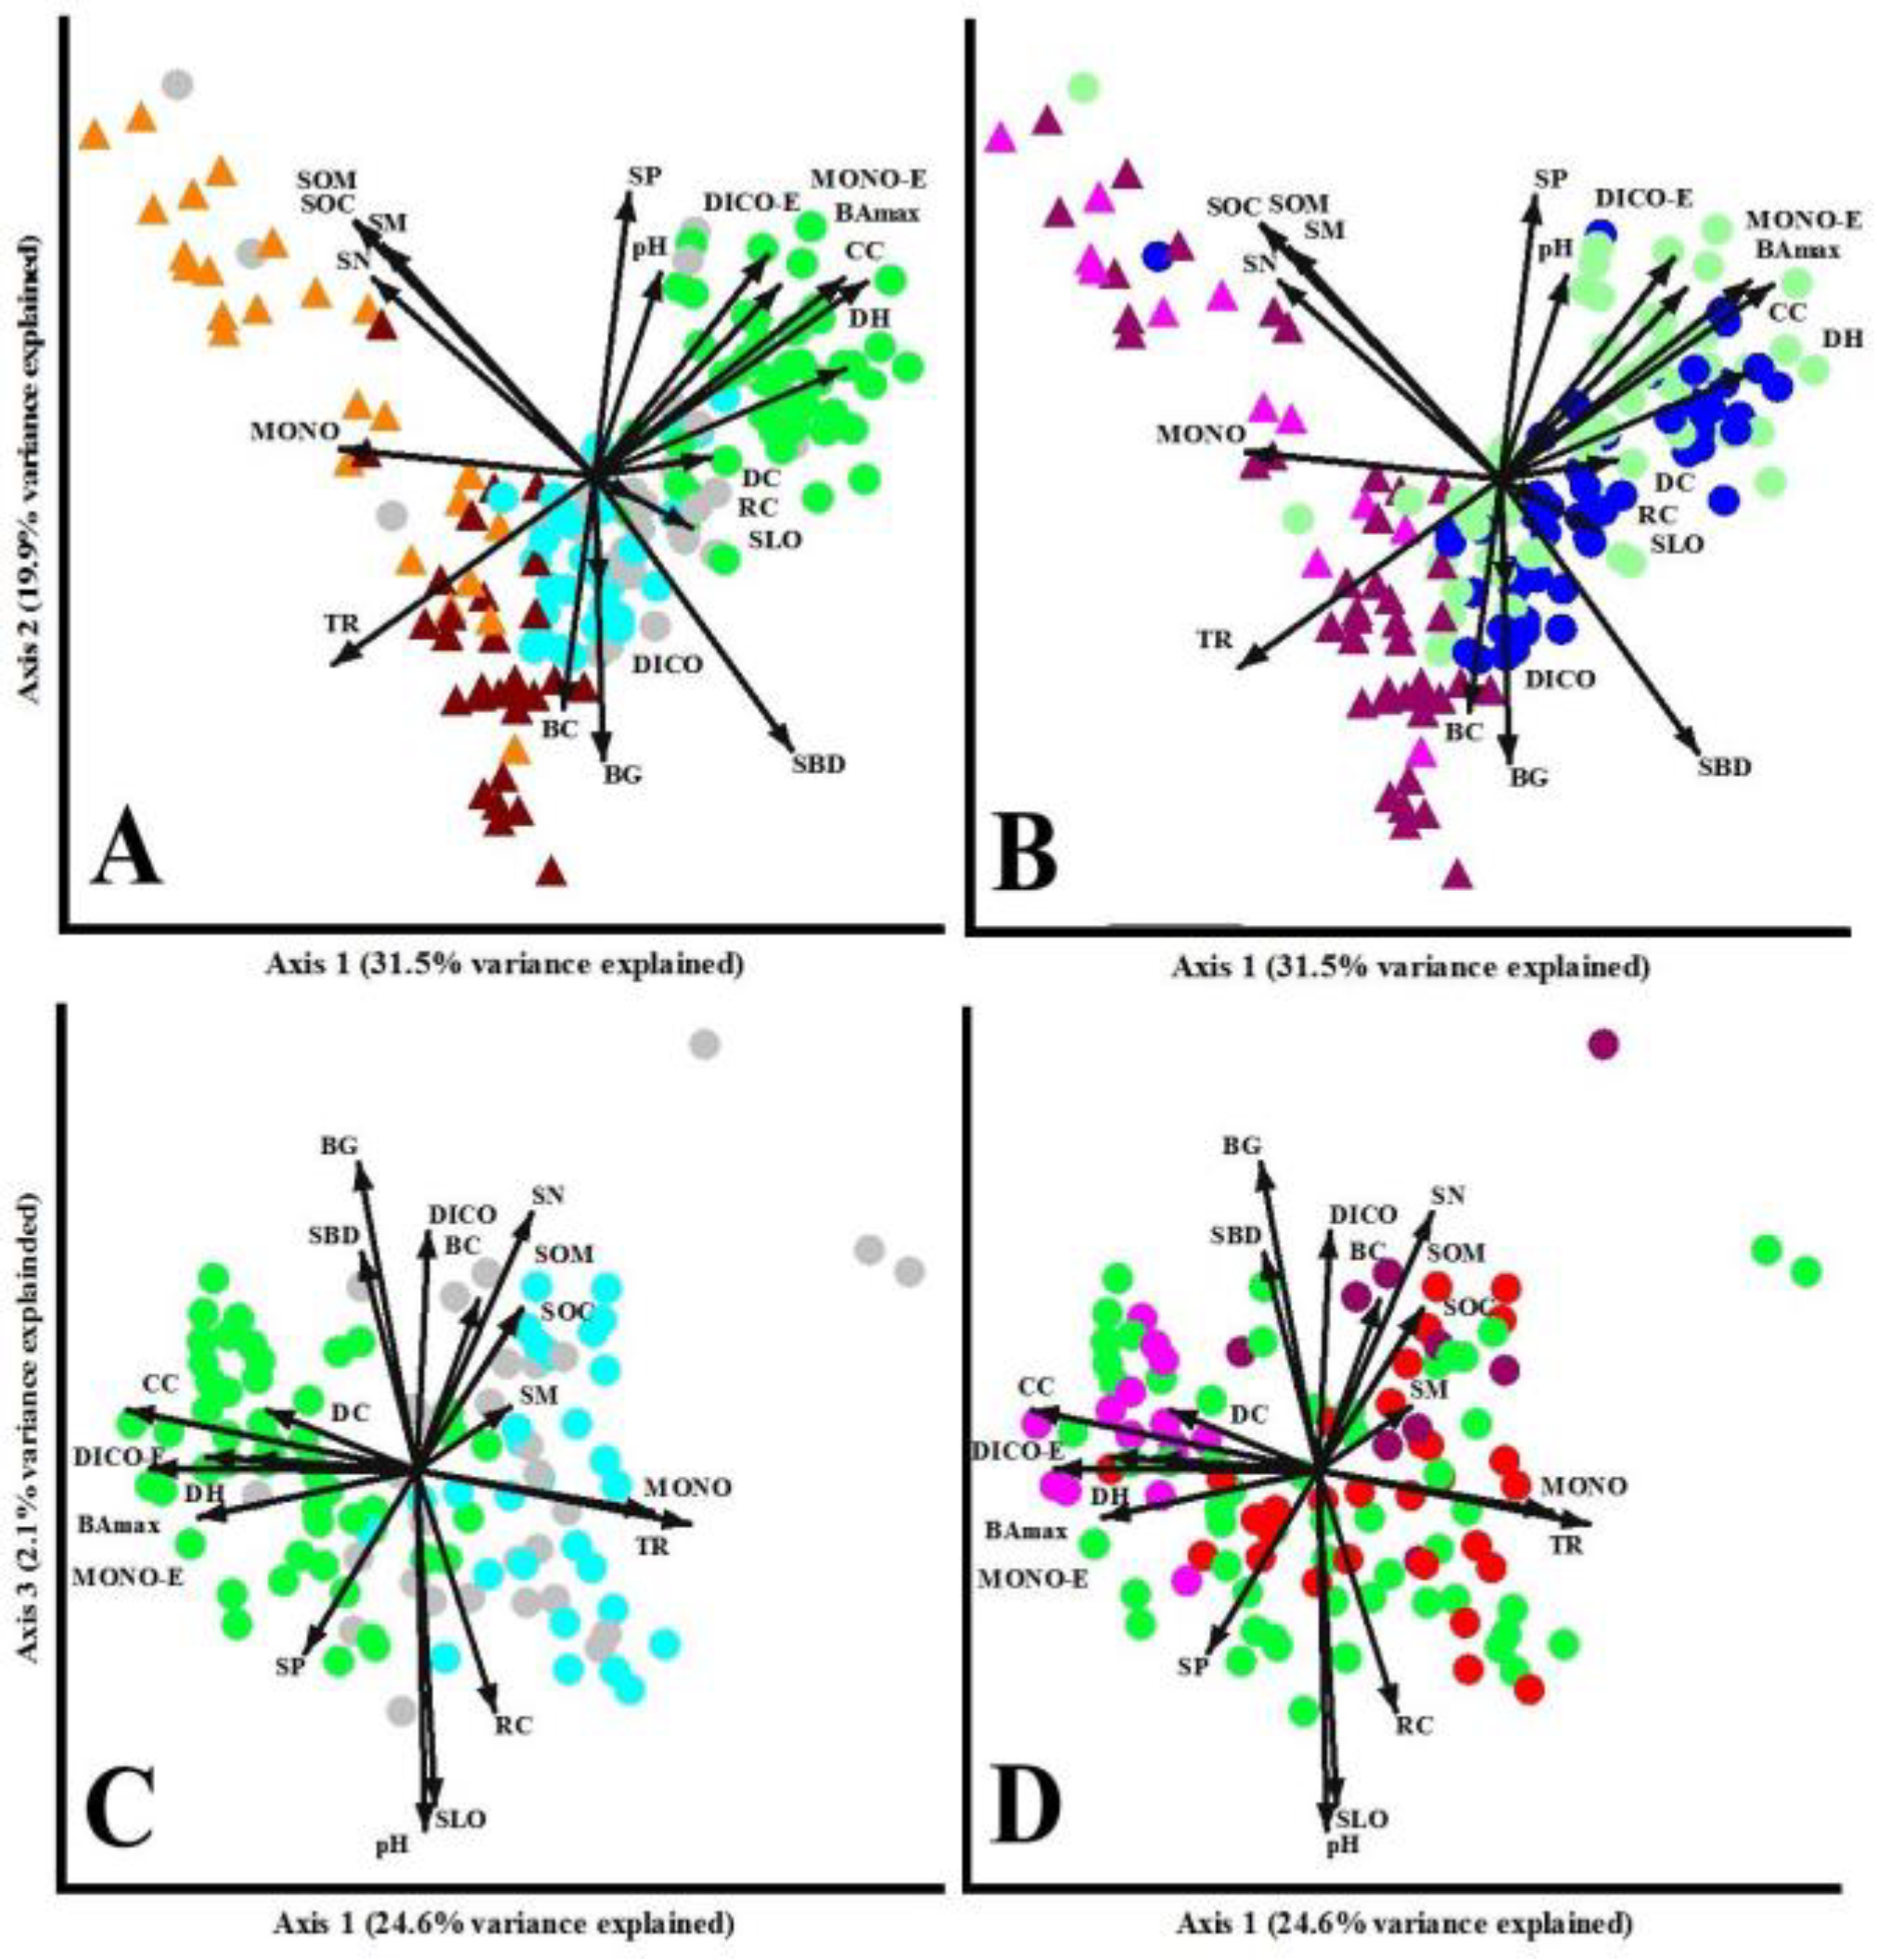
3.5. Relationship among Environmental Variables and Impact Types
4. Discussion
4.1. Changes in Forest Structure, Soil Properties and Understory Cover in the Landscape
4.2. Environmental Changes and Indicator Plants Related to Human Impacts
4.3. Relation between Invasive Understory Species and Forest Harvesting
5. Conclusions
Author Contributions
Funding
Data Availability Statement
Acknowledgments
Conflicts of Interest
References
- Jacquemyn, H.; Butaye, J.; Hermy, M. Influence of environmental and spatial variables on regional distribution of forest plant species in a fragmented and changing landscape. Ecography 2003, 26, 768–776. [Google Scholar] [CrossRef]
- Torras, O.; Gil-Tena, A.; Saura, S. How does forest landscape structure explain tree species richness in a Mediterranean context? Biodiv. Conserv. 2008, 17, 1227–1240. [Google Scholar] [CrossRef]
- Hessburg, P.; Miller, C.; Parks, S.; Povak, N.; Taylor, A.; Higuera, P.; Prichard, S.; North, M.; Collins, B.; Hurteau, M.; et al. Climate, environment, and disturbance history govern resilience of western north American forests. Front. Ecol. Evol. 2019, 7, e239. [Google Scholar] [CrossRef]
- Yeboah, D.; Chen, H. Diversity-disturbance relationship in forest landscapes. Land. Ecol. 2016, 31, 981–987. [Google Scholar] [CrossRef]
- Senf, C.; Seidl, R. Natural disturbances are spatially diverse but temporally synchronized across temperate forest landscapes in Europe. Glob. Change Biol. 2018, 24, 1201–1211. [Google Scholar] [CrossRef] [PubMed]
- Rebertus, A.; Kitzberger, T.; Veblen, T.; Roovers, L. Blowdown history and landscape patterns in the Andes of Tierra del Fuego, Argentina. Ecology 1997, 78, 678–692. [Google Scholar] [CrossRef]
- Gea-Izquierdo, G.; Martínez Pastur, G.; Cellini, J.M.; Lencinas, M.V. Forty years of silvicultural management in southern Nothofagus pumilio primary forests. For. Ecol. Manage. 2004, 201, 335–347. [Google Scholar] [CrossRef]
- Bače, R.; Schurman, J.; Brabec, M.; Čada, V.; Després, T.; Janda, P.; Lábusová, J.; Mikoláš, M.; Morrissey, R.; Mrhalová, H.; et al. Long-term responses of canopy-understorey interactions to disturbance severity in primary Picea abies forests. J. Veg. Sci. 2017, 28, 1128–1139. [Google Scholar] [CrossRef]
- Martínez Pastur, G.; Rosas, Y.M.; Chaves, J.; Cellini, J.M.; Barrera, M.D.; Favoretti, S.; Lencinas, M.V.; Peri, P.L. Changes in forest structure values along the natural cycle and different management strategies in Nothofagus antarctica forests. For. Ecol. Manage. 2021, 486, e118973. [Google Scholar] [CrossRef]
- Janda, P.; Trotsiuk, V.; Mikoláš, M.; Bače, R.; Nagel, T.; Seidl, R.; Seedre, M.; Morrissey, R.; Kucbel, S.; Jaloviar, P.; et al. The historical disturbance regime of mountain Norway spruce forests in the Western Carpathians and its influence on current forest structure and composition. For. Ecol. Manage. 2017, 388, 67–78. [Google Scholar] [CrossRef]
- Peri, P.L.; Rosas, Y.M.; López, D.; Lencinas, M.V.; Cavallero, L.; Martínez Pastur, G. Management strategies for silvopastoral system in native forests. Ecol. Austral 2022, 32, 749–766. [Google Scholar] [CrossRef]
- Chabrerie, O.; Verheyen, K.; Saguez, R.; Decocq, G. Disentangling relationships between habitat conditions, disturbance history, plant diversity, and American black cherry (Prunus serotina Ehrh.) invasion in a European temperate forest. Diver. Distr. 2008, 14, 204–212. [Google Scholar] [CrossRef]
- Huebner, C.D. Patterns of invasive plant abundance in disturbed versus undisturbed forests within three land types over 16 years. Diver. Distrib. 2020, 27, 130–143. [Google Scholar] [CrossRef]
- Levine, J.M.; Vila, M.; D’Antonio, C.M.; Dukes, J.S.; Grigulis, K.; Lavorel, S. Mechanisms underlying the impacts of exotic plant invasions. Proc. Roy. Soc. B-Biol. Sci. 2003, 270, 775–781. [Google Scholar] [CrossRef]
- Frangi, J.L.; Pérez, C.; Martiarena, R.; Pinazo, M.; Martínez Pastur, G.; Brown, A.; Peri, P.L.; Ceballos, D.S. Aspectos ecológicos y ambientales de los bosques nativos y plantaciones forestales en la Argentina: Una visión panorámica y conceptual. In El deterioro del suelo y el ambiente en Argentina; Casas, R.R., Ed.; FECIC: Buenos Aires, Argentina, 2015; pp. 365–432. [Google Scholar]
- Lázaro-Lobo, A.; Ervin, G. Native and exotic plant species respond differently to ecosystem characteristics at both local and landscape scales. Biol. Inv. 2021, 23, 143–156. [Google Scholar] [CrossRef]
- Davis, M.; Grime, J.; Thompson, K. Fluctuating resources in plant communities: A general theory of invasibility. J. Ecol. 2000, 88, 528–534. [Google Scholar] [CrossRef]
- Huebner, C.D.; Tobin, P. Invasibility of mature and 15-year-old deciduous forests by exotic plants. Plant Ecol. 2006, 186, 57–68. [Google Scholar] [CrossRef]
- Catford, J.; Vesk, P.; Richardson, D.; Pyšek, P. Quantifying levels of biological invasion: Towards the objective classification of invaded and invasible ecosystems. Glob. Change Biol. 2012, 18, 44–62. [Google Scholar] [CrossRef]
- Richardson, D.M.; Pyšek, P. Naturalization of introduced plants: Ecological drivers of biogeographical patterns. New Phytol. 2012, 196, 383–396. [Google Scholar] [CrossRef]
- Iannone, B.V.; Oswalt, C.; Liebhold, A.; Guo, Q.; Potter, K.; Nunez-Mir, G.; Oswald, S.; Pijanowski, B.; Fei, S. Region-specific patterns and drivers of macroscale forest plant invasions. Div. Distrib. 2015, 21, 1181–1192. [Google Scholar] [CrossRef]
- Riitters, K.; Potter, K.; Iannone, B.V.; Oswalt, C.; Fei, S.; Guo, Q. Landscape correlates of forest plant invasions: A high-resolution analysis across the eastern United States. Div. Distrib. 2018, 24, 274–284. [Google Scholar] [CrossRef]
- McCune, J.; Frendo, C.; Ramadan, M.; Baldwin, L. Comparing the effect of landscape context on vascular plant and bryophyte communities in a human-dominated landscape. J. Veg. Sci. 2020, 32, e12932. [Google Scholar] [CrossRef]
- Soler, R.; Lencinas, M.V.; Martínez Pastur, G.; Rosas, Y.M.; Bustamante, G.; Espelta, J.M. Forest regrowth in Tierra del Fuego, Southern Patagonia: Landscape drivers and effects on forest structure, soil, and understory attributes. Reg. Environ. Change 2022, 22, e46. [Google Scholar] [CrossRef]
- Hudson, P.F.; Alcántara-Ayala, I. Ancient and modern perspectives on land degradation. Catena 2006, 65, 102–106. [Google Scholar] [CrossRef]
- Fajardo, A.; Gazol, A.; Moreno Meynard, P.; Mayr, C.; Martínez Pastur, G.; Peri, P.L.; Camarero, J. Climate change-related growth improvements in a wide-niche breadth tree species across contrasting environments. Ann. Bot. 2023, 131, 941–951. [Google Scholar] [CrossRef]
- Vilà, M.; Espinar, J.; Hejda, M.; Hulme, P.; Jarošík, V.; Maron, J.; Pergl, J.; Schaffner, U.; Sun, Y.; Pyšek, P. Ecological impacts of invasive alien plants: A meta-analysis of their effects on species, communities and ecosystems. Ecol. Let. 2011, 14, 702–708. [Google Scholar] [CrossRef]
- Peri, P.L.; Hansen, N.E.; Bahamonde, H.A.; Lencinas, M.V.; von Müller, A.; Ormaechea, S.; Gargaglione, V.; Soler, R.; Tejera, L.; Lloyd, C.E.; et al. Silvopastoral systems under native forest in Patagonia, Argentina. In Silvopastoral systems in southern South America; Peri, P.L., Dube, F., Varella, A., Eds.; Springer: Bern, Switzerland, 2016; Series Advances in Agroforestry 11, chapter 6; pp. 117–168. [Google Scholar]
- Negi, V.S.; Pathak, R.; Rawal, R.; Bhatt, I.; Sharma, S. Long-term ecological monitoring on forest ecosystems in Indian Himalayan Region: Criteria and indicator approach. Ecol. Ind. 2019, 102, 374–381. [Google Scholar] [CrossRef]
- Haase, P.; Tonkin, J.; Stoll, S.; Burkhard, B.; Frenzel, M.; Geijzendorffer, I.; Häuser, C.; Klotz, S.; Kühn, I.; McDowell, W.; et al. The next generation of site-based long-term ecological monitoring: Linking essential biodiversity variables and ecosystem integrity. Sci. Total Environ. 2018, 613, 1376–1384. [Google Scholar] [CrossRef]
- Mirtl, M.; Borer, E.; Djukic, I.; Forsius, M.; Haubold, H.; Hugo, W.; Jourdan, J.; Lindenmayer, D.; McDowell, W.; Muraoka, H.; et al. Genesis, goals and achievements of long-term ecological research at the global scale: A critical review of ILTER and future directions. Sci. Tot. Environ. 2018, 626, 1439–1462. [Google Scholar] [CrossRef]
- Peri, P.L.; Lencinas, M.V.; Bousson, J.; Lasagno, R.; Soler, R.; Bahamonde, H.; Martínez Pastur, G. Biodiversity and ecological long-term plots in Southern Patagonia to support sustainable land management: The case of PEBANPA network. J. Nat. Conserv. 2016, 34, 51–64. [Google Scholar] [CrossRef]
- van Oudenhoven, A.; Petz, K.; Alkemade, R.; Hein, L.; de Groot, R.S. Framework for systematic indicator selection to assess effects of land management on ecosystem services. Ecol. Ind. 2012, 21, 110–122. [Google Scholar] [CrossRef]
- Schall, P.; Ammer, C. How to quantify forest management intensity in Central European forests. Eur. J. For. Res. 2013, 132, 379–396. [Google Scholar] [CrossRef]
- Dieler, J.; Uhl, E.; Biber, P.; Müller, J.; Rötzer, T.; Pretzsch, H. Effect of forest stand management on species composition, structural diversity, and productivity in the temperate zone of Europe. Eur. J. For. Res. 2017, 136, 739–766. [Google Scholar] [CrossRef]
- Oettel, J.; Lapin, K. Linking forest management and biodiversity indicators to strengthen sustainable forest management in Europe. Ecol. Ind. 2021, 122, e107275. [Google Scholar] [CrossRef]
- Milbau, A.; Stout, J.C.; Graee, B.J.; Nijs, I. A hierarchical framework for integrating invasibility experiments incorporating different factors and scales. Biol Inv. 2009, 11, 941–950. [Google Scholar] [CrossRef]
- Bradie, J.; Leung, B. A quantitative synthesis of the importance of variables used in MaxEnt species distribution models. J. Biogeogr. 2017, 44, 1344–1361. [Google Scholar] [CrossRef]
- Lázaro-Lobo, A.; Ramirez-Reyes, C.; Lucardi, R.D.; Ervin, G. Multivariate analysis of invasive plant species distributions in southern US forests. Land. Ecol. 2021, 36, 3539–3555. [Google Scholar] [CrossRef]
- Ellenberg, H. Zeigerwerte der Gefäßpflanzen Mitteleuropas (Indicator values of vascular plants in Central Europe). Scripta Geobotanica 1974, 9, 1–97. [Google Scholar] [CrossRef]
- Tichý, L.; Axmanová, I.; Dengler, J.; Guarino, R.; Jansen, F.; Midolo, G.; Nobis, M.; van Meerbeek, K.; Aćić, S.; Attorre, F.; et al. Ellenberg-type indicator values for European vascular plant species. J. Veg. Sci. 2022, 34, e13168. [Google Scholar] [CrossRef]
- Huertas Herrera, A.; Cellini, J.M.; Barrera, M.D.; Lencinas, M.V.; Martínez Pastur, G. Environmental gradients and anthropogenic impacts as main drivers for the invasion of exotics plants in forest mountain landscapes of South Patagonia. For. Ecol. Manage. 2018, 430, 380–393. [Google Scholar] [CrossRef]
- Haines-Young, R.; Potschin, M.; Kienast, F. Indicators of ecosystem service potential at European scales: Mapping marginal changes and trade-offs. Ecol. Ind. 2012, 21, 39–53. [Google Scholar] [CrossRef]
- Lencinas, M.V.; Sola, F.; Cellini, J.M.; Peri, P.L.; Martínez Pastur, G. Land sharing in South Patagonia: Conservation of above-ground beetle diversity in forests and non-forest ecosystems. Sci. Tot. Environ. 2019, 690, 132–139. [Google Scholar] [CrossRef]
- Stopps, G.; White, S.; Clements, D.; Upadhyaya, M. The biology of Canadian weeds. 149. Rumex acetosella L. Can. J. Plant Sci. 2011, 91, 1037–1052. [Google Scholar] [CrossRef]
- Visscher, A.M.; Wellstein, C.; Vanek, S.; Bricca, A.; Meza, K.; Huaraca, J.; Ccanto, R.; Olivera, E.; Loayza, J.; Vigil, L.; et al. Drivers of growth and establishment of the invasive plant Rumex acetosella within Andean fallow systems. Agric. Ecosyst. Environ. 2023, 351, e108446. [Google Scholar] [CrossRef]
- Domínguez Díaz, E.; Oliva, G.; Báez Madariaga, J.; Suárez Navarro, A.; Pérez Castillo, C. Effects of holistic grazing on structure and composition of naturalized prairies under livestock grazing, provincia de Última Esperanza, Magellan region, Chile. Anales Inst. Patagonia 2018, 46, 17–28. [Google Scholar] [CrossRef]
- Cipriotti, P.A.; Rauber, R.B.; Collantes, M.B.; Braun, K.; Escartín, C. Hieracium pilosella invasion in the Tierra del Fuego steppe, Southern Patagonia. Biol. Inv. 2010, 12, 2523–2535. [Google Scholar] [CrossRef]
- Speziale, K.L.; Ezcurra, C. Patterns of alien invasions in northwestern Patagonia, Argentina. J. Arid Environ. 2011, 75, 890–897. [Google Scholar] [CrossRef]
- Rauber, R.B.; Collantes, M.B.; Cipriotti, P.A.; Anchorena, J. Biotic and abiotic constraints to a plant invasion in vegetation communities of Tierra del Fuego. Aust. Ecol. 2013, 39, 436–442. [Google Scholar] [CrossRef]
- Cooke, M.M.; Martelli, A.; Sleiman, M.; Cipriotti, P. The role of competition on invader colonization along stress gradients in the Fuegian steppe. Oecologia 2021, 195, 1031–1040. [Google Scholar] [CrossRef]
- Alonso, M.F.; Wentzel, H.; Schmidt, A.; Balocchi, O. Plant community shifts along tree canopy cover gradients in grazed Patagonian Nothofagus antarctica forests and grasslands. Agrofor. Syst. 2020, 94, 651–661. [Google Scholar] [CrossRef]
- Martínez Pastur, G.; Rosas, Y.M.; Cellini, J.M.; Barrera, M.D.; Toro Manríquez, M.; Huertas Herrera, A.; Favoretti, S.; Lencinas, M.V.; Peri, P.L. Conservation values of understory vascular plants in even- and uneven-aged Nothofagus antarctica forests. Biodiv. Conserv. 2020, 29, 3783–3805. [Google Scholar] [CrossRef]
- Toledo, S.; Peri, P.L.; Correa, O.; Gargaglione, V.; González-Polo, M. Soil microbial communities respond to an environmental gradient of grazing intensity in south Patagonia Argentina. J. Arid Environ. 2021, 184, e104300. [Google Scholar] [CrossRef]
- Peri, P.L.; López, D.; Rusch, V.; Rusch, G.; Rosas, Y.M.; Martínez Pastur, G. State and transition model approach in native forests of Southern Patagonia (Argentina): Linking ecosystem services, thresholds and resilience. Int. J. Biodiv. Sci. Ecosyst. Ser. Manage. 2017, 13, 105–118. [Google Scholar] [CrossRef]
- Bitterlich, W. The relascope idea: Relative measurements in forestry; CAB: London, UK, 1984; 242p. [Google Scholar]
- Frazer, G.W.; Fournier, R.A.; Trofymow, J.A.; Gall, R.J. A comparison of digital and film fisheye photography for analysis of forest canopy structure and gap light transmission. Agric. For. Meteorol. 2001, 109, 249–263. [Google Scholar] [CrossRef]
- Martínez Pastur, G.; Peri, P.L.; Cellini, J.M.; Lencinas, M.V.; Barrera, M.D.; Ivancich, H. Canopy structure analysis for estimating forest regeneration dynamics and growth in Nothofagus pumilio forests. Ann. For. Sci. 2011, 68, 587–594. [Google Scholar] [CrossRef]
- Bao, S.D. Soil agricultural chemical analysis. China Agricultural Press: Beijing, China, 2000; pp. 265–267. [Google Scholar]
- Carter, M.; Gregorich, E. Soil sampling and methods of analysis; Canadian Society of Soil Science, Taylor and Francis: Boca Ratón, USA, 2007; 1261p. [Google Scholar]
- Bray, R.H.; Kurtz, L.T. Determination of total, organic, and available forms of phosphorus in soils. Soil Sci. 1945, 59, 39–45. [Google Scholar] [CrossRef]
- Bahamonde, H.A.; Gargaglione, V.; Peri, P.L. Sheep faeces decomposition and nutrient release across an environmental gradient in Southern Patagonia. Ecol. Austral 2017, 27, 18–28. [Google Scholar] [CrossRef]
- Martínez Pastur, G.; Cellini, J.M.; Chaves, J.; Rodriguez Souilla, J.; Benítez, J.; Rosas, Y.M.; Soler, R.; Lencinas, M.V.; Peri, P.L. Changes in forest structure modify understory and livestock occurrence along the natural cycle and different management strategies in Nothofagus antarctica forests. Agrofor. Syst. 2022, 96, 1039–1052. [Google Scholar] [CrossRef]
- Levy, E.G.; Madden, E.A. The point method of pasture analysis. N.Z.J. Agric. 1933, 46, 267–379. [Google Scholar]
- Moore, D.M. Flora of Tierra del Fuego; Missouri Botanical Garden, Anthony Nelson: London, UK, 1983; 396p. [Google Scholar]
- Correa, M.N. Flora Patagónica. INTA: Buenos Aires, Argentina, 1969-1998; 7 volume.
- McCune, B.; Mefford, M.J. Multivariate analysis of ecological data. Version 4.0. MjM software: Gleneden Beach, USA, 1999. [Google Scholar]
- Lozano-García, B.; Parras-Alcánta, L.; Brevik, E.C. Impact of topographic aspect and vegetation (native and reforested areas) on soil organic carbon and nitrogen budgets in Mediterranean natural areas. Sci. Tot. Environ. 2016, 544, 963–970. [Google Scholar] [CrossRef] [PubMed]
- Lucas, R.E.; Davis, J.F. Relationships between pH values of organic soils and availabilities of 12 plant nutrients. Soil Sci. 1961, 92, 177–182. [Google Scholar] [CrossRef]
- Gurevitch, J.; Scheiner, S.M.; Fox, G.A. The ecology of plants; Sinauer Associates: Sunderland, USA, 2002. [Google Scholar]
- Mittelbach, G.G.; McGill, B.J. Biodiversity and ecosystem functioning. In Community ecology; Mittelbach, G.G., Ed.; Sinauer Associates Inc.: Sunderland, USA, 2012; pp. 41–62. [Google Scholar]
- Golluscio, R.A.; Martínez, G.G.; Cavagnaro, F.P. How does grazing affect soil water availability in the Patagonian steppe? J. Arid. Environ. 2022, 205, e104800. [Google Scholar] [CrossRef]
- Alauzis, M.V.; Mazzarino, M.J.; Raffaele, E.; Roselli, L. Wildfires in NW Patagonia: Long-term effects on a Nothofagus forest soil. For. Ecol. Manage. 2004, 192, 131–142. [Google Scholar] [CrossRef]
- Posse, G.; Anchorena, J.; Collantes, M.B. Spatial micro-patterns in the steppe of Tierra del Fuego induced by sheep grazing. J. Veg. Sci. 2000, 11, 43–50. [Google Scholar] [CrossRef]
- Pauchard, A.; Alaback, P.B. Influence of elevation, land use, and landscape context on patterns of alien plant invasions along roadsides in protected areas of south-central Chile. Conserv. Biol. 2004, 18, 238–248. [Google Scholar] [CrossRef]
- Ghermandi, L.; Guthmann, N.; Bran, D. Early post-fire succession in northwestern Patagonia grasslands. J. Veg. Sci. 2004, 15, 67–76. [Google Scholar] [CrossRef]
- Sitzia, T.; Campagnaro, T.; Kowarik, I.; Trentanovi, G. Using forest management to control invasive alien species: Helping implement the new European regulation on invasive alien species. Biol. Inv. 2016, 18, 1–7. [Google Scholar] [CrossRef]
- Tilley, D.; Hulet, A.; Bushman, S.; Goebel, C.; Karl, J.; Love, S.; Wolf, M. When a weed is not a weed: Succession management using early seral natives for Intermountain rangeland restoration. Rangelands 2022, 44, 270–280. [Google Scholar] [CrossRef]
| n | CC | TR | DH | BAmax | |
|---|---|---|---|---|---|
| (A) Environment types | |||||
| OL-G | 29 | 8.84 a | 6.75 c | - | - |
| OL-W | 25 | 10.37 a | 6.75 c | - | - |
| FL-CF | 51 | 71.40 d | 2.61 a | 8.50 b | 51.10 b |
| FL-EF | 31 | 39.63 c | 5.02 b | 7.23 a | 17.62 a |
| FL-OF | 29 | 22.31 b | 6.15 c | 7.51 a | 8.06 a |
|
F (p) |
219.29 (<0.001) |
111.68 (<0.001) |
10.41 (<0.001) |
59.00 (<0.001) |
|
| (B) Grazing impacts | |||||
| OL-LG | 12 | 10.60 a | 6.75 b | - | - |
| OL-HG | 42 | 9.25 a | 6.75 b | - | - |
| FL-LG | 61 | 51.05 b | 4.04 a | 7.90 | 34.02 |
| FL-HG | 50 | 48.09 b | 4.42 a | 7.86 | 26.21 |
|
F (p) |
46.20 (<0.001) |
29.45 (<0.001) |
0.02 (0.900) |
2.35 (0.128) |
|
| (C) Harvested and fire impacts | |||||
| FL-UH | 57 | 50.79 a | 4.11 b | 7.87 ab | 30.58 a |
| FL-LH | 15 | 77.34 b | 2.16 a | 8.80 b | 60.82 b |
| FL-HH | 9 | 35.53 a | 5.24 b | 7.43 ab | 13.33 a |
| FL-F | 30 | 38.12 a | 5.09 b | 7.58 a | 20.36 a |
|
F (p) |
12.20 (<0.001) |
10.02 (<0.001) |
2.95 (0.040) |
11.66 (<0.001) |
|
| n | SLO | SBD | SM | pH | SOC | SOM | SN | SP | |
|---|---|---|---|---|---|---|---|---|---|
| (A) Environment types | |||||||||
| OL-G | 29 | 4.17 b | 0.75 b | 31.19 a | 4.54 a | 7.68 a | 19.13 a | 0.46 a | 12.43 a |
| OL-W | 25 | 2.06 a | 0.37 a | 107.31 b | 4.79 ab | 22.31 b | 55.47 b | 1.26 b | 16.25 ab |
| FL-CF | 51 | 4.35 b | 0.76 b | 25.16 a | 5.03 b | 7.44 a | 18.53 a | 0.41 a | 19.58 b |
| FL-EF | 31 | 5.22 b | 0.74 b | 23.85 a | 4.97 b | 8.87 a | 22.08 a | 0.42 a | 14.66 ab |
| FL-OF | 29 | 4.63 b | 0.77 b | 20.47 a | 5.02 b | 6.70 a | 16.70 a | 0.39 a | 13.13 a |
|
F (p) |
5.55 (<0.001) |
21.15 (<0.001) |
29.19 (<0.001) |
7.83 (<0.001) |
37.06 (<0.001) |
37.09 (<0.001) |
56.51 (<0.001) |
4.31 (0.002) |
|
| (B) Grazing impacts | |||||||||
| OL-LG | 12 | 2.29 a | 0.35 a | 116.83 c | 4.92 bc | 20.73 c | 51.56 c | 1.19 c | 15.67 ab |
| OL-HG | 42 | 3.45 ab | 0.65 b | 52.03 b | 4.58 a | 12.66 b | 31.49 b | 0.73 b | 13.78 a |
| FL-LG | 61 | 4.61 b | 0.71 bc | 25.25 a | 5.18 c | 7.82 a | 19.49 a | 0.41 a | 18.31 b |
| FL-HG | 50 | 4.74 b | 0.81 c | 21.52 a | 4.81 b | 7.43 a | 18.51 a | 0.40 a | 14.34 a |
|
F (p) |
4.23 (0.006) |
17.44 (<0.001) |
24.05 (<0.001) |
20.73 (<0.001) |
16.80 (<0.001) |
16.82 (<0.001) |
26.32 (<0.001) |
2.77 (0.043) |
|
| (C) Harvested and fire impacts | |||||||||
| FL-UH | 57 | 5.21 | 0.72 | 26.07 | 5.01 ab | 7.97 | 19.84 | 0.40 | 17.77 |
| FL-LH | 15 | 4.53 | 0.82 | 21.54 | 4.92 ab | 7.42 | 18.50 | 0.40 | 16.74 |
| FL-HH | 9 | 3.44 | 0.84 | 19.03 | 4.68 a | 7.98 | 19.88 | 0.47 | 11.31 |
| FL-F | 30 | 4.08 | 0.77 | 21.20 | 5.17 b | 7.04 | 17.56 | 0.40 | 15.62 |
|
F (p) |
1.70 (0.171) |
2.05 (0.111) |
2.63 (0.053) |
2.98 (0.034) |
0.37 (0.771) |
0.37 (0.771) |
1.74 (0.162) |
1.63 (0.186) |
|
| n | BG | DC | RC | BC | MONO | MONO-E | DICO | DICO-E | |
|---|---|---|---|---|---|---|---|---|---|
| (A) Environment types | |||||||||
| OL-G | 29 | 16.13 b | 2.00 ab | 1.72 ab | 2.34 b | 47.93 b | 2.07 a | 16.75 b | 2.20 a |
| OL-W | 25 | 4.32 a | 0.00 a | 0.00 a | 0.32 a | 67.04 c | 8.08 ab | 9.28 a | 6.64 ab |
| FL-CF | 51 | 5.52 a | 4.66 b | 2.35 ab | 0.19 a | 25.09 a | 26.50 c | 13.14 ab | 18.70 c |
| FL-EF | 31 | 6.00 a | 1.80 a | 4.51 ab | 0.64 a | 41.67 b | 13.61 b | 10.32 ab | 10.84 b |
| FL-OF | 29 | 4.55 a | 1.79 a | 5.51 b | 1.03 ab | 44.41 b | 5.65 ab | 14.96 ab | 4.41 a |
|
F (p) |
12.30 (<0.001) |
5.42 (<0.001) |
3.39 (0.010) |
6.75 (<0.001) |
226.41 (<0.001) |
25.81 (<0.001) |
2.77 (0.029) |
26.43 (<0.001) |
|
| (B) Grazing impacts | |||||||||
| OL-LG | 12 | 5.16 a | 0.00 a | 0.00 | 0.33 a | 65.50 b | 5.50 ab | 10.83 ab | 5.50 ab |
| OL-HG | 42 | 12.24 b | 1.38 a | 1.19 | 1.71 b | 54.28 b | 4.66 a | 14.00 ab | 3.90 a |
| FL-LG | 61 | 3.94 a | 2.78 ab | 4.06 | 0.52 a | 36.22 a | 14.65 bc | 15.21 b | 13.96 c |
| FL-HG | 50 | 7.20 a | 3.52 b | 3.44 | 0.56 a | 33.00 a | 20.88 b | 9.92 a | 11.32 bc |
|
F (p) |
9.92 (<0.001) |
2.88 (0.040) |
2.59 (0.055) |
3.91 (<0.001) |
17.04 (<0.001) |
11.76 (<0.001) |
2.92 (0.035) |
10.68 (<0.001) |
|
| (C) Harvested and fire impacts | |||||||||
| FL-UH | 57 | 5.19 | 2.56 a | 4.10 | 0.28 a | 34.35 b | 20.98 bc | 11.64 | 12.56 a |
| FL-LH | 15 | 6.93 | 6.00 b | 1.46 | 0.13 a | 18.00 a | 28.00 c | 10.93 | 24.13 b |
| FL-HH | 57 | 8.00 | 1.55 a | 3.33 | 1.77 b | 34.00 ab | 8.66 ab | 19.11 | 8.44 a |
| FL-F | 30 | 4.27 | 3.20 a | 4.46 | 0.86 ab | 44.20 b | 8.13 a | 14.13 | 8.80 a |
|
F (p) |
1.39 (0.248) |
5.02 (0.002) |
0.78 (0.507) |
3.71 (0.014) |
7.84 (<0.001) |
9.15 (<0.002) |
1.81 (0.149) |
8.98 (<0.001) |
|
| n | AZCA | BOGU | AZTR | HIPI | ACMI | RUAC | |
|---|---|---|---|---|---|---|---|
| (A) Environment types | |||||||
| OL-G | 29 | 2.31 ab | 3.37 b | 4.62 a | 2.62 ab | 0.03 | 4.07 |
| OL-W | 25 | 3.00 b | 0.84 a | 4.44 a | 1.12 a | 0.08 | 1.92 |
| FL-CF | 51 | 0.06 a | 0.00 a | 1.80 a | 1.00 a | 0.54 | 3.54 |
| FL-EF | 31 | 0.41 ab | 0.12 a | 16.64 b | 2.32 ab | 0.25 | 5.06 |
| FL-OF | 29 | 1.34 ab | 0.20 a | 25.45 b | 7.10 b | 0.17 | 4.14 |
|
F (p) |
3.54 (0.008) |
14.43 (<0.001) |
14.26 (<0.001) |
3.41 (0.010) |
0.62 (0.652) |
1.41 (0.234) |
|
| (B) Grazing impacts | |||||||
| OL-LG | 12 | 6.08 b | 1.75 ab | 6.75 ab | 1.00 | 0.00 | 2.08 |
| OL-HG | 42 | 1.64 a | 2.33 b | 3.90 a | 2.19 | 0.07 | 3.35 |
| FL-LG | 61 | 0.67 a | 0.06 a | 13.95 b | 2.03 | 0.39 | 3.22 |
| FL-HG | 50 | 0.28 a | 0.12 a | 9.90 ab | 4.10 | 0.34 | 5.24 |
|
F (p) |
8.87 (<0.001) |
11.44 (<0.001) |
2.93 (0.035) |
0.94 (0.423) |
0.45 (0.718) |
2.15 (0.096) |
|
| (C) Harvested and fire impacts | |||||||
| FL-UH | 57 | 0.38 | 0.12 | 10.05 ab | 3.35 | 0.19 | 5.14 |
| FL-LH | 15 | 0.06 | 0.00 | 0.66 a | 1.00 | 1.60 | 3.86 |
| FL-HH | 9 | 0.55 | 0.00 | 9.66 ab | 7.88 | 0.11 | 4.11 |
| FL-F | 30 | 0.90 | 0.10 | 22.53 b | 1.73 | 0.16 | 2.36 |
|
F (p) |
0.97 (0.408) |
1.04 (0.376) |
5.82 (<0.001) |
1.42 (0.240) |
2.27 (0.084) |
1.84 (0.145) |
|
Disclaimer/Publisher’s Note: The statements, opinions and data contained in all publications are solely those of the individual author(s) and contributor(s) and not of MDPI and/or the editor(s). MDPI and/or the editor(s) disclaim responsibility for any injury to people or property resulting from any ideas, methods, instructions or products referred to in the content. |
© 2023 by the authors. Licensee MDPI, Basel, Switzerland. This article is an open access article distributed under the terms and conditions of the Creative Commons Attribution (CC BY) license (http://creativecommons.org/licenses/by/4.0/).


