1. Introduction
As one of the three major cereals, wheat is also the main grain in China, so it is very important to monitor the growth status of wheat [
1]. As the most important pigment in the process of photosynthesis, chlorophyll is directly related to the light energy utilization of wheat, and the change of its content can reflect the growth status of wheat at different stages [
2]. Therefore, estimating the chlorophyll content of crops can guide agricultural production and field tillage, achieve high-yield and high-quality wheat production, and improve the level of agricultural production [
3].
Traditional methods for obtaining leaf chlorophyll content may require manual sampling in the field, combined with laboratory quantitative testing, or manual determination in the field using chlorophyll meters, which are time-consuming and laborious, and it is difficult to obtain information on leaf chlorophyll content of large-scale crops [
4]. Remote sensing technology has been widely used in crop growth monitoring, yield estimation, and pest prediction [
5], and also provides a new method for estimating the chlorophyll content of crop leaves. Red light and near-infrared are sensitive to green crops in the remote sensing spectral band, which contains a large amount of spectral information related to leaf chlorophyll content, and many scholars have carried out a lot of research. For example, Schlemmer et al. [
6] calculated NDVI by processing the hyperspectral reflectance of maize leaves as a derivative, and realized an effective estimation of maize chlorophyll content based on multivariate linear regression. Shen et al. [
7] established a partial least squares regression model to estimate the chlorophyll content of wheat leaves. Remote sensing has high resolution and efficiency. The characteristics of fast rate and wide range, so in the monitoring of crop growth. It has been rapidly developed and widely promoted.
The results show that remote sensing monitoring based on vegetation index (VI) has spatiotemporal continuity, which is convenient for long-term monitoring of crop growth information, and has high application value in chlorophyll estimation [
8].Qiao et al. [
9]studied the response characteristics of LCC and vegetation index of field maize under different coverage conditions, and constructed a canopy LCC estimation model by using random forest (RF) and partial least squares methods. Jia et al. [
10]showed that the spectral index of the new combination was helpful for the determination of sensitive bands, enhanced the correlation of leaf nitrogen content, and performed reliably in the regression model of nitrogen content in flue-cured tobacco leaves. With the rapid development of machine learning algorithms, multiple linear regression (MLR) [
11], partial least squares regression (PLSR) [
12], random forest regression (RFR) [
13], and support vector machine regression (SVR) [
14] and other methods have achieved good results in estimating leaf chlorophyll content. Liu et al. [
15]used continuous wavelet transform to analyze the chlorophyll content of potatoes, and the results showed that the continuous wavelet transform method could effectively extract the wavelet characteristics that were sensitive to the chlorophyll content of potatoes , and enhance the correlation between the spectrum and chlorophyll content. Many scholars have used different machine learning algorithms and different methods to conduct a lot of research on the quantitative monitoring of crop attributes and have achieved remarkable results. Therefore, it is particularly important to choose appropriate spectral pretreatment methods, vegetation index methods and machine learning methods to invert the chlorophyll content of crop leaves by spectroscopy.
The analysis of the dynamic changes of chlorophyll content and vegetation index at different growth stages can directly or indirectly reflect the growth status of wheat at different stages. In this study, the chlorophyll content of wheat at four different growth stages, namely flag picking stage, flowering stage, grain filling stage and maturity stage, was taken as the research object. A five-point smoothing pretreatment was performed on the original hyperspectral reflectance, The correlation matrix method was used to screen out the optimal combination bands of chlorophyll content and five vegetation indices in the range of 400-1000nm, and the chlorophyll content of wheat was estimated by polynomial regression, random forest, decision tree and artificial neural network algorithm, and the optimal vegetation index combination and the best estimation model were explored at different growth stages, so as to provide theoretical basis and technical support for real-time monitoring of wheat growth and development.
2. Materials and Methods
2.1. Study area
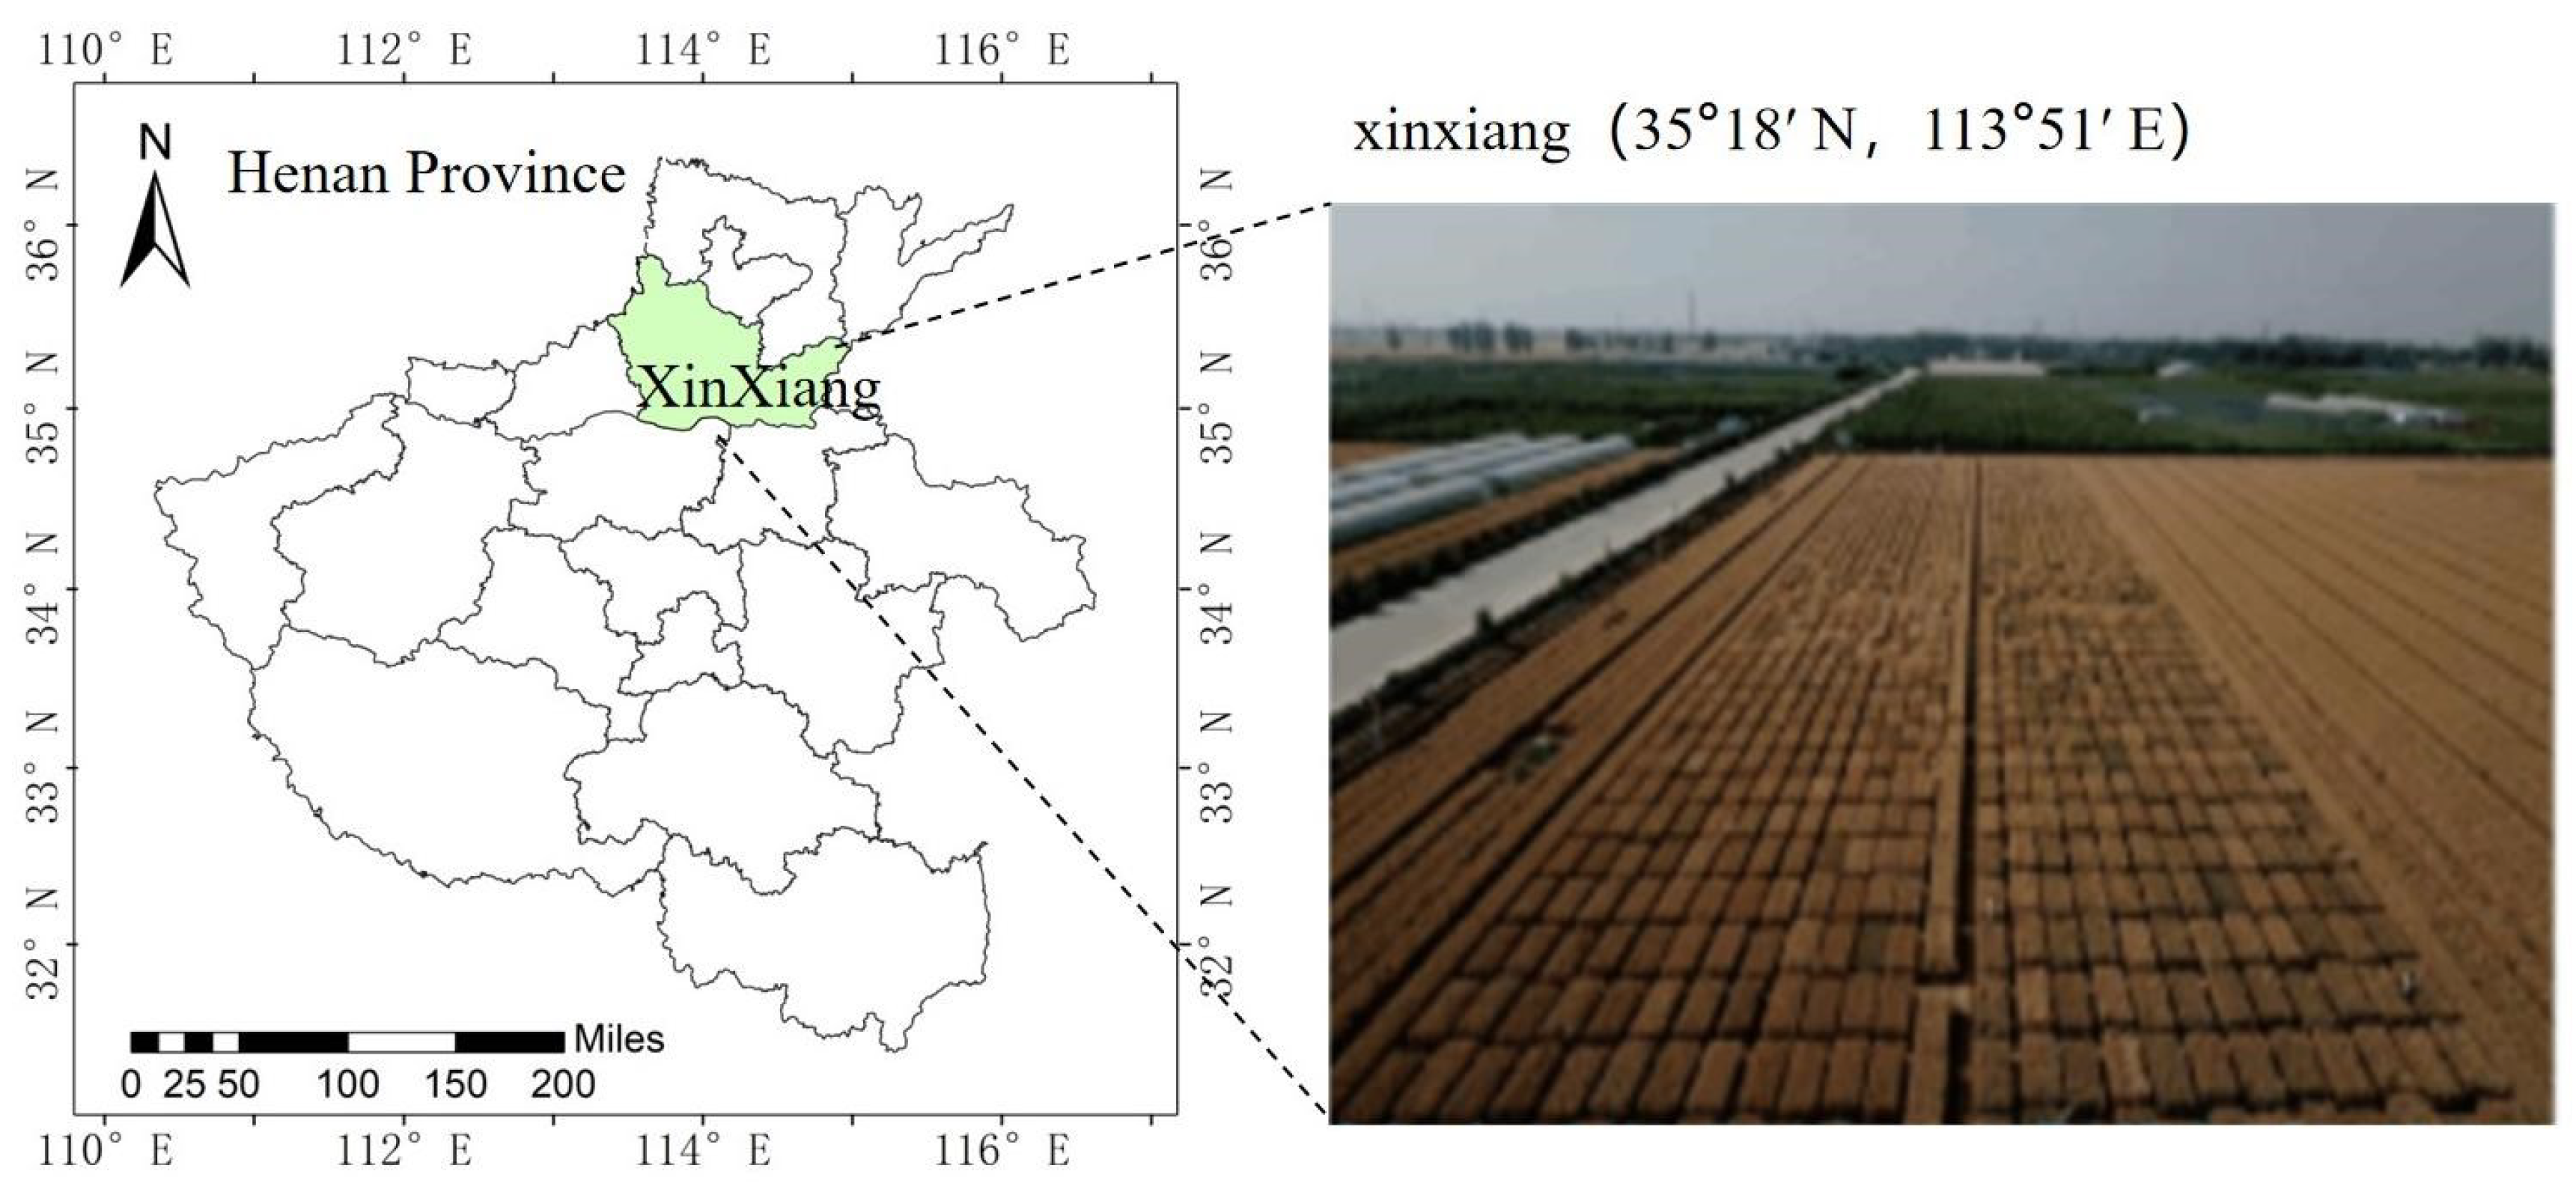
This study was conducted in Xinxiang, Chinese Academy of Agricultural Sciences (35.2°N, 113.8°E) during the 2020-2021 winter wheat growing season, with a plot area of 3.0 m × 1.4 m, with a 0.2 m interval between the left and right sides and 1 m between the front and back of the adjacent plots. Xinxiang City has a mild continental monsoon climate with four distinct seasons, and the seasonal characteristics are obvious. The spring is dry and windy, the summer is hot and rainy, the temperature difference between day and night in autumn is large, the winter is cold, the rain and snow are scarce, the average precipitation and the inequality of distribution are mainly concentrated in June to September, and the annual precipitation generally accounts for about 75% of the national precipitation, which is suitable for the growth of wheat (
Figure 1).
2.2. Hyperspectral data acquisition
Hyperspectral data of wheat canopy were acquired using the Field Spec portable object spectrometer manufactured by Analytica spectra devices, Inc. (ASD) in the United States [
16]. The spectral reflectance data acquisition experiment of wheat canopy was carried out in the flag picking period, flowering stage, grain filling stage and maturity period of wheat, including the key growth period of wheat, the experiment was carried out in sunny or cloudy weather, between 11 am and 12 noon, the cloud cover was less than 20%, in the process of obtaining hyperspectral data, the detector has been in a vertical state, the height of the detector and the canopy is 30 cm, The field of view is 25°, the spectral acquisition band of the instrument is 350 nm~2500 nm, for the measurement of each study area a 40 cm × 40 cm whiteboard was used to reduce the influence of natural light on the spectrum [
17]. Each cell measures 10 spectral curves, and after collecting the data, the data is processed by View Spec Pro software to extract the spectral reflectance, and the spectral reflectance value of the cell is the average of the reflectance of the 10 spectral curves.
2.3. Determination of chlorophyll content
Three samples with uniform growth representing the growth of the whole plot were selected from each experimental area, and the chlorophyll content of the top leaves of each sample was selected and the average value was taken as the chlorophyll content of the experimental area, in this paper, SPSS is mainly used for data processing. Under the same study conditions,
Table 1 showed that the chlorophyll content of different growth stages gradually decreased with the change of development stage from the flag-picking stage to the maturity stage, and the chlorophyll content value was larger at the flag-picking stage, and the chlorophyll content value at the maturity stage was relatively smaller, and the variance was the largest.
2.4. Construction of vegetation index
In hyperspectral data, vegetation information is mainly reflected in the spectral characteristics and changes of plant leaves and canopies, and the vegetation index constructed by using the spectral information obtained by remote sensing technology is widely used in the fields of land cover [
18,
19], vegetation classification, environmental change, crop and feed yield estimation, and drought monitoring in global regions [
20]. In remote sensing, the vegetation index is a combination of spectral reflectance of two or more bands. In this paper, a model of chlorophyll content was established, and five commonly used vegetation indices were selected (
Table 2).
2.5. Modeling Methods
Polynomial Regression (PR) is a special case of linear regression, in which the dimensionality of a variable is converted from nonlinear to linear. This is a way of increasing the number of times on an independent variable, and when we set the number (greater than 1) on an independent variable, we get the result of projecting that data on a higher power space.
Random Forest (RF) is a bagging ensemble method based on a set of decision trees. On this basis, we will introduce a random feature sub on each tree and look for a threshold that is best suited for discrete data. Eventually, many species of trees will be trained, and each tree will have different predictions [
21].
Decision Tree (DT) is a predictive model used to represent the mapping relationship between the attributes of things and the value of things. Each node in the tree represents an object, and the path of each branch represents a possible property, and each leaf node corresponds to the path that this leaf node travels through. In a spanning tree, which characteristics are to be divided, it is usually based on the principle that the purity is maximized after the partition, and if it is a tree, it needs to be pruned to remove nodes that would cause an increase in check errors to avoid overmatching [
22].
Artificial Neural Network (ANN) is a kind of Artificial Neural Network (ANN) that is designed based on the function of the human brain and can be used to solve practical problems. An algorithmic model that can judge the problems of the human brain from the perspective of information processing. The ability to approximate and the information is used to complete the simplest abstract calculations [
23]. The neural network is composed of an input layer, an output layer, and one or more layers of hidden layers, which are given corresponding weights through the connection between neurons, and the weights are continuously adjusted through training and learning algorithms to finally reach the optimum.
2.6. Accuracy evaluation index
By referring to the literature, three indicators were selected for the comprehensive evaluation of the model, which were the deterministic coefficient R², the root mean square error RMSE and the relative error RE. Among the three indicators, the closer the R² value of the coefficient of determination is to 1, The smaller the root mean square error RMSE and the relative error RE are, the higher the accuracy of the model and the more consistent the prediction effect is with the actual situation. The calculation formula is as follows:
where
represents the observed value of the test sample;
represents the estimate of the test sample;
represents the average of the observations of the test sample.
3. Results
Any two wavelength combinations between 400 and 1000 nm were calculated at the flag stage, flowering stage, grain filling stage, and maturity stage of wheat [
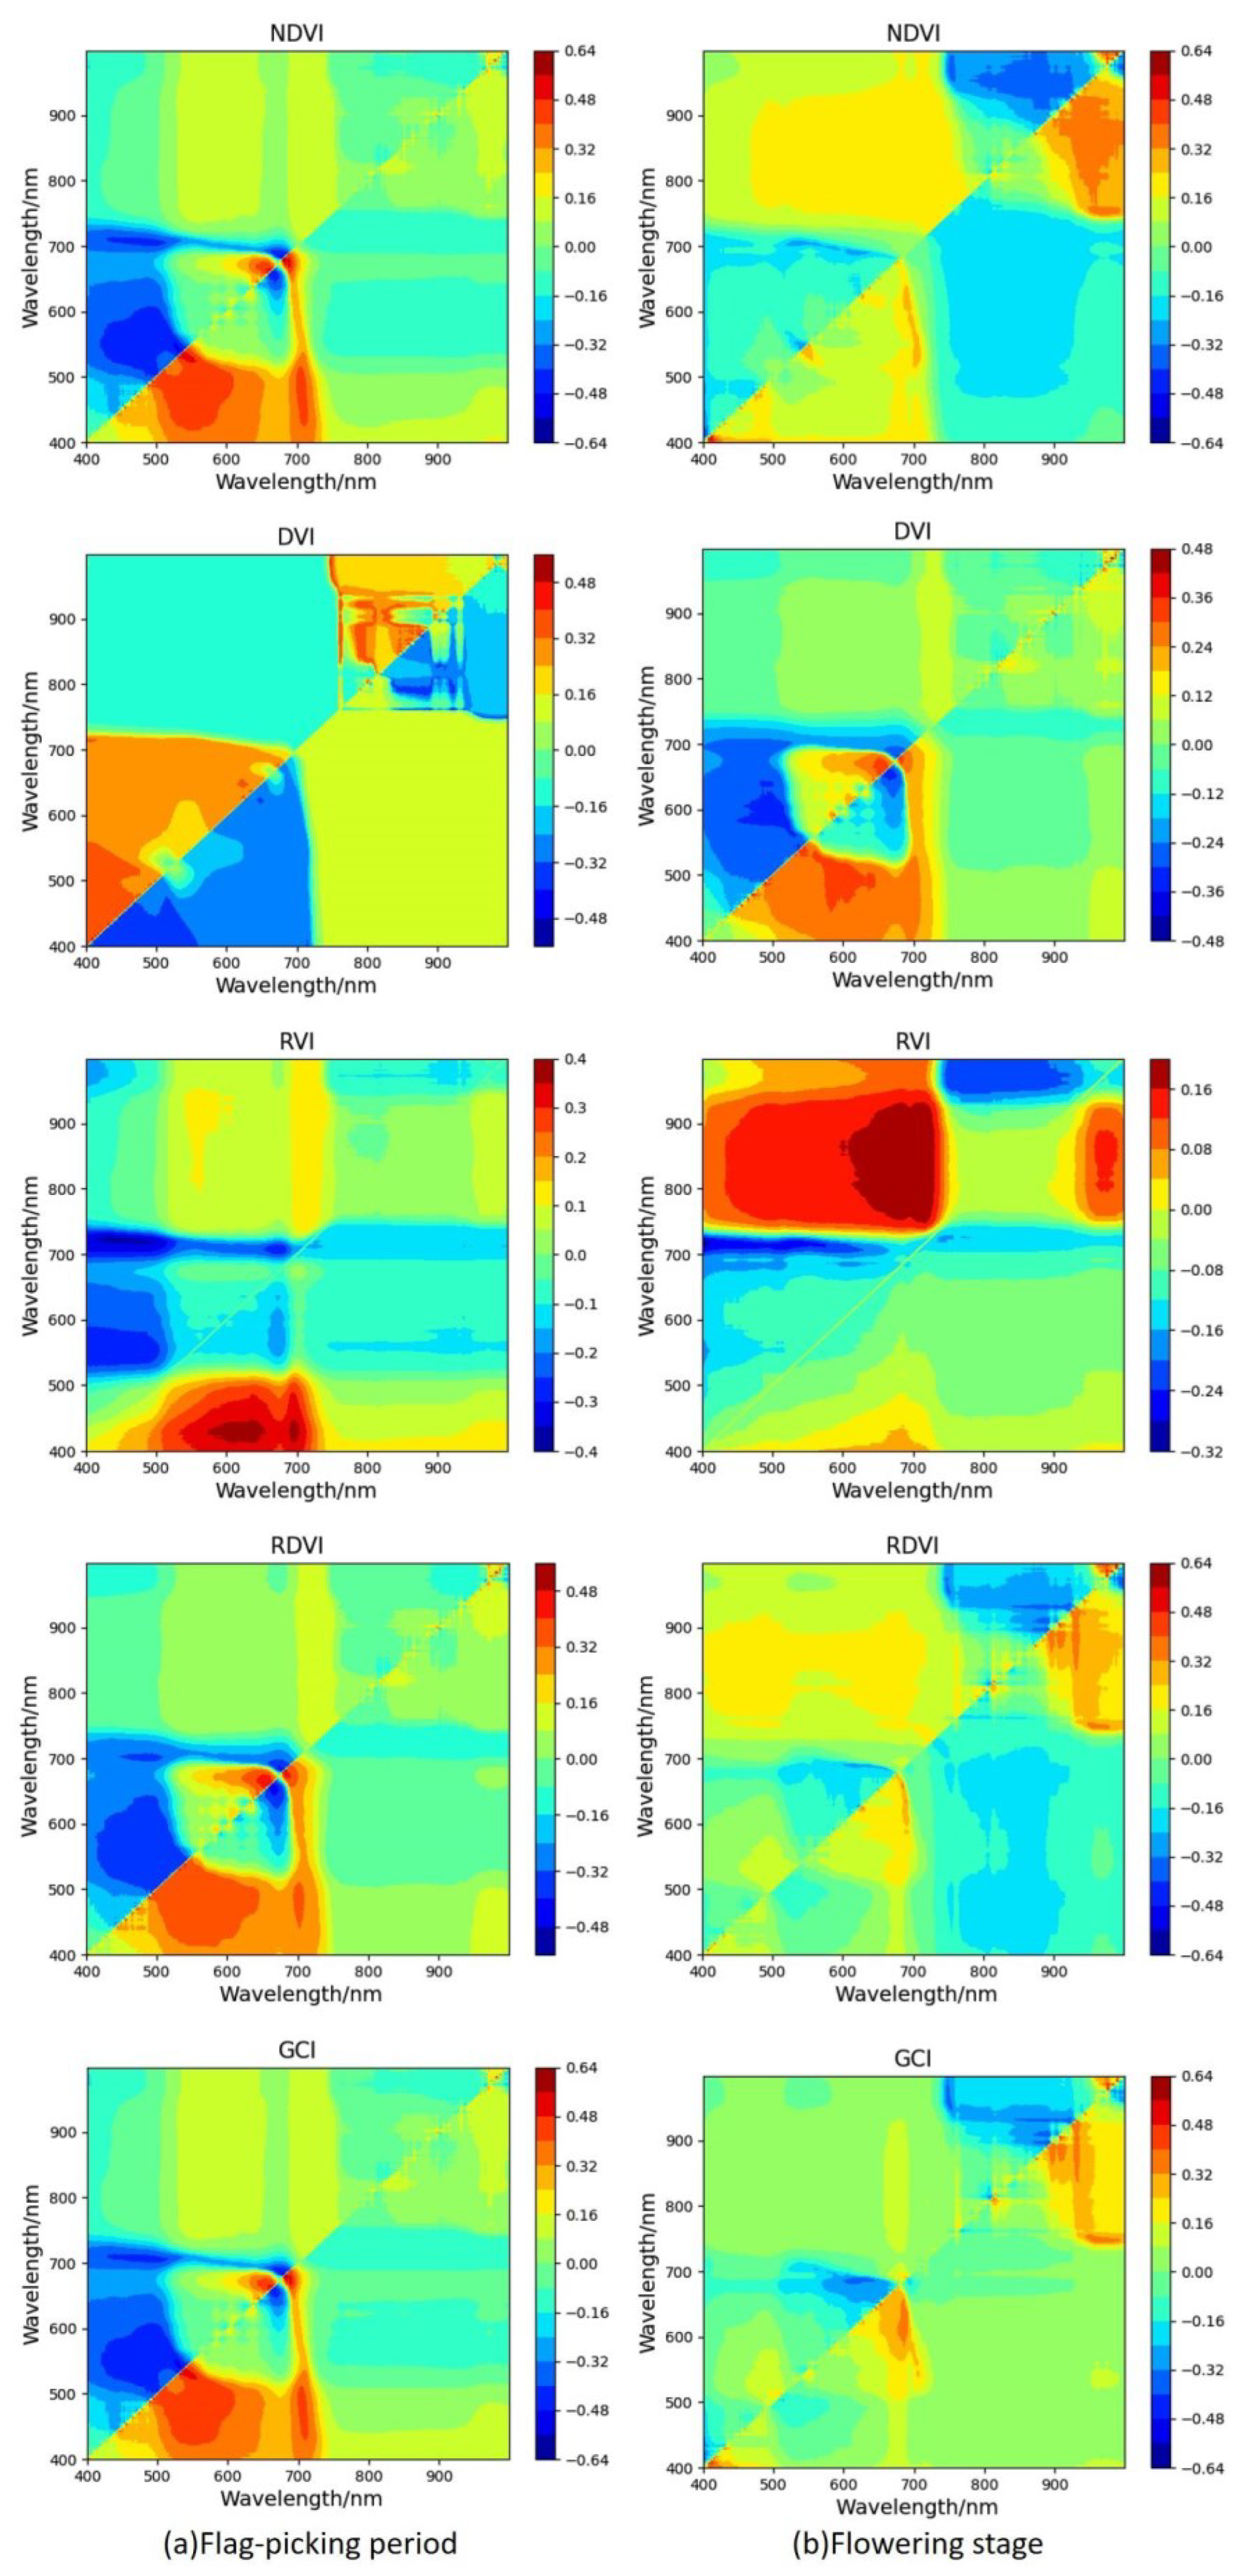
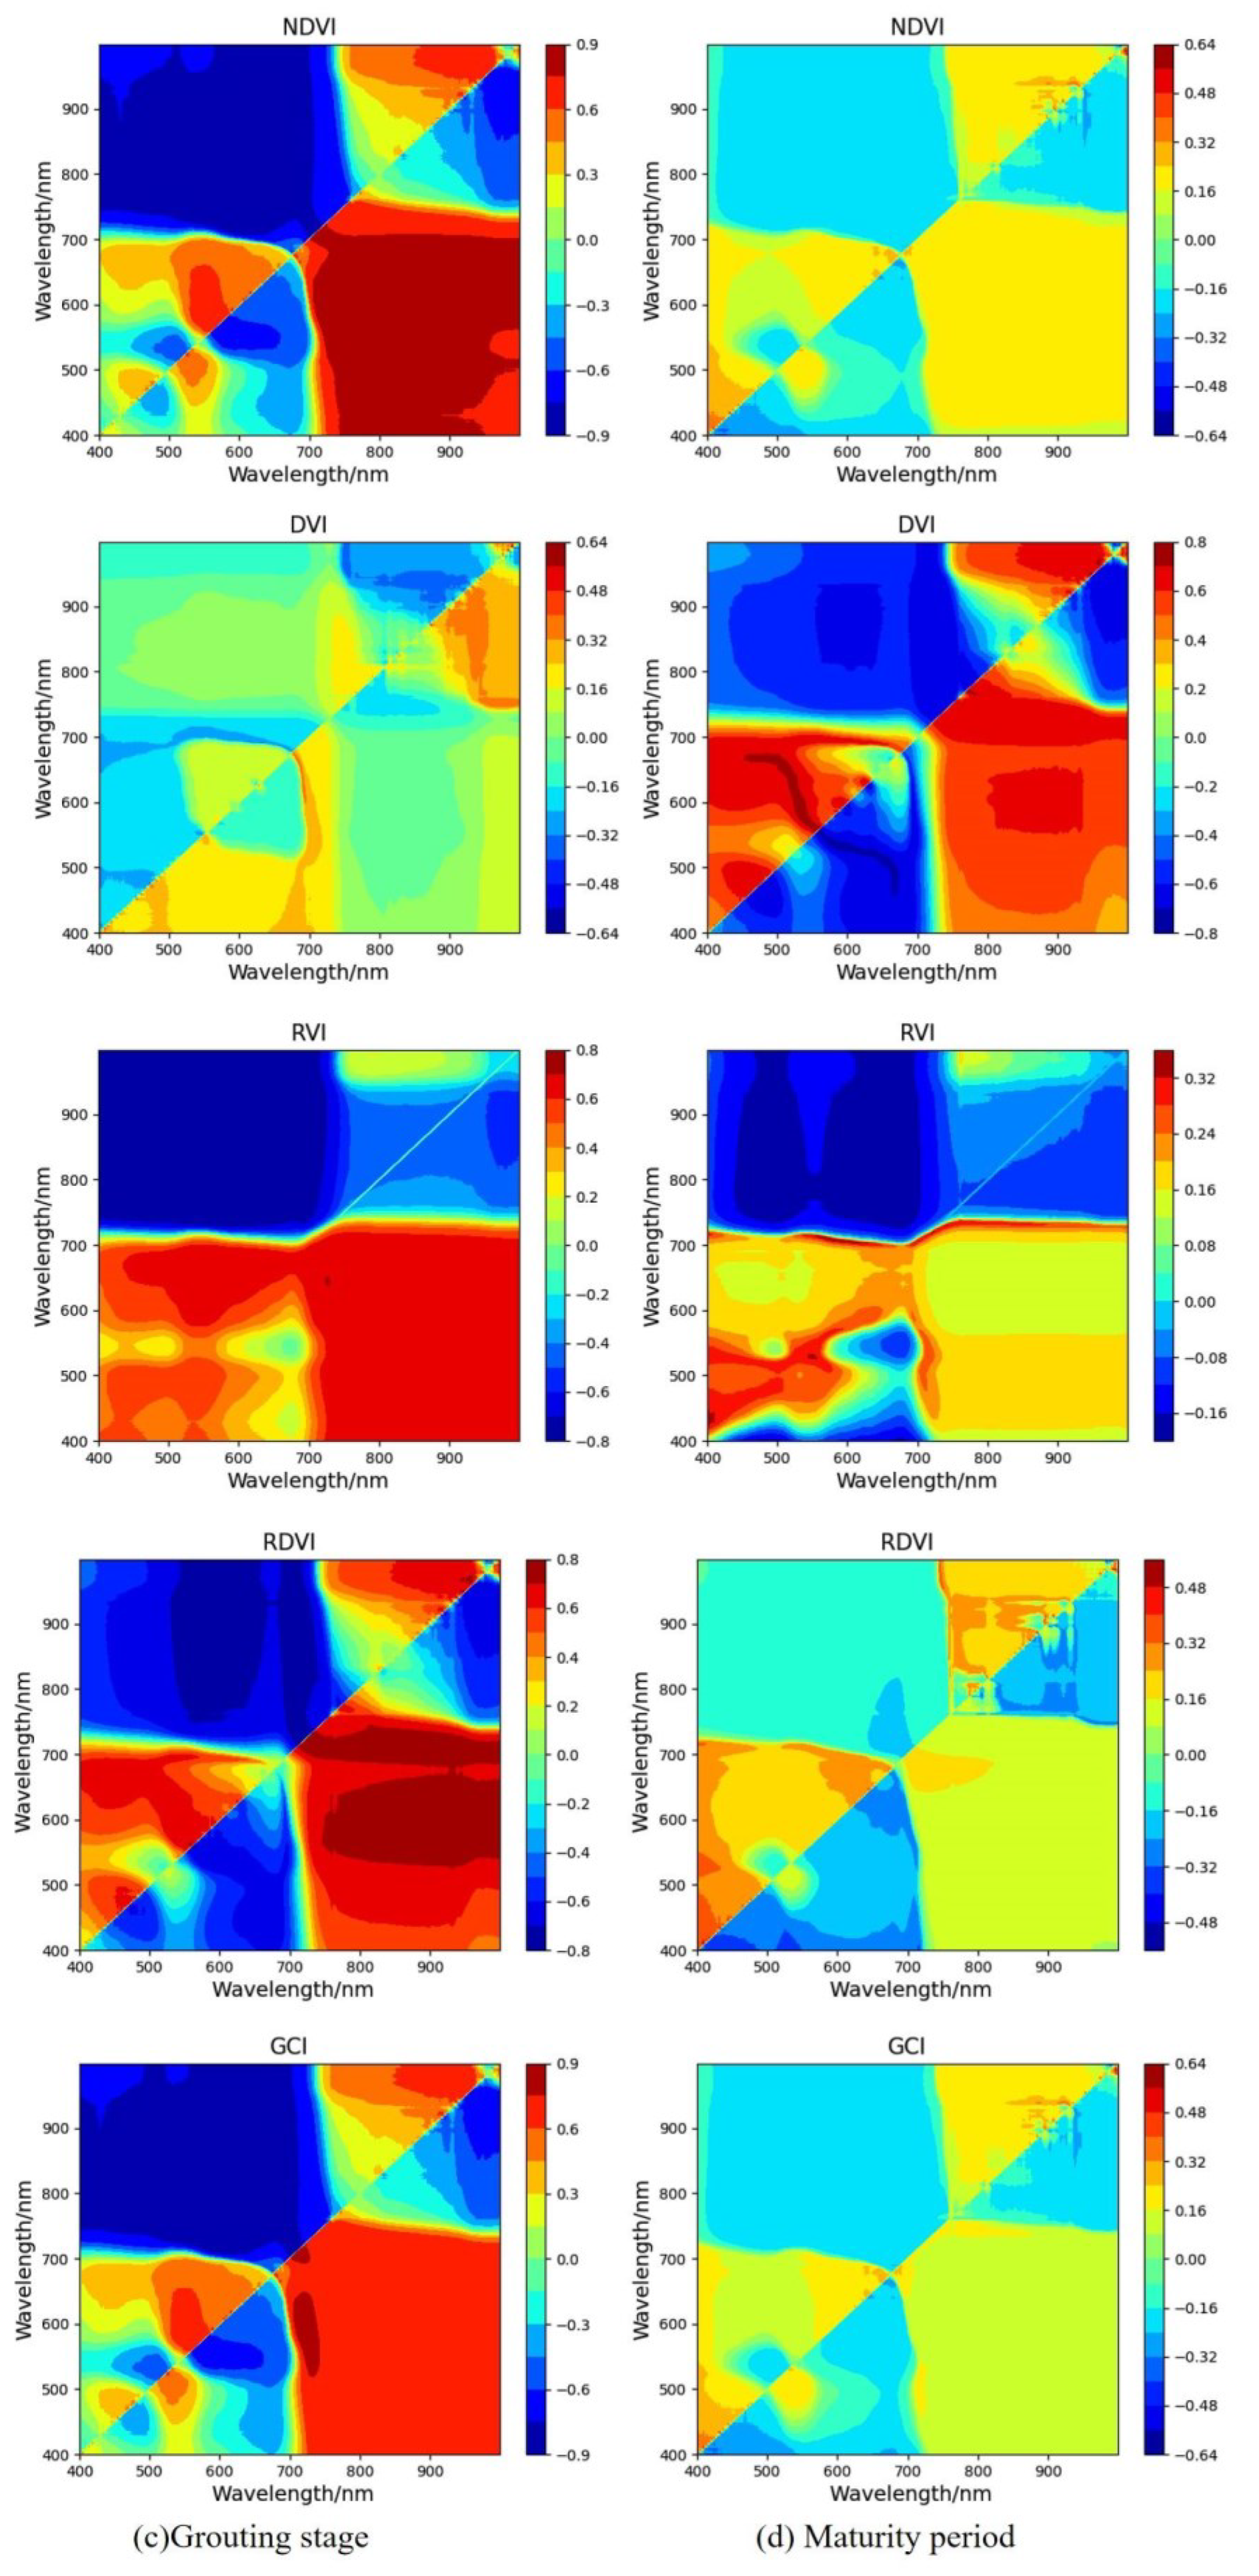
24], and the optimal combination bands of NDVI, DVI, RVI, RDVI and GCI were selected. The correlation coefficients between NDVI, DVI, RVI, RDVI, GCI and wheat chlorophyll content were distributed on two coordinate points of (400,400) and (1000,1000) as diagonal axes, and the two-dimensional correlation analysis of correlation coefficients of wheat during key growth periods was generated.
3.1. Chlorophyll correlation analysis at different growth stages
According to the correlation between vegetation index and chlorophyll content at the flag-picking stage, the two-dimensional matrix was analyzed to determine the optimal combination band, The optimal combination bands of NDVI, DVI, RVI, RDVI and GCI are respectively
、
、
、
and
It can be seen that the correlation coefficients of NDVI, RNDVI and GCI are all greater than 0.5, so we choose the combination of NDVI and GCI with a large correlation coefficient with chlorophyll content during the flag picking period, which can be used for the establishment of the model in the later stage (
Figure 2).
At the flowering stage, the correlation coefficients of NDVI and RDVI can reach more than 0.6, and the correlation of RVI is lower than 0.5, which is not suitable for modeling. NDVI and RDVI were selected as input variables for modeling the chlorophyll content of wheat at flowering stage.
At the grain filling stage, the correlation coefficients of NDVI, RVI and GCI all reached more than 0.6, so we selected the three vegetation indices of NDVI, RVI and GCI as the optimal vegetation indices of wheat chlorophyll content at the grain filling stage, which were used to establish the model.
At maturity, the correlation coefficients of NDVI (989,996), DVI (403,401), RVI (576,709), RDVI (493,401) and GCI (989,996) were -0.588, -0.532, -0.344, -0.550 and -0.588, respectively. Through the analysis, it can be seen that the correlation coefficients of NDVI, DVI, RDVI and GCI all reached 0.5, so the two vegetation indices of NDVI and GCI were selected for the construction of the later model at the maturity stage. According to the correlation analysis, the vegetation index with high correlation was selected to construct the model,
Table 3 shows the selection of independent variables.
3.2. Modeling results and analysis
Through the above correlation analysis, the optimal vegetation index with a good correlation with chlorophyll content was determined, in which 80% of the data were used for modeling, 20% of the data were used for verification, and the modeling accuracy verification set models R², RMSE and RE are shown in
Table 4.
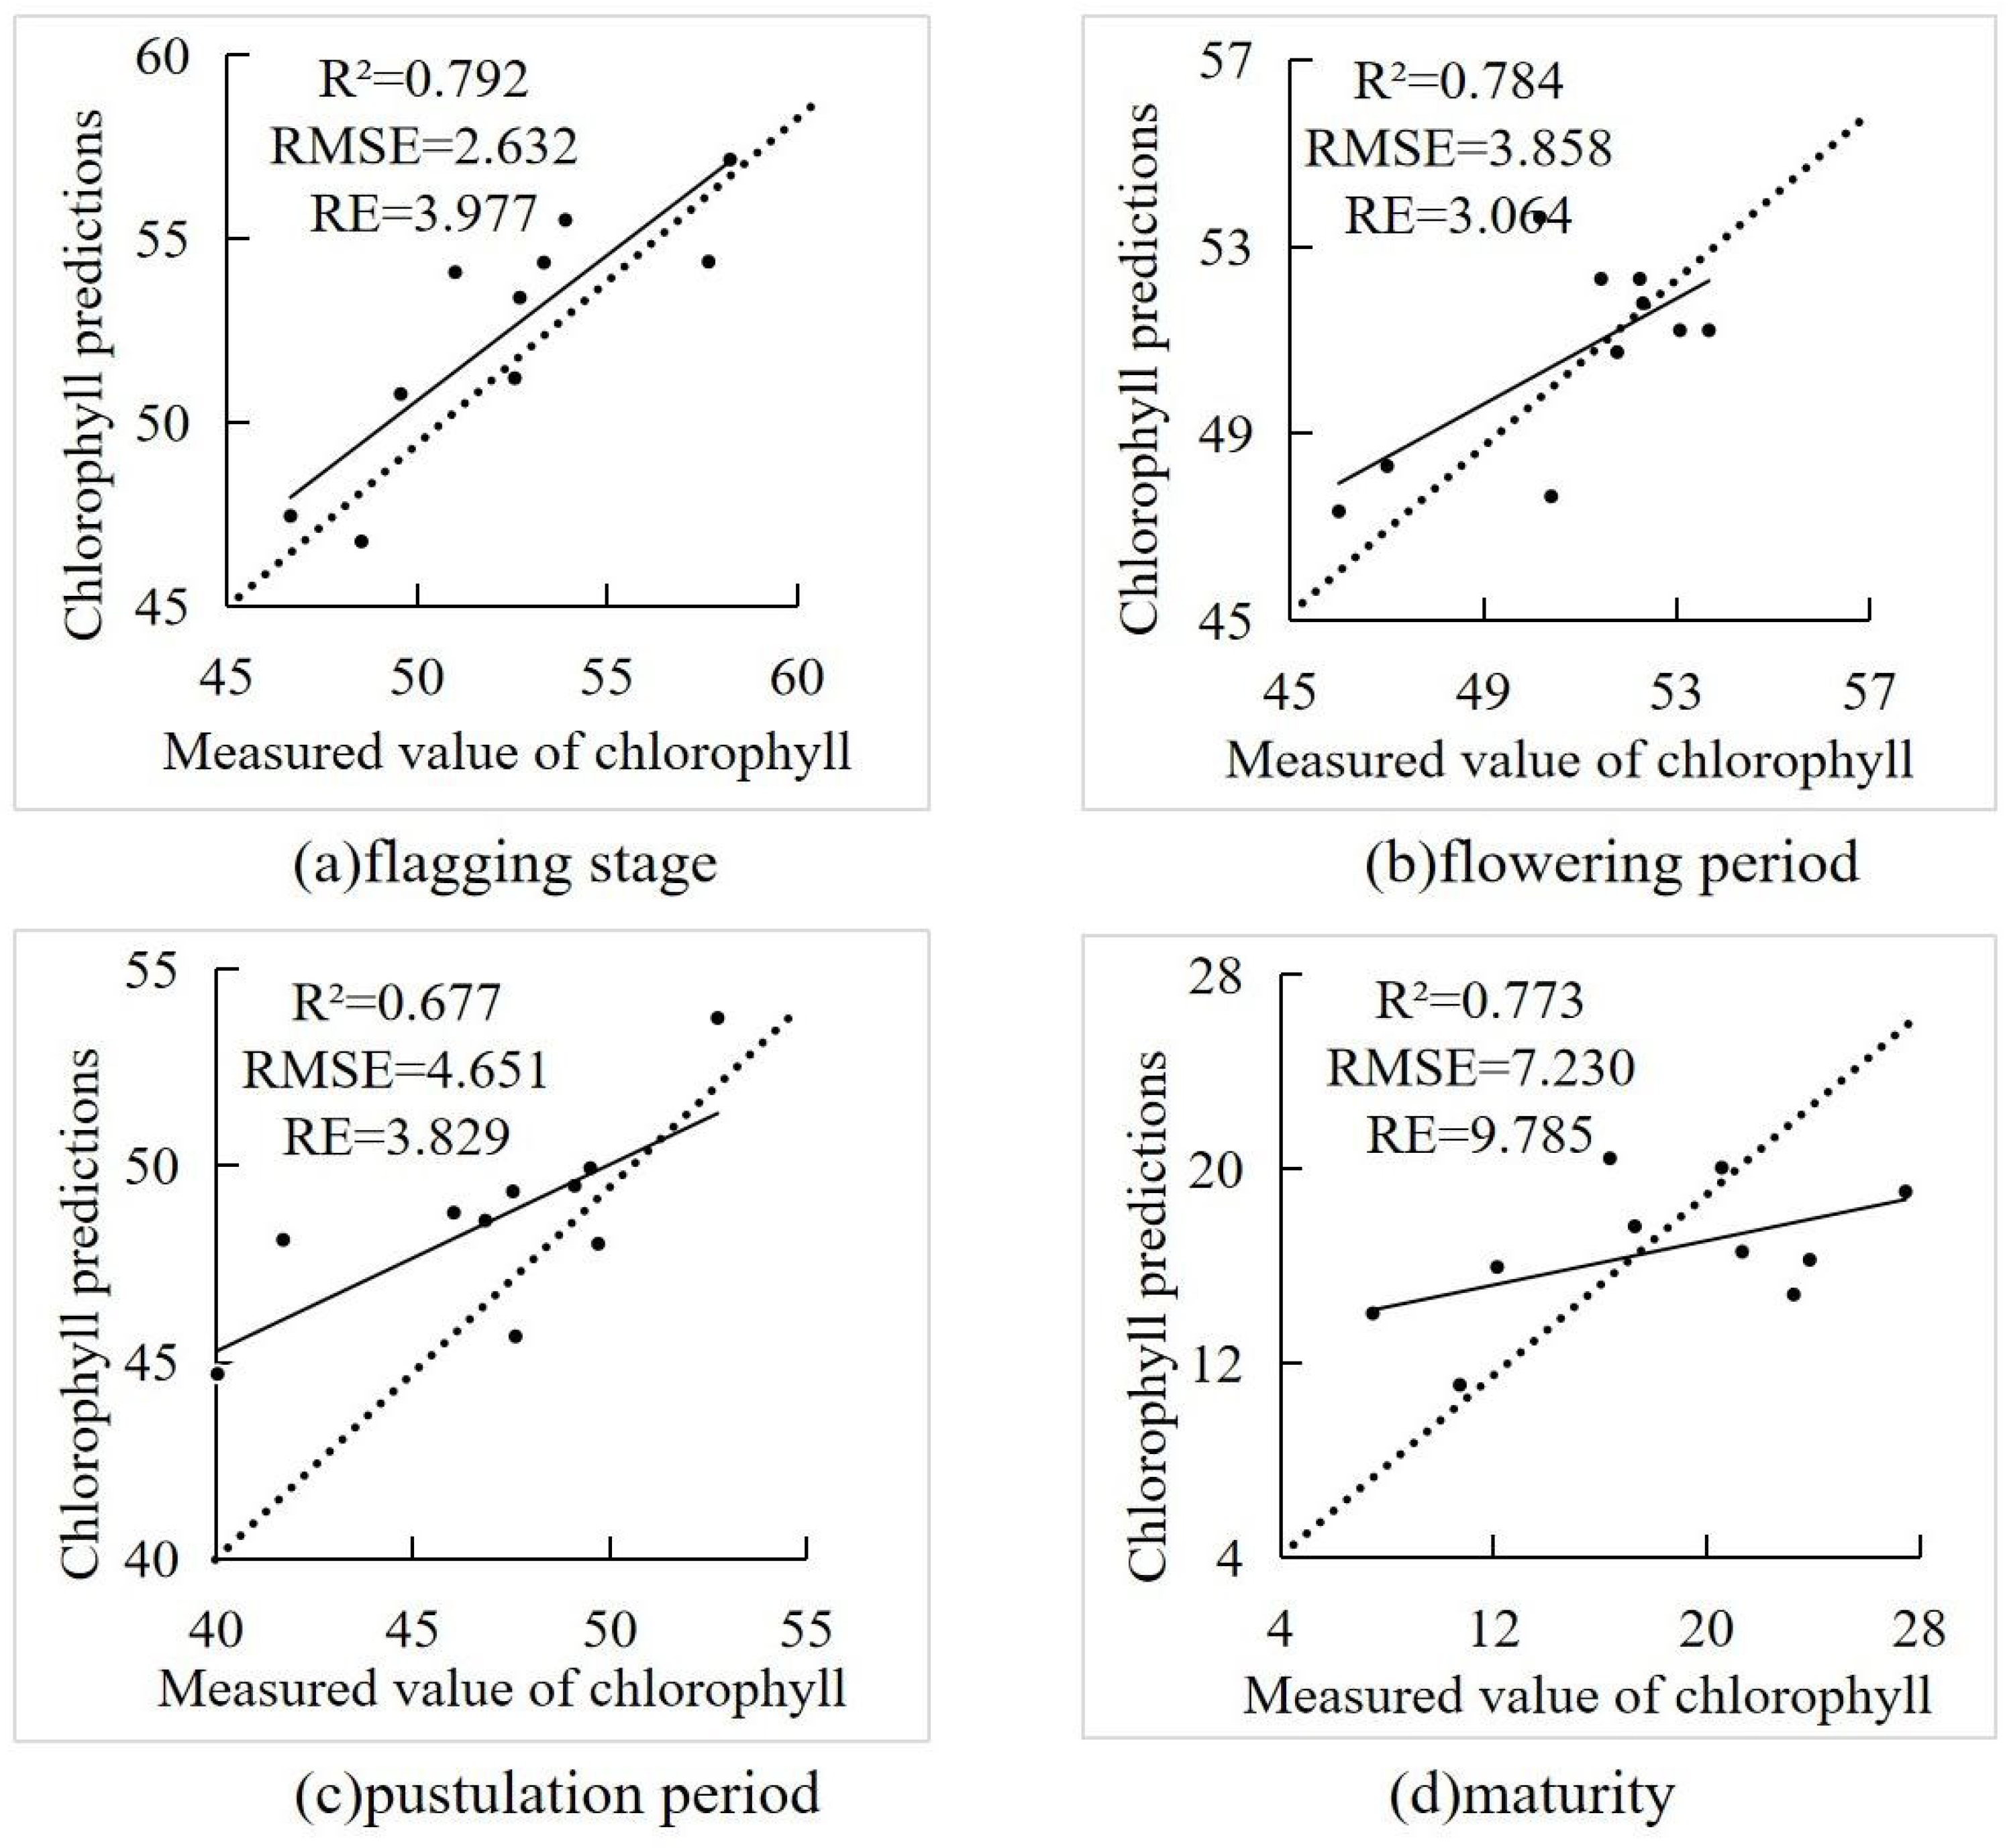
In the flag picking period, combined with polynomial regression, random forest, decision tree and artificial neural network modeling, the R², RMSE and RE of polynomial regression modeling were 0.792, 2.632 and 3.977, respectively. Compared with random forest, decision tree and artificial neural network, the R² is increased by 0.472, 0.274 and 0.255, respectively. the best model validation results are shown in
Figure 3a.
The R², RMSE and RE of random forest modeling at flowering stage were respectively 0.784, 3.858 and 3.064, compared with polynomial regression, decision tree and artificial neural network modeling, the R² increased by 0.102, 0.564 and 0.310, respectively, and RE decreased by 2.791 and 0.984 compared with polynomial regression and artificial neural network models, respectively, and the model validation results are shown in
Figure 3b.
During the filling period, the R², RMSE and RE of random forest modeling were respectively 0.677, 4.651 and 3.829, which are 0.061 higher than the artificial neural network R², RE decreased by 4.414, 0.520 and 1.088 for multinomial regression, decision tree and artificial neural network, respectively, and the model validation results are shown in
Figure 3c.
At maturity stage, the R², RMSE and RE of artificial neural network model for chlorophyll content estimation were 0.773, 7.230 and 9.785, respectively. the modeling R² of polynomial regression, random forest and decision tree increased by 0.402, 0.524 and 0.09, respectively, and the RMSE decreased by 1.146, 1.696 and 1.432, respectively, and the model validation results are shown in
Figure 3d.
4. Discussion
Chlorophyll content is closely related to crop nutritional status and growth status, and is a key indicator to measure crop productivity. Accurate obtaining of crop chlorophyll value is of great significance for crop growth monitoring and yield estimation [
25]. In this study, hyperspectral non-imaging data were used as the data source to estimate the chlorophyll content of wheat leaves at different growth stages by optimizing the existing vegetation index, and to explore the potential of hyperspectral data at different growth stages in estimating the chlorophyll content of wheat leaves. Hyperspectral data has abundant spectral band information, and its temporal and spatial resolution has been greatly improved compared with the previous data used to estimate chlorophyll content or other vegetation physiological parameters, which provides the possibility of fine monitoring of crop physiological parameters.
Previous studies have shown that the construction of an optimized spectral index can effectively reduce the interference of external environmental factors, accurately identify the sensitive bands of crop growth parameters, and significantly improve the monitoring accuracy and robustness of crop nitrogen, chlorophyll, and leaf area indices [
26]. Therefore, in this study, preferred spectral indices and machine learning models were used to estimate the chlorophyll value of wheat leaves, which offset the noise caused by environmental changes to varying degrees, improved the accuracy of model estimation, and the constructed model had strong universality in different regions. In addition, the data of this study are based on samples of different growth stages, but the constructed optimized spectral index has not been validated in different environments and years. In order to improve the robustness and generalization ability of the model, the applicability of different wheat varieties needs to be further tested.
5. Conclusions
In this study, the correlation matrix method was used to optimize the spectral index in the 400~1000nm band, and it was found that the optimal spectral index was highly correlated with the chlorophyll content of wheat at different growth stages, and the correlation between the chlorophyll content of wheat at the grain filling stage was the highest. The accuracy of the chlorophyll content prediction model constructed by RF method at flowering and irrigation stage was significantly higher than that of DT and ANN methods. The flag picking period is the best growth period for chlorophyll content prediction, and the accuracy R² of the validation set is 0.792, and the PR method is the best method for model construction.
Author Contributions
G.G.: Methodology, Formal analysis, Writing—original draft, Visualization. L.Z.: Methodology, Software. L.W.: Data curation, Writing—review and editing, Formal analysis. D.Y.: Supervision, Writing—review and editing, Funding acquisition, Data curation, Supervision, Project administration. All authors have read and agreed to the published version of the manuscript.
Funding
This study was supported by the National Natural Science Foundation of China (No. 52174160)
Data Availability Statement
Not applicable.
Conflicts of Interest
The authors declare no conflict of interest.
References
- Zhang, J.; Han, W.; Huang, L.; Zhang, Z.; Ma, Y.; Hu, Y. Leaf Chlorophyll Content Estimation of Winter Wheat Based on Visible and Near-Infrared Sensors. Sensors 2016, 16, 437. [Google Scholar] [CrossRef]
- Wang, T.; Gao, M.; Cao, C.; You, J.; Zhang, X.; Shen, L. Winter Wheat Chlorophyll Content Retrieval Based on Machine Learning Using in Situ Hyperspectral Data. Computers and Electronics in Agriculture 2022, 193, 106728. [Google Scholar] [CrossRef]
- Bai, X.; Song, Y.; Yu, R.; Xiong, J.; Peng, Y.; Jiang, Y.; Guijun, Y.; Li, Z.; Zhu, X. Hyperspectral Estimation of Apple Canopy Chlorophyll Content Using an Ensemble Learning Approach. Applied Engineering in Agriculture 2021, 37, 505–511. [Google Scholar] [CrossRef]
- Estimation of Chlorophyll Content in Potato Leaves Based on Spectral Red Edge Position. IFAC-PapersOnLine 2018, 51, 602–606. [CrossRef]
- Simic Milas, A.; Romanko, M.; Reil, P.; Abeysinghe, T.; Marambe, A. The Importance of Leaf Area Index in Mapping Chlorophyll Content of Corn under Different Agricultural Treatments Using UAV Images. International Journal of Remote Sensing 2018, 39, 5415–5431. [Google Scholar] [CrossRef]
- Schlemmer, M.R.; Francis, D.D.; Shanahan, J.F.; Schepers, J.S. Remotely Measuring Chlorophyll Content in Corn Leaves with Differing Nitrogen Levels and Relative Water Content. Agronomy Journal 2005, 97, 106–112. [Google Scholar] [CrossRef]
- Shen, L.; Gao, M.; Yan, J.; Wang, Q.; Shen, H. Winter Wheat SPAD Value Inversion Based on Multiple Pretreatment Methods. Remote Sensing 2022, 14, 4660. [Google Scholar] [CrossRef]
- Shuang, L.I.U.; Hai-ye, Y.U.; Jun-he, Z.; Hai-gen, Z.; Li-juan, K.; Lei, Z.; Jing-min, D.; Yuan-yuan, S.U.I. Study on Inversion Model of Chlorophyll Content in Soybean Leaf Based on Optimal Spectral Indices. gpxygpfx 2021, 41, 1912. [Google Scholar] [CrossRef]
- Qiao, L.; Tang, W.; Gao, D.; Zhao, R.; An, L.; Li, M.; Sun, H.; Song, D. UAV-Based Chlorophyll Content Estimation by Evaluating Vegetation Index Responses under Different Crop Coverages. Computers and Electronics in Agriculture 2022, 196, 106775. [Google Scholar] [CrossRef]
- Jia, F.; Liu, G.; Liu, D.; Zhang, Y.; Fan, W.; Xing, X. Comparison of Different Methods for Estimating Nitrogen Concentration in Flue-Cured Tobacco Leaves Based on Hyperspectral Reflectance. Field Crops Research 2013, 150, 108–114. [Google Scholar] [CrossRef]
- Xu, Y.; Tu, K.; Cheng, Y.; Hou, H.; Cao, H.; Dong, X.; Sun, Q. Application of Digital Image Analysis to the Prediction of Chlorophyll Content in Astragalus Seeds. Applied Sciences 2021, 11, 8744. [Google Scholar] [CrossRef]
- Chlorophyll Content Estimation Based on Cascade Spectral Optimizations of Interval and Wavelength Characteristics. Computers and Electronics in Agriculture 2021, 189, 106413. [CrossRef]
- Yao, C.; lu, S.; Sun, Z. Estimation of Leaf Chlorophyll Content with Polarization Measurements: Degree of Linear Polarization. Journal of Quantitative Spectroscopy and Radiative Transfer 2020, 242, 1–11. [Google Scholar] [CrossRef]
- Progress of Hyperspectral Data Processing and Modelling for Cereal Crop Nitrogen Monitoring. Computers and Electronics in Agriculture 2020, 172, 105321. [CrossRef]
- Liu, N.; Xing, Z.; Zhao, R.; Qiao, L.; Li, M.; Liu, G.; Sun, H. Analysis of Chlorophyll Concentration in Potato Crop by Coupling Continuous Wavelet Transform and Spectral Variable Optimization. Remote Sensing 2020, 12, 2826. [Google Scholar] [CrossRef]
- Yang, F.; Fan, Y.M.; Li, J.L.; Qian, Y.R.; Wang, Y.; Zhang, J. Estimating LAI and CCD of Rice and Wheat Using Hyperspectral Remote Sensing Data. Nongye Gongcheng Xuebao/Transactions of the Chinese Society of Agricultural Engineering 2010, 26, 237–243. [Google Scholar] [CrossRef]
- Malenovský, Z.; Homolová, L.; Zurita-Milla, R.; Lukeš, P.; Kaplan, V.; Hanuš, J.; Gastellu-Etchegorry, J.-P.; Schaepman, M.E. Retrieval of Spruce Leaf Chlorophyll Content from Airborne Image Data Using Continuum Removal and Radiative Transfer. Remote Sensing of Environment 2013, 131, 85–102. [Google Scholar] [CrossRef]
- Broge, N.H.; Mortensen, J.V. Deriving Green Crop Area Index and Canopy Chlorophyll Density of Winter Wheat from Spectral Reflectance Data. Remote Sensing of Environment 2002, 81, 45–57. [Google Scholar] [CrossRef]
- Darvishzadeh, R.; Skidmore, A.; Schlerf, M.; Atzberger, C.; Corsi, F.; Cho, M. LAI and Chlorophyll Estimation for a Heterogeneous Grassland Using Hyperspectral Measurements. ISPRS Journal of Photogrammetry and Remote Sensing 2008, 63, 409–426. [Google Scholar] [CrossRef]
- Curran, P.J.; Dungan, J.L.; Peterson, D.L. Estimating the Foliar Biochemical Concentration of Leaves with Reflectance Spectrometry: Testing the Kokaly and Clark Methodologies. Remote Sensing of Environment 2001, 76, 349–359. [Google Scholar] [CrossRef]
- Chen, X.; Li, F.; Shi, B.; Fan, K.; Li, Z.; Chang, Q. Estimation of Winter Wheat Canopy Chlorophyll Content Based on Canopy Spectral Transformation and Machine Learning Method. Agronomy 2023, 13, 783. [Google Scholar] [CrossRef]
- Zhang, W.; Wang, X.; Pan, Q.; Xie, J.; Zhang, J.; Meng, P. Hyperspectral Response Characteristics and Chlorophyll Content Estimation of Phyllostachys Violascens Leaves under Drought Stress. Shengtai Xuebao/ Acta Ecologica Sinica 2018, 38, 6677–6684. [Google Scholar] [CrossRef]
- Rasooli Sharabiani, V.; Soltani Nazarloo, A.; Taghinezhad, E.; Veza, I.; Szumny, A.; Figiel, A. Prediction of Winter Wheat Leaf Chlorophyll Content Based on VIS/NIR Spectroscopy Using ANN and PLSR. Food Science & Nutrition 2023, 11, 2166–2175. [Google Scholar] [CrossRef]
- Li, P.; Huang, X.; Yin, S.; Bao, Y.; Bao, G.; Tong, S.; Dashzeveg, G.; Nanzad, T.; Dorjsuren, A.; Enkhnasan, D.; et al. Optimizing Spectral Index to Estimate the Relative Chlorophyll Content of the Forest under the Damage of Erannis Jacobsoni Djak in Mongolia. Ecological Indicators 2023, 154, 110714. [Google Scholar] [CrossRef]
- Liu, G.; Yang, J.; Xu, H.; Zhu, J. Influence of Epistasis and QTL × Environment Interaction on Heading Date of Rice (Oryza Sativa L.). Journal of Genetics and Genomics 2007, 34, 608–615. [Google Scholar] [CrossRef] [PubMed]
- Xie, Q.; Huang, W.; Zhang, B.; Chen, P.; Song, X.; Pascucci, S.; Pignatti, S.; Laneve, G.; Dong, Y. Estimating Winter Wheat Leaf Area Index From Ground and Hyperspectral Observations Using Vegetation Indices. IEEE Journal of Selected Topics in Applied Earth Observations and Remote Sensing 2016, 9, 771–780. [Google Scholar] [CrossRef]
|
Disclaimer/Publisher’s Note: The statements, opinions and data contained in all publications are solely those of the individual author(s) and contributor(s) and not of MDPI and/or the editor(s). MDPI and/or the editor(s) disclaim responsibility for any injury to people or property resulting from any ideas, methods, instructions or products referred to in the content. |
© 2023 by the authors. Licensee MDPI, Basel, Switzerland. This article is an open access article distributed under the terms and conditions of the Creative Commons Attribution (CC BY) license (http://creativecommons.org/licenses/by/4.0/).


