1. Introduction
The growing demand for eco-friendly energy sources, driven by advancements in technology, burgeoning populations, and the urgent need to combat environmental pollution, has led to the increased exploration of alternative energy options often termed “green energy” [
1,
2,
3]. Among these alternatives, hydrogen and solar energy have emerged as prominent solutions [
4,
5,
6,
7,
8,
9]. Central to the production of hydrogen is the proton exchange membrane electrolyzer cell (PEMEC), a key contender in the realm of sustainable energy generation. This setup, characterized by two compartments for the anode and cathode separated by a polymer membrane featuring porous transport layers (PTLs), enables the efficient conversion of water into hydrogen and oxygen gases. Operating at high current densities is vital for achieving substantial hydrogen generation rates, yet it poses significant challenges, particularly concerning mass transport limitations that can contribute up to 25% of the entire electrolyzer overpotential [
10].
Effective design strategies that mitigate mass transfer losses are essential for optimal PEMEC performance. Within contemporary PEM electrolyzer systems, the flow of reactant liquid and product gas through the PTL introduces complexities, as the by-product oxygen gases generated at the anode catalyst layer tend to obstruct the reaction sites, impeding the flow of reactant water [
10]. Understanding the behaviour of oxygen bubbles within the PTL is crucial, given their potential impacts on the electrolyzer’s performance. Several studies have examined the influence of various PTL characteristics, including fibre dimensions, porosity, and pore width, on cell performance [
12,
13,
14,
15,
16,
17,
18]. These investigations have provided valuable insights into the intricate dynamics of mass transportation within the PTL, emphasizing the critical role of PTL characteristics in optimizing PEMEC efficiency.
The challenges associated with visualizing and comprehending the complex two-phase flow within the PTL have prompted the development of advanced modelling techniques to improve our understanding of the transport phenomena in PEMEC devices [
17]. Recent research has leveraged neutron radiography and X-ray imaging to analyse water and gas distribution within the PTL structure, shedding light on critical aspects of water content and mass transport behaviour [
15,
16,
22]. These studies have offered crucial insights into the mechanisms governing mass transport within the PTL, facilitating the development of effective strategies to mitigate mass transport losses and enhance electrolyzer performance.
Efficient elimination of oxygen bubbles within the PTL is essential for optimizing hydrogen production, enhancing catalyst utilization, prolonging membrane life, and ensuring system stability, all vital for numerous applications, including green energy storage, fuel cell systems, and industrial processes. Understanding the effects of oxygen bubble blockage within the PTL, including mass transport limitations, reduced gas diffusion, increased resistance, catalyst deactivation, and issues with PEM hydration, is paramount for developing effective mitigation strategies and enhancing the overall performance of PEMECs.
In addressing these challenges, the present study introduces a novel numerical model to analyse the concentration of oxygen within the PTL, employing a sophisticated three-dimensional, two-phase mixture model with time-dependent thermophysical properties. By contrasting the transport characteristics of the advanced model with a simplified homogeneous porous media approach, this study contributes to the comprehensive understanding of effective diffusivity in porous media, offering valuable insights into transport phenomena within complex porous structures. While simplified models are often employed for their computational efficiency, the proposed model aims to bridge the gap between complex porous structures and effective transport features, contributing to a more nuanced understanding of transport phenomena within PEM electrolyzer systems.
2. Model and Physics Description
The Polymer Electrolyte Membrane Electrolyzer Cell (PEMEC) plays a pivotal role in the production of oxygen within the porous transport layers of the PEM Electrolyzer. Within the PEMEC, comprising distinct anode and cathode compartments, the electrolysis process initiates as water enters the anode side and undergoes consumption, resulting in the generation of oxygen gas. Meanwhile, protons traverse through a Nafion membrane, congregating at the cathode side where hydrogen gas is produced and accumulated.
In our investigation, the primary focus centers on the comprehensive analysis of the intricate oxygen production mechanisms operating within the electrolyzer. This analysis is facilitated by the utilization of the reaction equation presented below, elucidating the fundamental conversion dynamics at play:
In addition to the production of oxygen gas as illustrated in Equation (1), the intricate interplay of proton transport at the electrode surface and Porous Transport Layer (PTL) interactions leads to a discernible net mass outflux, adding to the complexity of the electrolysis process. Our study endeavors to unravel the underlying dynamics of these processes, offering a comprehensive understanding of the oxygen production mechanisms within the PEM Electrolyzer.
The presented research entails the geometric modeling and numerical simulation of an engineered homogeneous porous media employing the powerful COMSOL Multiphysics software.
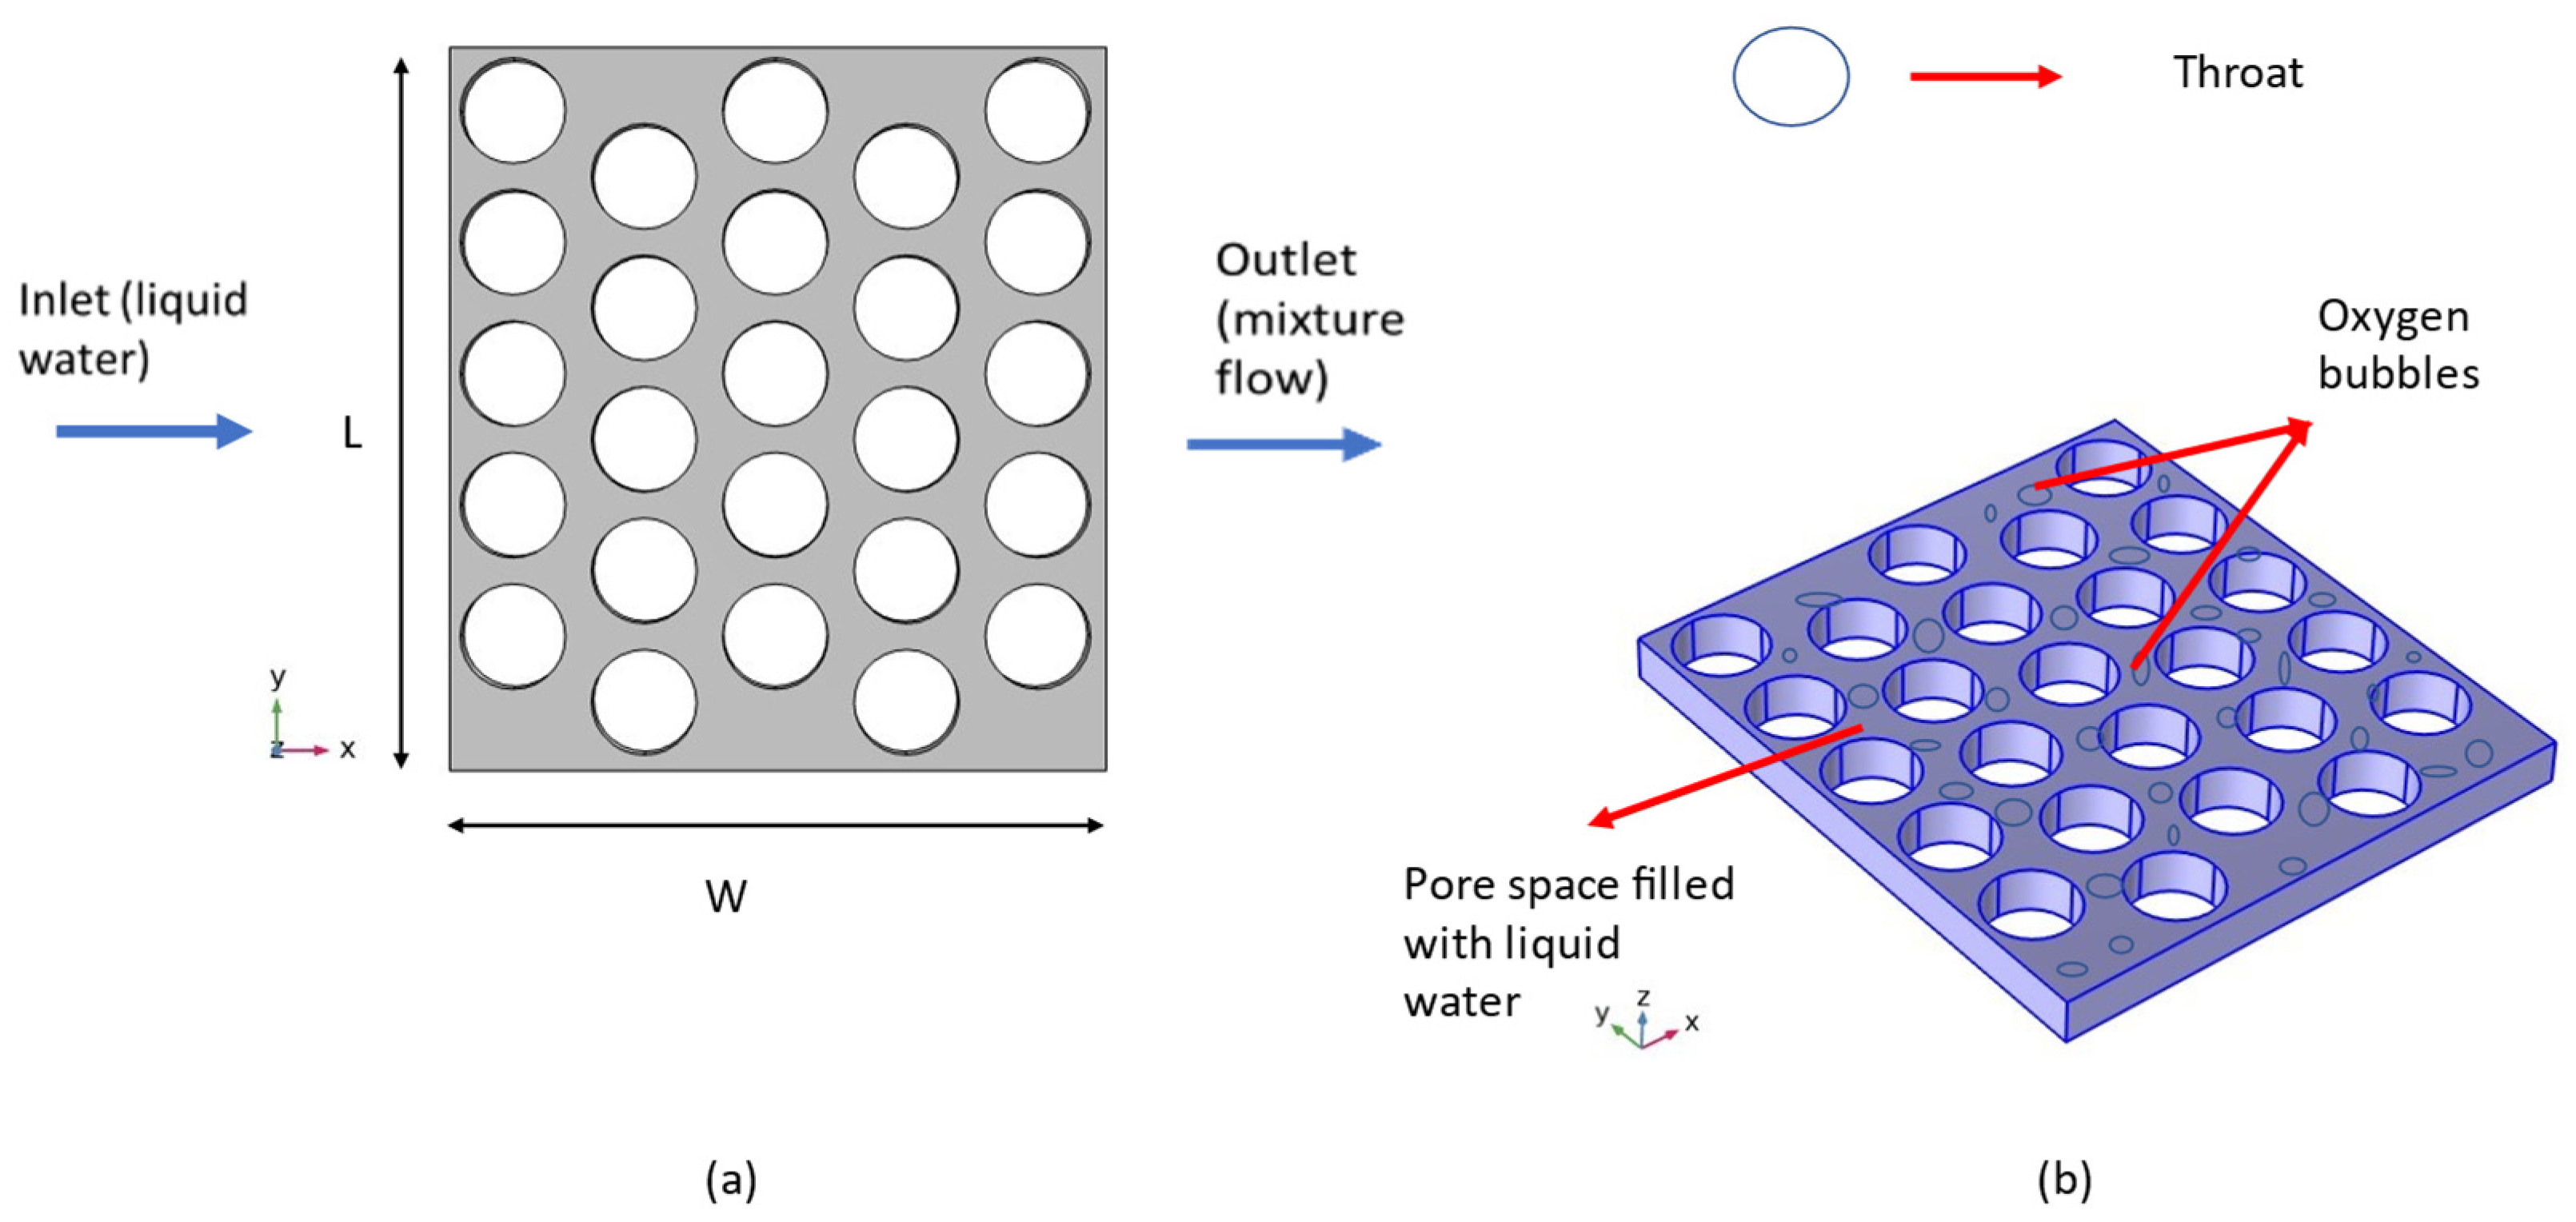
Figure 1a vividly illustrates the intricate geometric configuration of the artificial transport layer, depicting the systematic inflow of liquid water via the inlet positioned at the left boundary of the Porous Transport Layer (PTL). This influx initiates a controlled dispersion across the spatial domain represented by the distinct blue-colored region, specifically designed to facilitate optimal diffusion. The culmination of this dynamic process transpires at the PTL outlet, located along the right boundary, where the resulting effluent manifests as a two-phase amalgamation comprising oxygen gas and liquid water, emanating from the anode electrode positioned below the PTL. A comprehensive schematic overview of this intricate process is depicted in
Figure 1b, serving as an indispensable visual aid in comprehending the intricacies of the system under investigation.
The inherent characteristics of the artificial homogeneous PTL domain are meticulously documented in
Table 1, serving as a comprehensive repository of crucial geometrical attributes essential for a profound understanding of the modeled system. Of note, the average throat diameter, porosity, and thickness of the domain are thoughtfully calibrated to reflect a balanced synthesis of the key characteristics associated with both felt and sintered powder configurations [
14,
15]. These carefully selected parameters contribute to the accurate representation of the complex dynamics at play within the artificial PTL domain, underscoring the meticulous attention devoted to achieving a robust and versatile simulation framework.
Furthermore,
Table 2 provides a comprehensive compendium of the essential physical parameters intrinsic to the meticulously crafted mixture model employed in the comprehensive numerical simulation. These parameters serve as the fundamental building blocks underpinning the robust computational framework, facilitating a nuanced exploration of the intricate interplay of various physical phenomena within the artificial PTL domain. The meticulous documentation and utilization of these parameters serve as a testament to the rigorous and methodical approach adopted in the quest for an all-encompassing understanding of the underlying processes governing oxygen production within the PEM Electrolyzer.
The structure of the model is devised in two sequential phases, beginning with the simulation of single-phase flow, specifically the behavior of liquid water without any oxygen generation. Subsequently, this initial phase serves as the foundation for the time-dependent simulation, encompassing a 5-second timeframe during which the generation of oxygen commences at t = 0 s and continues until the culmination of the production process. It is noteworthy that the resolution time for this comprehensive simulation is approximately 22 hours, reflecting the intricacies involved in capturing the dynamic interplay of the two phases.
In our simulation framework, the integration of two pivotal user-defined functions (UDFs) plays a crucial role. The first UDF governs the local oxygen flux, effecting a smooth transition from a value of 1 to 0 as the volume fraction of oxygen approaches 1. The strategic implementation of this UDF not only curbs abrupt fluctuations in flux but also bolsters convergence, ensuring the robustness and stability of the computational process. Following the completion of the time-dependent procedure, a secondary UDF orchestrates a controlled increment in the oxygen flow from 0 to 1, effectively minimizing the computational time required for the simulation.
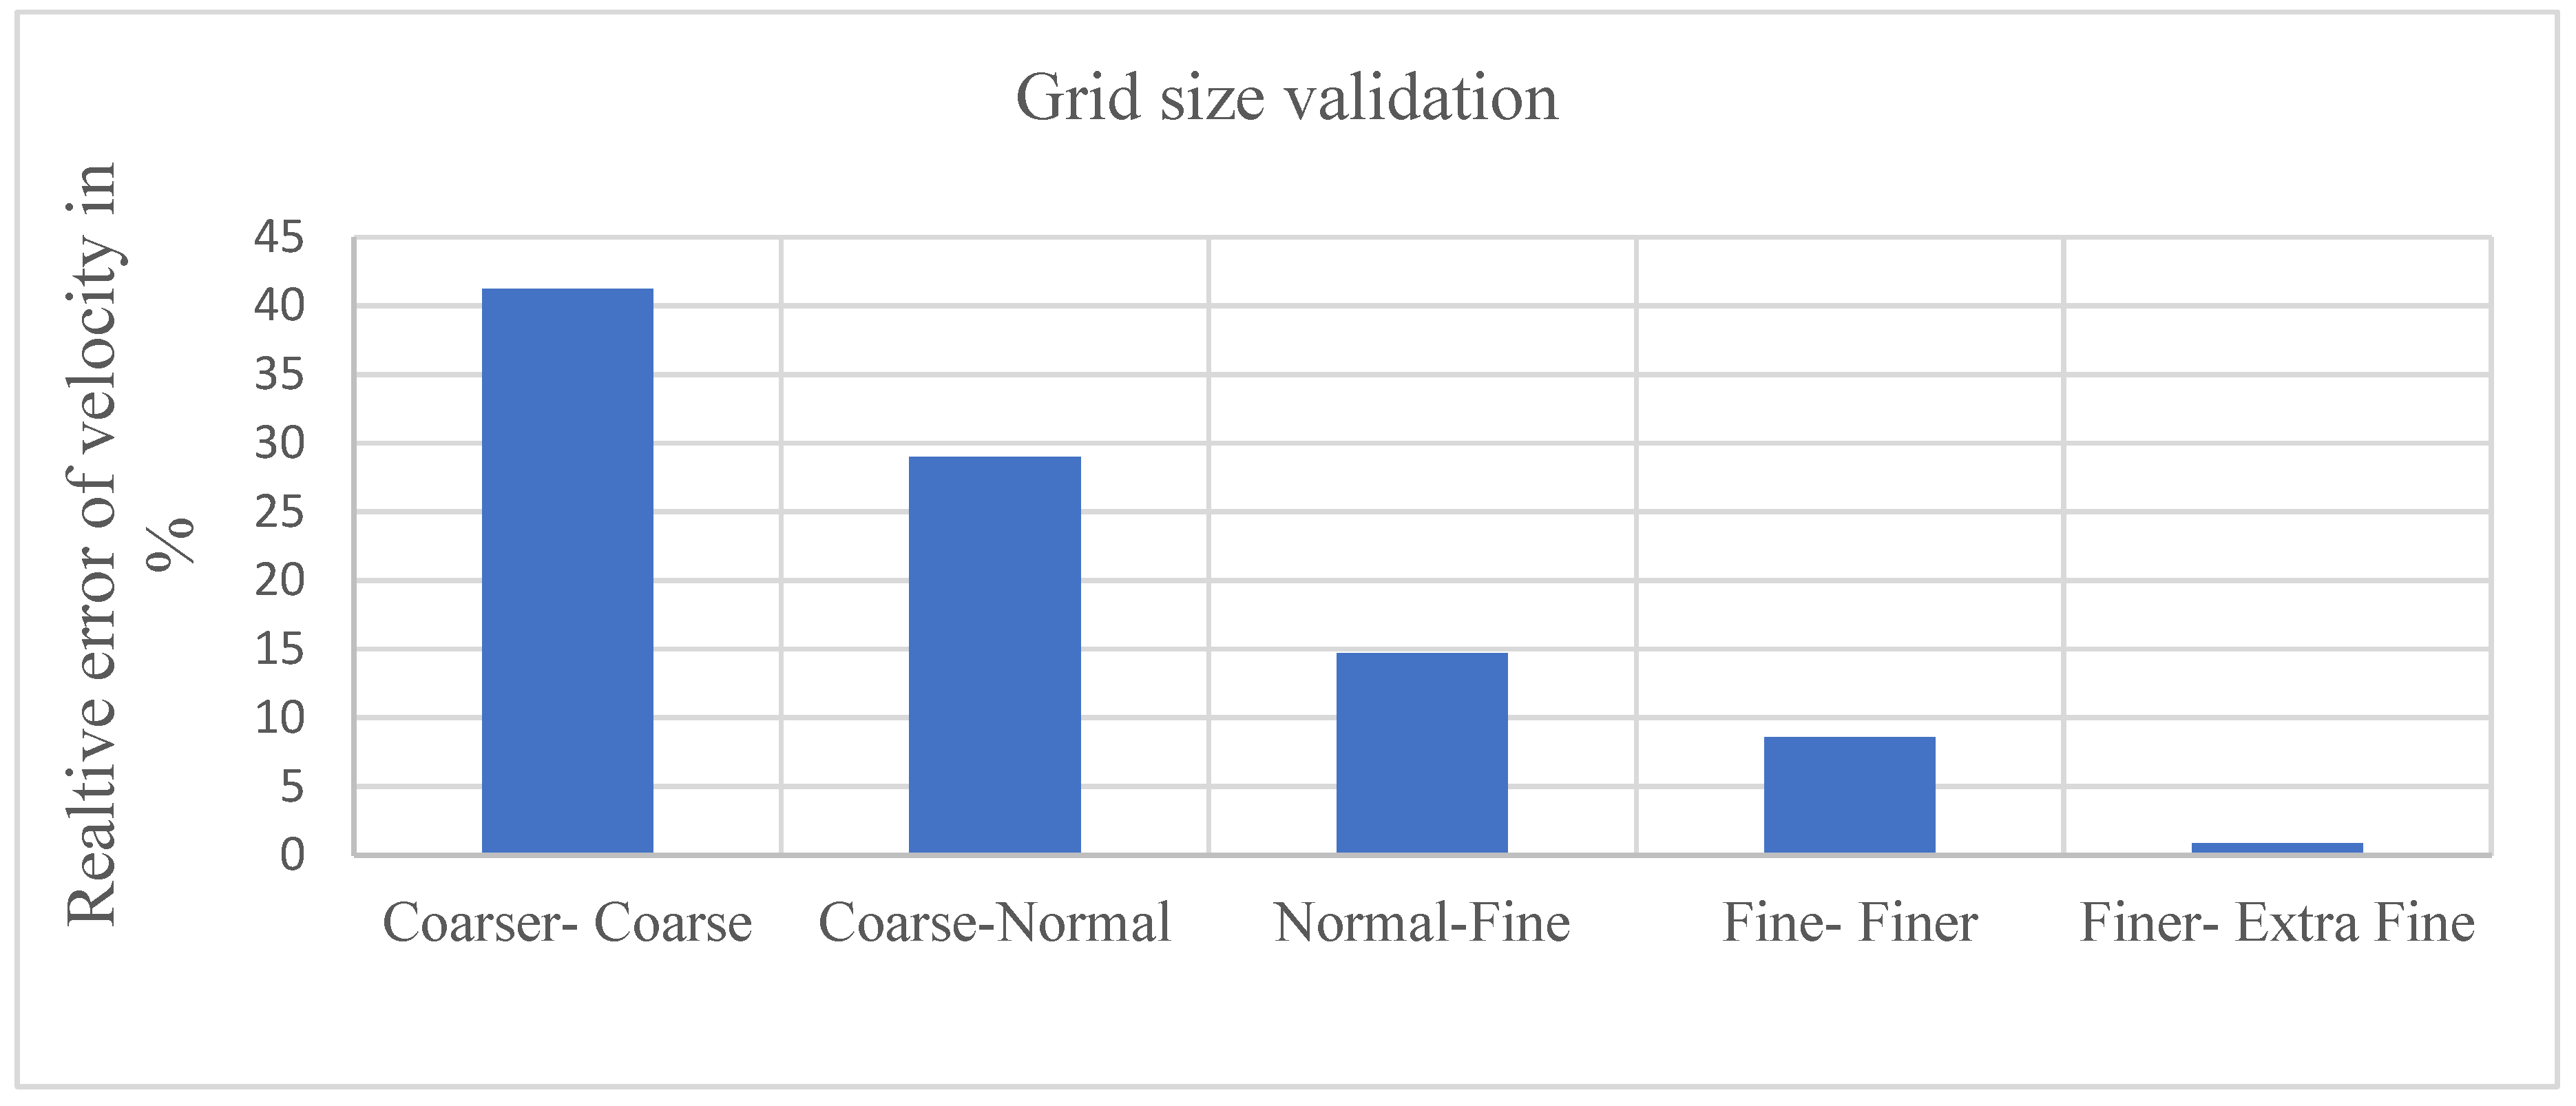
The generation of an optimized mesh assumes paramount importance in the realm of Computational Fluid Dynamics (CFD) modeling for PEM electrolyzers. A well-crafted mesh design exerts a profound influence on computational efficiency, effectively managing computational resources by striking an optimal balance between the requisite precision of the simulation and the associated computational cost. In our study, a physics-driven mesh tailored to the specific model requirements is meticulously crafted and evaluated across different resolutions, ranging from coarser to extra fine.
In the process of selecting the most appropriate mesh, a comparative analysis of the relative error in velocity between different mesh types is conducted. Notably, the assessment reveals a relative error range between 41.2256% to 0.854701%, with the finer mesh displaying the least error. Consequently, based on a comprehensive evaluation of simulation duration and result accuracy, the Finer mesh configuration is chosen for its ability to strike an optimal balance between computational efficiency and fidelity of results.
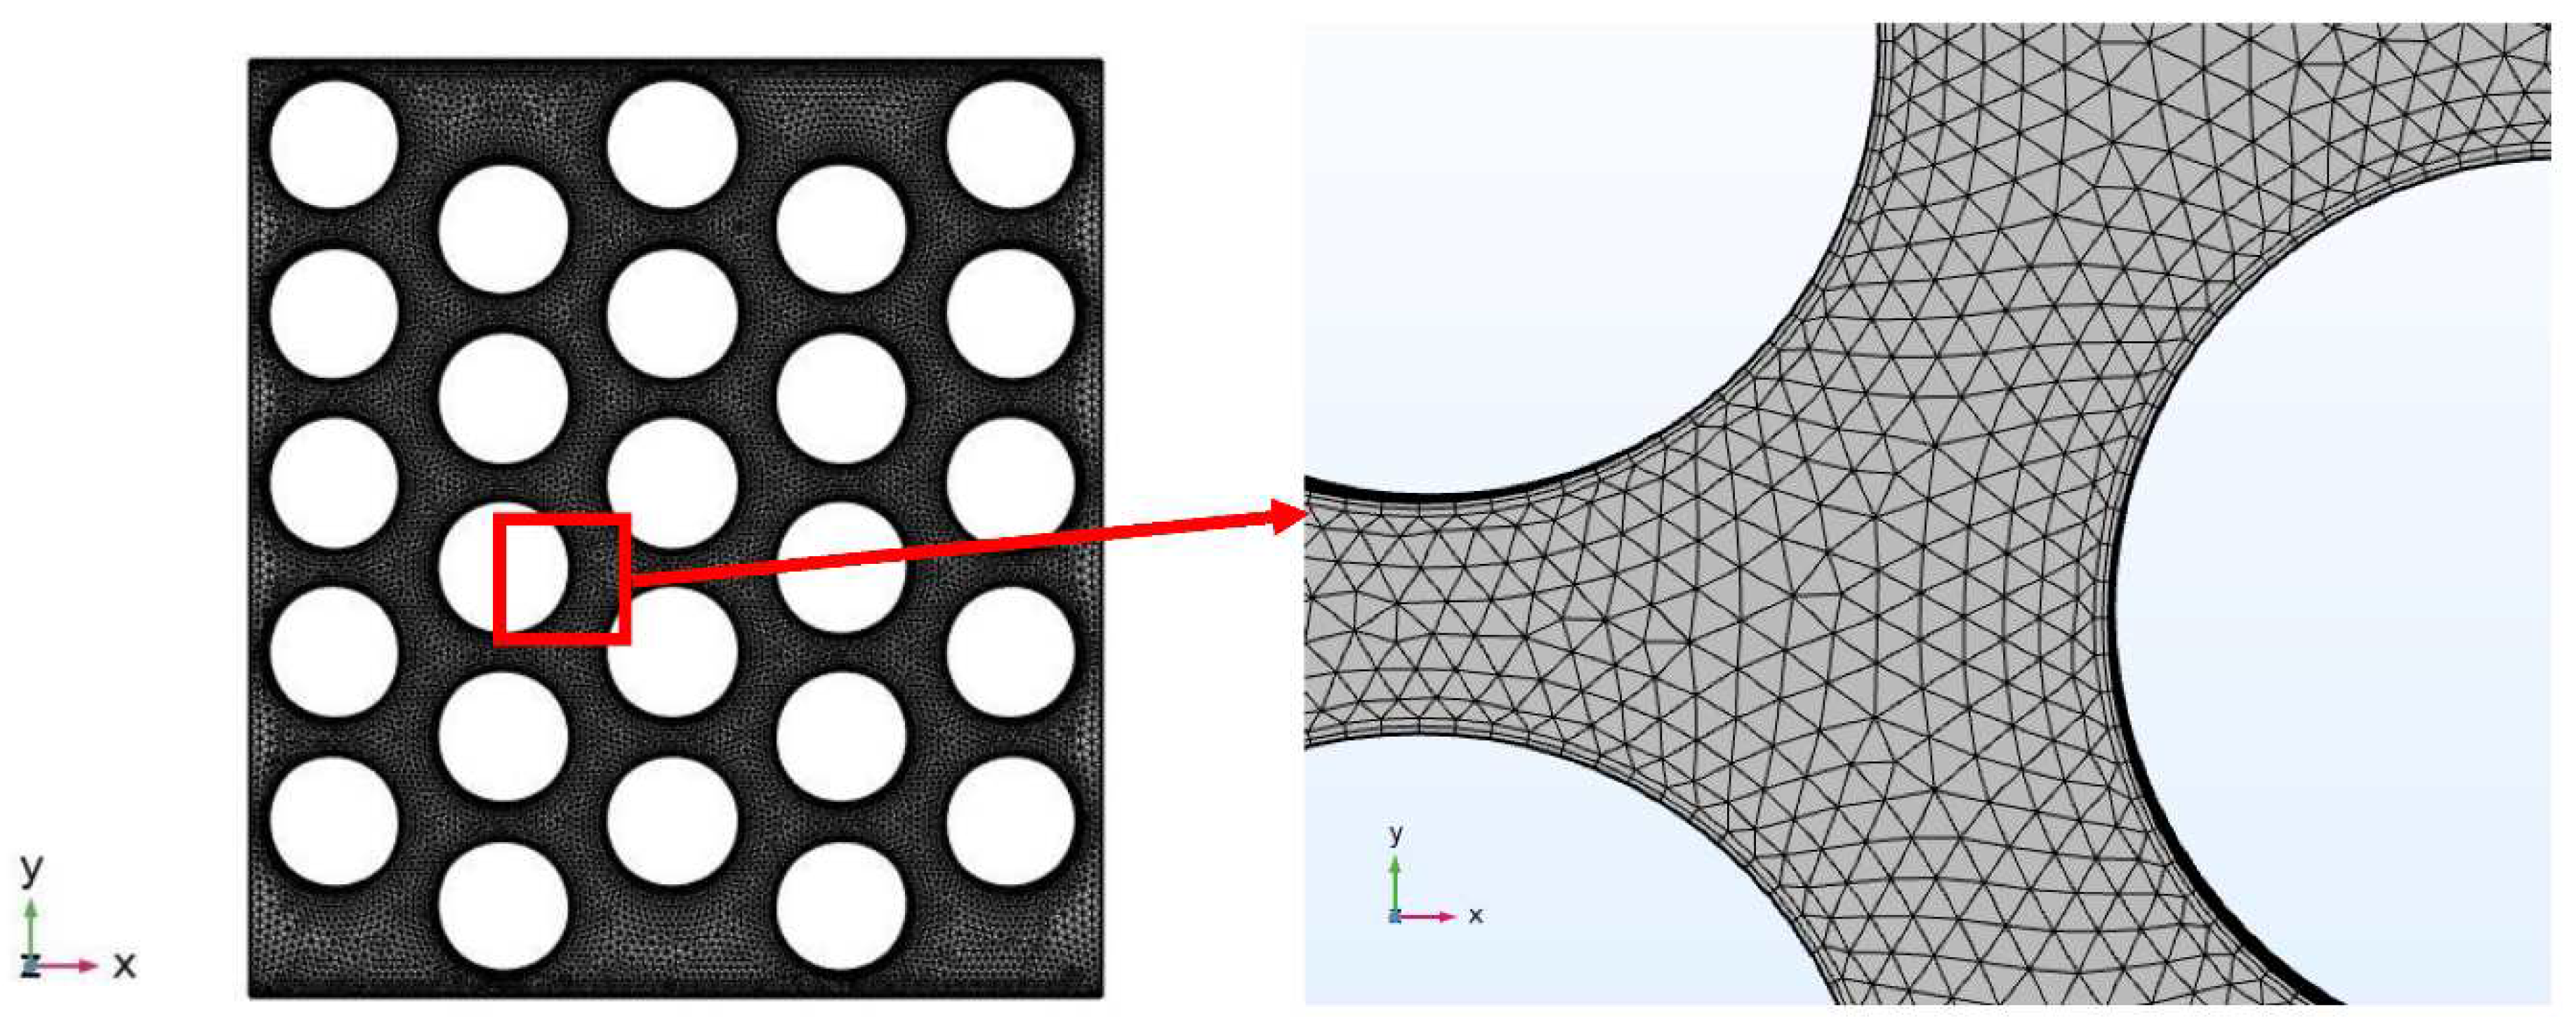
The final mesh configuration, as illustrated in
Figure 3, is comprised of 1573398 elements, featuring 1365030 tetrahedral elements and 208368 prism elements. Notably, the average element quality of the mesh is 0.691, with an element volume ratio of 0.004733 and a mesh volume of 7.472E-4 mm
3. This well-optimized mesh configuration serves as the backbone of our simulation framework, facilitating the accurate and efficient examination of the intricate dynamics within the PEM electrolyzer system.
2.1. Governing Equations and Boundary Conditions
PEM electrolysis is a three-phase process that involves the flow of energy, momentum, and charge through a solid membrane, liquid water, and gaseous hydrogen and oxygen. The following are the governing equations of the problem,
The continuity equation, which is a fundamental equation in fluid dynamics, describes mass conservation in a fluid system. The continuity equation in this model describes the transport of the liquid water phase through the PTL and can be expressed as Equation (2) [
19]:
The momentum equation can be written as:
where,
The mixture velocity is the most essential component describing the total velocity of the water and gas mixture in the PTL. The velocity of the mixture is calculated as the sums of the velocities of the liquid and gas phases, which are collectively referred to within this model as the continuous and dispersed phases, weighted by their respective volume portions. The velocity of the mixture is stated as follows [
20],
where
denotes the volume fraction, and the indices ‘c’ and ‘d’ denote continuous and dispersed phases, accordingly.
In this model, relative velocity between the continuous and dispersed phases, which establishes the rate of mass transfer between the phases, is also a crucial factor in addition to mixture velocity. The difference between the velocities of the continuous () and dispersed phases () is defined as relative velocity.
The relative velocity or the slip velocity can be written as,
The volume fractions of the dispersed and continuous phases as well as their separate densities affect the density of the mixture in the model. A weighted sum of the densities of the different phases can be used to get the mixture density. The density of the mixture can be written as,
where,
represent the density and volume fraction of dispersed phase,
represents the density and volume fraction of continuous phase.
The dispersed phase mass fraction is written as follows,
The drag force is written as follows,
where,
The dispersed phase transfer equation has been defined as follows,
The mass transfer ratio between the phases is denoted by
The energy equation is expressed as follows [
21],
Temperature, thermal conductivity, and specific heat capacity can be represented by T, K, and , respectively.
To accurately define the behavior of the system in the mixture model technique used to simulate PEM electrolysis, specific boundary conditions must be defined. The boundary conditions, which describe how the system interacts with the surroundings, are critical for precise simulation results. The inlet and outflow boundary conditions are velocity-driven at the inlet and pressure at the outlet. For all other boundaries, no dispersed phase flux and no slip conditions are set. The model accounts for buoyancy’s gravitational effects, with the gravity vector pointed downward in the z-direction. Using an inlet boundary condition and assuming total oxygen production, the overall oxygen gas production/total bulk out flux is defined. A dispersed phase flux boundary condition is employed at the inlet.
In this work, the numerical investigation has been carried out using COMSOL Multiphysics. The finite-element approach is used to solve the numerical model. The finite element method (FEM) is used to resolve physical systems partial differential equations (PDEs). FEM can be used to resolve the mixture model that explains and analyzes the behavior of the liquid-gas two-phase flow in the PEM electrolyzer, including the conservation equations for species transport, momentum transfer, and electrical potential. By reducing the system down into feasible parts, the model is solved using the FEM, and the PDEs are approximated using piecewise continuous basis functions. Complex geometries and boundary conditions, which are prevalent in PEM electrolysis, can be solved using the FEM technique. The approach is a useful tool for developing and enhancing PEM electrolyzers as it generates accurate results under a variety of operating conditions. The behavior of fluid interfaces in multiphase flows is simulated numerically using the Volume of Fluid (VOF) method. The VOF approach can be used to simulate the behavior of the liquid-gas interface in the PTL and the liquid membrane interface in the membrane electrode assembly in the context of PEM electrolysis. It can offer insightful information about how the system behaves and performs under various operating circumstances, and it can aid in PEM electrolyzer design optimization for increased effectiveness and performance.
3. Results and discussion
3.1. Oxygen concentration
The investigation into the volume of oxygen utilized in proton exchange membrane (PEM) electrolysis underscores its crucial role in determining the efficiency and performance of the cell. The oxygen concentration within the anode compartment is predominantly influenced by the mass transfer of oxygen to the electrode surface and the kinetics of oxygen reduction at the electrode. The volume fraction of oxygen concentration in PEM electrolysis represents the ratio of the moles of oxygen gas to the total moles of products generated (including water vapor and oxygen) within the anode compartment. Various factors such as gas flow rate, pressure, temperature, catalyst activity, and loading contribute to the modulation of the volume fraction of oxygen concentration.
In this study, the maintenance of a constant mass flow rate of 260 ml/min at a temperature of 80 °C and atmospheric pressure was ensured.
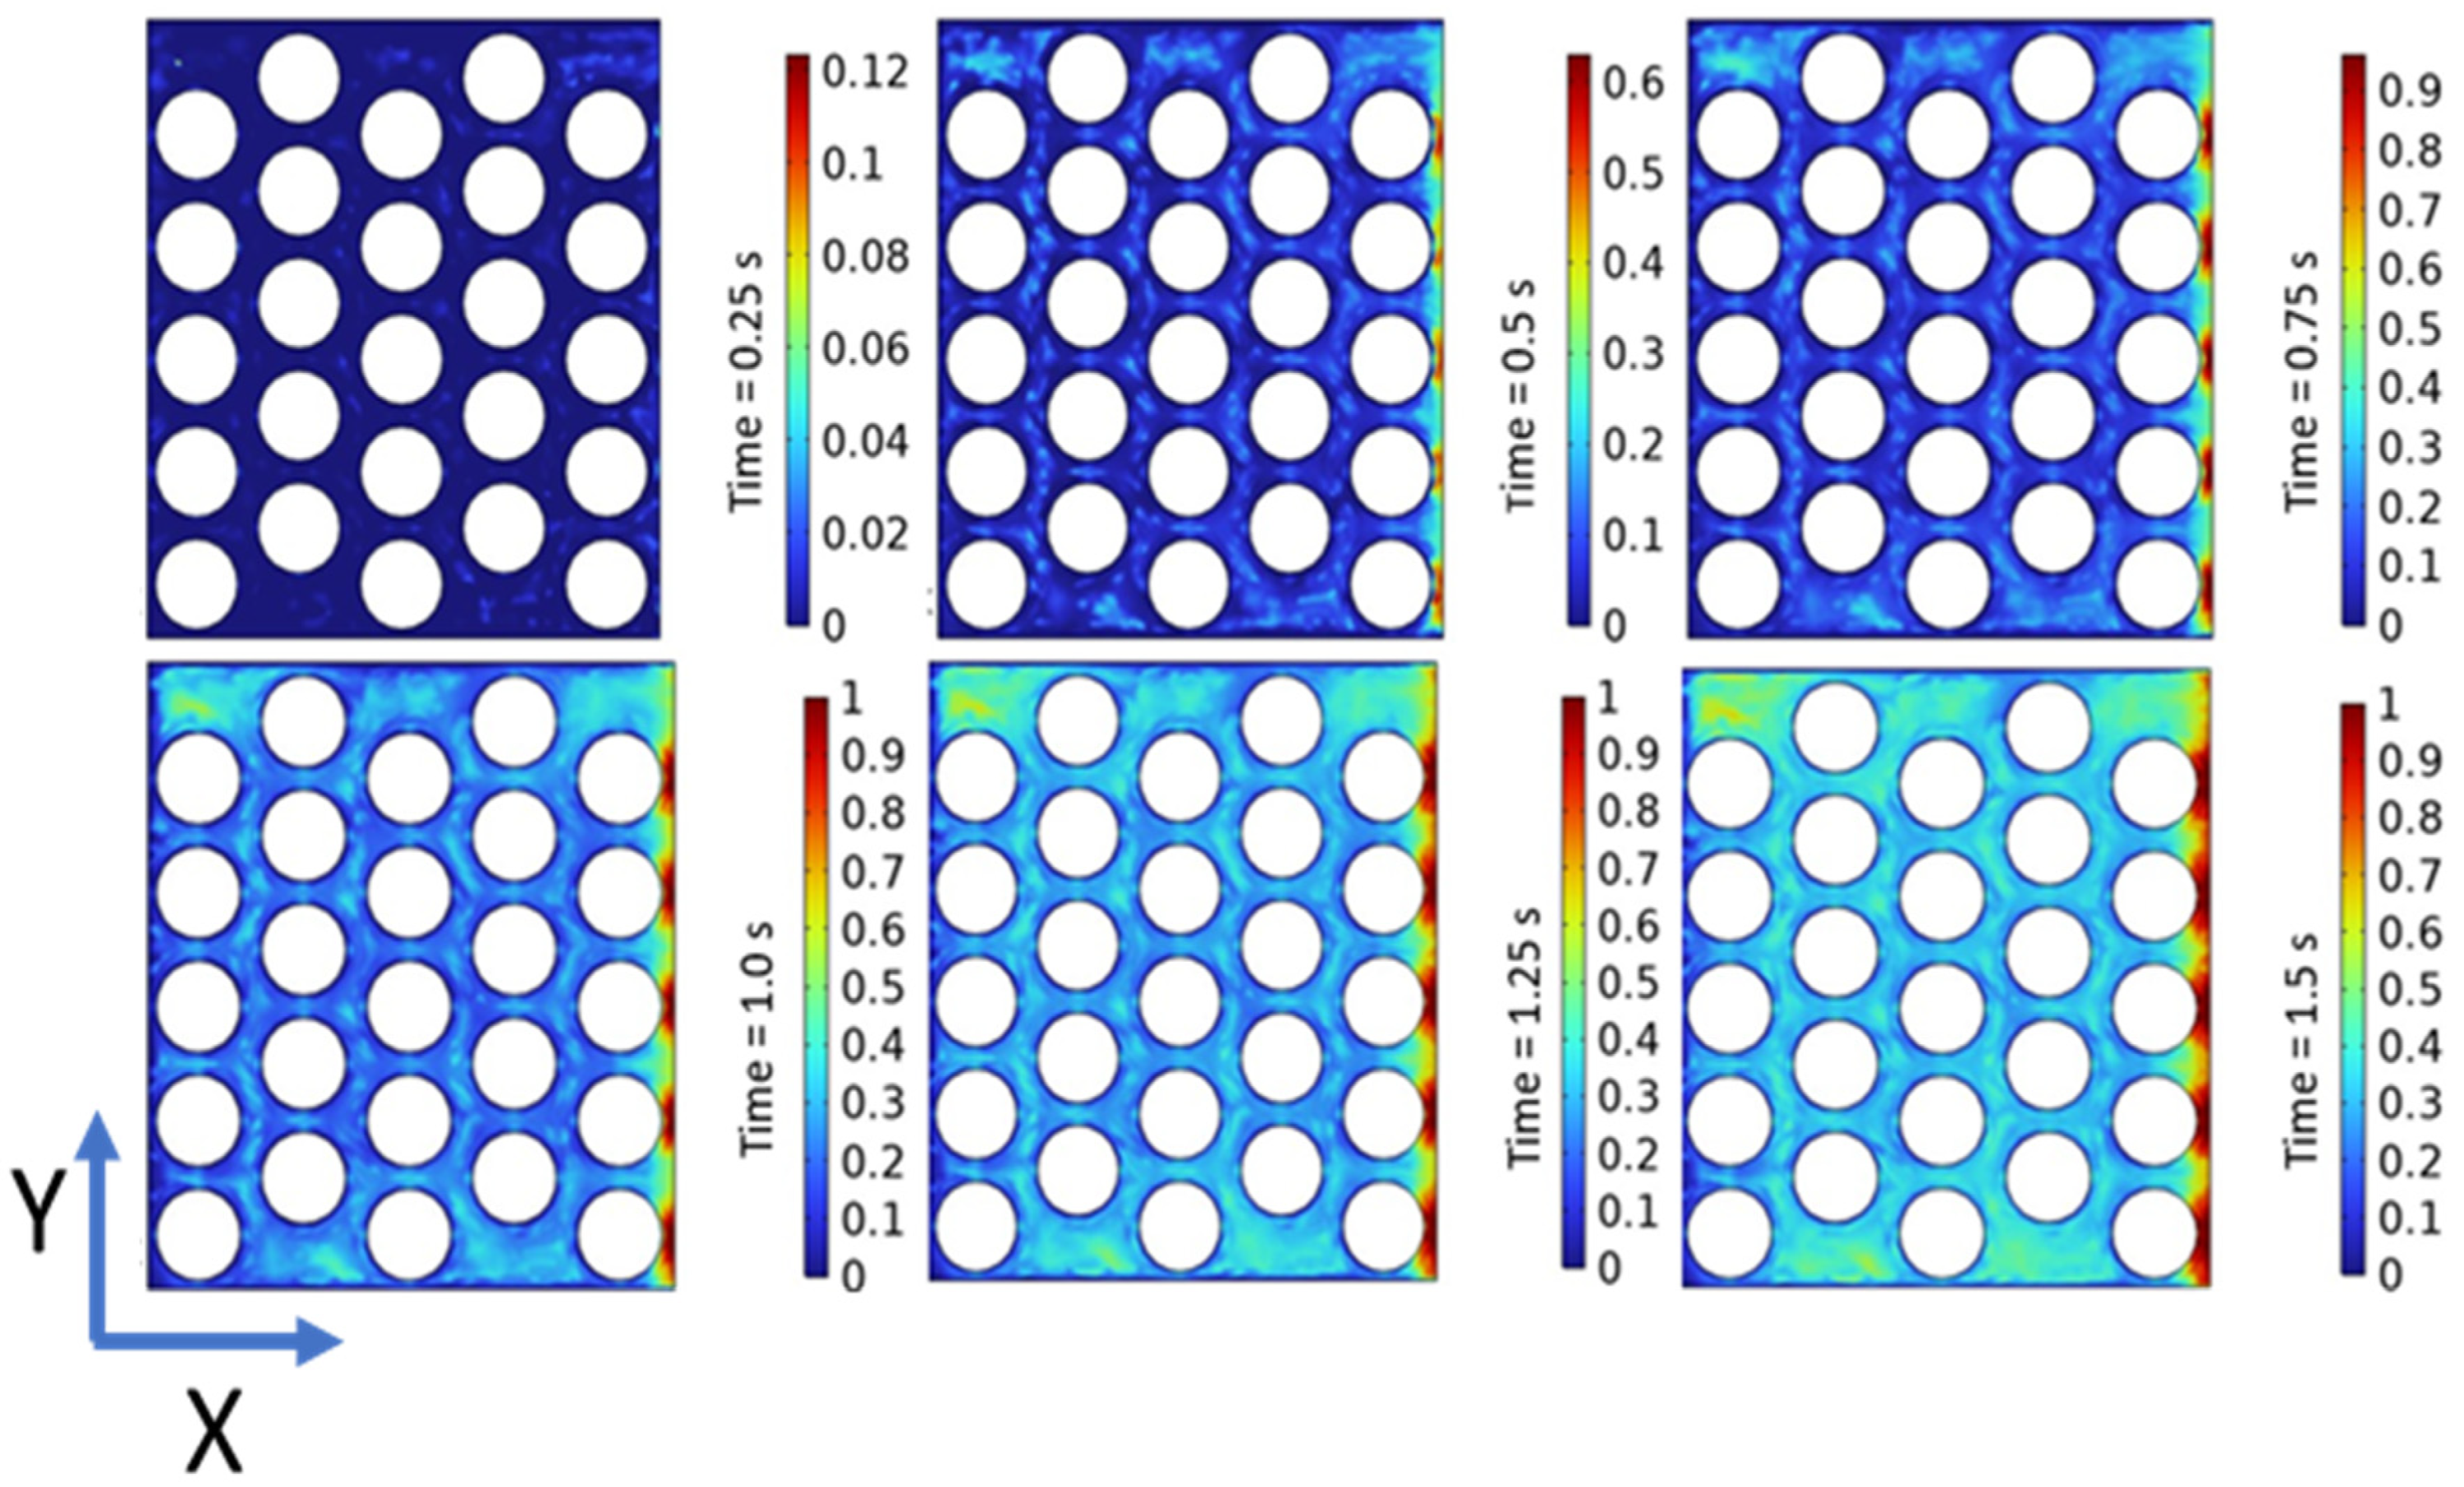
Figure 4, illustrates the volume percentage of oxygen contour within the model at different time intervals. At 0.25 s, the PTL exhibits a uniform distribution of oxygen gas on the anode side, primarily concentrated at the interface of the electrode surface area and the PTL. The initial concentration of gas, measuring 0.12, indicates the presence of oxygen bubbles within the PTL. The concentration of oxygen progressively increases, reaching a maximum of 0.6 at 0.5 s, accompanied by an escalation in the presence of oxygen bubbles over time. At 0.75 s, the potential for gas liquefaction becomes pronounced, with the highest concentration of gas peaking at 0.9%. The concentration of oxygen is notably prominent along the outlet wall of the PTL and the outermost regions of the circular pores. The movement of oxygen bubbles from the lower to the upper layer is facilitated by the reduced pressure differential at 0.75 s, ensuring a uniform distribution of gas molecules across the PTL’s electrode surface area. The saturation of the entire PTL with the maximum oxygen concentration is observed at 1.0 s, coinciding with optimized oxygen molecule transport. Furthermore, the stability of the oxygen distribution is evident from 1.25 s to 1.50 s, implying a steady-state condition.
In
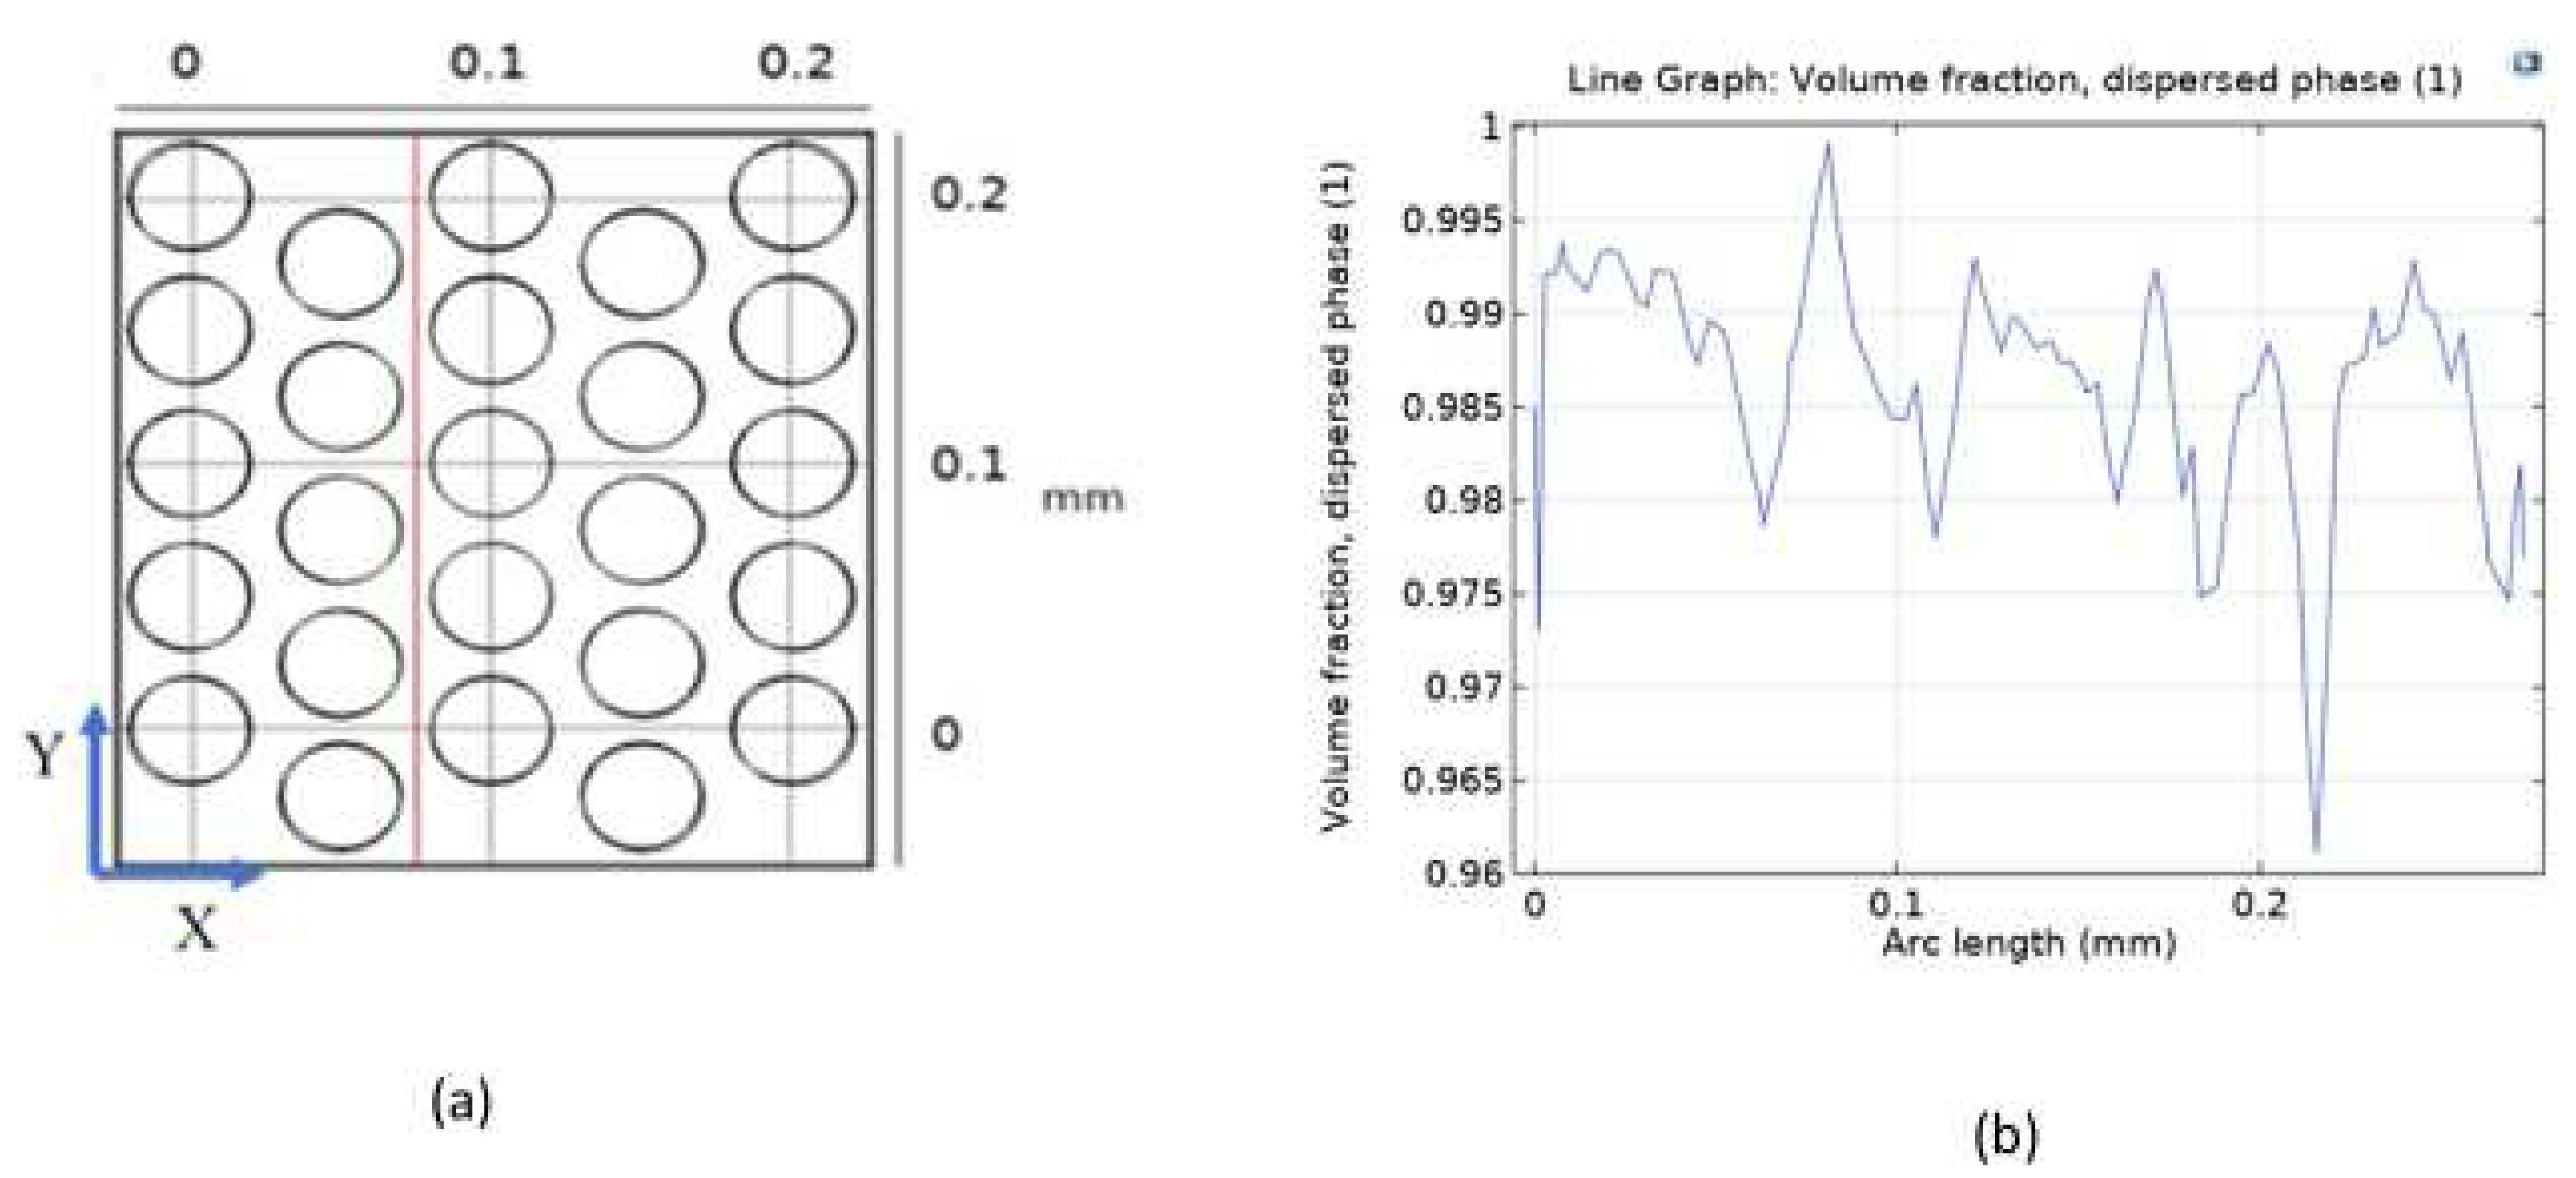
Figure 5, the line graph representing the volume fraction of the dispersed phase (O
2) along the arc length demonstrates the spatial distribution of oxygen within the model. The graph indicates a peak saturation of 1 at 0.09 mm and a minimum saturation of 0.96 at 0.21 mm along the arc length. Additionally, the uniform distribution of the volume fraction of the dispersed phase (O
2) across the entire model is clearly depicted from 0 s to 5 s, reaching saturation at 1 s and persisting throughout the observation period. These results contribute significantly to the comprehensive understanding of the intricate dynamics within the PEM electrolysis system, providing a foundation for further advancements in the field of sustainable energy technology.
3.2. Velocity field
The concept of “mass-averaged velocity” within PTL of PEM electrolysis represents the mean velocity of gas within the PTL, weighted by the mass of gas passing through each location in the layer. This crucial parameter plays a pivotal role in determining the overall performance and efficiency of the cell, directly influencing the mass transport of reactants and products. Factors such as pressure, gas flow rate, porosity, tortuosity of the PTL, and the cell’s dimensions collectively influence the mass-averaged velocity within the anode PTL. Typically, a higher mass-averaged velocity is indicative of more efficient mass transfer and improved cell functionality.
In this study, a porosity of 50% in the porous medium, combined with an inlet mass flow rate of a full cell of 260 ml/min simulated under atmospheric pressure and a temperature of 80 °C, was maintained.
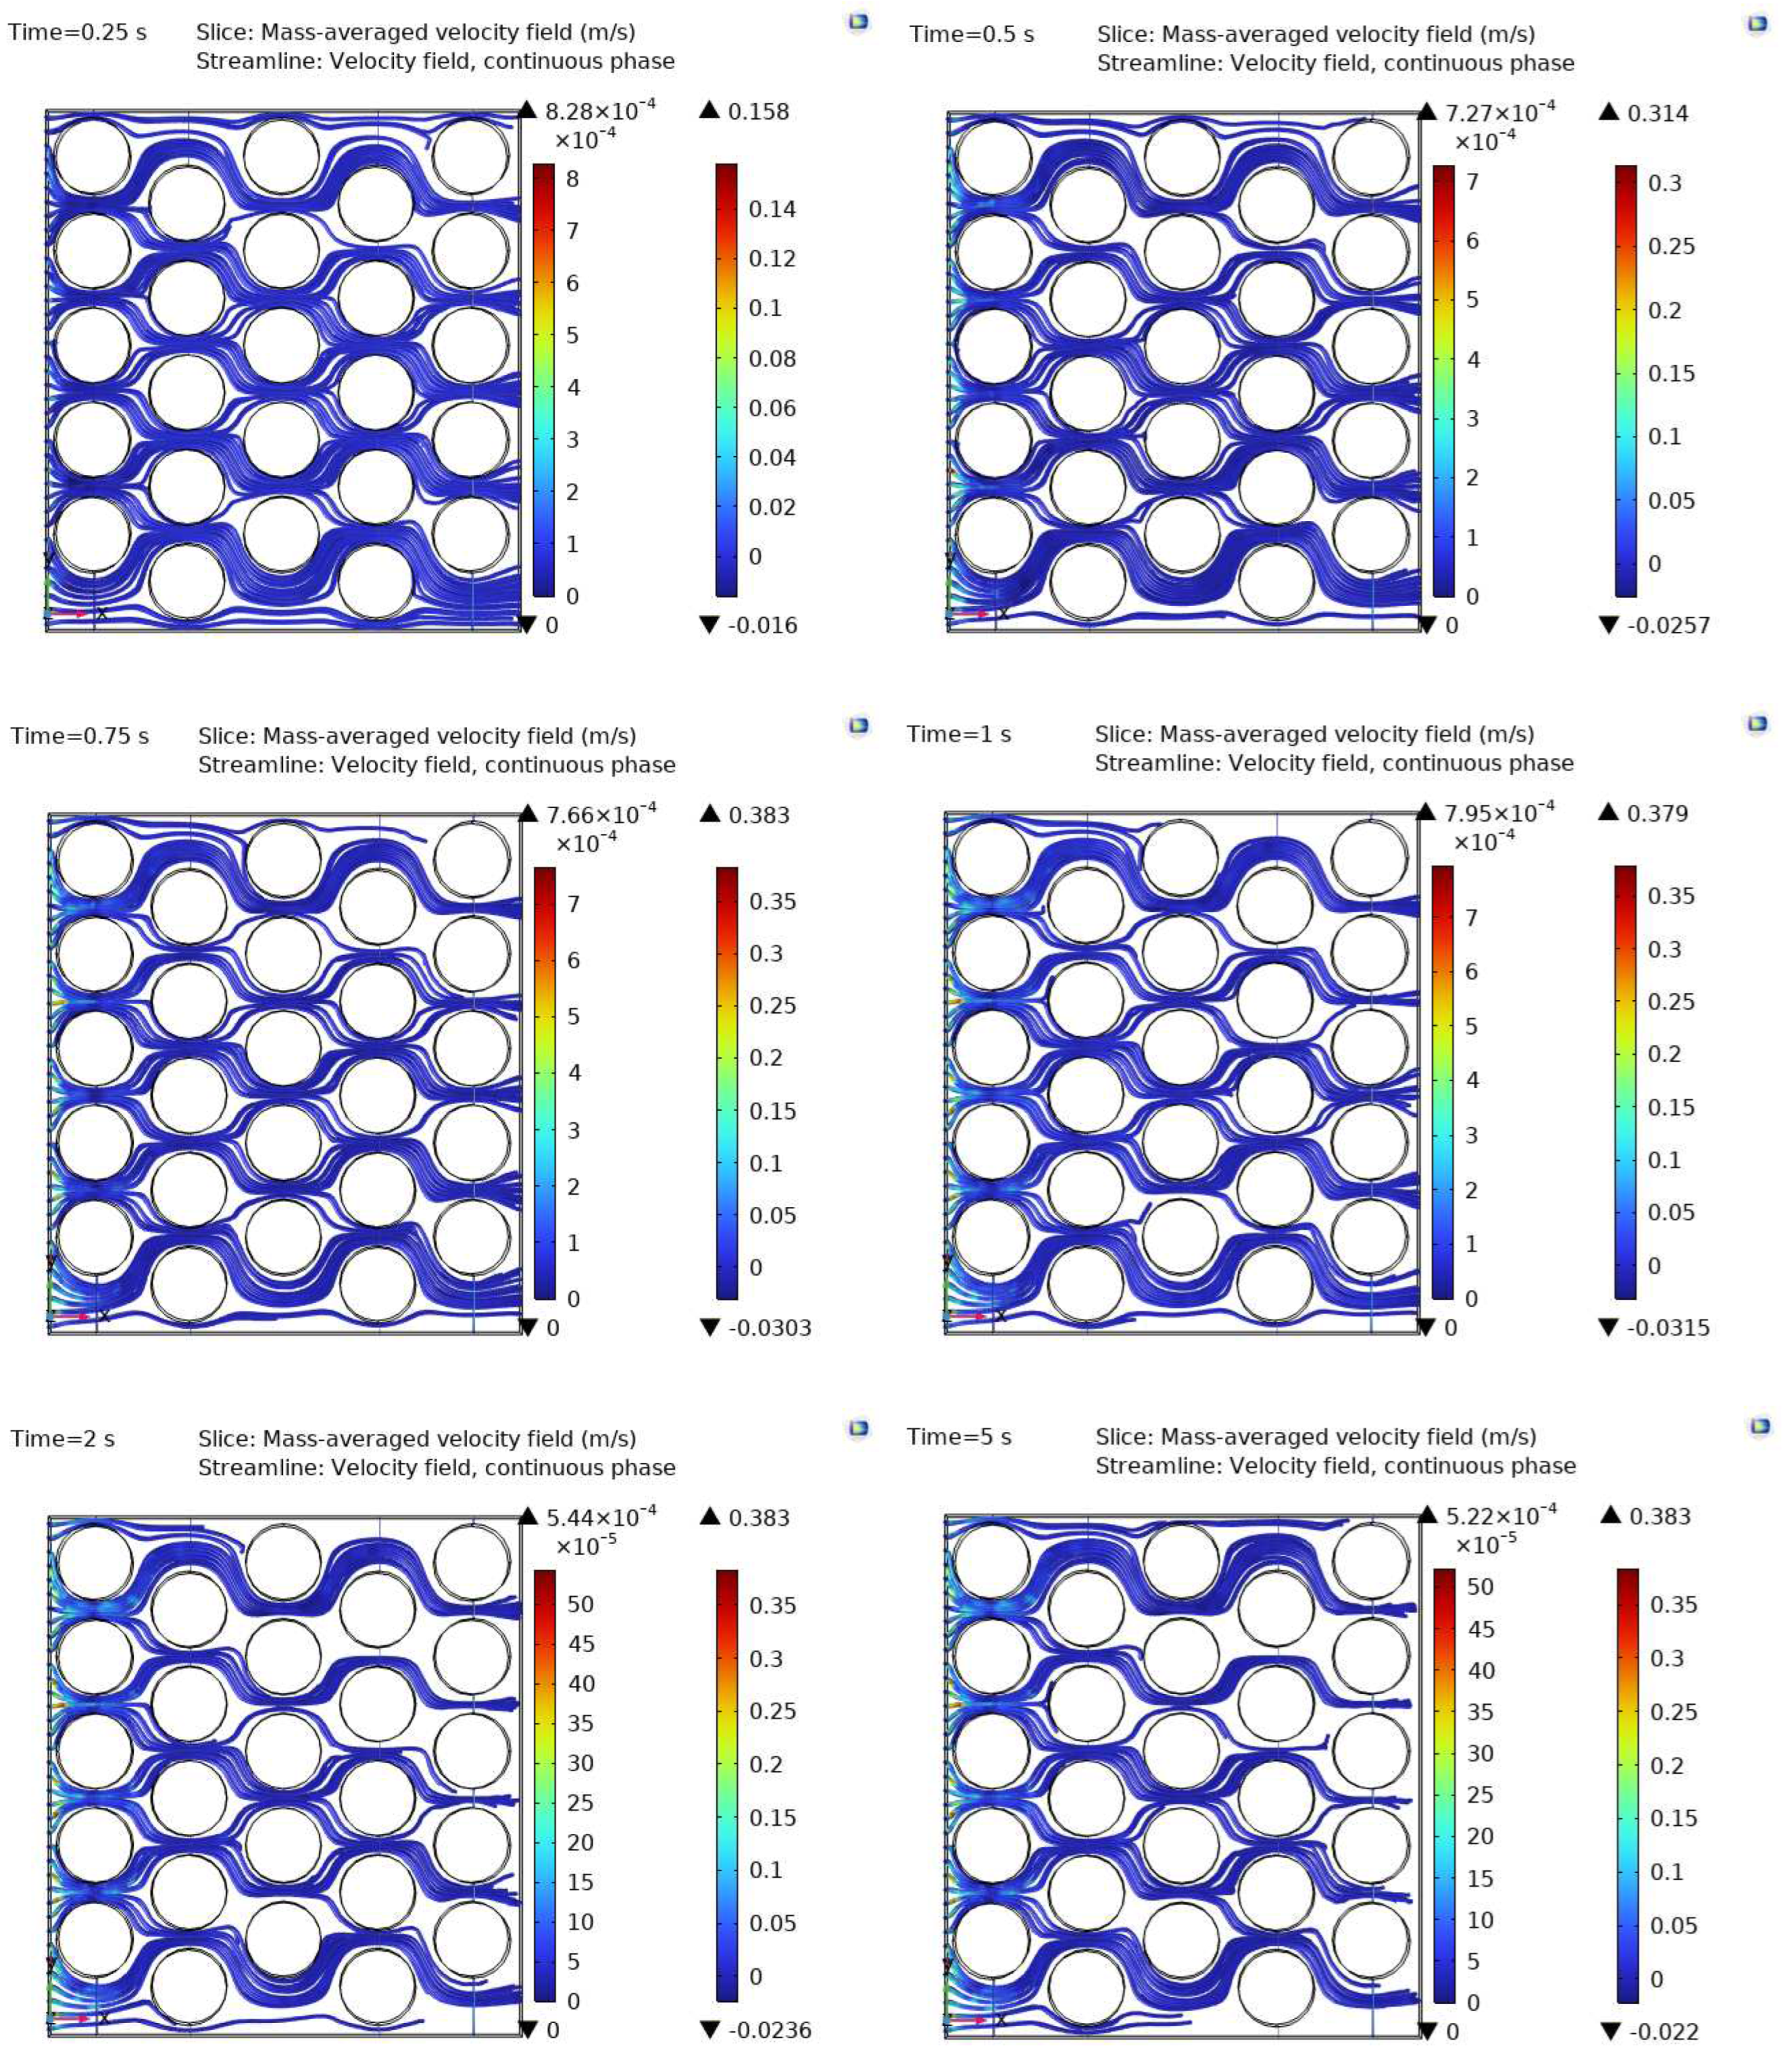
Figure 6, illustrates the contours of the mass-averaged velocity at various intervals within the designed model. The velocity is observed to be minimal at the inlet, where the flow traverses the pore network. Notably, the streamlines follow the established path of the pore network once the flow is fully developed. At the outlet, the flow velocity peaks at 0.383 m/s within 0.75 s, remaining below 1 s for the entire 5-second simulation. This behavior suggests that the flow field achieves a constant distribution in less than a second. The sliced portion between the throats represents the mass-averaged velocity, whereas the streamlines depict the velocity field of the continuous phase (liquid water).
Furthermore,
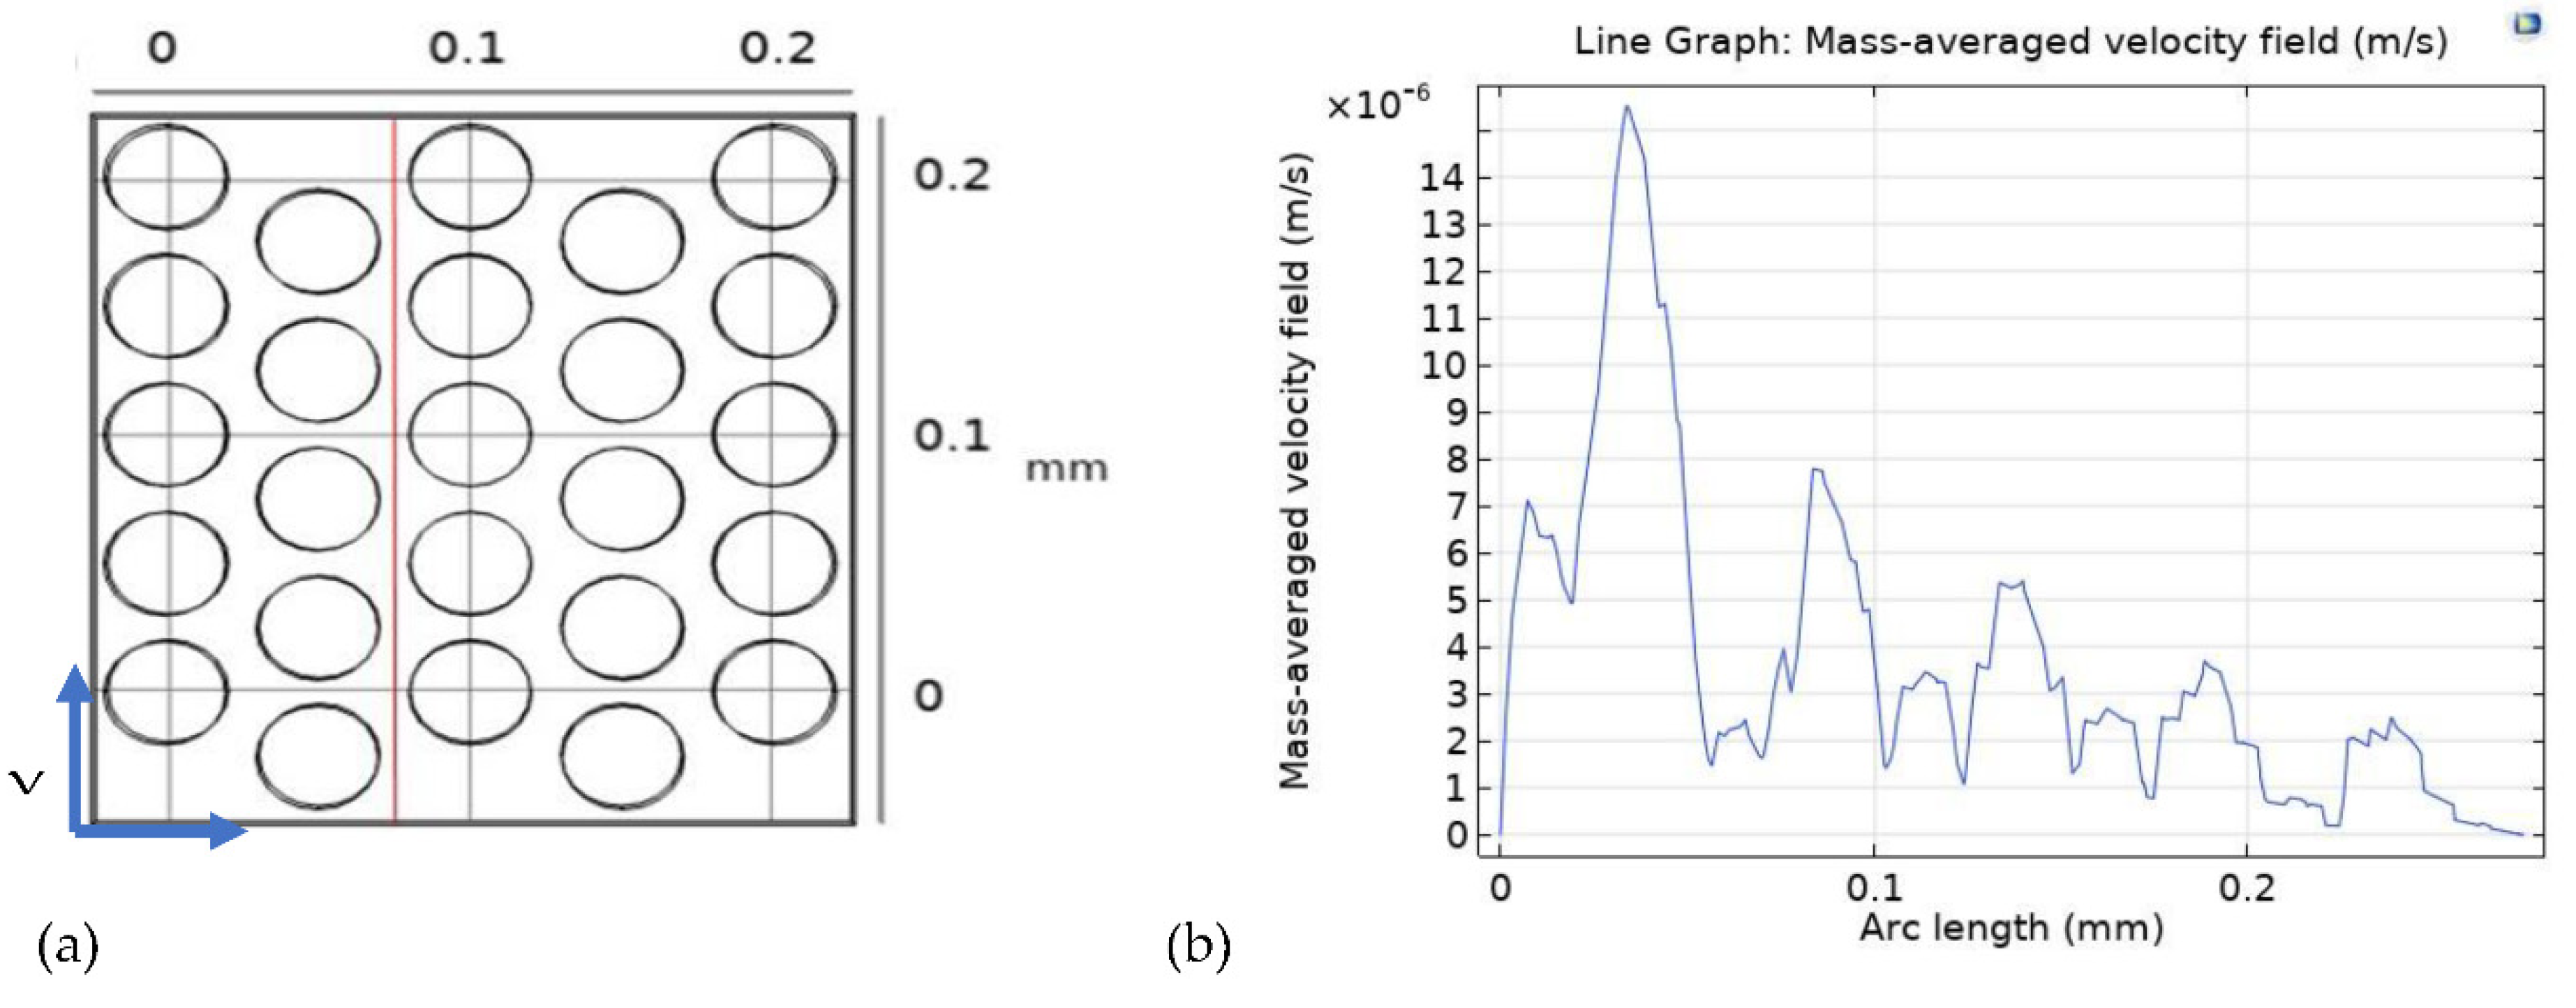
Figure 7, presents the relationship between the mass-averaged velocity field (m/s) and the arc length (mm), demonstrating the velocity distribution at a specific cut section of the 3D model at 0.075 mm along the XY axis (indicated by the red line in
Figure 7a). The results highlight a peak velocity at 0.025 mm from the inlet, gradually decreasing along the arc length. These findings offer valuable insights into the intricate dynamics of mass transport within the PTL of PEM electrolyzers, providing a comprehensive understanding of the factors influencing the cell’s performance and efficiency.
3.3. Pressure distribution
The pressure distribution within a PEM electrolysis cell, characterized by the disparity in pressure from the inlet to the outlet of the reactant gases (typically hydrogen and oxygen), is influenced by various factors such as gas flow rate, PTL design, and pressure drop across different components of the cell. The pressure drop is generally most pronounced at the inlet, gradually diminishing as the gases traverse through the PTL, catalyst layer, membrane, and other parts of the cell. Alterations to the flow path, bends, or adjustments in the design of flow channels and PTLs can significantly impact the pressure distribution.
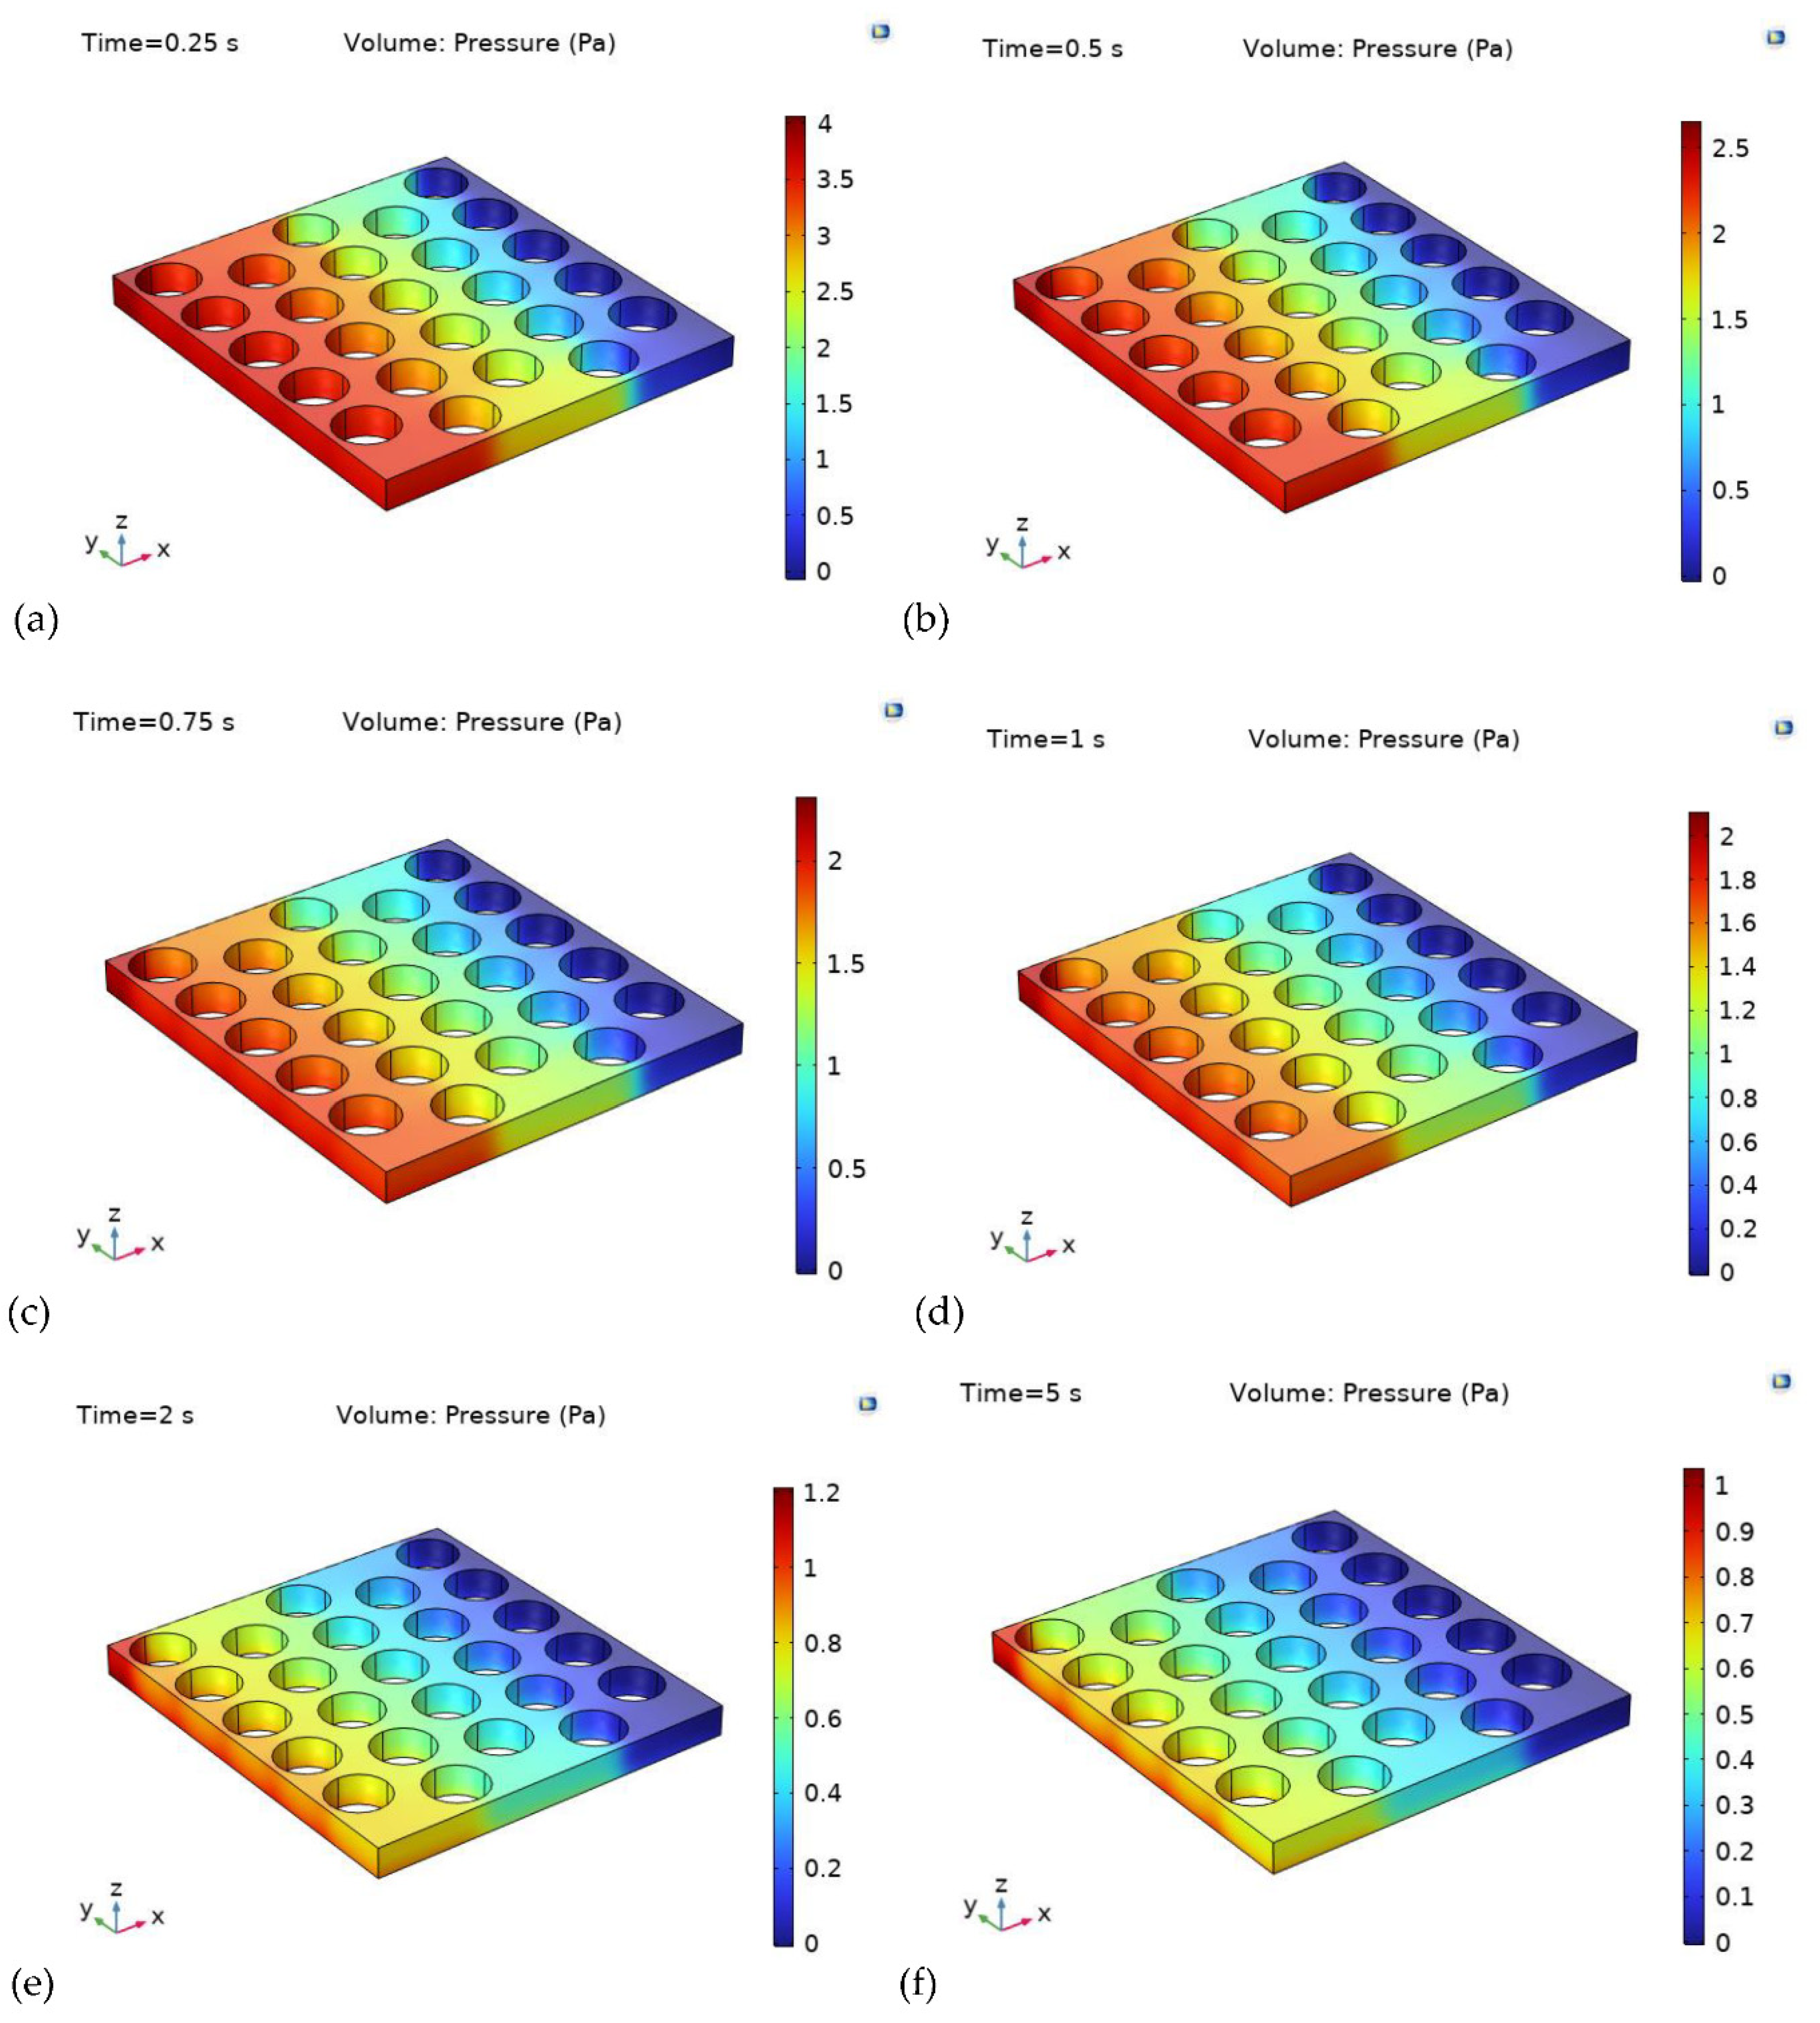
Figure 8, provides a comprehensive depiction of the pressure distribution contour at different time intervals, emphasizing the variations in pressure within the PTL. The numerical results demonstrate that the pressure at the PTL inlet surpasses that at the outlet throughout the observed instances. Notably, at 0.25 s, the pressure inside the PTL exhibits a significant spike, leading to a noticeable disparity in pressure, consequently influencing the uniformity of pressure distribution. Furthermore, an analysis of the results reveals a substantial pressure drop of 37.5% between 0.25 s and 0.5 s. However, a marginal reduction of approximately 20% in the pressure drop is observed between 0.5 s and 1.0 s, with the pressure gradually achieving a more uniform distribution within the PTL over time.
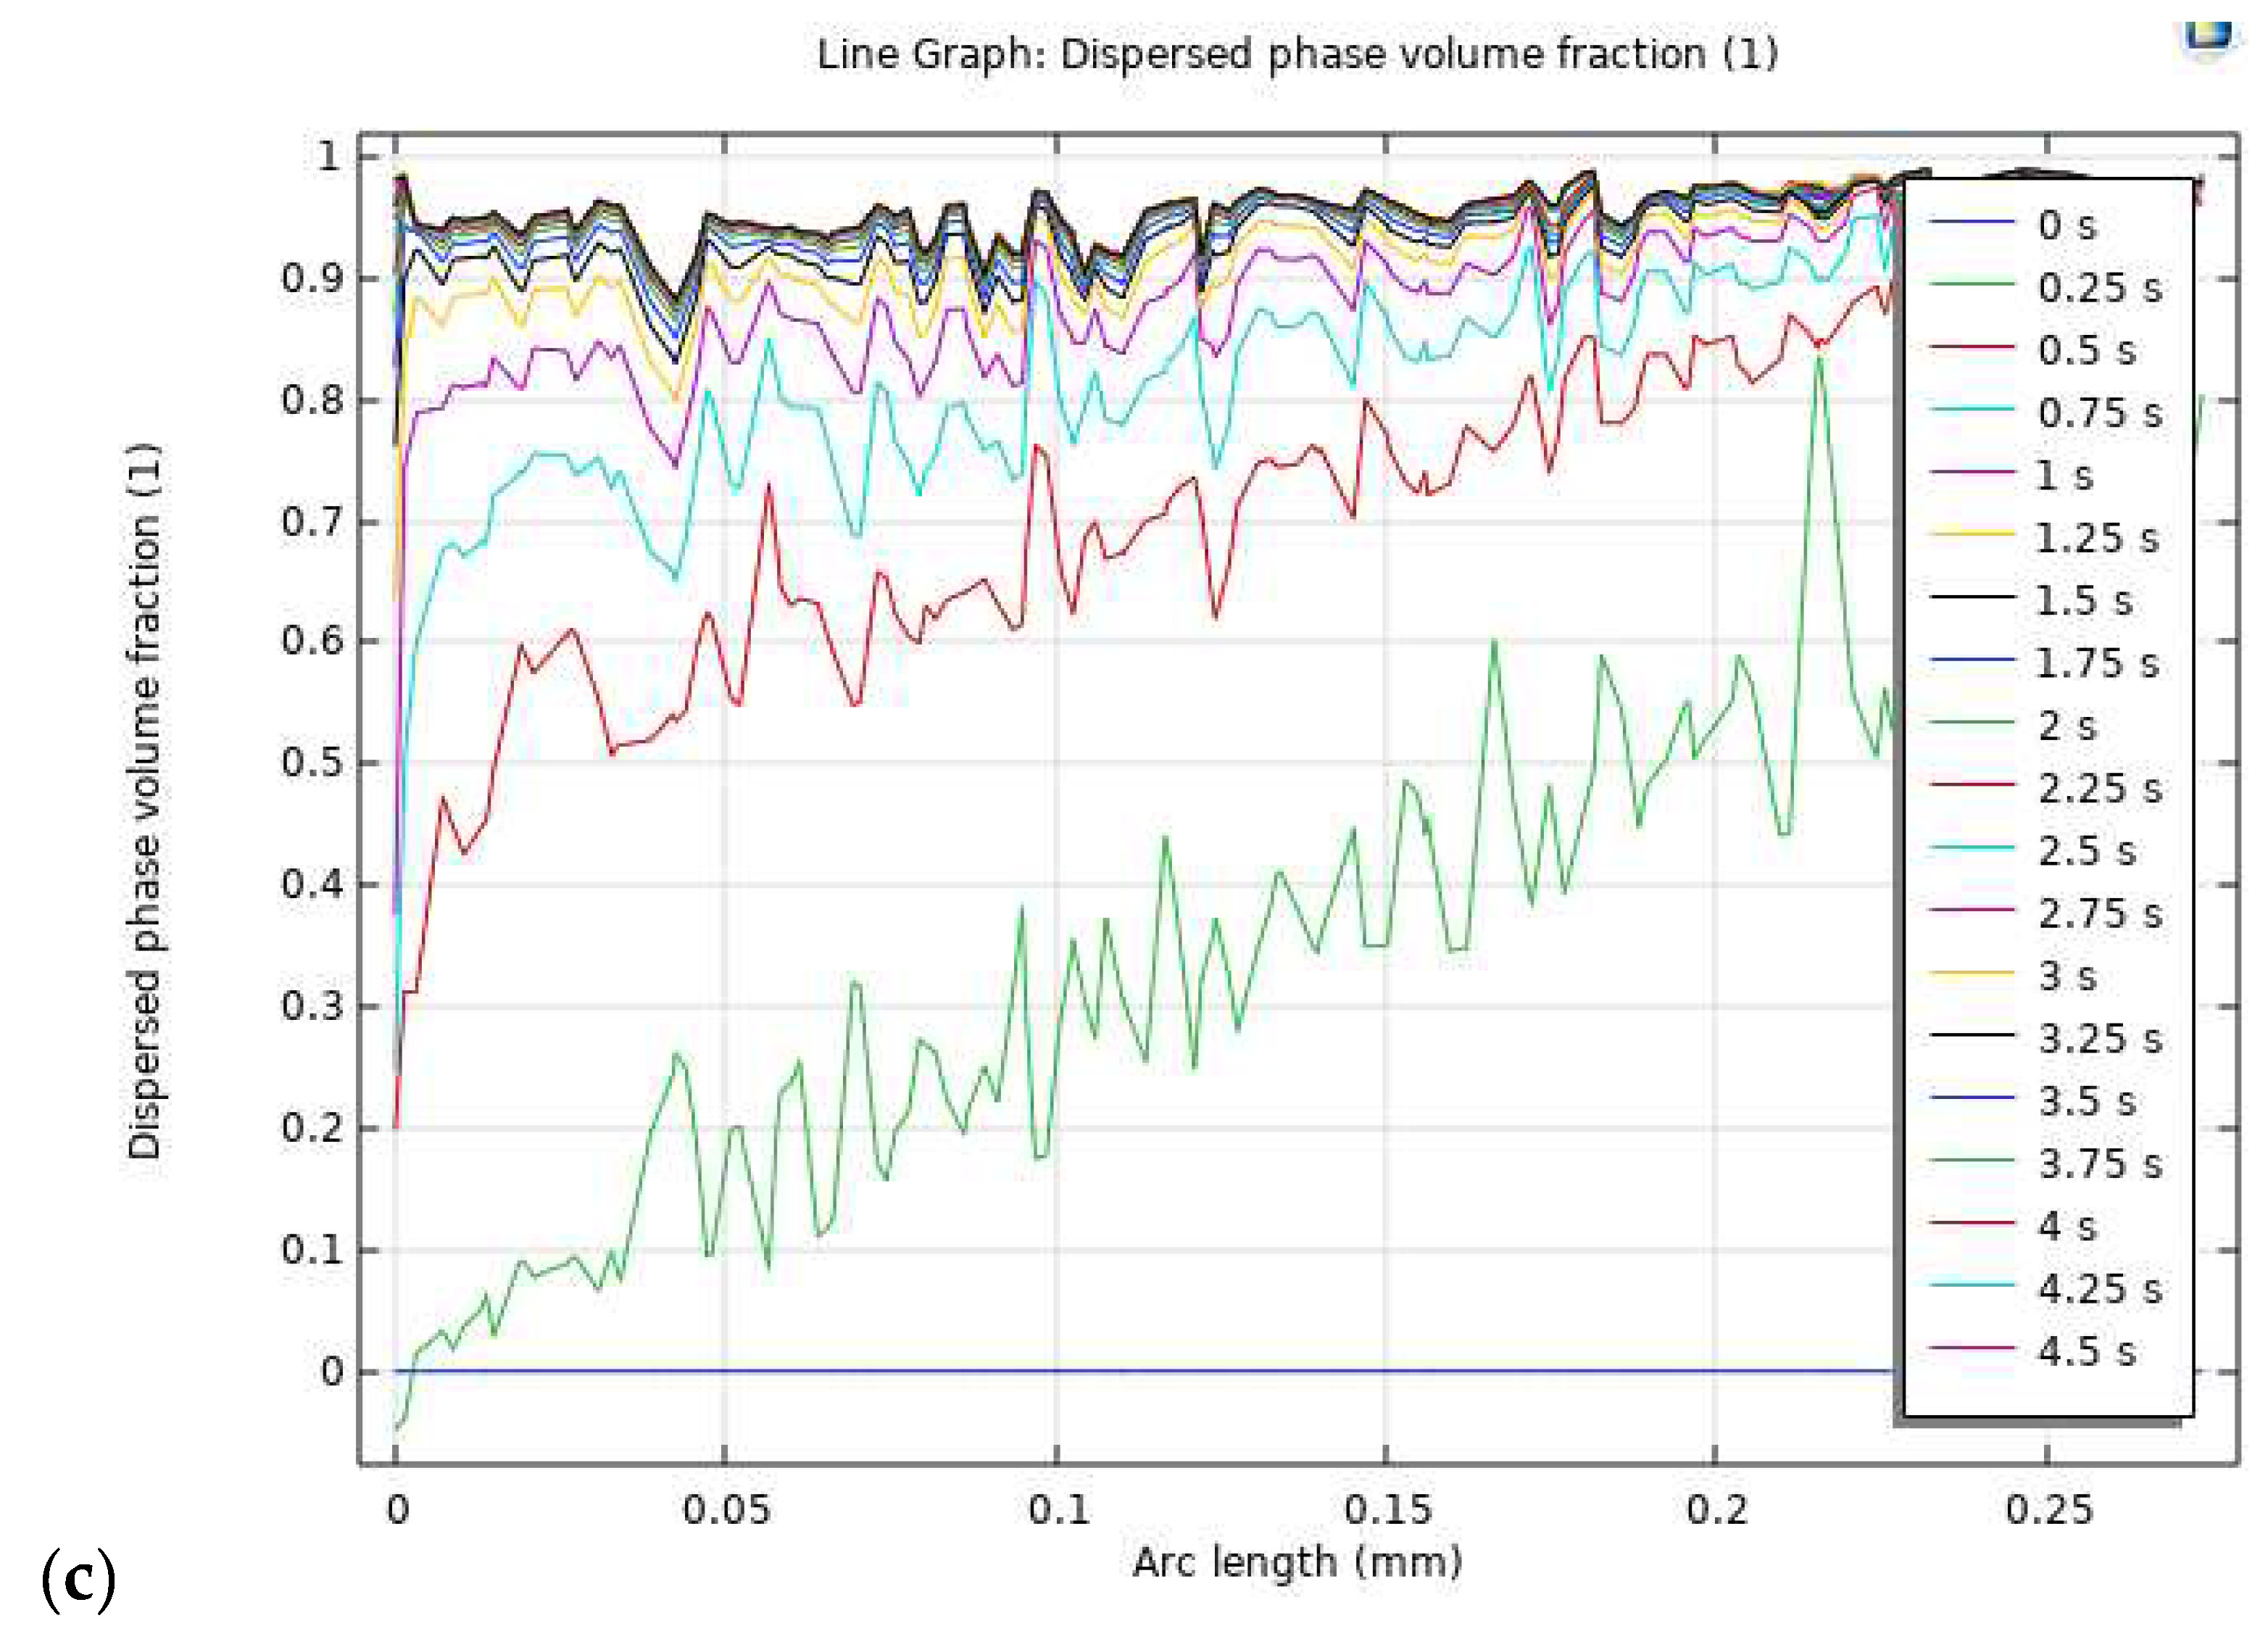
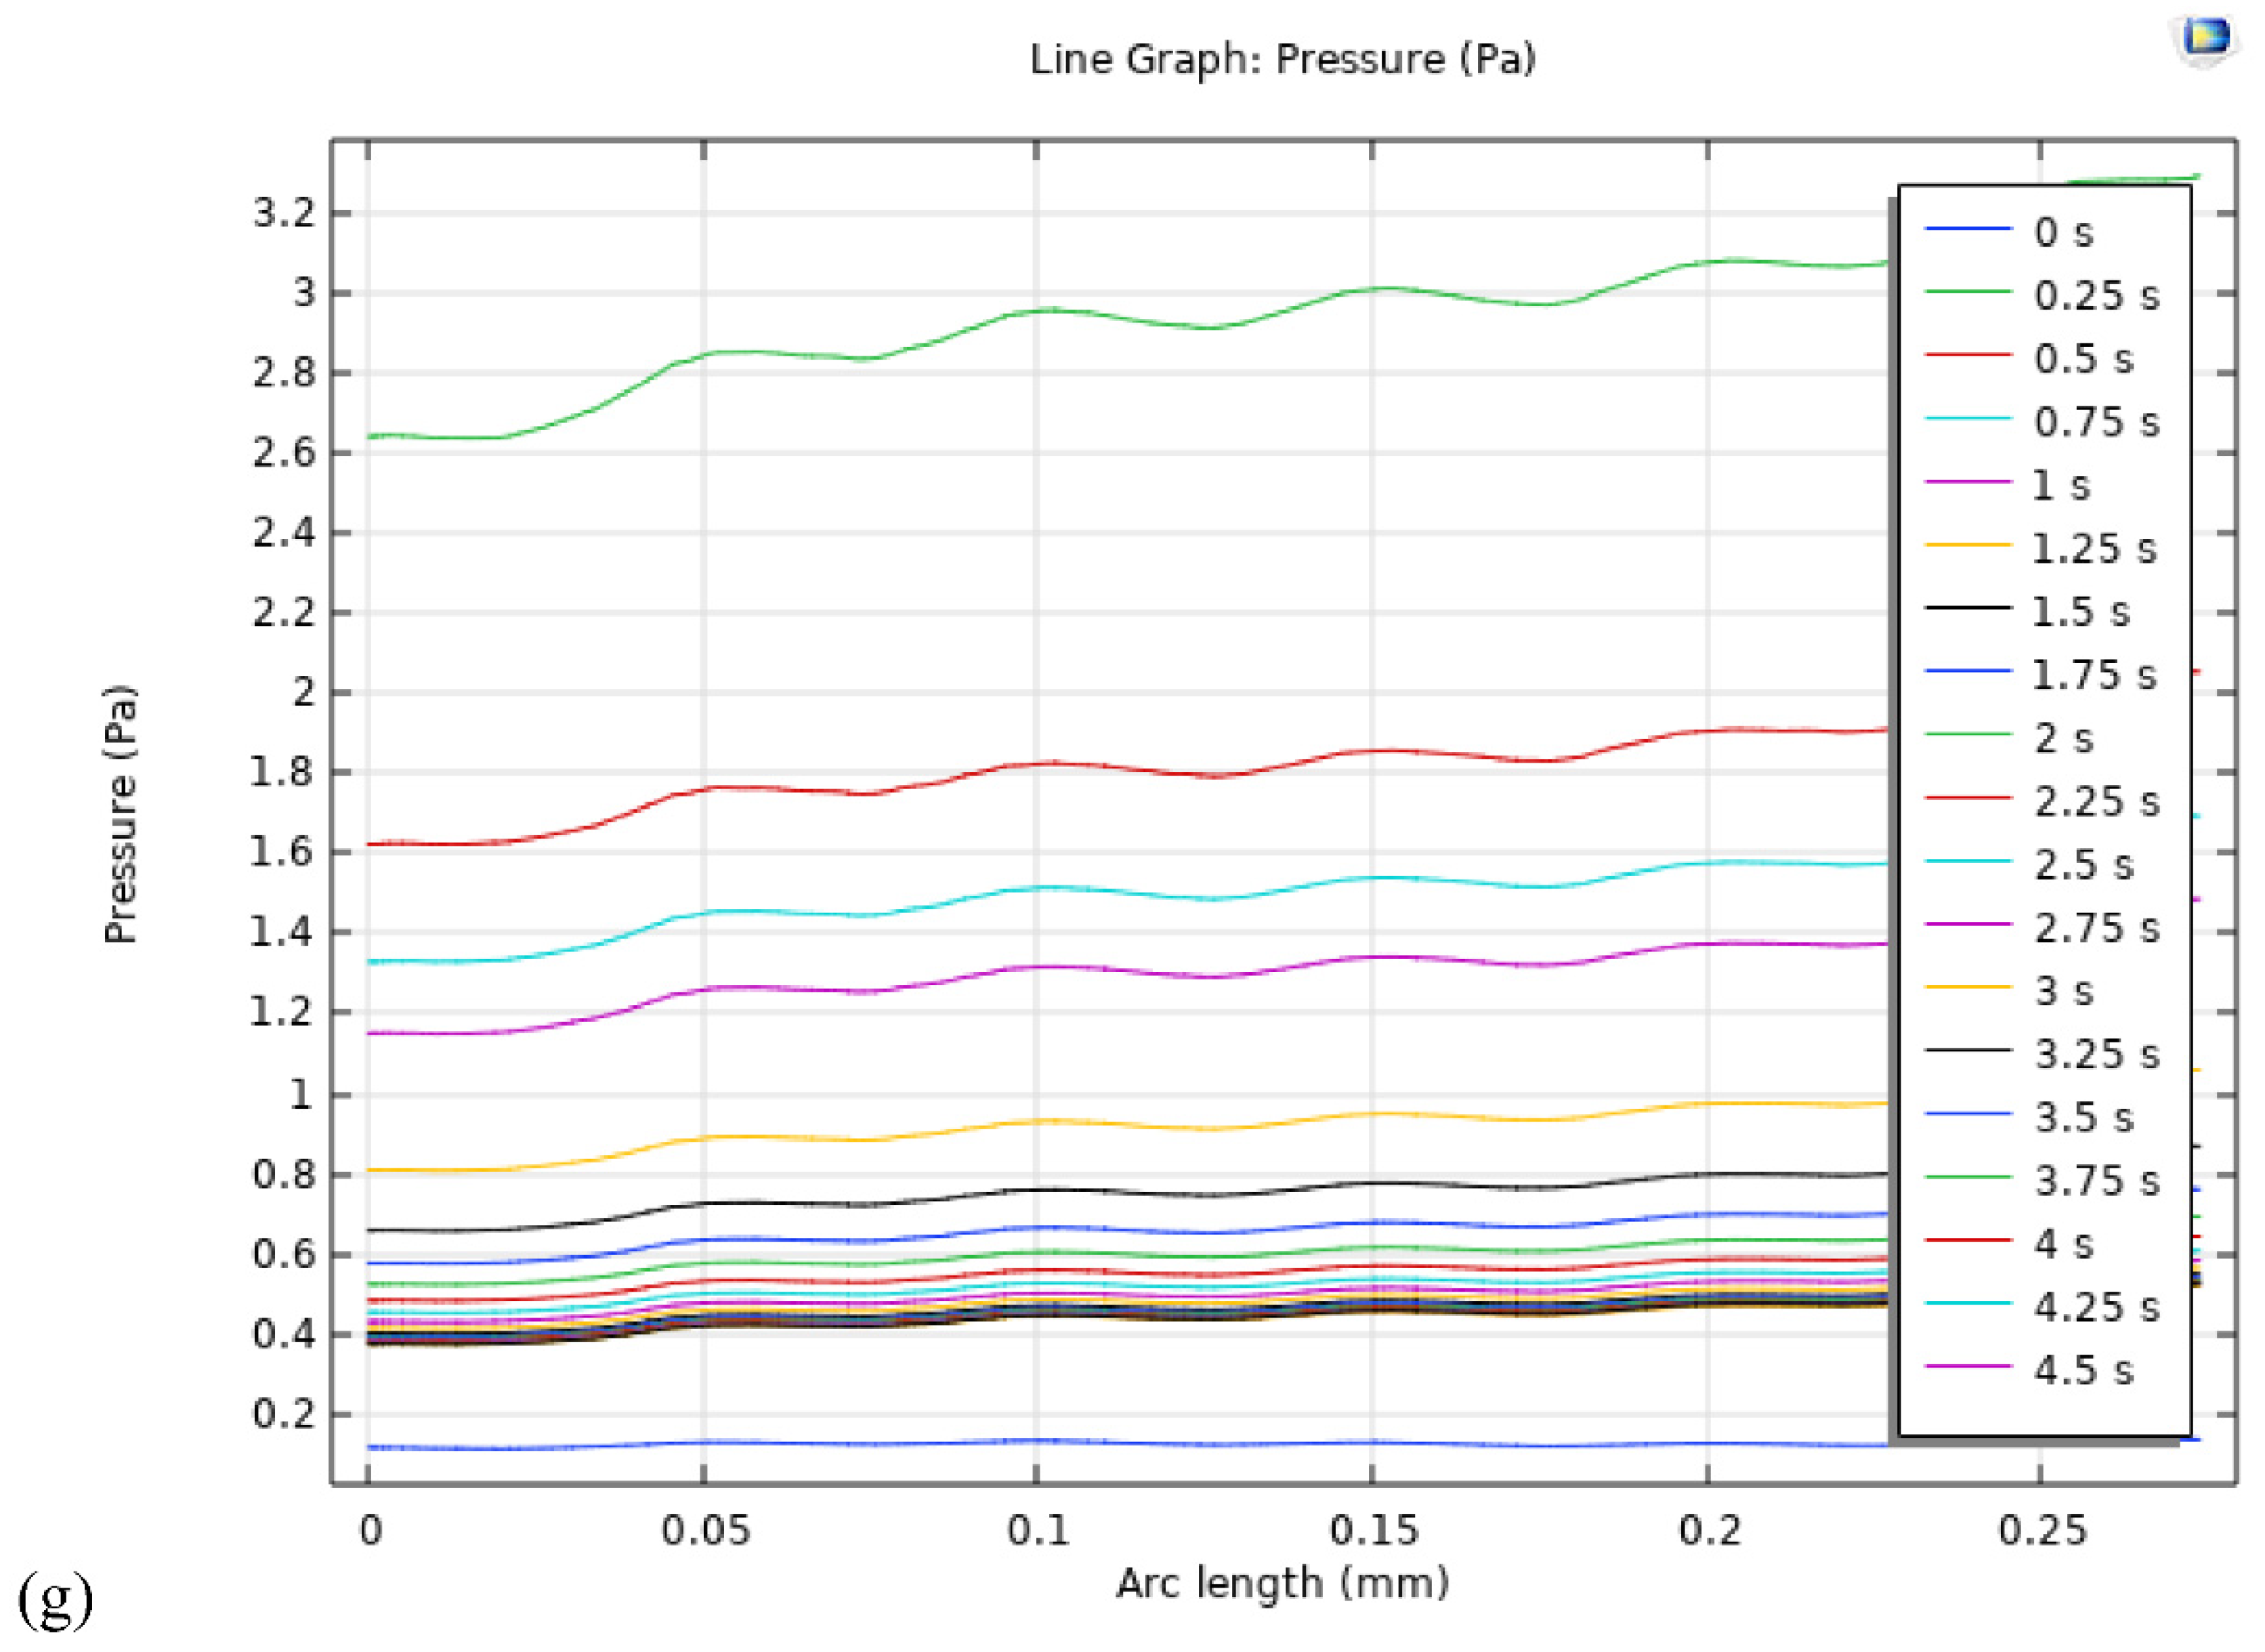
Figure 8g, provides a graphical representation of the pressure drop along the arc length at various time intervals, ranging from 0 s to 5 s with an interval of 0.25 s. The model records the highest pressure of 3.5 Pa at 0.25 s. As the simulation progresses, the pressure drop across the entire model exhibits a significant increase, primarily attributed to the evolving nature of the oxygen gas, as illustrated in
Figure 8g. These insights offer valuable implications for understanding the complex interplay of various factors influencing the pressure distribution within PEM electrolysis cells, thereby contributing to the advancement and optimization of PEM electrolysis technologies. Further investigations are recommended to delve deeper into the underlying mechanisms governing the pressure dynamics within the cell, facilitating the development of more efficient and sustainable energy conversion systems.
4. Conclusion
This study marks a pioneering attempt to utilize a two-phase flow mixture model to comprehensively examine the dynamics of oxygen generation within the designed 3D porous transport layer (PTL) of a PEM electrolyzer. The investigation focused on observing the computational dynamics of the PEM electrolyzer at various time intervals, contributing to the refinement of mass transfer losses and the mitigation of pressure drop within the system.
The key findings from this study are as follows:
The transfer of oxygen bubbles from lower to higher levels is observed to transpire within the time range of 0.75 s, shedding light on the intricate dynamics governing the movement of oxygen within the PTL.
The mass-averaged velocity attains its maximum value of 0.383 m/s in 0.75 s, indicating a rapid establishment of a constant flow distribution within a time frame of less than a second, persisting throughout the 5-second simulation period.
The study reveals a significant pressure drop of 37.5% between the time intervals of 0.25 s and 0.5 s. However, a moderate decline of approximately 20% in pressure drop is observed between 0.5 s and 1.0 s. As the simulation progresses, the pressure distribution within the model gradually becomes more uniform, emphasizing the evolving nature of the system dynamics.
Notably, the evolution of oxygen gas leads to a substantial increase in the pressure drop across the entire model over time, underscoring the dynamic interplay between the evolving gas composition and the intricate flow patterns within the PTL.
These observations contribute significantly to the comprehensive understanding of the intricate dynamics within the PEM electrolyzer, offering valuable insights for the advancement and optimization of PEM electrolysis systems. Further investigations building on these findings are recommended to deepen our understanding of the underlying mechanisms governing the performance of PEM electrolyzers, thereby facilitating the development of more efficient and sustainable energy conversion technologies.
Funding
This work was supported by the Ministry of Science and Technology [Project No: MOST111-2221-E-155-032].
Data Availability Statement
The data that support the findings of this study are available within the article.
Acknowledgments
We are grateful to Yuan Ze University and the Fuel Cell Centre for allowing us to perform this research in their distinguished facility. We sincerely thank Taiwan’s Ministry of Science and Technology for funding our project (Project No: MOST111-2221-E-155-032) at every stage; your assistance has been essential.
Conflicts of Interest
The authors declare no conflict of interest. The funders had no role in the design of the study; in the collection, analysis, or interpretation of data; in the writing of the manuscript; or in the decision to publish the results.
References
- Yari, M. Kalbasi, R., & Talebizadehsardari, P. (2019). Energetic-exergetic analysis of an air handling unit to reduce energy consumption by a novel creative idea. International Journal of Numerical Methods for Heat & Fluid Flow, 29(10), 3959-3975.
- Yaïci, W. Entchev, E., Talebizadehsardari, P., & Longo, M. (2020). Thermodynamic, economic and sustainability analysis of solar organic rankine cycle system with zeotropic working fluid mixtures for micro-cogeneration in buildings. Applied Sciences, 10(21), 7925.
- Yan, S. R. Fazilati, M. A., Samani, N., Ghasemi, H. R., Toghraie, D., Nguyen, Q., & Karimipour, A. (2020). Energy efficiency optimization of the waste heat recovery system with embedded phase change materials in greenhouses: a thermo-economic-environmental study. Journal of Energy Storage, 30, 101445.
- S.A. Bagherzadeh, B. Ruhani, M.M. Namar, et al., Compression ratio energy and exergy analysis of a developed Brayton-based power cycle employing CAES and ORC. J Therm Anal Calorim, J Therm. Anal. Calorim. 139 (2020) 2781–2790. [CrossRef]
- Cao, Y. Doustgani, A., Salehi, A., Nemati, M., Ghasemi, A., & Koohshekan, O. (2020). The economic evaluation of establishing a plant for producing biodiesel from edible oil wastes in oil-rich countries: Case study Iran. Energy, 213, 118760.
- Toghraie, D., Karami, A., Afrand, M., & Karimipour, A. (2018). Effects of geometric parameters on the performance of solar chimney power plants. Energy, 162, 1052-1061.
- Barnoon, P., Toghraie, D., Mehmandoust, B., Fazilati, M. A., & Eftekhari, S. A. (2021). Comprehensive study on hydrogen production via propane steam reforming inside a reactor. Energy Reports, 7, 929-941.
- Eisapour, A. H., Naghizadeh, A., Eisapour, M., & Talebizadehsardari, P. (2021). Optimal design of a metal hydride hydrogen storage bed using a helical coil heat exchanger along with a central return tube during the absorption process. International journal of hydrogen energy, 46(27), 14478-14493.
- Karim, S. H. T. Tofiq, T. A., Shariati, M., Rad, H. N., & Ghasemi, A. (2021). 4E analyses and multi-objective optimization of a solar-based combined cooling, heating, and power system for residential applications. Energy reports, 7, 1780-1797. [CrossRef]
- Suermann, M. Schmidt, T. J., & Büchi, F. N. (2015). Investigation of mass transport losses in polymer electrolyte electrolysis cells. Ecs Transactions, 69(17), 1141.
- Marangio, F. Santarelli, M., & Calì, M. (2009). Theoretical model and experimental analysisof a high-pressure PEM water electrolyser for hydrogen production. International journal of hydrogen energy, 34(3), 1143-1158.
- Hwang, C. M. Ishida, M., Ito, H., Maeda, T., Nakano, A., Hasegawa, Y.,... & Yoshida, T. (2011). Influence of properties of gas diffusion layers on the performance of polymer electrolyte-based unitized reversible fuel cells. International journal of hydrogen energy, 36(2), 1740-1753. [CrossRef]
- Ito, H. Maeda, T., Nakano, A., Hwang, C. M., Ishida, M., Kato, A., & Yoshida, T. (2012). Experimental study on porous current collectors of PEM electrolyzers. International journal of hydrogen energy, 37(9), 7418-7428.
- Arbabi, F. Kalantarian, A., Abouatallah, R., Wang, R., Wallace, J., & Bazylak, A. (2013). Visualizing bubble flows in electrolyzer GDLs using microfluidic platforms. ECS Transactions, 58(1), 907.
- Arbabi, F. Kalantarian, A., Abouatallah, R., Wang, R., Wallace, J. S., & Bazylak, A. (2014). Feasibility study of using microfluidic platforms for visualizing bubble flows in electrolyzer gas diffusion layers. Journal of Power Sources, 258, 142-149.
- Panchenko, O. Borgardt, E., Zwaygardt, W., Hackemüller, F. J., Bram, M., Kardjilov, N., & Lehnert, W. (2018). In-situ two-phase flow investigation of different porous transport layer for a polymer electrolyte membrane (PEM) electrolyzer with neutron spectroscopy. Journal of Power Sources, 390, 108-115.
- Lee, J. K. Lee, C. H., & Bazylak, A. (2019). Pore network modelling to enhance liquid water transport through porous transport layers for polymer electrolyte membrane electrolyzers. Journal of Power Sources, 437, 226910.
- Wang, W. Yu, S., Li, K., Ding, L., Xie, Z., Li, Y.,... & Zhang, F. Y. (2021). Insights into the rapid two-phase transport dynamics in different structured porous transport layers of water electrolyzers through high-speed visualization. Journal of Power Sources, 516, 230641. [CrossRef]
- Barnoon, P. Toghraie, D., & Karimipour, A. (2021). Application of rotating circular obstacles in improving ferrofluid heat transfer in an enclosure saturated with porous medium subjected to a magnetic field. Journal of Thermal Analysis and Calorimetry, 145, 3301-3323. [CrossRef]
- Silva, R. Garcia, F. A., Faia, P. M., & Rasteiro, M. G. (2015). Evaluating the performance of the mixture model coupled with high and low reynolds turbulence closures in the numerical description of concentrated solid-liquid flows of settling particles. The Journal of Computational Multiphase Flows, 7(4), 241-257. [CrossRef]
- Shahsavar, S. Noori, D. Toghraie, P. Barnoon, Free convection of non-Newtonian Nano fluid flow inside an eccentric annulus from the point of view of first-law and second-law of thermodynamics, J. Appl. Math. Mech. (2020). [CrossRef]
- Seweryn, J. Biesdorf, J., Schmidt, T. J., & Boillat, P. (2016). Communication—neutron radiography of the water/gas distribution in the porous layers of an operating electrolyser. Journal of The Electrochemical Society, 163(11), F3009. [CrossRef]
- Cui, F. Hong, F., Li, C., & Cheng, P. (2019). Two-phase flow instability in distributed jet array impingement boiling on pin-fin structured surface and its affecting factors. International Journal of Heat and Mass Transfer, 143, 118495. [CrossRef]
- Zhou, H. Meng, K., Chen, W., & Chen, B. (2022). 3D two-phase and non-isothermal modeling for PEM water electrolyzer: Heat and mass transfer characteristic investigation. International Journal of Energy Research, 46(12), 17126-17143. [CrossRef]
- Nie, J. & Chen, Y. (2010). Numerical modeling of three-dimensional two-phase gas–liquid flow in the flow field plate of a PEM electrolysis cell. International Journal of Hydrogen Energy, 35(8), 3183-3197. [CrossRef]
|
Disclaimer/Publisher’s Note: The statements, opinions and data contained in all publications are solely those of the individual author(s) and contributor(s) and not of MDPI and/or the editor(s). MDPI and/or the editor(s) disclaim responsibility for any injury to people or property resulting from any ideas, methods, instructions or products referred to in the content. |
© 2023 by the authors. Licensee MDPI, Basel, Switzerland. This article is an open access article distributed under the terms and conditions of the Creative Commons Attribution (CC BY) license (http://creativecommons.org/licenses/by/4.0/).
