Preprint
Article

Study on Novel Solid-State Forms of Sorafenib with Advantages in Terms of Solubility

Altmetrics

Downloads

166

Views

63

Comments

0

Submitted:

15 November 2023

Posted:

16 November 2023

You are already at the latest version

Alerts
Abstract
The development of solid-state forms of drugs is an effective mean of solubility enhancement. In this study, two polymorphs named form C, form D, and two co-crystals of sorafenib (SF) with oxalic acid (SF-OA) and malonic acid (SF-MA), by evaporation and slurry method, have been developed and characterized. The single-crystal X-ray diffraction results showed that the structure of form C was similar to of form I. It had similar cellular parameters, but different arrangement of stacking due to π-π conjugation. The drug molecules in SF-OA underwent torsional folding through four hydrogen bonds of intermolecular and intramolecular. The solubility performance of solid-state forms improved significantly. Compared with form I, form C and form D were 1.59, 1.49 times at pH 1.2 HCl, 1.59, 1.87 fold at pH 6.8 PBS. In particular, the SF-OA and SF-MA increased the apparent solubility of SF at pH 1.2 by 8.3 and 6.4 times, at pH 6.8 by 4.0 and 4.5 times respectively. The dissolution mechanisms were analyzed. New solid-state forms showed strong stability at storage conditions of 40 °C/75% RH and 60 °C/0% RH. Notably, the crystal of SF preferred to transform in mixed solvents, and the formation of co-crystals confirmed the ∆pKa rule.
Keywords: 
Subject: Chemistry and Materials Science  -   Medicinal Chemistry

1. Introduction

The field of drug discovery faces its biggest challenge in enhancing drug solubility [1]. Research has revealed that approximately 40% of drugs on the market and up to 90% of drugs in the development phase have low solubility[2]. It is well-known that different solid forms of a drug possess distinct physicochemical characteristics that influence its solubility, melting point, dissolution, and stability [3,4,5,6]. Therefore the solid forms of active pharmaceutical ingredients (API), including salts, polymorphs, solvates and co-crystals are gained increasing interest in the pharmaceutical field for modifying the physicochemical properties of API [7,8,9]. Indeed, the advantages for developing solid-state of drug have been proven to improve the solubility properties of the drug and thus the bioavailability. Maniruzzaman et al [10] used Hydrophilic Plasdone ® S630 copovidone (S630), Eudragit ® EPO (EPO) and other macromers to induce micro-nano paracetamol crystal from stable form I to metastable form II, the dissolution rate of 30 min can be increased to more than 90%. Drozd et al [11] used succinic, maleic and dl-tartaric acids to prepare miconazole co-crystals, in-vitro studies revealed that the miconazole multicomponent crystals indicated the higher peak blood concentration values 2.4-, 2.9- and 4.6-fold higher than the API.
Sorafenib(SF,4-[4-[[4-chloro-3-(trifluoromethyl)phenyl]carbamoylamino]phen-oxy]-N-methyl-pyridine-2-carboxamide), is an oral multi-kinase inhibitor which was developed by Bayer and Onyx Pharmaceuticals [12,13,14,15]. It specifically targets the serine/threonine kinase of the Ras-Mitogen-Activated protein kinases pathway with a dual antitumor mechanism [16,17,18,19]. It was approved by the U.S. Food and Drug Administration (FDA) for the treatment of advanced renal cell carcinoma and as a first-line drug for advanced hepatocellular carcinoma [20,21]. Sorafenib belongs to a Biopharmaceutics Classification System (BCS) class II with high permeability but poorly aqueous solubility, with a low bioavailability of 8.4% [22,23]. The marketed active substance sorafenib tosylate (SFN) is also BCS class II with low aqueous solubility (insoluble in pH 1~6) [24]. It is common knowledge that the solubility and dissolution rate of oral drugs in the gastrointestinal tract is one of the most important factors regulating their bioavailability [25,26]. Therefore, various papers have been reported to improve the solubility and bioavailability of SF, such as suspensions [27], nanocomplexes [28,29] and liposomes [30,31]. Currently, the solid forms of SF were reported including solvates [32,33], salts [34] and co-crystals [35]. However, reports on the polymorphs and co-crystals of SF free base are still few. Up to now, only four polymorphs and a co-crystal have been reported without physical property studies, which are form I [36], form A [37], form B [38], form X [39] and SF-FU [35]. Herein, we attempted to develop extensive solid-state forms of SF and investigate their solubility, dissolution rate and stability.
Figure 1. The chemical structure of sorafenib.
Preprints 90558 g001
In this study, there are two polymorphs (form C and form D) and two co-crystals (SF-OA, SF-MA) of SF with advanced solubility, which were explored by solvent methods. The crystal structure of the above samples was characterized by powder X-ray diffraction (PXRD) and Fourier transform infrared (FT-IR) spectroscopy. The thermodynamic parameters were investigated by differential scanning calorimetry (DSC), thermogravimetric analysis (TGA), polarizing light microscopy (PLM), and hot-stage polarizing light microscopy (HSPLM). The single crystals of form C and SF-OA were cultured by volatilization and diffusion crystallization, which were determined by single-crystal X-ray diffraction (SCXRD). Furthermore, we utilized specialized software to simulate the specific structure and conduct an in-depth analysis of the crystal structure. The solubility performance of the crystals was assessed with SF API through solubility and dissolution experiments. In addition, the stability of the solid-state forms was evaluated through stability experiments.

2. Experimental Section

2.1. Materials and Apparatus

Sorafenib (C21H16ClF3N4O3, MW=464.82, form I) was provided (purity>99% ) by Lian Shuo Biotechnology Co., Ltd. (Zhejiang, China) without further purification. Oxalic acid (OA) was purchased from Aladdin Bio-Chem Technology Co., Ltd., China. Malic acid (MA) was supplied by Sinopharm Chemical Reagent Co., Ltd., China. Acetonitrile (CAN, Tedia, HPLC grade) was purchased from Fangping Chemical Co., Ltd. (Zhejiang, China). Other analytical grade solvents were purchased from Sinopharm Chemical Reagent Co., Ltd., China. An ultrasound generator was purchased from Kun Shan Ultrasonic Instruments Co., Ltd. (Jiangsu Province, China).

2.2. Polymorphs Screening Experiments

As well known, the growth of crystals is affected by external factors, such as temperature, solvent and crystallize method etc. In order to obtain polymorphs with great performance, various solvent and multiple methods have been chosen to screen polymorphs, like the evaporation method, steam diffusion method, slurry method, melting method and antisolvent method. In addition, we control the condition of crystal growth by regulating the temperature, solvent ratio, dosage of drug and so on.

2.2.1. Preparations of form A

About 80 mg of SF was dissolved in 14 mL of dichloromethane/methanol (6:1, v:v), which was heated and refluxed for 10 min. After cooling down to room temperature, it was stirred for 2 h. Finally, form A was obtained by crystallization.

2.2.2. Preparations of form C

About 50 mg of SF was dissolved in 20 mL of methanol/H2O (6:1, v:v) to obtain a saturated solution. Then, the clear solution was filtered by a nylon membrane filter (0.22 μm) subsequently. The solution was evaporated at 60 ℃ by an oil bath. Finally, form C was obtained by evaporation crystallization.

2.2.3. Preparations of form D

About 30 mg of SF was dissolved in 2 mL of glacial acetic acid using an ultrasound generator to obtain clear solution. Then, form D was obtained by open evaporation at above 25 ℃ for one week.

2.2.4. Preparations of form X

SF was dissolved in methanol, the solution was stirred (300 rpm) at 62 ℃. The solution then was filtered (0.22 μm) and transferred into 20 mL glass penicillin bottle. The solution (contained 40 mg of SF) was magnetically stirred followed by addition of 12 mL H2O stepwise till precipitate appeared. Finally, the solid was obtained by centrifugation and dried under vacuum at 40 ℃ for 24 h.

2.2.5. Preparations of amorphous

About 100 mg of SF was put into a 100 ml round-bottom flask, heated to 230 ℃ in an oil bath, and kept for 10 min. Subsequently, it was taken out and cooled down to room temperature. Finally, amorphous was obtained by grinding.

2.3. Co-crystal Screening Experiments

SF is weakly basic compound (pKa 2.03) and can be crystallized with acidic CCFs. The ∆pKa (∆pKa=pKabase - pKaacid) rule is a useful tool for co-crystal screening [4,40]. The FDA suggested that the co-crystals will be formed when ΔpKa less than 1[41]. To verify the ΔpKa rules, different dicarboxylic acid co-former (Oxalic acid, Malonic acid, Succinic acid, Glutaric acid, Adipic acid and Pimelic acid) were selected to synthesize SF co-crystals. The chemical structure and pKa of crystal co-former (CCFs) were summarized in supporting materials Figure S1 and Table S1. Two new co-crystals were developed by experiments.

2.3.1. Preparations of Co-crystals

Sorafenib-Oxalic acid (SF-OA) co-crystal: 80.0 mg of SF and 15.5 mg of OA (1:1, molar ratio) were transferred to 4 mL of dichloromethane in a 10 mL glass penicillin bottle. The slurry suspension was stirred at 700 rpm for 24 h under room temperature. The resulting slurry was filtered and the resulting solid was dried under vacuum at 50 ℃ for 24 h.
Sorafenib-Malonic acid (SF-MA) co-crystal: 80.0 mg of SF and 17.9 mg of MA (1:1, molar ratio) were transferred to 4 mL of dichloromethane in a 10 mL glass penicillin bottle. The slurry suspension was stirred at 700 rpm for 24 h under room temperature. The resulting slurry was filtered and the resulting solid was dried under vacuum at 50 ℃ for 24 h.

2.3.2. Preparations of Physical Mixtures

Sorafenib and Oxalic acid physical mixture (SF-OA PM): 80.0 mg of SF and 15.5 mg of OA (1:1, molar ratio) were ground in mortar with pestle for 10 min (no mechanical activation).
Sorafenib and Malonic acid physical mixture (SF-MA PM): 80.0 mg of SF and 17.9 mg of MA (1:1, molar ratio) were ground in mortar with pestle for 10 min (no mechanical activation).

2.3.3. Stoichiometry Studies of SF Co-crystals

80 mg of SF and OA or MA were weighed with different molar ratios (1:1, 1:2, 2:1) into glass penicillin bottle. Then, add 4 mL dichloromethane. The suspension was stirred at 700 rpm under room temperature for 24 h. The resulting slurry was filtered and the resulting solid was dried under vacuum at 50 ℃ for 24 h.

2.4. Single Crystal Growth

Form C: A solution of methanol/H2O (6:1, v/v) was prepared and placed in the sonicator for thorough mixing. 30.0 mg of SF dissolved in 15 mL of the above solution, then put in the sonicator for faster dissolution. Until the solution became clear, placed it into a water bath at 60 ℃ for 6 h.
SF-OA: 80.0 mg of SF and 15.5 mg of OA were dissolved in 2 mL of tetrahydrofuran (THF), and filtered by a nylon membrane filter (0.22 μm) in a 5 mL penicillin bottle. Then, 1mL THF was added to the penicillin bottle. Meanwhile, 5 mL of n-hexane was poured into a clean penicillin bottle with a capacity of 20 mL. Then, exposure to a 20 mL penicillin bottle containing n-hexane, and the penicillin bottle was sealed and placed in a dark and dry environment. The single crystal would be growing in 10 days.

2.5. Solid characterization

2.5.1. Powder X-ray Diffraction (PXRD)

Powder X-ray diffraction studies were carried out in Bruker D2 Phaser diffractometer system (Karlsruhe, Germany) with Cu-Kα radiation source (a wavelength of 1.5418 Å). The voltage and the current were set as 30 kV and 10 mA, respectively. All the samples were placed on sample pan and gently flattened as thin layers for detection. It was scanned in the range of 3 to 40° and the step time was set as 0.2 s with a step length of 0.02°.

2.5.2. Single-Crystal X-ray Diffraction (SCXRD).

Single crystals of form C and SF-OA were obtained by solvent method. Crystals with better shape were selected and tested on Bruker D8 Venture diffractometer (Karlsruhe, Germany). The source of radiation is Mo-Kα with wavelength of 0.71073 Å. The crystal was kept at 170.00 K during data collection. Using Olex2 [42], the structure was solved with the SHELXT [43] structure solution program using Intrinsic Phasing and refined with the SHELXL[44] refinement package using Least Squares minimization [45]. The acquired crystal information files were deposited in Cambridge Crystallographic Database Centre (CCDC) to obtain the deposition numbers, which are 2290456 (form C) and 2290468 (SF-OA), respectively. The Figure S2 and Figure S3 for structural formula and the atom numbers of the form C and SF-OA molecules were simulated by Diamond 4.0 [46].

2.5.3. Differential Scanning Calorimetry (DSC)

DSC was performed in a TA Instrument Discovery DSC 250 (New Castle, Delaware, USA). About 3-5 mg of sample was weighed and put into aluminum pans. Each one was heated from 40 ℃ to 230 ℃ at a constant heating rate of 10 ℃/min under continuous dry nitrogen gas purge (50 mL/min). The obtained data were analyzed by using Trios Software, which included peak melting point (Tm) and melting enthalpy (∆Hm).

2.5.4. Thermogravimetric Analysis (TGA)

TGA measurements were conducted using a TA Instrument Discovery TGA Q500 (New Castle, Delaware, USA). About 5-10 mg of sample was placed in an opening platinum crucible. Each one was heated from 40 ℃ to 300 ℃ at a constant heating rate of 10 ℃/min under continuous dry nitrogen gas purge (50 mL/min).

2.5.5. Polarizing Light Microscopy and Hot-Stage Polarizing Light Microscopy (PLM and HSPLM)

HSPLM consists of a hot-stage and the OlympusCX41+HTC polarizing light microscopy with one polarizer (Olympus Co., Ltd., Shanghai, China), and the microscope was connected to the computer by means of a video camera. All the samples were observed their crystal shape by polarized light microscopy without hot-stage. However, form D, SF-OA and SF-MA possessed unique thermal behavior, which were spilled on the coverslip (1.8 cm*1.8 cm*0.01 cm) and placed on the hot-stage. Observation of crystal shape changes in the solid-state form and verification of its thermal behavior by adjusting the endpoint temperature and time consumption on the hot-stage.

2.5.6. Fourier Transform Infrared Spectroscopy (FT-IR)

A Nicolet iS50 Avatar 370 FT-IR spectrometer (Thermo, USA) was used to record the FT-IR spectroscopy of each sample. Spectra in the wavenumber of 400-4000 cm-1 were acquired with a total of 32 scans and a spectral resolution of 4 cm-1. The data were analyzed with the software Origin 8.

2.5.7. High-Performance Liquid Chromatography (HPLC)

The concentration detection was determined by an HPLC system (Agilent Technologies Inc., CA, USA) with a reverse-phase Welch Welchrom-C18 column (5 μm*4.6 mm*250 mm) and a UV detection wavelength of 265 nm. The mobile phase consisted of acetonitrile and 0.02 M acetic acid solution of pH 5.5 (65:35, v/v) with a flow rate of 1.0 mL· min-1. The column temperature and the injection volume were 30 ℃ and 10 μL, respectively.

2.6. Solubility and In-vitro Dissolution Experiments

2.6.1. Solubility and Kinetic Solubility Experiments

SF and two new polymorphs were milled and passed through a 60 mesh screen to obtain particles of similar particle size. The above sample was poured into a hydrochloric acid solution (pH 1.2 HCl) and phosphate buffer solution (PBS, pH 6.8) containing 0.2% sodium dodecyl sulfate (SDS), which ensured it could not be completely dissolved. After stirring at 200 rpm for 24 h in a 37 ℃ water bath, a suspension is obtained and filtered through a 0.22 μm nylon-66 filter. Then, the concentration of SF was determined by HPLC, and the solubility was calculated by the calibration curve. The solubility experiments were performed in triplicate (n = 3).
SF, two co-crystals and the physical mixtures were milled and passed through a 60 mesh screen to obtain particles of similar particle size. Add 200 mL of media to a 250 mL beaker and pre-warm the medium solution in a water bath at 37 ℃. Weighed the excess sample and poured it into a beaker, and stirred at 150 rpm in a constant temperature water bath. The excess sample was dissolved in the medium, and the sample solution was aspirated and passed through the needle filter at 2, 5, 10, 15, 30, 60, 90 and 120 min, respectively. After filtering through a 0.22 μm nylon-66 filter, the content of SF was detected and analyzed by HPLC. The filtered liquor was analyzed by HPLC to quantify the concentration of SF. The dissolution experiments were performed in triplicate (n = 3).

2.6.2. In-vitro Dissolution Experiments

The RC-6 dissolution apparatus (China) was implemented for the dissolution study. The dissolution of SF, two polymorphs and the physical mixtures were milled to powders and sieved using 60-mesh to decrease the influence of particle size for powder dissolution experiments. Took all the samples into 900 mL of pH 1.2 HCl and pH 6.8 PBS (containing 0.2% SDS). The stirring speed was 75 rpm and the temperature was maintained at 37±0.5 ℃. The samples were withdrawn at 5 mL for 5, 15, 30, 60, 90, 120, 240, 360 and 720 min while supplemented with 5 mL fresh buffer solution. The resulting samples were filtered through a 0.22 μm nylon-66 filter. The filtered liquor was analyzed by HPLC to quantify the concentration of SF. The dissolution experiments were performed in triplicate (n = 3).

2.7. Stability Test

The unexpected physical changes of polymorphs and co-crystals could be triggered by high temperatures and environmental humidity. Stability tests were performed to investigate the physical and chemical stability of all the samples. After being exposed to 40 ℃/75% RH for 60 days and 60 ℃/0% RH for 30 days, the samples were analyzed using PXRD to determine possible phase changes and chemical degradation. The stability tests were performed in triplicate (n = 3).

3. Results and Discussion

3.1. Experimental Results

3.1.1. Solid-state Form Screening Results

To screen new solid-state form with better performance, we conducted a large number of experiments by varying the crystallization method, solvent, temperature, solvent ratios and CCFs. At the same time, all the experiments were repeated 3 times to ensure the accuracy. The results of solid-state form screening were summarized in Table 1. Two new polymorphs were screened using the solvent evaporation method with slow or rapid speed, melting method and antisolvent method, named form C and form D. More specific results could be found in Table S2. Two novel co-crystals were obtained by slurry method, named SF-OA and SF-MA. Meanwhile, the results of screening experiments for SF and CCFs in slurry method were shown in Table S3. It is worth noting that amorphous [47], form A [37] and form X [39] have been reported. Furthermore, SF would be transformed into amorphous during high-temperature melting, which was different from the reported methods. Through the polymorphs screening results, it could be found that the crystal of SF is more prone to transform in mixed solvents than a single solvent. Through the co-crystal screening results, only two co-formers with ∆pKa less than 1 formed co-crystals with SF (SF-OA and SF-MA), confirming the rules of ∆pKa.

3.1.2. Stoichiometry Studies of SF Co-crystals

SF and dicarboxylic acid have abundant hydrogen bonding sites, suggesting that the components of SF co-crystals may have more stoichiometric ratios. Therefore, the stoichiometry studies of SF co-crystals were performed and the results are shown in Figure 2. From the PXRD spectra (Figure 2 (a)), we could observe that new characteristic peaks with a stoichiometric ratio (SF : OA) of 1:1 appear at 16.28°, 17.22° and 18.98°, while both the characteristic peaks belonging to SF and OA disappear. Crystals with a stoichiometric ratio of 1:2 had characteristic peaks at 7.32°, 18.68° and 27.23°, whereas a stoichiometric ratio of 2:1 was similar to a SF proprietary peak. Combined with the DSC curves Figure 2 (b), it could be observed that the crystal with a stoichiometric ratio of 1:1 had a melting peak, yet 1:2 had multiple melting peaks, and the crystal with a stoichiometric ratio of 2:1 appeared a broad peak and a sharp molten peak. Since general crystals only has a melting point, we speculated that the crystals obtained by stoichiometric ratios of 1:2 and 2:1 were not pure and may contain OA or SF with excess.
The PXRD was shown in Figure 2 (c), we could see that the characteristic peaks with the stoichiometric ratios (SF : MA) of 1:1 and 1:2 basically coincide, while crystals with a stoichiometric ratio of 2:1 have characteristic peaks of SF at 24.98°. From the DSC curve in Figure 2 (d), the stoichiometric ratios of 1:2 and 2:1 have multiple melting points. It is obvious that crystals with a stoichiometric ratio of 1:2 and 2:1 are mixed crystals.
Hence, it was found that pure co-crystals could be obtained when the stoichiometry ratio of SF with OA and MA was 1:1. The following characterization of co-crystals is prepared with a stoichiometric ratio of 1:1.

3.2. Results of Characterization

3.2.1. PXRD Patterns

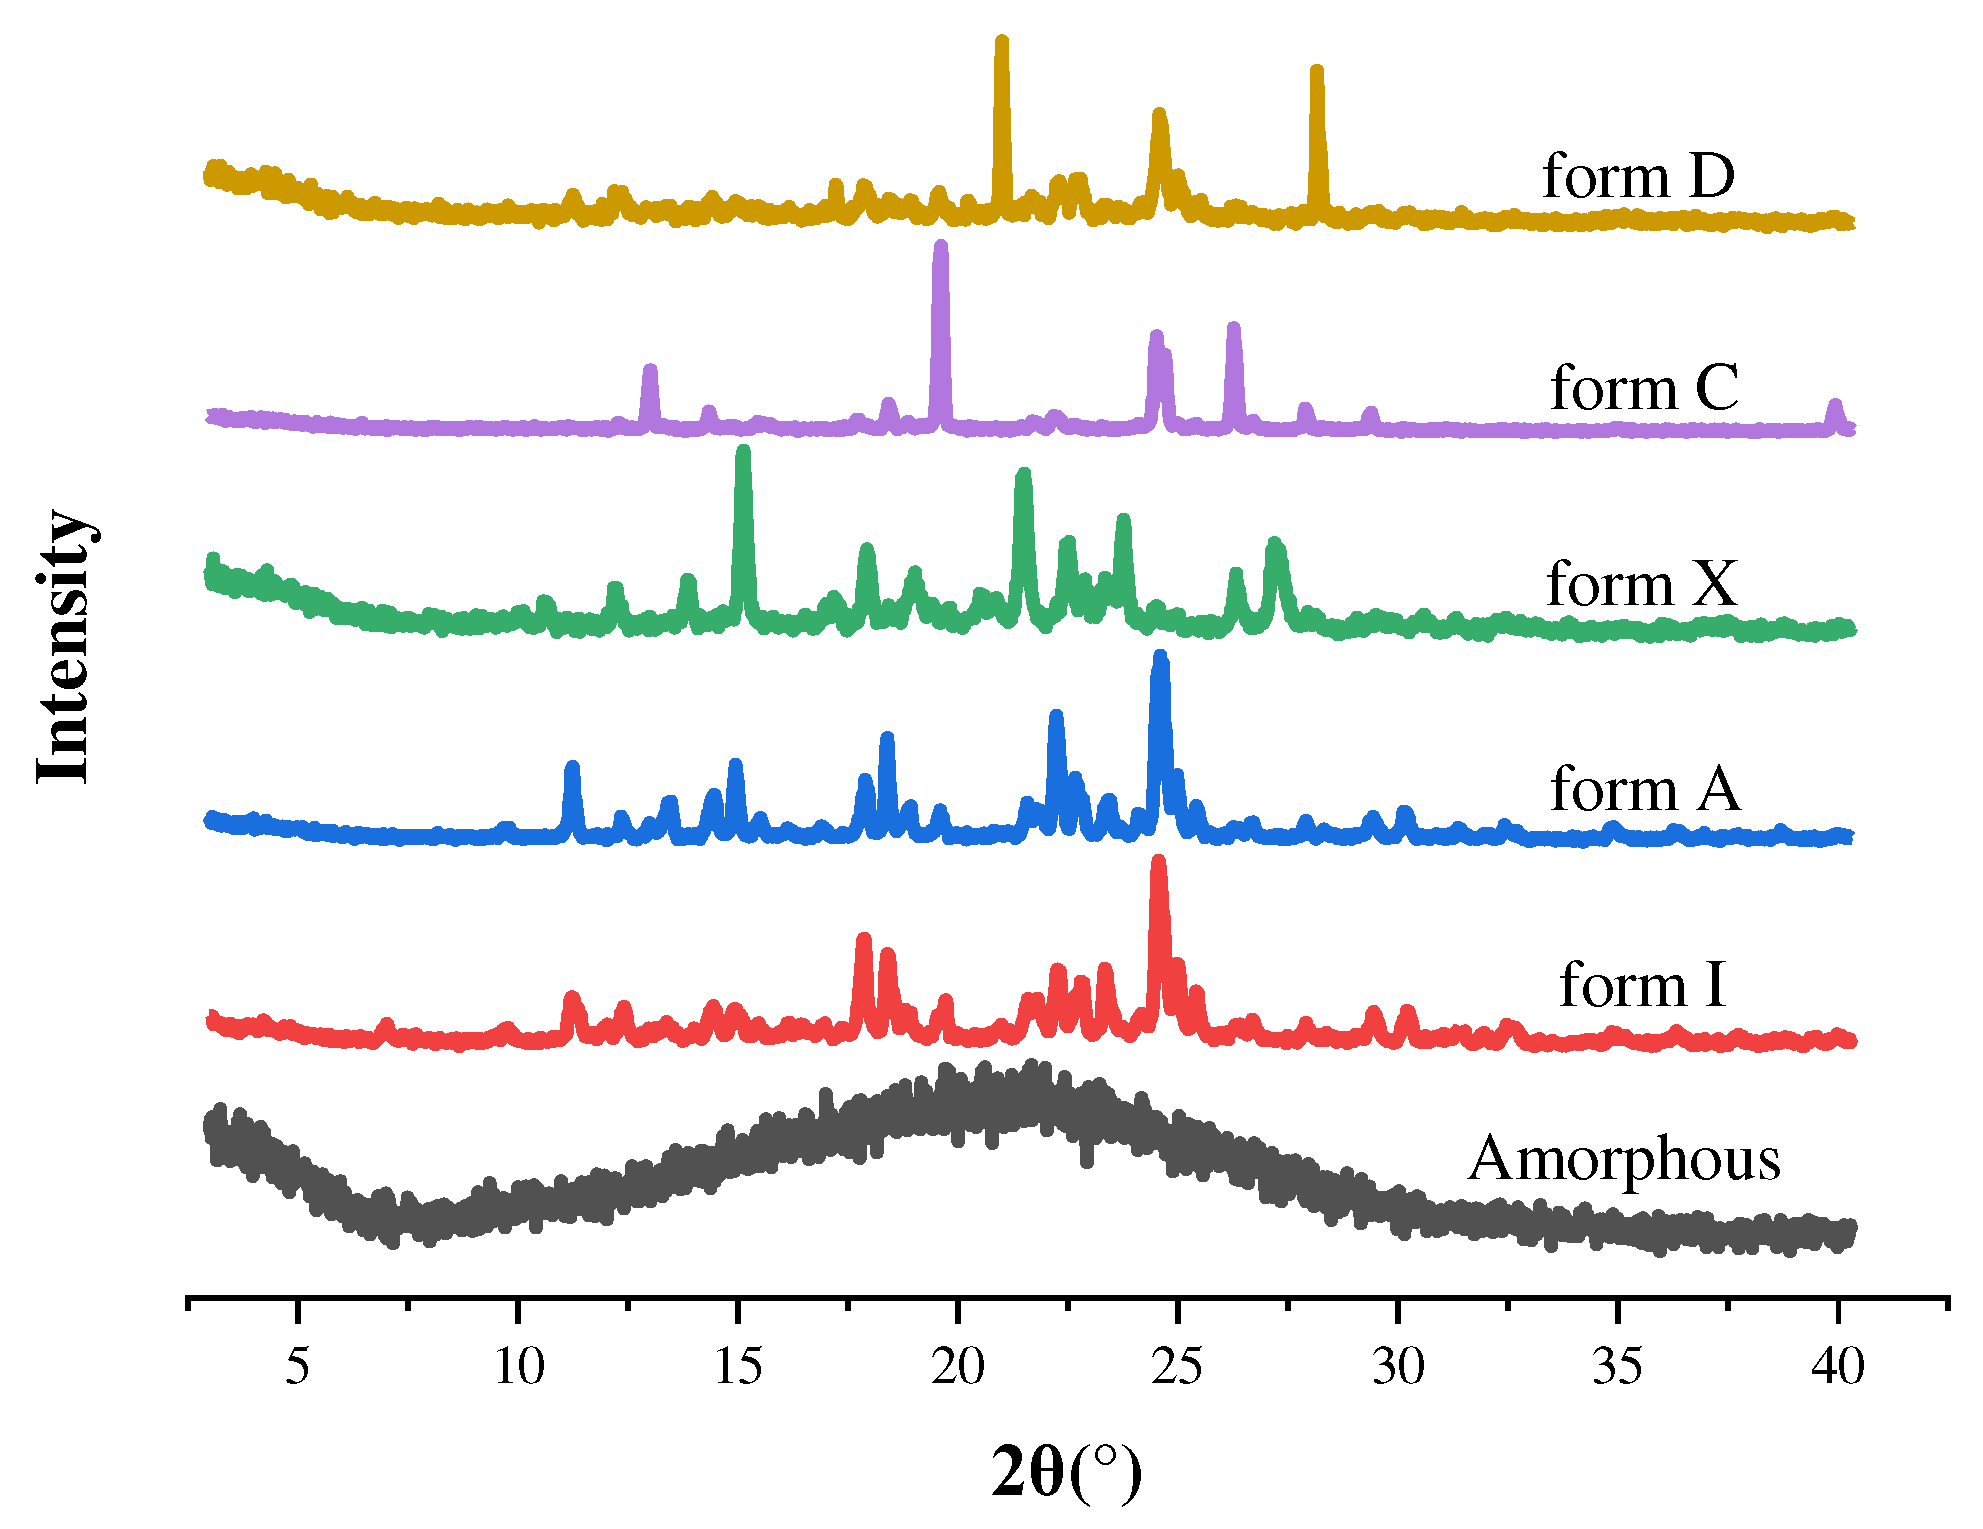
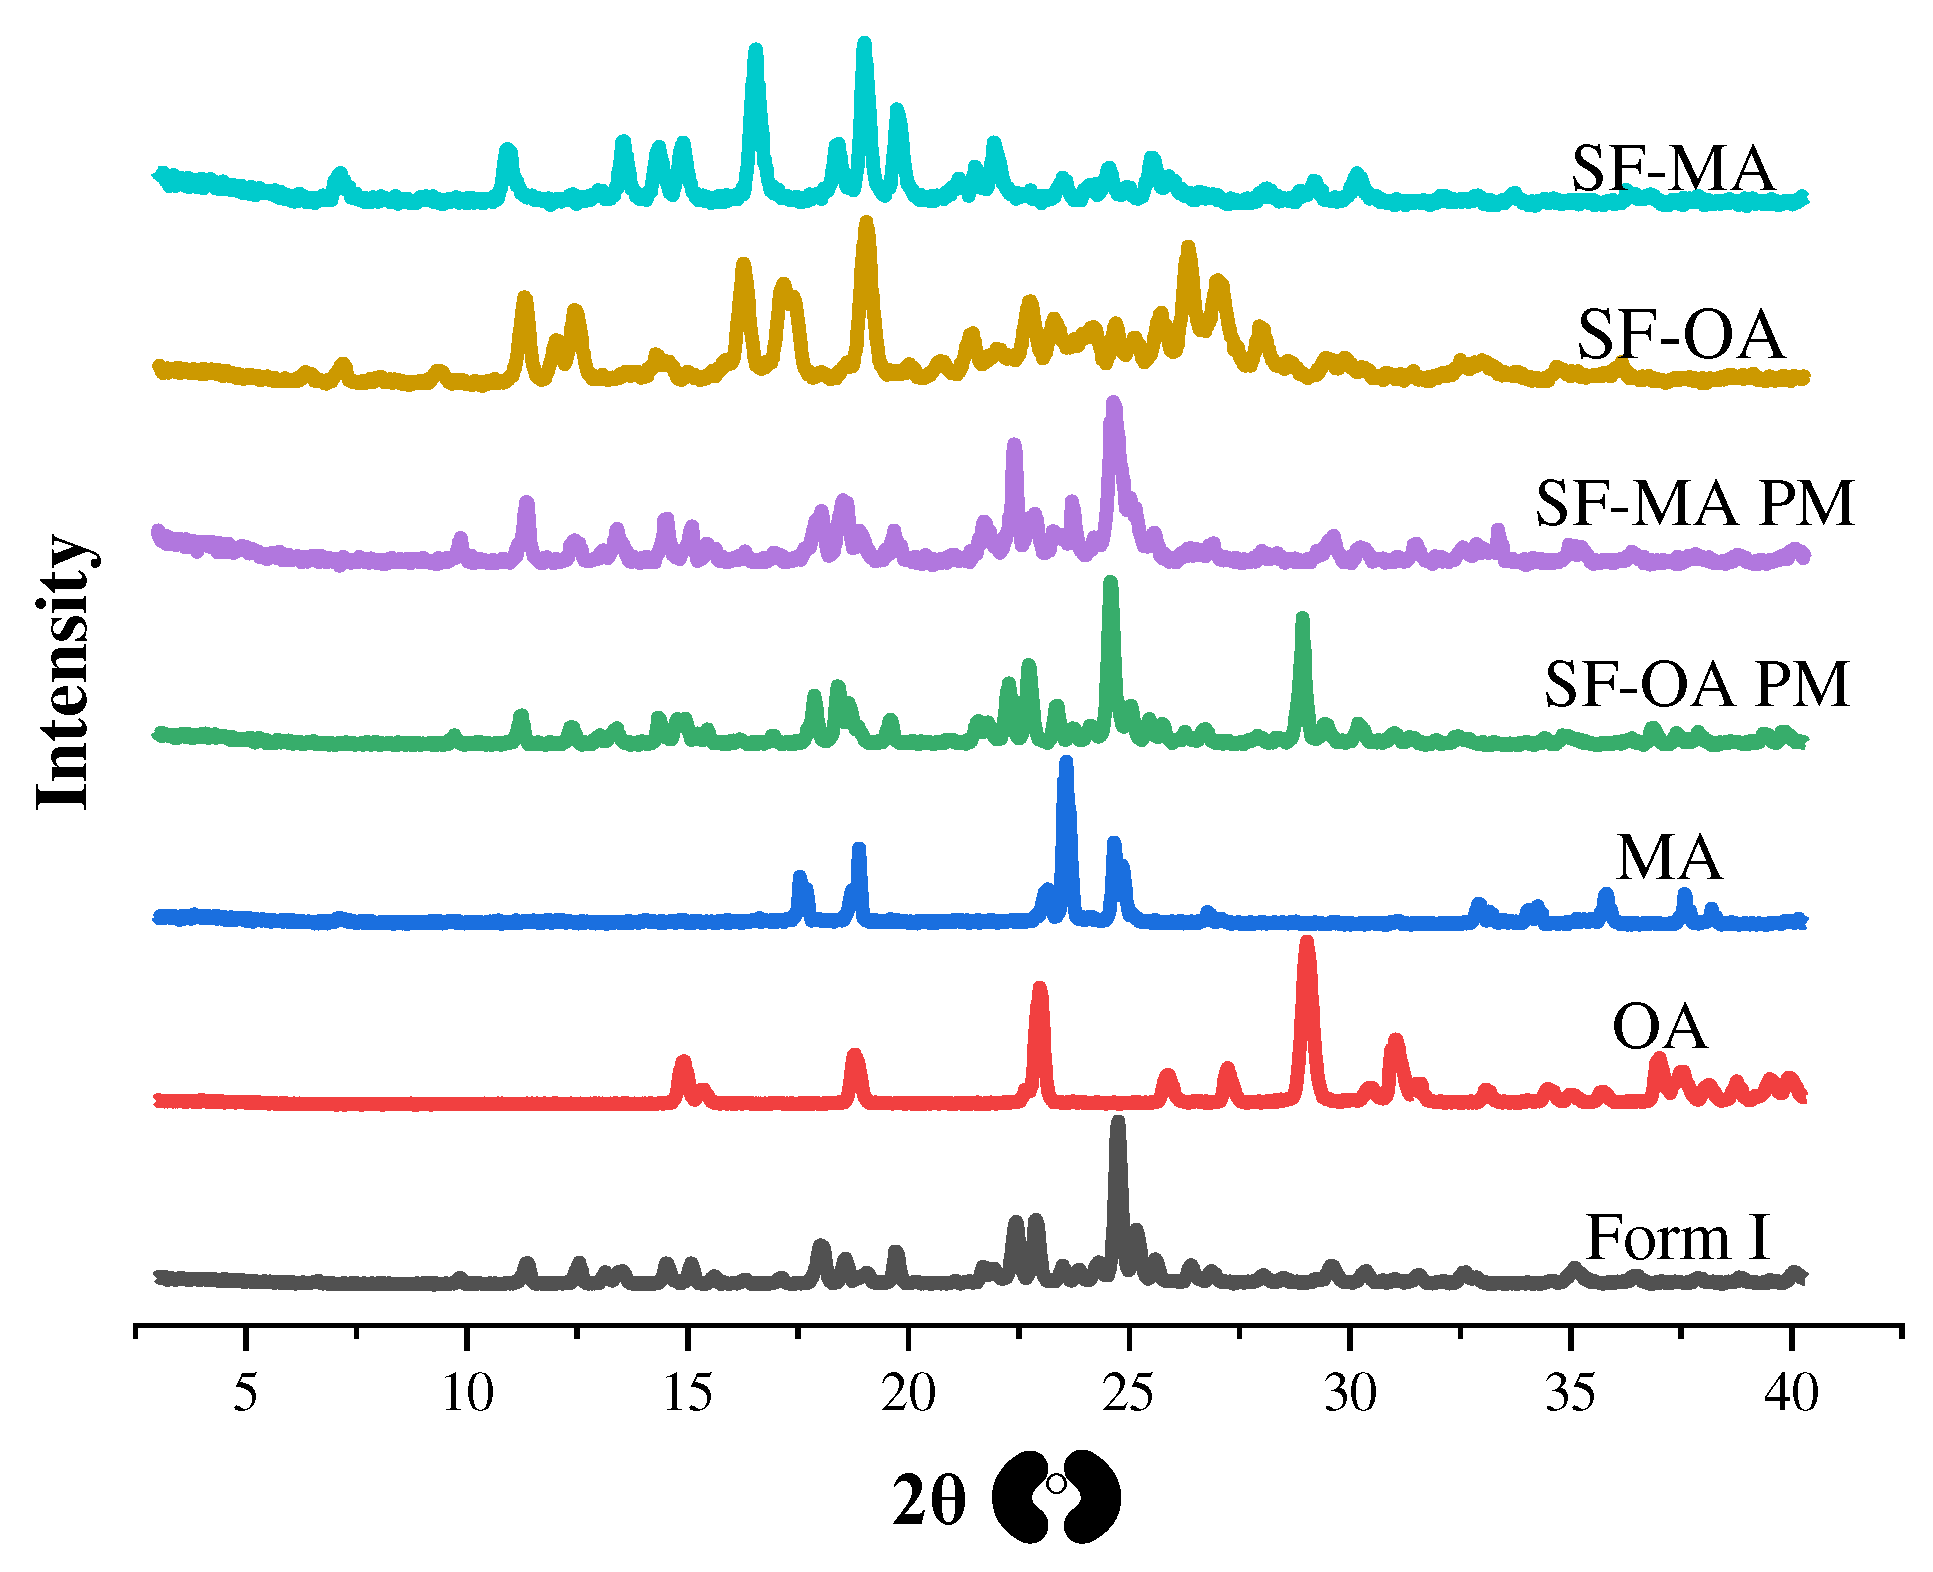
To preliminarily determine whether the new solid-state form is a different crystal, we measured the crystal structure by PXRD. The specific characteristic peaks of all the samples were summarized in Table 2. The PXRD patterns of form C and form D and the existing forms were shown in Figure 3. The characteristic peak of form C is 13.01°, 18.43°, 19.60°, 26.27° and 27.90°. The characteristic peak of form D was 20.99°, 24.99° and 28.17°. It was clear that form C and form D were new crystal forms for SF. The PXRD pictures of form I, OA, MA, SF-OA, SF-MA and physical mixtures were presented at Figure 4. The characteristic peak of SF-OA is 7.22°, 9.41°, 11.32°, 12.05°, 16.28°, 17.22°, 18.98°, 20.73°, 22.72°, 24.12° and 26.33°, while that of SF-MA was 7.26°, 8.40°, 9.22°, 11.11°, 15.04°, 16.71°, 19.19°, 22.17° and 23.68°. Hence, compared to SF and CCFs, we speculated that SF-OA and SF-MA are new co-crystals. However, to deeply understand crystal structure, it was necessary to use other means for auxiliary characterization, such as SCXRD, DSC and TGA.

3.2.2. SCXRD

SCXRD is primarily used to determine the crystal structure of a single pure substance. It can obtain crystal parameters and simulate the molecular arrangement, unit cell structure and bond action mode through software. To further explore new solid-state forms and learn more detailed crystal structure information, we cultured all samples as single crystals. Fortunately, single crystals of form C and SF-OA were gained by diffusion crystallization (THF/n-Hexane) and evaporation, respectively. However, form D tended to cluster together when grown. It was quite challenging to find individual crystals that were grown separately. For SF-MA, only powdered or mixed crystals were obtained through methods such as cooling crystallization, room temperature evaporation or diffusion crystallization.
Through single crystal inspection and analysis, we had successfully collected high quality single crystal diffraction data of form C and SF-OA. The crystallographic parameters of form C, SF-OA and form I are summarized in Table 3, and the structures of unit cell are shown in Figure 5. The data for form I is sourced from the CCDC, as described by Shimpi et al [48] in their article. The single-crystal parameters (Table 3) indicated that form C and SF-OA belong to the monoclinic crystal system, as does form I. The space group of form C is P21/c in consistent with form I, whereas SF-OA crystallizes in the P21/n group. The parameters of the form C and form I indicated their high similarity in structure. However, the crystal parameters show that SF-OA is quite different from Form I, and we speculate that it may be due to the addition of OA. Hence, the two-dimensional structures of the two solid-state forms packing along the a, b and c axis are shown in Figure 6, Figure 7 and Figure 8 for exploring in more details.
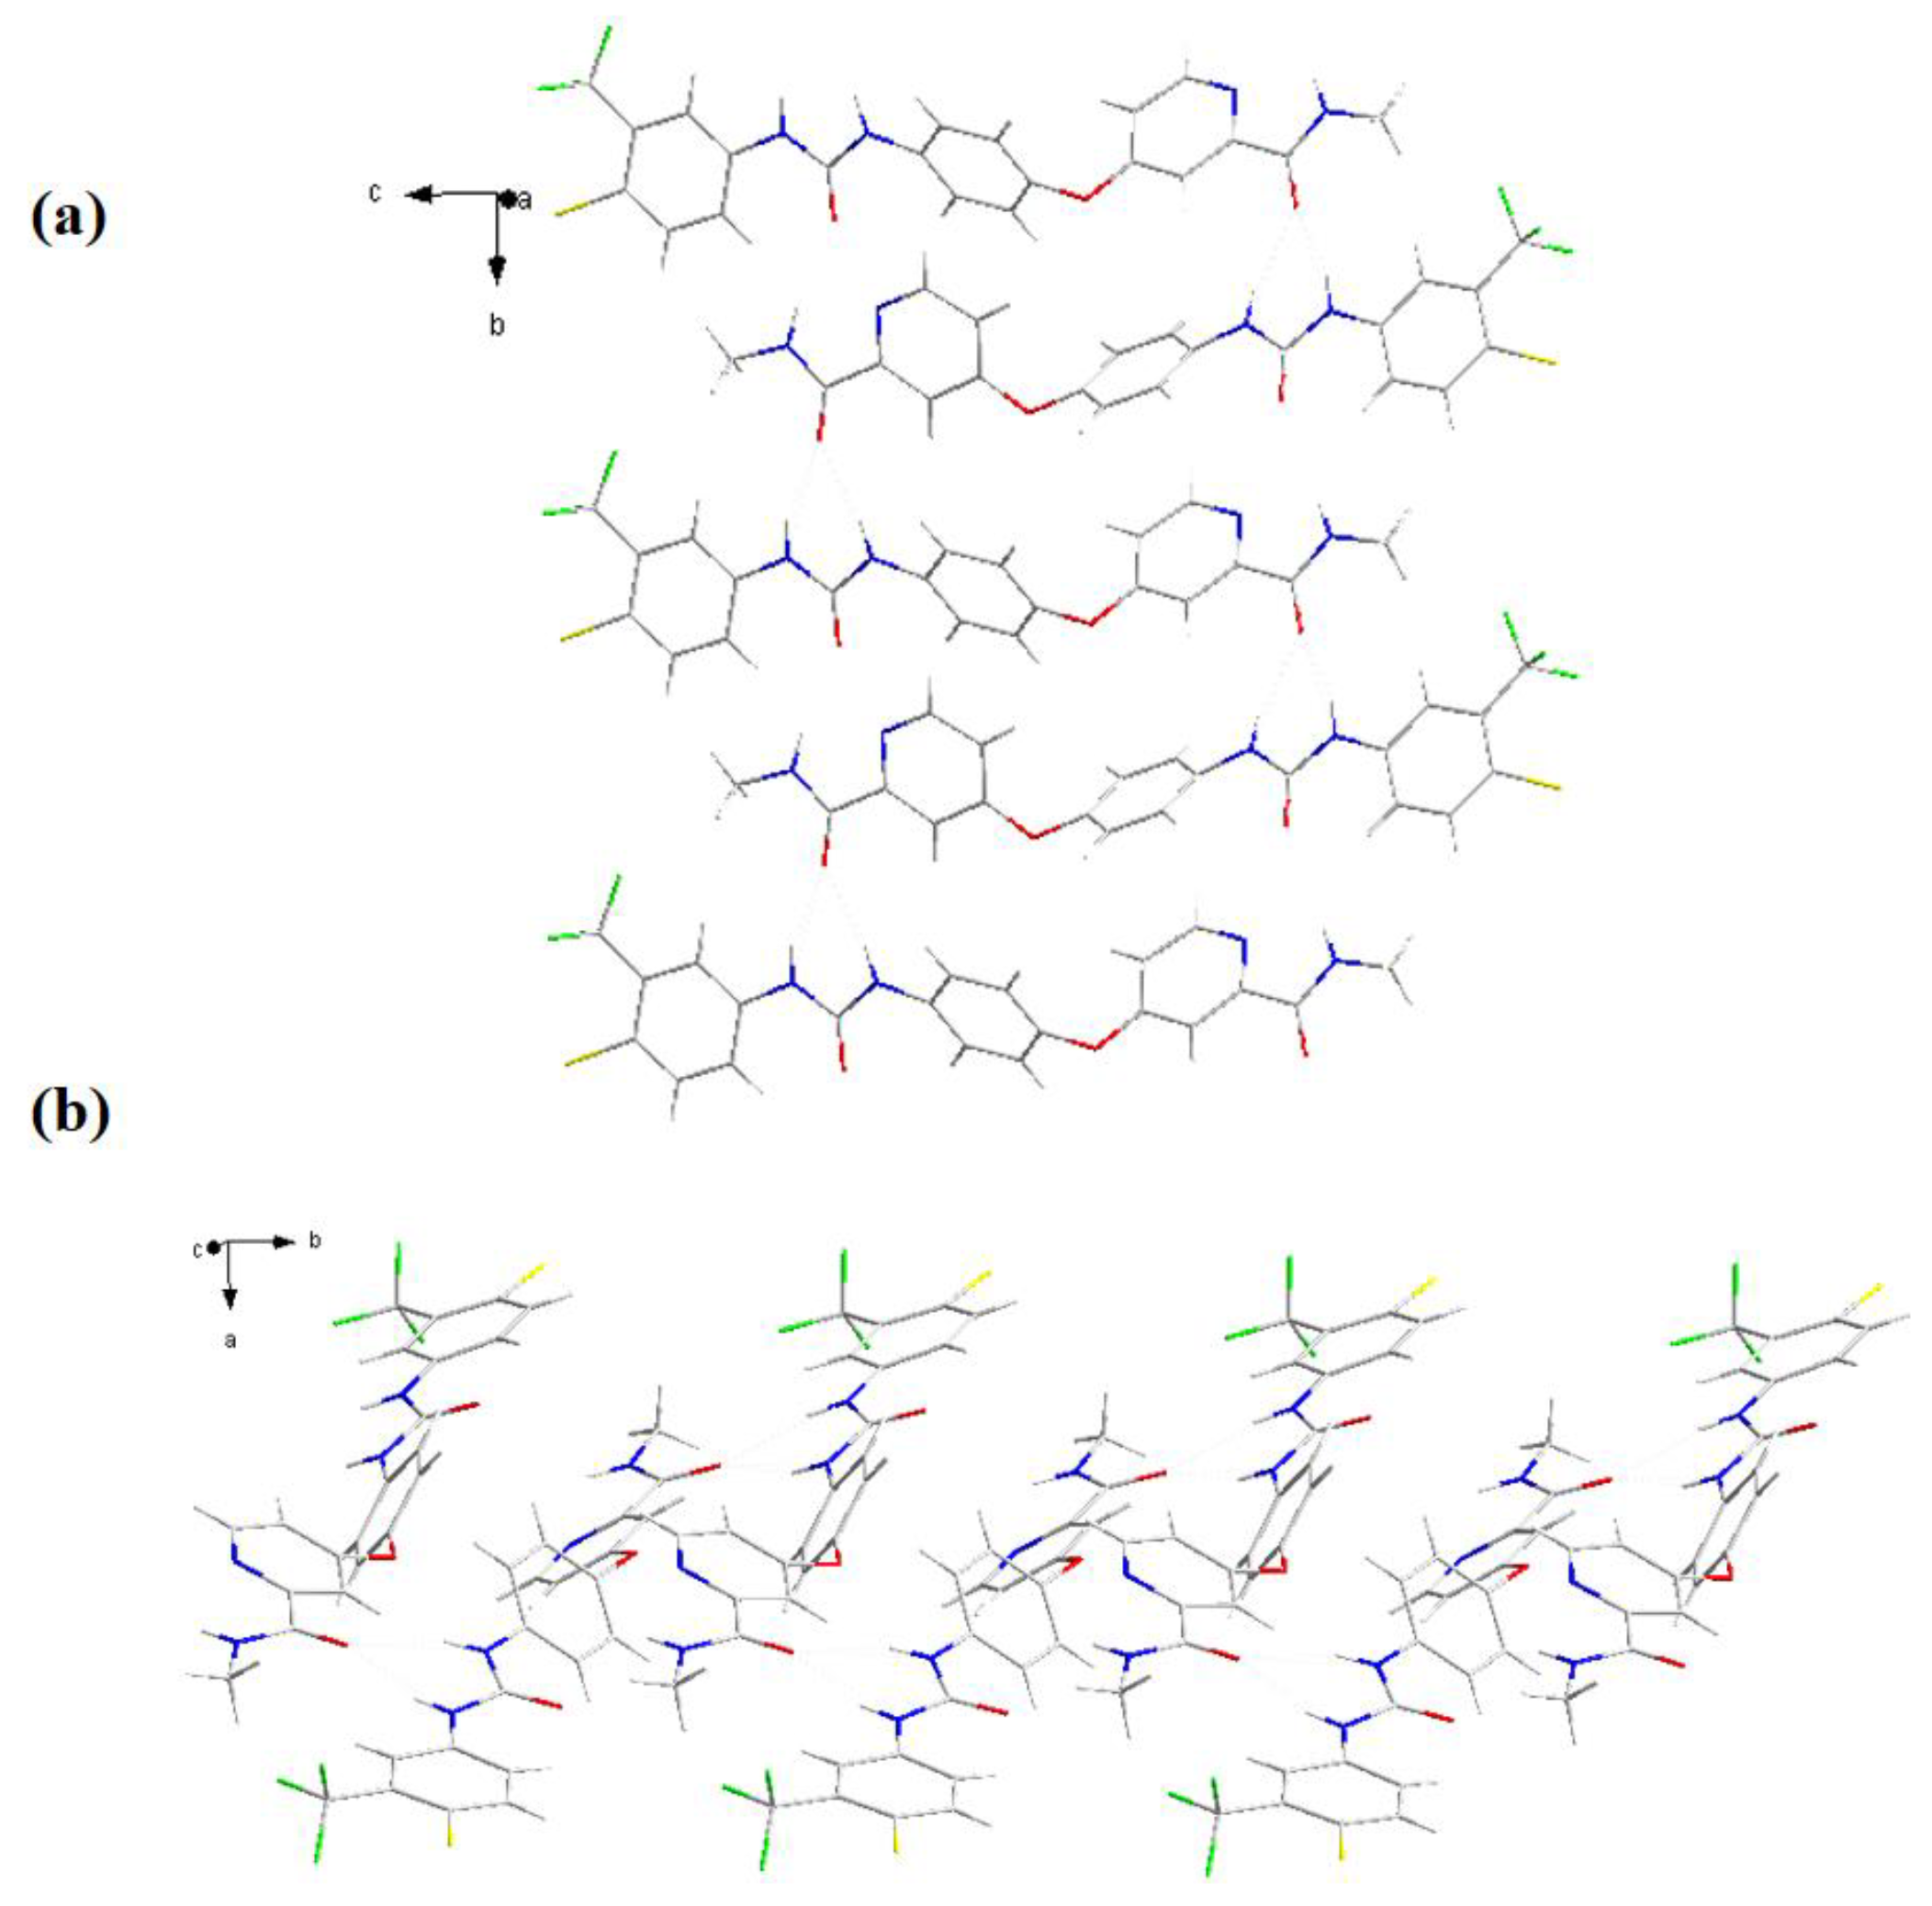
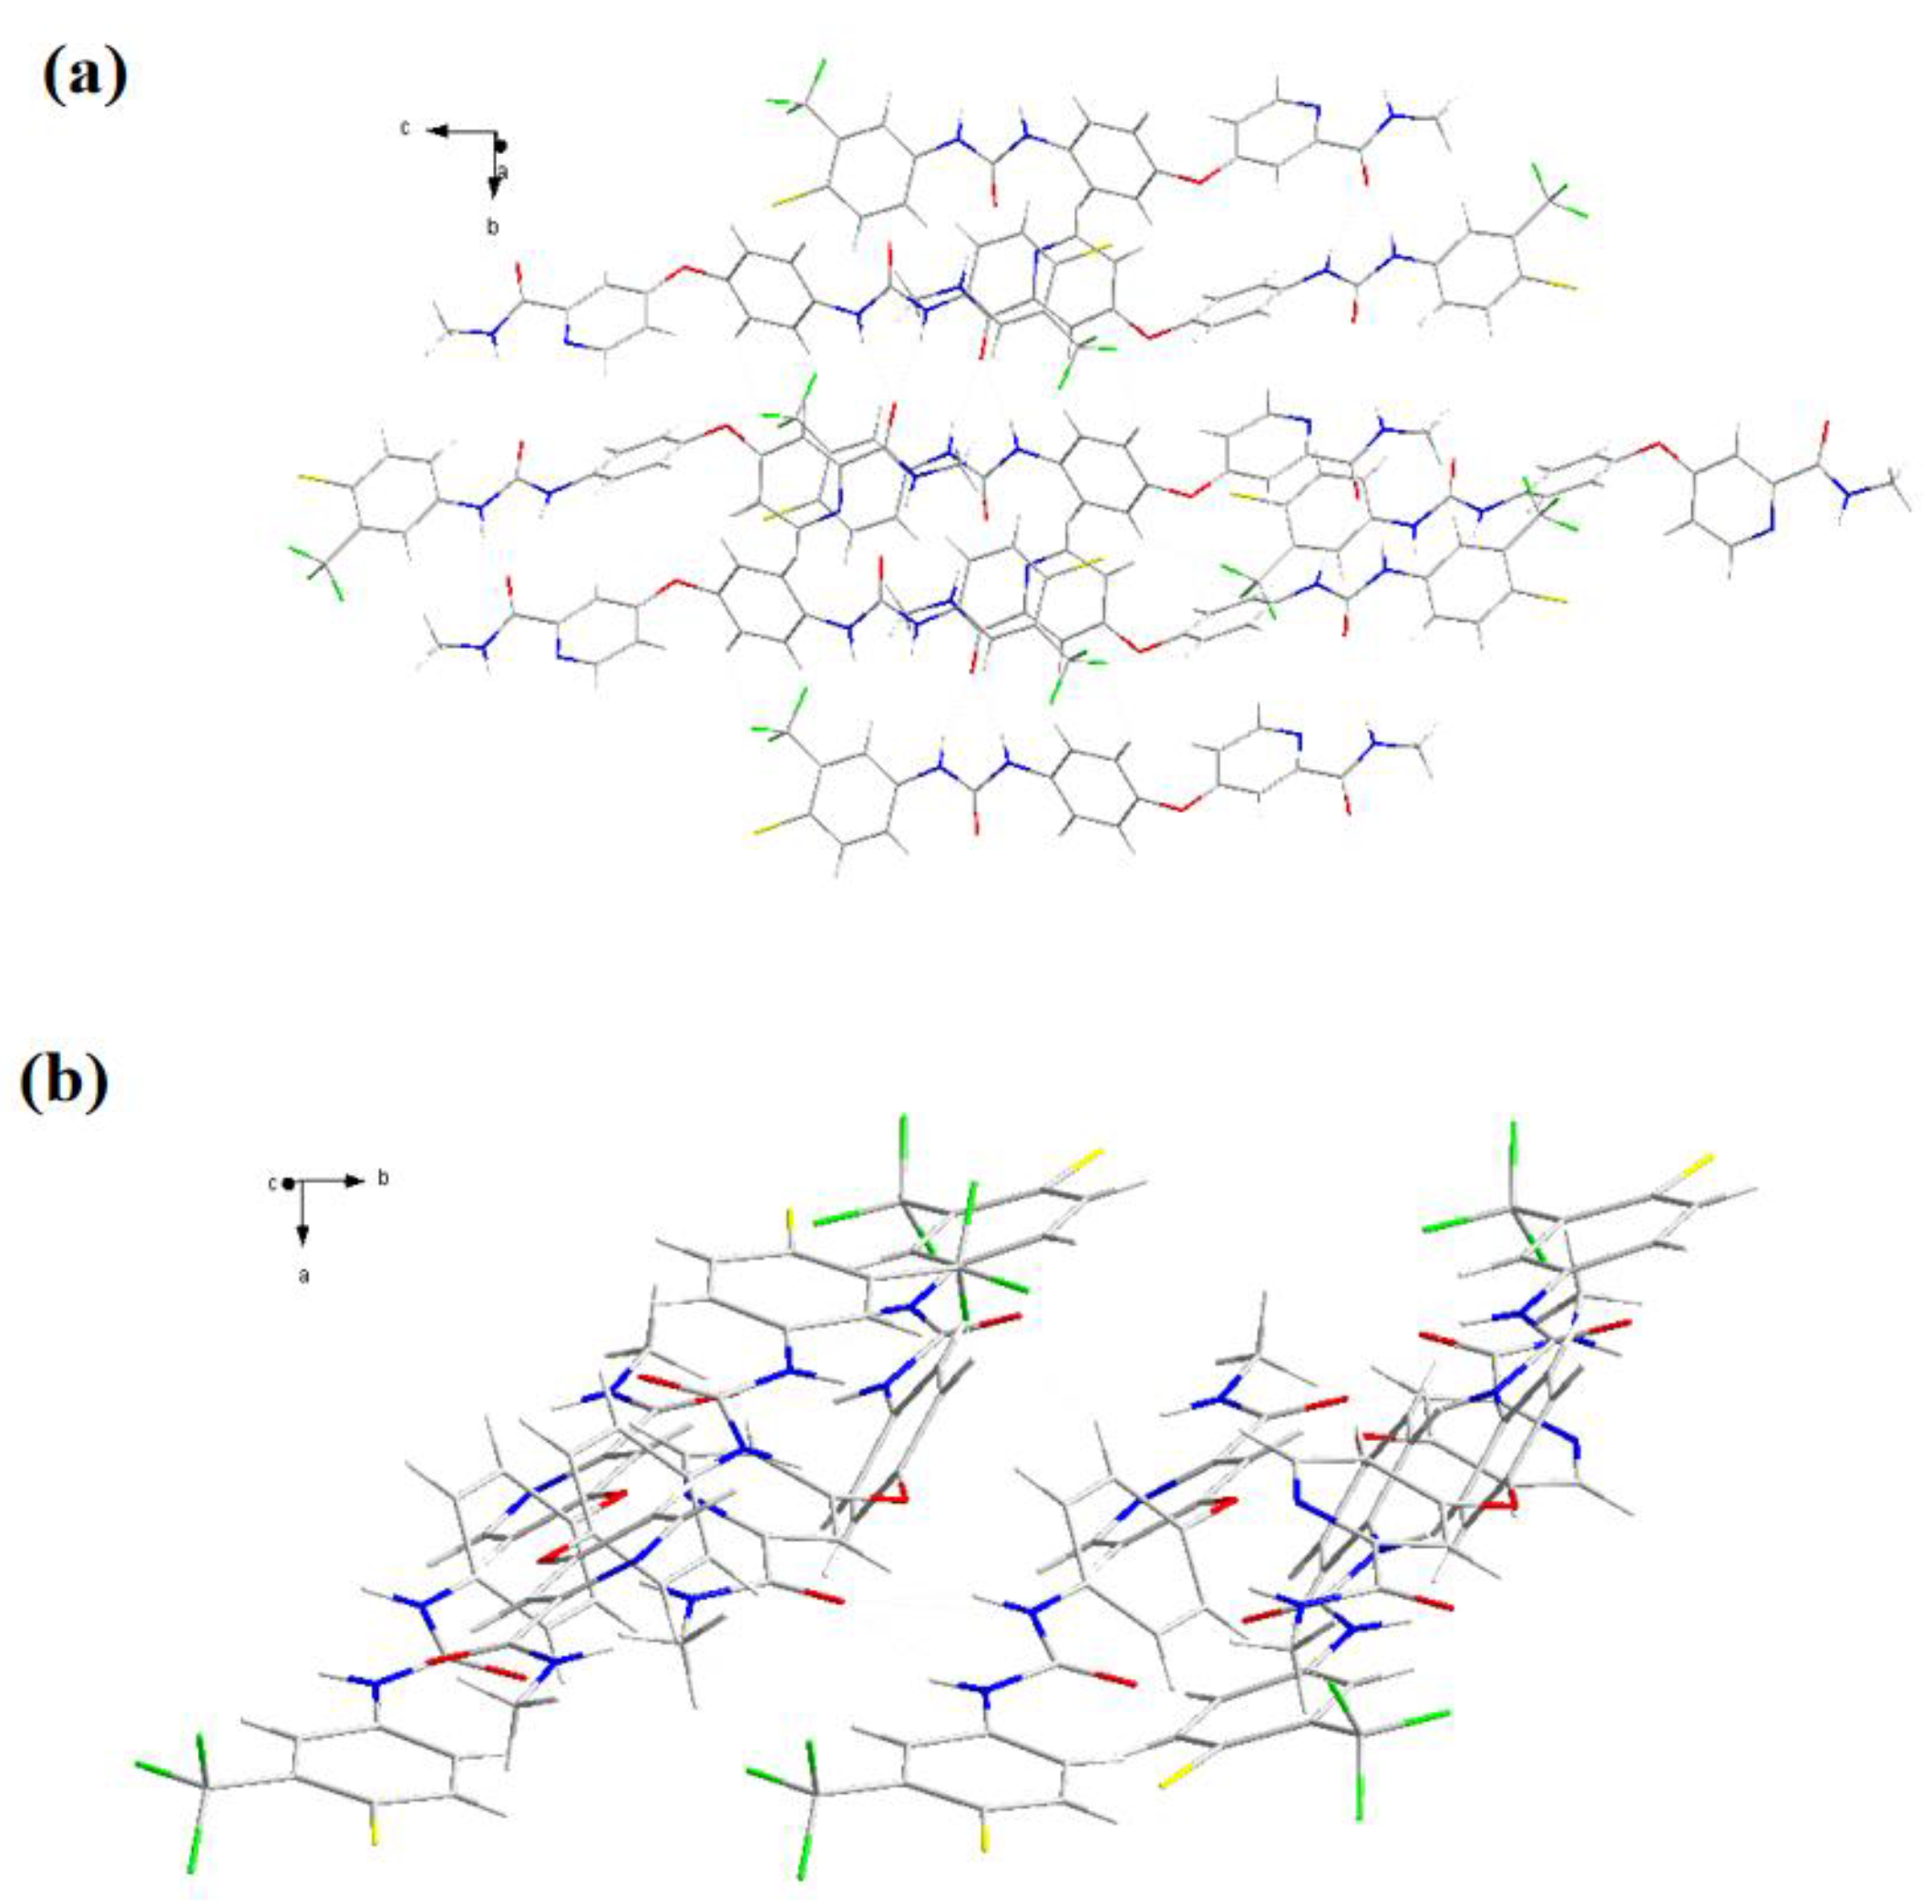
There were highly similar structures of form C and form I in Figure 5, yet it could be seen that they were distinct in stack arrangement by comparing Figure 6 with Figure 7. Form I was regularly arranged in reverse order by single molecules at b axis and a axis (Figure 6 (a), (b)). It was shown a π-π conjugation that the benzene ring of form C is stacked with the pyridine ring of the adjacent SF molecule at the b axis in Figure 7 (a). Compared with the arrangement of form I in Figure 6 (b) and Figure 7 (b), form I was formed by two molecules stacked together along the a-axis, while form C was formed by three molecules cross-stacked. In Table 4, there was a significant disparity in the torsion angle between form C and form I in their crystal structures due to inter-molecular π-π stacking. Hence, it could be inferred that different patterns of molecular accumulation have an important impact on crystal form growth.
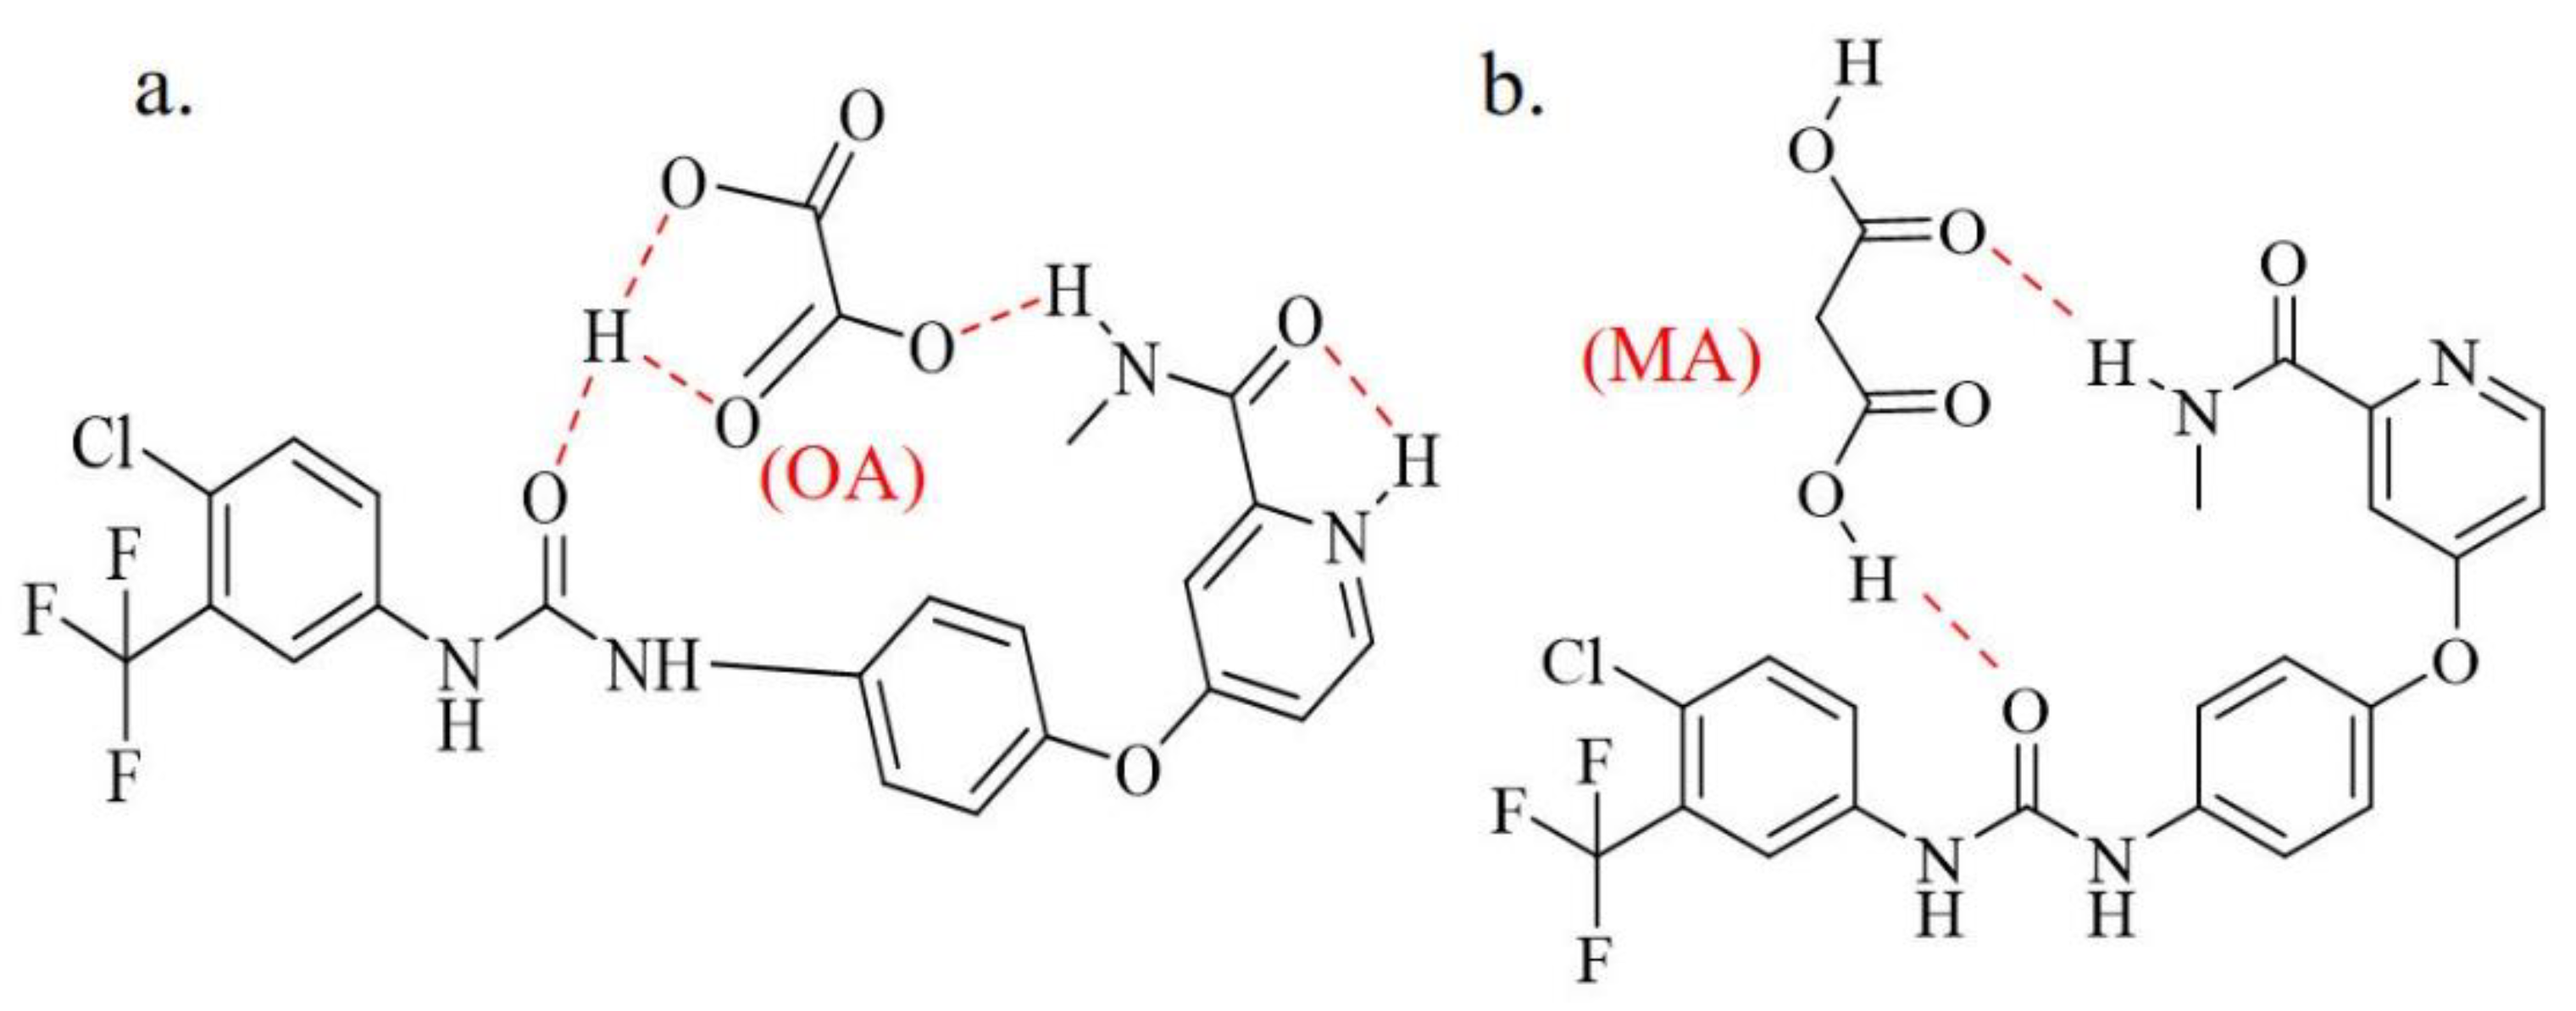
As shown in Figure 5, the structure of form I presented on the form of liner, and the structure of SF-OA showed a flip state. That's exactly why the molecular stacking diagrams of Form I and SF-OA were arranged in completely different ways. It was found in Figure 5 that the form I was arranged in reverse order without other molecules, yet the SF-OA was arranged in a trans alternative sequence. SF was bound to OA by hydrogen bonds, then SF-OA being significantly more complex. The hydrogen bonding parameters of SF-OA were summarized in Table S4. The hydrogen bonding distribution was specifically shown in Figure 8 (a), there were two inter-molecular hydrogen bonding which were as follows N4-H4···O7 and O6-H6···O1. Among them, N4-H4···O7 had a bond length of 2.61 Å and a bond angle of 107°, the hydrogen bond length of O6-H6···O1 was 2.1719 Å, the angle was 126°. The SF and OA molecules were mainly linked by N4-H4···O7 and O6-H6···O1. Furthermore, two intra-molecular hydrogen bonds existed in SF-OA, in the drug molecule as well as in OA, which were N3-H3···O3 and O6-H6···O5, respectively. According to Table S4, the intramolecular hydrogen bonds of SF also played an important role in the formation of SF-OA. Combined with Figure 5 (a) and (c), it could be inferred that the intramolecular hydrogen bond of SF and OA made the SF molecule fold better to form intermolecular hydrogen bonds. Meanwhile, as shown in Table 4, a large difference in the torsion angle of SF-OA and SF could be observed, due to the formation of hydrogen bonds. Besides, it could be observed that SF-OA consisted of one SF molecule and one OA molecule from the single crystal simulation diagram. Thus, concluded that the stoichiometric ratio of SF-OA was 1:1.

3.2.3. DSC

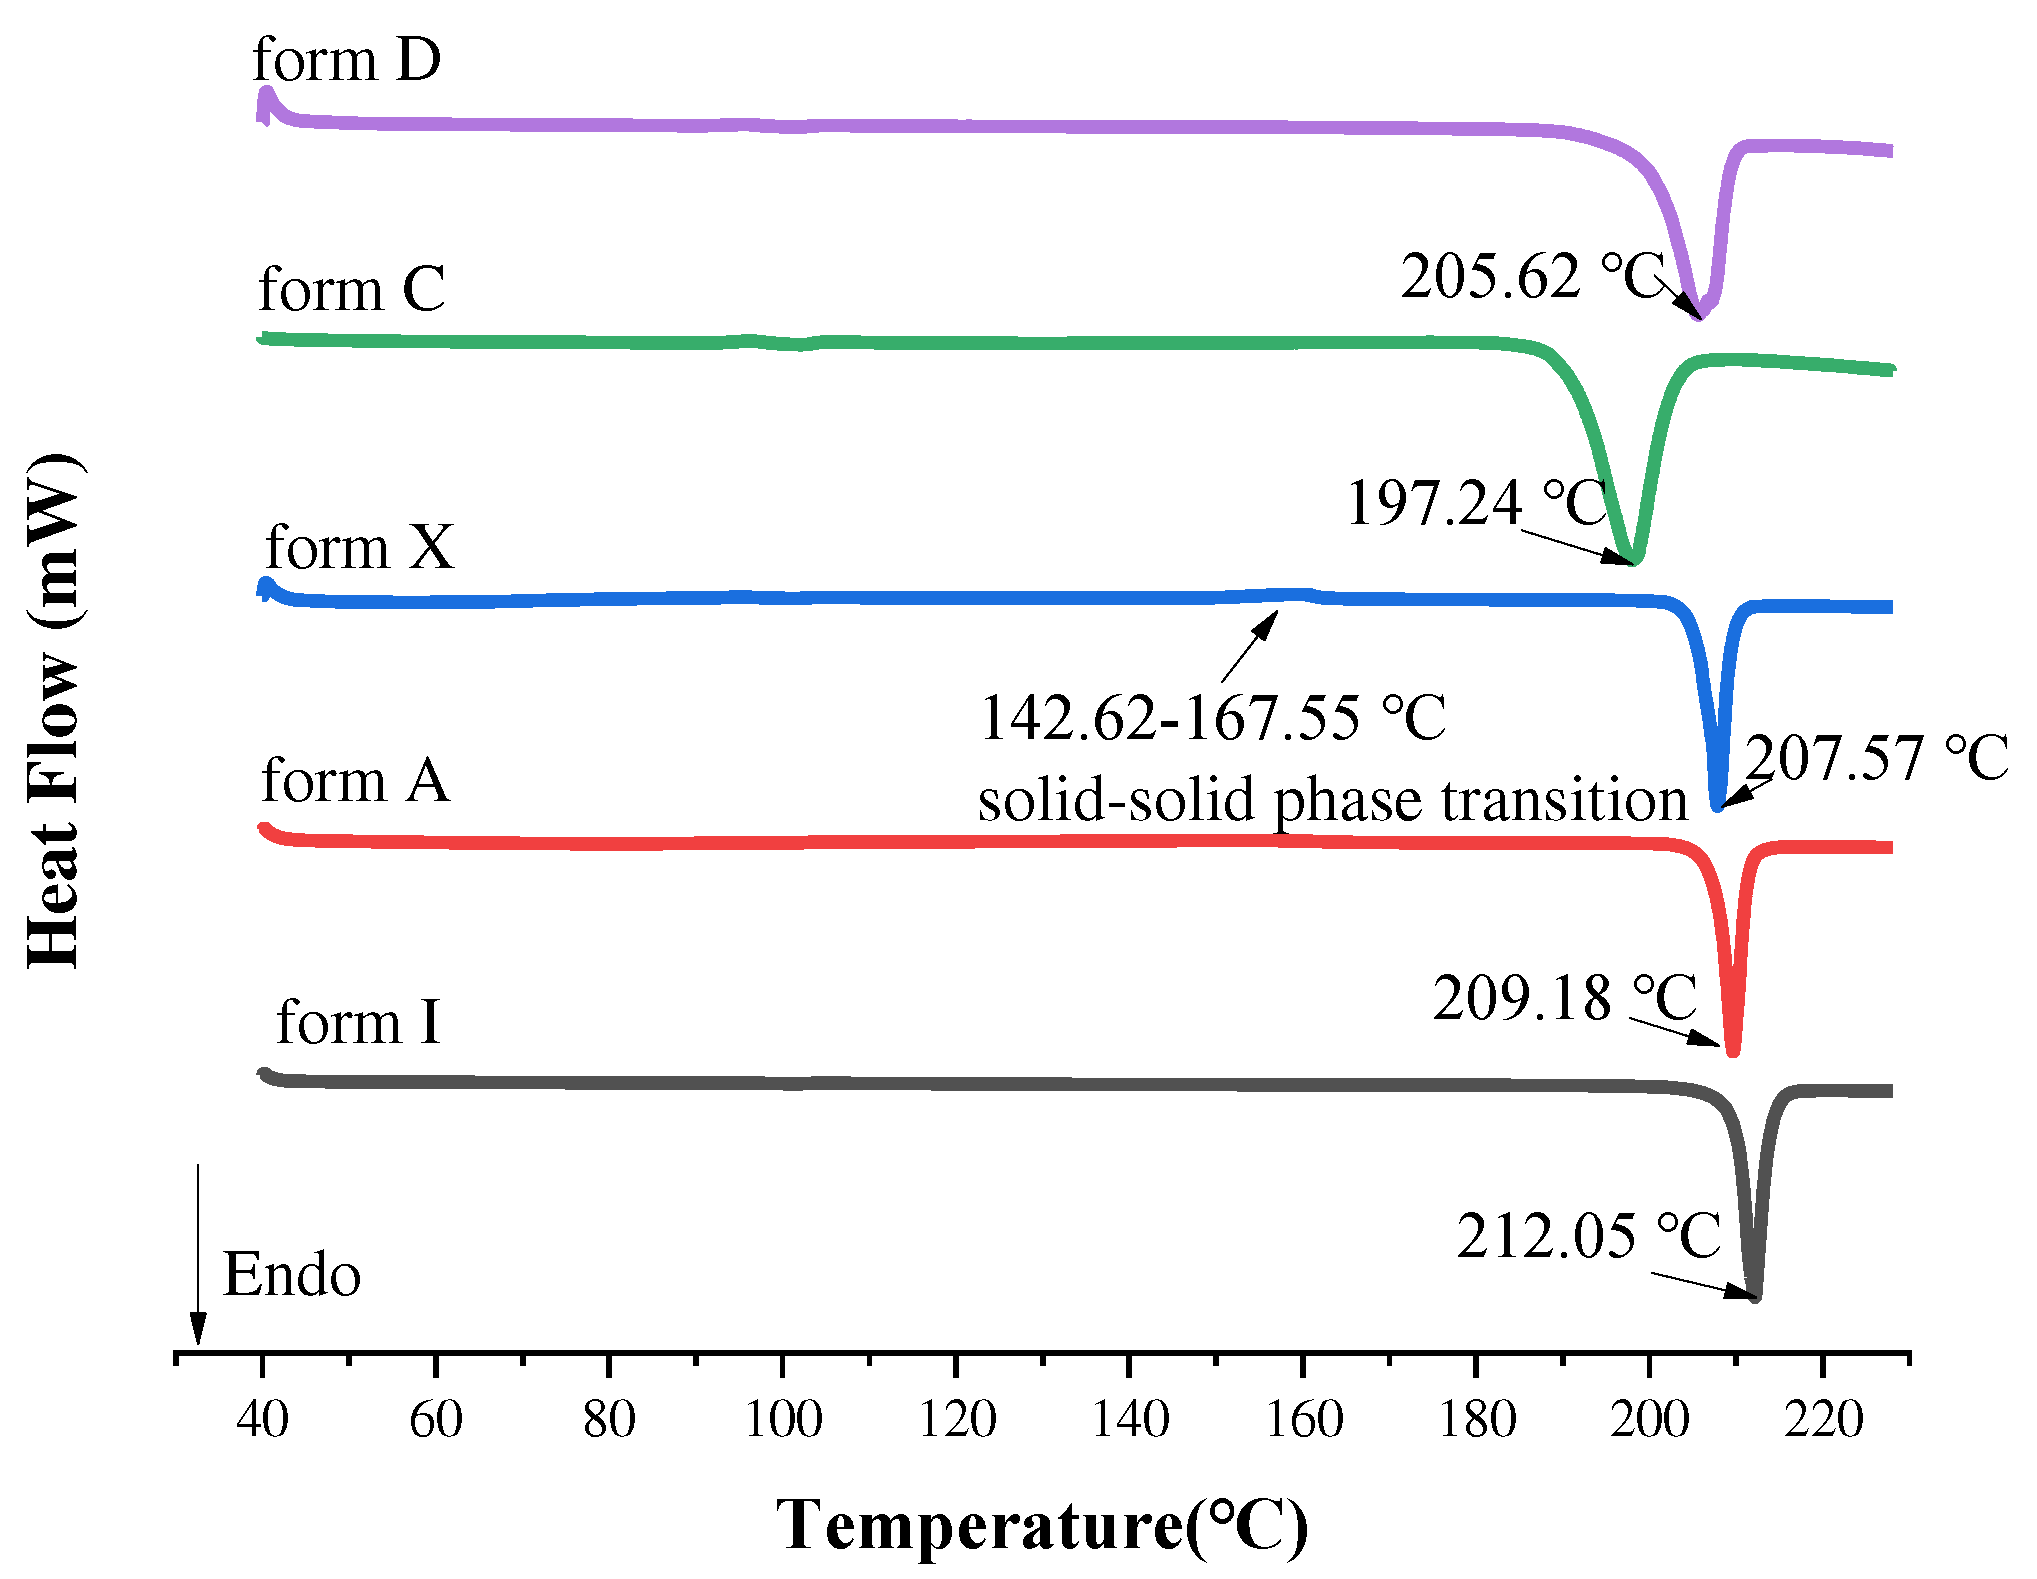
Substance is often accompanied by changes in thermodynamic properties, when it melts, crystallizes and transforms [49]. As we know, thermodynamic properties were also an important means of judging the formation of new crystal forms. DSC allowed the determination of changes in its thermodynamic properties to characterize physical or chemical change processes. Detection of all the samples by DSC, the results were shown in Figure 9. The melting endothermic peak of the existing polymorphs form I and form A appeared at 212.05 ℃ and 209.18 ℃, respectively. Form X underwent solid-solid transition at 142.62-167.55 ℃, and the final melting peak was about 207.57 ℃, which was consistent with the description of patent [38]. Notably, form C and form D had only one heat absorption peak, which were 197.24 ℃ and 205.62 ℃. This meant the formation of a new polymorph. The melting points and enthalpies of the fusion of SF were summarized in Table 5. It followed that different crystalline forms had different melting points.
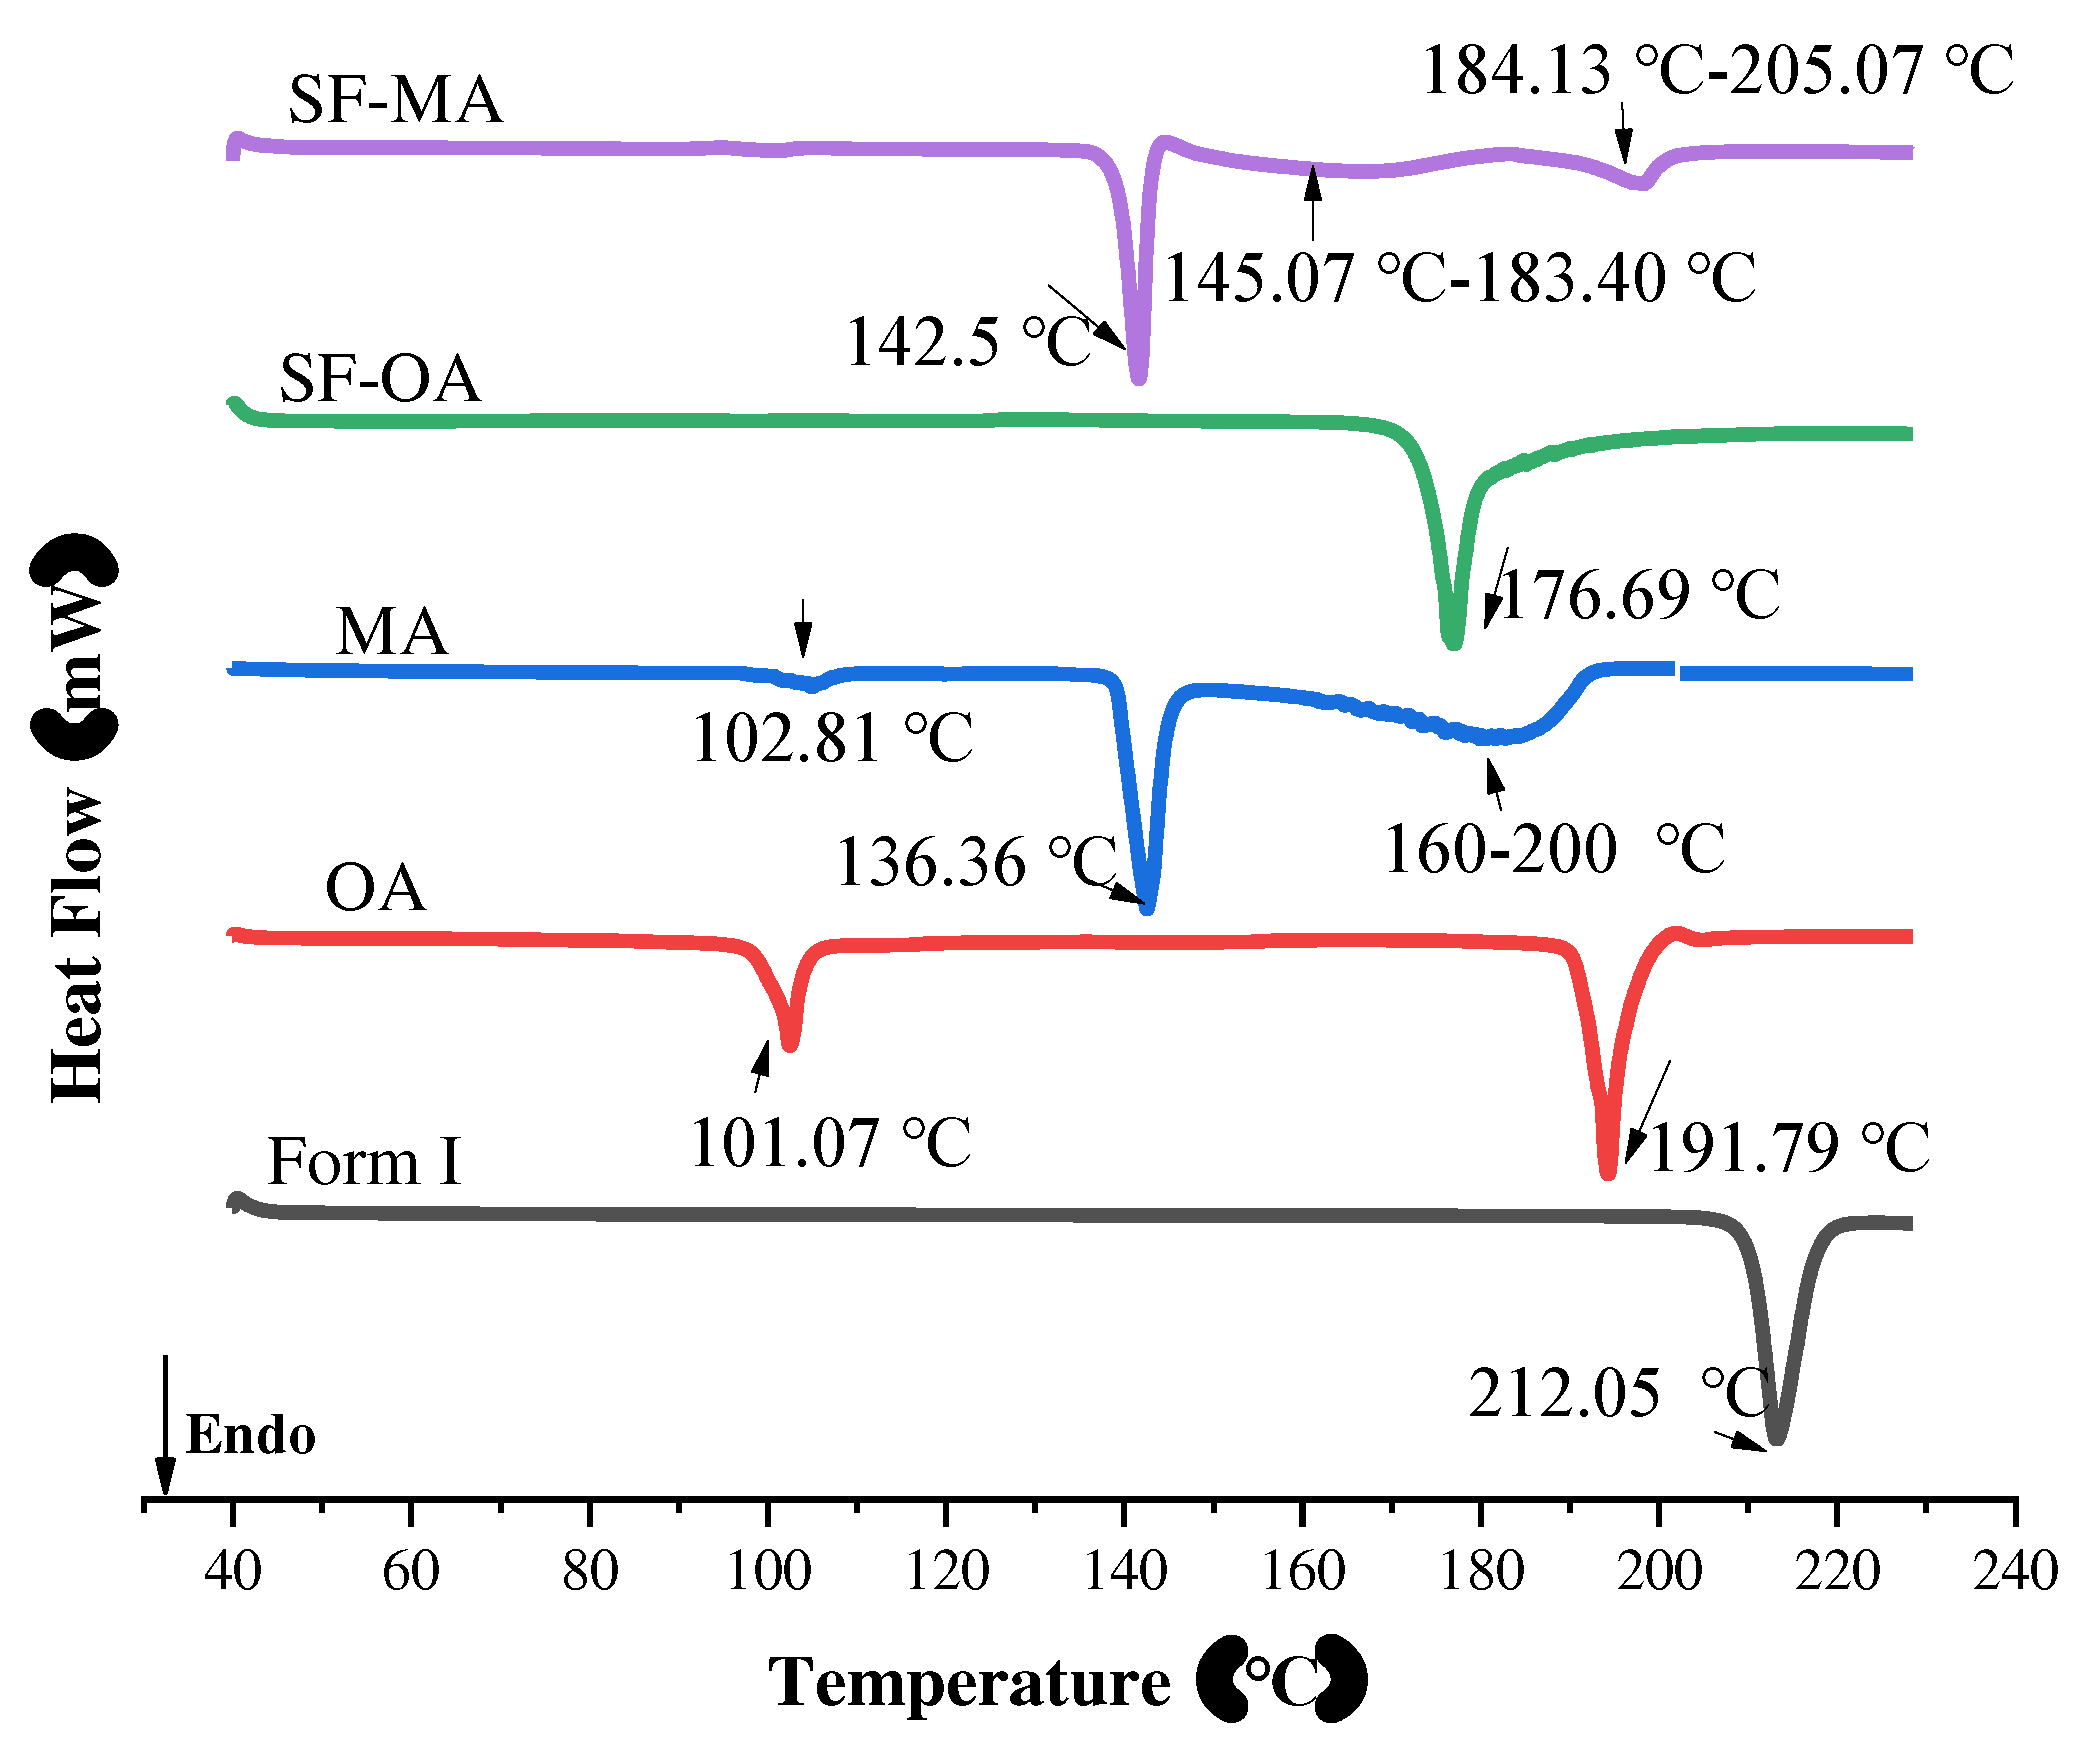
The DSC curves of SF form I, CCFs, SF-OA and SF-MA were presented in Figure 10. The melting endothermic peak of form I was 212.05 ℃. Two melting endothermic peaks of the anhydrous oxalic acid could be observed, which were 101.07 ℃, 191.79 ℃. It is well known that anhydrous oxalic acid has hygroscopic properties [50]. Hence, the peak that appeared from the DSC curve of OA at 101.07 ℃ was suspected to cause by the purity of anhydrous oxalic acid. For malonic acid, there were two endothermic peaks in the DSC curve of MA, which were 102.81 ℃, 136.36 ℃ and a wide peak at 160 ℃-200 ℃, which is agree with previous report [51]. The first endothermic peak is owing to the solid phase transition, and the second sharp endothermic peak at 136.36 ℃ attributed to melting. The third wide endothermic peak corresponds to thermal decomposition. However, the melting points of co-crystals were remarkably different than the melting points of API and CCFs. We noticed that there was only one heat absorption peak at 176.69 ℃ for SF-OA, which signaled the creation of new solid forms. For SF-MA, a sharp endothermic peak was 142.5 ℃ which was a melting peak belonging to itself, which was consistent with the melting point of most co-crystals between the guest and the mother [52,53]. Furthermore, two wide peaks were 145.07 ℃-183.40 ℃, 184.13 ℃-205.07 ℃, respectively. Based on the melting behavior of MA, we speculated that these two broad peaks are SF-MA decomposition peaks. Therefore, a comparative analysis combined with PXRD data leads to the conclusion that two new co-crystals have been formed. In addition to DSC, TGA was also a very important tool in the analysis of thermodynamic properties.

3.2.4. TGA

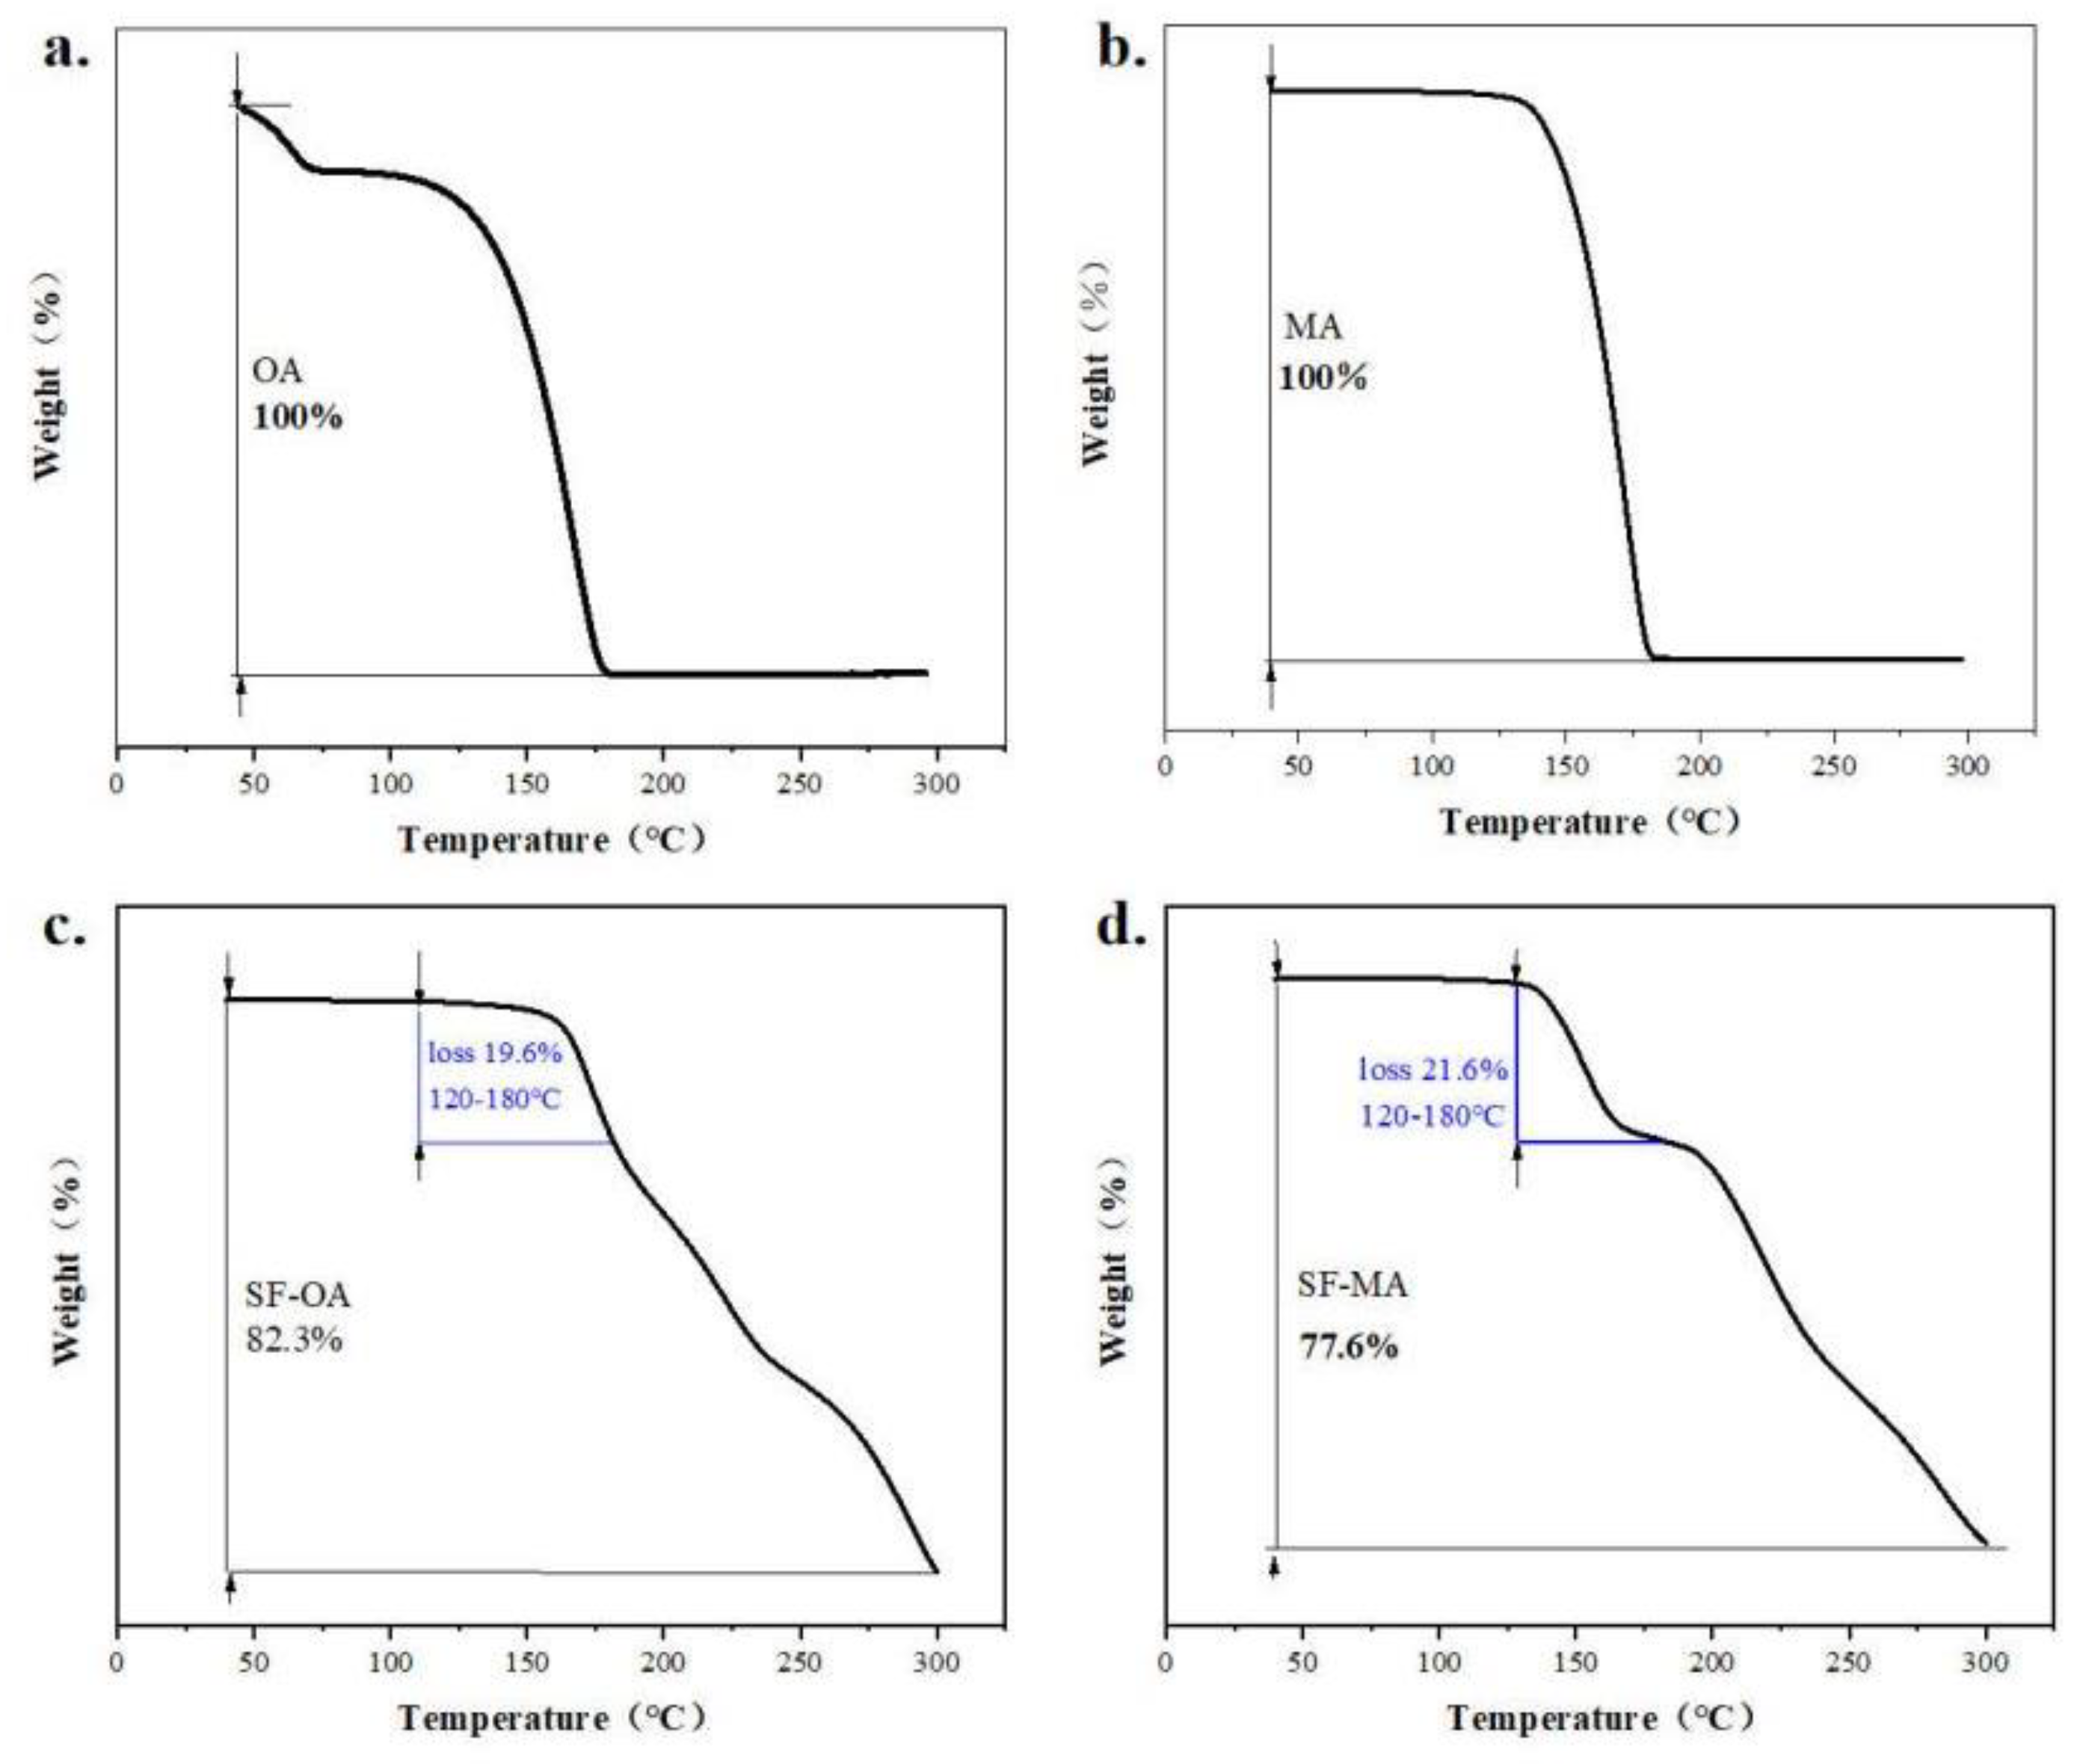
In order to further explore the thermodynamic properties of polymorphs and co-crystals, understand their decomposition. TGA was used to detect all samples over the specific temperature range of 40 to 300 ℃. The TGA curves of form I, form C and form D are shown in Figure 11 (a-c). The presented weight loss of form I was 54.21% from 200 ℃ to 300 ℃, whereas form C weight loss was 55.78% from 183.77 ℃ to 300 ℃. Meanwhile, weight loss of form D was 65.12% from 190.12 ℃ to 300 ℃. It could draw a conclusion that the thermal stability of form C was superior to form D. According to TGA curves of CCFs and co-crystals in Figure 12 (a-d), the weight loss of OA and MA was almost 100%, when they were heated to 180 ℃ in Figure 12 (a, b). The thermal events observed for MA agreed with the previously reported thermal behavior [54,55]. When SF-OA was heated to 180 ℃, there was a weight of loss 19.6%, which is close to the theoretical content of OA in SF-OA (theoretical weight loss 16.22%). For SF-MA, two obvious weight losses occurred in the temperature ranges of 120-180 ℃ and 190-300 ℃. The first weight loss was 21.6% occurred between 120 ℃ and 180 ℃, which could be ascribed to the loss of MA of SF-MA (theoretical weight loss of 18.58%). After losing the co-former, the SF part of SF-MA began to decompose upon further heating. The TGA curves indicate that the stoichiometric ratios of SF co-crystals are 1:1.

3.2.5. PLM and HSPLM

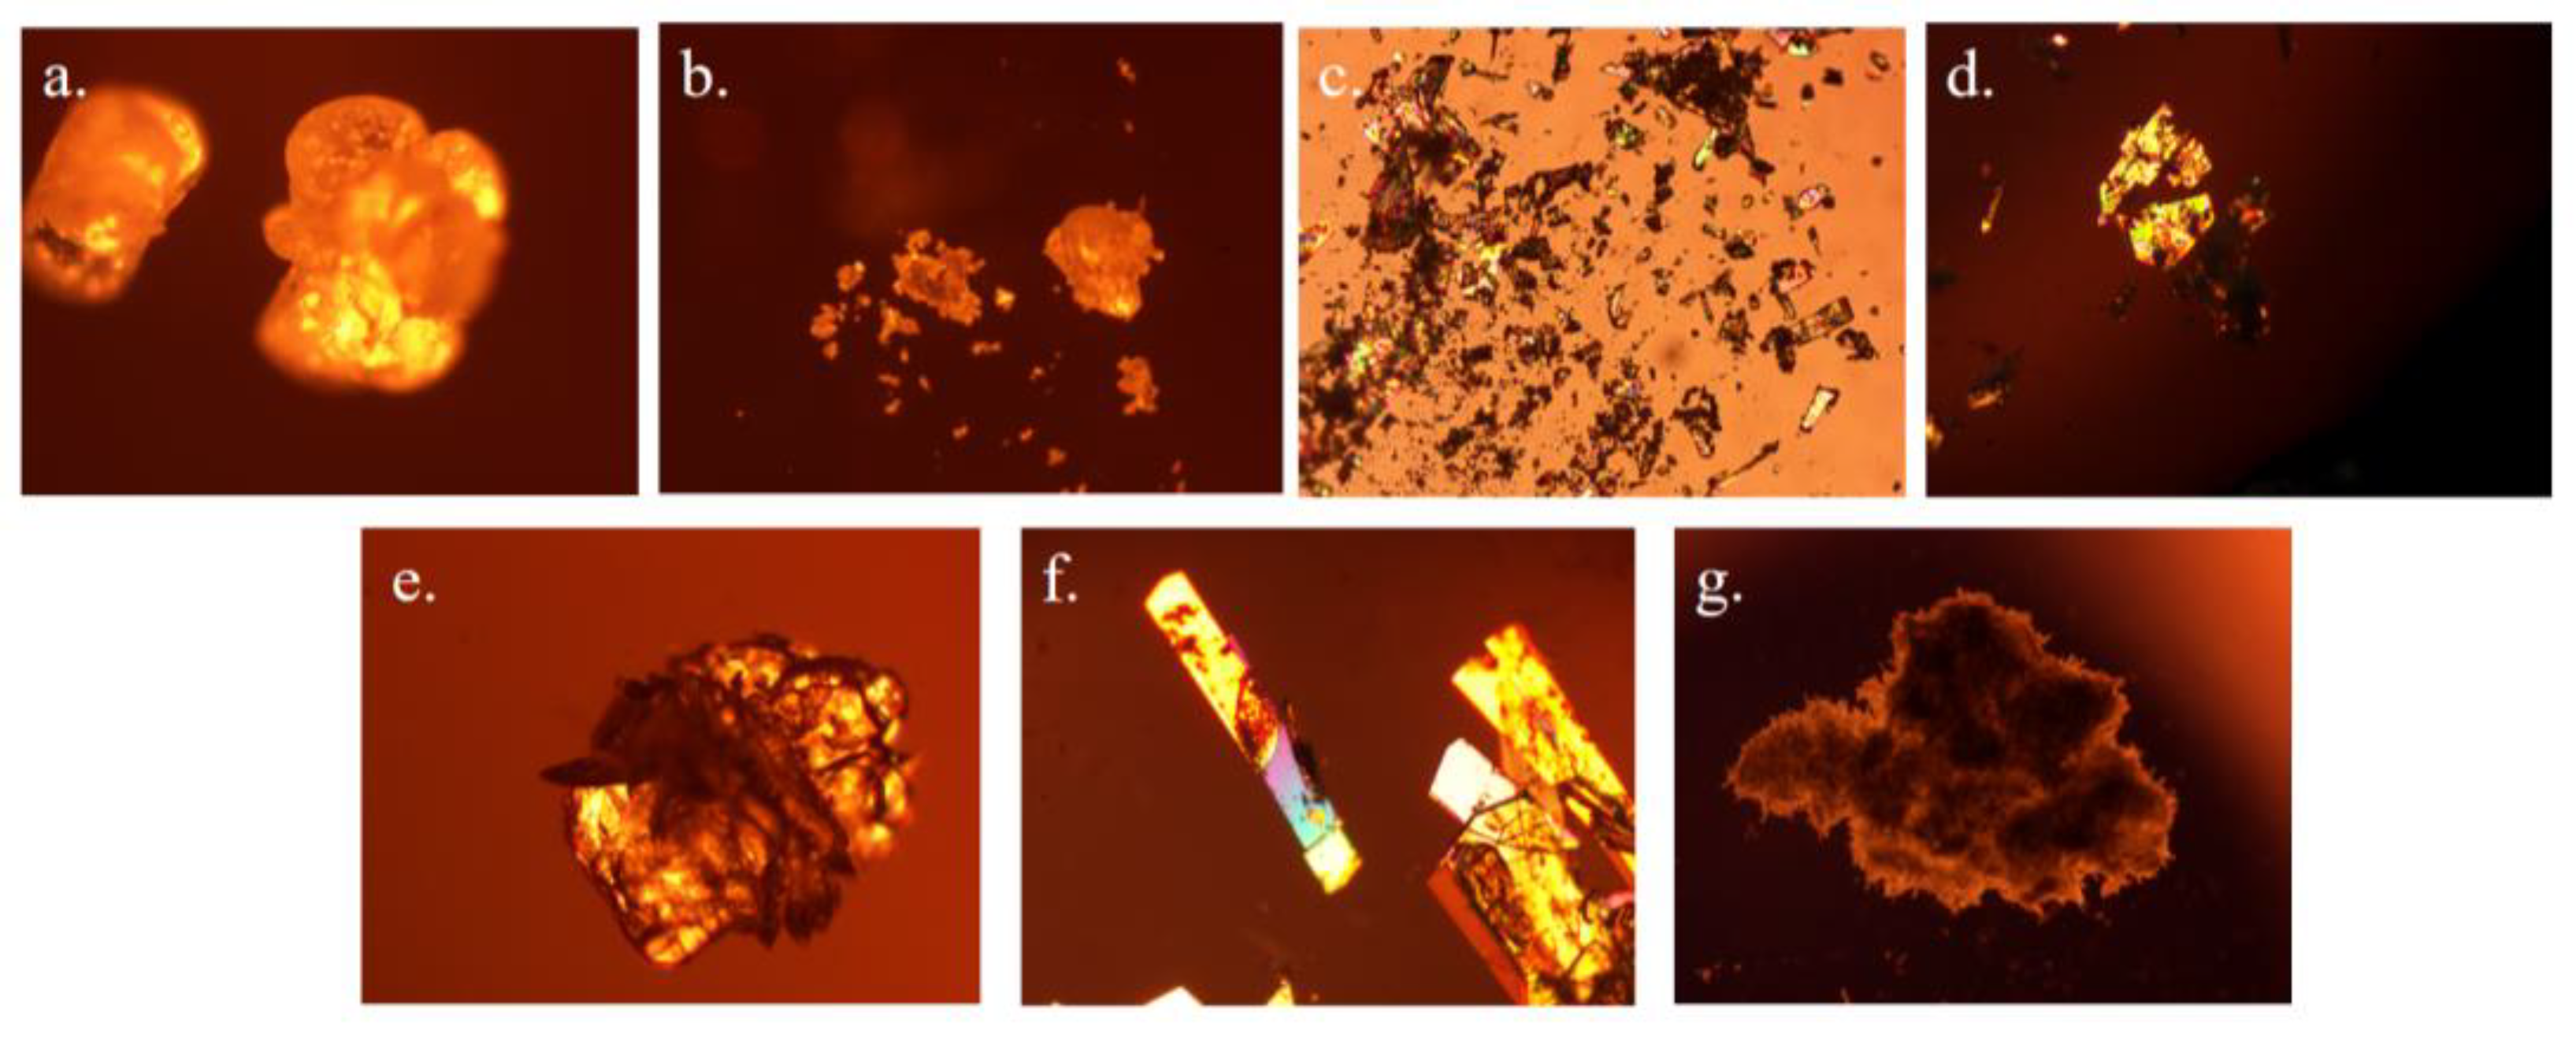
Different morphologies may exist in different crystal forms. The photos of form I, form A, form X, form C, form D, SF-OA and SF-MA under polarize light microscopy were shown in Figure 13 (a-f). We could observe that form I was granular, form A was also granular, and form X was prismatic. Form C was an irregular column, while form D was more like a ball plus a sheet. SF-OA was long columnar, while SF-MA was a piled needle. There was a big difference between the new solid-state forms and the form I.
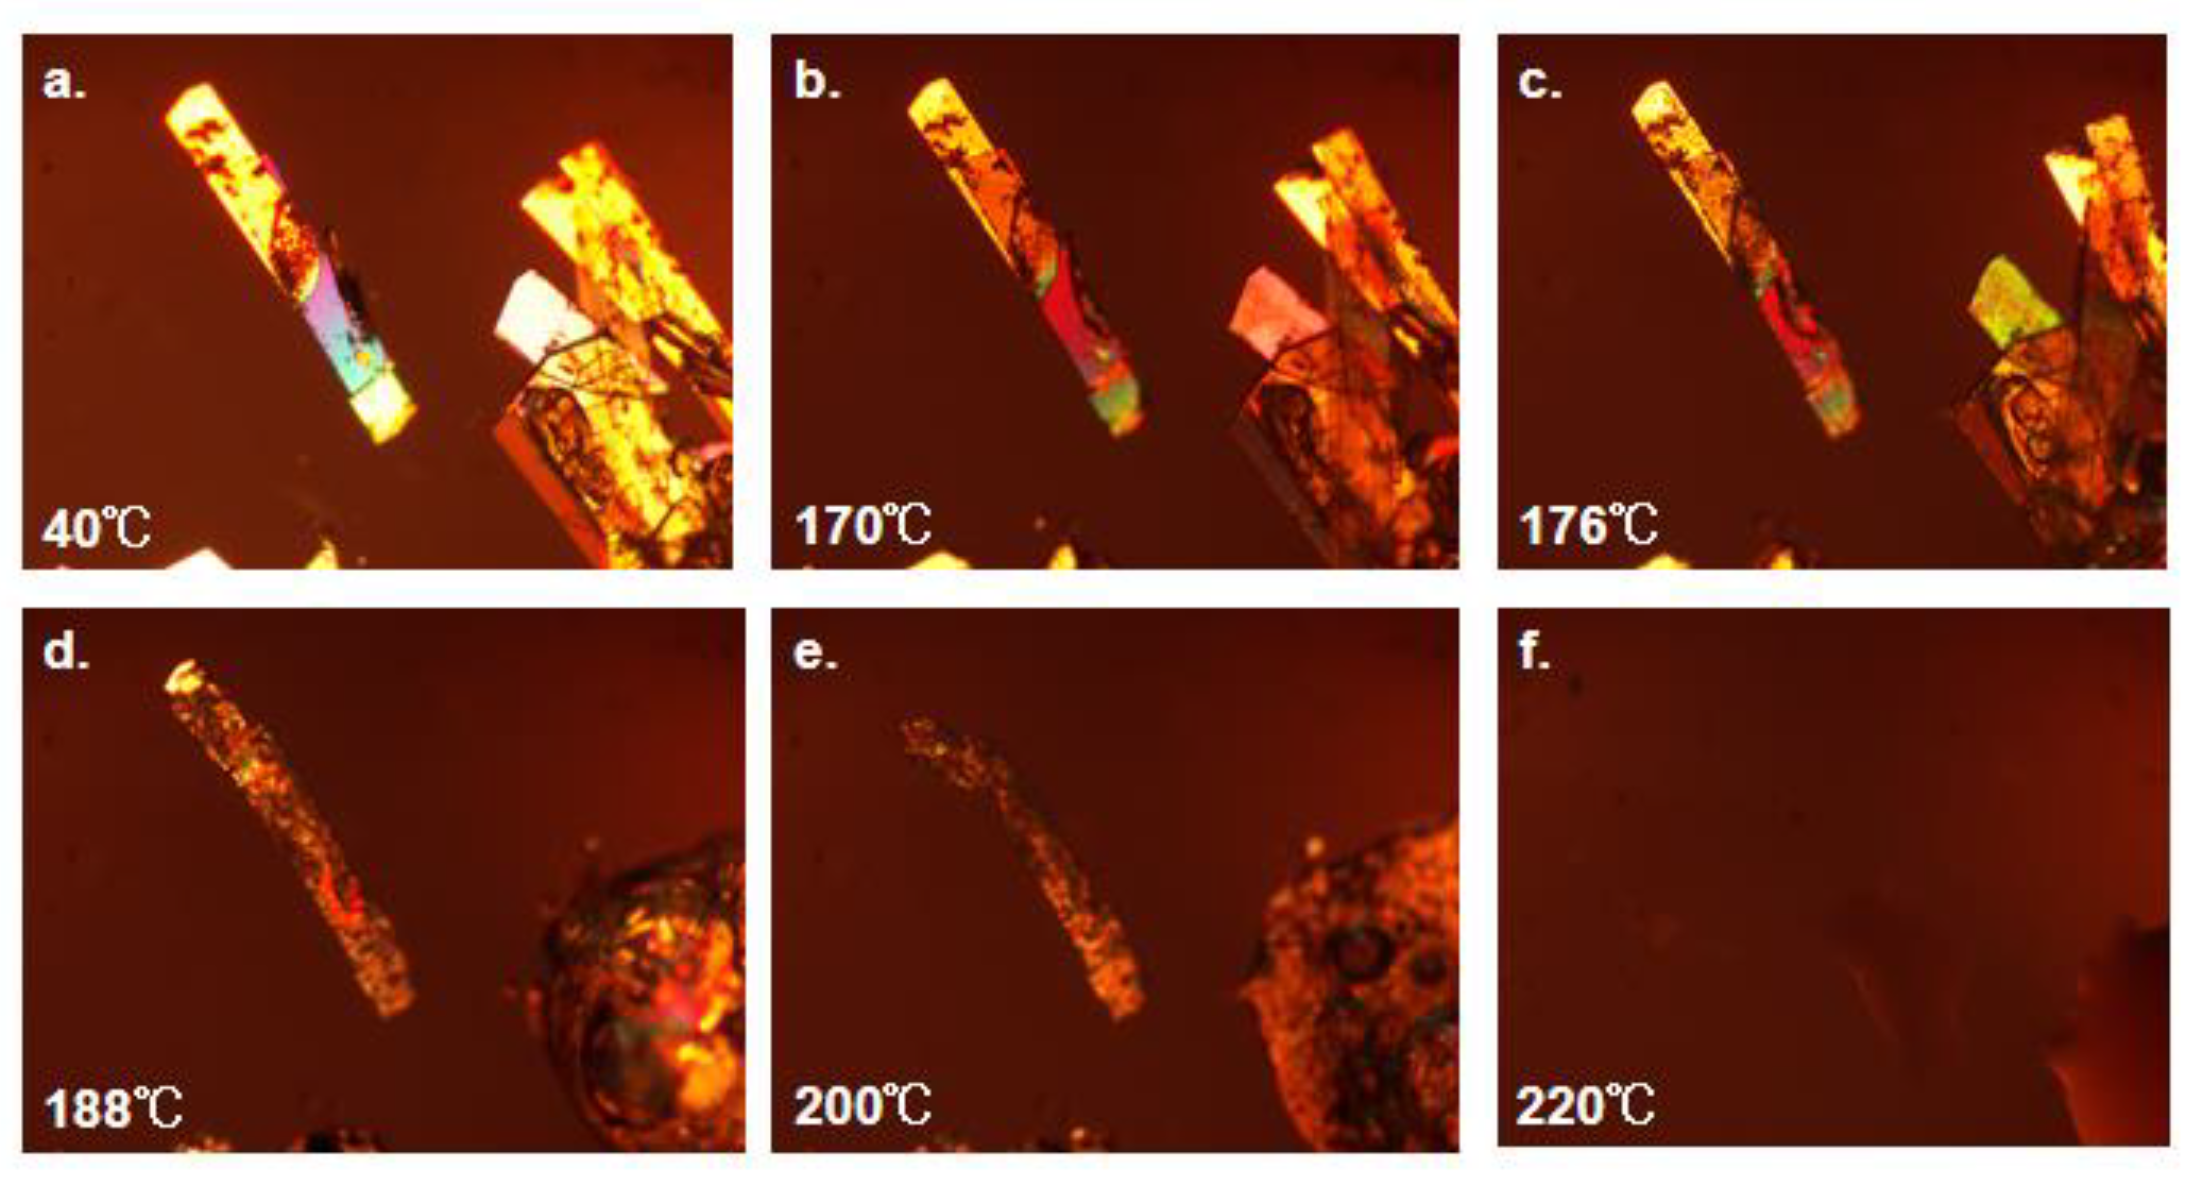
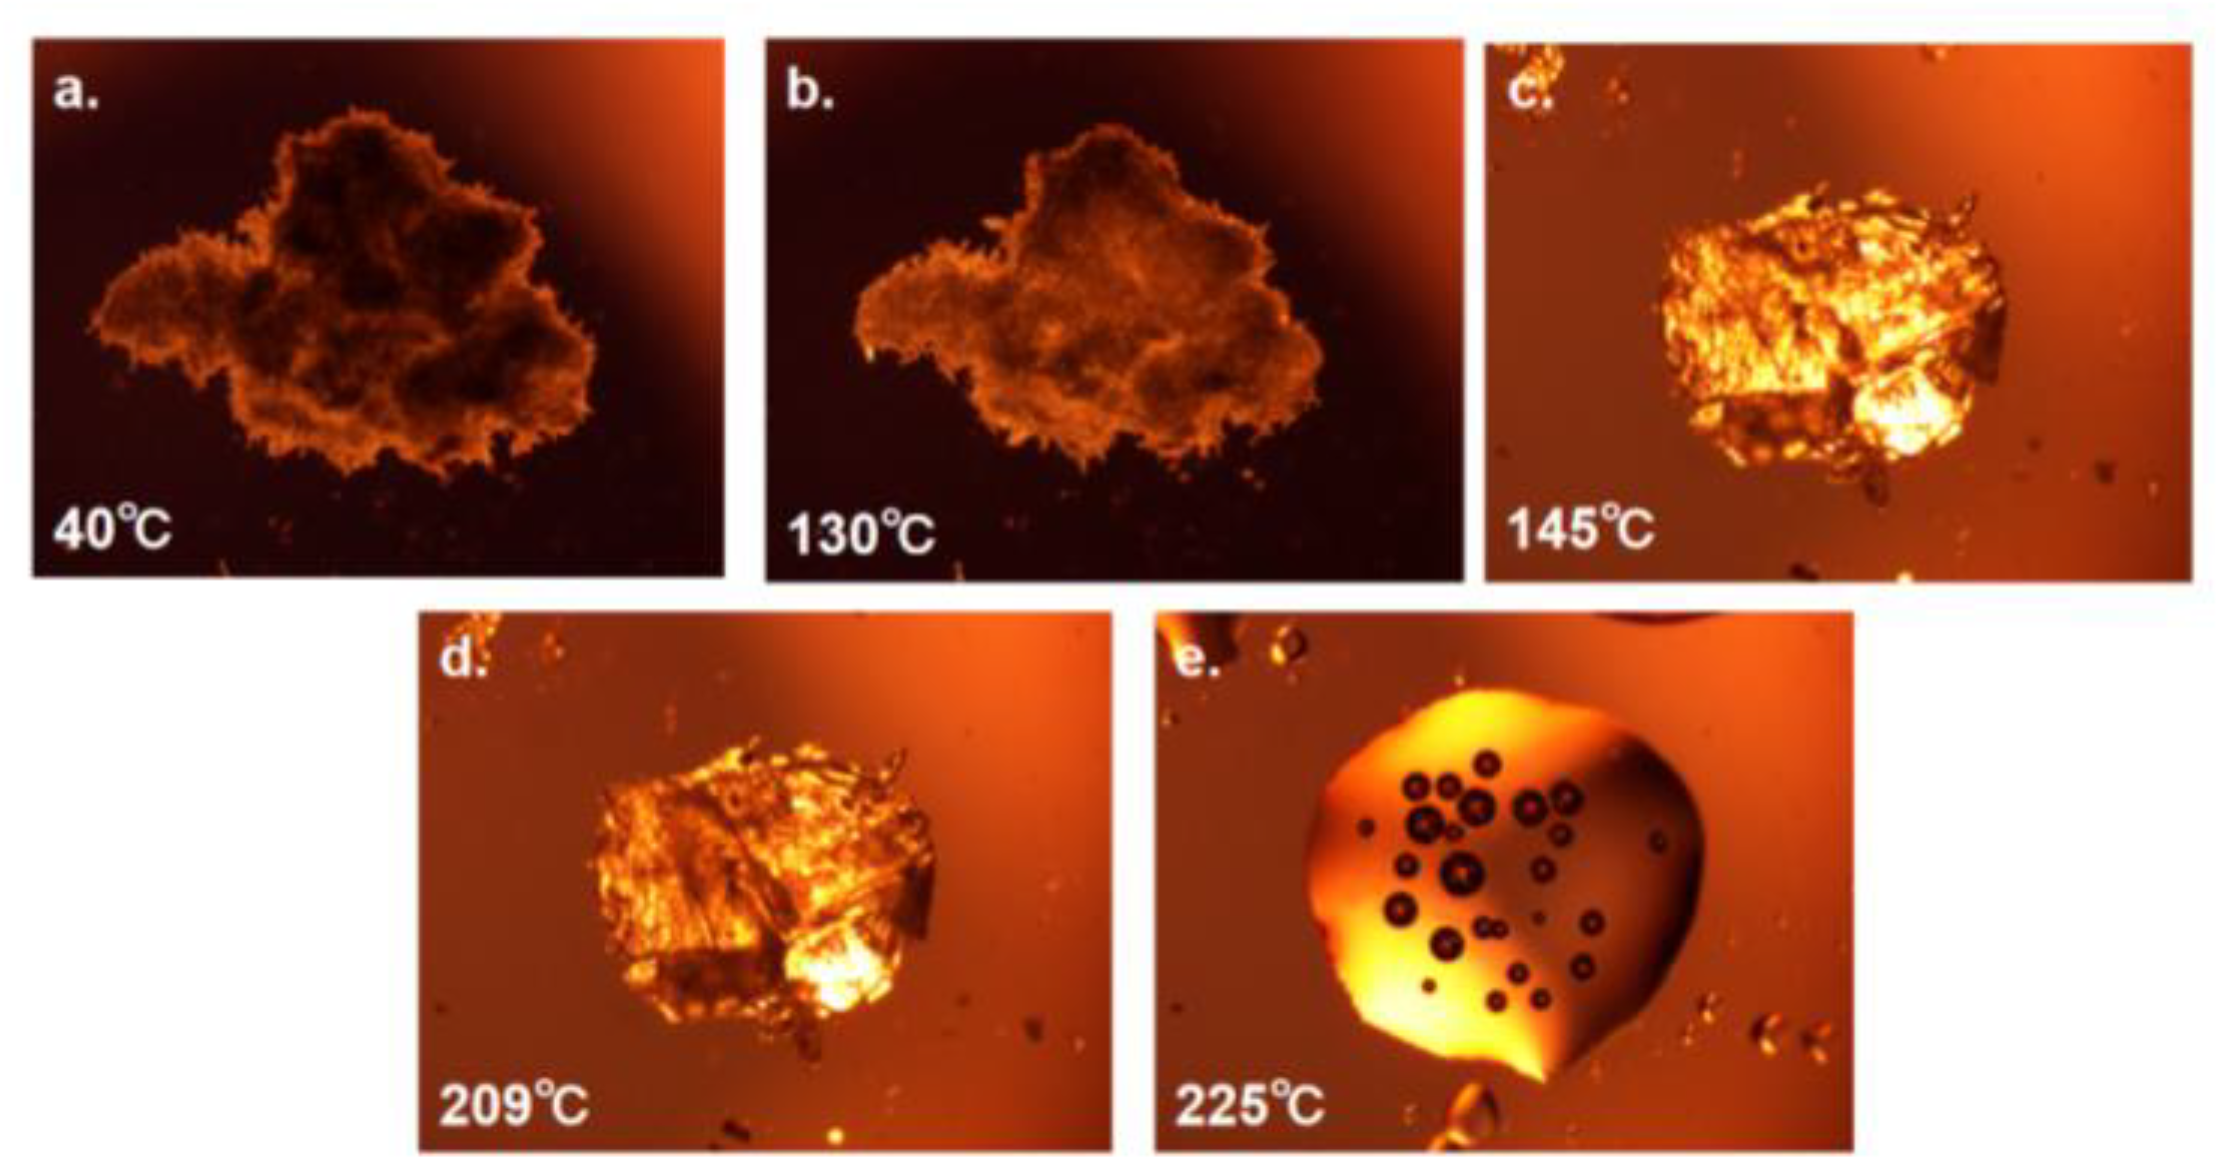
In order to observe the thermal behavior of the co-crystals in more details, the experiment of the co-crystals was carried out by setting the corresponding program through HSPLM. According to the findings from DSC and TGA, it is hypothesized that the crystal morphology of SF-OA and SF-MA has undergone a corresponding transformation when subjected to heat. To further investigate this, direct hot-stage polarizing microscope experiments were conducted. From Figure 14, SF-OA started to melt at 170 ℃, and there was a large area of melting at 188 ℃ until the melting is complete at 220 ℃. Then we speculated that the stepped float after 230 ℃ during TGA may be due to sample decomposition. Two melting phases of SF-MA were exhibited in Figure 15. The first stage involves the instantaneous transformation of SF-MA from cotton wool to massive crystals with suddenly brighten at 145 ℃, which was the melt of co-crystal. The second stage involves of a decomposition of MA from 145℃ to 209 ℃, we guessed that the melting of the bulk crystals up to 209 ℃. The final complete melting at 225 ℃, which was attributed to the molten of SF. In a word, we speculated that SF-MA was unstable at high temperatures, SF-MA melted when heated to 145℃. At the same time, the MA began to decompose, then the SF coalesced into a clump, and the observed crystals suddenly brighten with melting does not occur until 225 ℃.

3.2.6. FT-IR

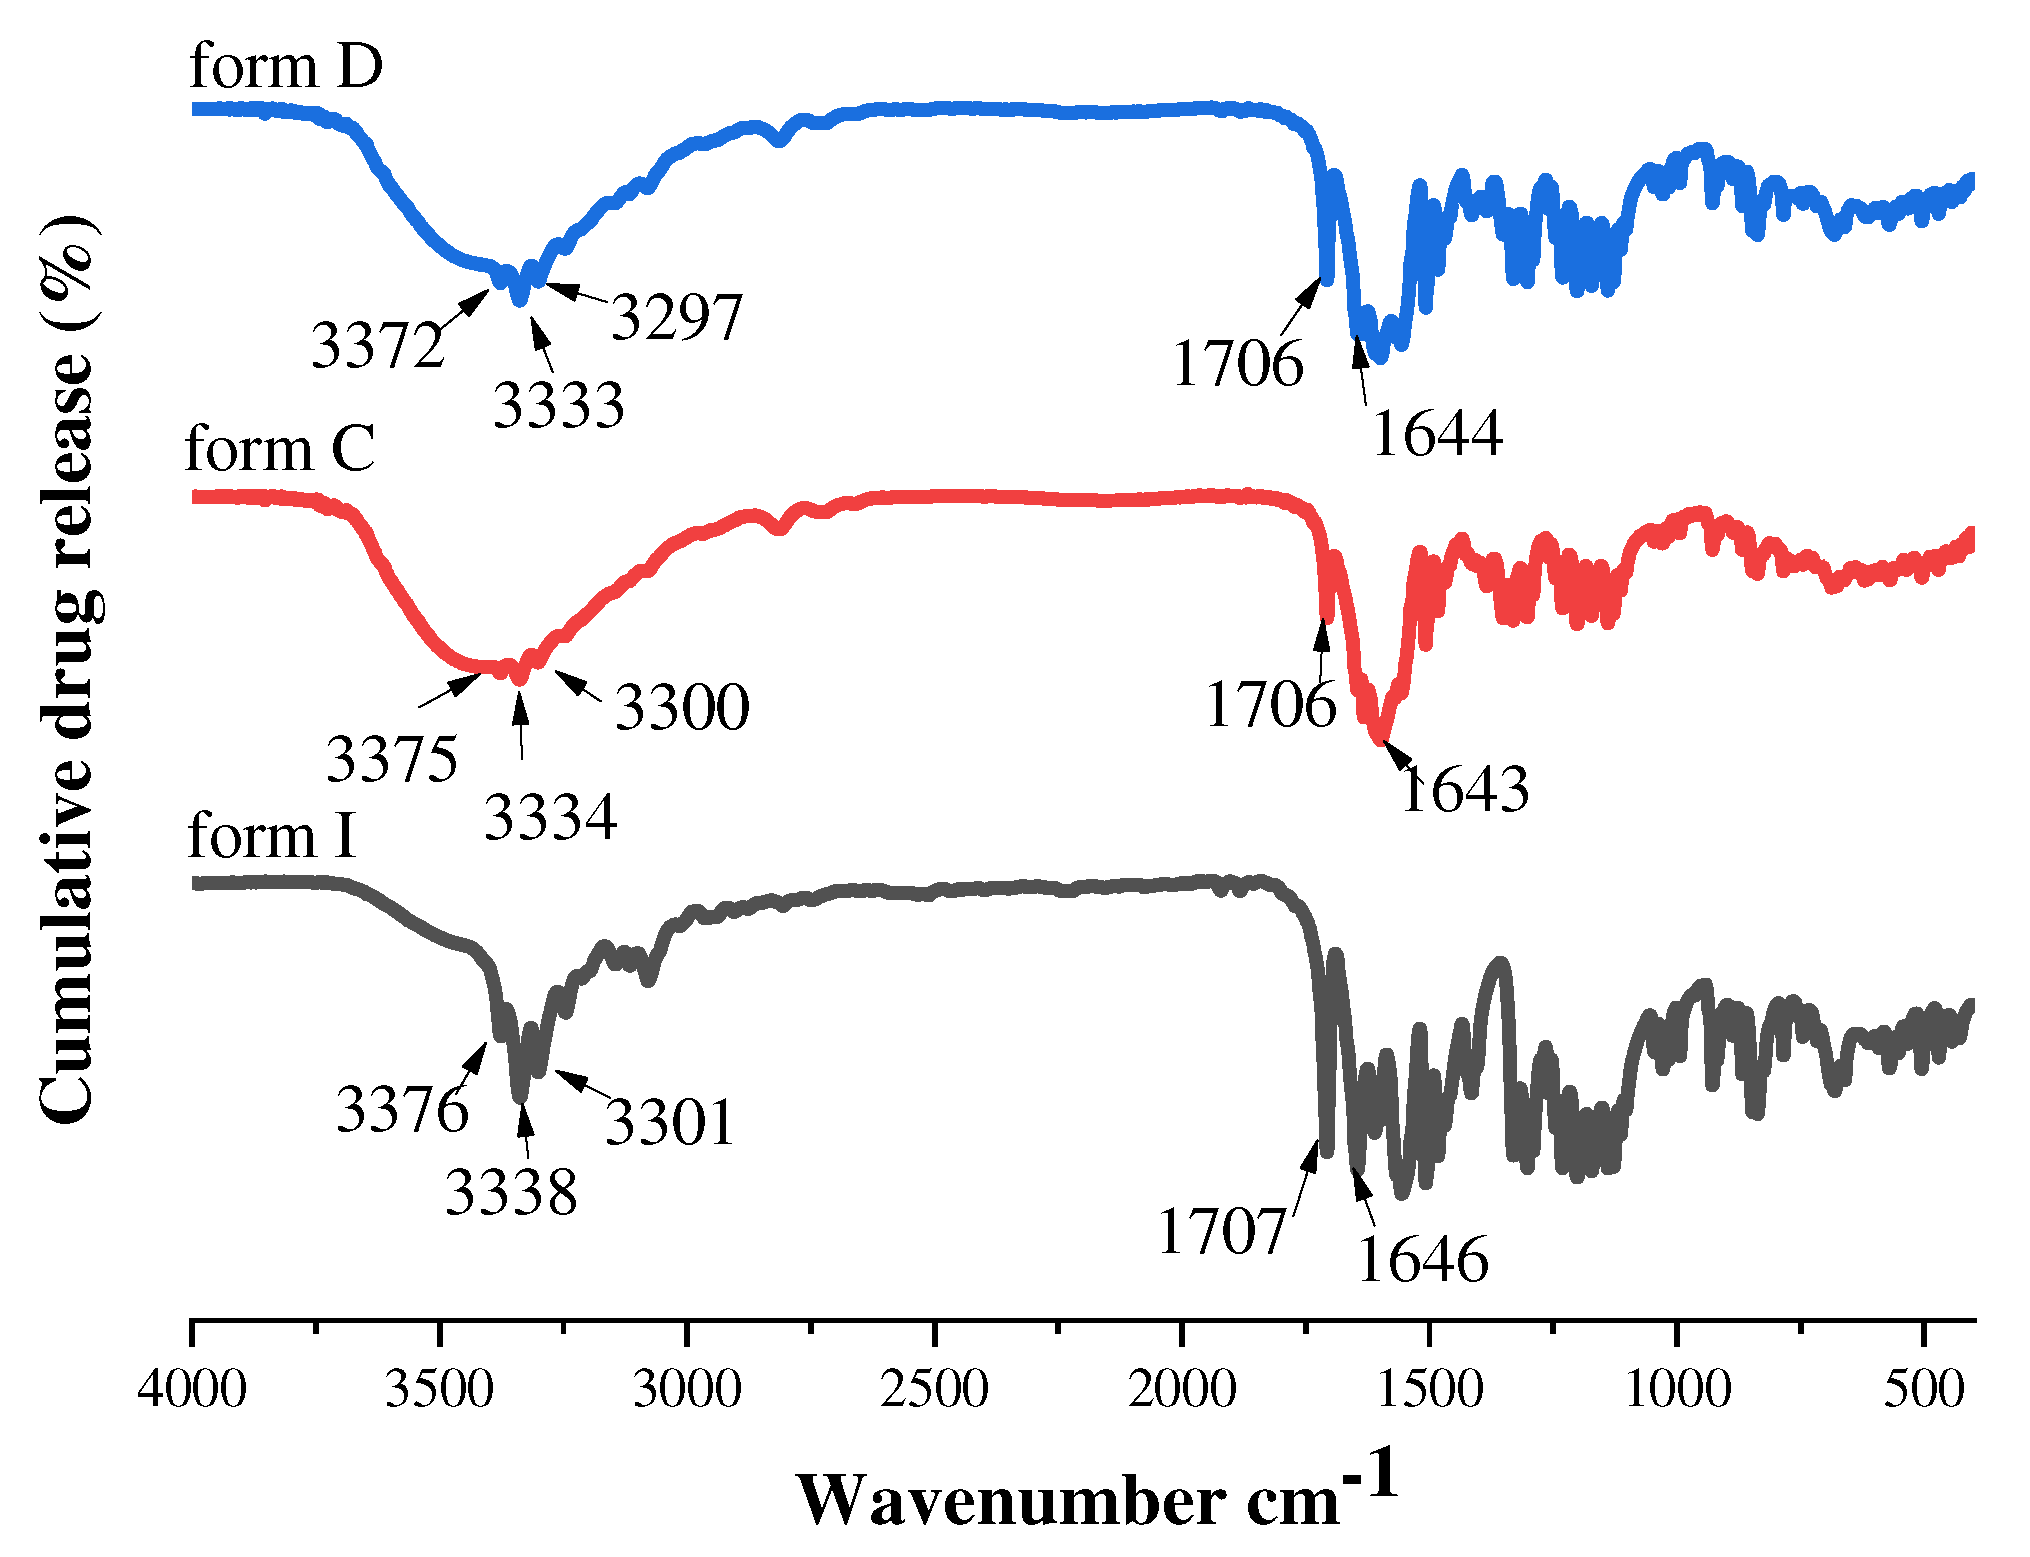
In order to verify functional group information in solid-state forms, we assisted the process with fourier transform infrared spectroscopy. According to the FT-IR spectrum (Figure 16), the distinct differences at 3200-3380 cm-1 and 1750-1600 cm-1 of form I, form C and form D could be noticed. SF form I showed characteristic absorption peaks for N-H and C=O stretch at 3376/3301 cm-1 and 1707/1646 cm-1, respectively. However, in the low wavenumber range, form C and form D showed strong absorption peaks at 1706/1643 cm-1 and 1706/1644 cm-1, which showed a red shift. Meanwhile, the peaks of form C and form D were wilder at high wavenumber positions compared to form I, which were 3375/3300 cm-1 and 3372/3297 cm-1, it also showed a red shift. Hence, it could be inferred from the aforementioned analysis that there were various configurations among molecules.
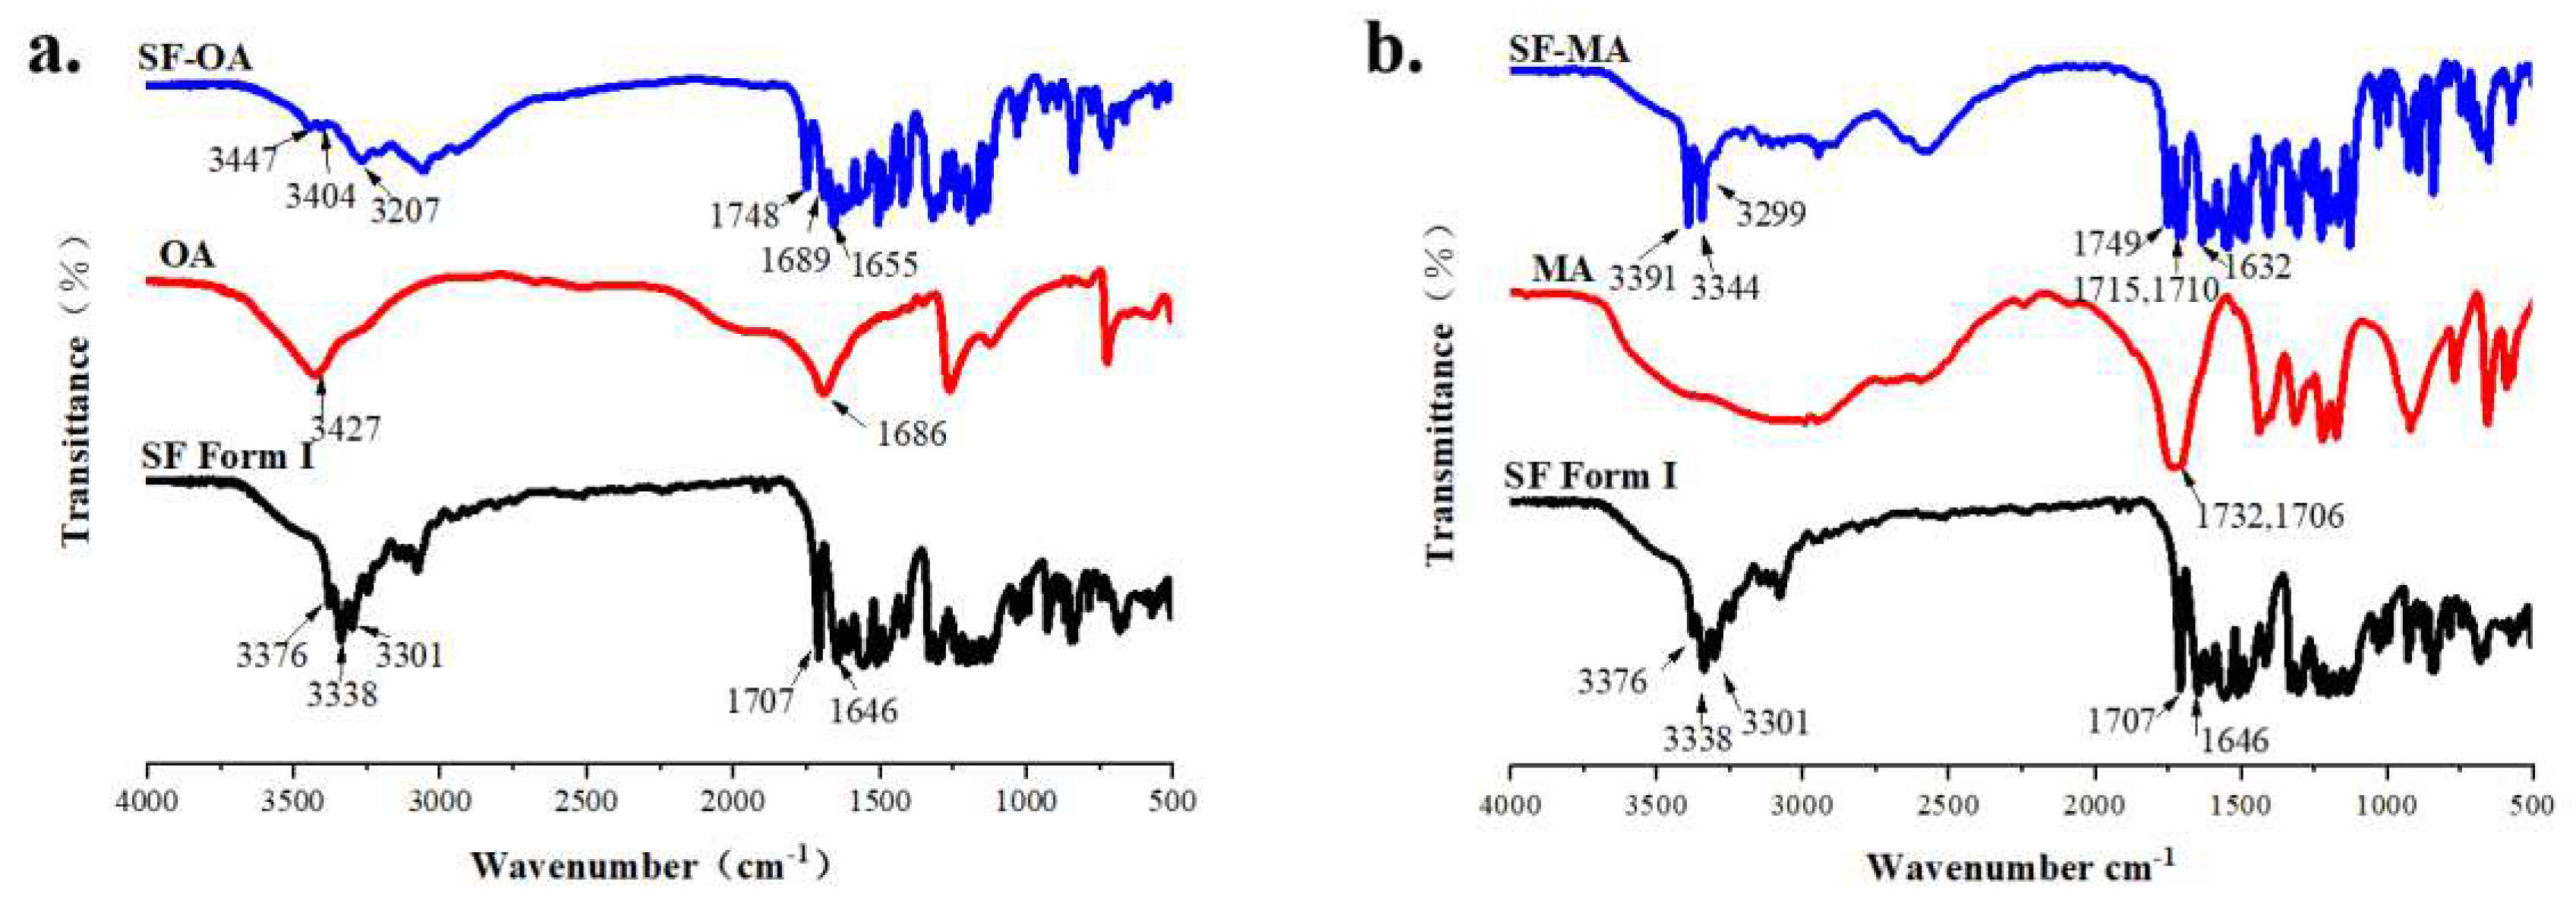
The FT-IR spectra of SF form I, CCFs and co-crystals have been compared to further verify the inter-molecular interactions between SF and CCF (Figure 17). As shown in Figure 17 (a), OA showed characteristic stretching vibration peaks for C=O and O-H stretch at 1686 cm-1 and 3427 cm-1, respectively. In the infrared spectrum of SF-OA, the characteristic stretching vibration peaks of O-H and N-H at 3447/3404/3207 cm-1 could be observed. While the C=O vibration peaks appeared at 1748/1869/1655 cm-1. By comparing the IR spectrum, it could find that the characteristic stretching vibration peaks (N-H, O-H, C=O) of SF and OA have been displaced and its vibration peak become wider, indicating that there may be differences in the intermolecular forces. The movement of O-H, N-H, C=O aslo verified that the urea and amide groups of SF formed hydrogen bonds with the carbon groups of anhydrous oxalic acid in co-crystals, which was agree with the result of SCXRD. The diagram of the mode of action between SF and OA was shown in Figure 18 (a). In Figure 17(b), MA showed characteristic absorption peaks for C=O stretch at 1732 cm-1. The N-H stretching vibrations were observed at 3391/3344/3299 cm-1, and the C=O stretching vibrations appear at 1749/1715/1632 cm-1. The infrared spectral variation of SF-MA was similar to SF-OA. Therefore, we speculated that SF forms a hydrogen bond with MA and has the same site as SF-OA, and the speculative diagram of the mode of action was shown in Figure 18 (b). In addition, mentioned in the literature that the C=O in the neutral carboxylic acid has a strong tensile band at 1700 cm-1[56]. The absorption peaks of C=O are all around 1700 cm-1 in co-crystals, so it could be inferred that there was no ionic bond interaction between SF and OA, MA. Combined with the ∆pKa rule, SF was more likely to form co-crystals with OA and MA than salt.

3.3. Solution and In-Vitro Dissolution Experiments

3.3.1. Equilibrium Solubility of form C and form D

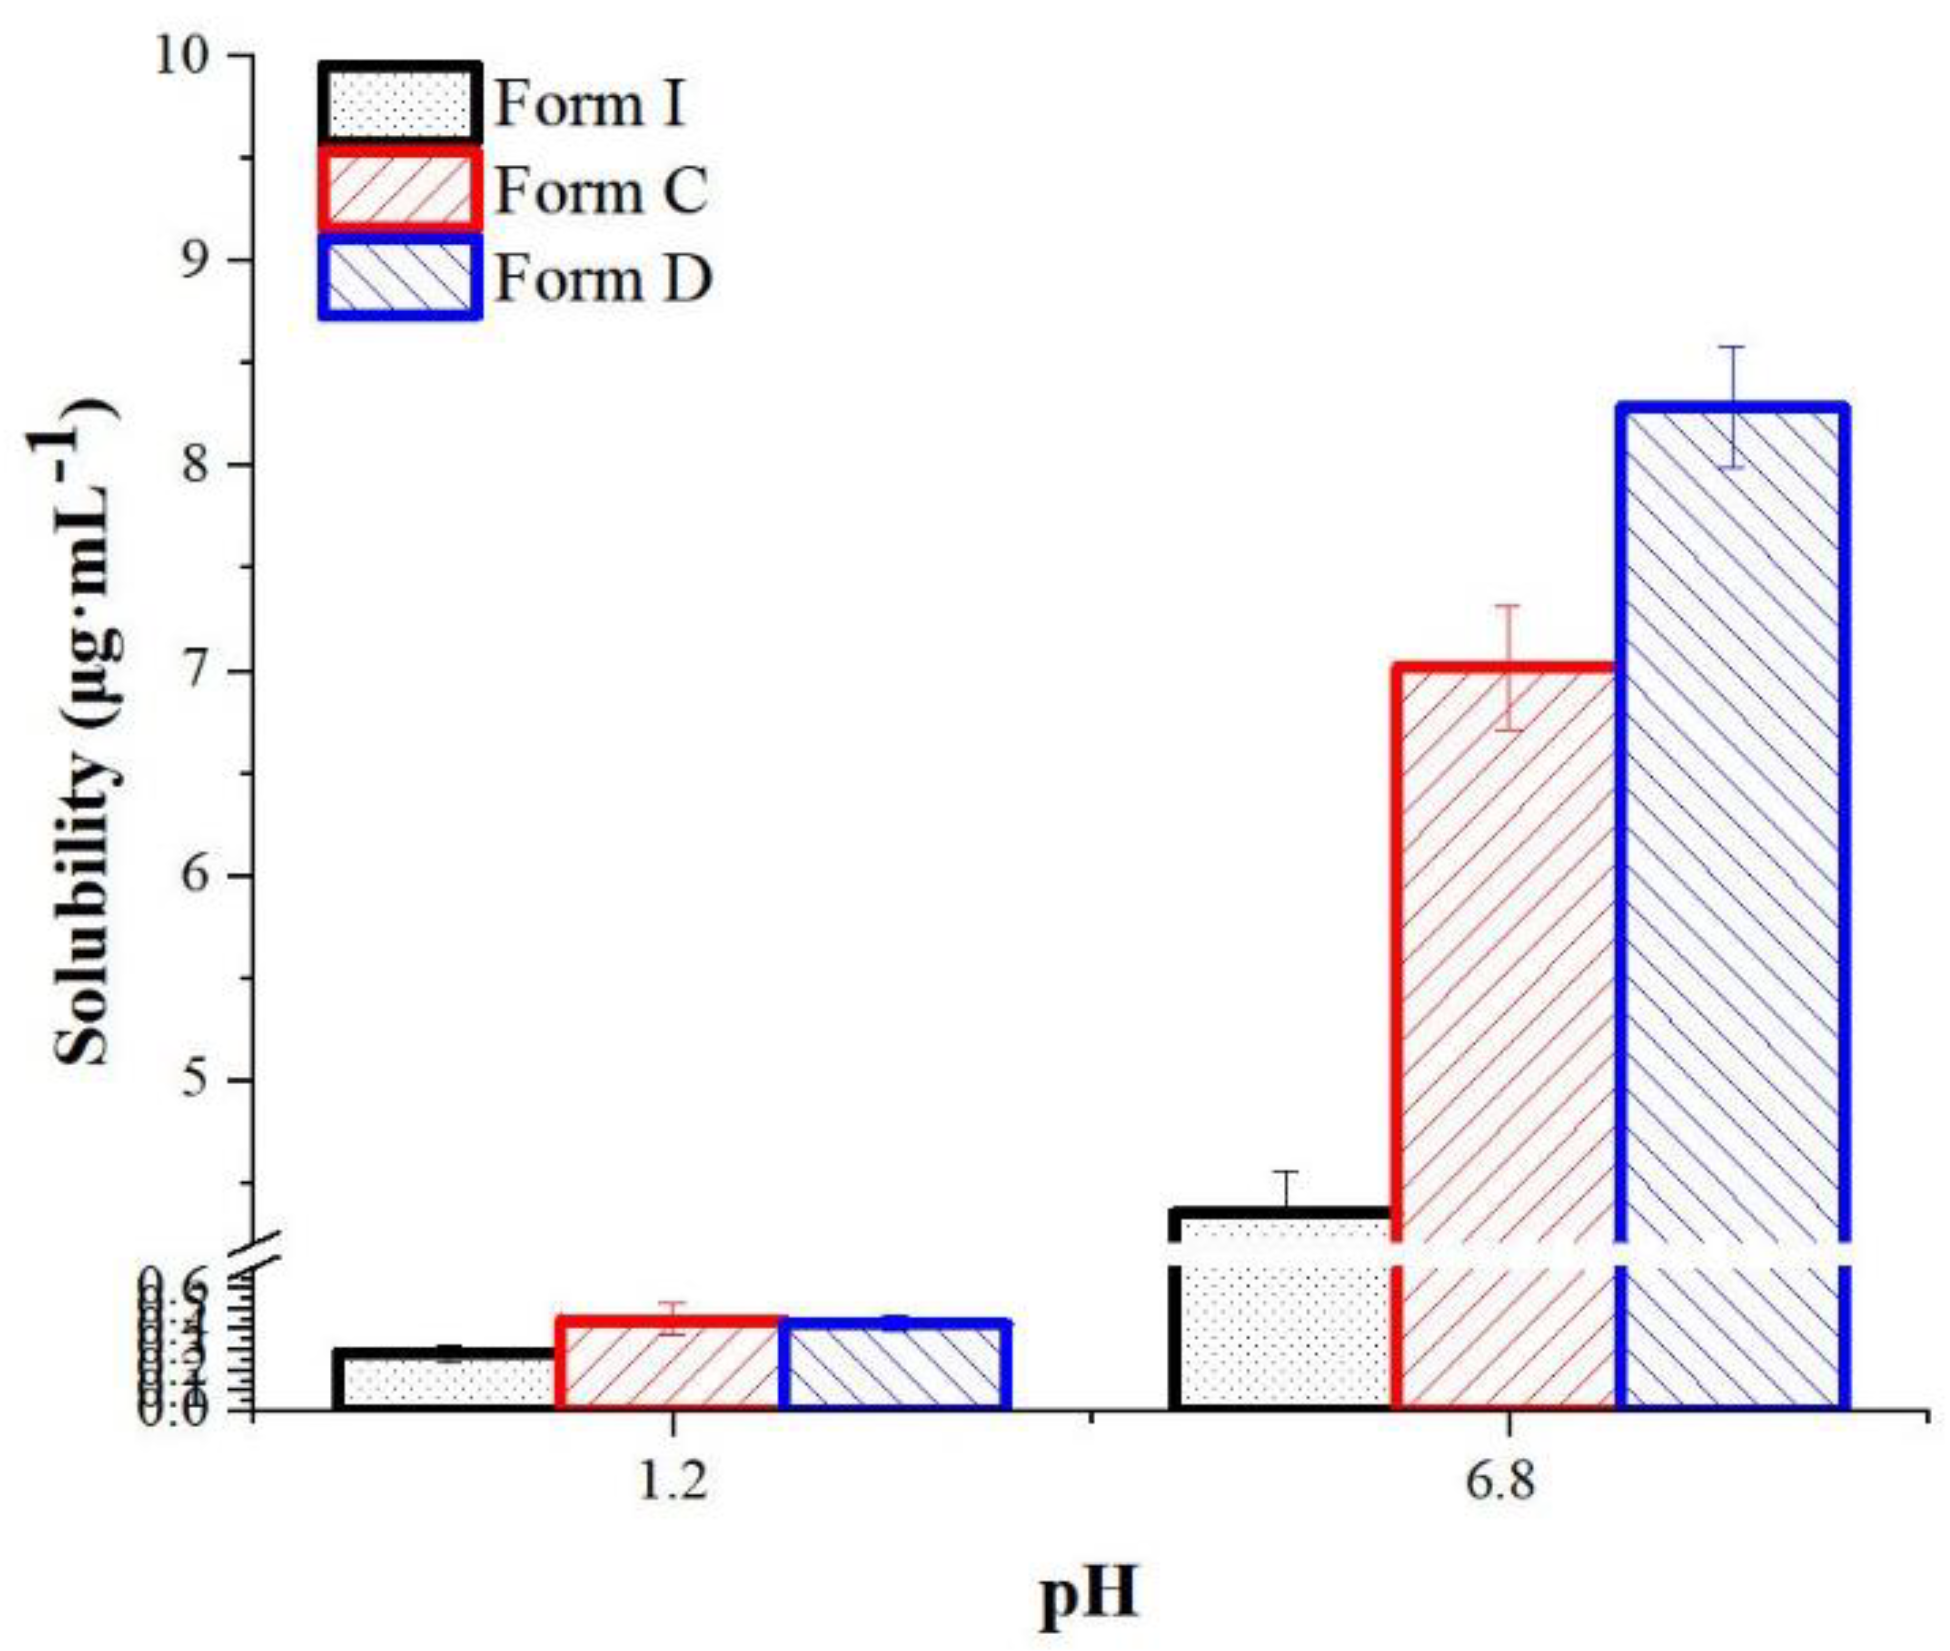
Solubility is one of the most important properties of drugs, as low solubility limits drug absorption and reduces oral bioavailability [57]. The equilibrium solubility in hydrochloric acid solution (pH 1.2 HCl) and phosphate buffer solution (pH 6.8 with 0.2%SDS) for two polymorphs compared to API Form I were shown in Figure 19. At pH 1.2 HCl, the solubility of form C and form D was 1.59, 1.49 times than form I, and it was improved by 1.59, 1.87 fold at pH 6.8 with 0.2%SDS, respectively.

3.3.2. In-Vitro Dissolution Experiments

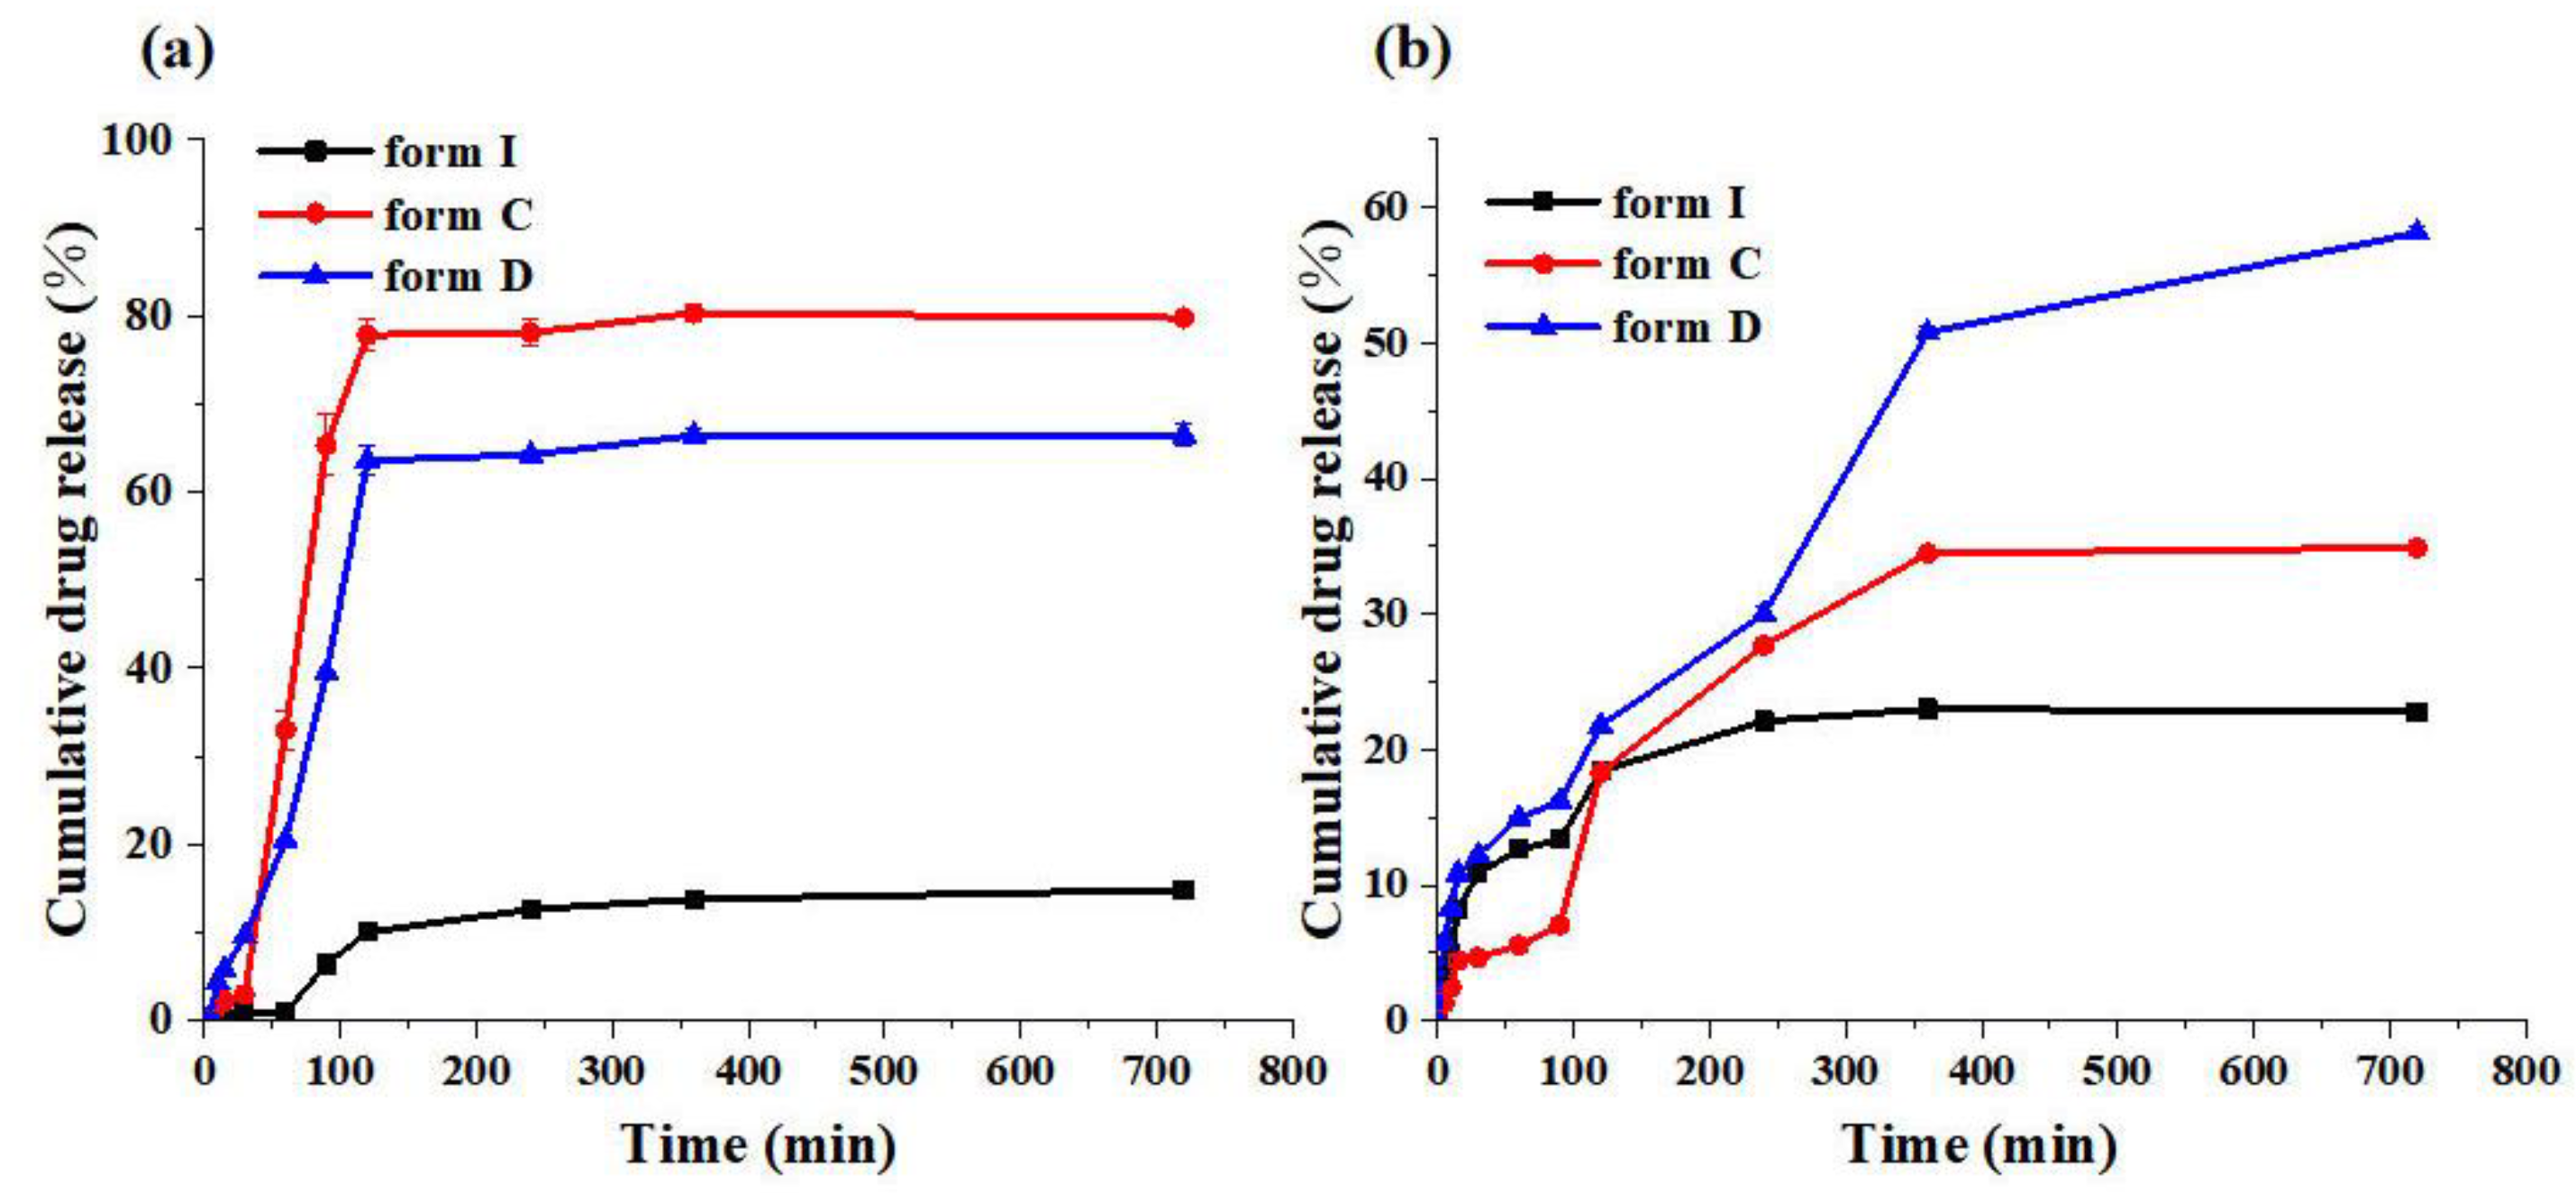
The purpose of in vitro dissolution testing is to understand the biopharmacological properties of a formulation and to predict the release and absorption characteristics of a drug in vivo [58,59,60]. Thus, compared with form I, we investigated the cumulative drug release behavior of the new crystalline form C and form D to further evaluate the polymorphs of SF in pH 1.2 HCl solution, pH 6.8 PBS containing 0.2% SDS for 12h (720 min) at 37 ℃. The cumulative release behavior of pH 1.2 HCl was shown in Figure 20 (a), the cumulative drug release of form C was the highest in all samples and the cumulative drug release was up to 79.7%. Form D was also higher than form I, which was 66.7%. Yet, the cumulative drug release of form I was only 14.89%. As shown in Figure 20 (b), the ordination of cumulative drug release at pH 6.8 was form D, form C, and form I which were 58.1%, 34.9%, and 22.8%. Furthermore, based on the information provided in Figure 20, it was evident that form C and form D could maintain stable release for 720 mins and improve the release capacity of SF in two conditions. Combined with the results of the solubility experiment, it could be concluded that there was potential for form C and form D to be used in clinical applications.

3.3.3. Kinetic Solubility of Co-crystals

Kinetic solubility is a non-equilibrium solubility. It is usually associated with the dissolution behavior and stability of a drug in solution. Kinetic solubility measurements were performed on co-crystals, as they may be subject to dissociation during solubility measurements [61,62,63]. The kinetic solubility experiments of SF Form I, PMs, and co-crystals were conducted at pH 1.2 HCl and pH 6.8 PBS containing 0.2% SDS at 37 ℃, and the results were presented in Figure 21. SF-OA and SF-MA exhibited faster dissolution rates and higher apparent solubility (Smax) compared to SF and PMs. In pH 1.2 HCl, the Smax values of SF-OA and SF-MA were 7.19 μg/mL and 5.57 μg/mL, which were 8.3 and 6.4 times as much as that of SF Form I respectively. Similarly, the Smax values of SF-OA and SF-MA are 37.22 μg/mL and 42.02 μg/mL in pH 6.8 PBS respectively, which were 4.0 and 4.5 times higher than that of the SF Form I. Furthermore, SF physical mixtures are in general agreement with the Form I curve in Figure 21, which concludes that physical mixtures could not improve the solubility of SF. Therefore, the drug had the property of improving solubility only when it formed a co-crystal with CCFs through forces such as hydrogen bonding.

3.3.4. The Discussion of Co-crystals Solubility Mechanism

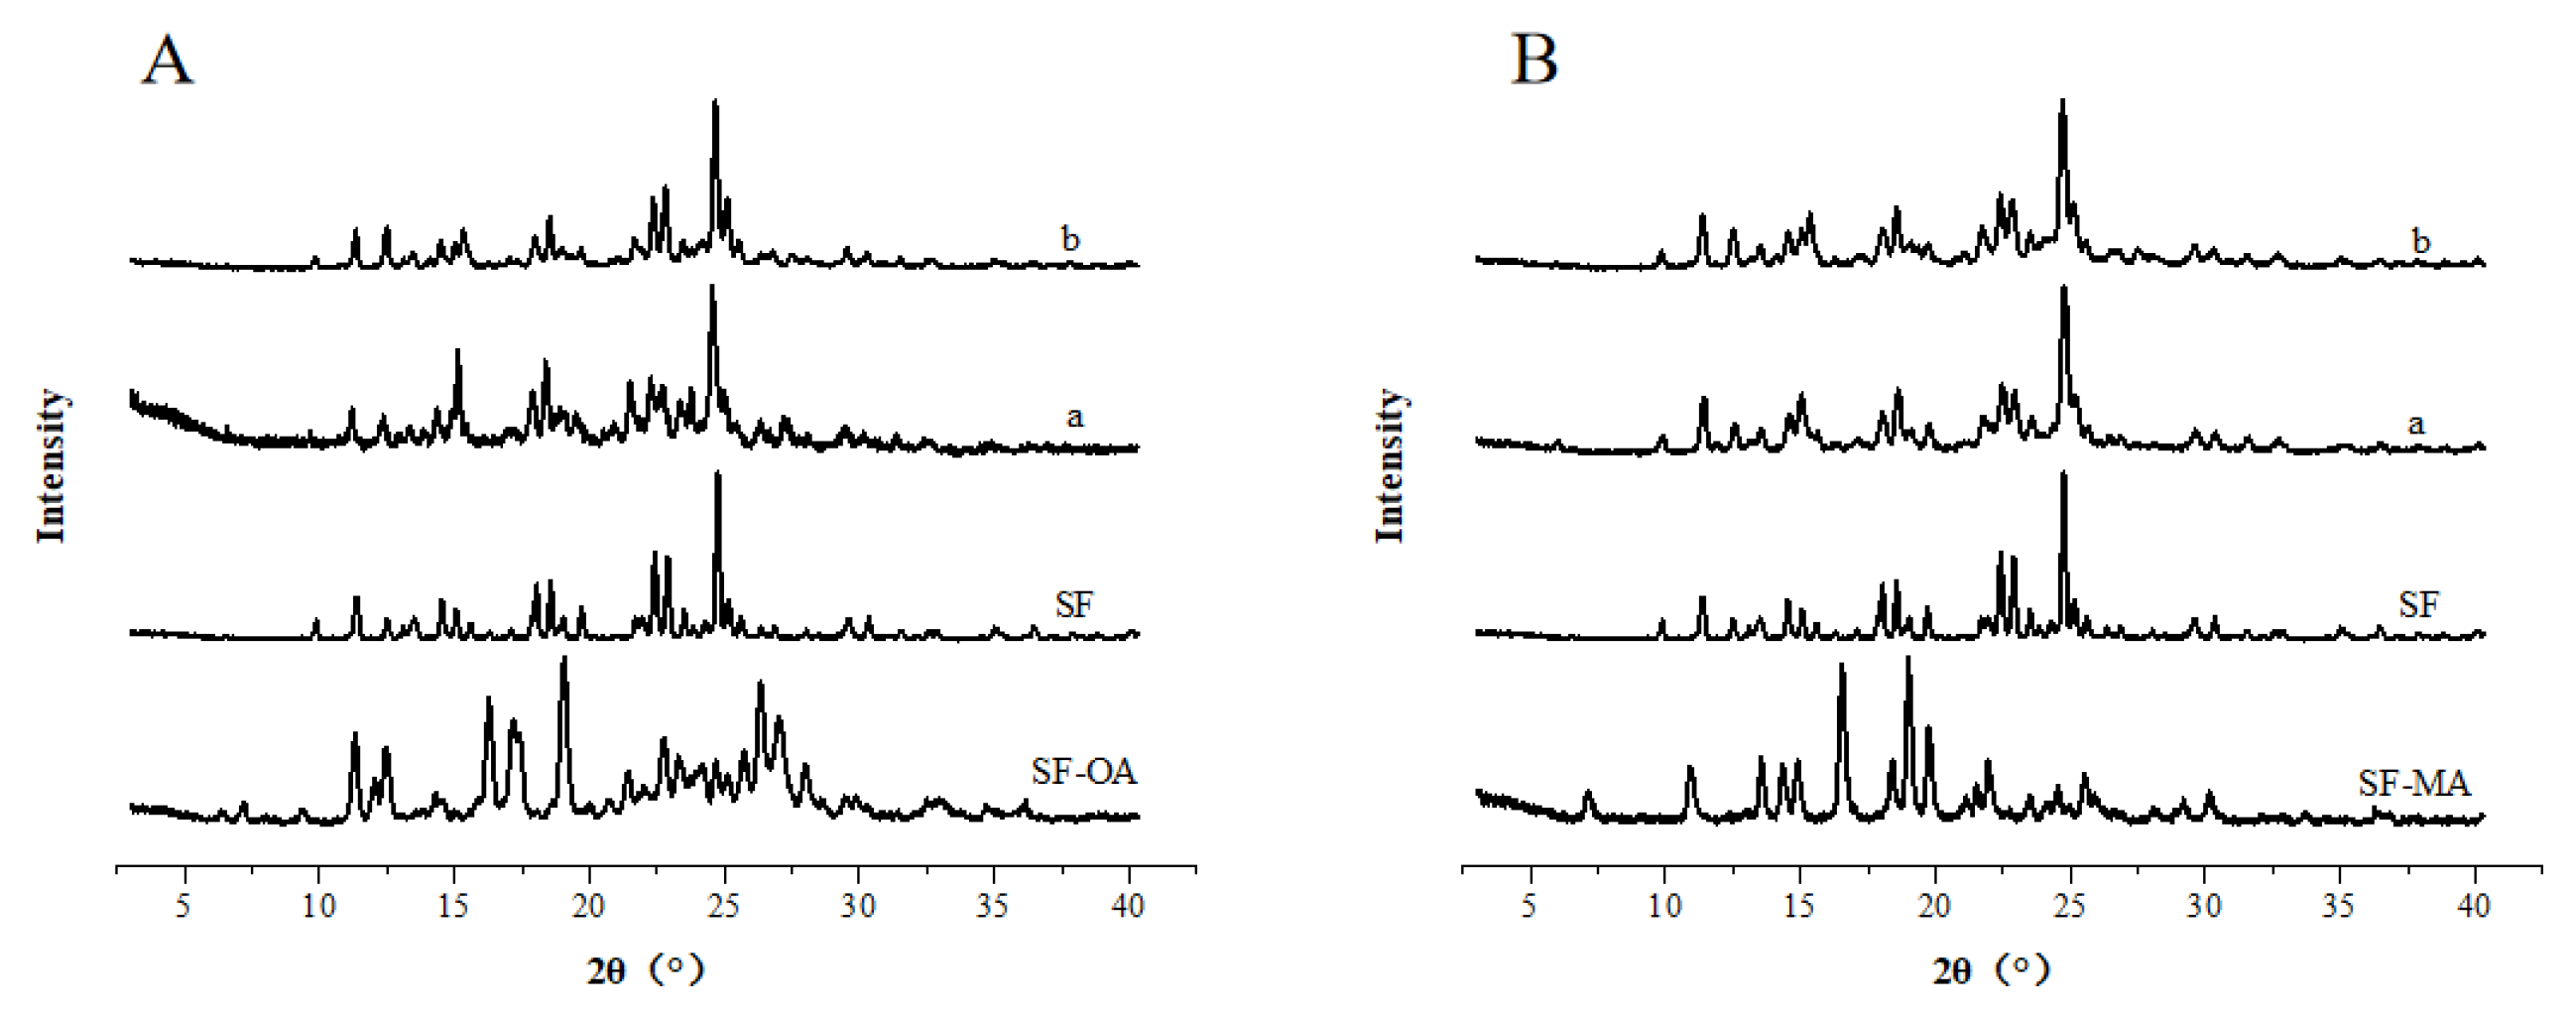
The increased apparent solubility of SF co-crystals may be conducive to improving the oral bioavailability of the poorly soluble SF. After reaching Smax, the concentration of the co-crystals decreased gradually and was close to SF Form I. This phenomenon was called “spring and parachute” which has also been reported in other co-crystal systems [64,65] and suggests that two co-crystals may convert to SF Form I during dissolution. It could be further proved by PXRD of the residual solids (Figure 22). The PXRD patterns of residual solids depicted a characteristic peak of SF at 22.32° and 24.65°. According to the “spring and parachute” mechanism, the difference in solubilities between the SF and CCF leads to rapid dissolution of the more soluble part (CCF) of co-crystal and lattice collapse. While the SF part of the co-crystal evolves supersaturated as metastable crystalline phase transforming to stable crystalline phase (SF Form I) following. At the end of the experiment, the pH of the phosphoric acid buffer was always maintained at 6.8, while in hydrochloric acid with pH 1.2 HCl, the pH of all samples was between 1.15-1.35. The pH values of all samples remained almost unchanged, indicating that the dissolution profiles for co-crystals were hardly affected by changes in pH value. Therefore, the increase in co-crystal solubility was due to itself.

3.5. Stability Tests

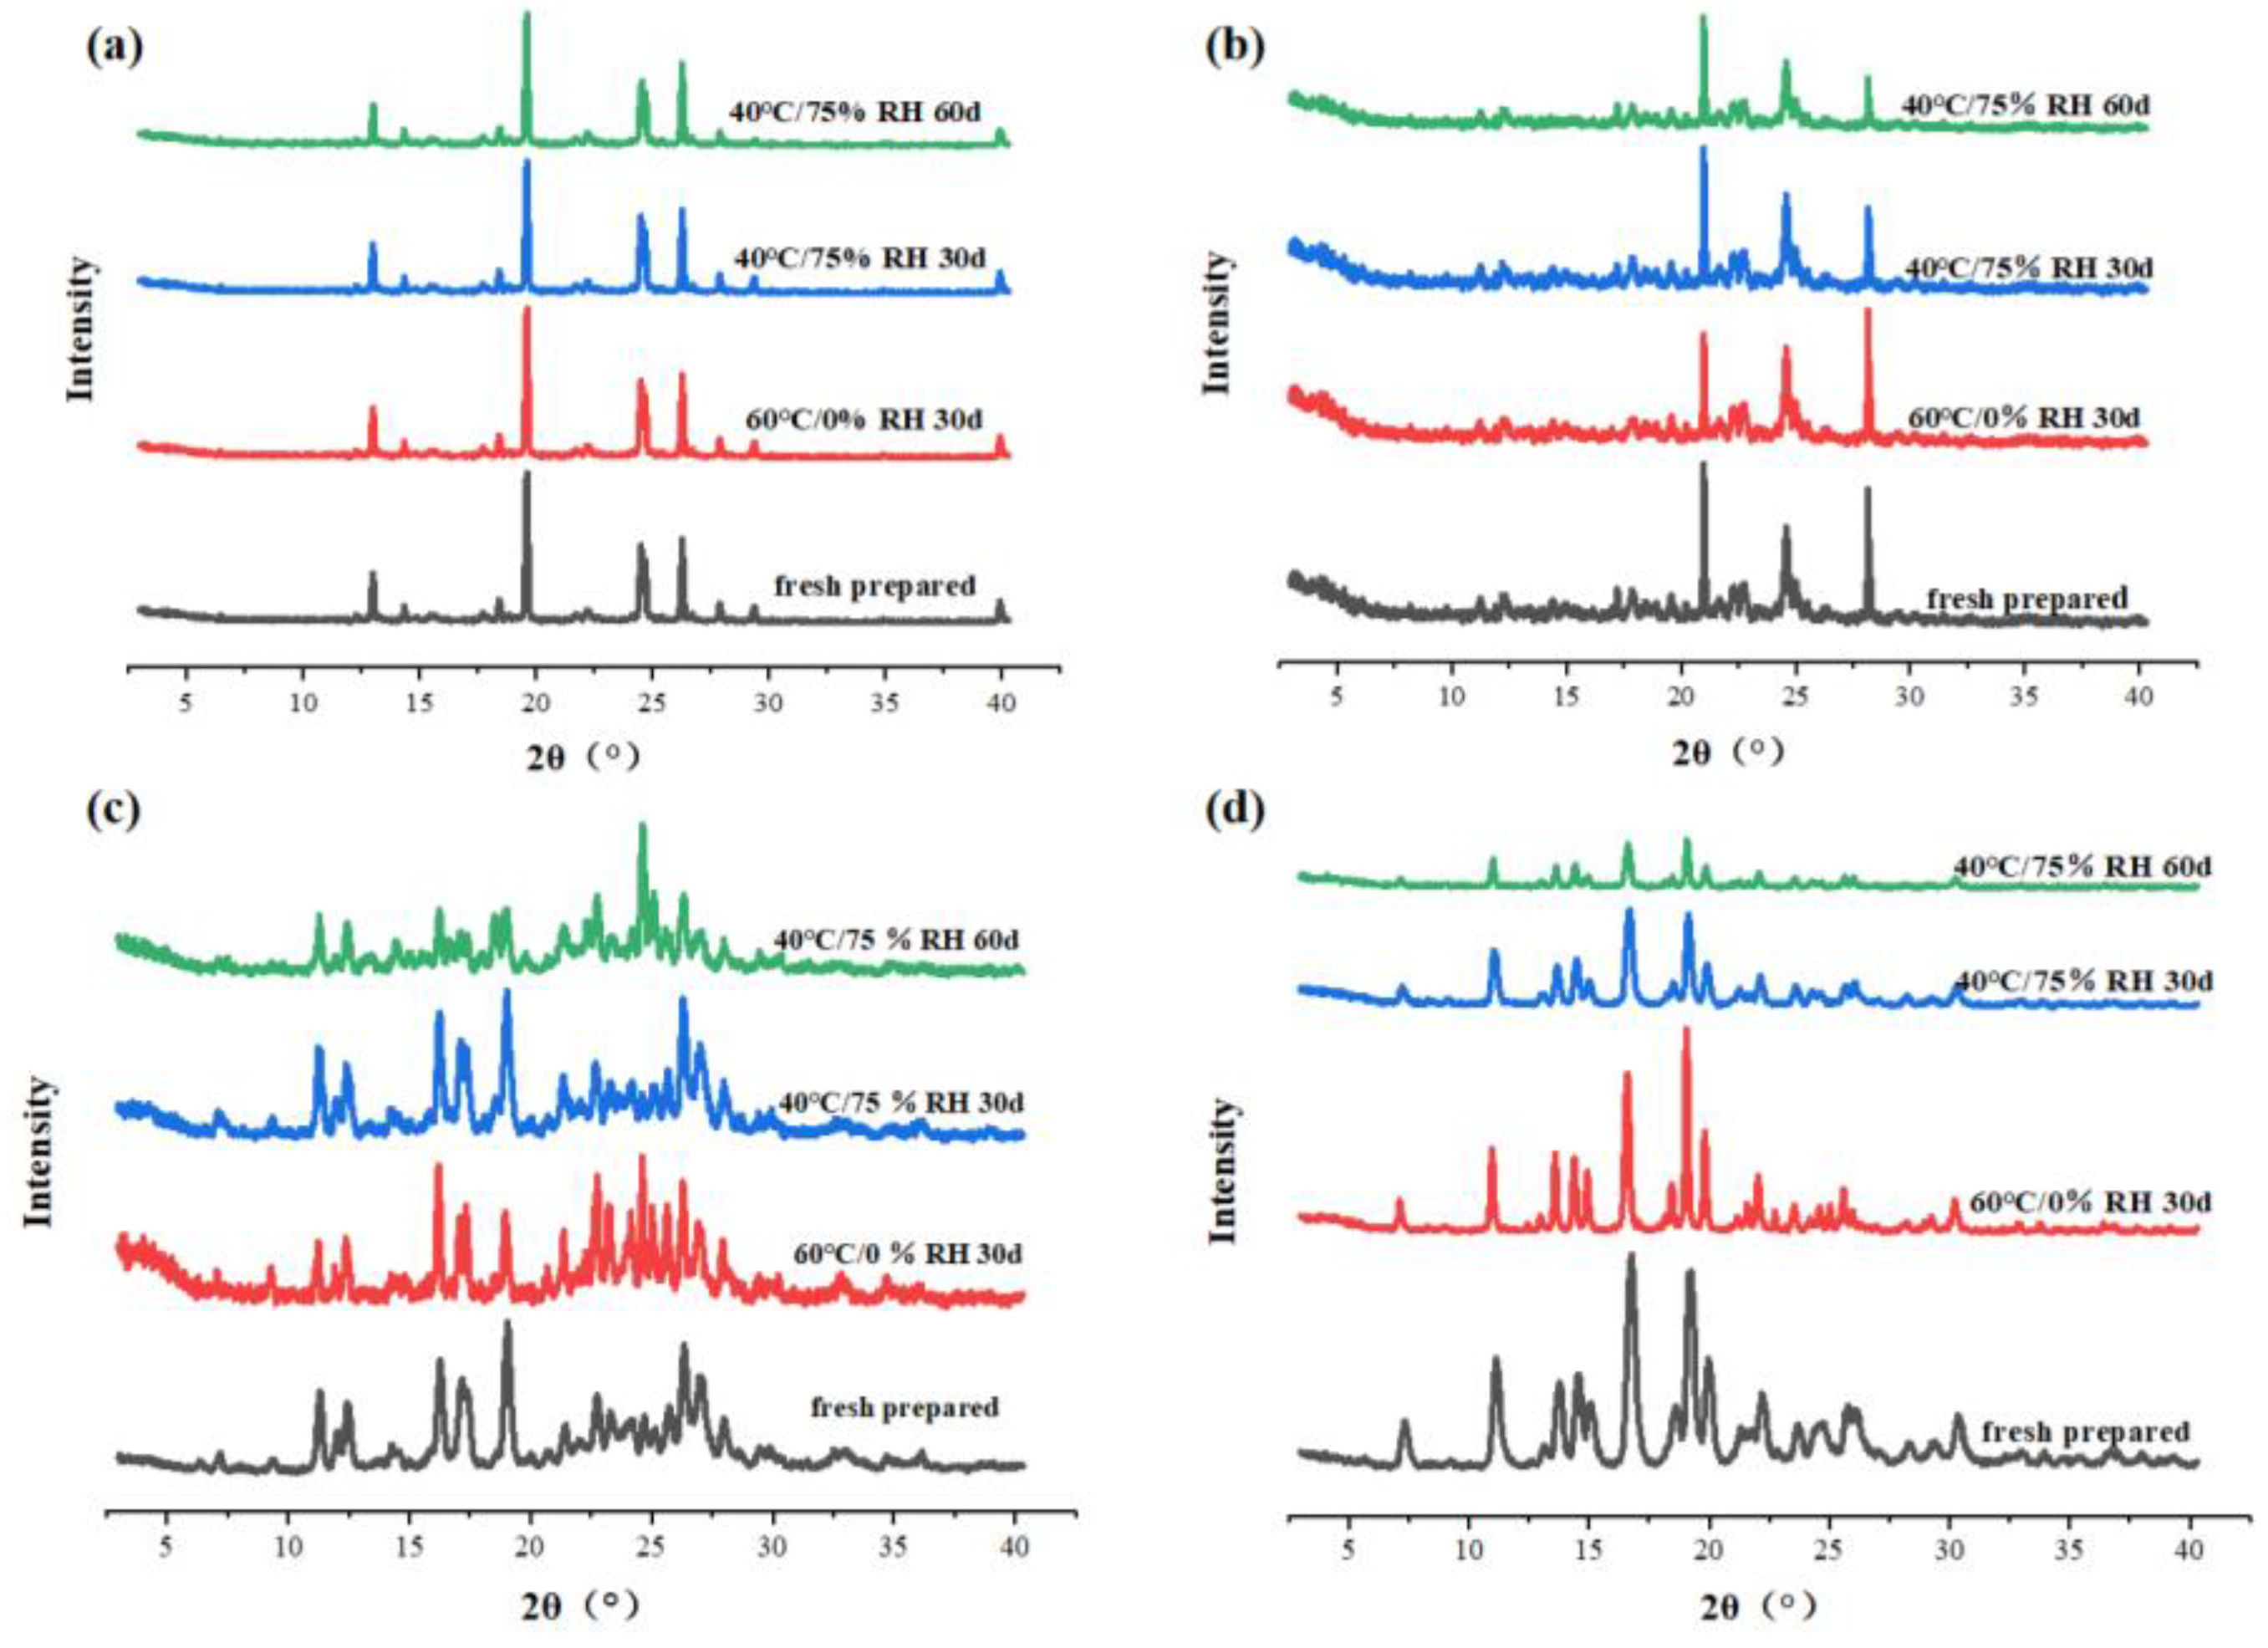
The physical stability of drugs is important for the development and formulations of pharmaceuticals. The physical stability of the SF polymorphs and co-crystals was evaluated at two conditions, which were accelerated stability condition (40 °C/75% RH) for 30 and 60 days and high-temperature stability condition (60 °C/0% RH) for 30 days. The results of the stability test were shown in Figure 23 (a-d), form C, form D, SF-OA and SF-MA are able to remain stable without transcrystallization, indicating good physical stability under these conditions. Hence, good stability provided possibilities for further research.

3.6. Relative Stability between Polymorphs.

The transformation of polymorphs is a physical process of phase change and equilibrium [66,67]. From the relationship between the melting points of the two polymorphs and Tt (the intersection of two crystalline free energy curves), the stability relationship between the two polymorphs could be deduced. The relative stabilities among the polymorphs were deduced with the help of the thermal data in Table 5.
The enthalpy changes for the conversion of form I to form II ( Δ H I II ) was expressed as:
Δ H I II = T T m I C p I d T + Δ H m , I + T m , I T m , II C p L d T + 0 Δ H m , II T T m II C p II d T = Δ H m , I Δ H m , II T T m I C p d T T m , I T m , II C p II C p L d T
Where T is the absolute temperature; Cp is the heat capacity.
Entropy changes in the conversion of form I to form II( Δ S I II ) was expressed as:
Δ S I II = T T m I C p I T d T + Δ S m , I + T m , I T m , II C p L T d T + 0 Δ S m , II T T m II C p II T d T = Δ H m , I T m I Δ H m , II T m , II T T m I C p d T T m , I T m , II C p II C p L T d T
If ignore the heat capacity difference between form I, form II, and the liquid, Eq. (1) and Eq. (2) can be expressed as:
                                                                                                                                  Δ H I II Δ H m , I Δ H m , II    
                                                                                                                                  Δ S I II Δ H m , I T m I Δ H m , II T m , II      
The relationship between Gibbs energy and conversion of form I and form II was given as Eq. (5). By introducing Eq. (3) and (4) into Eq. (5), Eq. (6) was obtained.
                                  Δ G I II = Δ H I II T Δ S I II                  
                        Δ G I II = Δ H m , I Δ H m , II T Δ H m , I T m I Δ H m , II T m , II                  
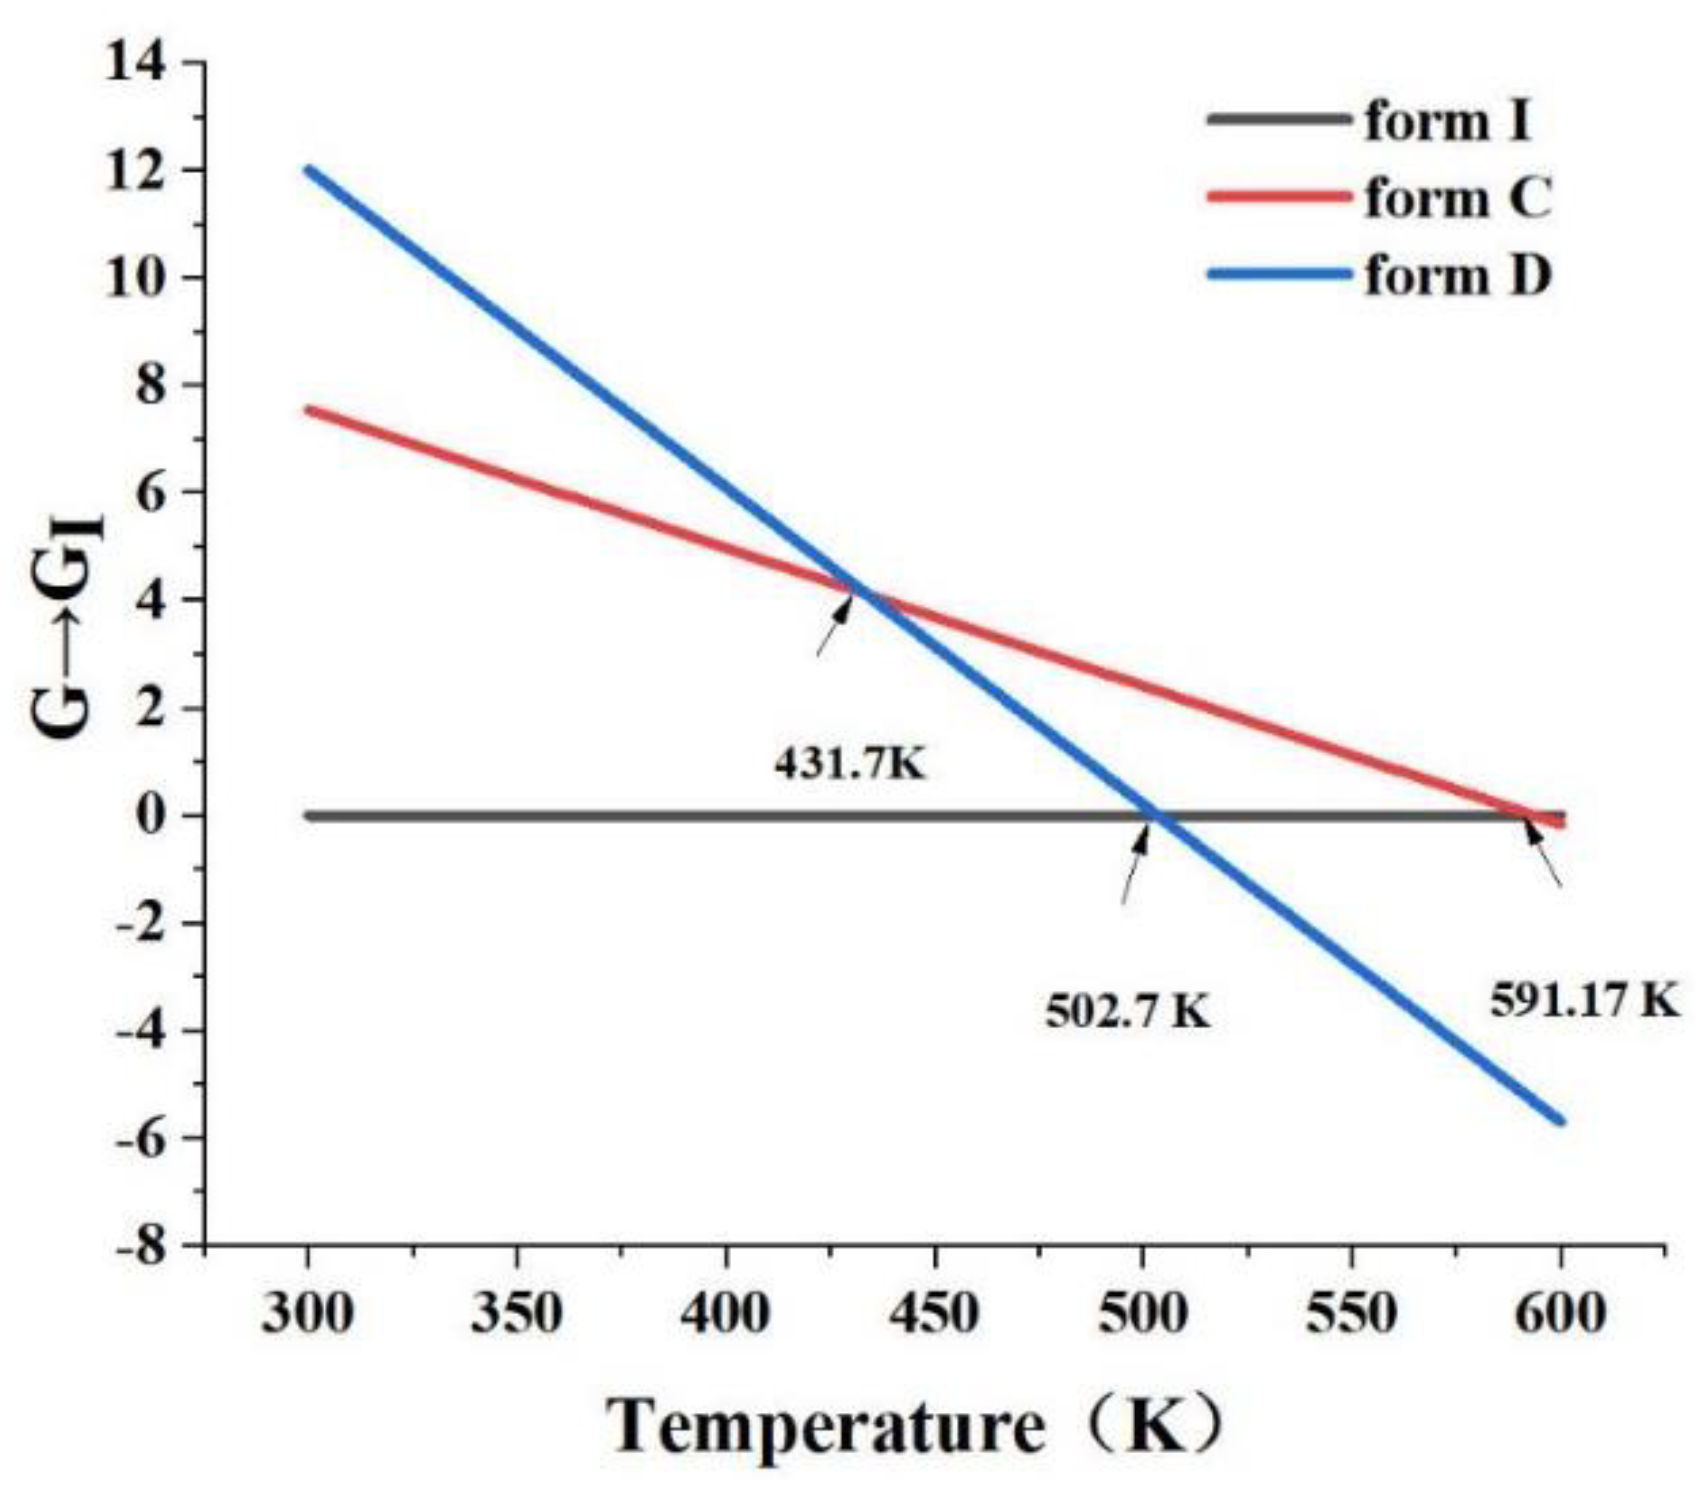
The relative free energy diagram of form C, form D and form I was plotted using Eqs. (1- 6), as shown in Figure 24. From the figure, the three intersections were 431.7 K, 502.7 K, and 591.17 K, which were the intersections of form C and form D, form D and form I, and form C and form I, respectively. It could be observed that the Tt of form I and form C (470.39 K) was 591.17 K, which was above the melting point of form I and form C, implying that they were monotropic transformation relations. Similarly, the Tt (502.7 K) of form I and form D (478.77 K) was also higher than the melting point. Therefore, both form C and form D were monomorphic relationships with form I. However, form C and form D had an intersection point at 431.7 K. Thus, when the temperature below 431.7 K, the free energy order was form D > form C > form I. In a word, form D was the most unstable and form I was the most stable at room temperature (about 310 K).

4. Conclusion

In this paper, we have successfully developed two polymorphs (form C and form D) and two co-crystals (SF-OA and SF-MA) of SF. The crystal parameters and thermodynamic properties of these samples were characterized by PXRD, DSC, TGA and FT-IR. Additionally, the single crystals of form C and SF-OA were cultivated by solution method and characterized by SCXRD. The crystal structure and arrangement were thoroughly analyzed using software such as Olex2, SHELXL and Diamond 4.0. Furthermore, the solubility and dissolution experiments revealed that the polymorphs and co-crystals have improved the solubility properties of SF. The solubility of form C and form D were 1.59, 1.49 times at pH 1.2 HCl and 1.59, 1.87 times at pH 6.8 PBS that of form I, respectively. In particular, the maximum solubility values of SF-OA and SF-MA were 4.0, 4.5 times at pH 1.2 HCl and 8.1, 6.3 times at pH 6.8 PBS higher than that of the SF form I. All the new solid-state forms possessed a good stability in the conditions of 40 °C/75% RH and 60 °C/0% RH.
During the exploration of SF polymorphs, we discovered that SF is more responsive to mixed solvents than to a single solvent. By analyzing the single crystal data of Form C, we found that the difference in the molecular arrangement between form C and form I was due to π-π conjugation. Thus, it was confirmed that different molecular arrangements could lead to new crystal forms, and these variations in molecular structure could cause changes in physicochemical properties. Notably, the co-crystals (SF-OA) occurred as a result of the twisting of SF molecules of amide and urea to establish hydrogen bonds with the carboxyl group by single crystal structure analysis, which could be deduced that SF has a higher potential for development of new solid-state forms. Further, the formation of SF-OA, SF-MA verifies the applicability of the ∆pKa rule in co-crystals formation. It was concluded that the study of polymorph and co-crystal forms offers the potential for enhancing the bioavailability of SF in clinical settings and expanding our understanding of SF crystallography.

Supplementary Materials

The following supporting information can be downloaded at the website of this paper posted on Preprints.org.

Author Contributions

Conceptualization, S.S. and Z.W.; Methodology, S.S.; Software, Z.W.; Validation, S.S. and Z.W. ; Formal Analysis, X.L.; Investigation, Y.D., J.P. and D.W.; Writing – Original Draft Preparation, Z.W. and S.S.; Writing – Review & Editing, X.S.; Supervision, X.S.

Funding

This project was supported by National Key R&D Program of China (2021YFC2101000), Zhejiang Provincial Key R&D Project (2020C03006), Research and Application Service Platform Project of API Manufacturing Environmental Protection and Safety Technology in China (2020-0107-3-1) and Zhejiang Province Science and Technology Plan Project (2019C04023).

Institutional Review Board Statement

Not applicable.

Informed Consent Statement

Not applicable.

Conflicts of Interest

The authors declare no conflict of interest.

References

  1. KUMARI L, CHOUDHARI Y, PATEL P, et al. Advancement in Solubilization Approaches: A Step towards Bioavailability Enhancement of Poorly Soluble Drugs. Life. 2023, 13(5): 1099; [CrossRef]
  2. OFTSSON T, BREWSTER M E. Pharmaceutical applications of cyclodextrins: basic science and product development. Journal of Pharmacy and Pharmacology. 2010, 62(11): 1607-21; [CrossRef]
  3. Cruz-Cabeza AJ. Acid–base crystalline complexes and the pKa rule. CrystEngComm, 2012, 14(20):6362-5; [CrossRef]
  4. Gong W, Mondal PK, Ahmadi S, Wu Y, Rohani S. Cocrystals, Salts, and Salt-Solvates of olanzapine; selection of coformers and improved solubility. Int J Pharm. 2021, 608:121063-72. [CrossRef]
  5. Domingos S, Andre V, Quaresma S, Martins IC, Minas da Piedade MF, Duarte MT. New forms of old drugs: improving without changing. J Pharm Pharmacol. 2015, 67(6):830-46. [CrossRef]
  6. JAMBHEKAR S S, BREEN P J. Drug dissolution: significance of physicochemical properties and physiological conditions. Drug Discovery Today. 2013, 18(23): 1173-84. [CrossRef]
  7. Butreddy A, Almutairi M, Komanduri N, Bandari S, Zhang F, Repka MA. Multicomponent crystalline solid forms of aripiprazole produced via hot melt extrusion techniques: An exploratory study. J Drug Deliv Sci Technol. 2021, 63:102529-39. [CrossRef]
  8. Moisescu-Goia C, Muresan-Pop M, Simon V. New solid state forms of antineoplastic 5-fluorouracil with anthelmintic piperazine. Journal of Molecular Structure. 2017;1150:37-43. [CrossRef]
  9. Bueno MS, Minambres GG, Bongioanni A et al. Exploring solid forms of oxytetracycline hydrochloride. Int J Pharm. 2020, 585:119496-504. [CrossRef]
  10. MANIRUZZAMAN M, LAM M, MOLINA C, et al. RETRACTED ARTICLE: Study of the Transformations of Micro/Nano-crystalline Acetaminophen Polymorphs in Drug-Polymer Binary Mixtures. AAPS PharmSciTech. 2017, 18(5): 1428-37. [CrossRef]
  11. Drozd K V, Manin A N, Boycov D E, et al. Simultaneous Improvement of Dissolution Behavior and Oral Bioavailability of Antifungal Miconazole via Cocrystal and Salt Formation. Pharmaceutics, 2022, 14(5): 1107. [CrossRef]
  12. Zhu Y J, Zheng B, Wang H Y, et al. New knowledge of the mechanisms of sorafenib resistance in liver cancer. Acta Pharmacologica Sinica, 2017, 38(5): 614-622. [CrossRef]
  13. Cao M, Xu Y, Youn JI, Cabrera R, Zhang X, Gabrilovich D et al. Kinase inhibitor Sorafenib modulates immunosuppressive cell populations in a murine liver cancer model. Lab Invest. 2011, 91(4):598-608. [CrossRef]
  14. IYER R, FETTERLY G, LUGADE A, et al. Sorafenib: a clinical and pharmacologic review. Expert Opinion on Pharmacotherapy. 2010, 11(11): 1943-55. [CrossRef]
  15. Takimoto CH, Awada A. Safety and anti-tumor activity of sorafenib (Nexavar) in combination with other anti-cancer agents: a review of clinical trials. Cancer Chemother Pharmacol. 2008, 61(4):535-48. [CrossRef]
  16. Takeuchi A, Eto M, Tatsugami K, et al. Mechanism of synergistic antitumor effect of sorafenib and interferon-α on treatment of renal cell carcinoma. The Journal of urology. 2010, 184(6): 2549-2556. [CrossRef]
  17. Liu L, Cao Y, Chen C, Zhang X, McNabola A, Wilkie D et al. Sorafenib blocks the RAF/MEK/ERK pathway, inhibits tumor angiogenesis, and induces tumor cell apoptosis in hepatocellular carcinoma model PLC/PRF/5. Cancer Res. 2006, 66(24):11851-8. [CrossRef]
  18. Kong FH, Ye QF, Miao XY, Liu X, Huang SQ, Xiong L et al. Current status of sorafenib nanoparticle delivery systems in the treatment of hepatocellular carcinoma. Theranostics. 2021, 11(11):5464-90. [CrossRef]
  19. Mendez-Blanco C, Fondevila F, Garcia-Palomo A, Gonzalez-Gallego J, Mauriz JL. Sorafenib resistance in hepatocarcinoma: role of hypoxia-inducible factors. Exp Mol Med. 2018, 50(10):1-9. [CrossRef]
  20. Kim A, Balis FM, Widemann BC. Sorafenib and sunitinib. Oncologist. 2009, 14(8):800-5. [CrossRef]
  21. Wiergowska G, Stasilowicz A, Miklaszewski A, Lewandowska K, Cielecka-Piontek J. Structural Polymorphism of Sorafenib Tosylate as a Key Factor in Its Solubility Differentiation. Pharmaceutics. 2021, 13(3):384-93. [CrossRef]
  22. Zhang Z, Niu B, Chen J, He X, Bao X, Zhu J et al. The use of lipid-coated nanodiamond to improve bioavailability and efficacy of sorafenib in resisting metastasis of gastric cancer. Biomaterials. 2014, 35(15):4565-72. [CrossRef]
  23. Shi Y, Zhao Z, Gao Y, Pan DC et al. Oral delivery of sorafenib through spontaneous formation of ionic liquid nanocomplexes. Jounaral of Control Release. 2020, 322:602-9. [CrossRef]
  24. Wiergowska G, Stasilowicz A, Miklaszewski A, Lewandowska K, Cielecka-Piontek J. Structural Polymorphism of Sorafenib Tosylate as a Key Factor in Its Solubility Differentiation. Pharmaceutics. 2021, 13(3):384-93. [CrossRef]
  25. Martins Santos OM, Jacon Freitas JT, Bitencourt M, Martins FT, Doriguetto AC. Three new orbifloxacin multicomponent crystal forms towards pharmaceutical improvement. Journal of MolecularS tructure. 2020, 1217:128371-8. [CrossRef]
  26. Savjani KT, Gajjar AK, Savjani JK. Drug solubility: importance and enhancement techniques. ISRN Pharm. 2012, 2012:195727-85736. [CrossRef]
  27. Wang XQ, Fan JM, Liu YO, Zhao B, Jia ZR, Zhang Q. Bioavailability and pharmacokinetics of sorafenib suspension, nanoparticles and nanomatrix for oral administration to rat. Int J Pharm. 2011, 419(1-2):339-46. [CrossRef]
  28. EBADI M, BUSKARAN K, BULLO S, et al. Drug delivery system based on magnetic iron oxide nanoparticles coated with (polyvinyl alcohol-zinc/aluminium-layered double hydroxide-sorafenib). Alexandria Engineering Journal, 2021, 60(1): 733-47. [CrossRef]
  29. GAO W, JIA X, WU J, et al. Preparation and evaluation of folate-decorated human serum albumin nanoparticles for the targeted delivery of sorafenib to enhance antihepatocarcinoma efficacy. Journal of Drug Delivery Science and Technology, 2019, 54: 101349. [CrossRef]
  30. Sun W, Wang Y, Cai M, Lin L, Chen X, Cao Z et al. Codelivery of sorafenib and GPC3 siRNA with PEI-modified liposomes for hepatoma therapy. Biomater Sci. 2017, 5(12):2468-79. [CrossRef]
  31. Xiao Y, Liu Y, Yang S, et al. Sorafenib and gadolinium co-loaded liposomes for drug delivery and MRI-guided HCC treatment. Colloids and Surfaces B: Biointerfaces, 2016, 141: 83-92. [CrossRef]
  32. Yang P, Qin C, Du S, Jia L, Qin Y, Gong J et al. Crystal Structure, Stability and Desolvation of the Solvates of Sorafenib Tosylate. Crystals. 2019;9(7):367-80. [CrossRef]
  33. Li C, Zhong J, Liu B, Yang T, Lv B, Luo Y. Study on Typical Diarylurea Drugs or Derivatives in Cocrystallizing with Strong H-Bond Acceptor DMSO. ACS Omega. 2021, 6(8):5532-47. [CrossRef]
  34. Phan C, Shen J, Yu K, Liu J, Tang G. Hydrogen Bonds, Topologies, Energy Frameworks and Solubilities of Five Sorafenib Salts. Int J Mol Sci. 2021, 22(13):6682-93. [CrossRef]
  35. Liu C, Wang C, Wan S, Liu L, Sun C, Qian F. An Elusive Drug–Drug Cocrystal Prepared Using a Heteroseeding Strategy. Crystal Growth & Design., 2021, 21(10): 5659-68. [CrossRef]
  36. CHEN Y, ZHU W, LIANG J. New-type sorafenib tosylate polymorphic form has differential scanning calorimetry pattern in high transition temperature and specified melting decomposition peak, CN102850267-A [P/OL]. <Go to ISI>://DIIDW:2013F00136.
  37. WANG B, LIN D, ZHANG J. Crystalline form of sorafenib for drug used for treating cancer, has specific characteristic peaks at preset Bragg angle measured by X-ray powder diffraction,CN103664771-A;CN103664771-B[P/OL]. <Go to ISI>://DIIDW:2014J37488.
  38. HUANG X, ZHU S, WANG J, et al. New sorafenib crystalline form B shows specific characteristic absorption peaks in X-ray powder diffraction pattern, CN109422676-A [P/OL]. <Go to ISI>://DIIDW:201923360A.
  39. SHAO Q, WEI W, XIA Y, et al. New Sorafenib free base crystal form, prepared by adding sorafenib free base into alcohol, heating to dissolve, and filtering while hot, adding the filtrate dropwise into water, stirring, filtering, and drying, CN113773249-A [P/OL]. <Go to ISI>://DIIDW:2021E96191.
  40. Lemmerer A, Govindraju S, Johnston M, Motloung X, Savig KL. Co-crystals and molecular salts of carboxylic acid/pyridine complexes: can calculated pKa's predict proton transfer? A case study of nine complexes. CrystEngComm. 2015,17(19):3591-5. [CrossRef]
  41. Douroumis D, Ross SA, Nokhodchi A. Advanced methodologies for cocrystal synthesis. Adv Drug Deliv Rev. 2017,117:178-95. [CrossRef]
  42. Dolomanov, O.V., Bourhis, L.J., Gildea, R.J, Howard, J.A.K. & Puschmann, H. J. Appl. Cryst. 2009, 42, 339-341.
  43. G. M. Sheldrick, Acta Crystallogr., Sect. C: Struct. Chem. 2015, 71, 3–8.
  44. G. M. Sheldrick, Acta Crystallogr., Sect. A: Found. Adv. 2015, 71, 3–8.
  45. C. B. Hübschle, G. M. Sheldrick and B. Dittrich, J. Appl. Crystallogr., 2011, 44, 1281–1284.
  46. W. T. Pennington, J. Appl. Crystallogr., 1999, 32, 1028–1029.
  47. CHIKHALIKAR S, GHAGARE M, KANKAN R N, et al. New sorafenib in amorphous form useful in pharmaceutical composition and medicine for treating cancer, WO2009106825-A1; IN200800402-I3 [P/OL]. <Go to ISI>://DIIDW:2009N22664.
  48. Shimpi MR, Alhayali A, Cavanagh KL, Rodríguez-Hornedo N, Velaga SP. Tadalafil–Malonic Acid Cocrystal: Physicochemical Characterization, pH-Solubility, and Supersaturation Studies. Crystal Growth & Design. 2018, 18(8):4378-87. [CrossRef]
  49. GUO M, SUN X, CHEN J, et al. Pharmaceutical cocrystals: A review of preparations, physicochemical properties and applications. Acta Pharm Sin B. 2021, 11(8):2537-2564. [CrossRef]
  50. MA Q, HE H, LIU C. Hygroscopic properties of oxalic acid and atmospherically relevant oxalates. Atmospheric Environment,2013,69:281-8. [CrossRef]
  51. Shevchenko A, Bimbo L M, Miroshnyk I, et al. A new cocrystal and salts of itraconazole: Comparison of solid-state properties, stability and dissolution behavior. International Journal of Pharmaceutics. 2012, 436(1-2): 403-409. [CrossRef]
  52. Perlovich G. Melting points of one-and two-component molecular crystals as effective characteristics for rational design of pharmaceutical systems. Acta Crystallographica Section B: Structural Science, Crystal Engineering and Materials. 2020, 76(4): 696-706. [CrossRef]
  53. Al-Obaidi H, Lawrence M J, Al-Saden N, et al. Investigation of griseofulvin and hydroxypropylmethyl cellulose acetate succinate miscibility in ball milled solid dispersions. International journal of pharmaceutics. 2013, 443(1-2): 95-102. [CrossRef]
  54. Caires F J, Lima L S, Carvalho C T, et al. Thermal behaviour of malonic acid, sodium malonate and its compounds with some bivalent transition metal ions. Thermochimica acta. 2010, 497(1-2): 35-40. [CrossRef]
  55. Okur N Ü, Siafaka P I, Gökçe E H. Challenges in oral drug delivery and applications of lipid nanoparticles as potent oral drug carriers for managing cardiovascular risk factors. Current Pharmaceutical Biotechnology. 2021, 22(7): 892-905. [CrossRef]
  56. Lee T, Wang P Y. Screening, manufacturing, photoluminescence, and molecular recognition of co-crystals: cytosine with dicarboxylic acids. Crystal growth & design. 2010, 10(3): 1419-1434. [CrossRef]
  57. YAMAMOTO K, IKEDA Y. Kinetic solubility and lipophilicity evaluation connecting formulation technology strategy perspective. Journal of Drug Delivery Science and Technology. 2016, 33: 13-8. [CrossRef]
  58. SAAL C, PETEREIT A C. Optimizing solubility: Kinetic versus thermodynamic solubility temptations and risks. European Journal of Pharmaceutical Sciences. 2012, 47(3): 589-95. [CrossRef]
  59. Berry DJ, Steed JW. Pharmaceutical cocrystals, salts and multicomponent systems; intermolecular interactions and property based design. Adv Drug Deliv Rev. 2017, 117:3-24. [CrossRef]
  60. Babu NJ, Nangia A. Solubility Advantage of Amorphous Drugs and Pharmaceutical Cocrystals. Crystal Growth & Design. 2011, 11(7):2662-79. [CrossRef]
  61. REGGANE M, WIEST J, SAEDTLER M, et al. Bioinspired co-crystals of Imatinib providing enhanced kinetic solubility. European Journal of Pharmaceutics and Biopharmaceutics. 2018, 128: 290-9. [CrossRef]
  62. Gugoasa A L, Staden S R. Advanced Methods for the Analysis of Testosterone, Current Medicinal Chemistry. 2018, 25(33). [CrossRef]
  63. WILSON V, LOU X, OSTERLING D J, et al. Relationship between amorphous solid dispersion in vivo absorption and in vitro dissolution: phase behavior during dissolution, speciation, and membrane mass transport. Journal of Controlled Release. 2018, 292: 172-82. [CrossRef]
  64. Yan Y, Chen J-M, Lu T-B. Simultaneously enhancing the solubility and permeability of acyclovir by crystal engineering approach. CrystEngComm. 2013,15(33). [CrossRef]
  65. SETO Y, SATO H, MASUDA Y. Effect of water vapor pressure on thermal dehydration of lithium sulfate monohydrate. Thermochimica Acta. 2002, 388(1): 21-5. [CrossRef]
  66. SHI X, DENG Y, WANG Z, et al. Two new nilotinib polymorphs with solubility advantages prepared by the melt crystallization process. Journal of Drug Delivery Science and Technology. 2023, 84: 104511. [CrossRef]
  67. Braga D, Casali L, Grepioni F. The Relevance of Crystal Forms in the Pharmaceutical Field: Sword of Damocles or Innovation Tools?. International Journal of Molecular Sciences, 2022, 23(16): 9013. [CrossRef]
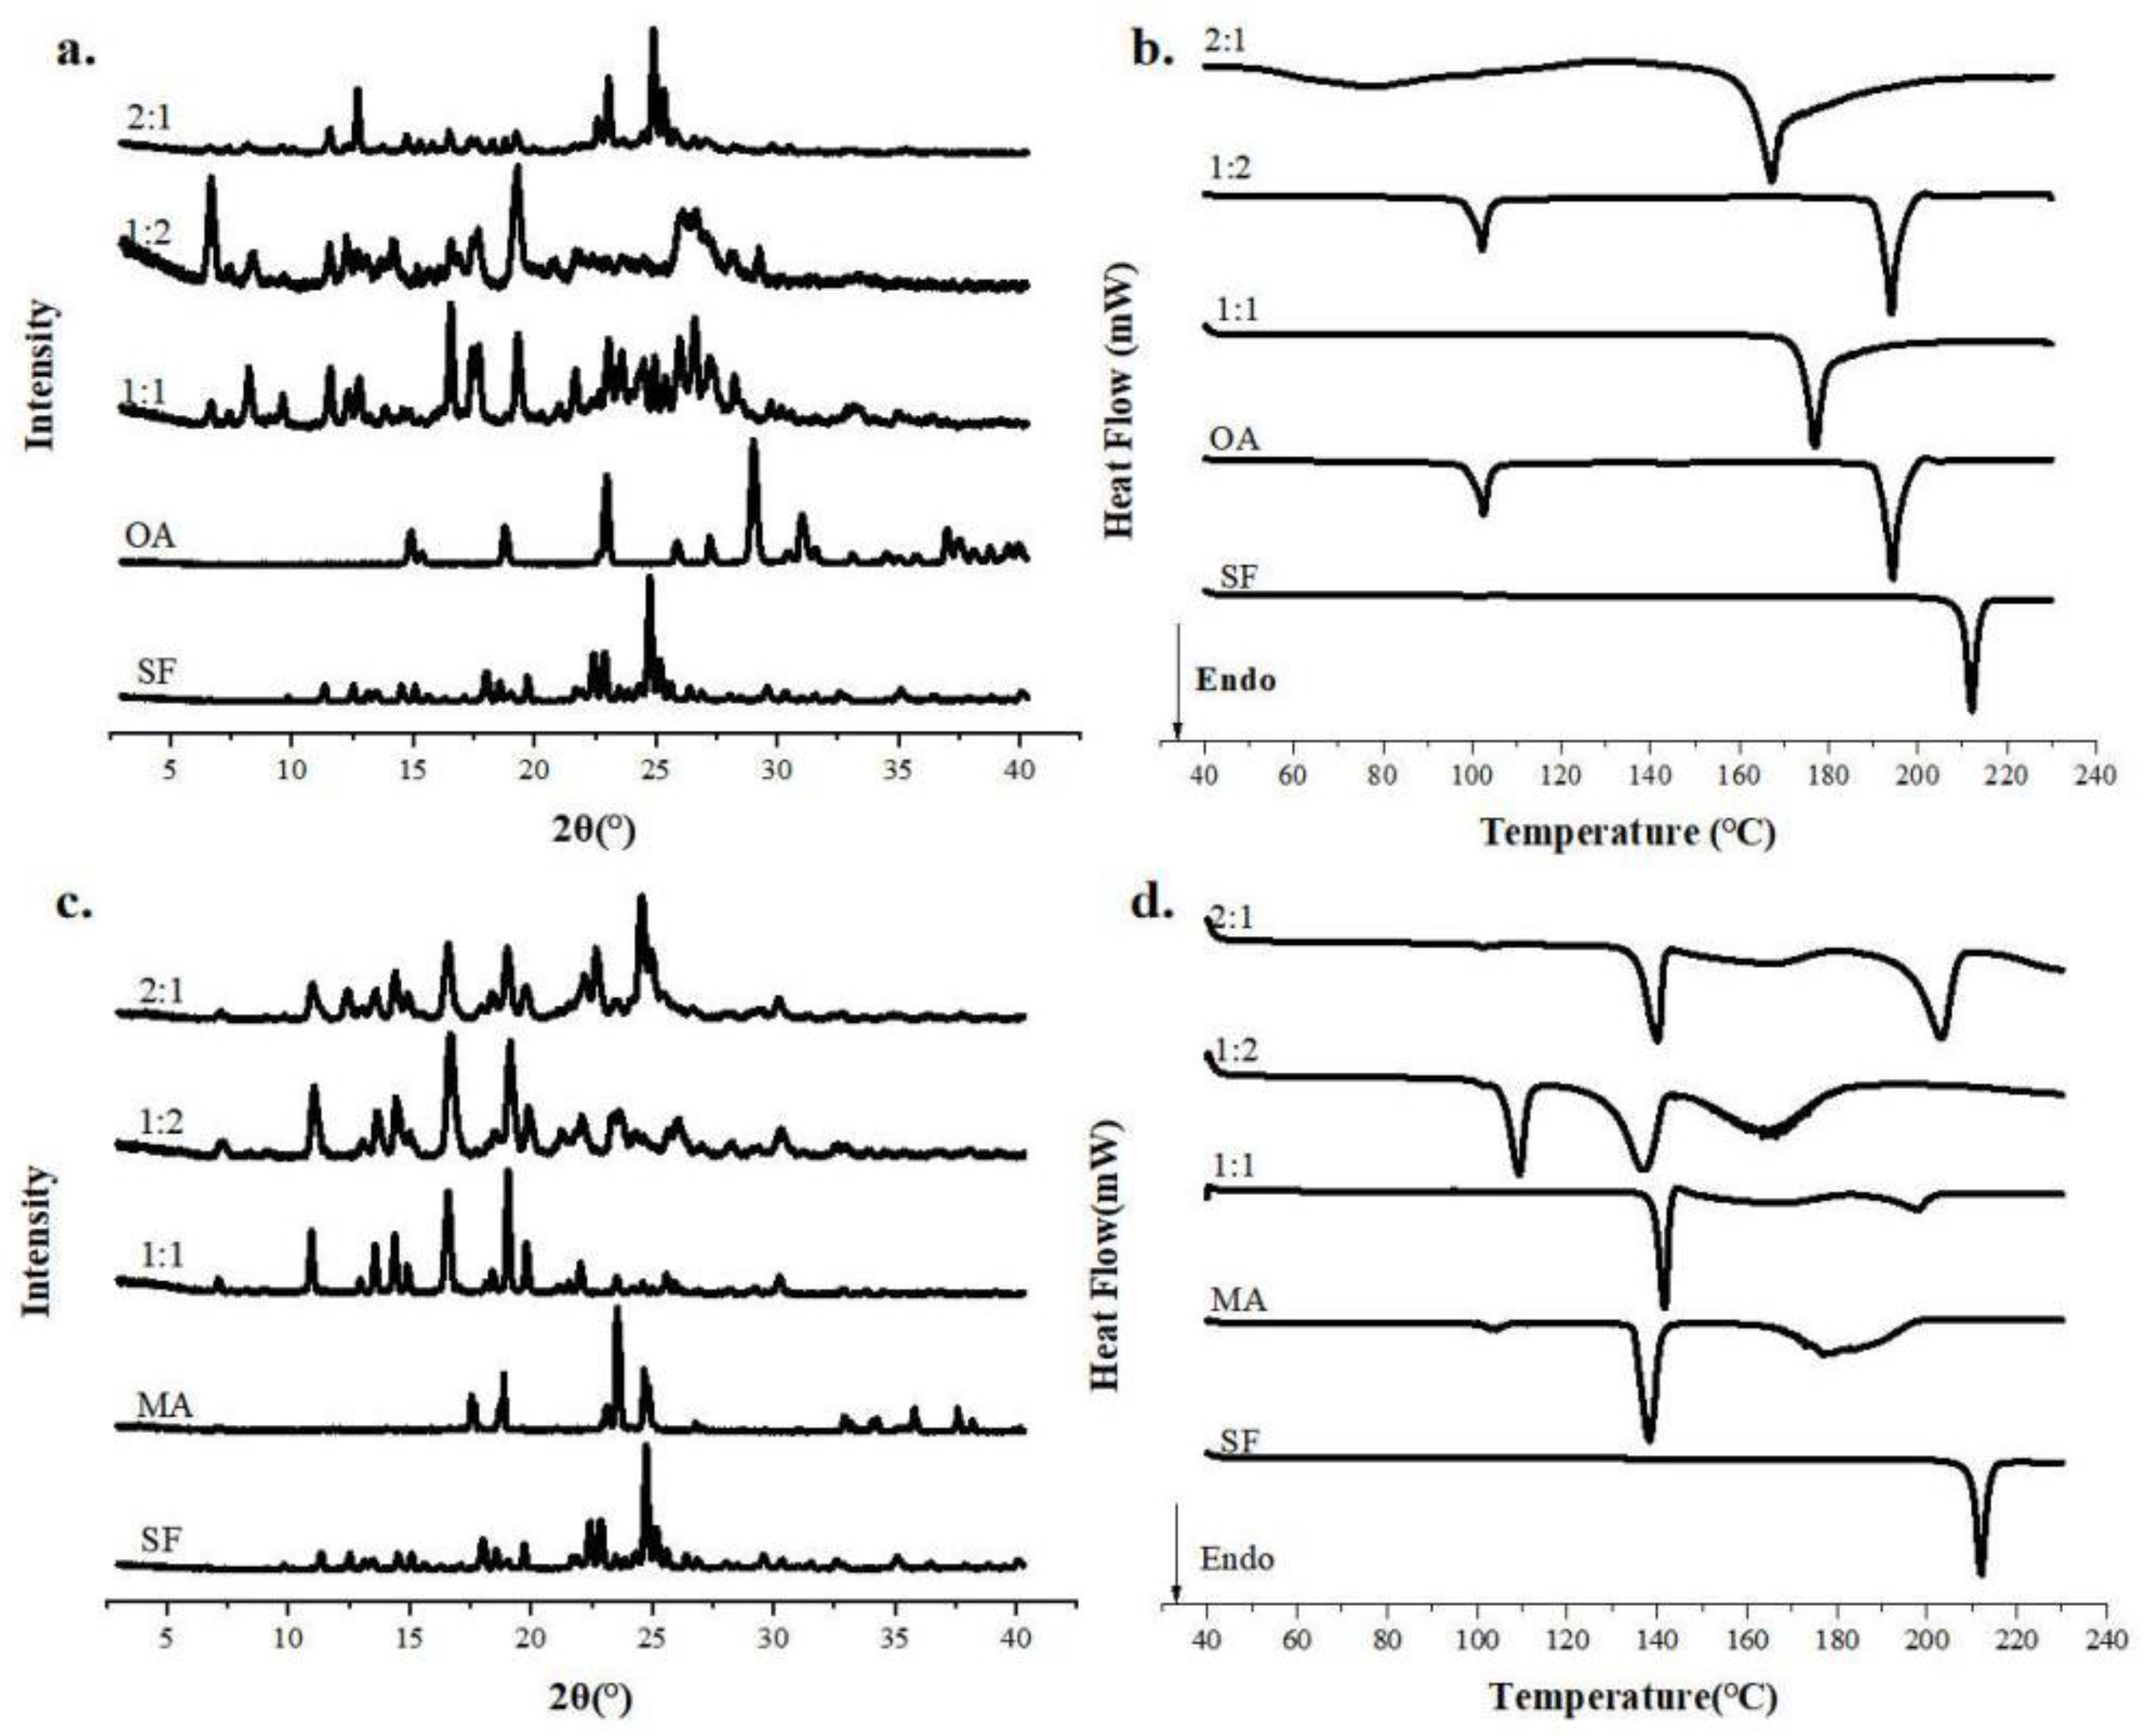
Figure 2. PXRD patterns and DSC curves of SF and CCFs in different stoichiometry.
Preprints 90558 g002
Figure 3. The PXRD patterns of Amorphous, form I, form A, form X, form C and form D.
Preprints 90558 g003
Figure 4. The PXRD patterns of form I, OA, MA, SF-OA PM, SF-MA PM, SF-OA and SF-MA.
Preprints 90558 g004
Figure 5. The unit cell of (a) form I, (b)form C, (c)SF-OA.
Preprints 90558 g005
Figure 6. Molecule stacking diagrams in different orientations of form I.
Preprints 90558 g006
Figure 7. Molecule stacking diagrams in different orientations of form C.
Preprints 90558 g007
Figure 8. (a) Schematic diagram of hydrogen bonding connection and (b-c) molecule stacking diagrams in different orientations of form I.
Preprints 90558 g008
Figure 9. The DSC patterns of form I, form A, form X, form C and form D.
Preprints 90558 g009
Figure 10. The DSC patterns of form I, OA, MA, SF-OA and SF-MA.
Preprints 90558 g010
Figure 11. The TGA curves of a. form I, b. form C, c. form D.
Preprints 90558 g011
Figure 12. The TGA curves of a.OA, b.MA, c.SF-OA, d.SF-MA.
Preprints 90558 g012
Figure 13. The photos of solid-state forms of SF under polarize light microscopy: a.form I, b.form A, c.form X, d.form C, e.form D, f.SF-OA and g.SF-MA.
Preprints 90558 g013
Figure 14. The changes of SF-OA under hot-stage polarizing microscopy.
Preprints 90558 g014
Figure 15. The changes of SF-MA under hot-stage polarizing microscopy.
Preprints 90558 g015
Figure 16. The FT-IR spectra of form I, form C and form D.
Preprints 90558 g016
Figure 17. The FT-IR spectra of (a)SF-OA and (b)SF-MA.
Preprints 90558 g017
Figure 18. (a) The diagram of the mode of action of SF-OA containing hydrogen bonds. (b)The speculative mode of action of SF-MA.
Preprints 90558 g018
Figure 19. Histograms for the solubility of form I, form C and form D in pH 1.2 and 6.8 media. (n =3).
Preprints 90558 g019
Figure 20. The cumulative drug release of form I, form C and form D at (a) pH 1.2 HCl, (b) pH 6.8 PBS containing 0.2% SDS.
Preprints 90558 g020
Figure 21. Solubility of SF-OA and SF-MA in (a) pH 1.2 HCl and (b) pH = 6.8 PBS containing 0.2%SDS.
Preprints 90558 g021
Figure 22. PXRD patterns of (A) SF-OA and (B) SF-MA before and after experiments in (a) pH 1.2 HCl and (b) pH = 6.8 PBS containing 0.2%SDS.
Preprints 90558 g022
Figure 23. PXRD patterns of SF polymorphs and co-crystals during storage at 40 °C/75% RH for 60 days and 60 °C/0% RH for 30 days, (a) form C, (b) form D, (c) SF-OA, (d) SF-MA.
Preprints 90558 g023
Figure 24. The relative free energy diagram of form C, form D and form I.
Preprints 90558 g024
Table 1. The results of solid-state form screening.
forms Materials Methods Solvents
form C form I Evaporation Methanol/H2O (6:1, v:v)
form D form I Evaporation Acetic Acid
SF-OA form I / Oxalic Acid Slurry Dichloromethane
SF-MA form I / Malonic Acid Slurry Dichloromethane
form A form I Cooling Dichloromethane/Methanol (6:1, v:v)
form X form I Antisolvent Methanol/ H2O (1:4, v:v)
Amorphous form I Melting -
“-”:There is no solvents.
Table 2. The characteristic diffraction peaks of SF polymorphs.
Polymorphs Angular positions of characteristic diffraction peaks (2θ)
form C 6.44°,13.01°,14.34°,18.43°,19.60°,24.57°,26.27°,27.90°.
form D 11.24°,17.22°,20.99°,24.99°,28.17°.
SF-OA 7.22°, 9.41°, 11.32°, 12.05°, 16.28°, 17.22°, 18.98°, 20.73°, 22.72°, 24.12°, 26.33°
SF-MA 7.26°, 8.40°, 9.22°, 11.11°, 15.04°, 16.71°, 19.19°, 22.17°, 23.68°.
form I 7.02°,11.23°,12.39°,14.01 ° ,14.43°,14.93°,17.86°,18.41°,18.82°,19.71°,21.66°,21.80°,22.27°,22.79°,23.34°,24.56°,24.98°,25.42°,29.44°.
form A 9.72°,11.23°,13.42°,14.42°,14.94°,17.89°,18.39°,18.91°,19.59°,21.57°,22.23°,22.72°,23.42°,24.58°,24.97°,27.89 °.
form X 10.64°,12.19°,13.88°,15.11°,17.93°,21.49°,23.75°,26.32°,27.21°.
Table 3. The crystallographic parameters of SF-OA, form I of SF.
Form I Form C SF-OA
Empirical formula C21H16ClF3N4O3 C21H16ClF3N4O3 C21H16ClF3N4O3·C2H2O4
Formula weight 464.83 464.83 554.82
Temperature/K 294 170.00 170.00
Crystal system monoclinic monoclinic monoclinic
Space group P21/c P21/c P21/n
a/Å 8.1587(16) 7.8479(9) 11.6364(4)
b/Å 9.8055(19) 9.5480(11) 8.5629(3)
c/Å 27.758(5) 27.142(3) 28.4389(9)
α/° 90 90 90
β/° 94.358(3) 93.606(5) 98.5960(10)
γ/° 90 90 90
Volume/Å3 2214.2(7) 2029.8(4) 2801.86(16)
Z 4 4 4
ρcalcg/cm3 - 1.521 1.486
μ/mm-1 - 1.447 0.214
F(000) - 952.0 1296.0
Radiation MoKα(λ = 0.71073) MoKα(λ = 0.71073) MoKα(λ = 0.71073)
Rint - 0.1052 0.0569
wR2 0.102 0.1335 0.1405
CCDC number 813502 2290456 2290468
“-”:The single crystal data of form I comes from the Cambridge database, and the corresponding parameters cannot be found.
Table 4. The torsion angles in the SF molecules of form I, form C and SF-OA.
Torsion Angle (°) form I form C SF-OA
C12-O2-C15-C16 -9.8 169.7 8.8
C6-N1-C8-N2 -170.62 -170.1 -175.9
C6-N1-C8-O1 9.3 9.9 4.1
C9-N2-C8-N1 6.8 8.4 -6.3
C17-N4-C20-C21 179.51 -179.9 -175.3
C16-C17-C20-O3 18.5 19.5 -179.5
C15-O2-C11-C12 -9.8 109.9 83.4
C1-C2-C3-Cl1 -4.2 175.2 -0.9
C1-C2-C3-C4 177.05 -3.4 178.6
C15-O2-C12-C13 170.80 -73.6 101.1
C16-C17-C20-N4 -161.45 161.0 0.7
Table 5. Thermal data of SF polymorphs.
Form I Form A Form C Form D Form X*
Tm (℃) 212.09 209.18 197.24 205.62 -
Tm (K) 485.24 482.33 470.39 478.77 -
△Hm (kJ/mol) 103.68 95.04 88.427 73.979 -
*: They performed solid-solid phase transformation, thus thermal data were not available.
Disclaimer/Publisher’s Note: The statements, opinions and data contained in all publications are solely those of the individual author(s) and contributor(s) and not of MDPI and/or the editor(s). MDPI and/or the editor(s) disclaim responsibility for any injury to people or property resulting from any ideas, methods, instructions or products referred to in the content.
Copyright: This open access article is published under a Creative Commons CC BY 4.0 license, which permit the free download, distribution, and reuse, provided that the author and preprint are cited in any reuse.
Prerpints.org logo

Preprints.org is a free preprint server supported by MDPI in Basel, Switzerland.

Subscribe

© 2024 MDPI (Basel, Switzerland) unless otherwise stated